Kiowa, KS Map & Demographics
Kiowa Map
Kiowa Overview
$32,298
PER CAPITA INCOME
$76,583
AVG FAMILY INCOME
$51,806
AVG HOUSEHOLD INCOME
49.4%
WAGE / INCOME GAP [ % ]
50.6¢/ $1
WAGE / INCOME GAP [ $ ]
0.43
INEQUALITY / GINI INDEX
785
TOTAL POPULATION
371
MALE POPULATION
414
FEMALE POPULATION
89.61
MALES / 100 FEMALES
111.59
FEMALES / 100 MALES
39.8
MEDIAN AGE
2.8
AVG FAMILY SIZE
2.2
AVG HOUSEHOLD SIZE
429
LABOR FORCE [ PEOPLE ]
68.6%
PERCENT IN LABOR FORCE
3.3%
UNEMPLOYMENT RATE
Kiowa Zip Codes
Kiowa Area Codes
Income in Kiowa
Income Overview in Kiowa
Per Capita Income in Kiowa is $32,298, while median incomes of families and households are $76,583 and $51,806 respectively.
| Characteristic | Number | Measure |
| Per Capita Income | 785 | $32,298 |
| Median Family Income | 209 | $76,583 |
| Mean Family Income | 209 | $83,629 |
| Median Household Income | 351 | $51,806 |
| Mean Household Income | 351 | $66,805 |
| Income Deficit | 209 | $0 |
| Wage / Income Gap (%) | 785 | 49.40% |
| Wage / Income Gap ($) | 785 | 50.60¢ per $1 |
| Gini / Inequality Index | 785 | 0.43 |
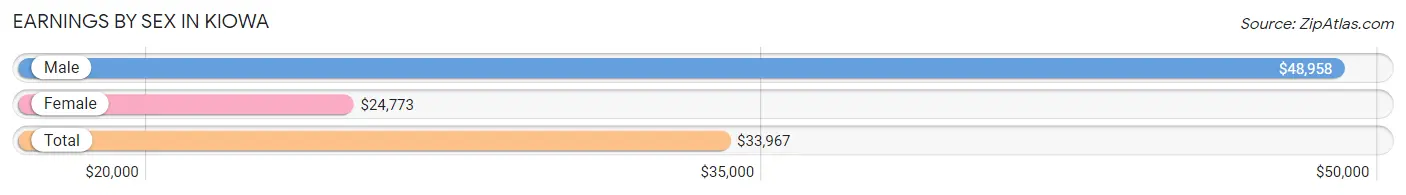
Earnings by Sex in Kiowa
Average Earnings in Kiowa are $33,967, $48,958 for men and $24,773 for women, a difference of 49.4%.
| Sex | Number | Average Earnings |
| Male | 225 (51.0%) | $48,958 |
| Female | 216 (49.0%) | $24,773 |
| Total | 441 (100.0%) | $33,967 |
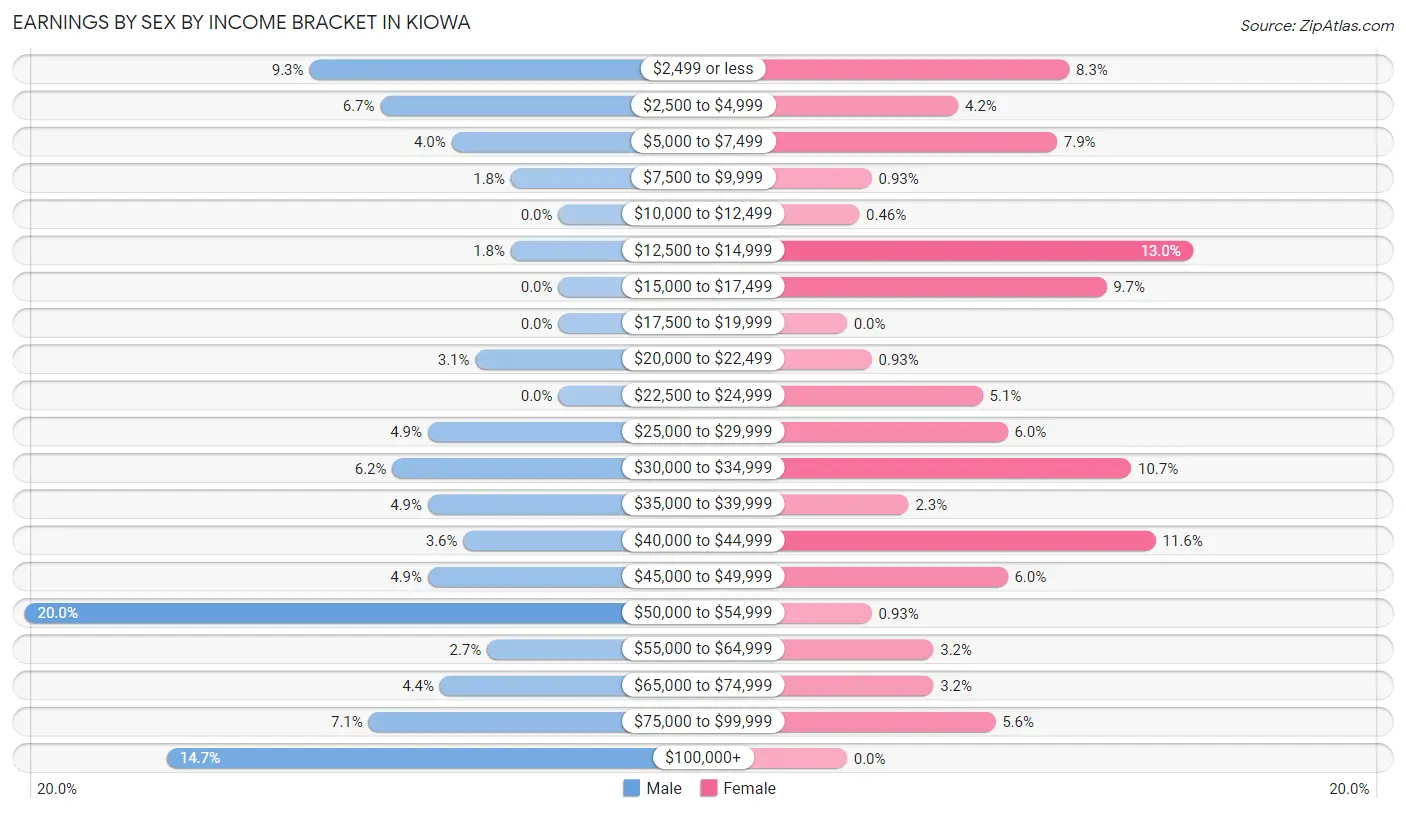
Earnings by Sex by Income Bracket in Kiowa
The most common earnings brackets in Kiowa are $50,000 to $54,999 for men (45 | 20.0%) and $12,500 to $14,999 for women (28 | 13.0%).
| Income | Male | Female |
| $2,499 or less | 21 (9.3%) | 18 (8.3%) |
| $2,500 to $4,999 | 15 (6.7%) | 9 (4.2%) |
| $5,000 to $7,499 | 9 (4.0%) | 17 (7.9%) |
| $7,500 to $9,999 | 4 (1.8%) | 2 (0.9%) |
| $10,000 to $12,499 | 0 (0.0%) | 1 (0.5%) |
| $12,500 to $14,999 | 4 (1.8%) | 28 (13.0%) |
| $15,000 to $17,499 | 0 (0.0%) | 21 (9.7%) |
| $17,500 to $19,999 | 0 (0.0%) | 0 (0.0%) |
| $20,000 to $22,499 | 7 (3.1%) | 2 (0.9%) |
| $22,500 to $24,999 | 0 (0.0%) | 11 (5.1%) |
| $25,000 to $29,999 | 11 (4.9%) | 13 (6.0%) |
| $30,000 to $34,999 | 14 (6.2%) | 23 (10.6%) |
| $35,000 to $39,999 | 11 (4.9%) | 5 (2.3%) |
| $40,000 to $44,999 | 8 (3.6%) | 25 (11.6%) |
| $45,000 to $49,999 | 11 (4.9%) | 13 (6.0%) |
| $50,000 to $54,999 | 45 (20.0%) | 2 (0.9%) |
| $55,000 to $64,999 | 6 (2.7%) | 7 (3.2%) |
| $65,000 to $74,999 | 10 (4.4%) | 7 (3.2%) |
| $75,000 to $99,999 | 16 (7.1%) | 12 (5.6%) |
| $100,000+ | 33 (14.7%) | 0 (0.0%) |
| Total | 225 (100.0%) | 216 (100.0%) |
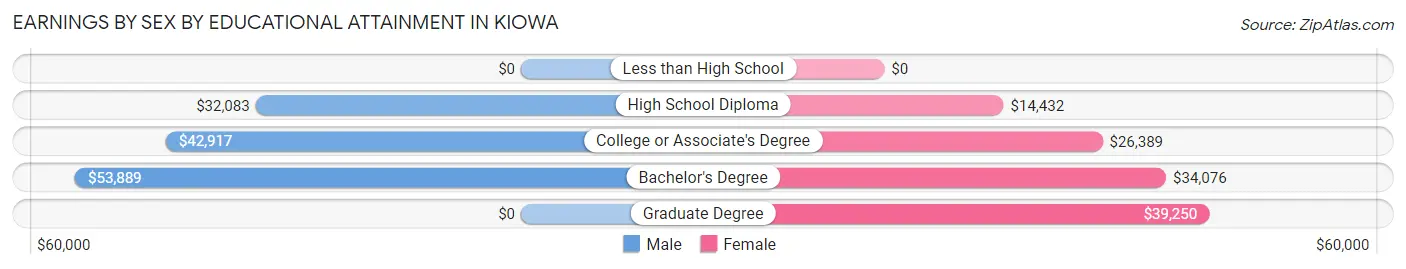
Earnings by Sex by Educational Attainment in Kiowa
Average earnings in Kiowa are $53,125 for men and $25,104 for women, a difference of 52.7%. Men with an educational attainment of bachelor's degree enjoy the highest average annual earnings of $53,889, while those with high school diploma education earn the least with $32,083. Women with an educational attainment of graduate degree earn the most with the average annual earnings of $39,250, while those with high school diploma education have the smallest earnings of $14,432.
| Educational Attainment | Male Income | Female Income |
| Less than High School | - | - |
| High School Diploma | $32,083 | $14,432 |
| College or Associate's Degree | $42,917 | $26,389 |
| Bachelor's Degree | $53,889 | $34,076 |
| Graduate Degree | - | - |
| Total | $53,125 | $25,104 |
Family Income in Kiowa
Family Income Brackets in Kiowa
According to the Kiowa family income data, there are 56 families falling into the $75,000 to $99,999 income range, which is the most common income bracket and makes up 26.8% of all families. Conversely, the $10,000 to $14,999 income bracket is the least frequent group with only 4 families (1.9%) belonging to this category.
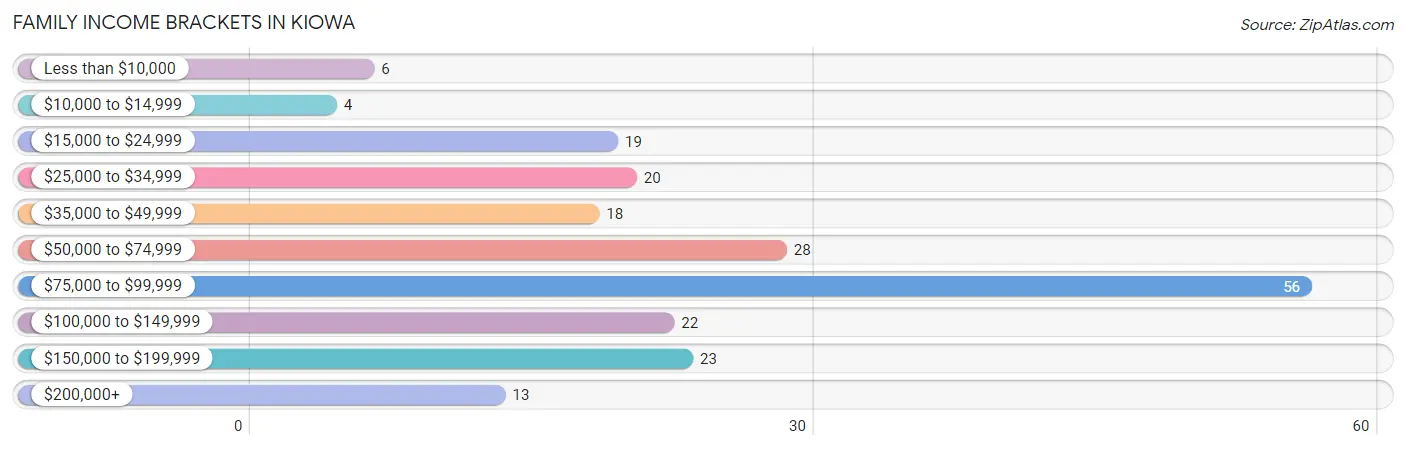
| Income Bracket | # Families | % Families |
| Less than $10,000 | 6 | 2.9% |
| $10,000 to $14,999 | 4 | 1.9% |
| $15,000 to $24,999 | 19 | 9.1% |
| $25,000 to $34,999 | 20 | 9.6% |
| $35,000 to $49,999 | 18 | 8.6% |
| $50,000 to $74,999 | 28 | 13.4% |
| $75,000 to $99,999 | 56 | 26.8% |
| $100,000 to $149,999 | 22 | 10.5% |
| $150,000 to $199,999 | 23 | 11.0% |
| $200,000+ | 13 | 6.2% |
Family Income by Famaliy Size in Kiowa
4-person families (42 | 20.1%) account for the highest median family income in Kiowa with $150,217 per family, while 4-person families (42 | 20.1%) have the highest median income of $37,554 per family member.
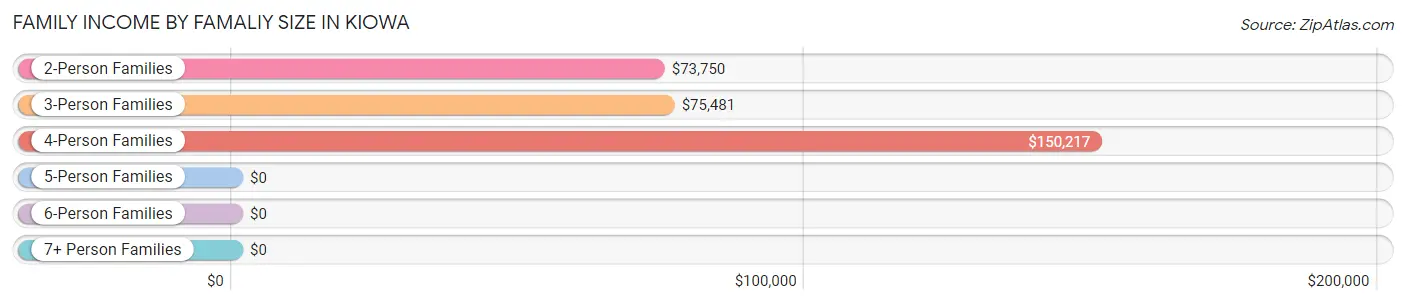
| Income Bracket | # Families | Median Income |
| 2-Person Families | 123 (58.9%) | $73,750 |
| 3-Person Families | 31 (14.8%) | $75,481 |
| 4-Person Families | 42 (20.1%) | $150,217 |
| 5-Person Families | 7 (3.4%) | $0 |
| 6-Person Families | 6 (2.9%) | $0 |
| 7+ Person Families | 0 (0.0%) | $0 |
| Total | 209 (100.0%) | $76,583 |
Family Income by Number of Earners in Kiowa
The median family income in Kiowa is $76,583, with families comprising 2 earners (95) having the highest median family income of $96,750, while families with 1 earner (65) have the lowest median family income of $31,705, accounting for 45.5% and 31.1% of families, respectively.
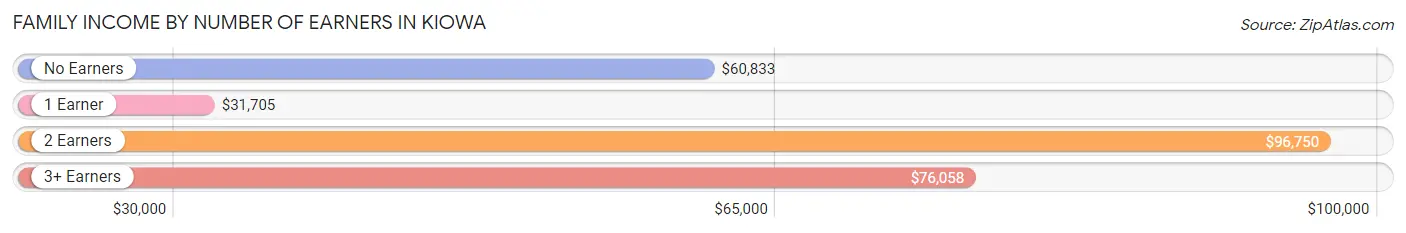
| Number of Earners | # Families | Median Income |
| No Earners | 28 (13.4%) | $60,833 |
| 1 Earner | 65 (31.1%) | $31,705 |
| 2 Earners | 95 (45.5%) | $96,750 |
| 3+ Earners | 21 (10.1%) | $76,058 |
| Total | 209 (100.0%) | $76,583 |
Household Income in Kiowa
Household Income Brackets in Kiowa
With 62 households falling in the category, the $75,000 to $99,999 income range is the most frequent in Kiowa, accounting for 17.7% of all households. In contrast, only 13 households (3.7%) fall into the $200,000+ income bracket, making it the least populous group.
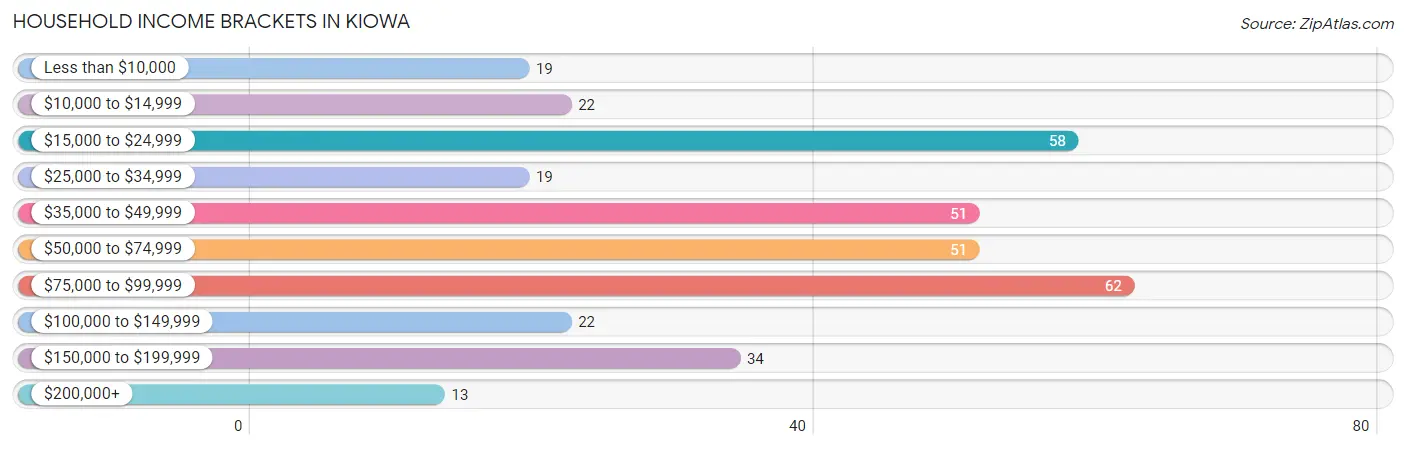
| Income Bracket | # Households | % Households |
| Less than $10,000 | 19 | 5.4% |
| $10,000 to $14,999 | 22 | 6.3% |
| $15,000 to $24,999 | 58 | 16.5% |
| $25,000 to $34,999 | 19 | 5.4% |
| $35,000 to $49,999 | 51 | 14.5% |
| $50,000 to $74,999 | 51 | 14.5% |
| $75,000 to $99,999 | 62 | 17.7% |
| $100,000 to $149,999 | 22 | 6.3% |
| $150,000 to $199,999 | 34 | 9.7% |
| $200,000+ | 13 | 3.7% |
Household Income by Householder Age in Kiowa
The median household income in Kiowa is $51,806, with the highest median household income of $67,813 found in the 25 to 44 years age bracket for the primary householder. A total of 117 households (33.3%) fall into this category. Meanwhile, the 15 to 24 years age bracket for the primary householder has the lowest median household income of $0, with 28 households (8.0%) in this group.
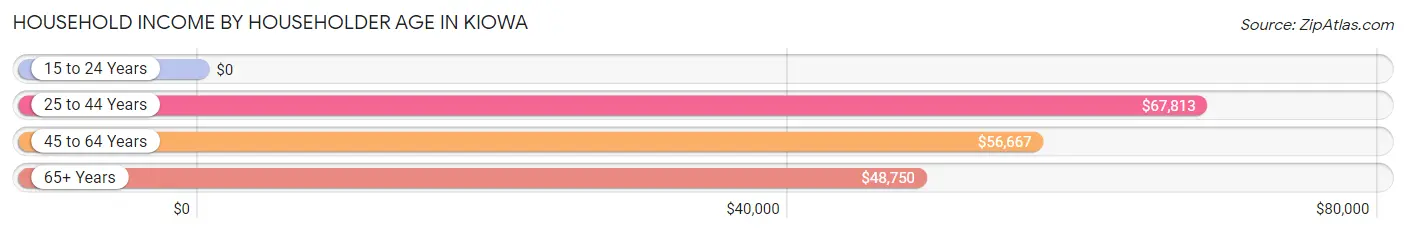
| Income Bracket | # Households | Median Income |
| 15 to 24 Years | 28 (8.0%) | $0 |
| 25 to 44 Years | 117 (33.3%) | $67,813 |
| 45 to 64 Years | 94 (26.8%) | $56,667 |
| 65+ Years | 112 (31.9%) | $48,750 |
| Total | 351 (100.0%) | $51,806 |
Poverty in Kiowa
Income Below Poverty by Sex and Age in Kiowa
With 11.6% poverty level for males and 19.5% for females among the residents of Kiowa, 18 to 24 year old males and 18 to 24 year old females are the most vulnerable to poverty, with 18 males (64.3%) and 6 females (42.9%) in their respective age groups living below the poverty level.
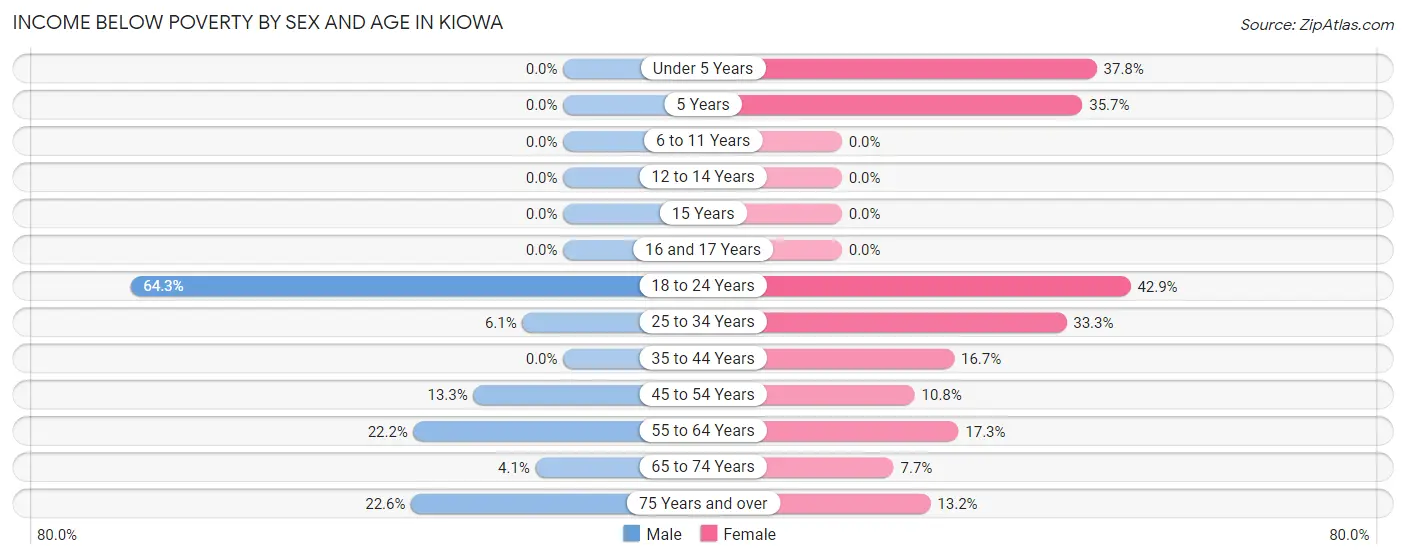
| Age Bracket | Male | Female |
| Under 5 Years | 0 (0.0%) | 14 (37.8%) |
| 5 Years | 0 (0.0%) | 5 (35.7%) |
| 6 to 11 Years | 0 (0.0%) | 0 (0.0%) |
| 12 to 14 Years | 0 (0.0%) | 0 (0.0%) |
| 15 Years | 0 (0.0%) | 0 (0.0%) |
| 16 and 17 Years | 0 (0.0%) | 0 (0.0%) |
| 18 to 24 Years | 18 (64.3%) | 6 (42.9%) |
| 25 to 34 Years | 2 (6.1%) | 23 (33.3%) |
| 35 to 44 Years | 0 (0.0%) | 8 (16.7%) |
| 45 to 54 Years | 4 (13.3%) | 4 (10.8%) |
| 55 to 64 Years | 8 (22.2%) | 9 (17.3%) |
| 65 to 74 Years | 3 (4.1%) | 4 (7.7%) |
| 75 Years and over | 7 (22.6%) | 5 (13.2%) |
| Total | 42 (11.6%) | 78 (19.5%) |
Income Above Poverty by Sex and Age in Kiowa
According to the poverty statistics in Kiowa, males aged under 5 years and females aged 6 to 11 years are the age groups that are most secure financially, with 100.0% of males and 100.0% of females in these age groups living above the poverty line.
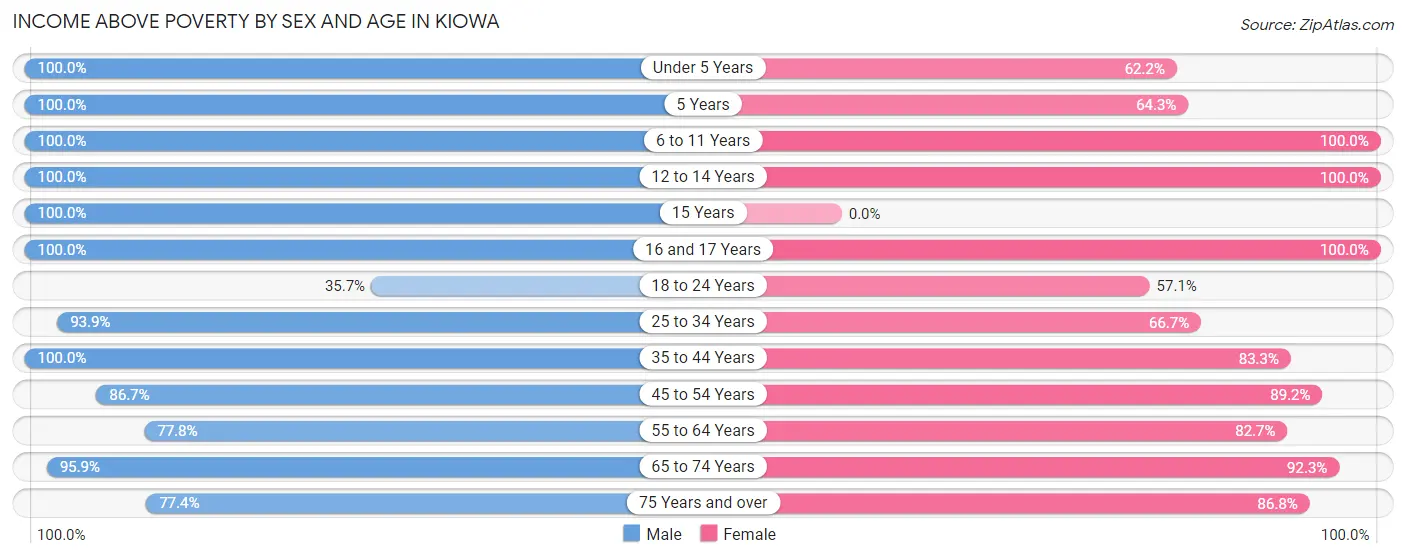
| Age Bracket | Male | Female |
| Under 5 Years | 15 (100.0%) | 23 (62.2%) |
| 5 Years | 32 (100.0%) | 9 (64.3%) |
| 6 to 11 Years | 14 (100.0%) | 27 (100.0%) |
| 12 to 14 Years | 5 (100.0%) | 8 (100.0%) |
| 15 Years | 8 (100.0%) | 0 (0.0%) |
| 16 and 17 Years | 14 (100.0%) | 5 (100.0%) |
| 18 to 24 Years | 10 (35.7%) | 8 (57.1%) |
| 25 to 34 Years | 31 (93.9%) | 46 (66.7%) |
| 35 to 44 Years | 43 (100.0%) | 40 (83.3%) |
| 45 to 54 Years | 26 (86.7%) | 33 (89.2%) |
| 55 to 64 Years | 28 (77.8%) | 43 (82.7%) |
| 65 to 74 Years | 70 (95.9%) | 48 (92.3%) |
| 75 Years and over | 24 (77.4%) | 33 (86.8%) |
| Total | 320 (88.4%) | 323 (80.5%) |
Income Below Poverty Among Married-Couple Families in Kiowa
The poverty statistics for married-couple families in Kiowa show that 4.3% or 7 of the total 162 families live below the poverty line. Families with no children have the highest poverty rate of 5.4%, comprising of 5 families. On the other hand, families with 3 or 4 children have the lowest poverty rate of 0.0%, which includes 0 families.
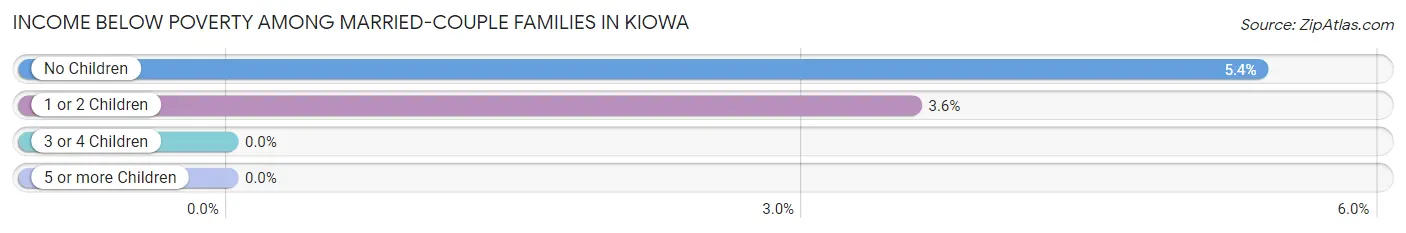
| Children | Above Poverty | Below Poverty |
| No Children | 88 (94.6%) | 5 (5.4%) |
| 1 or 2 Children | 54 (96.4%) | 2 (3.6%) |
| 3 or 4 Children | 13 (100.0%) | 0 (0.0%) |
| 5 or more Children | 0 (0.0%) | 0 (0.0%) |
| Total | 155 (95.7%) | 7 (4.3%) |
Income Below Poverty Among Single-Parent Households in Kiowa
According to the poverty data in Kiowa, 21.4% or 3 single-father households and 57.6% or 19 single-mother households are living below the poverty line. Among single-father households, those with no children have the highest poverty rate, with 3 households (100.0%) experiencing poverty. Likewise, among single-mother households, those with 1 or 2 children have the highest poverty rate, with 11 households (78.6%) falling below the poverty line.
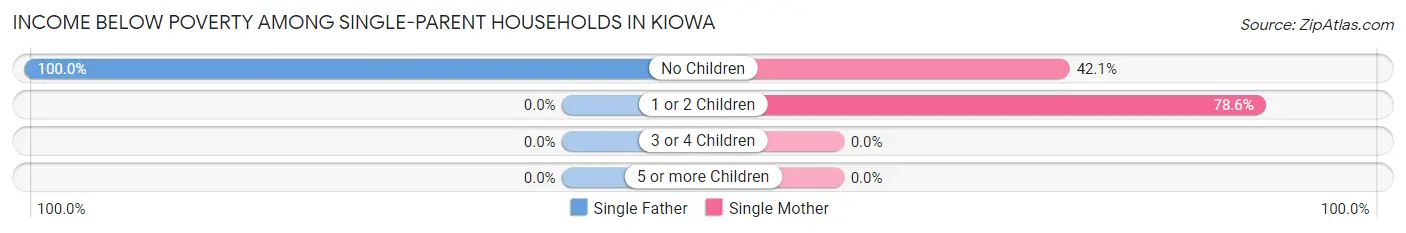
| Children | Single Father | Single Mother |
| No Children | 3 (100.0%) | 8 (42.1%) |
| 1 or 2 Children | 0 (0.0%) | 11 (78.6%) |
| 3 or 4 Children | 0 (0.0%) | 0 (0.0%) |
| 5 or more Children | 0 (0.0%) | 0 (0.0%) |
| Total | 3 (21.4%) | 19 (57.6%) |
Income Below Poverty Among Married-Couple vs Single-Parent Households in Kiowa
The poverty data for Kiowa shows that 7 of the married-couple family households (4.3%) and 22 of the single-parent households (46.8%) are living below the poverty level. Within the married-couple family households, those with no children have the highest poverty rate, with 5 households (5.4%) falling below the poverty line. Among the single-parent households, those with 1 or 2 children have the highest poverty rate, with 11 household (78.6%) living below poverty.
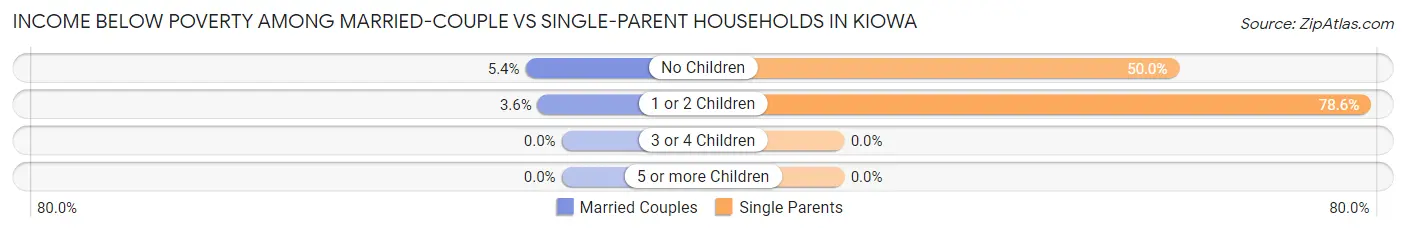
| Children | Married-Couple Families | Single-Parent Households |
| No Children | 5 (5.4%) | 11 (50.0%) |
| 1 or 2 Children | 2 (3.6%) | 11 (78.6%) |
| 3 or 4 Children | 0 (0.0%) | 0 (0.0%) |
| 5 or more Children | 0 (0.0%) | 0 (0.0%) |
| Total | 7 (4.3%) | 22 (46.8%) |
Race in Kiowa
The most populous races in Kiowa are White / Caucasian (684 | 87.1%), Two or more Races (63 | 8.0%), and Hispanic or Latino (28 | 3.6%).
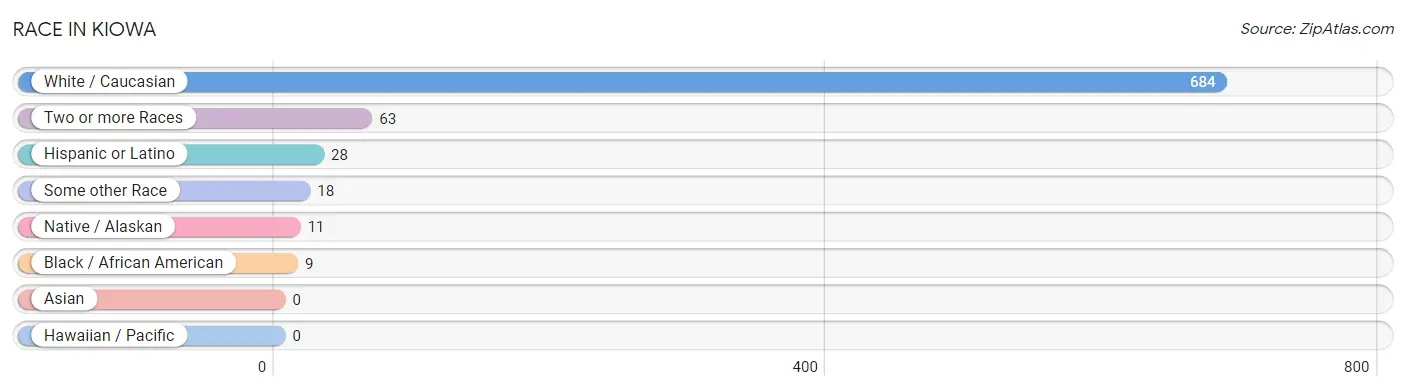
| Race | # Population | % Population |
| Asian | 0 | 0.0% |
| Black / African American | 9 | 1.1% |
| Hawaiian / Pacific | 0 | 0.0% |
| Hispanic or Latino | 28 | 3.6% |
| Native / Alaskan | 11 | 1.4% |
| White / Caucasian | 684 | 87.1% |
| Two or more Races | 63 | 8.0% |
| Some other Race | 18 | 2.3% |
| Total | 785 | 100.0% |
Ancestry in Kiowa
The most populous ancestries reported in Kiowa are German (218 | 27.8%), English (101 | 12.9%), Irish (58 | 7.4%), American (54 | 6.9%), and French (45 | 5.7%), together accounting for 60.6% of all Kiowa residents.
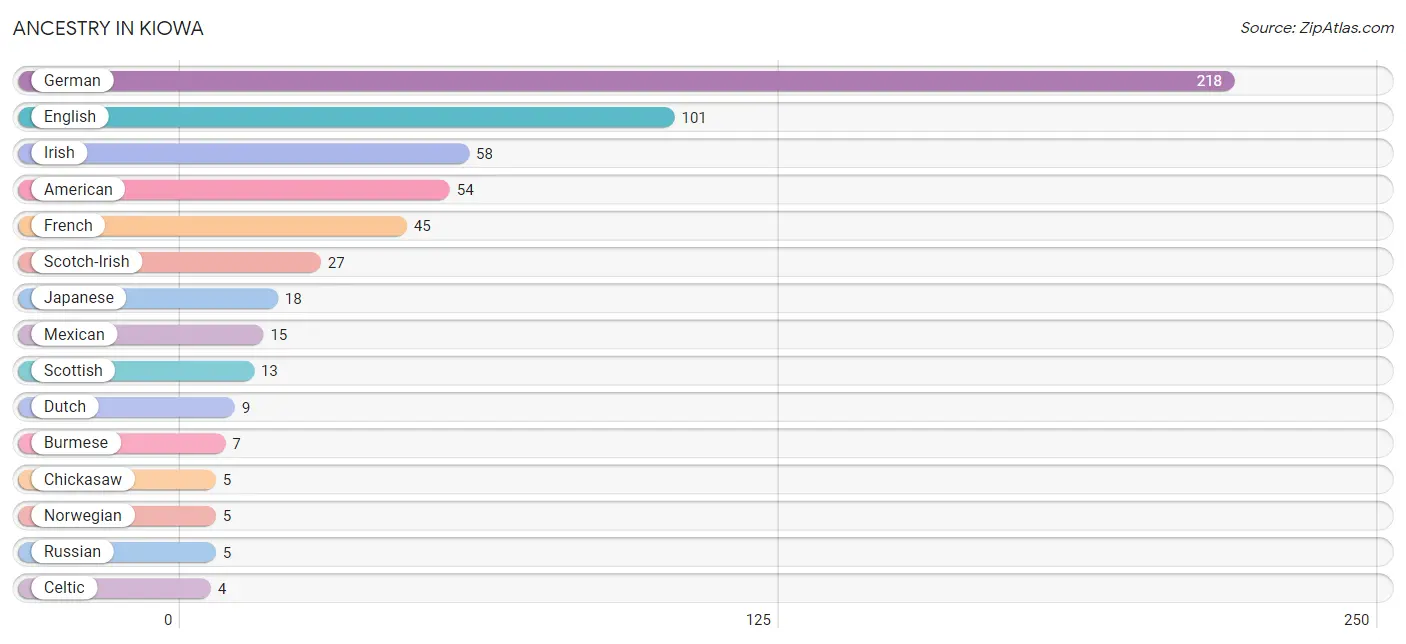
| Ancestry | # Population | % Population |
| American | 54 | 6.9% |
| Apache | 1 | 0.1% |
| Austrian | 2 | 0.3% |
| Burmese | 7 | 0.9% |
| Celtic | 4 | 0.5% |
| Cherokee | 1 | 0.1% |
| Chickasaw | 5 | 0.6% |
| Dutch | 9 | 1.1% |
| English | 101 | 12.9% |
| French | 45 | 5.7% |
| German | 218 | 27.8% |
| Irish | 58 | 7.4% |
| Japanese | 18 | 2.3% |
| Mexican | 15 | 1.9% |
| Navajo | 1 | 0.1% |
| Norwegian | 5 | 0.6% |
| Polish | 3 | 0.4% |
| Russian | 5 | 0.6% |
| Scotch-Irish | 27 | 3.4% |
| Scottish | 13 | 1.7% |
| Spanish | 2 | 0.3% |
| Spanish American | 4 | 0.5% |
| Swedish | 4 | 0.5% |
| Swiss | 2 | 0.3% |
| Welsh | 1 | 0.1% | View All 25 Rows |
Immigrants in Kiowa
The most numerous immigrant groups reported in Kiowa came from Australia (2 | 0.3%), and Oceania (2 | 0.3%), together accounting for 0.5% of all Kiowa residents.
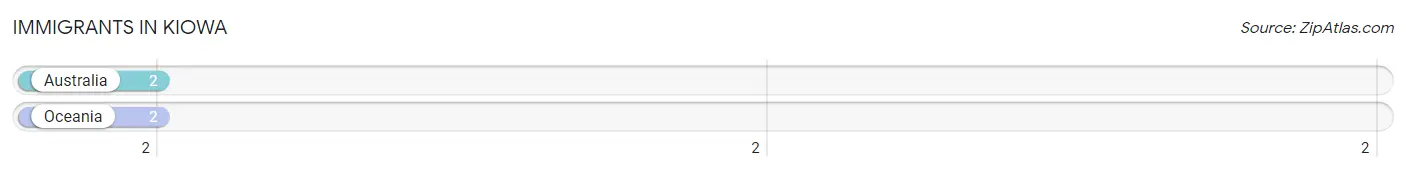
| Immigration Origin | # Population | % Population |
| Australia | 2 | 0.3% |
| Oceania | 2 | 0.3% | View All 2 Rows |
Sex and Age in Kiowa
Sex and Age in Kiowa
The most populous age groups in Kiowa are 65 to 69 Years (51 | 13.8%) for men and Under 5 Years (37 | 8.9%) for women.
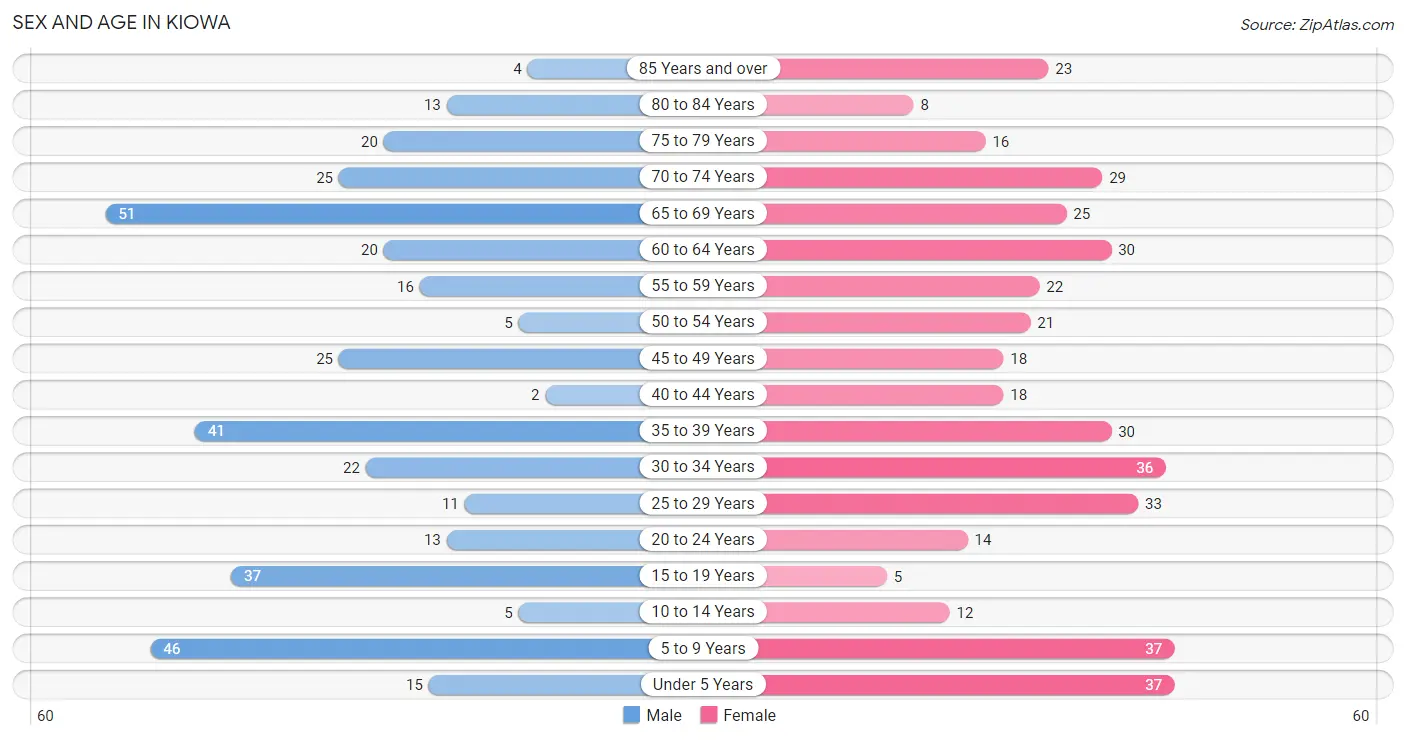
| Age Bracket | Male | Female |
| Under 5 Years | 15 (4.0%) | 37 (8.9%) |
| 5 to 9 Years | 46 (12.4%) | 37 (8.9%) |
| 10 to 14 Years | 5 (1.3%) | 12 (2.9%) |
| 15 to 19 Years | 37 (10.0%) | 5 (1.2%) |
| 20 to 24 Years | 13 (3.5%) | 14 (3.4%) |
| 25 to 29 Years | 11 (3.0%) | 33 (8.0%) |
| 30 to 34 Years | 22 (5.9%) | 36 (8.7%) |
| 35 to 39 Years | 41 (11.1%) | 30 (7.2%) |
| 40 to 44 Years | 2 (0.5%) | 18 (4.3%) |
| 45 to 49 Years | 25 (6.7%) | 18 (4.3%) |
| 50 to 54 Years | 5 (1.3%) | 21 (5.1%) |
| 55 to 59 Years | 16 (4.3%) | 22 (5.3%) |
| 60 to 64 Years | 20 (5.4%) | 30 (7.2%) |
| 65 to 69 Years | 51 (13.8%) | 25 (6.0%) |
| 70 to 74 Years | 25 (6.7%) | 29 (7.0%) |
| 75 to 79 Years | 20 (5.4%) | 16 (3.9%) |
| 80 to 84 Years | 13 (3.5%) | 8 (1.9%) |
| 85 Years and over | 4 (1.1%) | 23 (5.6%) |
| Total | 371 (100.0%) | 414 (100.0%) |
Families and Households in Kiowa
Median Family Size in Kiowa
The median family size in Kiowa is 2.80 persons per family, with single male/father families (14 | 6.7%) accounting for the largest median family size of 3.14 persons per family. On the other hand, single female/mother families (33 | 15.8%) represent the smallest median family size with 2.42 persons per family.
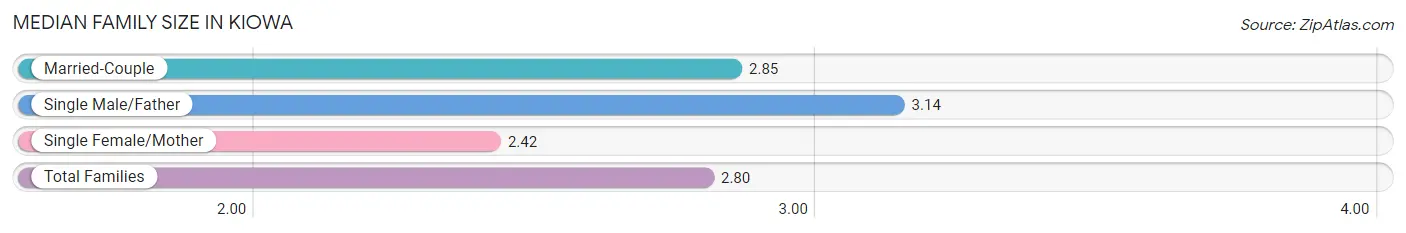
| Family Type | # Families | Family Size |
| Married-Couple | 162 (77.5%) | 2.85 |
| Single Male/Father | 14 (6.7%) | 3.14 |
| Single Female/Mother | 33 (15.8%) | 2.42 |
| Total Families | 209 (100.0%) | 2.80 |
Median Household Size in Kiowa
The median household size in Kiowa is 2.17 persons per household, with single male/father households (14 | 4.0%) accounting for the largest median household size of 3.71 persons per household. non-family households (142 | 40.5%) represent the smallest median household size with 1.13 persons per household.
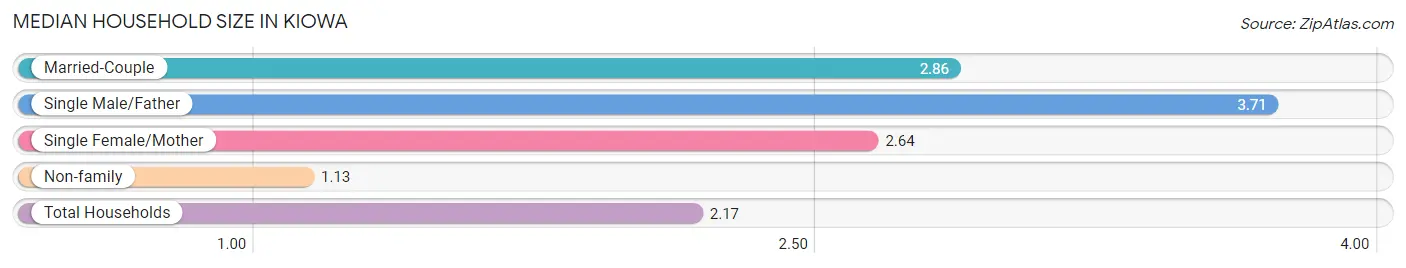
| Household Type | # Households | Household Size |
| Married-Couple | 162 (46.2%) | 2.86 |
| Single Male/Father | 14 (4.0%) | 3.71 |
| Single Female/Mother | 33 (9.4%) | 2.64 |
| Non-family | 142 (40.5%) | 1.13 |
| Total Households | 351 (100.0%) | 2.17 |
Household Size by Marriage Status in Kiowa
Out of a total of 351 households in Kiowa, 209 (59.5%) are family households, while 142 (40.5%) are nonfamily households. The most numerous type of family households are 2-person households, comprising 115, and the most common type of nonfamily households are 1-person households, comprising 123.
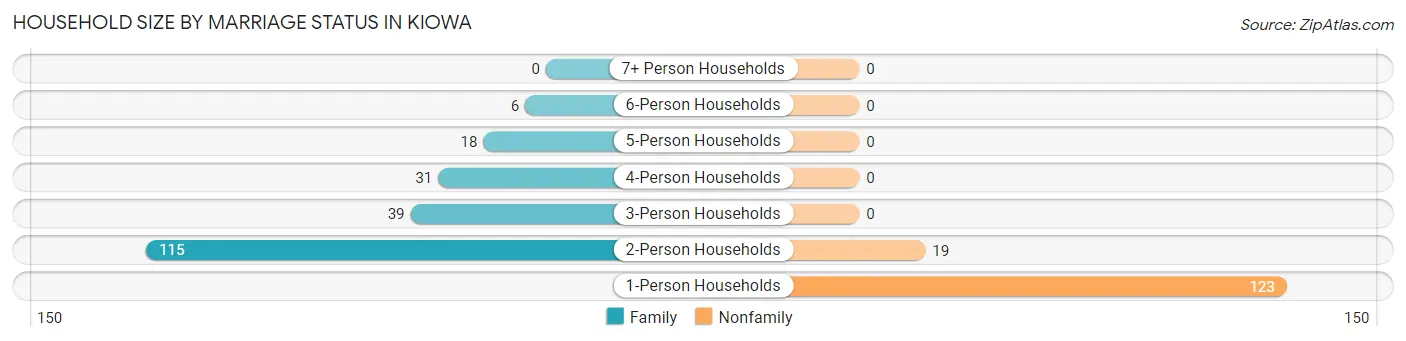
| Household Size | Family Households | Nonfamily Households |
| 1-Person Households | - | 123 (35.0%) |
| 2-Person Households | 115 (32.8%) | 19 (5.4%) |
| 3-Person Households | 39 (11.1%) | 0 (0.0%) |
| 4-Person Households | 31 (8.8%) | 0 (0.0%) |
| 5-Person Households | 18 (5.1%) | 0 (0.0%) |
| 6-Person Households | 6 (1.7%) | 0 (0.0%) |
| 7+ Person Households | 0 (0.0%) | 0 (0.0%) |
| Total | 209 (59.5%) | 142 (40.5%) |
Female Fertility in Kiowa
Fertility by Age in Kiowa
Average fertility rate in Kiowa is 71.0 births per 1,000 women. Women in the age bracket of 20 to 34 years have the highest fertility rate with 133.0 births per 1,000 women. Women in the age bracket of 20 to 34 years acount for 100.0% of all women with births.
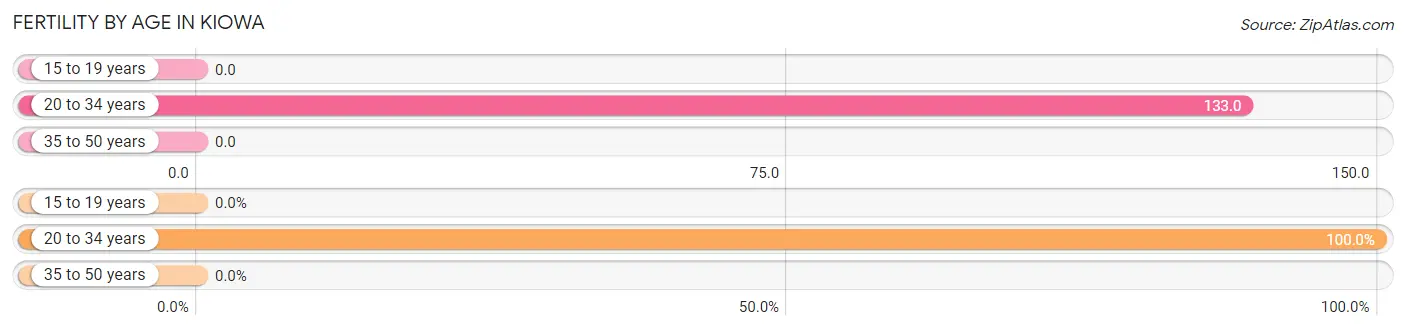
| Age Bracket | Women with Births | Births / 1,000 Women |
| 15 to 19 years | 0 (0.0%) | 0.0 |
| 20 to 34 years | 11 (100.0%) | 133.0 |
| 35 to 50 years | 0 (0.0%) | 0.0 |
| Total | 11 (100.0%) | 71.0 |
Fertility by Age by Marriage Status in Kiowa
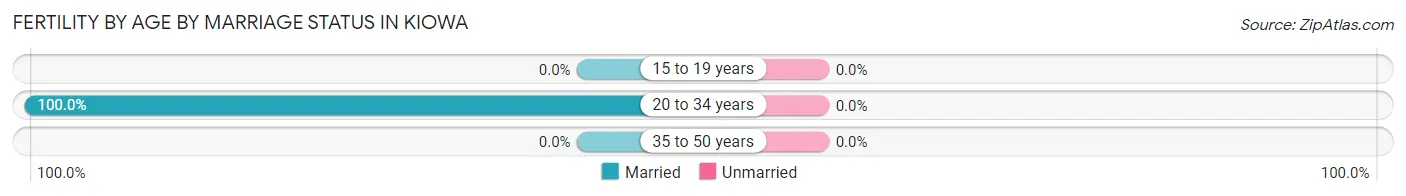
| Age Bracket | Married | Unmarried |
| 15 to 19 years | 0 (0.0%) | 0 (0.0%) |
| 20 to 34 years | 11 (100.0%) | 0 (0.0%) |
| 35 to 50 years | 0 (0.0%) | 0 (0.0%) |
| Total | 11 (100.0%) | 0 (0.0%) |
Fertility by Education in Kiowa
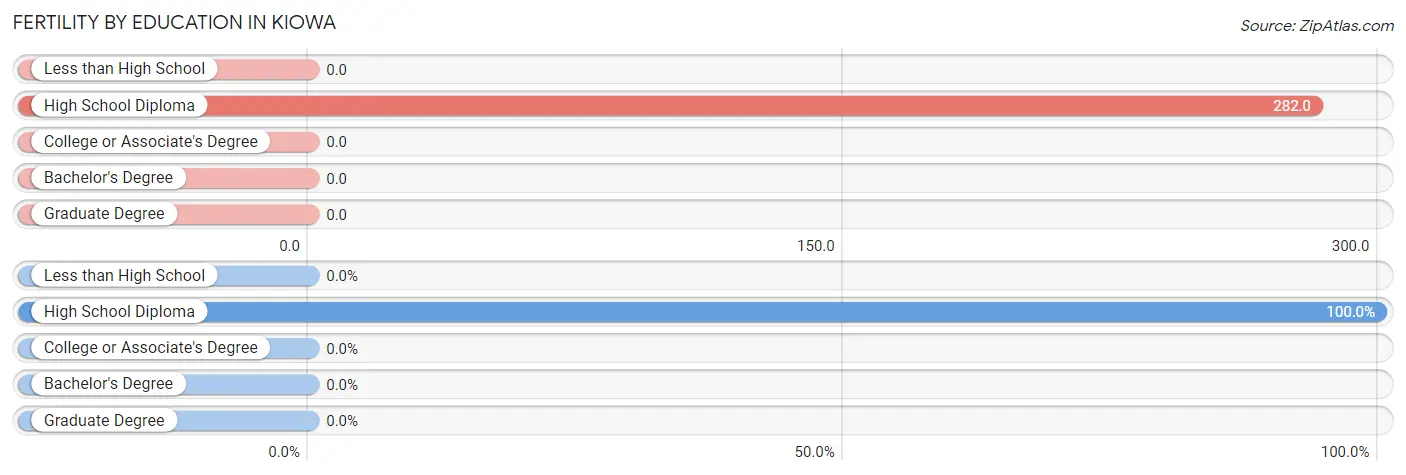
| Educational Attainment | Women with Births | Births / 1,000 Women |
| Less than High School | 0 (0.0%) | 0.0 |
| High School Diploma | 11 (100.0%) | 282.0 |
| College or Associate's Degree | 0 (0.0%) | 0.0 |
| Bachelor's Degree | 0 (0.0%) | 0.0 |
| Graduate Degree | 0 (0.0%) | 0.0 |
| Total | 11 (100.0%) | 71.0 |
Fertility by Education by Marriage Status in Kiowa
| Educational Attainment | Married | Unmarried |
| Less than High School | 0 (0.0%) | 0 (0.0%) |
| High School Diploma | 11 (100.0%) | 0 (0.0%) |
| College or Associate's Degree | 0 (0.0%) | 0 (0.0%) |
| Bachelor's Degree | 0 (0.0%) | 0 (0.0%) |
| Graduate Degree | 0 (0.0%) | 0 (0.0%) |
| Total | 11 (100.0%) | 0 (0.0%) |
Employment Characteristics in Kiowa
Employment by Class of Employer in Kiowa
Among the 413 employed individuals in Kiowa, private company employees (185 | 44.8%), local government employees (81 | 19.6%), and not-for-profit organizations (45 | 10.9%) make up the most common classes of employment.
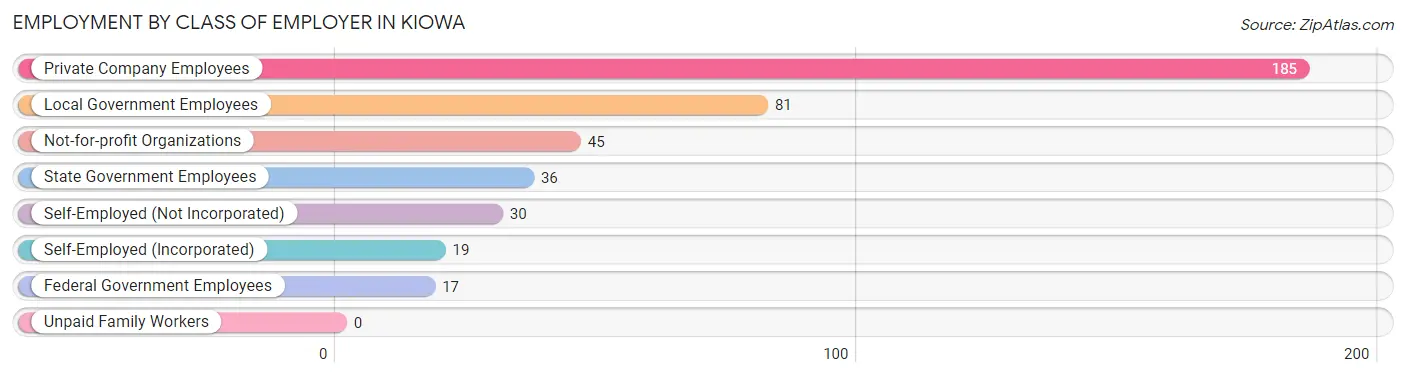
| Employer Class | # Employees | % Employees |
| Private Company Employees | 185 | 44.8% |
| Self-Employed (Incorporated) | 19 | 4.6% |
| Self-Employed (Not Incorporated) | 30 | 7.3% |
| Not-for-profit Organizations | 45 | 10.9% |
| Local Government Employees | 81 | 19.6% |
| State Government Employees | 36 | 8.7% |
| Federal Government Employees | 17 | 4.1% |
| Unpaid Family Workers | 0 | 0.0% |
| Total | 413 | 100.0% |
Employment Status by Age in Kiowa
According to the labor force statistics for Kiowa, out of the total population over 16 years of age (625), 68.6% or 429 individuals are in the labor force, with 3.3% or 14 of them unemployed. The age group with the highest labor force participation rate is 20 to 24 years, with 100.0% or 27 individuals in the labor force. Within the labor force, the 45 to 54 years age range has the highest percentage of unemployed individuals, with 21.2% or 14 of them being unemployed.
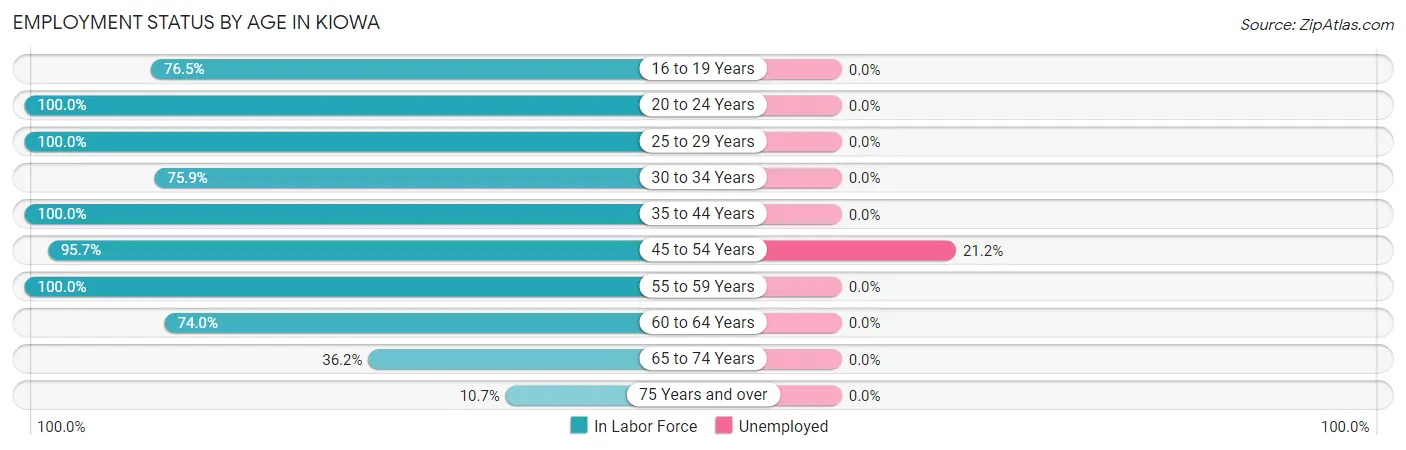
| Age Bracket | In Labor Force | Unemployed |
| 16 to 19 Years | 26 (76.5%) | 0 (0.0%) |
| 20 to 24 Years | 27 (100.0%) | 0 (0.0%) |
| 25 to 29 Years | 44 (100.0%) | 0 (0.0%) |
| 30 to 34 Years | 44 (75.9%) | 0 (0.0%) |
| 35 to 44 Years | 91 (100.0%) | 0 (0.0%) |
| 45 to 54 Years | 66 (95.7%) | 14 (21.2%) |
| 55 to 59 Years | 38 (100.0%) | 0 (0.0%) |
| 60 to 64 Years | 37 (74.0%) | 0 (0.0%) |
| 65 to 74 Years | 47 (36.2%) | 0 (0.0%) |
| 75 Years and over | 9 (10.7%) | 0 (0.0%) |
| Total | 429 (68.6%) | 14 (3.3%) |
Employment Status by Educational Attainment in Kiowa
According to labor force statistics for Kiowa, 91.4% of individuals (320) out of the total population between 25 and 64 years of age (350) are in the labor force, with 4.4% or 14 of them being unemployed. The group with the highest labor force participation rate are those with the educational attainment of bachelor's degree or higher, with 100.0% or 80 individuals in the labor force. Within the labor force, individuals with less than high school education have the highest percentage of unemployment, with 50.0% or 14 of them being unemployed.
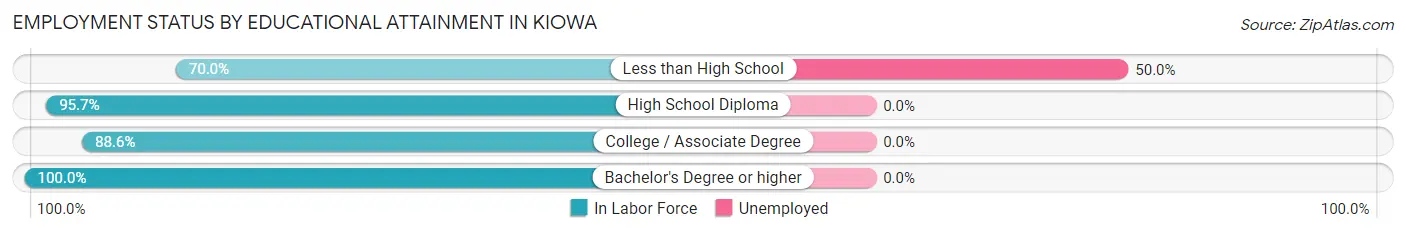
| Educational Attainment | In Labor Force | Unemployed |
| Less than High School | 28 (70.0%) | 20 (50.0%) |
| High School Diploma | 111 (95.7%) | 0 (0.0%) |
| College / Associate Degree | 101 (88.6%) | 0 (0.0%) |
| Bachelor's Degree or higher | 80 (100.0%) | 0 (0.0%) |
| Total | 320 (91.4%) | 15 (4.4%) |
Employment Occupations by Sex in Kiowa
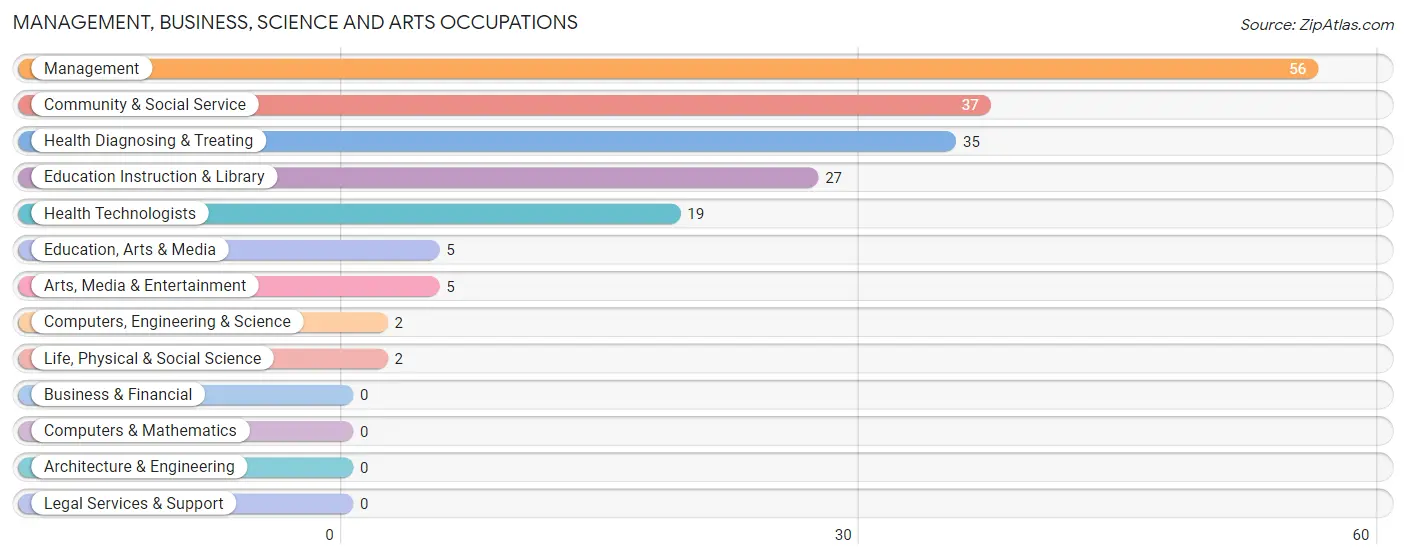
Management, Business, Science and Arts Occupations
The most common Management, Business, Science and Arts occupations in Kiowa are Management (56 | 13.5%), Community & Social Service (37 | 8.9%), Health Diagnosing & Treating (35 | 8.4%), Education Instruction & Library (27 | 6.5%), and Health Technologists (19 | 4.6%).
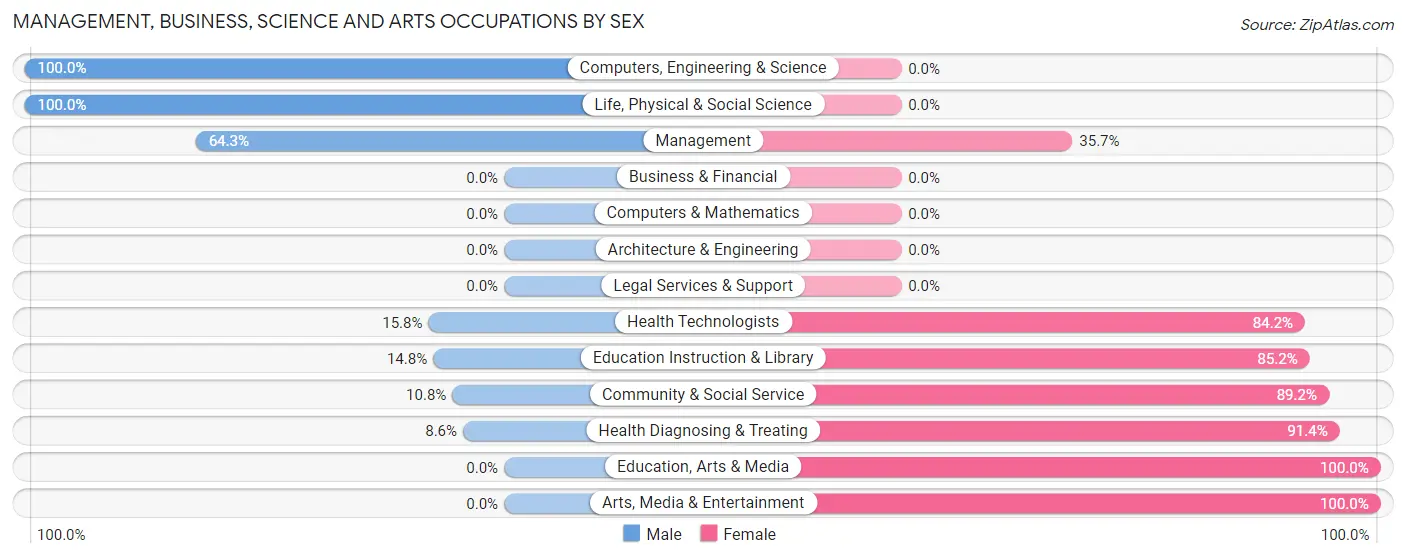
Management, Business, Science and Arts Occupations by Sex
Within the Management, Business, Science and Arts occupations in Kiowa, the most male-oriented occupations are Computers, Engineering & Science (100.0%), Life, Physical & Social Science (100.0%), and Management (64.3%), while the most female-oriented occupations are Education, Arts & Media (100.0%), Arts, Media & Entertainment (100.0%), and Health Diagnosing & Treating (91.4%).
| Occupation | Male | Female |
| Management | 36 (64.3%) | 20 (35.7%) |
| Business & Financial | 0 (0.0%) | 0 (0.0%) |
| Computers, Engineering & Science | 2 (100.0%) | 0 (0.0%) |
| Computers & Mathematics | 0 (0.0%) | 0 (0.0%) |
| Architecture & Engineering | 0 (0.0%) | 0 (0.0%) |
| Life, Physical & Social Science | 2 (100.0%) | 0 (0.0%) |
| Community & Social Service | 4 (10.8%) | 33 (89.2%) |
| Education, Arts & Media | 0 (0.0%) | 5 (100.0%) |
| Legal Services & Support | 0 (0.0%) | 0 (0.0%) |
| Education Instruction & Library | 4 (14.8%) | 23 (85.2%) |
| Arts, Media & Entertainment | 0 (0.0%) | 5 (100.0%) |
| Health Diagnosing & Treating | 3 (8.6%) | 32 (91.4%) |
| Health Technologists | 3 (15.8%) | 16 (84.2%) |
| Total (Category) | 45 (34.6%) | 85 (65.4%) |
| Total (Overall) | 199 (47.9%) | 216 (52.0%) |
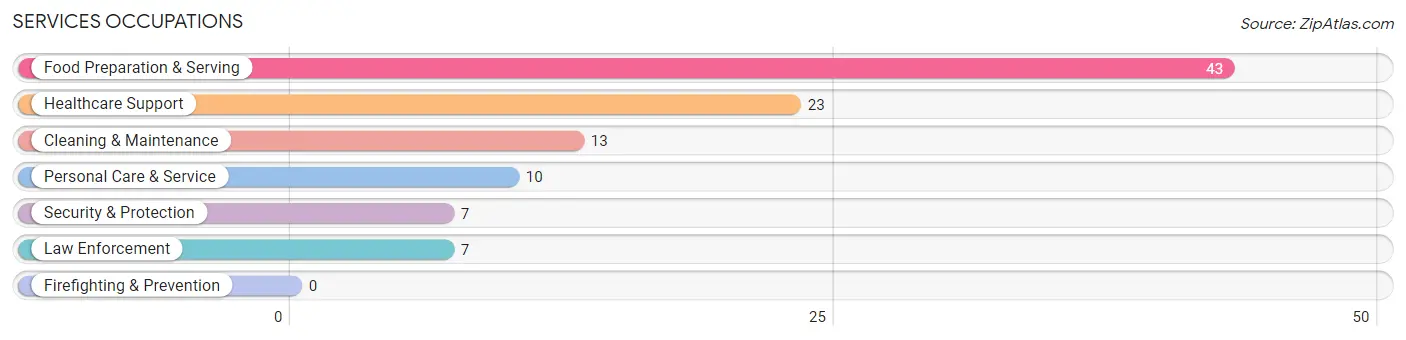
Services Occupations
The most common Services occupations in Kiowa are Food Preparation & Serving (43 | 10.4%), Healthcare Support (23 | 5.5%), Cleaning & Maintenance (13 | 3.1%), Personal Care & Service (10 | 2.4%), and Security & Protection (7 | 1.7%).
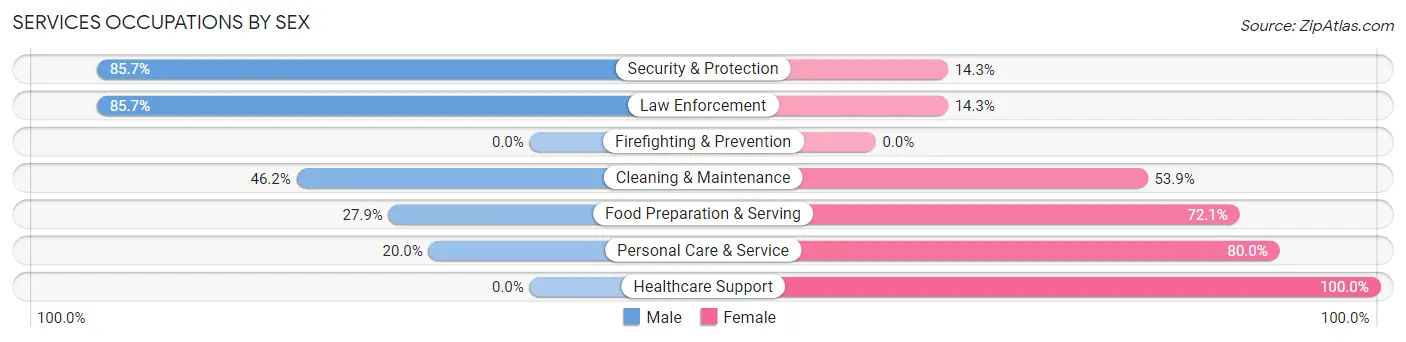
Services Occupations by Sex
Within the Services occupations in Kiowa, the most male-oriented occupations are Security & Protection (85.7%), Law Enforcement (85.7%), and Cleaning & Maintenance (46.2%), while the most female-oriented occupations are Healthcare Support (100.0%), Personal Care & Service (80.0%), and Food Preparation & Serving (72.1%).
| Occupation | Male | Female |
| Healthcare Support | 0 (0.0%) | 23 (100.0%) |
| Security & Protection | 6 (85.7%) | 1 (14.3%) |
| Firefighting & Prevention | 0 (0.0%) | 0 (0.0%) |
| Law Enforcement | 6 (85.7%) | 1 (14.3%) |
| Food Preparation & Serving | 12 (27.9%) | 31 (72.1%) |
| Cleaning & Maintenance | 6 (46.2%) | 7 (53.8%) |
| Personal Care & Service | 2 (20.0%) | 8 (80.0%) |
| Total (Category) | 26 (27.1%) | 70 (72.9%) |
| Total (Overall) | 199 (47.9%) | 216 (52.0%) |
Sales and Office Occupations
The most common Sales and Office occupations in Kiowa are Office & Administration (27 | 6.5%), and Sales & Related (26 | 6.3%).
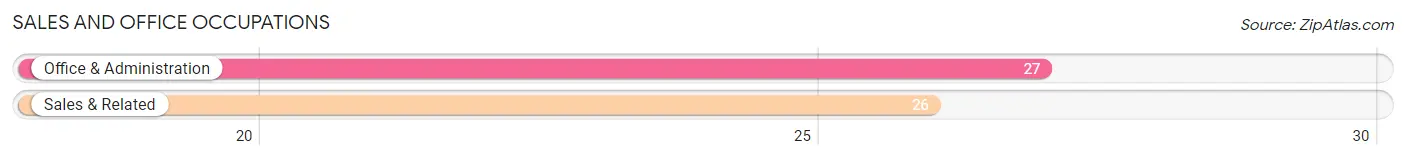
Sales and Office Occupations by Sex
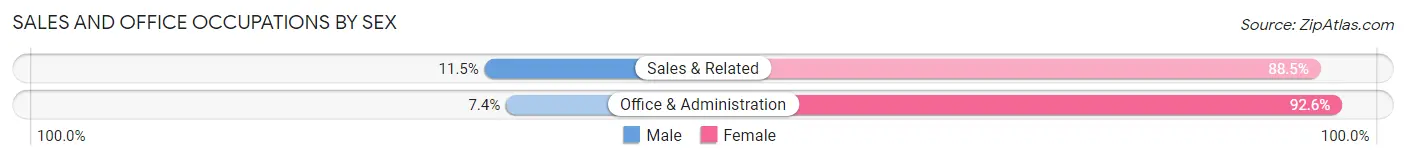
| Occupation | Male | Female |
| Sales & Related | 3 (11.5%) | 23 (88.5%) |
| Office & Administration | 2 (7.4%) | 25 (92.6%) |
| Total (Category) | 5 (9.4%) | 48 (90.6%) |
| Total (Overall) | 199 (47.9%) | 216 (52.0%) |
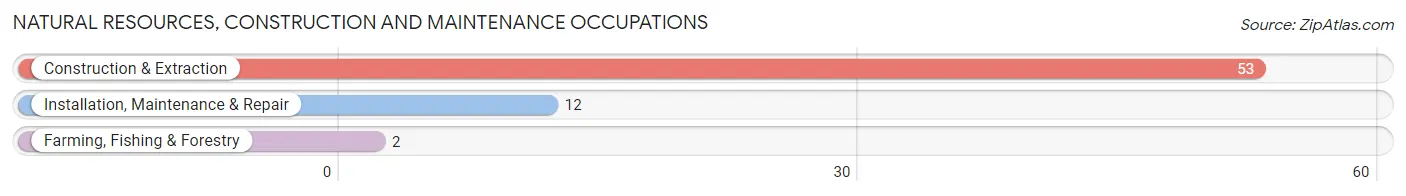
Natural Resources, Construction and Maintenance Occupations
The most common Natural Resources, Construction and Maintenance occupations in Kiowa are Construction & Extraction (53 | 12.8%), Installation, Maintenance & Repair (12 | 2.9%), and Farming, Fishing & Forestry (2 | 0.5%).
Natural Resources, Construction and Maintenance Occupations by Sex
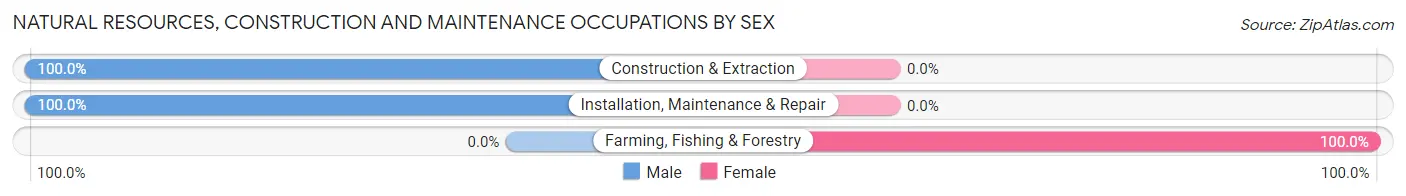
| Occupation | Male | Female |
| Farming, Fishing & Forestry | 0 (0.0%) | 2 (100.0%) |
| Construction & Extraction | 53 (100.0%) | 0 (0.0%) |
| Installation, Maintenance & Repair | 12 (100.0%) | 0 (0.0%) |
| Total (Category) | 65 (97.0%) | 2 (3.0%) |
| Total (Overall) | 199 (47.9%) | 216 (52.0%) |
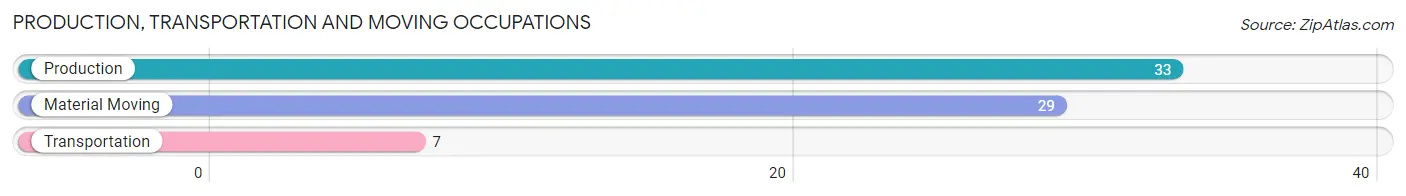
Production, Transportation and Moving Occupations
The most common Production, Transportation and Moving occupations in Kiowa are Production (33 | 8.0%), Material Moving (29 | 7.0%), and Transportation (7 | 1.7%).
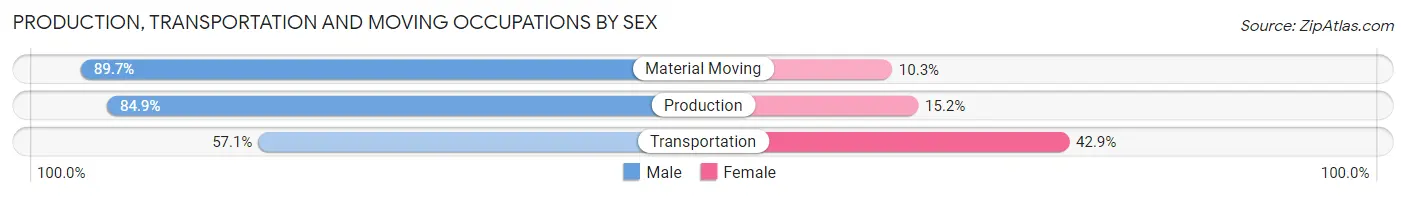
Production, Transportation and Moving Occupations by Sex
| Occupation | Male | Female |
| Production | 28 (84.9%) | 5 (15.1%) |
| Transportation | 4 (57.1%) | 3 (42.9%) |
| Material Moving | 26 (89.7%) | 3 (10.3%) |
| Total (Category) | 58 (84.1%) | 11 (15.9%) |
| Total (Overall) | 199 (47.9%) | 216 (52.0%) |
Employment Industries by Sex in Kiowa
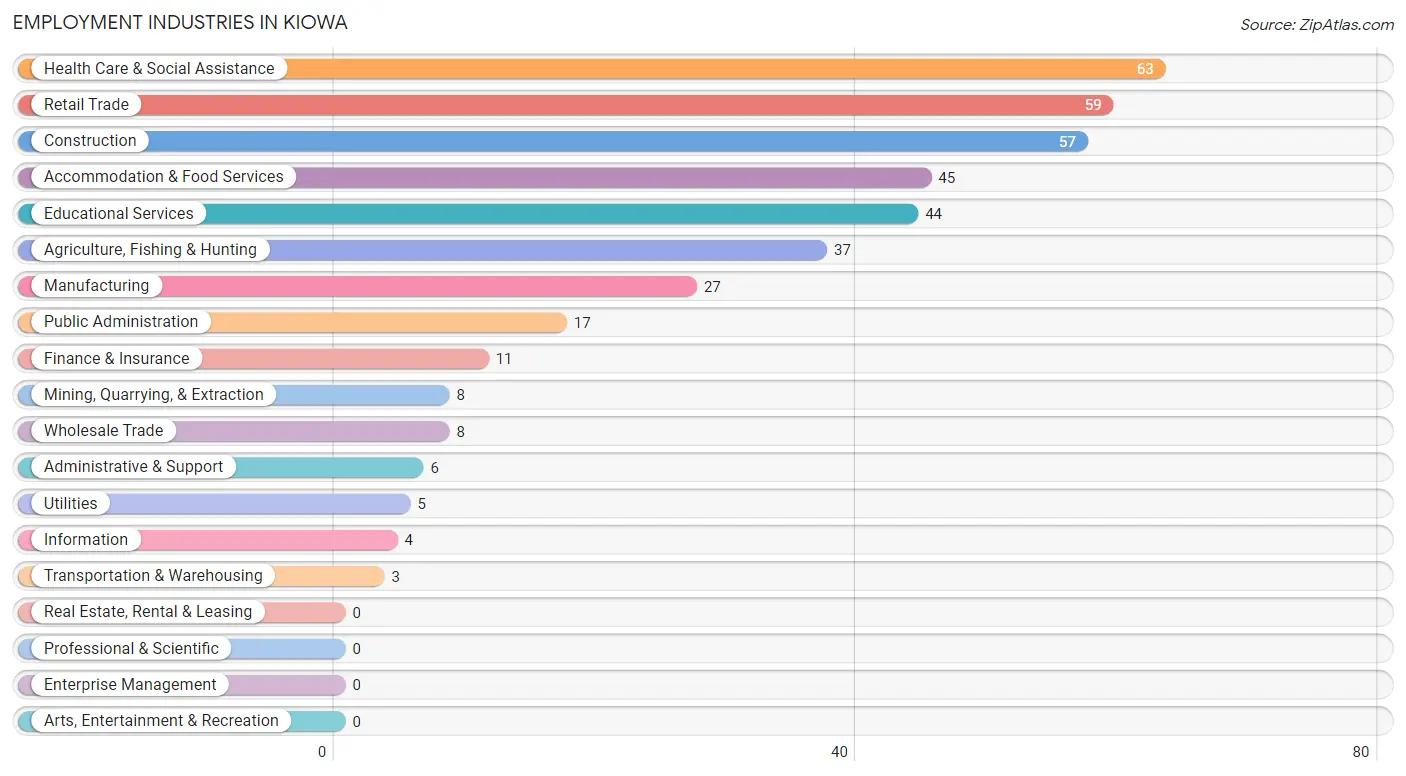
Employment Industries in Kiowa
The major employment industries in Kiowa include Health Care & Social Assistance (63 | 15.2%), Retail Trade (59 | 14.2%), Construction (57 | 13.7%), Accommodation & Food Services (45 | 10.8%), and Educational Services (44 | 10.6%).
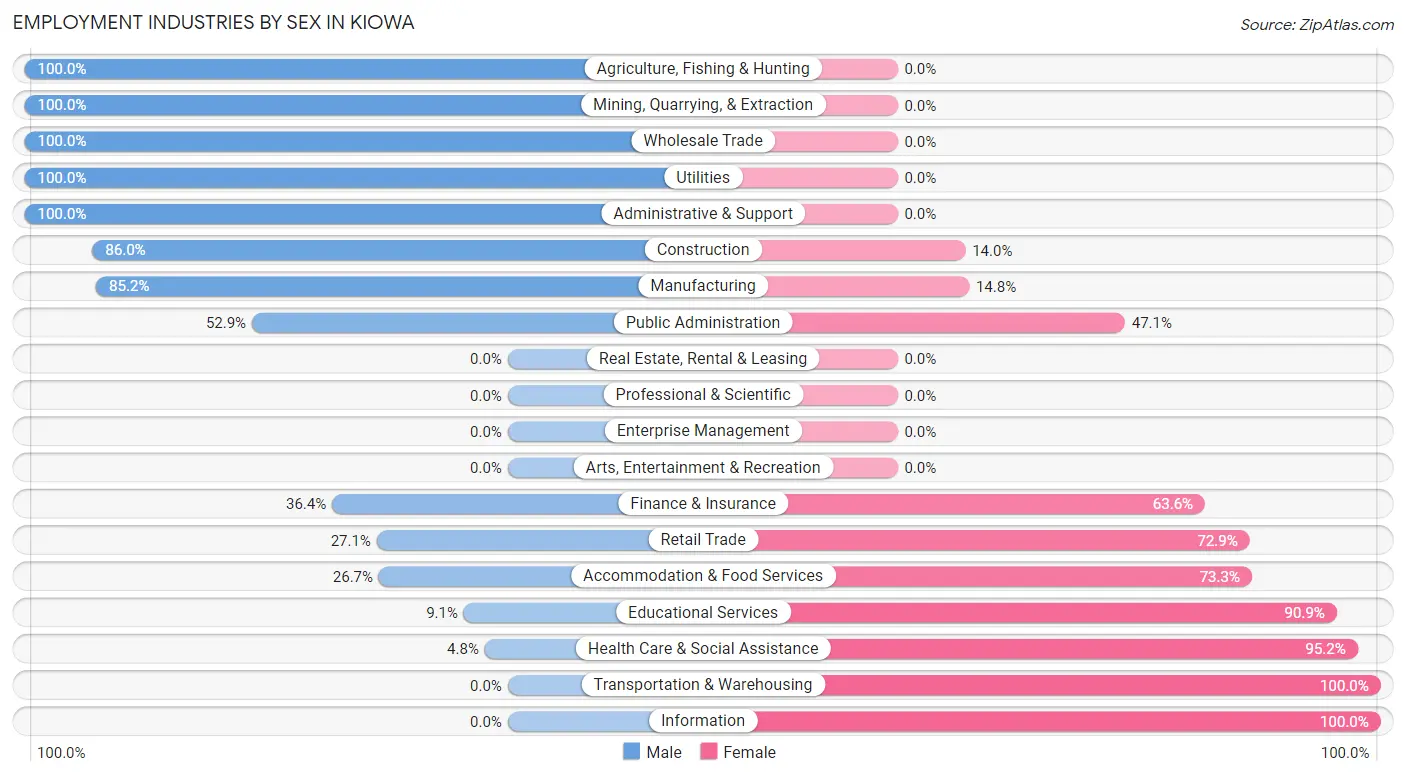
Employment Industries by Sex in Kiowa
The Kiowa industries that see more men than women are Agriculture, Fishing & Hunting (100.0%), Mining, Quarrying, & Extraction (100.0%), and Wholesale Trade (100.0%), whereas the industries that tend to have a higher number of women are Transportation & Warehousing (100.0%), Information (100.0%), and Health Care & Social Assistance (95.2%).
| Industry | Male | Female |
| Agriculture, Fishing & Hunting | 37 (100.0%) | 0 (0.0%) |
| Mining, Quarrying, & Extraction | 8 (100.0%) | 0 (0.0%) |
| Construction | 49 (86.0%) | 8 (14.0%) |
| Manufacturing | 23 (85.2%) | 4 (14.8%) |
| Wholesale Trade | 8 (100.0%) | 0 (0.0%) |
| Retail Trade | 16 (27.1%) | 43 (72.9%) |
| Transportation & Warehousing | 0 (0.0%) | 3 (100.0%) |
| Utilities | 5 (100.0%) | 0 (0.0%) |
| Information | 0 (0.0%) | 4 (100.0%) |
| Finance & Insurance | 4 (36.4%) | 7 (63.6%) |
| Real Estate, Rental & Leasing | 0 (0.0%) | 0 (0.0%) |
| Professional & Scientific | 0 (0.0%) | 0 (0.0%) |
| Enterprise Management | 0 (0.0%) | 0 (0.0%) |
| Administrative & Support | 6 (100.0%) | 0 (0.0%) |
| Educational Services | 4 (9.1%) | 40 (90.9%) |
| Health Care & Social Assistance | 3 (4.8%) | 60 (95.2%) |
| Arts, Entertainment & Recreation | 0 (0.0%) | 0 (0.0%) |
| Accommodation & Food Services | 12 (26.7%) | 33 (73.3%) |
| Public Administration | 9 (52.9%) | 8 (47.1%) |
| Total | 199 (47.9%) | 216 (52.0%) |
Education in Kiowa
School Enrollment in Kiowa
The most common levels of schooling among the 149 students in Kiowa are kindergarten (45 | 30.2%), elementary school (32 | 21.5%), and high school (30 | 20.1%).
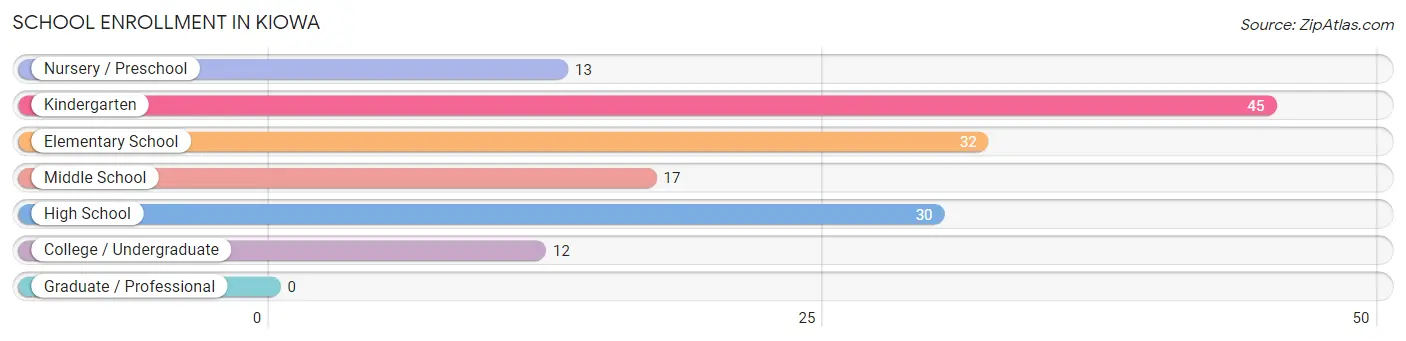
| School Level | # Students | % Students |
| Nursery / Preschool | 13 | 8.7% |
| Kindergarten | 45 | 30.2% |
| Elementary School | 32 | 21.5% |
| Middle School | 17 | 11.4% |
| High School | 30 | 20.1% |
| College / Undergraduate | 12 | 8.1% |
| Graduate / Professional | 0 | 0.0% |
| Total | 149 | 100.0% |
School Enrollment by Age by Funding Source in Kiowa
Out of a total of 149 students who are enrolled in schools in Kiowa, 22 (14.8%) attend a private institution, while the remaining 127 (85.2%) are enrolled in public schools. The age group of 10 to 14 year olds has the highest likelihood of being enrolled in private schools, with 12 (70.6% in the age bracket) enrolled. Conversely, the age group of 3 to 4 year olds has the lowest likelihood of being enrolled in a private school, with 7 (100.0% in the age bracket) attending a public institution.
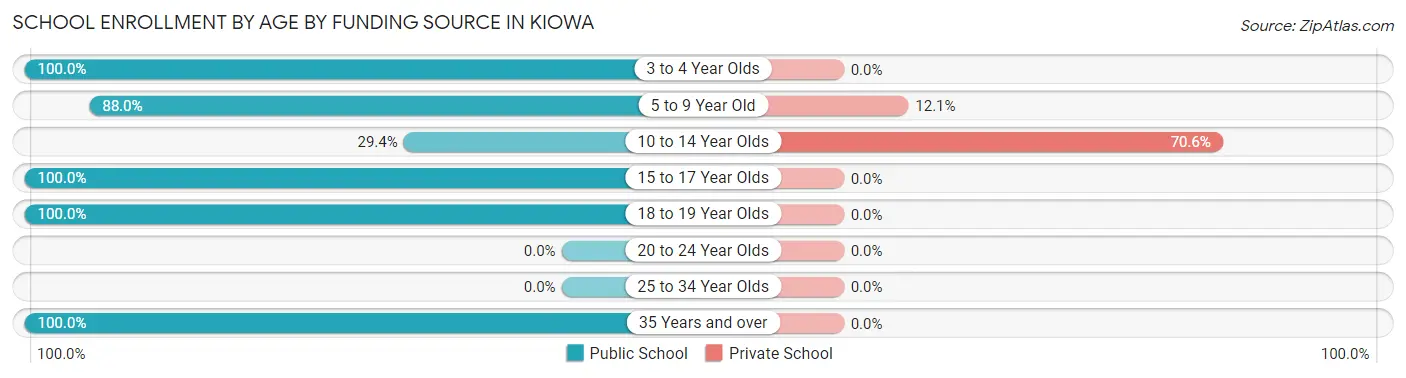
| Age Bracket | Public School | Private School |
| 3 to 4 Year Olds | 7 (100.0%) | 0 (0.0%) |
| 5 to 9 Year Old | 73 (87.9%) | 10 (12.0%) |
| 10 to 14 Year Olds | 5 (29.4%) | 12 (70.6%) |
| 15 to 17 Year Olds | 27 (100.0%) | 0 (0.0%) |
| 18 to 19 Year Olds | 3 (100.0%) | 0 (0.0%) |
| 20 to 24 Year Olds | 0 (0.0%) | 0 (0.0%) |
| 25 to 34 Year Olds | 0 (0.0%) | 0 (0.0%) |
| 35 Years and over | 12 (100.0%) | 0 (0.0%) |
| Total | 127 (85.2%) | 22 (14.8%) |
Educational Attainment by Field of Study in Kiowa
Education (43 | 26.7%), arts & humanities (43 | 26.7%), social sciences (40 | 24.8%), business (15 | 9.3%), and psychology (7 | 4.3%) are the most common fields of study among 161 individuals in Kiowa who have obtained a bachelor's degree or higher.
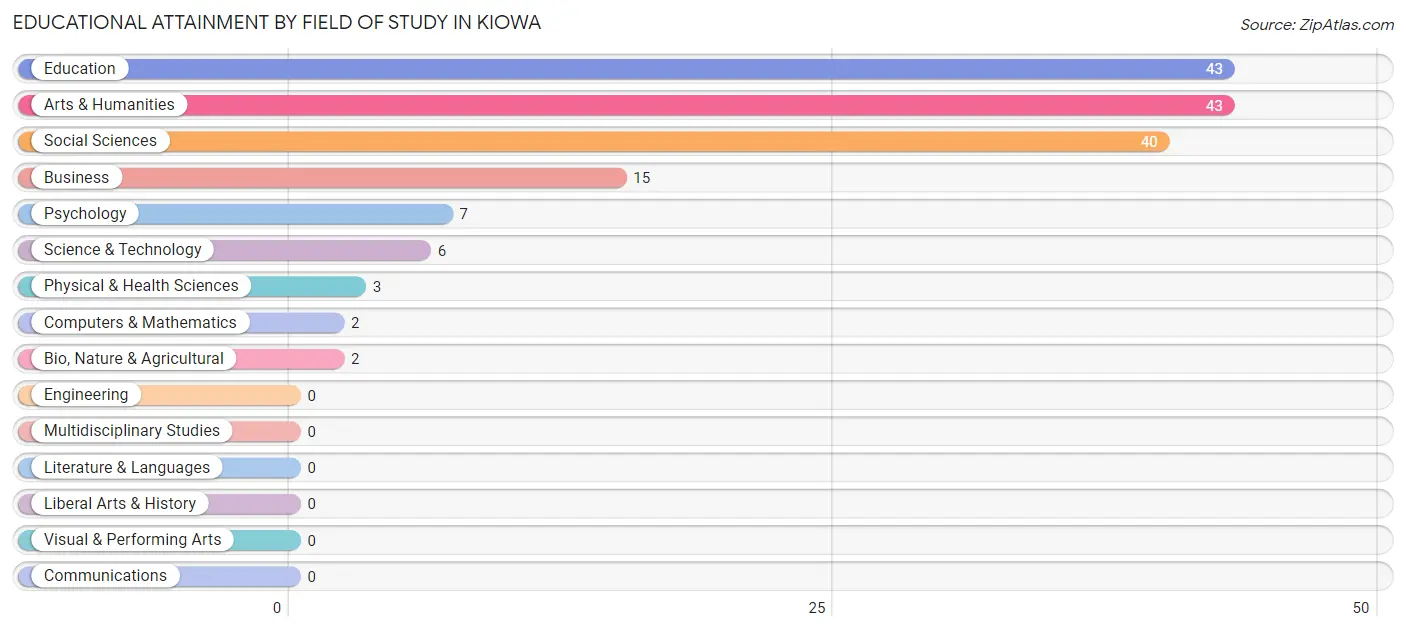
| Field of Study | # Graduates | % Graduates |
| Computers & Mathematics | 2 | 1.2% |
| Bio, Nature & Agricultural | 2 | 1.2% |
| Physical & Health Sciences | 3 | 1.9% |
| Psychology | 7 | 4.3% |
| Social Sciences | 40 | 24.8% |
| Engineering | 0 | 0.0% |
| Multidisciplinary Studies | 0 | 0.0% |
| Science & Technology | 6 | 3.7% |
| Business | 15 | 9.3% |
| Education | 43 | 26.7% |
| Literature & Languages | 0 | 0.0% |
| Liberal Arts & History | 0 | 0.0% |
| Visual & Performing Arts | 0 | 0.0% |
| Communications | 0 | 0.0% |
| Arts & Humanities | 43 | 26.7% |
| Total | 161 | 100.0% |
Transportation & Commute in Kiowa
Vehicle Availability by Sex in Kiowa
The most prevalent vehicle ownership categories in Kiowa are males with 2 vehicles (95, accounting for 47.7%) and females with 2 vehicles (61, making up 44.4%).
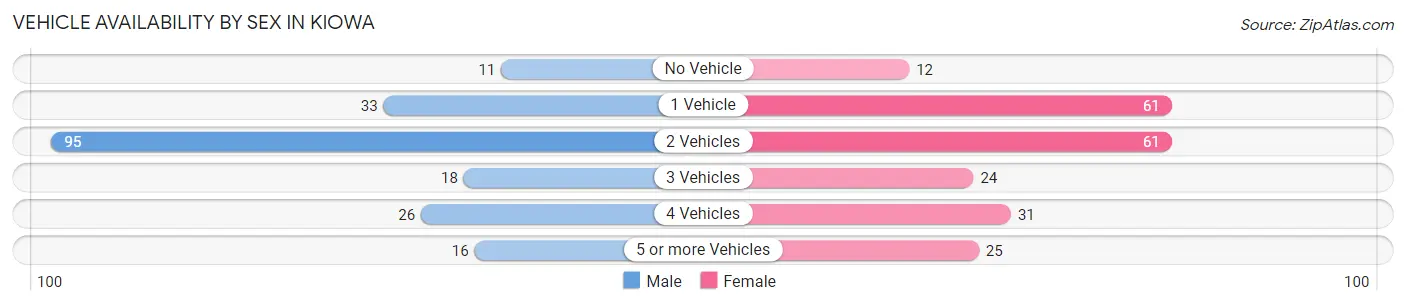
| Vehicles Available | Male | Female |
| No Vehicle | 11 (5.5%) | 12 (5.6%) |
| 1 Vehicle | 33 (16.6%) | 61 (28.5%) |
| 2 Vehicles | 95 (47.7%) | 61 (28.5%) |
| 3 Vehicles | 18 (9.0%) | 24 (11.2%) |
| 4 Vehicles | 26 (13.1%) | 31 (14.5%) |
| 5 or more Vehicles | 16 (8.0%) | 25 (11.7%) |
| Total | 199 (100.0%) | 214 (100.0%) |
Commute Time in Kiowa
The most frequently occuring commute durations in Kiowa are less than 5 minutes (122 commuters, 29.6%), 5 to 9 minutes (113 commuters, 27.4%), and 15 to 19 minutes (66 commuters, 16.0%).
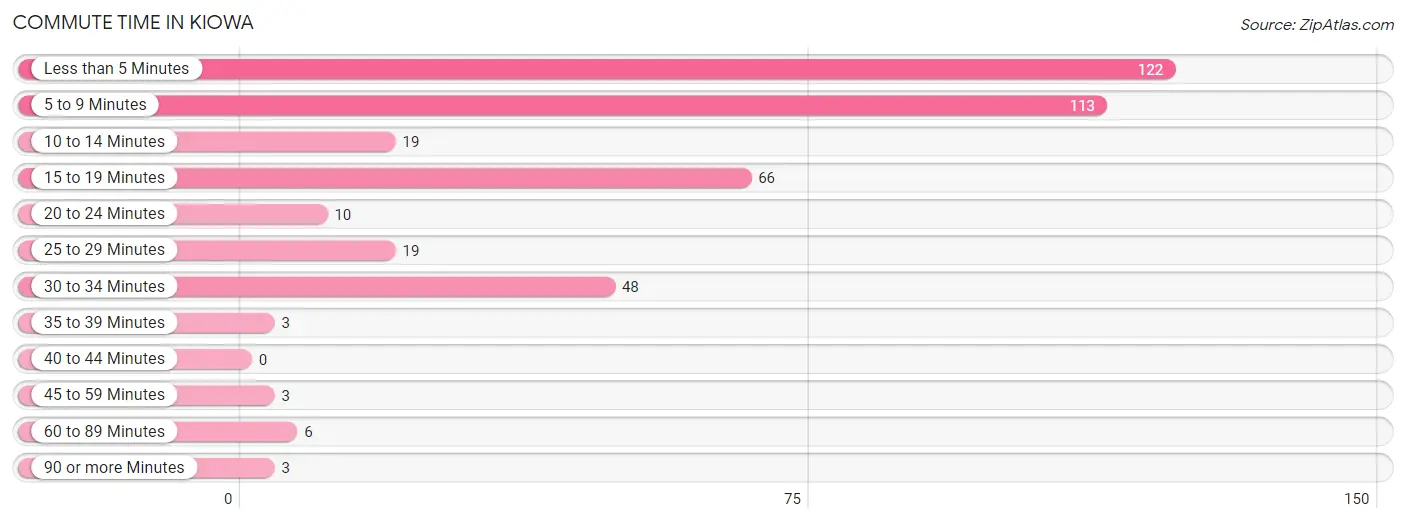
| Commute Time | # Commuters | % Commuters |
| Less than 5 Minutes | 122 | 29.6% |
| 5 to 9 Minutes | 113 | 27.4% |
| 10 to 14 Minutes | 19 | 4.6% |
| 15 to 19 Minutes | 66 | 16.0% |
| 20 to 24 Minutes | 10 | 2.4% |
| 25 to 29 Minutes | 19 | 4.6% |
| 30 to 34 Minutes | 48 | 11.7% |
| 35 to 39 Minutes | 3 | 0.7% |
| 40 to 44 Minutes | 0 | 0.0% |
| 45 to 59 Minutes | 3 | 0.7% |
| 60 to 89 Minutes | 6 | 1.5% |
| 90 or more Minutes | 3 | 0.7% |
Commute Time by Sex in Kiowa
The most common commute times in Kiowa are 15 to 19 minutes (66 commuters, 33.2%) for males and less than 5 minutes (84 commuters, 39.4%) for females.
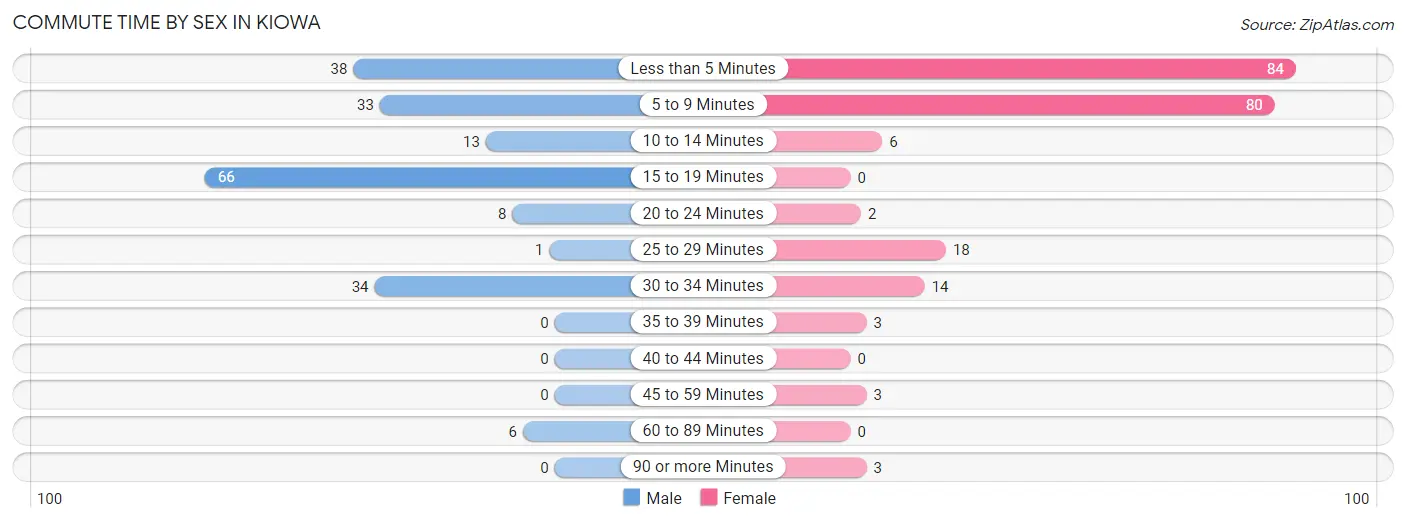
| Commute Time | Male | Female |
| Less than 5 Minutes | 38 (19.1%) | 84 (39.4%) |
| 5 to 9 Minutes | 33 (16.6%) | 80 (37.6%) |
| 10 to 14 Minutes | 13 (6.5%) | 6 (2.8%) |
| 15 to 19 Minutes | 66 (33.2%) | 0 (0.0%) |
| 20 to 24 Minutes | 8 (4.0%) | 2 (0.9%) |
| 25 to 29 Minutes | 1 (0.5%) | 18 (8.5%) |
| 30 to 34 Minutes | 34 (17.1%) | 14 (6.6%) |
| 35 to 39 Minutes | 0 (0.0%) | 3 (1.4%) |
| 40 to 44 Minutes | 0 (0.0%) | 0 (0.0%) |
| 45 to 59 Minutes | 0 (0.0%) | 3 (1.4%) |
| 60 to 89 Minutes | 6 (3.0%) | 0 (0.0%) |
| 90 or more Minutes | 0 (0.0%) | 3 (1.4%) |
Time of Departure to Work by Sex in Kiowa
The most frequent times of departure to work in Kiowa are 6:30 AM to 6:59 AM (65, 32.7%) for males and 7:30 AM to 7:59 AM (62, 29.1%) for females.
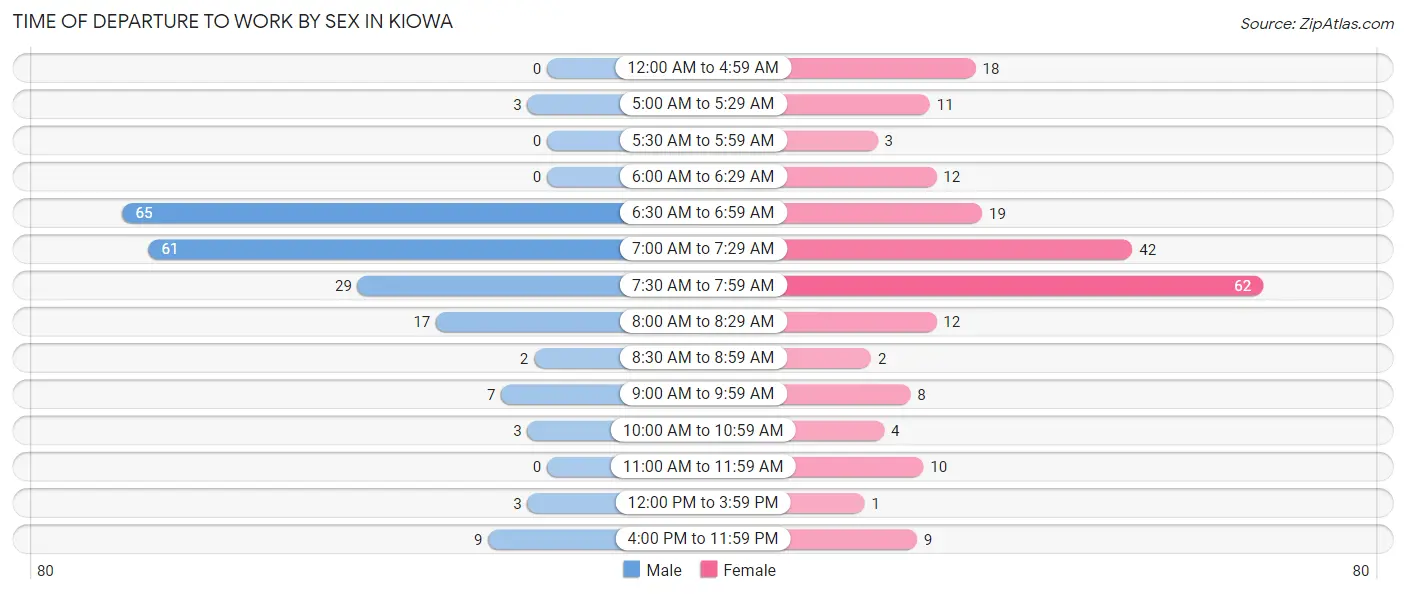
| Time of Departure | Male | Female |
| 12:00 AM to 4:59 AM | 0 (0.0%) | 18 (8.5%) |
| 5:00 AM to 5:29 AM | 3 (1.5%) | 11 (5.2%) |
| 5:30 AM to 5:59 AM | 0 (0.0%) | 3 (1.4%) |
| 6:00 AM to 6:29 AM | 0 (0.0%) | 12 (5.6%) |
| 6:30 AM to 6:59 AM | 65 (32.7%) | 19 (8.9%) |
| 7:00 AM to 7:29 AM | 61 (30.6%) | 42 (19.7%) |
| 7:30 AM to 7:59 AM | 29 (14.6%) | 62 (29.1%) |
| 8:00 AM to 8:29 AM | 17 (8.5%) | 12 (5.6%) |
| 8:30 AM to 8:59 AM | 2 (1.0%) | 2 (0.9%) |
| 9:00 AM to 9:59 AM | 7 (3.5%) | 8 (3.8%) |
| 10:00 AM to 10:59 AM | 3 (1.5%) | 4 (1.9%) |
| 11:00 AM to 11:59 AM | 0 (0.0%) | 10 (4.7%) |
| 12:00 PM to 3:59 PM | 3 (1.5%) | 1 (0.5%) |
| 4:00 PM to 11:59 PM | 9 (4.5%) | 9 (4.2%) |
| Total | 199 (100.0%) | 213 (100.0%) |
Housing Occupancy in Kiowa
Occupancy by Ownership in Kiowa
Of the total 351 dwellings in Kiowa, owner-occupied units account for 270 (76.9%), while renter-occupied units make up 81 (23.1%).
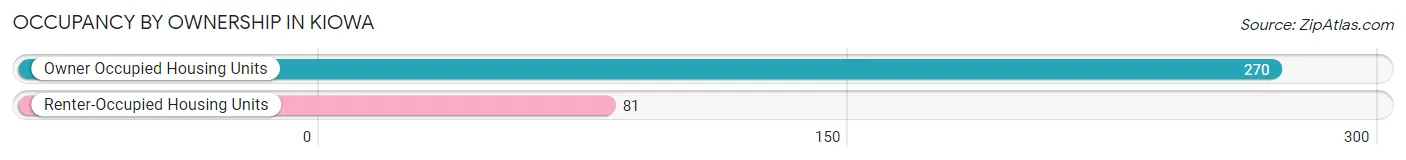
| Occupancy | # Housing Units | % Housing Units |
| Owner Occupied Housing Units | 270 | 76.9% |
| Renter-Occupied Housing Units | 81 | 23.1% |
| Total Occupied Housing Units | 351 | 100.0% |
Occupancy by Household Size in Kiowa
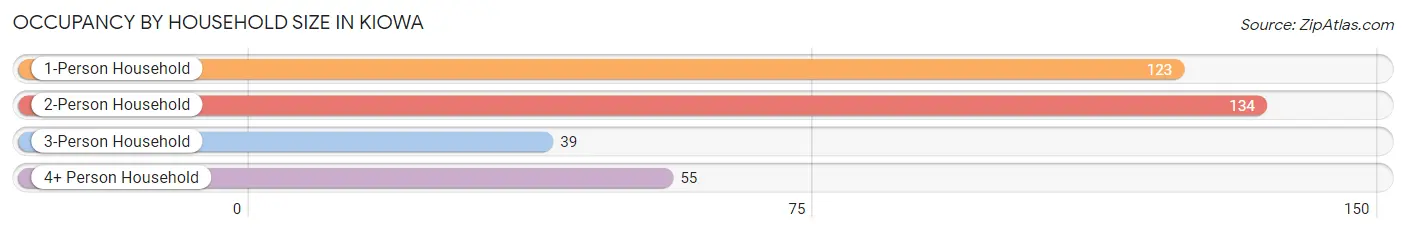
| Household Size | # Housing Units | % Housing Units |
| 1-Person Household | 123 | 35.0% |
| 2-Person Household | 134 | 38.2% |
| 3-Person Household | 39 | 11.1% |
| 4+ Person Household | 55 | 15.7% |
| Total Housing Units | 351 | 100.0% |
Occupancy by Ownership by Household Size in Kiowa
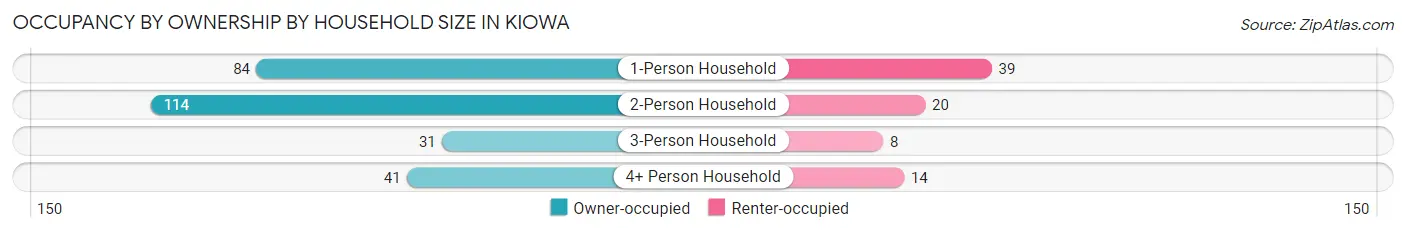
| Household Size | Owner-occupied | Renter-occupied |
| 1-Person Household | 84 (68.3%) | 39 (31.7%) |
| 2-Person Household | 114 (85.1%) | 20 (14.9%) |
| 3-Person Household | 31 (79.5%) | 8 (20.5%) |
| 4+ Person Household | 41 (74.6%) | 14 (25.5%) |
| Total Housing Units | 270 (76.9%) | 81 (23.1%) |
Occupancy by Educational Attainment in Kiowa
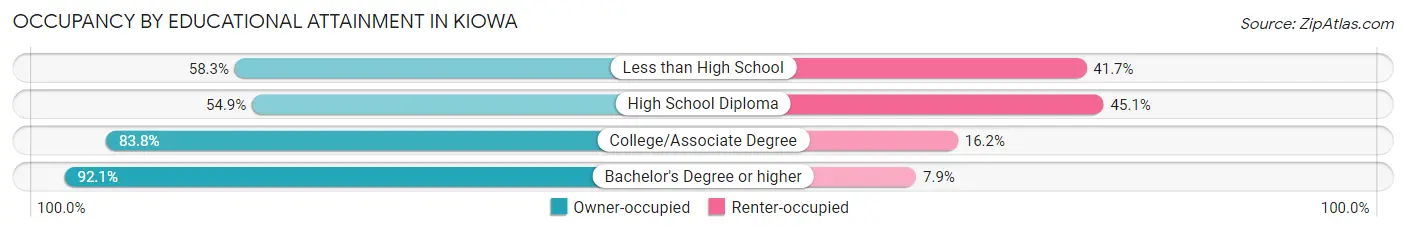
| Household Size | Owner-occupied | Renter-occupied |
| Less than High School | 7 (58.3%) | 5 (41.7%) |
| High School Diploma | 56 (54.9%) | 46 (45.1%) |
| College/Associate Degree | 114 (83.8%) | 22 (16.2%) |
| Bachelor's Degree or higher | 93 (92.1%) | 8 (7.9%) |
Occupancy by Age of Householder in Kiowa
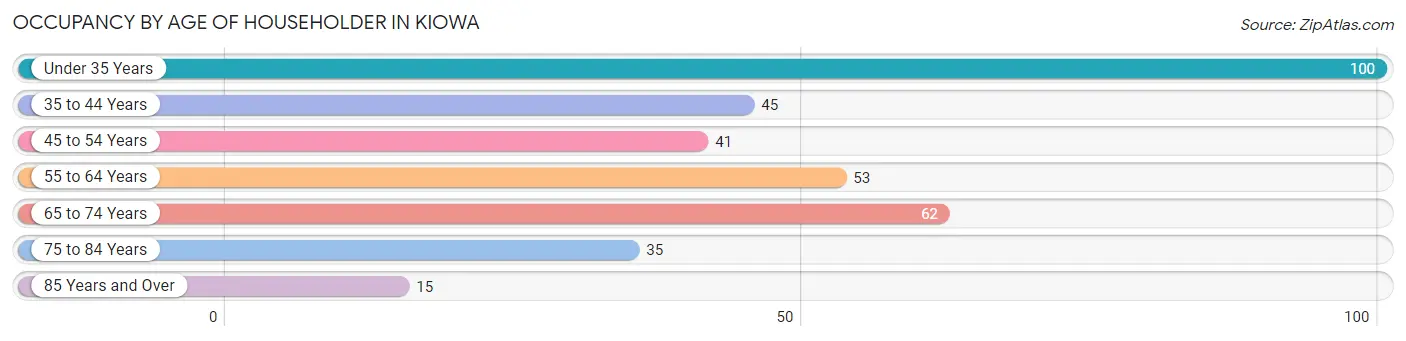
| Age Bracket | # Households | % Households |
| Under 35 Years | 100 | 28.5% |
| 35 to 44 Years | 45 | 12.8% |
| 45 to 54 Years | 41 | 11.7% |
| 55 to 64 Years | 53 | 15.1% |
| 65 to 74 Years | 62 | 17.7% |
| 75 to 84 Years | 35 | 10.0% |
| 85 Years and Over | 15 | 4.3% |
| Total | 351 | 100.0% |
Housing Finances in Kiowa
Median Income by Occupancy in Kiowa
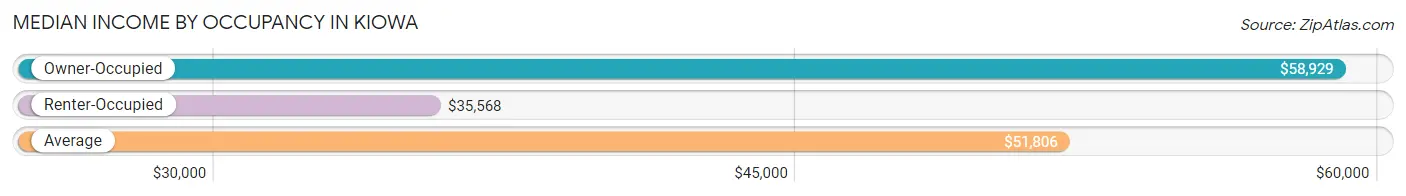
| Occupancy Type | # Households | Median Income |
| Owner-Occupied | 270 (76.9%) | $58,929 |
| Renter-Occupied | 81 (23.1%) | $35,568 |
| Average | 351 (100.0%) | $51,806 |
Occupancy by Householder Income Bracket in Kiowa
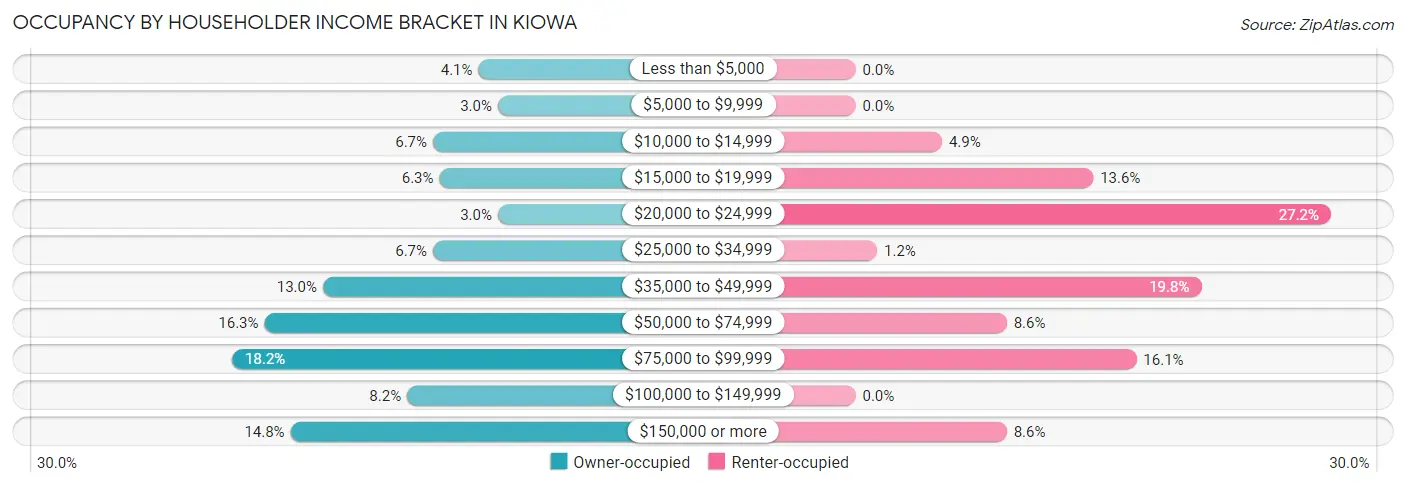
| Income Bracket | Owner-occupied | Renter-occupied |
| Less than $5,000 | 11 (4.1%) | 0 (0.0%) |
| $5,000 to $9,999 | 8 (3.0%) | 0 (0.0%) |
| $10,000 to $14,999 | 18 (6.7%) | 4 (4.9%) |
| $15,000 to $19,999 | 17 (6.3%) | 11 (13.6%) |
| $20,000 to $24,999 | 8 (3.0%) | 22 (27.2%) |
| $25,000 to $34,999 | 18 (6.7%) | 1 (1.2%) |
| $35,000 to $49,999 | 35 (13.0%) | 16 (19.8%) |
| $50,000 to $74,999 | 44 (16.3%) | 7 (8.6%) |
| $75,000 to $99,999 | 49 (18.1%) | 13 (16.1%) |
| $100,000 to $149,999 | 22 (8.2%) | 0 (0.0%) |
| $150,000 or more | 40 (14.8%) | 7 (8.6%) |
| Total | 270 (100.0%) | 81 (100.0%) |
Monthly Housing Cost Tiers in Kiowa
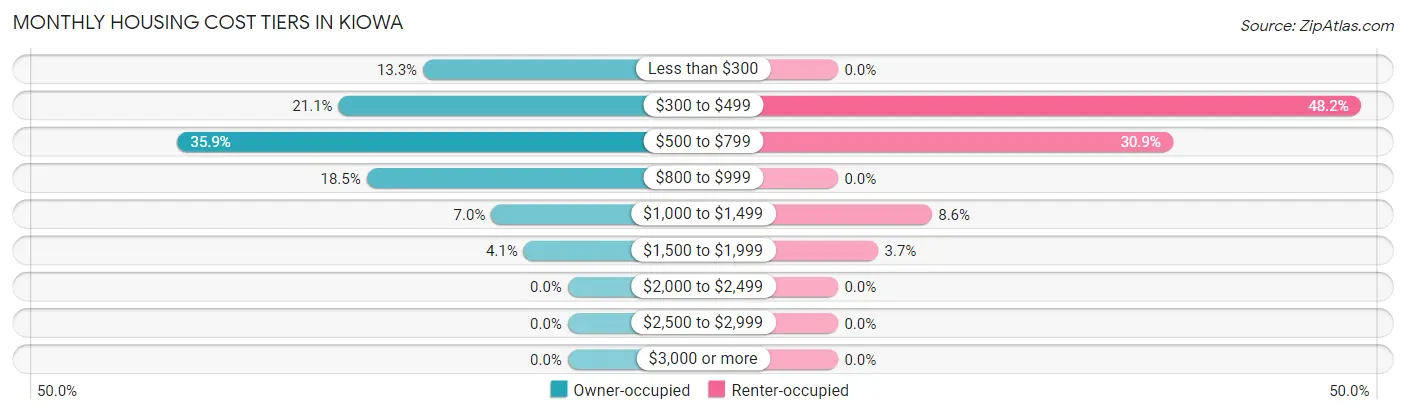
| Monthly Cost | Owner-occupied | Renter-occupied |
| Less than $300 | 36 (13.3%) | 0 (0.0%) |
| $300 to $499 | 57 (21.1%) | 39 (48.1%) |
| $500 to $799 | 97 (35.9%) | 25 (30.9%) |
| $800 to $999 | 50 (18.5%) | 0 (0.0%) |
| $1,000 to $1,499 | 19 (7.0%) | 7 (8.6%) |
| $1,500 to $1,999 | 11 (4.1%) | 3 (3.7%) |
| $2,000 to $2,499 | 0 (0.0%) | 0 (0.0%) |
| $2,500 to $2,999 | 0 (0.0%) | 0 (0.0%) |
| $3,000 or more | 0 (0.0%) | 0 (0.0%) |
| Total | 270 (100.0%) | 81 (100.0%) |
Physical Housing Characteristics in Kiowa
Housing Structures in Kiowa
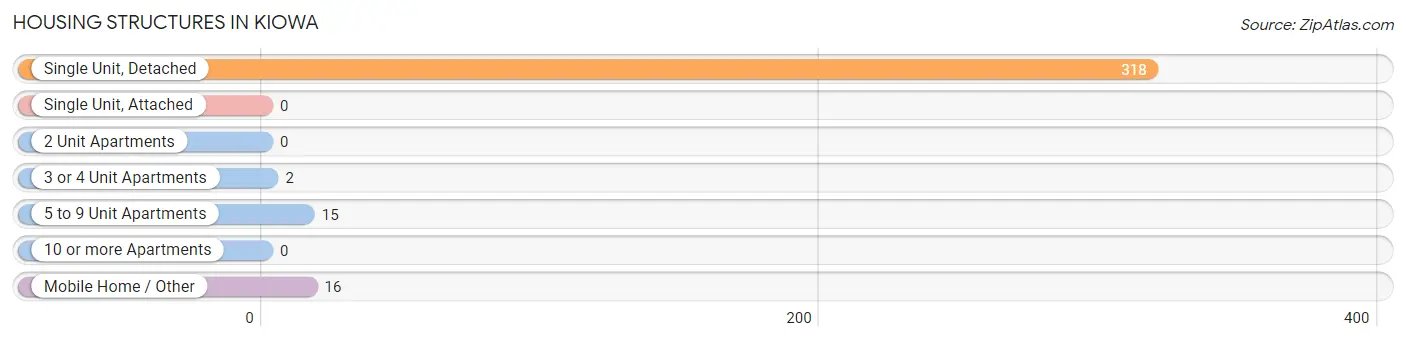
| Structure Type | # Housing Units | % Housing Units |
| Single Unit, Detached | 318 | 90.6% |
| Single Unit, Attached | 0 | 0.0% |
| 2 Unit Apartments | 0 | 0.0% |
| 3 or 4 Unit Apartments | 2 | 0.6% |
| 5 to 9 Unit Apartments | 15 | 4.3% |
| 10 or more Apartments | 0 | 0.0% |
| Mobile Home / Other | 16 | 4.6% |
| Total | 351 | 100.0% |
Housing Structures by Occupancy in Kiowa
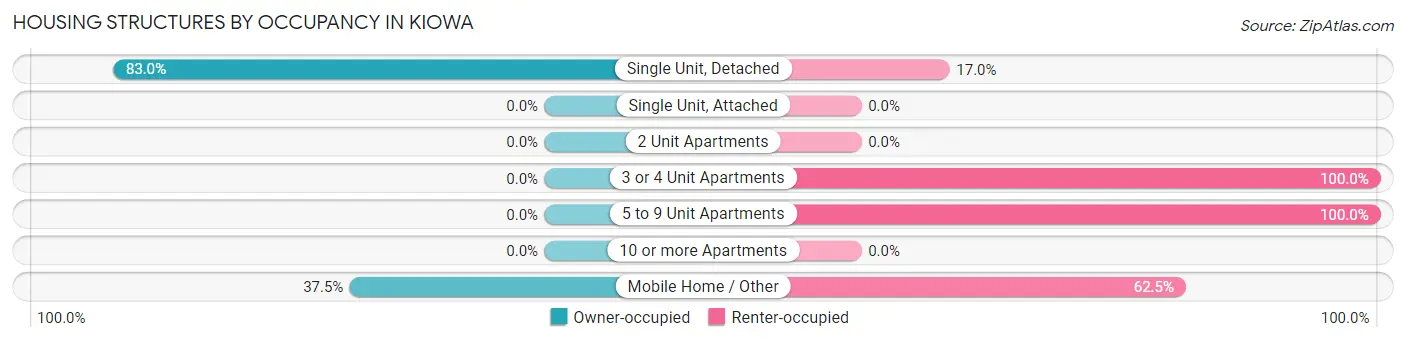
| Structure Type | Owner-occupied | Renter-occupied |
| Single Unit, Detached | 264 (83.0%) | 54 (17.0%) |
| Single Unit, Attached | 0 (0.0%) | 0 (0.0%) |
| 2 Unit Apartments | 0 (0.0%) | 0 (0.0%) |
| 3 or 4 Unit Apartments | 0 (0.0%) | 2 (100.0%) |
| 5 to 9 Unit Apartments | 0 (0.0%) | 15 (100.0%) |
| 10 or more Apartments | 0 (0.0%) | 0 (0.0%) |
| Mobile Home / Other | 6 (37.5%) | 10 (62.5%) |
| Total | 270 (76.9%) | 81 (23.1%) |
Housing Structures by Number of Rooms in Kiowa
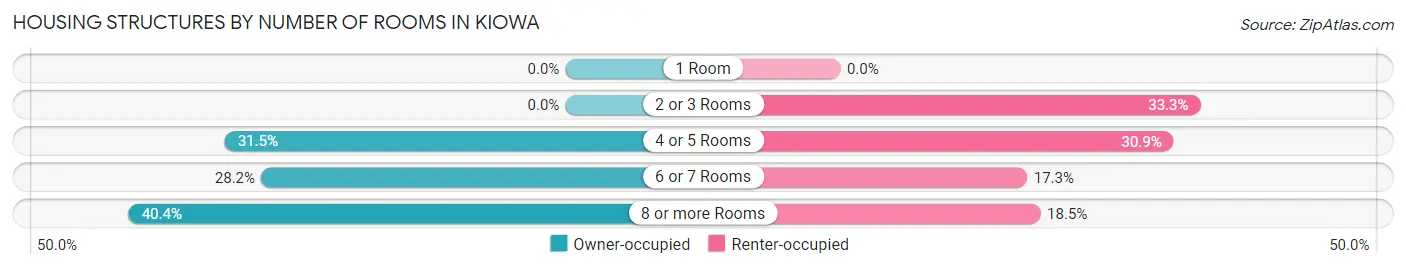
| Number of Rooms | Owner-occupied | Renter-occupied |
| 1 Room | 0 (0.0%) | 0 (0.0%) |
| 2 or 3 Rooms | 0 (0.0%) | 27 (33.3%) |
| 4 or 5 Rooms | 85 (31.5%) | 25 (30.9%) |
| 6 or 7 Rooms | 76 (28.1%) | 14 (17.3%) |
| 8 or more Rooms | 109 (40.4%) | 15 (18.5%) |
| Total | 270 (100.0%) | 81 (100.0%) |
Housing Structure by Heating Type in Kiowa
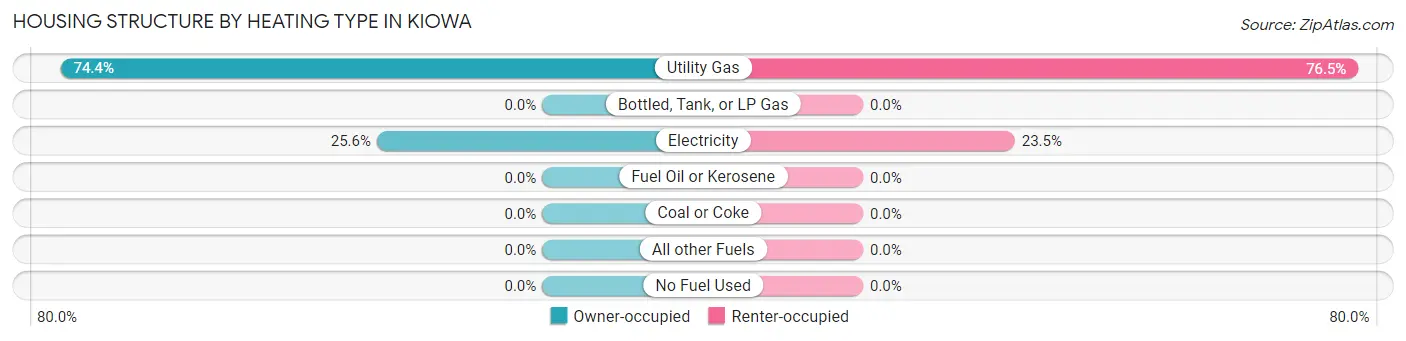
| Heating Type | Owner-occupied | Renter-occupied |
| Utility Gas | 201 (74.4%) | 62 (76.5%) |
| Bottled, Tank, or LP Gas | 0 (0.0%) | 0 (0.0%) |
| Electricity | 69 (25.6%) | 19 (23.5%) |
| Fuel Oil or Kerosene | 0 (0.0%) | 0 (0.0%) |
| Coal or Coke | 0 (0.0%) | 0 (0.0%) |
| All other Fuels | 0 (0.0%) | 0 (0.0%) |
| No Fuel Used | 0 (0.0%) | 0 (0.0%) |
| Total | 270 (100.0%) | 81 (100.0%) |
Household Vehicle Usage in Kiowa
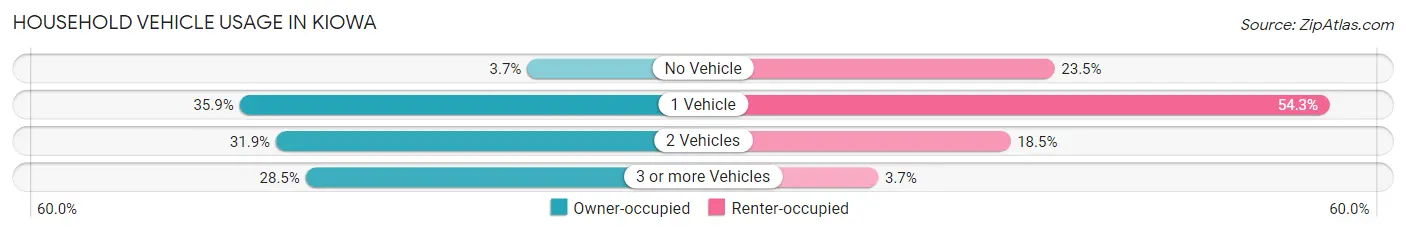
| Vehicles per Household | Owner-occupied | Renter-occupied |
| No Vehicle | 10 (3.7%) | 19 (23.5%) |
| 1 Vehicle | 97 (35.9%) | 44 (54.3%) |
| 2 Vehicles | 86 (31.9%) | 15 (18.5%) |
| 3 or more Vehicles | 77 (28.5%) | 3 (3.7%) |
| Total | 270 (100.0%) | 81 (100.0%) |
Real Estate & Mortgages in Kiowa
Real Estate and Mortgage Overview in Kiowa
| Characteristic | Without Mortgage | With Mortgage |
| Housing Units | 212 | 58 |
| Median Property Value | $79,200 | $64,500 |
| Median Household Income | $58,214 | $8 |
| Monthly Housing Costs | $527 | $0 |
| Real Estate Taxes | $1,680 | $0 |
Property Value by Mortgage Status in Kiowa
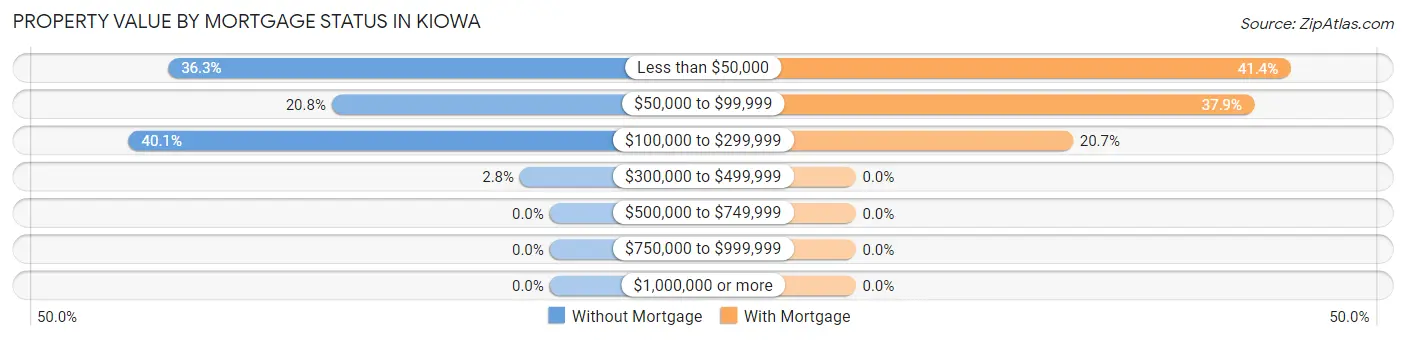
| Property Value | Without Mortgage | With Mortgage |
| Less than $50,000 | 77 (36.3%) | 24 (41.4%) |
| $50,000 to $99,999 | 44 (20.7%) | 22 (37.9%) |
| $100,000 to $299,999 | 85 (40.1%) | 12 (20.7%) |
| $300,000 to $499,999 | 6 (2.8%) | 0 (0.0%) |
| $500,000 to $749,999 | 0 (0.0%) | 0 (0.0%) |
| $750,000 to $999,999 | 0 (0.0%) | 0 (0.0%) |
| $1,000,000 or more | 0 (0.0%) | 0 (0.0%) |
| Total | 212 (100.0%) | 58 (100.0%) |
Household Income by Mortgage Status in Kiowa
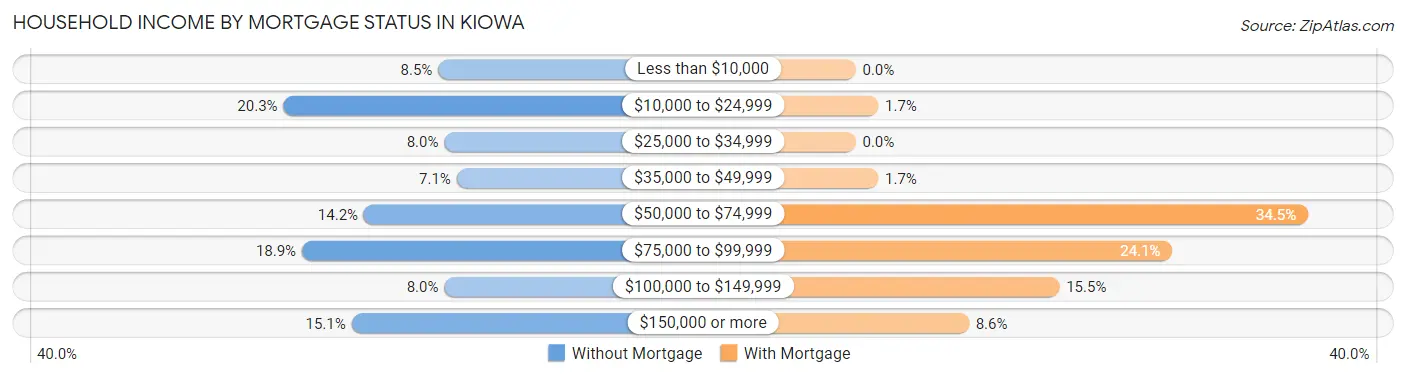
| Household Income | Without Mortgage | With Mortgage |
| Less than $10,000 | 18 (8.5%) | 0 (0.0%) |
| $10,000 to $24,999 | 43 (20.3%) | 1 (1.7%) |
| $25,000 to $34,999 | 17 (8.0%) | 0 (0.0%) |
| $35,000 to $49,999 | 15 (7.1%) | 1 (1.7%) |
| $50,000 to $74,999 | 30 (14.1%) | 20 (34.5%) |
| $75,000 to $99,999 | 40 (18.9%) | 14 (24.1%) |
| $100,000 to $149,999 | 17 (8.0%) | 9 (15.5%) |
| $150,000 or more | 32 (15.1%) | 5 (8.6%) |
| Total | 212 (100.0%) | 58 (100.0%) |
Property Value to Household Income Ratio in Kiowa
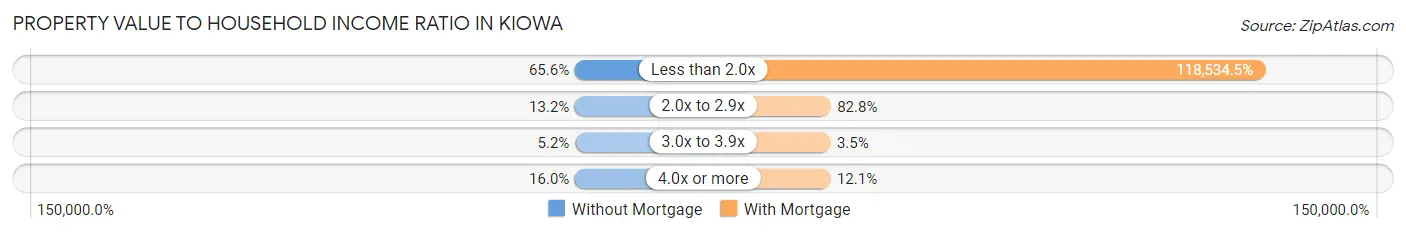
| Value-to-Income Ratio | Without Mortgage | With Mortgage |
| Less than 2.0x | 139 (65.6%) | 68,750 (118,534.5%) |
| 2.0x to 2.9x | 28 (13.2%) | 48 (82.8%) |
| 3.0x to 3.9x | 11 (5.2%) | 2 (3.5%) |
| 4.0x or more | 34 (16.0%) | 7 (12.1%) |
| Total | 212 (100.0%) | 58 (100.0%) |
Real Estate Taxes by Mortgage Status in Kiowa
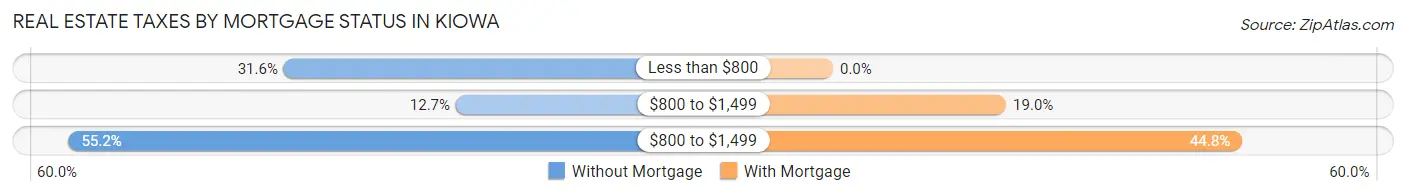
| Property Taxes | Without Mortgage | With Mortgage |
| Less than $800 | 67 (31.6%) | 0 (0.0%) |
| $800 to $1,499 | 27 (12.7%) | 11 (19.0%) |
| $800 to $1,499 | 117 (55.2%) | 26 (44.8%) |
| Total | 212 (100.0%) | 58 (100.0%) |
Health & Disability in Kiowa
Health Insurance Coverage by Age in Kiowa
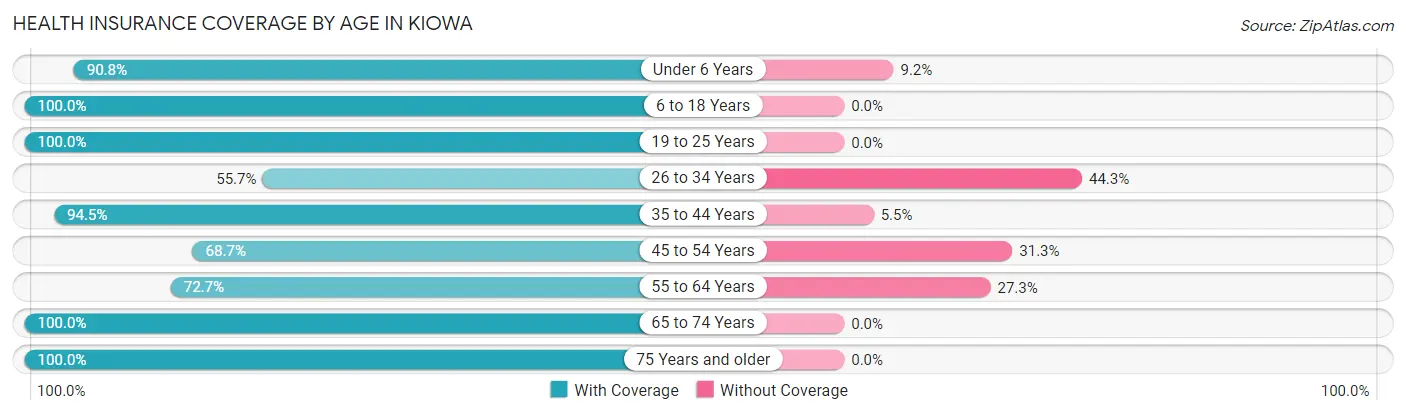
| Age Bracket | With Coverage | Without Coverage |
| Under 6 Years | 89 (90.8%) | 9 (9.2%) |
| 6 to 18 Years | 86 (100.0%) | 0 (0.0%) |
| 19 to 25 Years | 42 (100.0%) | 0 (0.0%) |
| 26 to 34 Years | 54 (55.7%) | 43 (44.3%) |
| 35 to 44 Years | 86 (94.5%) | 5 (5.5%) |
| 45 to 54 Years | 46 (68.7%) | 21 (31.3%) |
| 55 to 64 Years | 64 (72.7%) | 24 (27.3%) |
| 65 to 74 Years | 125 (100.0%) | 0 (0.0%) |
| 75 Years and older | 69 (100.0%) | 0 (0.0%) |
| Total | 661 (86.6%) | 102 (13.4%) |
Health Insurance Coverage by Citizenship Status in Kiowa
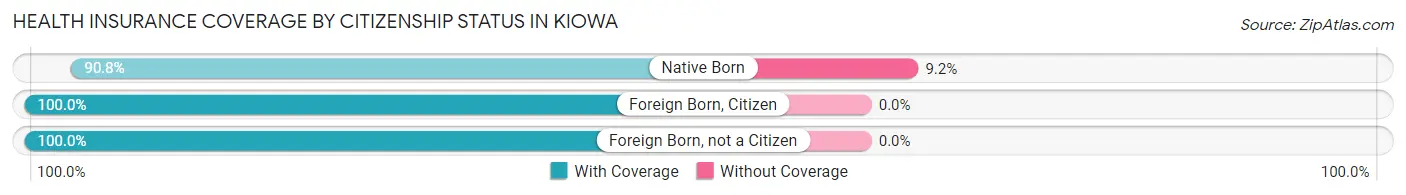
| Citizenship Status | With Coverage | Without Coverage |
| Native Born | 89 (90.8%) | 9 (9.2%) |
| Foreign Born, Citizen | 86 (100.0%) | 0 (0.0%) |
| Foreign Born, not a Citizen | 42 (100.0%) | 0 (0.0%) |
Health Insurance Coverage by Household Income in Kiowa
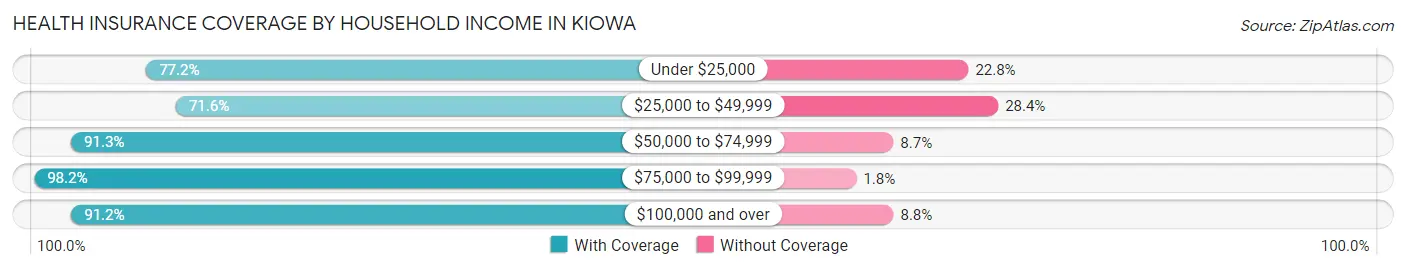
| Household Income | With Coverage | Without Coverage |
| Under $25,000 | 105 (77.2%) | 31 (22.8%) |
| $25,000 to $49,999 | 101 (71.6%) | 40 (28.4%) |
| $50,000 to $74,999 | 115 (91.3%) | 11 (8.7%) |
| $75,000 to $99,999 | 163 (98.2%) | 3 (1.8%) |
| $100,000 and over | 177 (91.2%) | 17 (8.8%) |
Public vs Private Health Insurance Coverage by Age in Kiowa
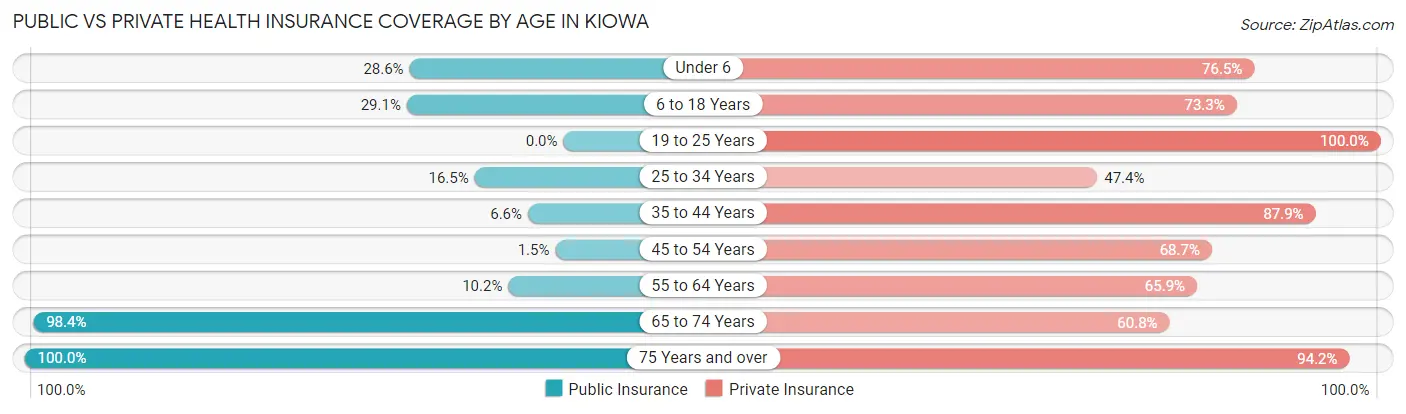
| Age Bracket | Public Insurance | Private Insurance |
| Under 6 | 28 (28.6%) | 75 (76.5%) |
| 6 to 18 Years | 25 (29.1%) | 63 (73.3%) |
| 19 to 25 Years | 0 (0.0%) | 42 (100.0%) |
| 25 to 34 Years | 16 (16.5%) | 46 (47.4%) |
| 35 to 44 Years | 6 (6.6%) | 80 (87.9%) |
| 45 to 54 Years | 1 (1.5%) | 46 (68.7%) |
| 55 to 64 Years | 9 (10.2%) | 58 (65.9%) |
| 65 to 74 Years | 123 (98.4%) | 76 (60.8%) |
| 75 Years and over | 69 (100.0%) | 65 (94.2%) |
| Total | 277 (36.3%) | 551 (72.2%) |
Disability Status by Sex by Age in Kiowa
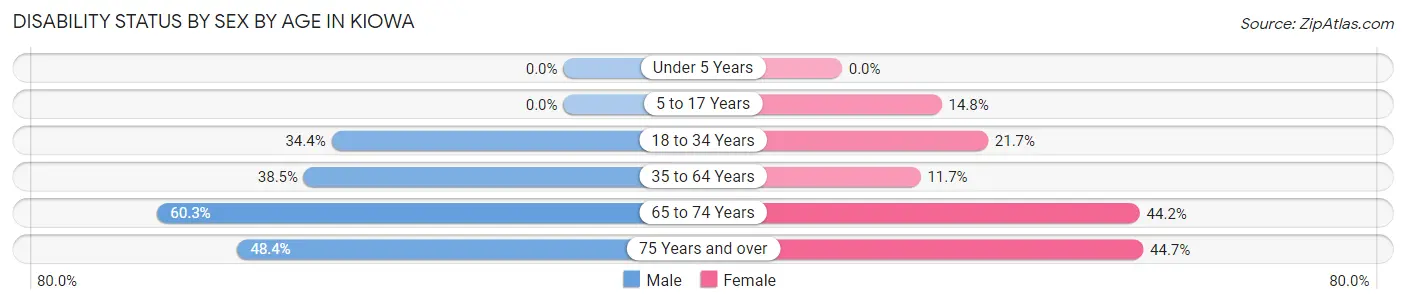
| Age Bracket | Male | Female |
| Under 5 Years | 0 (0.0%) | 0 (0.0%) |
| 5 to 17 Years | 0 (0.0%) | 8 (14.8%) |
| 18 to 34 Years | 21 (34.4%) | 18 (21.7%) |
| 35 to 64 Years | 42 (38.5%) | 16 (11.7%) |
| 65 to 74 Years | 44 (60.3%) | 23 (44.2%) |
| 75 Years and over | 15 (48.4%) | 17 (44.7%) |
Disability Class by Sex by Age in Kiowa
Disability Class: Hearing Difficulty
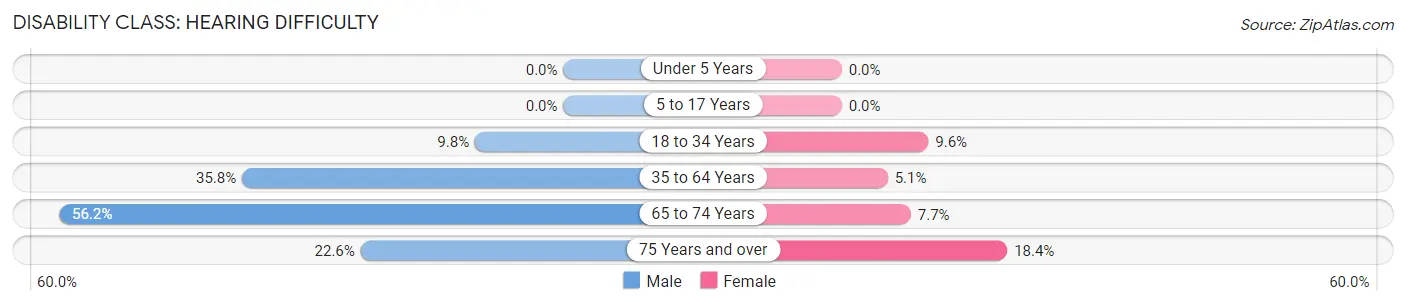
| Age Bracket | Male | Female |
| Under 5 Years | 0 (0.0%) | 0 (0.0%) |
| 5 to 17 Years | 0 (0.0%) | 0 (0.0%) |
| 18 to 34 Years | 6 (9.8%) | 8 (9.6%) |
| 35 to 64 Years | 39 (35.8%) | 7 (5.1%) |
| 65 to 74 Years | 41 (56.2%) | 4 (7.7%) |
| 75 Years and over | 7 (22.6%) | 7 (18.4%) |
Disability Class: Vision Difficulty
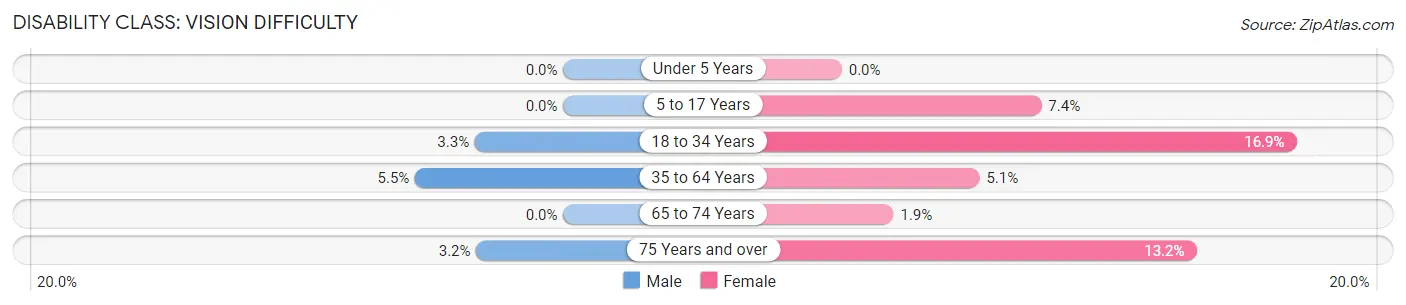
| Age Bracket | Male | Female |
| Under 5 Years | 0 (0.0%) | 0 (0.0%) |
| 5 to 17 Years | 0 (0.0%) | 4 (7.4%) |
| 18 to 34 Years | 2 (3.3%) | 14 (16.9%) |
| 35 to 64 Years | 6 (5.5%) | 7 (5.1%) |
| 65 to 74 Years | 0 (0.0%) | 1 (1.9%) |
| 75 Years and over | 1 (3.2%) | 5 (13.2%) |
Disability Class: Cognitive Difficulty
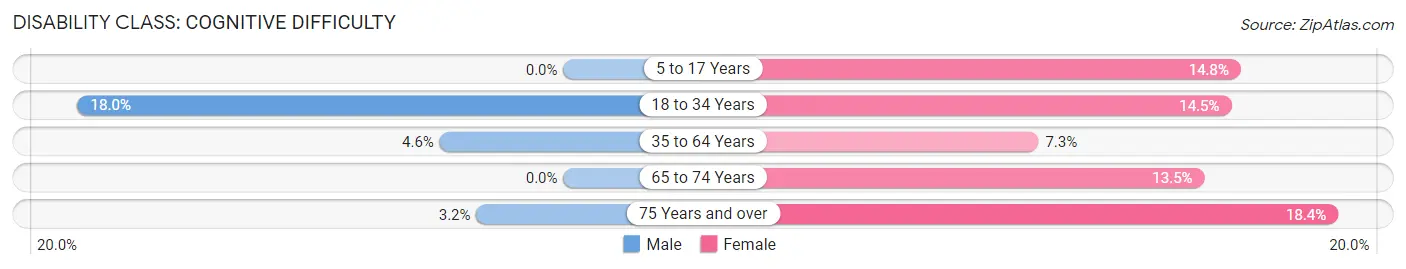
| Age Bracket | Male | Female |
| 5 to 17 Years | 0 (0.0%) | 8 (14.8%) |
| 18 to 34 Years | 11 (18.0%) | 12 (14.5%) |
| 35 to 64 Years | 5 (4.6%) | 10 (7.3%) |
| 65 to 74 Years | 0 (0.0%) | 7 (13.5%) |
| 75 Years and over | 1 (3.2%) | 7 (18.4%) |
Disability Class: Ambulatory Difficulty
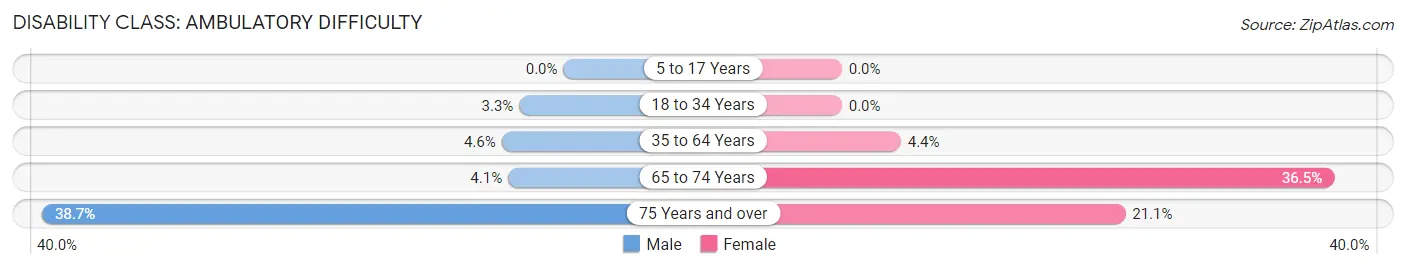
| Age Bracket | Male | Female |
| 5 to 17 Years | 0 (0.0%) | 0 (0.0%) |
| 18 to 34 Years | 2 (3.3%) | 0 (0.0%) |
| 35 to 64 Years | 5 (4.6%) | 6 (4.4%) |
| 65 to 74 Years | 3 (4.1%) | 19 (36.5%) |
| 75 Years and over | 12 (38.7%) | 8 (21.0%) |
Disability Class: Self-Care Difficulty
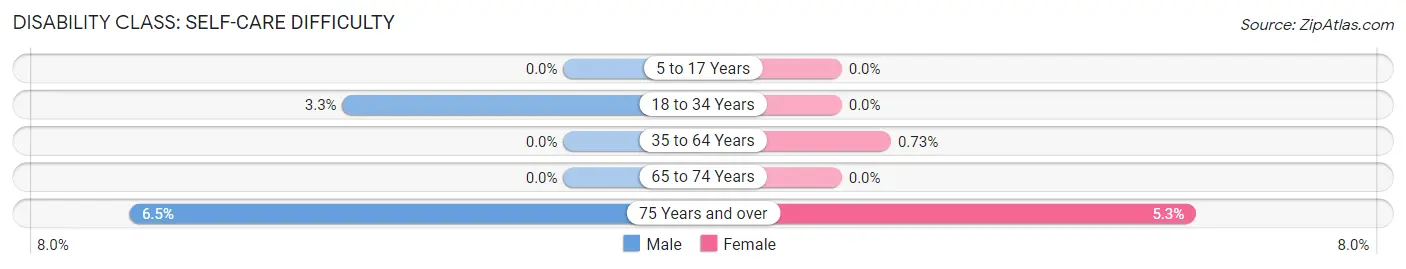
| Age Bracket | Male | Female |
| 5 to 17 Years | 0 (0.0%) | 0 (0.0%) |
| 18 to 34 Years | 2 (3.3%) | 0 (0.0%) |
| 35 to 64 Years | 0 (0.0%) | 1 (0.7%) |
| 65 to 74 Years | 0 (0.0%) | 0 (0.0%) |
| 75 Years and over | 2 (6.5%) | 2 (5.3%) |
Technology Access in Kiowa
Computing Device Access in Kiowa
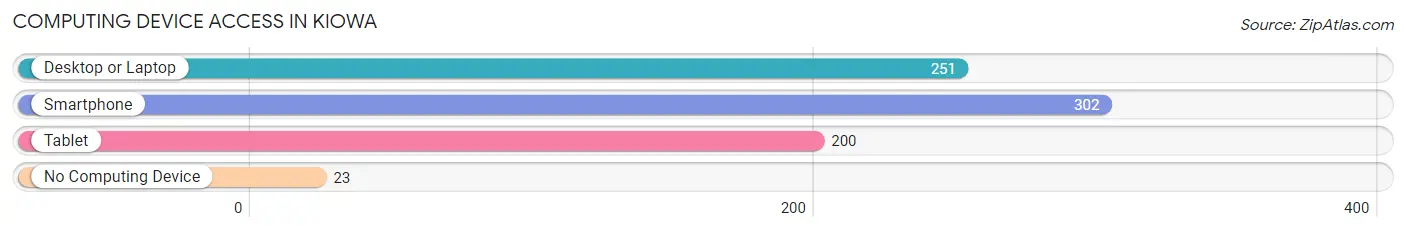
| Device Type | # Households | % Households |
| Desktop or Laptop | 251 | 71.5% |
| Smartphone | 302 | 86.0% |
| Tablet | 200 | 57.0% |
| No Computing Device | 23 | 6.6% |
| Total | 351 | 100.0% |
Internet Access in Kiowa
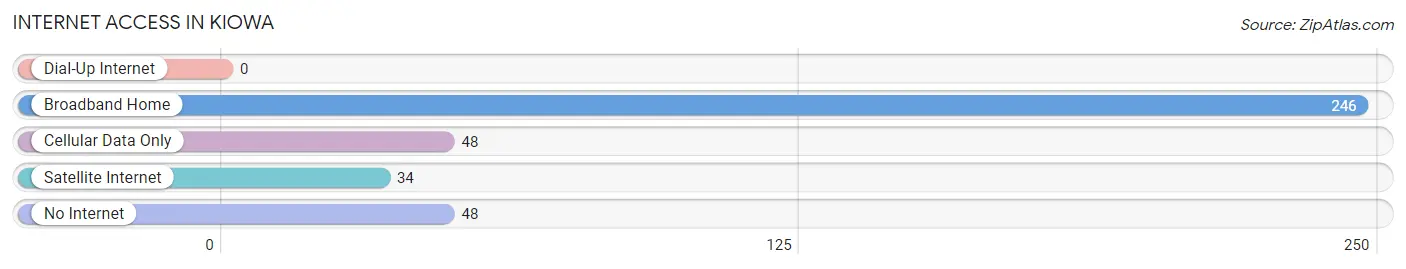
| Internet Type | # Households | % Households |
| Dial-Up Internet | 0 | 0.0% |
| Broadband Home | 246 | 70.1% |
| Cellular Data Only | 48 | 13.7% |
| Satellite Internet | 34 | 9.7% |
| No Internet | 48 | 13.7% |
| Total | 351 | 100.0% |
Kiowa Summary
Kiowa, Kansas is a small town located in the southeastern corner of the state, in Barber County. It is situated on the banks of the Arkansas River, and is surrounded by rolling hills and prairies. The town was founded in 1887, and has a population of approximately 1,000 people.
Kiowa is located in the heart of the Great Plains, and is known for its agricultural heritage. The town is home to a variety of crops, including wheat, corn, and soybeans. The town is also home to a number of livestock, including cattle, sheep, and horses. The town is also home to a variety of businesses, including a grocery store, a hardware store, and a few restaurants.
Kiowa is a small town with a rich history. The town was founded in 1887 by a group of settlers from the nearby town of Medicine Lodge. The settlers were looking for a place to settle and start a new life, and they chose Kiowa because of its fertile soil and abundant water supply. The town was named after the Kiowa tribe, who had lived in the area for centuries.
Kiowa is a small town with a big heart. The town is home to a variety of churches, including the First United Methodist Church, the First Presbyterian Church, and the First Baptist Church. The town also has a variety of civic organizations, including the Kiowa Lions Club, the Kiowa Rotary Club, and the Kiowa Chamber of Commerce.
Kiowa is a small town with a big economy. The town is home to a variety of businesses, including a grocery store, a hardware store, and a few restaurants. The town is also home to a variety of industries, including a lumber mill, a grain elevator, and a feed mill. The town is also home to a variety of services, including a post office, a bank, and a library.
Kiowa is a small town with a diverse population. The town is home to a variety of ethnicities, including Native American, African American, Hispanic, and Asian. The town is also home to a variety of religions, including Christianity, Judaism, and Islam. The town is also home to a variety of ages, including young children, teenagers, and seniors.
Kiowa is a small town with a lot to offer. The town is home to a variety of activities, including fishing, hunting, camping, and hiking. The town is also home to a variety of events, including the Kiowa County Fair, the Kiowa County Rodeo, and the Kiowa County Music Festival. The town is also home to a variety of attractions, including the Kiowa County Museum, the Kiowa County Historical Society, and the Kiowa County Library.
Kiowa is a small town with a lot of potential. The town is home to a variety of businesses, industries, and services, and is home to a diverse population. The town is also home to a variety of activities, events, and attractions. The town is a great place to live, work, and play, and is a great place to call home.
Common Questions
What is Per Capita Income in Kiowa?
Per Capita income in Kiowa is $32,298.
What is the Median Family Income in Kiowa?
Median Family Income in Kiowa is $76,583.
What is the Median Household income in Kiowa?
Median Household Income in Kiowa is $51,806.
What is Income or Wage Gap in Kiowa?
Income or Wage Gap in Kiowa is 49.4%.
Women in Kiowa earn 50.6 cents for every dollar earned by a man.
What is Inequality or Gini Index in Kiowa?
Inequality or Gini Index in Kiowa is 0.43.
What is the Total Population of Kiowa?
Total Population of Kiowa is 785.
What is the Total Male Population of Kiowa?
Total Male Population of Kiowa is 371.
What is the Total Female Population of Kiowa?
Total Female Population of Kiowa is 414.
What is the Ratio of Males per 100 Females in Kiowa?
There are 89.61 Males per 100 Females in Kiowa.
What is the Ratio of Females per 100 Males in Kiowa?
There are 111.59 Females per 100 Males in Kiowa.
What is the Median Population Age in Kiowa?
Median Population Age in Kiowa is 39.8 Years.
What is the Average Family Size in Kiowa
Average Family Size in Kiowa is 2.8 People.
What is the Average Household Size in Kiowa
Average Household Size in Kiowa is 2.2 People.
How Large is the Labor Force in Kiowa?
There are 429 People in the Labor Forcein in Kiowa.
What is the Percentage of People in the Labor Force in Kiowa?
68.6% of People are in the Labor Force in Kiowa.
What is the Unemployment Rate in Kiowa?
Unemployment Rate in Kiowa is 3.3%.