Junction City, KS Map & Demographics
Junction City Map
Junction City Overview
$28,075
PER CAPITA INCOME
$68,362
AVG FAMILY INCOME
$60,709
AVG HOUSEHOLD INCOME
34.2%
WAGE / INCOME GAP [ % ]
65.8¢/ $1
WAGE / INCOME GAP [ $ ]
$10,102
FAMILY INCOME DEFICIT
0.38
INEQUALITY / GINI INDEX
22,738
TOTAL POPULATION
12,078
MALE POPULATION
10,660
FEMALE POPULATION
113.30
MALES / 100 FEMALES
88.26
FEMALES / 100 MALES
28.5
MEDIAN AGE
3.0
AVG FAMILY SIZE
2.5
AVG HOUSEHOLD SIZE
11,964
LABOR FORCE [ PEOPLE ]
71.8%
PERCENT IN LABOR FORCE
4.4%
UNEMPLOYMENT RATE
Junction City Zip Codes
Junction City Area Codes
Income in Junction City
Income Overview in Junction City
Per Capita Income in Junction City is $28,075, while median incomes of families and households are $68,362 and $60,709 respectively.
| Characteristic | Number | Measure |
| Per Capita Income | 22,738 | $28,075 |
| Median Family Income | 5,936 | $68,362 |
| Mean Family Income | 5,936 | $77,293 |
| Median Household Income | 8,969 | $60,709 |
| Mean Household Income | 8,969 | $69,492 |
| Income Deficit | 5,936 | $10,102 |
| Wage / Income Gap (%) | 22,738 | 34.18% |
| Wage / Income Gap ($) | 22,738 | 65.82¢ per $1 |
| Gini / Inequality Index | 22,738 | 0.38 |
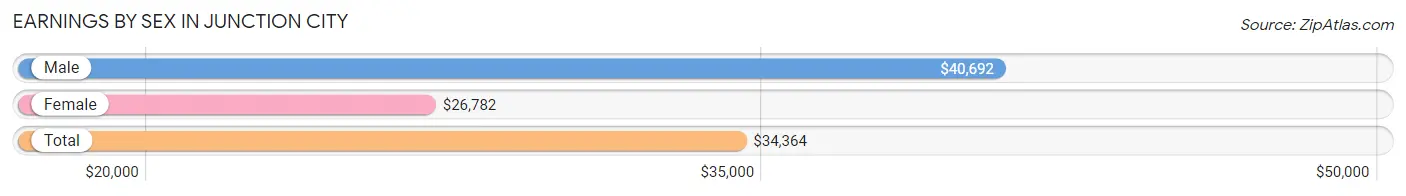
Earnings by Sex in Junction City
Average Earnings in Junction City are $34,364, $40,692 for men and $26,782 for women, a difference of 34.2%.
| Sex | Number | Average Earnings |
| Male | 6,879 (54.8%) | $40,692 |
| Female | 5,677 (45.2%) | $26,782 |
| Total | 12,556 (100.0%) | $34,364 |
Earnings by Sex by Income Bracket in Junction City
The most common earnings brackets in Junction City are $65,000 to $74,999 for men (700 | 10.2%) and $25,000 to $29,999 for women (563 | 9.9%).

| Income | Male | Female |
| $2,499 or less | 145 (2.1%) | 302 (5.3%) |
| $2,500 to $4,999 | 95 (1.4%) | 180 (3.2%) |
| $5,000 to $7,499 | 128 (1.9%) | 208 (3.7%) |
| $7,500 to $9,999 | 213 (3.1%) | 324 (5.7%) |
| $10,000 to $12,499 | 163 (2.4%) | 411 (7.2%) |
| $12,500 to $14,999 | 60 (0.9%) | 188 (3.3%) |
| $15,000 to $17,499 | 178 (2.6%) | 195 (3.4%) |
| $17,500 to $19,999 | 121 (1.8%) | 334 (5.9%) |
| $20,000 to $22,499 | 136 (2.0%) | 354 (6.2%) |
| $22,500 to $24,999 | 188 (2.7%) | 237 (4.2%) |
| $25,000 to $29,999 | 604 (8.8%) | 563 (9.9%) |
| $30,000 to $34,999 | 684 (9.9%) | 427 (7.5%) |
| $35,000 to $39,999 | 634 (9.2%) | 366 (6.5%) |
| $40,000 to $44,999 | 567 (8.2%) | 282 (5.0%) |
| $45,000 to $49,999 | 338 (4.9%) | 211 (3.7%) |
| $50,000 to $54,999 | 468 (6.8%) | 300 (5.3%) |
| $55,000 to $64,999 | 464 (6.8%) | 332 (5.9%) |
| $65,000 to $74,999 | 700 (10.2%) | 76 (1.3%) |
| $75,000 to $99,999 | 528 (7.7%) | 264 (4.6%) |
| $100,000+ | 465 (6.8%) | 123 (2.2%) |
| Total | 6,879 (100.0%) | 5,677 (100.0%) |
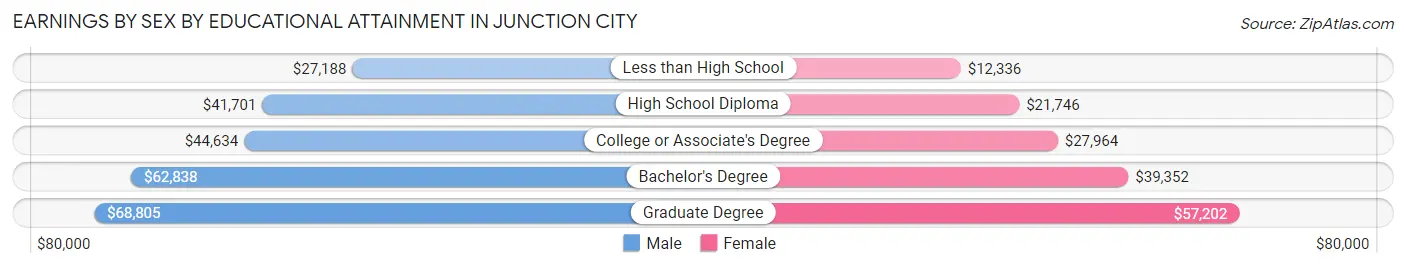
Earnings by Sex by Educational Attainment in Junction City
Average earnings in Junction City are $45,288 for men and $29,165 for women, a difference of 35.6%. Men with an educational attainment of graduate degree enjoy the highest average annual earnings of $68,805, while those with less than high school education earn the least with $27,188. Women with an educational attainment of graduate degree earn the most with the average annual earnings of $57,202, while those with less than high school education have the smallest earnings of $12,336.
| Educational Attainment | Male Income | Female Income |
| Less than High School | $27,188 | $12,336 |
| High School Diploma | $41,701 | $21,746 |
| College or Associate's Degree | $44,634 | $27,964 |
| Bachelor's Degree | $62,838 | $39,352 |
| Graduate Degree | $68,805 | $57,202 |
| Total | $45,288 | $29,165 |
Family Income in Junction City
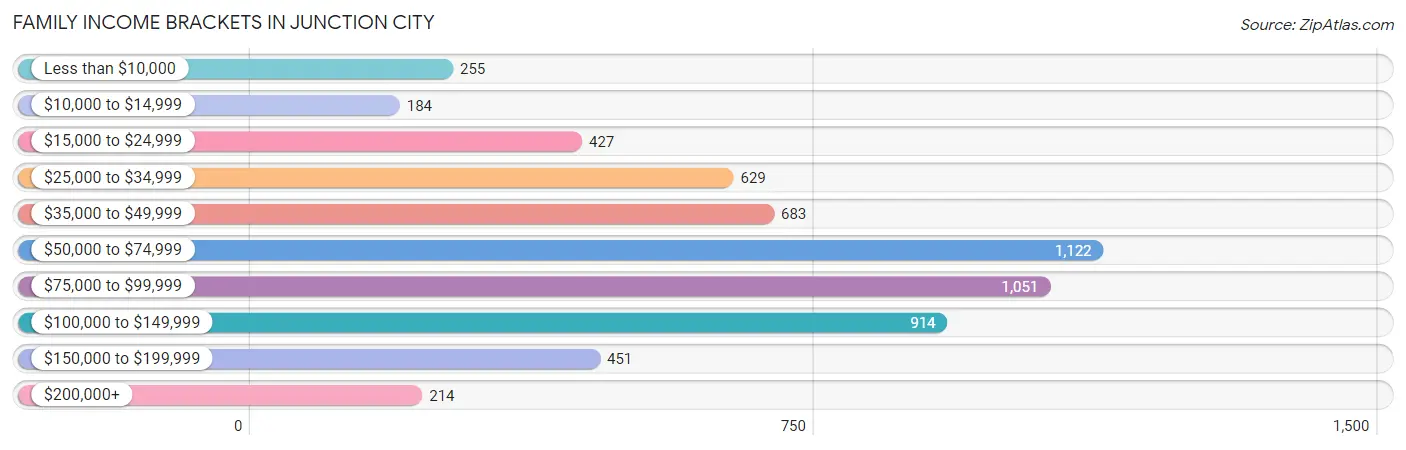
Family Income Brackets in Junction City
According to the Junction City family income data, there are 1,122 families falling into the $50,000 to $74,999 income range, which is the most common income bracket and makes up 18.9% of all families. Conversely, the $10,000 to $14,999 income bracket is the least frequent group with only 184 families (3.1%) belonging to this category.
| Income Bracket | # Families | % Families |
| Less than $10,000 | 255 | 4.3% |
| $10,000 to $14,999 | 184 | 3.1% |
| $15,000 to $24,999 | 427 | 7.2% |
| $25,000 to $34,999 | 629 | 10.6% |
| $35,000 to $49,999 | 683 | 11.5% |
| $50,000 to $74,999 | 1,122 | 18.9% |
| $75,000 to $99,999 | 1,051 | 17.7% |
| $100,000 to $149,999 | 914 | 15.4% |
| $150,000 to $199,999 | 451 | 7.6% |
| $200,000+ | 214 | 3.6% |
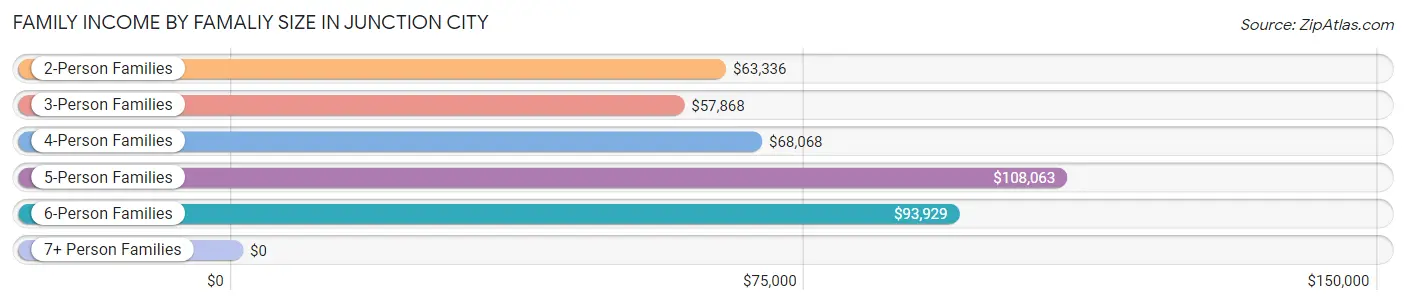
Family Income by Famaliy Size in Junction City
5-person families (637 | 10.7%) account for the highest median family income in Junction City with $108,063 per family, while 2-person families (2,611 | 44.0%) have the highest median income of $31,668 per family member.
| Income Bracket | # Families | Median Income |
| 2-Person Families | 2,611 (44.0%) | $63,336 |
| 3-Person Families | 1,637 (27.6%) | $57,868 |
| 4-Person Families | 874 (14.7%) | $68,068 |
| 5-Person Families | 637 (10.7%) | $108,063 |
| 6-Person Families | 142 (2.4%) | $93,929 |
| 7+ Person Families | 35 (0.6%) | $0 |
| Total | 5,936 (100.0%) | $68,362 |
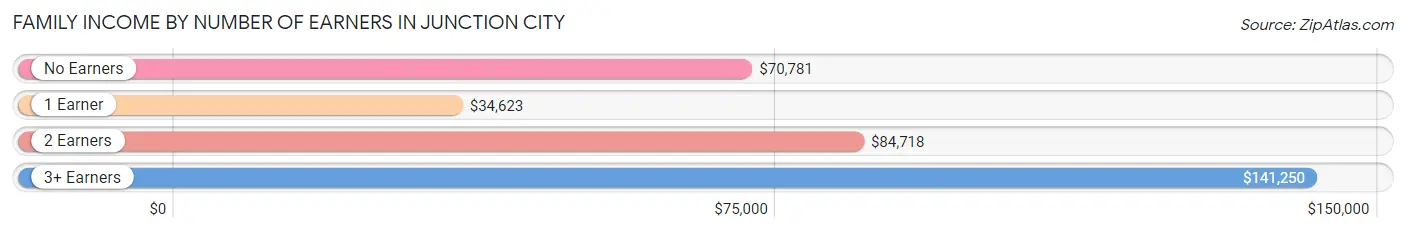
Family Income by Number of Earners in Junction City
The median family income in Junction City is $68,362, with families comprising 3+ earners (560) having the highest median family income of $141,250, while families with 1 earner (2,101) have the lowest median family income of $34,623, accounting for 9.4% and 35.4% of families, respectively.
| Number of Earners | # Families | Median Income |
| No Earners | 687 (11.6%) | $70,781 |
| 1 Earner | 2,101 (35.4%) | $34,623 |
| 2 Earners | 2,588 (43.6%) | $84,718 |
| 3+ Earners | 560 (9.4%) | $141,250 |
| Total | 5,936 (100.0%) | $68,362 |
Household Income in Junction City
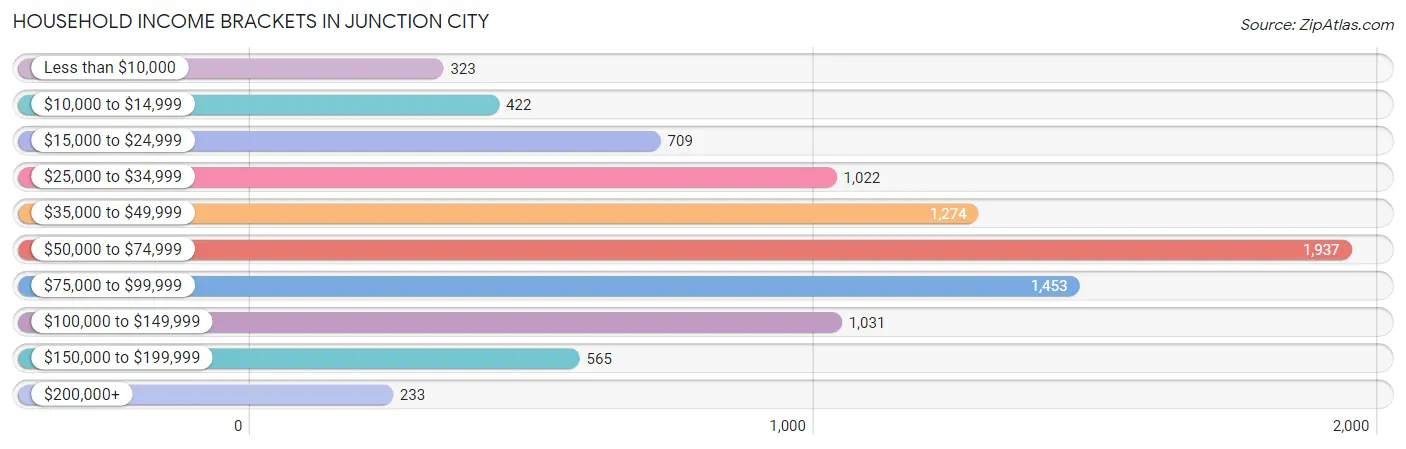
Household Income Brackets in Junction City
With 1,937 households falling in the category, the $50,000 to $74,999 income range is the most frequent in Junction City, accounting for 21.6% of all households. In contrast, only 233 households (2.6%) fall into the $200,000+ income bracket, making it the least populous group.
| Income Bracket | # Households | % Households |
| Less than $10,000 | 323 | 3.6% |
| $10,000 to $14,999 | 422 | 4.7% |
| $15,000 to $24,999 | 709 | 7.9% |
| $25,000 to $34,999 | 1,022 | 11.4% |
| $35,000 to $49,999 | 1,274 | 14.2% |
| $50,000 to $74,999 | 1,937 | 21.6% |
| $75,000 to $99,999 | 1,453 | 16.2% |
| $100,000 to $149,999 | 1,031 | 11.5% |
| $150,000 to $199,999 | 565 | 6.3% |
| $200,000+ | 233 | 2.6% |
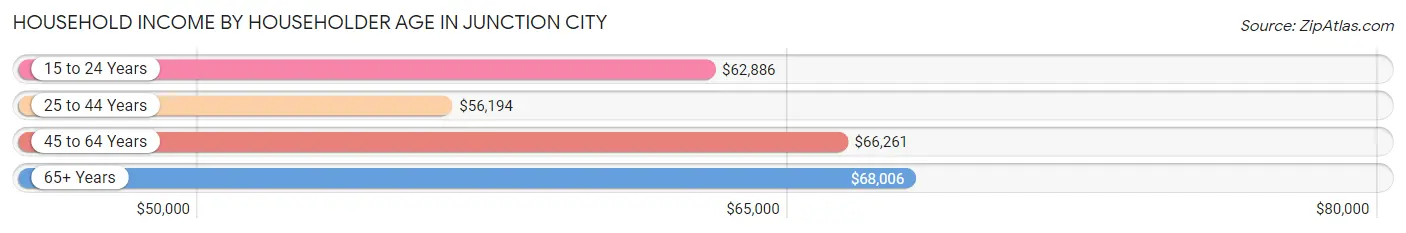
Household Income by Householder Age in Junction City
The median household income in Junction City is $60,709, with the highest median household income of $68,006 found in the 65+ years age bracket for the primary householder. A total of 1,455 households (16.2%) fall into this category. Meanwhile, the 25 to 44 years age bracket for the primary householder has the lowest median household income of $56,194, with 4,112 households (45.9%) in this group.
| Income Bracket | # Households | Median Income |
| 15 to 24 Years | 1,113 (12.4%) | $62,886 |
| 25 to 44 Years | 4,112 (45.9%) | $56,194 |
| 45 to 64 Years | 2,289 (25.5%) | $66,261 |
| 65+ Years | 1,455 (16.2%) | $68,006 |
| Total | 8,969 (100.0%) | $60,709 |
Poverty in Junction City
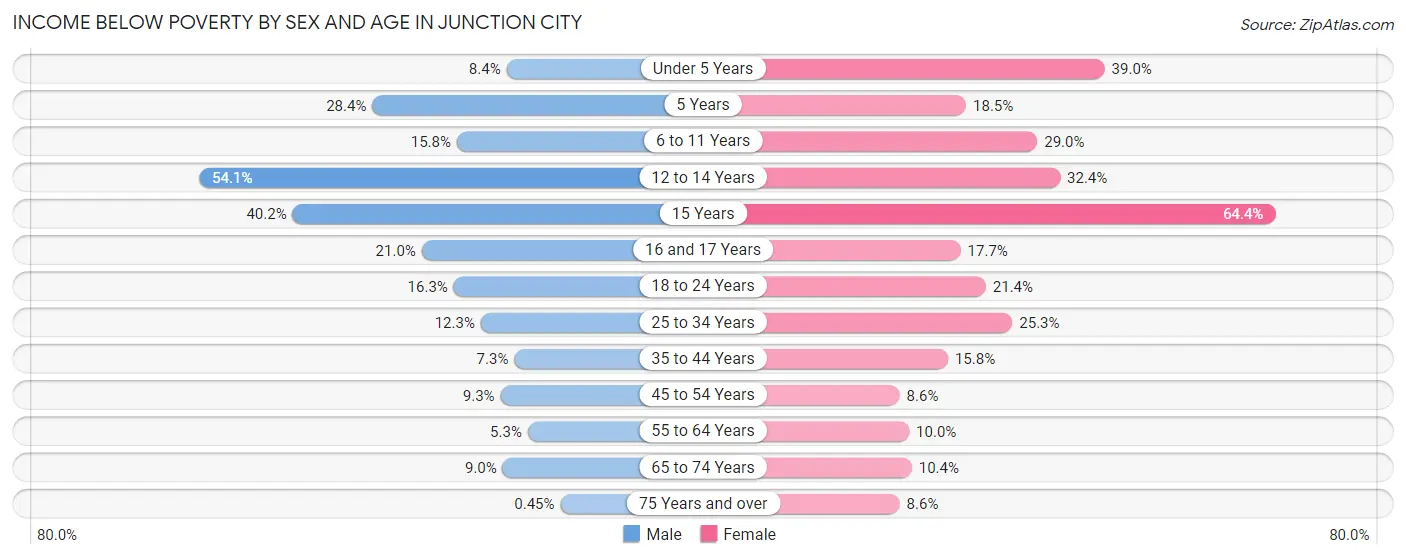
Income Below Poverty by Sex and Age in Junction City
With 14.0% poverty level for males and 21.0% for females among the residents of Junction City, 12 to 14 year old males and 15 year old females are the most vulnerable to poverty, with 285 males (54.1%) and 74 females (64.3%) in their respective age groups living below the poverty level.
| Age Bracket | Male | Female |
| Under 5 Years | 85 (8.4%) | 363 (39.0%) |
| 5 Years | 63 (28.4%) | 60 (18.5%) |
| 6 to 11 Years | 205 (15.8%) | 261 (29.0%) |
| 12 to 14 Years | 285 (54.1%) | 154 (32.4%) |
| 15 Years | 72 (40.2%) | 74 (64.3%) |
| 16 and 17 Years | 65 (21.0%) | 36 (17.6%) |
| 18 to 24 Years | 323 (16.3%) | 247 (21.4%) |
| 25 to 34 Years | 290 (12.3%) | 525 (25.3%) |
| 35 to 44 Years | 98 (7.3%) | 206 (15.8%) |
| 45 to 54 Years | 92 (9.3%) | 83 (8.6%) |
| 55 to 64 Years | 41 (5.3%) | 81 (10.0%) |
| 65 to 74 Years | 45 (9.0%) | 80 (10.4%) |
| 75 Years and over | 2 (0.4%) | 42 (8.6%) |
| Total | 1,666 (14.0%) | 2,212 (21.0%) |
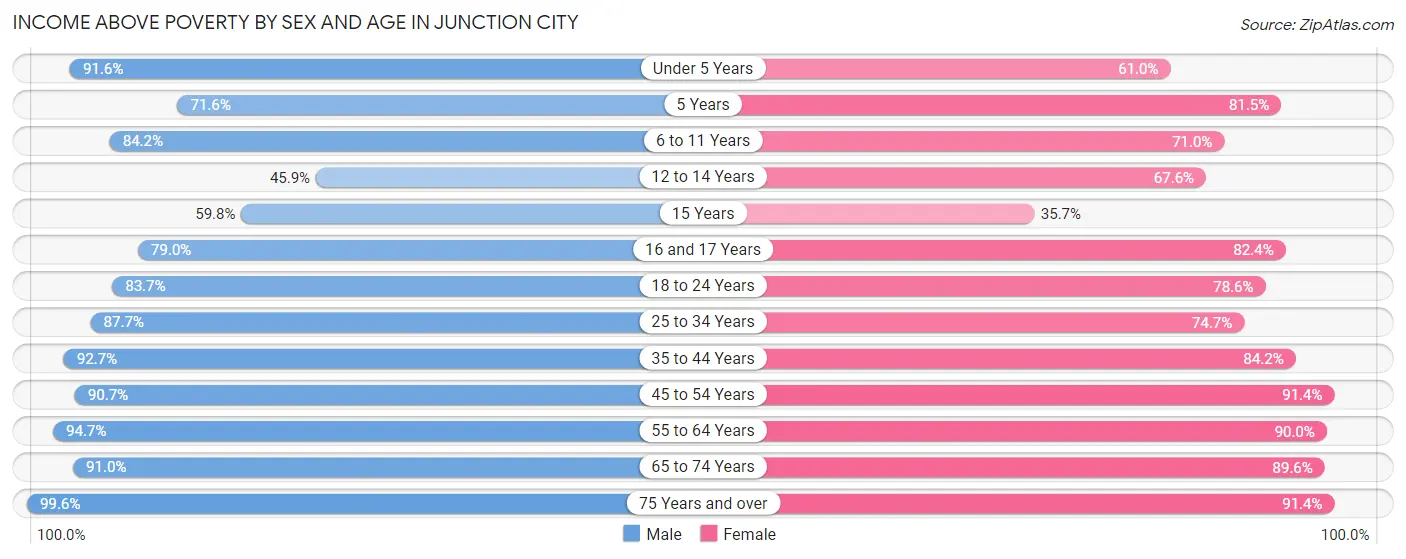
Income Above Poverty by Sex and Age in Junction City
According to the poverty statistics in Junction City, males aged 75 years and over and females aged 45 to 54 years are the age groups that are most secure financially, with 99.6% of males and 91.4% of females in these age groups living above the poverty line.
| Age Bracket | Male | Female |
| Under 5 Years | 922 (91.6%) | 567 (61.0%) |
| 5 Years | 159 (71.6%) | 265 (81.5%) |
| 6 to 11 Years | 1,091 (84.2%) | 638 (71.0%) |
| 12 to 14 Years | 242 (45.9%) | 321 (67.6%) |
| 15 Years | 107 (59.8%) | 41 (35.6%) |
| 16 and 17 Years | 244 (79.0%) | 168 (82.4%) |
| 18 to 24 Years | 1,660 (83.7%) | 908 (78.6%) |
| 25 to 34 Years | 2,073 (87.7%) | 1,548 (74.7%) |
| 35 to 44 Years | 1,246 (92.7%) | 1,100 (84.2%) |
| 45 to 54 Years | 893 (90.7%) | 883 (91.4%) |
| 55 to 64 Years | 734 (94.7%) | 729 (90.0%) |
| 65 to 74 Years | 454 (91.0%) | 690 (89.6%) |
| 75 Years and over | 444 (99.6%) | 447 (91.4%) |
| Total | 10,269 (86.0%) | 8,305 (79.0%) |
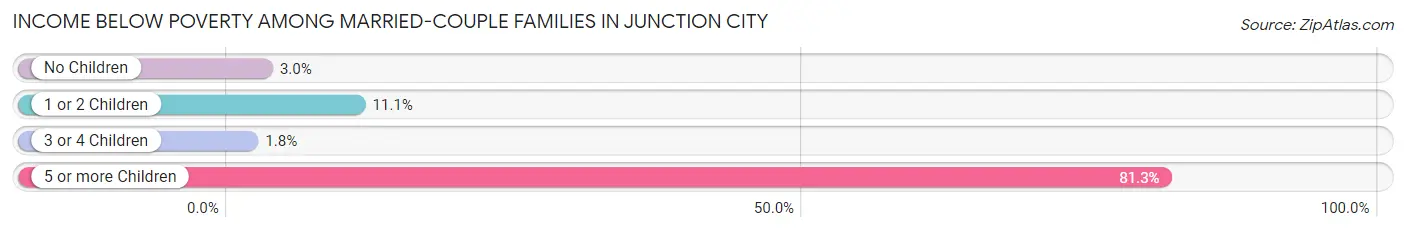
Income Below Poverty Among Married-Couple Families in Junction City
The poverty statistics for married-couple families in Junction City show that 6.3% or 256 of the total 4,062 families live below the poverty line. Families with 5 or more children have the highest poverty rate of 81.2%, comprising of 13 families. On the other hand, families with 3 or 4 children have the lowest poverty rate of 1.8%, which includes 8 families.
| Children | Above Poverty | Below Poverty |
| No Children | 1,975 (97.0%) | 62 (3.0%) |
| 1 or 2 Children | 1,384 (88.9%) | 173 (11.1%) |
| 3 or 4 Children | 444 (98.2%) | 8 (1.8%) |
| 5 or more Children | 3 (18.8%) | 13 (81.2%) |
| Total | 3,806 (93.7%) | 256 (6.3%) |
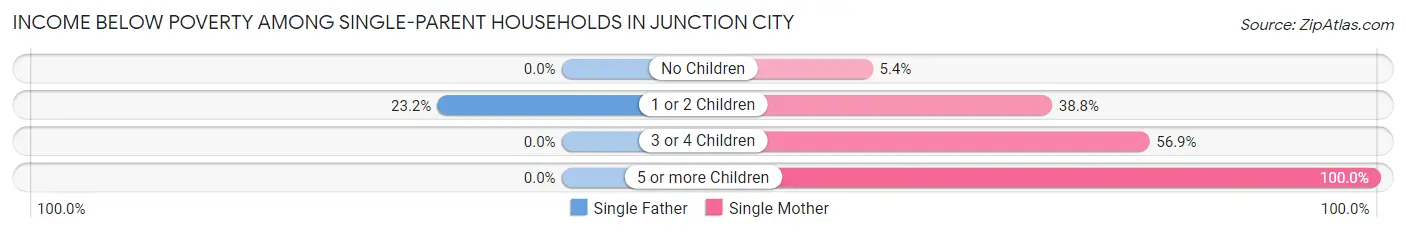
Income Below Poverty Among Single-Parent Households in Junction City
According to the poverty data in Junction City, 19.1% or 73 single-father households and 34.6% or 516 single-mother households are living below the poverty line. Among single-father households, those with 1 or 2 children have the highest poverty rate, with 73 households (23.2%) experiencing poverty. Likewise, among single-mother households, those with 5 or more children have the highest poverty rate, with 9 households (100.0%) falling below the poverty line.
| Children | Single Father | Single Mother |
| No Children | 0 (0.0%) | 13 (5.4%) |
| 1 or 2 Children | 73 (23.2%) | 453 (38.8%) |
| 3 or 4 Children | 0 (0.0%) | 41 (56.9%) |
| 5 or more Children | 0 (0.0%) | 9 (100.0%) |
| Total | 73 (19.1%) | 516 (34.6%) |
Income Below Poverty Among Married-Couple vs Single-Parent Households in Junction City
The poverty data for Junction City shows that 256 of the married-couple family households (6.3%) and 589 of the single-parent households (31.4%) are living below the poverty level. Within the married-couple family households, those with 5 or more children have the highest poverty rate, with 13 households (81.2%) falling below the poverty line. Among the single-parent households, those with 5 or more children have the highest poverty rate, with 9 household (100.0%) living below poverty.
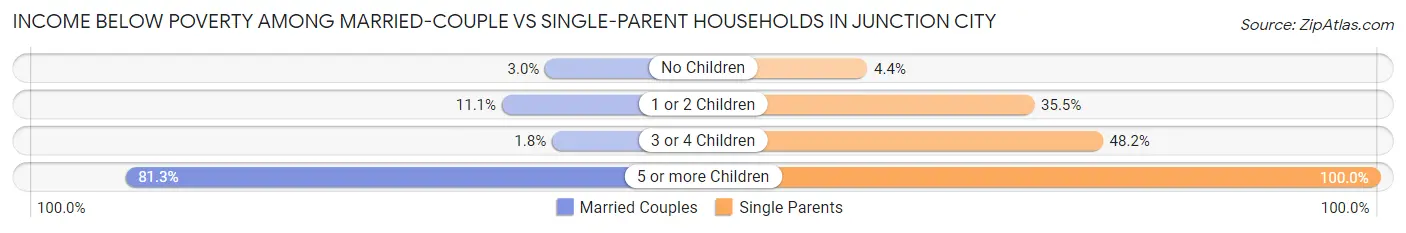
| Children | Married-Couple Families | Single-Parent Households |
| No Children | 62 (3.0%) | 13 (4.4%) |
| 1 or 2 Children | 173 (11.1%) | 526 (35.5%) |
| 3 or 4 Children | 8 (1.8%) | 41 (48.2%) |
| 5 or more Children | 13 (81.2%) | 9 (100.0%) |
| Total | 256 (6.3%) | 589 (31.4%) |
Race in Junction City
The most populous races in Junction City are White / Caucasian (12,990 | 57.1%), Black / African American (4,363 | 19.2%), and Hispanic or Latino (3,945 | 17.3%).
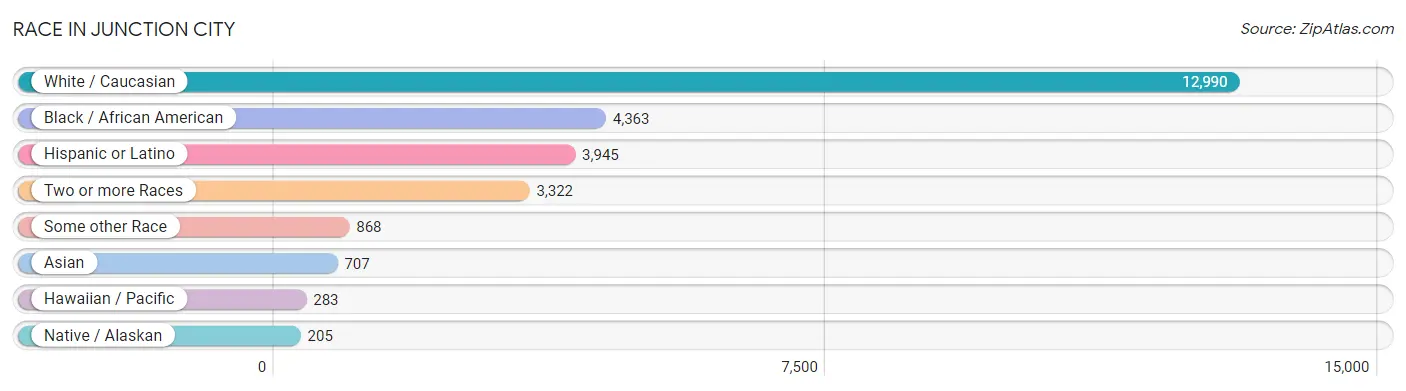
| Race | # Population | % Population |
| Asian | 707 | 3.1% |
| Black / African American | 4,363 | 19.2% |
| Hawaiian / Pacific | 283 | 1.2% |
| Hispanic or Latino | 3,945 | 17.3% |
| Native / Alaskan | 205 | 0.9% |
| White / Caucasian | 12,990 | 57.1% |
| Two or more Races | 3,322 | 14.6% |
| Some other Race | 868 | 3.8% |
| Total | 22,738 | 100.0% |
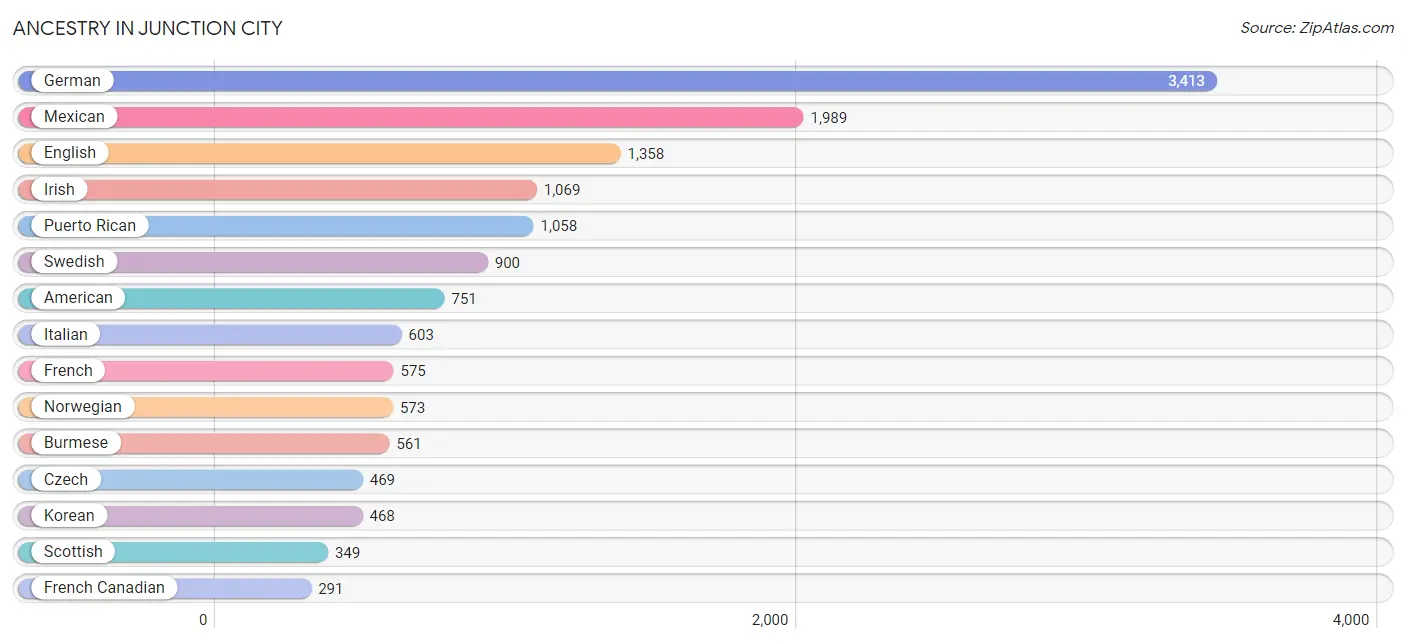
Ancestry in Junction City
The most populous ancestries reported in Junction City are German (3,413 | 15.0%), Mexican (1,989 | 8.7%), English (1,358 | 6.0%), Irish (1,069 | 4.7%), and Puerto Rican (1,058 | 4.6%), together accounting for 39.1% of all Junction City residents.
| Ancestry | # Population | % Population |
| African | 129 | 0.6% |
| Alaska Native | 10 | 0.0% |
| American | 751 | 3.3% |
| Apache | 19 | 0.1% |
| Arab | 48 | 0.2% |
| Argentinean | 15 | 0.1% |
| Austrian | 178 | 0.8% |
| Belgian | 42 | 0.2% |
| Bhutanese | 207 | 0.9% |
| Blackfeet | 34 | 0.2% |
| Bolivian | 43 | 0.2% |
| British | 132 | 0.6% |
| British West Indian | 13 | 0.1% |
| Burmese | 561 | 2.5% |
| Canadian | 21 | 0.1% |
| Central American | 239 | 1.1% |
| Cherokee | 134 | 0.6% |
| Chilean | 46 | 0.2% |
| Chinese | 7 | 0.0% |
| Choctaw | 13 | 0.1% |
| Colombian | 10 | 0.0% |
| Costa Rican | 11 | 0.1% |
| Croatian | 31 | 0.1% |
| Czech | 469 | 2.1% |
| Danish | 102 | 0.4% |
| Dominican | 93 | 0.4% |
| Dutch | 111 | 0.5% |
| English | 1,358 | 6.0% |
| Estonian | 13 | 0.1% |
| Ethiopian | 50 | 0.2% |
| European | 263 | 1.2% |
| Finnish | 12 | 0.1% |
| French | 575 | 2.5% |
| French Canadian | 291 | 1.3% |
| German | 3,413 | 15.0% |
| German Russian | 35 | 0.2% |
| Ghanaian | 27 | 0.1% |
| Guamanian / Chamorro | 137 | 0.6% |
| Guatemalan | 54 | 0.2% |
| Honduran | 17 | 0.1% |
| Hungarian | 39 | 0.2% |
| Indian (Asian) | 83 | 0.4% |
| Indonesian | 1 | 0.0% |
| Irish | 1,069 | 4.7% |
| Italian | 603 | 2.6% |
| Jamaican | 69 | 0.3% |
| Korean | 468 | 2.1% |
| Lebanese | 10 | 0.0% |
| Lithuanian | 37 | 0.2% |
| Mexican | 1,989 | 8.7% |
| Mexican American Indian | 27 | 0.1% |
| Moroccan | 34 | 0.2% |
| Native Hawaiian | 67 | 0.3% |
| Navajo | 93 | 0.4% |
| Nigerian | 9 | 0.0% |
| Northern European | 12 | 0.1% |
| Norwegian | 573 | 2.5% |
| Pakistani | 80 | 0.4% |
| Panamanian | 107 | 0.5% |
| Pennsylvania German | 10 | 0.0% |
| Polish | 131 | 0.6% |
| Portuguese | 38 | 0.2% |
| Potawatomi | 81 | 0.4% |
| Puerto Rican | 1,058 | 4.6% |
| Romanian | 17 | 0.1% |
| Russian | 75 | 0.3% |
| Salvadoran | 50 | 0.2% |
| Samoan | 9 | 0.0% |
| Scandinavian | 131 | 0.6% |
| Scotch-Irish | 102 | 0.4% |
| Scottish | 349 | 1.5% |
| Sioux | 4 | 0.0% |
| Slavic | 12 | 0.1% |
| South American | 117 | 0.5% |
| Spaniard | 103 | 0.4% |
| Spanish | 59 | 0.3% |
| Sri Lankan | 61 | 0.3% |
| Subsaharan African | 215 | 0.9% |
| Swedish | 900 | 4.0% |
| Swiss | 30 | 0.1% |
| Thai | 13 | 0.1% |
| Tohono O'Odham | 5 | 0.0% |
| Venezuelan | 3 | 0.0% |
| Welsh | 28 | 0.1% |
| West Indian | 228 | 1.0% | View All 85 Rows |
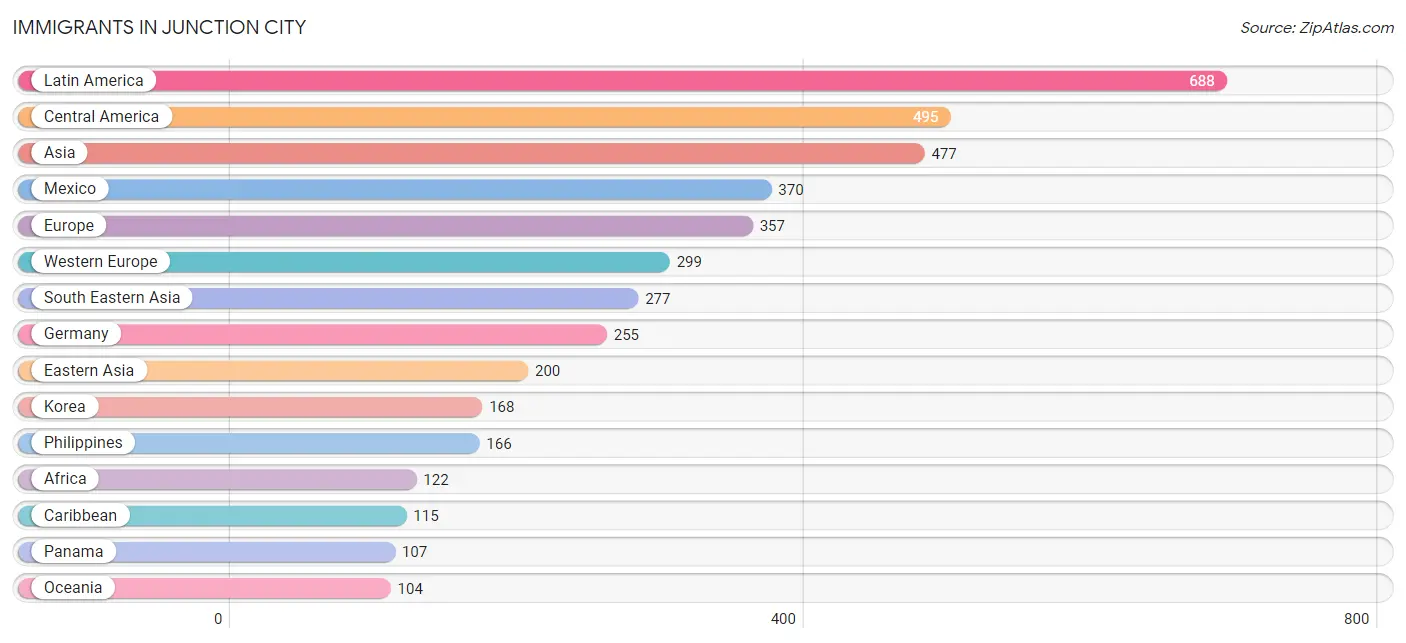
Immigrants in Junction City
The most numerous immigrant groups reported in Junction City came from Latin America (688 | 3.0%), Central America (495 | 2.2%), Asia (477 | 2.1%), Mexico (370 | 1.6%), and Europe (357 | 1.6%), together accounting for 10.5% of all Junction City residents.
| Immigration Origin | # Population | % Population |
| Africa | 122 | 0.5% |
| Argentina | 15 | 0.1% |
| Asia | 477 | 2.1% |
| Australia | 14 | 0.1% |
| Austria | 13 | 0.1% |
| Belgium | 31 | 0.1% |
| Bolivia | 14 | 0.1% |
| Caribbean | 115 | 0.5% |
| Central America | 495 | 2.2% |
| Chile | 46 | 0.2% |
| Dominican Republic | 57 | 0.3% |
| Eastern Africa | 29 | 0.1% |
| Eastern Asia | 200 | 0.9% |
| Eastern Europe | 58 | 0.3% |
| Ethiopia | 21 | 0.1% |
| Europe | 357 | 1.6% |
| Germany | 255 | 1.1% |
| Ghana | 61 | 0.3% |
| Guatemala | 18 | 0.1% |
| Jamaica | 45 | 0.2% |
| Japan | 32 | 0.1% |
| Kenya | 8 | 0.0% |
| Korea | 168 | 0.7% |
| Latin America | 688 | 3.0% |
| Mexico | 370 | 1.6% |
| Nigeria | 9 | 0.0% |
| Oceania | 104 | 0.5% |
| Panama | 107 | 0.5% |
| Philippines | 166 | 0.7% |
| Romania | 17 | 0.1% |
| Russia | 20 | 0.1% |
| South America | 78 | 0.3% |
| South Eastern Asia | 277 | 1.2% |
| Thailand | 57 | 0.3% |
| Ukraine | 21 | 0.1% |
| Venezuela | 3 | 0.0% |
| Vietnam | 54 | 0.2% |
| Western Africa | 70 | 0.3% |
| Western Europe | 299 | 1.3% | View All 39 Rows |
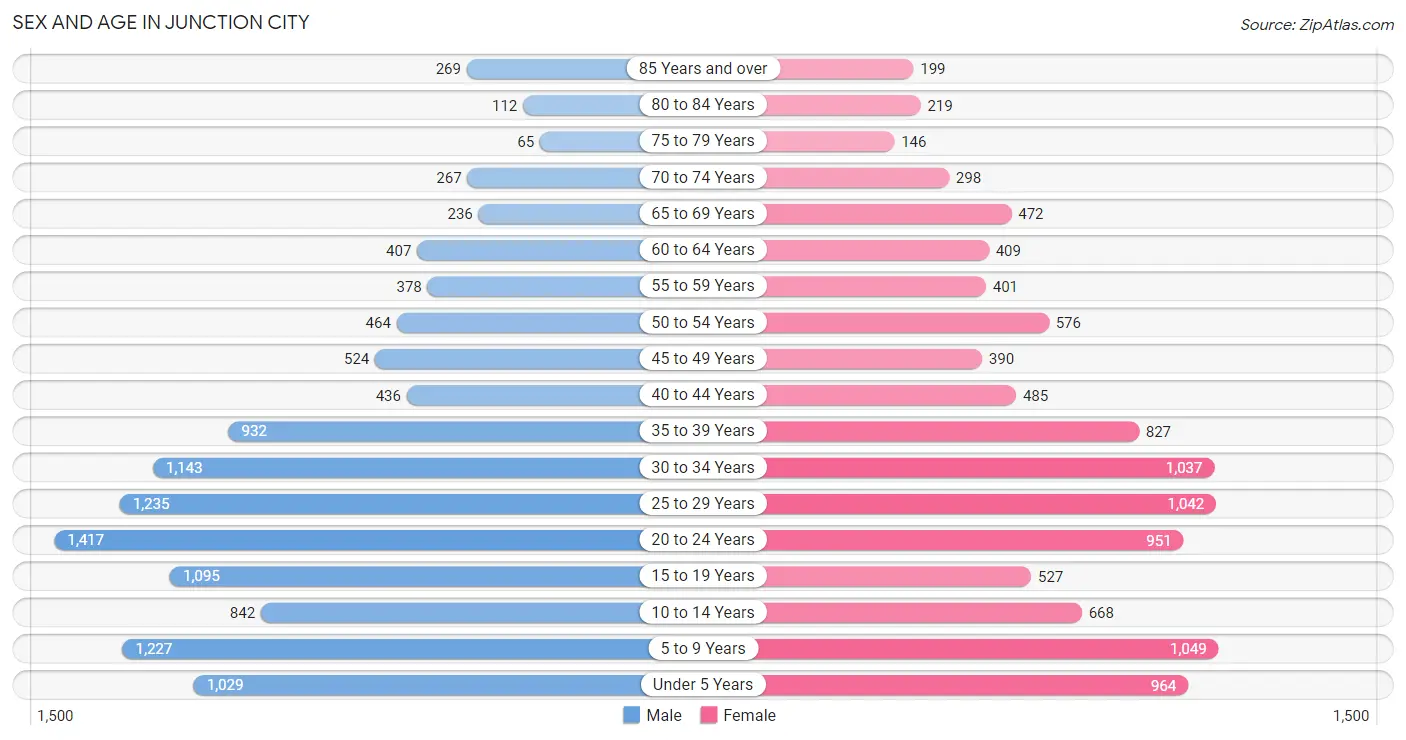
Sex and Age in Junction City
Sex and Age in Junction City
The most populous age groups in Junction City are 20 to 24 Years (1,417 | 11.7%) for men and 5 to 9 Years (1,049 | 9.8%) for women.
| Age Bracket | Male | Female |
| Under 5 Years | 1,029 (8.5%) | 964 (9.0%) |
| 5 to 9 Years | 1,227 (10.2%) | 1,049 (9.8%) |
| 10 to 14 Years | 842 (7.0%) | 668 (6.3%) |
| 15 to 19 Years | 1,095 (9.1%) | 527 (4.9%) |
| 20 to 24 Years | 1,417 (11.7%) | 951 (8.9%) |
| 25 to 29 Years | 1,235 (10.2%) | 1,042 (9.8%) |
| 30 to 34 Years | 1,143 (9.5%) | 1,037 (9.7%) |
| 35 to 39 Years | 932 (7.7%) | 827 (7.8%) |
| 40 to 44 Years | 436 (3.6%) | 485 (4.5%) |
| 45 to 49 Years | 524 (4.3%) | 390 (3.7%) |
| 50 to 54 Years | 464 (3.8%) | 576 (5.4%) |
| 55 to 59 Years | 378 (3.1%) | 401 (3.8%) |
| 60 to 64 Years | 407 (3.4%) | 409 (3.8%) |
| 65 to 69 Years | 236 (1.9%) | 472 (4.4%) |
| 70 to 74 Years | 267 (2.2%) | 298 (2.8%) |
| 75 to 79 Years | 65 (0.5%) | 146 (1.4%) |
| 80 to 84 Years | 112 (0.9%) | 219 (2.1%) |
| 85 Years and over | 269 (2.2%) | 199 (1.9%) |
| Total | 12,078 (100.0%) | 10,660 (100.0%) |
Families and Households in Junction City
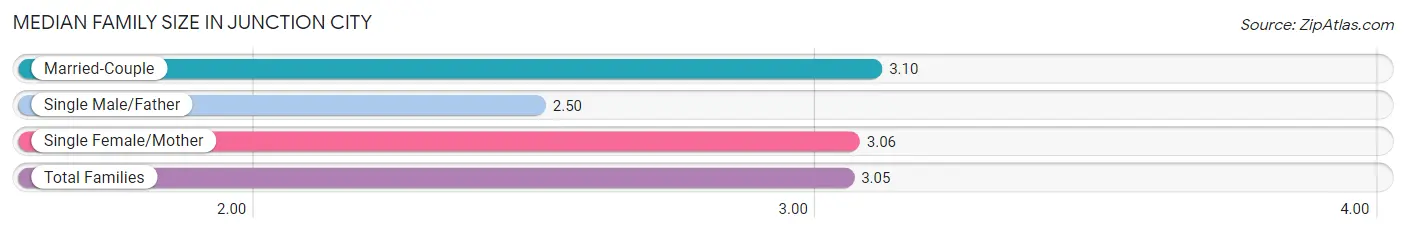
Median Family Size in Junction City
The median family size in Junction City is 3.05 persons per family, with married-couple families (4,062 | 68.4%) accounting for the largest median family size of 3.1 persons per family. On the other hand, single male/father families (383 | 6.5%) represent the smallest median family size with 2.50 persons per family.
| Family Type | # Families | Family Size |
| Married-Couple | 4,062 (68.4%) | 3.10 |
| Single Male/Father | 383 (6.5%) | 2.50 |
| Single Female/Mother | 1,491 (25.1%) | 3.06 |
| Total Families | 5,936 (100.0%) | 3.05 |
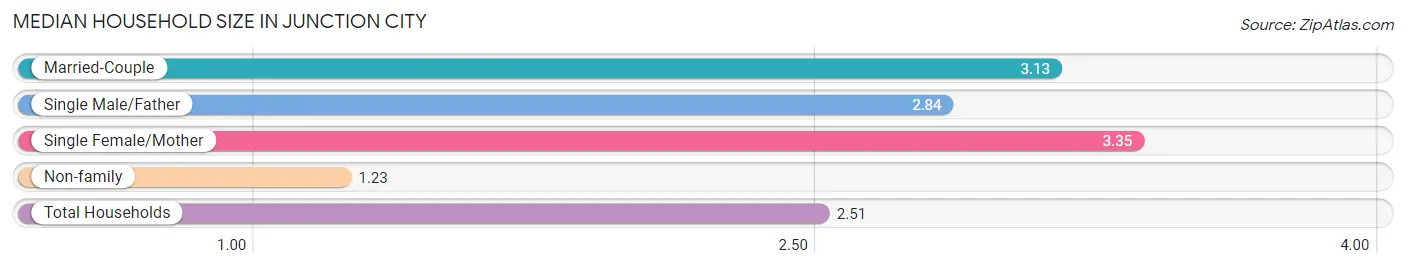
Median Household Size in Junction City
The median household size in Junction City is 2.51 persons per household, with single female/mother households (1,491 | 16.6%) accounting for the largest median household size of 3.35 persons per household. non-family households (3,033 | 33.8%) represent the smallest median household size with 1.23 persons per household.
| Household Type | # Households | Household Size |
| Married-Couple | 4,062 (45.3%) | 3.13 |
| Single Male/Father | 383 (4.3%) | 2.84 |
| Single Female/Mother | 1,491 (16.6%) | 3.35 |
| Non-family | 3,033 (33.8%) | 1.23 |
| Total Households | 8,969 (100.0%) | 2.51 |
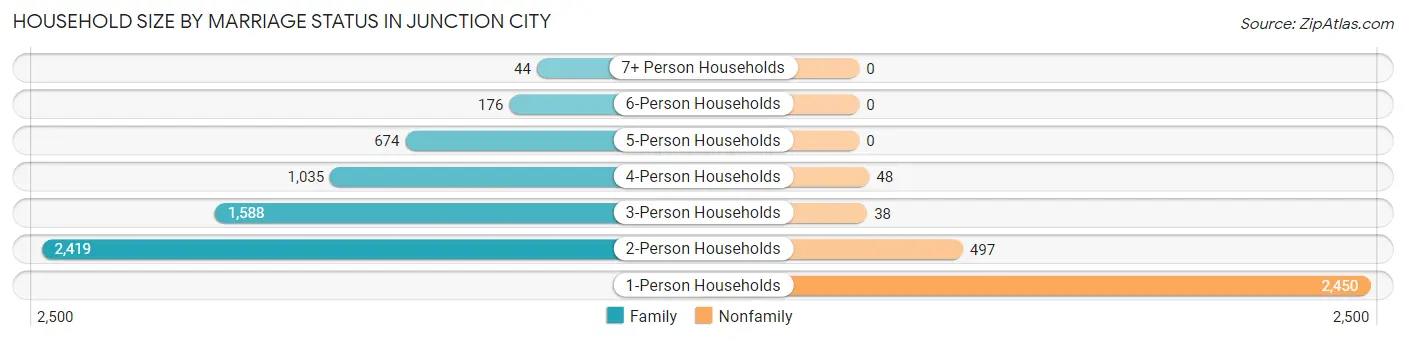
Household Size by Marriage Status in Junction City
Out of a total of 8,969 households in Junction City, 5,936 (66.2%) are family households, while 3,033 (33.8%) are nonfamily households. The most numerous type of family households are 2-person households, comprising 2,419, and the most common type of nonfamily households are 1-person households, comprising 2,450.
| Household Size | Family Households | Nonfamily Households |
| 1-Person Households | - | 2,450 (27.3%) |
| 2-Person Households | 2,419 (27.0%) | 497 (5.5%) |
| 3-Person Households | 1,588 (17.7%) | 38 (0.4%) |
| 4-Person Households | 1,035 (11.5%) | 48 (0.5%) |
| 5-Person Households | 674 (7.5%) | 0 (0.0%) |
| 6-Person Households | 176 (2.0%) | 0 (0.0%) |
| 7+ Person Households | 44 (0.5%) | 0 (0.0%) |
| Total | 5,936 (66.2%) | 3,033 (33.8%) |
Female Fertility in Junction City
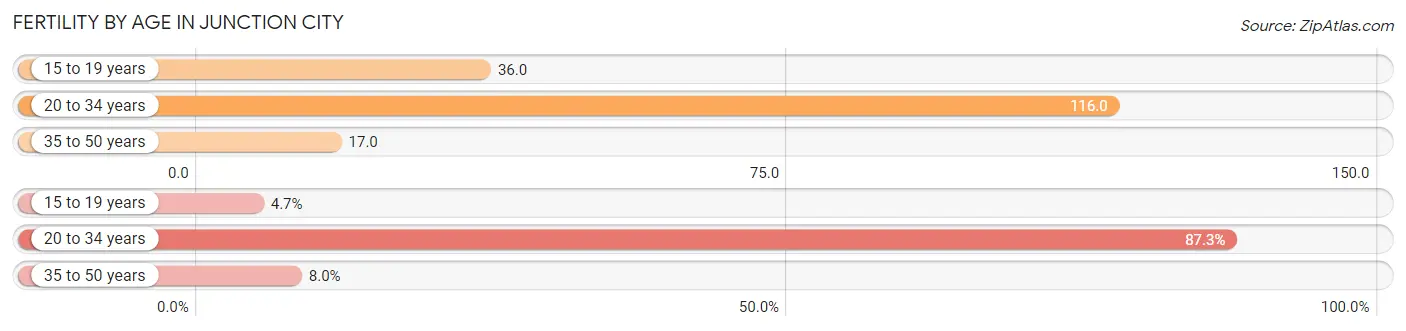
Fertility by Age in Junction City
Average fertility rate in Junction City is 74.0 births per 1,000 women. Women in the age bracket of 20 to 34 years have the highest fertility rate with 116.0 births per 1,000 women. Women in the age bracket of 20 to 34 years acount for 87.3% of all women with births.
| Age Bracket | Women with Births | Births / 1,000 Women |
| 15 to 19 years | 19 (4.7%) | 36.0 |
| 20 to 34 years | 351 (87.3%) | 116.0 |
| 35 to 50 years | 32 (8.0%) | 17.0 |
| Total | 402 (100.0%) | 74.0 |
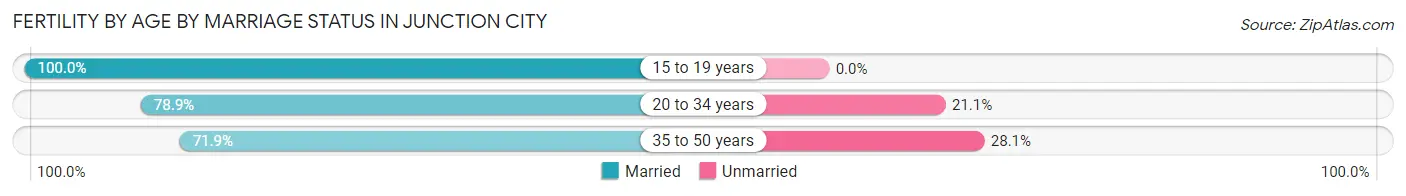
Fertility by Age by Marriage Status in Junction City
79.4% of women with births (402) in Junction City are married. The highest percentage of unmarried women with births falls into 35 to 50 years age bracket with 28.1% of them unmarried at the time of birth, while the lowest percentage of unmarried women with births belong to 15 to 19 years age bracket with 0.0% of them unmarried.
| Age Bracket | Married | Unmarried |
| 15 to 19 years | 19 (100.0%) | 0 (0.0%) |
| 20 to 34 years | 277 (78.9%) | 74 (21.1%) |
| 35 to 50 years | 23 (71.9%) | 9 (28.1%) |
| Total | 319 (79.3%) | 83 (20.6%) |
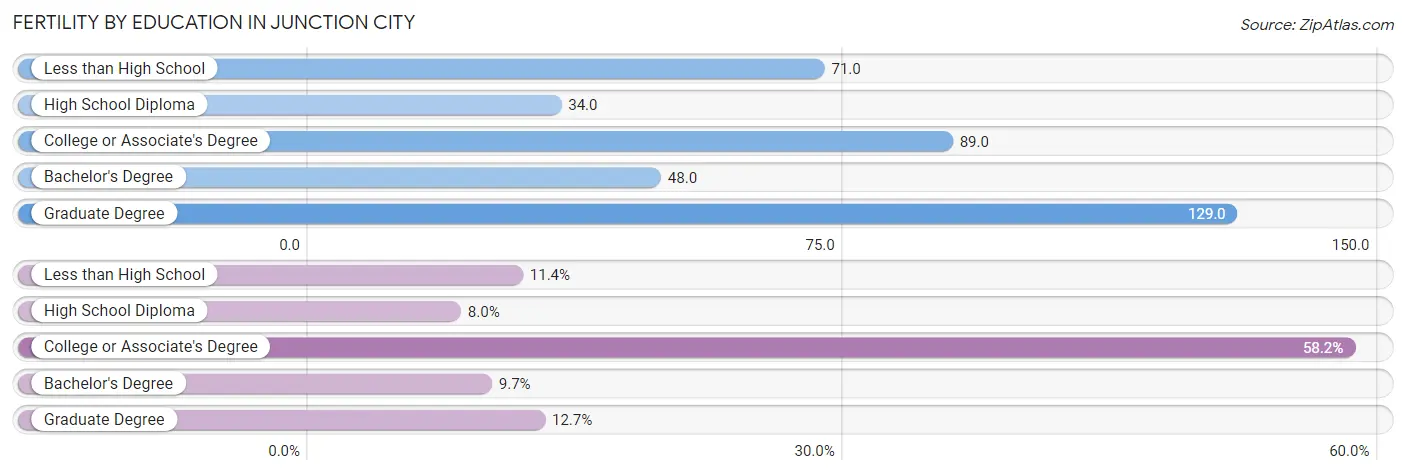
Fertility by Education in Junction City
Average fertility rate in Junction City is 74.0 births per 1,000 women. Women with the education attainment of graduate degree have the highest fertility rate of 129.0 births per 1,000 women, while women with the education attainment of high school diploma have the lowest fertility at 34.0 births per 1,000 women. Women with the education attainment of college or associate's degree represent 58.2% of all women with births.
| Educational Attainment | Women with Births | Births / 1,000 Women |
| Less than High School | 46 (11.4%) | 71.0 |
| High School Diploma | 32 (8.0%) | 34.0 |
| College or Associate's Degree | 234 (58.2%) | 89.0 |
| Bachelor's Degree | 39 (9.7%) | 48.0 |
| Graduate Degree | 51 (12.7%) | 129.0 |
| Total | 402 (100.0%) | 74.0 |
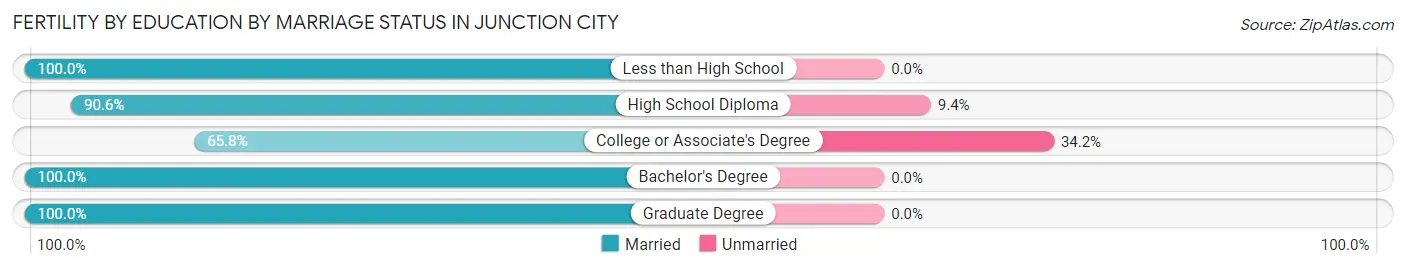
Fertility by Education by Marriage Status in Junction City
20.6% of women with births in Junction City are unmarried. Women with the educational attainment of less than high school are most likely to be married with 100.0% of them married at childbirth, while women with the educational attainment of college or associate's degree are least likely to be married with 34.2% of them unmarried at childbirth.
| Educational Attainment | Married | Unmarried |
| Less than High School | 46 (100.0%) | 0 (0.0%) |
| High School Diploma | 29 (90.6%) | 3 (9.4%) |
| College or Associate's Degree | 154 (65.8%) | 80 (34.2%) |
| Bachelor's Degree | 39 (100.0%) | 0 (0.0%) |
| Graduate Degree | 51 (100.0%) | 0 (0.0%) |
| Total | 319 (79.3%) | 83 (20.6%) |
Employment Characteristics in Junction City
Employment by Class of Employer in Junction City
Among the 11,367 employed individuals in Junction City, private company employees (5,981 | 52.6%), federal government employees (3,008 | 26.5%), and local government employees (955 | 8.4%) make up the most common classes of employment.
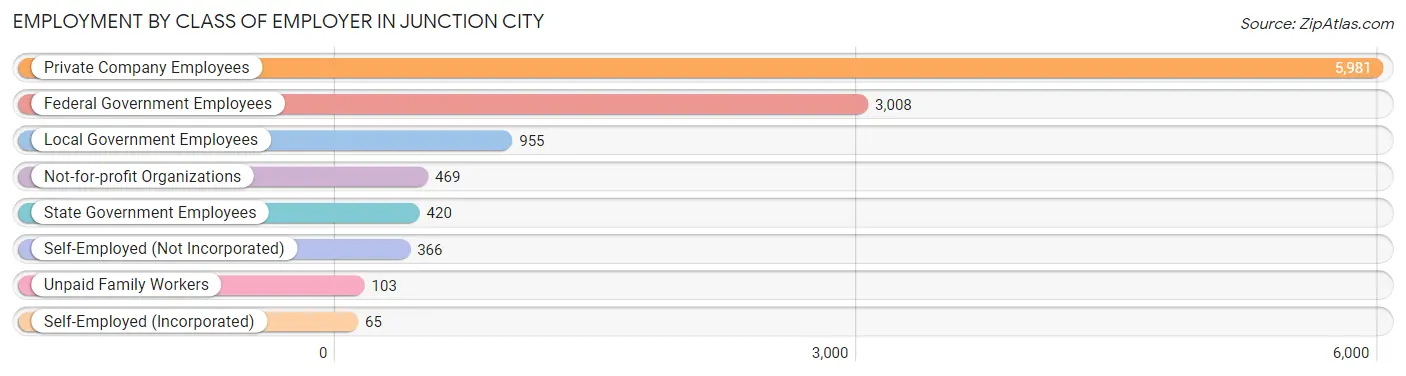
| Employer Class | # Employees | % Employees |
| Private Company Employees | 5,981 | 52.6% |
| Self-Employed (Incorporated) | 65 | 0.6% |
| Self-Employed (Not Incorporated) | 366 | 3.2% |
| Not-for-profit Organizations | 469 | 4.1% |
| Local Government Employees | 955 | 8.4% |
| State Government Employees | 420 | 3.7% |
| Federal Government Employees | 3,008 | 26.5% |
| Unpaid Family Workers | 103 | 0.9% |
| Total | 11,367 | 100.0% |
Employment Status by Age in Junction City
According to the labor force statistics for Junction City, out of the total population over 16 years of age (16,663), 71.8% or 11,964 individuals are in the labor force, with 4.4% or 526 of them unemployed. The age group with the highest labor force participation rate is 20 to 24 years, with 92.2% or 2,183 individuals in the labor force. Within the labor force, the 20 to 24 years age range has the highest percentage of unemployed individuals, with 10.3% or 225 of them being unemployed.
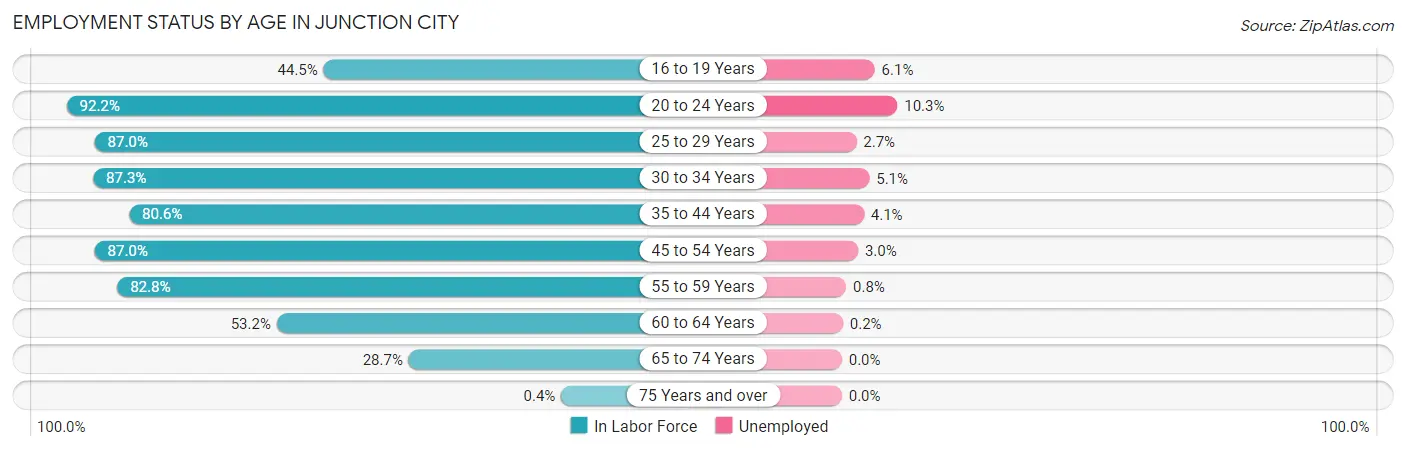
| Age Bracket | In Labor Force | Unemployed |
| 16 to 19 Years | 590 (44.5%) | 36 (6.1%) |
| 20 to 24 Years | 2,183 (92.2%) | 225 (10.3%) |
| 25 to 29 Years | 1,981 (87.0%) | 53 (2.7%) |
| 30 to 34 Years | 1,903 (87.3%) | 97 (5.1%) |
| 35 to 44 Years | 2,160 (80.6%) | 89 (4.1%) |
| 45 to 54 Years | 1,700 (87.0%) | 51 (3.0%) |
| 55 to 59 Years | 645 (82.8%) | 5 (0.8%) |
| 60 to 64 Years | 434 (53.2%) | 1 (0.2%) |
| 65 to 74 Years | 365 (28.7%) | 0 (0.0%) |
| 75 Years and over | 4 (0.4%) | 0 (0.0%) |
| Total | 11,964 (71.8%) | 526 (4.4%) |
Employment Status by Educational Attainment in Junction City
According to labor force statistics for Junction City, 82.6% of individuals (8,827) out of the total population between 25 and 64 years of age (10,686) are in the labor force, with 3.3% or 291 of them being unemployed. The group with the highest labor force participation rate are those with the educational attainment of bachelor's degree or higher, with 87.2% or 2,286 individuals in the labor force. Within the labor force, individuals with college / associate degree education have the highest percentage of unemployment, with 5.3% or 209 of them being unemployed.
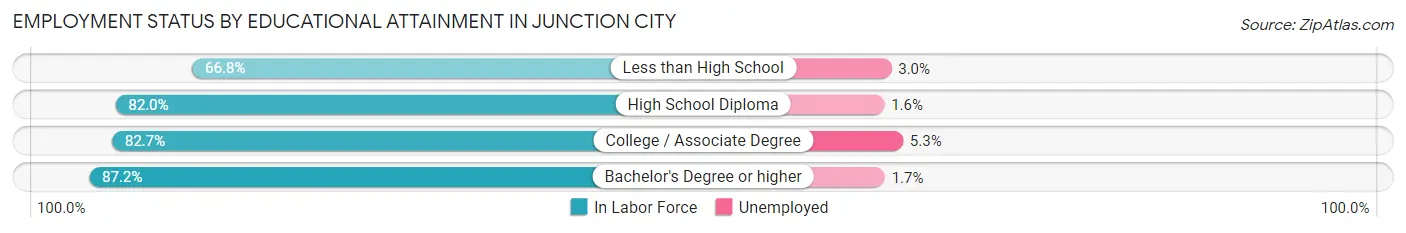
| Educational Attainment | In Labor Force | Unemployed |
| Less than High School | 482 (66.8%) | 22 (3.0%) |
| High School Diploma | 2,108 (82.0%) | 41 (1.6%) |
| College / Associate Degree | 3,946 (82.7%) | 253 (5.3%) |
| Bachelor's Degree or higher | 2,286 (87.2%) | 45 (1.7%) |
| Total | 8,827 (82.6%) | 353 (3.3%) |
Employment Occupations by Sex in Junction City
Management, Business, Science and Arts Occupations
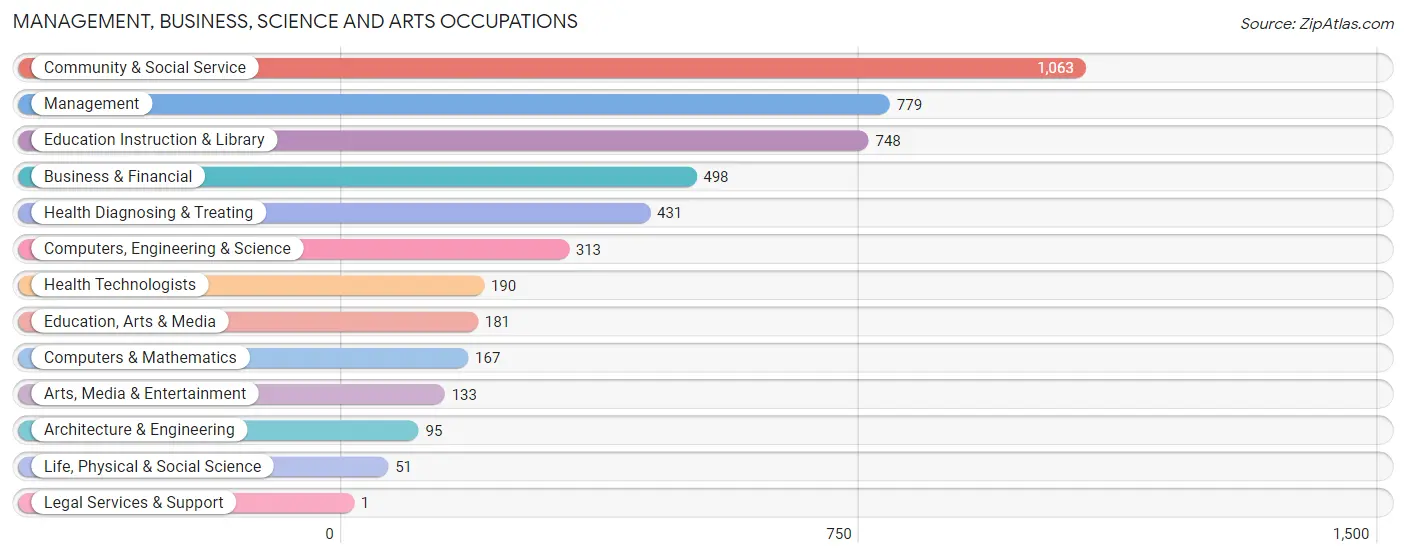
The most common Management, Business, Science and Arts occupations in Junction City are Community & Social Service (1,063 | 10.8%), Management (779 | 7.9%), Education Instruction & Library (748 | 7.6%), Business & Financial (498 | 5.0%), and Health Diagnosing & Treating (431 | 4.4%).
Management, Business, Science and Arts Occupations by Sex
Within the Management, Business, Science and Arts occupations in Junction City, the most male-oriented occupations are Architecture & Engineering (100.0%), Legal Services & Support (100.0%), and Computers & Mathematics (87.4%), while the most female-oriented occupations are Education Instruction & Library (85.3%), Education, Arts & Media (80.7%), and Community & Social Service (80.3%).
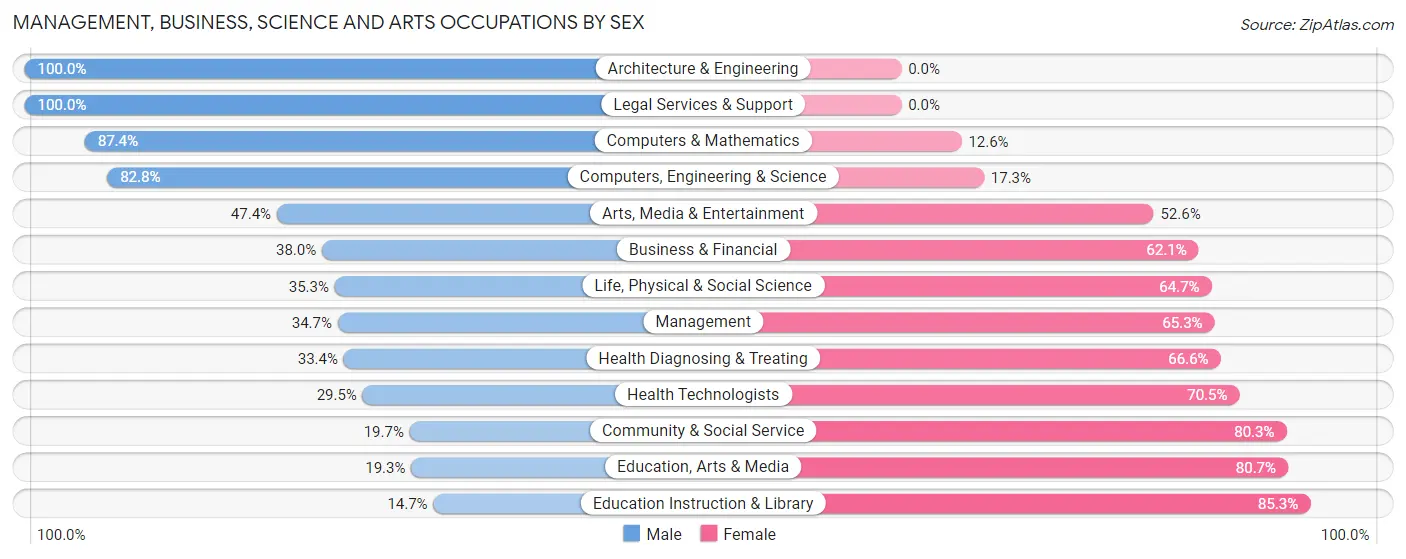
| Occupation | Male | Female |
| Management | 270 (34.7%) | 509 (65.3%) |
| Business & Financial | 189 (38.0%) | 309 (62.1%) |
| Computers, Engineering & Science | 259 (82.8%) | 54 (17.2%) |
| Computers & Mathematics | 146 (87.4%) | 21 (12.6%) |
| Architecture & Engineering | 95 (100.0%) | 0 (0.0%) |
| Life, Physical & Social Science | 18 (35.3%) | 33 (64.7%) |
| Community & Social Service | 209 (19.7%) | 854 (80.3%) |
| Education, Arts & Media | 35 (19.3%) | 146 (80.7%) |
| Legal Services & Support | 1 (100.0%) | 0 (0.0%) |
| Education Instruction & Library | 110 (14.7%) | 638 (85.3%) |
| Arts, Media & Entertainment | 63 (47.4%) | 70 (52.6%) |
| Health Diagnosing & Treating | 144 (33.4%) | 287 (66.6%) |
| Health Technologists | 56 (29.5%) | 134 (70.5%) |
| Total (Category) | 1,071 (34.7%) | 2,013 (65.3%) |
| Total (Overall) | 5,055 (51.2%) | 4,819 (48.8%) |
Services Occupations
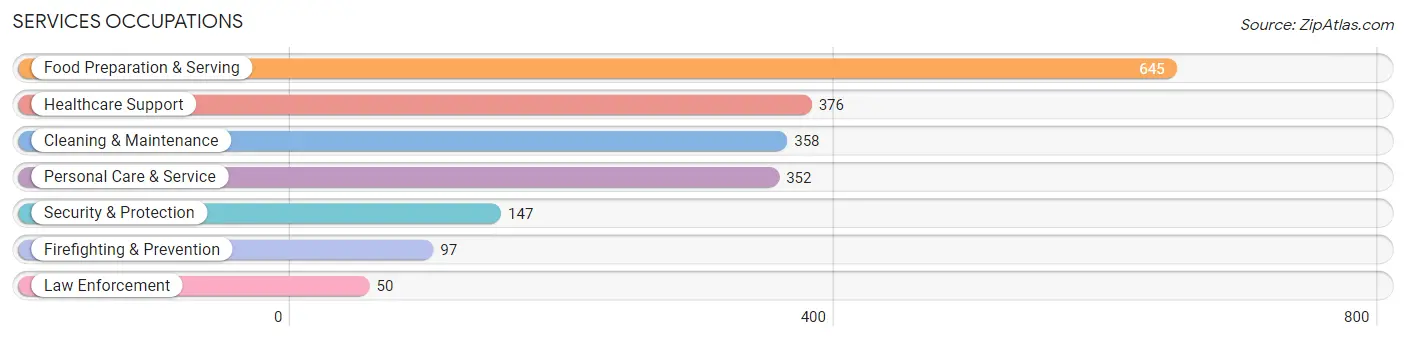
The most common Services occupations in Junction City are Food Preparation & Serving (645 | 6.5%), Healthcare Support (376 | 3.8%), Cleaning & Maintenance (358 | 3.6%), Personal Care & Service (352 | 3.6%), and Security & Protection (147 | 1.5%).
Services Occupations by Sex
Within the Services occupations in Junction City, the most male-oriented occupations are Firefighting & Prevention (100.0%), Security & Protection (73.5%), and Cleaning & Maintenance (54.2%), while the most female-oriented occupations are Healthcare Support (90.2%), Law Enforcement (78.0%), and Personal Care & Service (77.0%).
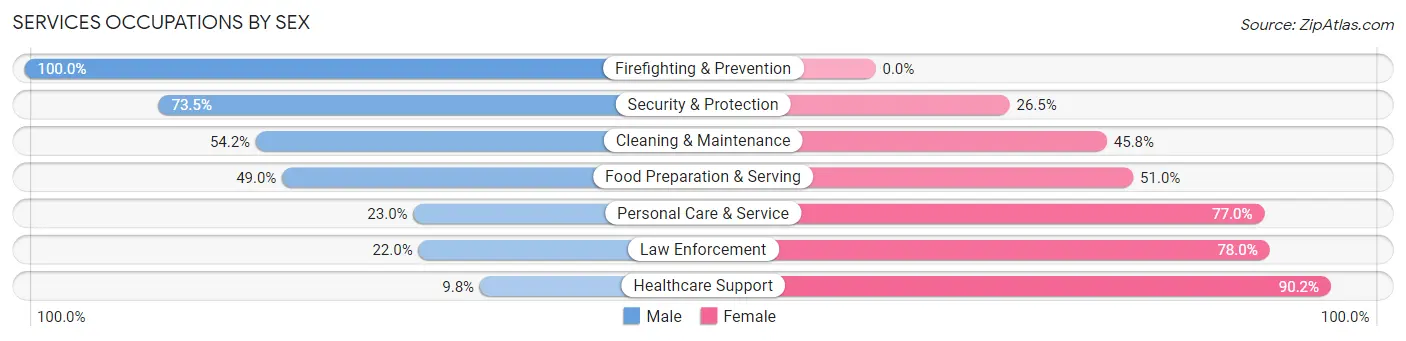
| Occupation | Male | Female |
| Healthcare Support | 37 (9.8%) | 339 (90.2%) |
| Security & Protection | 108 (73.5%) | 39 (26.5%) |
| Firefighting & Prevention | 97 (100.0%) | 0 (0.0%) |
| Law Enforcement | 11 (22.0%) | 39 (78.0%) |
| Food Preparation & Serving | 316 (49.0%) | 329 (51.0%) |
| Cleaning & Maintenance | 194 (54.2%) | 164 (45.8%) |
| Personal Care & Service | 81 (23.0%) | 271 (77.0%) |
| Total (Category) | 736 (39.2%) | 1,142 (60.8%) |
| Total (Overall) | 5,055 (51.2%) | 4,819 (48.8%) |
Sales and Office Occupations
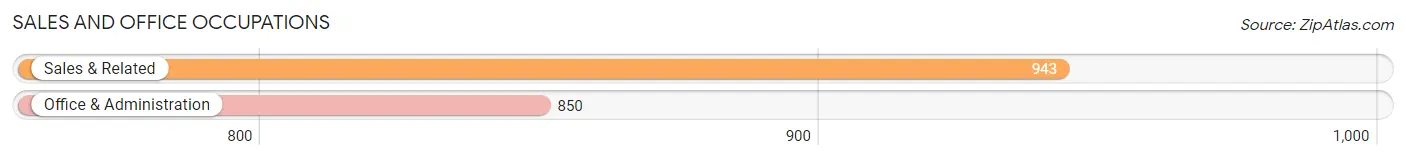
The most common Sales and Office occupations in Junction City are Sales & Related (943 | 9.6%), and Office & Administration (850 | 8.6%).
Sales and Office Occupations by Sex
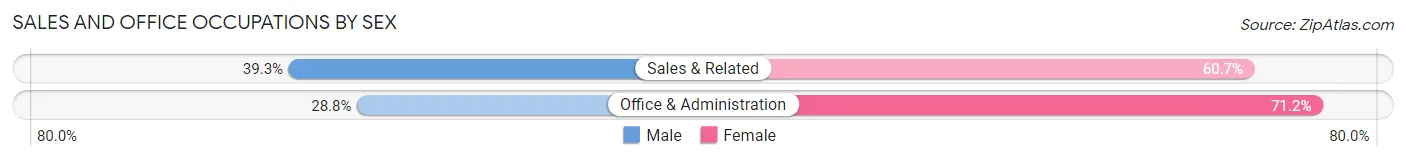
| Occupation | Male | Female |
| Sales & Related | 371 (39.3%) | 572 (60.7%) |
| Office & Administration | 245 (28.8%) | 605 (71.2%) |
| Total (Category) | 616 (34.4%) | 1,177 (65.6%) |
| Total (Overall) | 5,055 (51.2%) | 4,819 (48.8%) |
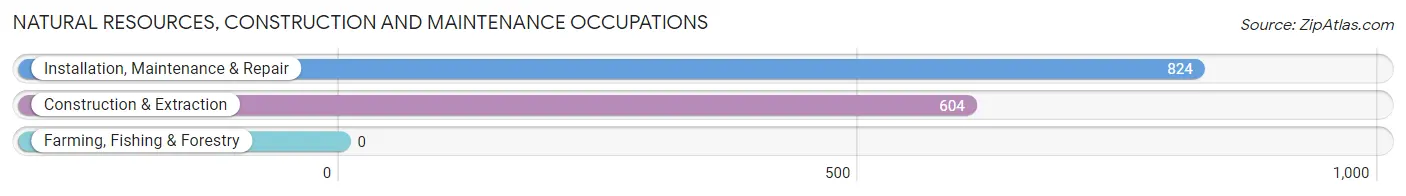
Natural Resources, Construction and Maintenance Occupations
The most common Natural Resources, Construction and Maintenance occupations in Junction City are Installation, Maintenance & Repair (824 | 8.4%), and Construction & Extraction (604 | 6.1%).
Natural Resources, Construction and Maintenance Occupations by Sex
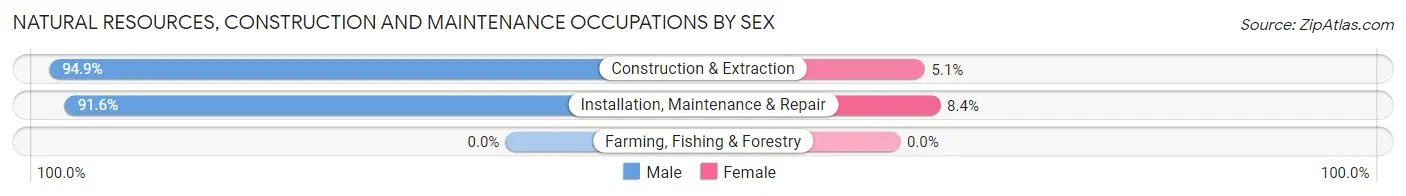
| Occupation | Male | Female |
| Farming, Fishing & Forestry | 0 (0.0%) | 0 (0.0%) |
| Construction & Extraction | 573 (94.9%) | 31 (5.1%) |
| Installation, Maintenance & Repair | 755 (91.6%) | 69 (8.4%) |
| Total (Category) | 1,328 (93.0%) | 100 (7.0%) |
| Total (Overall) | 5,055 (51.2%) | 4,819 (48.8%) |
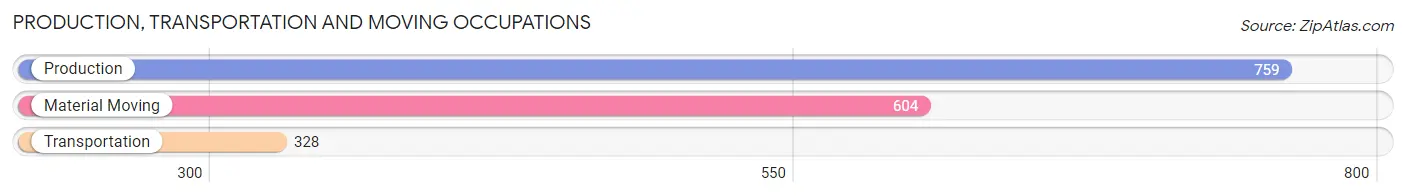
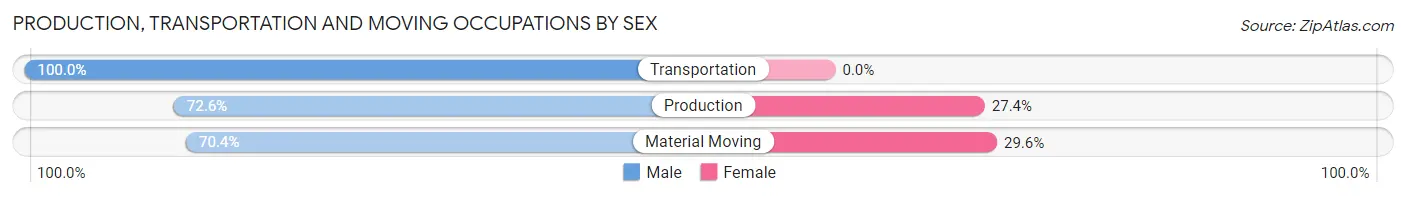
Production, Transportation and Moving Occupations
The most common Production, Transportation and Moving occupations in Junction City are Production (759 | 7.7%), Material Moving (604 | 6.1%), and Transportation (328 | 3.3%).
Production, Transportation and Moving Occupations by Sex
| Occupation | Male | Female |
| Production | 551 (72.6%) | 208 (27.4%) |
| Transportation | 328 (100.0%) | 0 (0.0%) |
| Material Moving | 425 (70.4%) | 179 (29.6%) |
| Total (Category) | 1,304 (77.1%) | 387 (22.9%) |
| Total (Overall) | 5,055 (51.2%) | 4,819 (48.8%) |
Employment Industries by Sex in Junction City
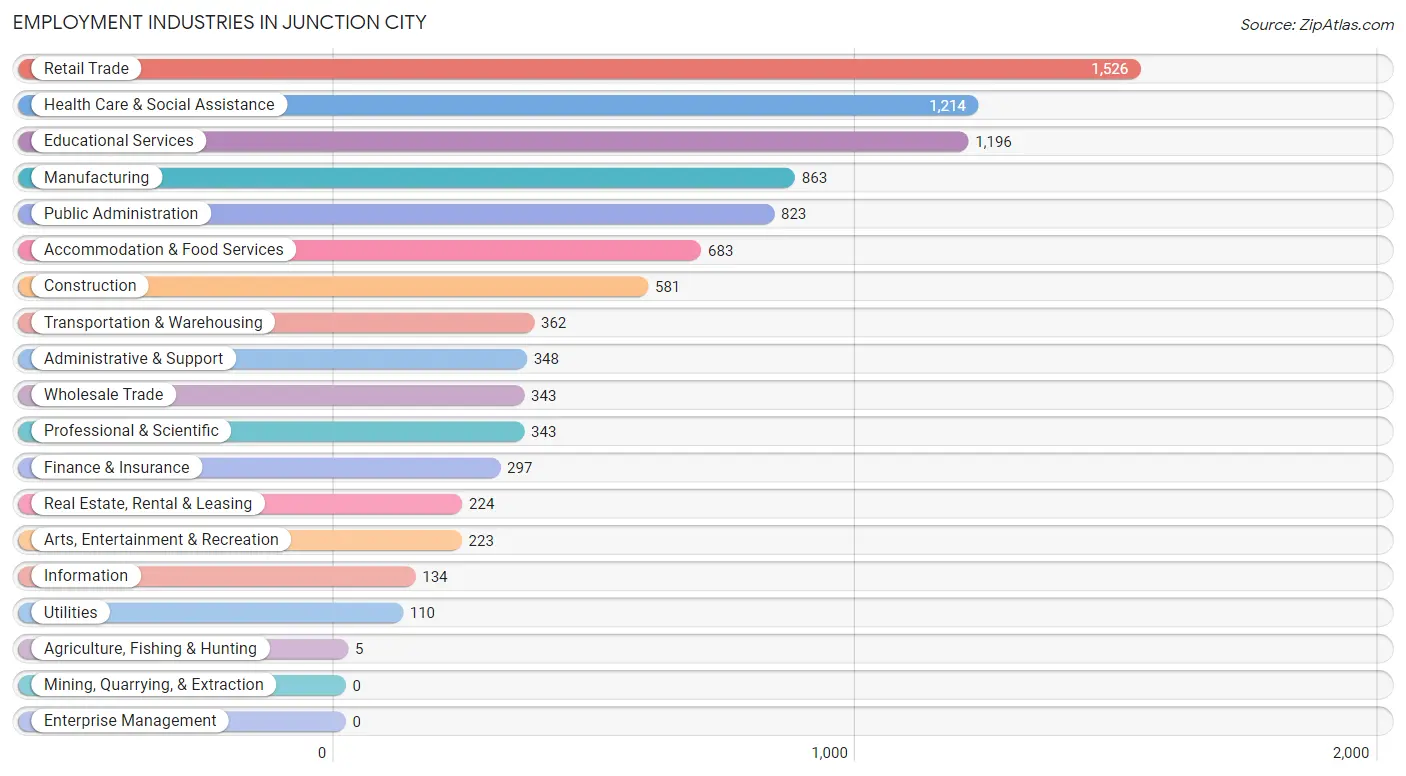
Employment Industries in Junction City
The major employment industries in Junction City include Retail Trade (1,526 | 15.4%), Health Care & Social Assistance (1,214 | 12.3%), Educational Services (1,196 | 12.1%), Manufacturing (863 | 8.7%), and Public Administration (823 | 8.3%).
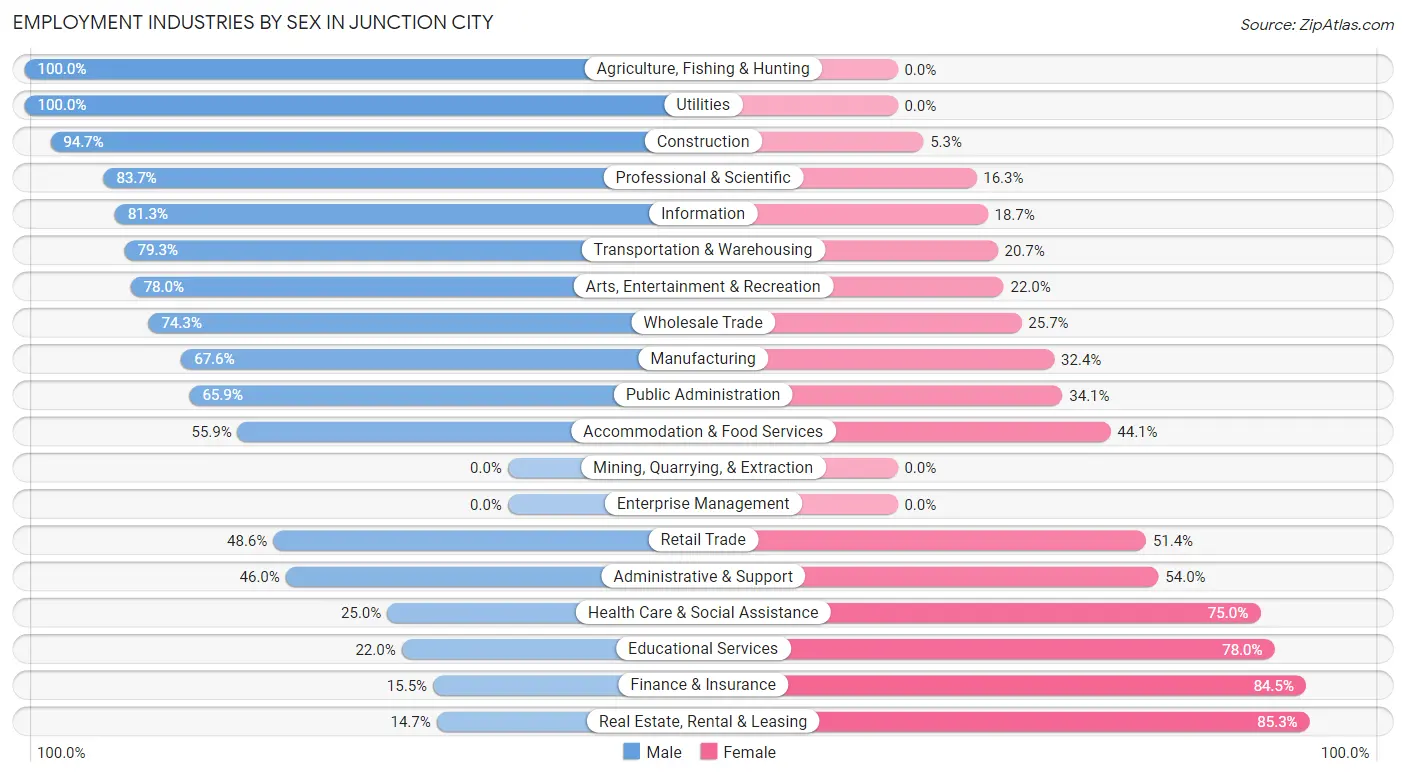
Employment Industries by Sex in Junction City
The Junction City industries that see more men than women are Agriculture, Fishing & Hunting (100.0%), Utilities (100.0%), and Construction (94.7%), whereas the industries that tend to have a higher number of women are Real Estate, Rental & Leasing (85.3%), Finance & Insurance (84.5%), and Educational Services (78.0%).
| Industry | Male | Female |
| Agriculture, Fishing & Hunting | 5 (100.0%) | 0 (0.0%) |
| Mining, Quarrying, & Extraction | 0 (0.0%) | 0 (0.0%) |
| Construction | 550 (94.7%) | 31 (5.3%) |
| Manufacturing | 583 (67.6%) | 280 (32.4%) |
| Wholesale Trade | 255 (74.3%) | 88 (25.7%) |
| Retail Trade | 741 (48.6%) | 785 (51.4%) |
| Transportation & Warehousing | 287 (79.3%) | 75 (20.7%) |
| Utilities | 110 (100.0%) | 0 (0.0%) |
| Information | 109 (81.3%) | 25 (18.7%) |
| Finance & Insurance | 46 (15.5%) | 251 (84.5%) |
| Real Estate, Rental & Leasing | 33 (14.7%) | 191 (85.3%) |
| Professional & Scientific | 287 (83.7%) | 56 (16.3%) |
| Enterprise Management | 0 (0.0%) | 0 (0.0%) |
| Administrative & Support | 160 (46.0%) | 188 (54.0%) |
| Educational Services | 263 (22.0%) | 933 (78.0%) |
| Health Care & Social Assistance | 303 (25.0%) | 911 (75.0%) |
| Arts, Entertainment & Recreation | 174 (78.0%) | 49 (22.0%) |
| Accommodation & Food Services | 382 (55.9%) | 301 (44.1%) |
| Public Administration | 542 (65.9%) | 281 (34.1%) |
| Total | 5,055 (51.2%) | 4,819 (48.8%) |
Education in Junction City
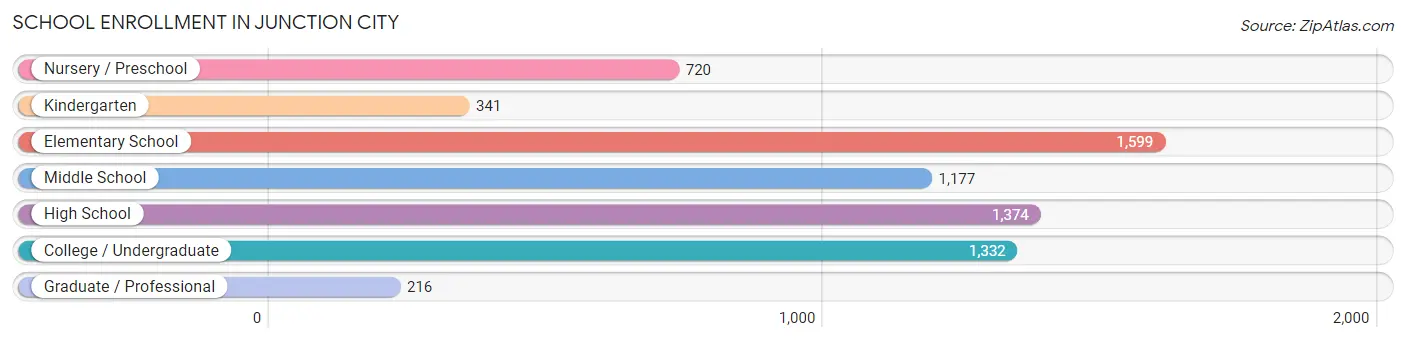
School Enrollment in Junction City
The most common levels of schooling among the 6,759 students in Junction City are elementary school (1,599 | 23.7%), high school (1,374 | 20.3%), and college / undergraduate (1,332 | 19.7%).
| School Level | # Students | % Students |
| Nursery / Preschool | 720 | 10.6% |
| Kindergarten | 341 | 5.1% |
| Elementary School | 1,599 | 23.7% |
| Middle School | 1,177 | 17.4% |
| High School | 1,374 | 20.3% |
| College / Undergraduate | 1,332 | 19.7% |
| Graduate / Professional | 216 | 3.2% |
| Total | 6,759 | 100.0% |
School Enrollment by Age by Funding Source in Junction City
Out of a total of 6,759 students who are enrolled in schools in Junction City, 412 (6.1%) attend a private institution, while the remaining 6,347 (93.9%) are enrolled in public schools. The age group of 20 to 24 year olds has the highest likelihood of being enrolled in private schools, with 67 (11.8% in the age bracket) enrolled. Conversely, the age group of 25 to 34 year olds has the lowest likelihood of being enrolled in a private school, with 513 (100.0% in the age bracket) attending a public institution.
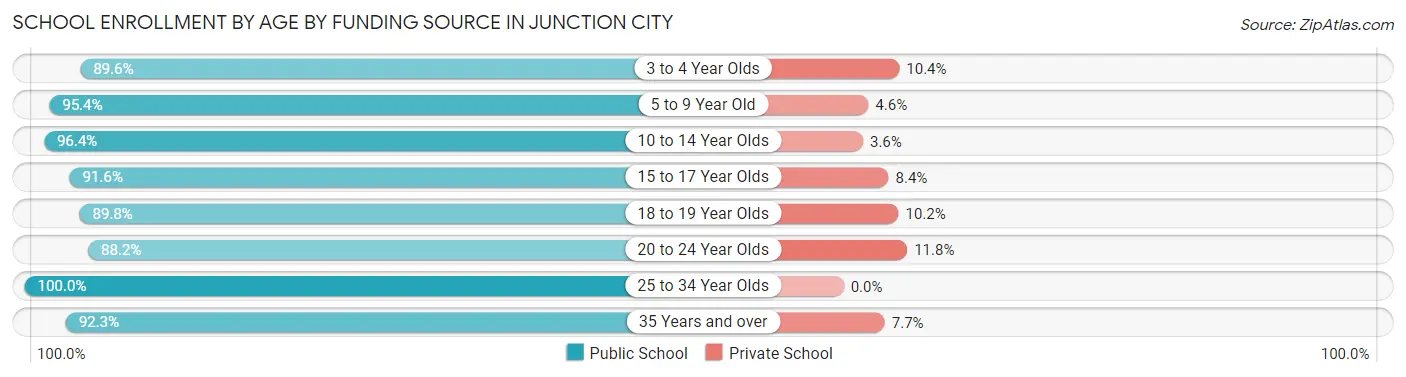
| Age Bracket | Public School | Private School |
| 3 to 4 Year Olds | 432 (89.6%) | 50 (10.4%) |
| 5 to 9 Year Old | 2,049 (95.4%) | 99 (4.6%) |
| 10 to 14 Year Olds | 1,361 (96.4%) | 51 (3.6%) |
| 15 to 17 Year Olds | 712 (91.6%) | 65 (8.4%) |
| 18 to 19 Year Olds | 457 (89.8%) | 52 (10.2%) |
| 20 to 24 Year Olds | 499 (88.2%) | 67 (11.8%) |
| 25 to 34 Year Olds | 513 (100.0%) | 0 (0.0%) |
| 35 Years and over | 325 (92.3%) | 27 (7.7%) |
| Total | 6,347 (93.9%) | 412 (6.1%) |
Educational Attainment by Field of Study in Junction City
Business (745 | 23.9%), education (602 | 19.3%), arts & humanities (589 | 18.9%), computers & mathematics (205 | 6.6%), and science & technology (172 | 5.5%) are the most common fields of study among 3,119 individuals in Junction City who have obtained a bachelor's degree or higher.
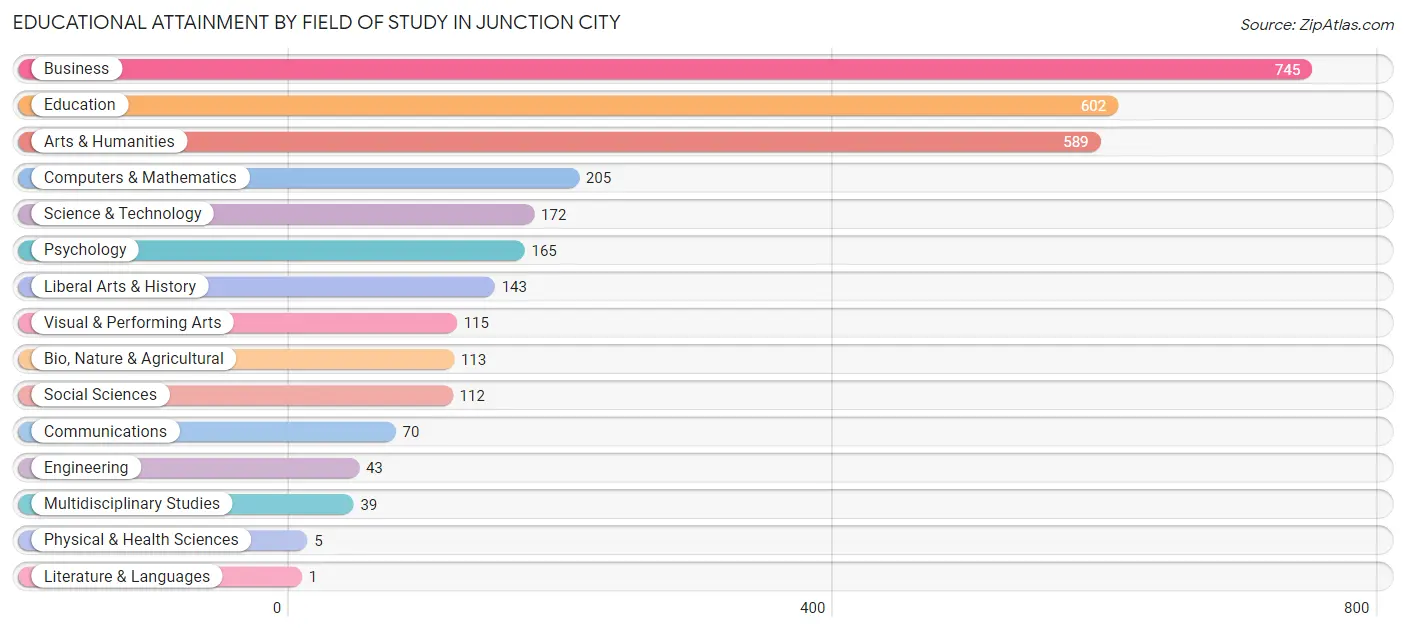
| Field of Study | # Graduates | % Graduates |
| Computers & Mathematics | 205 | 6.6% |
| Bio, Nature & Agricultural | 113 | 3.6% |
| Physical & Health Sciences | 5 | 0.2% |
| Psychology | 165 | 5.3% |
| Social Sciences | 112 | 3.6% |
| Engineering | 43 | 1.4% |
| Multidisciplinary Studies | 39 | 1.3% |
| Science & Technology | 172 | 5.5% |
| Business | 745 | 23.9% |
| Education | 602 | 19.3% |
| Literature & Languages | 1 | 0.0% |
| Liberal Arts & History | 143 | 4.6% |
| Visual & Performing Arts | 115 | 3.7% |
| Communications | 70 | 2.2% |
| Arts & Humanities | 589 | 18.9% |
| Total | 3,119 | 100.0% |
Transportation & Commute in Junction City
Vehicle Availability by Sex in Junction City
The most prevalent vehicle ownership categories in Junction City are males with 2 vehicles (2,976, accounting for 46.2%) and females with 2 vehicles (2,099, making up 60.4%).
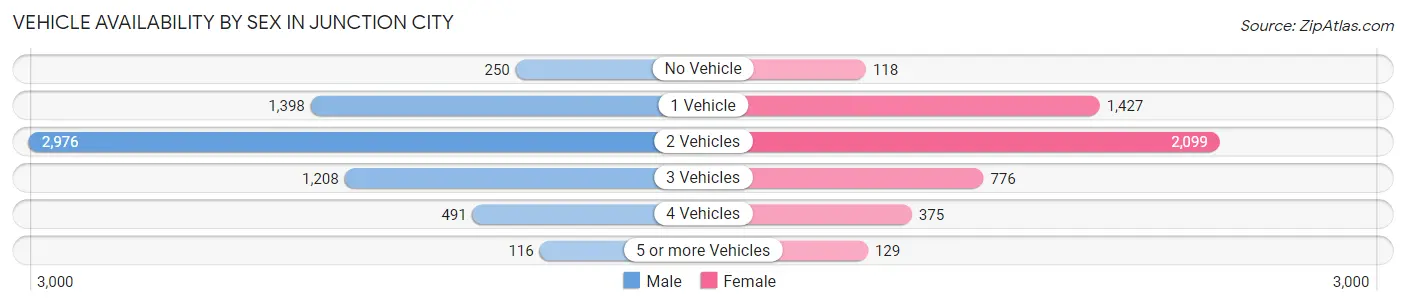
| Vehicles Available | Male | Female |
| No Vehicle | 250 (3.9%) | 118 (2.4%) |
| 1 Vehicle | 1,398 (21.7%) | 1,427 (29.0%) |
| 2 Vehicles | 2,976 (46.2%) | 2,099 (42.6%) |
| 3 Vehicles | 1,208 (18.8%) | 776 (15.8%) |
| 4 Vehicles | 491 (7.6%) | 375 (7.6%) |
| 5 or more Vehicles | 116 (1.8%) | 129 (2.6%) |
| Total | 6,439 (100.0%) | 4,924 (100.0%) |
Commute Time in Junction City
The most frequently occuring commute durations in Junction City are 10 to 14 minutes (2,369 commuters, 21.6%), 15 to 19 minutes (1,902 commuters, 17.4%), and 5 to 9 minutes (1,763 commuters, 16.1%).
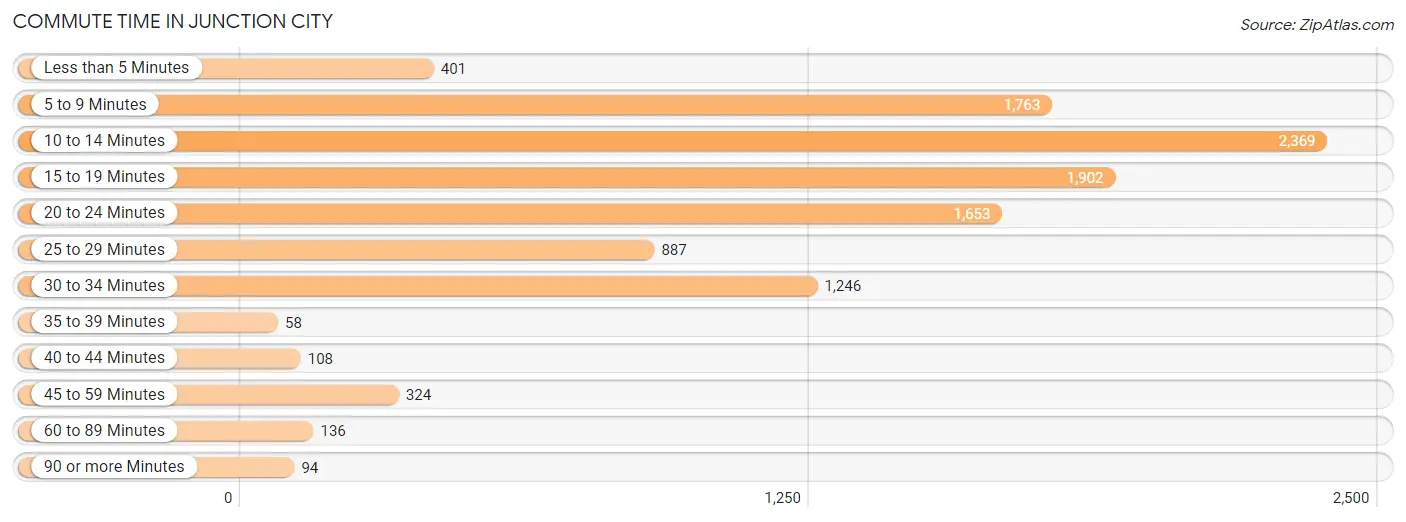
| Commute Time | # Commuters | % Commuters |
| Less than 5 Minutes | 401 | 3.7% |
| 5 to 9 Minutes | 1,763 | 16.1% |
| 10 to 14 Minutes | 2,369 | 21.6% |
| 15 to 19 Minutes | 1,902 | 17.4% |
| 20 to 24 Minutes | 1,653 | 15.1% |
| 25 to 29 Minutes | 887 | 8.1% |
| 30 to 34 Minutes | 1,246 | 11.4% |
| 35 to 39 Minutes | 58 | 0.5% |
| 40 to 44 Minutes | 108 | 1.0% |
| 45 to 59 Minutes | 324 | 3.0% |
| 60 to 89 Minutes | 136 | 1.2% |
| 90 or more Minutes | 94 | 0.9% |
Commute Time by Sex in Junction City
The most common commute times in Junction City are 15 to 19 minutes (1,373 commuters, 22.1%) for males and 10 to 14 minutes (1,171 commuters, 24.7%) for females.
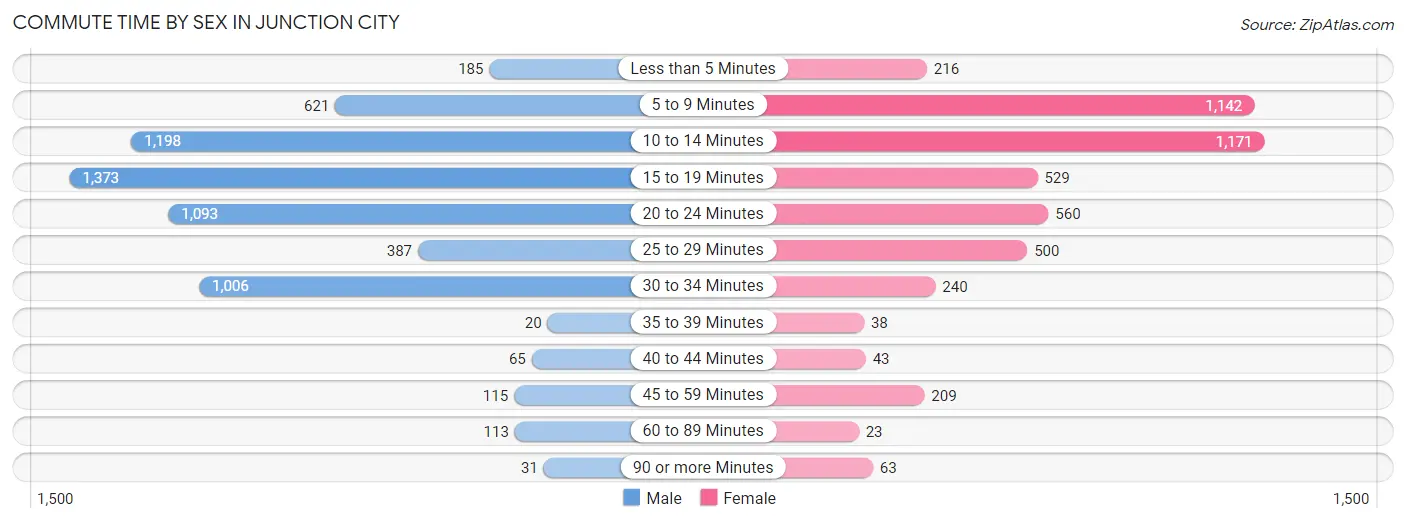
| Commute Time | Male | Female |
| Less than 5 Minutes | 185 (3.0%) | 216 (4.6%) |
| 5 to 9 Minutes | 621 (10.0%) | 1,142 (24.1%) |
| 10 to 14 Minutes | 1,198 (19.3%) | 1,171 (24.7%) |
| 15 to 19 Minutes | 1,373 (22.1%) | 529 (11.2%) |
| 20 to 24 Minutes | 1,093 (17.6%) | 560 (11.8%) |
| 25 to 29 Minutes | 387 (6.2%) | 500 (10.6%) |
| 30 to 34 Minutes | 1,006 (16.2%) | 240 (5.1%) |
| 35 to 39 Minutes | 20 (0.3%) | 38 (0.8%) |
| 40 to 44 Minutes | 65 (1.1%) | 43 (0.9%) |
| 45 to 59 Minutes | 115 (1.8%) | 209 (4.4%) |
| 60 to 89 Minutes | 113 (1.8%) | 23 (0.5%) |
| 90 or more Minutes | 31 (0.5%) | 63 (1.3%) |
Time of Departure to Work by Sex in Junction City
The most frequent times of departure to work in Junction City are 6:00 AM to 6:29 AM (1,024, 16.5%) for males and 6:30 AM to 6:59 AM (739, 15.6%) for females.
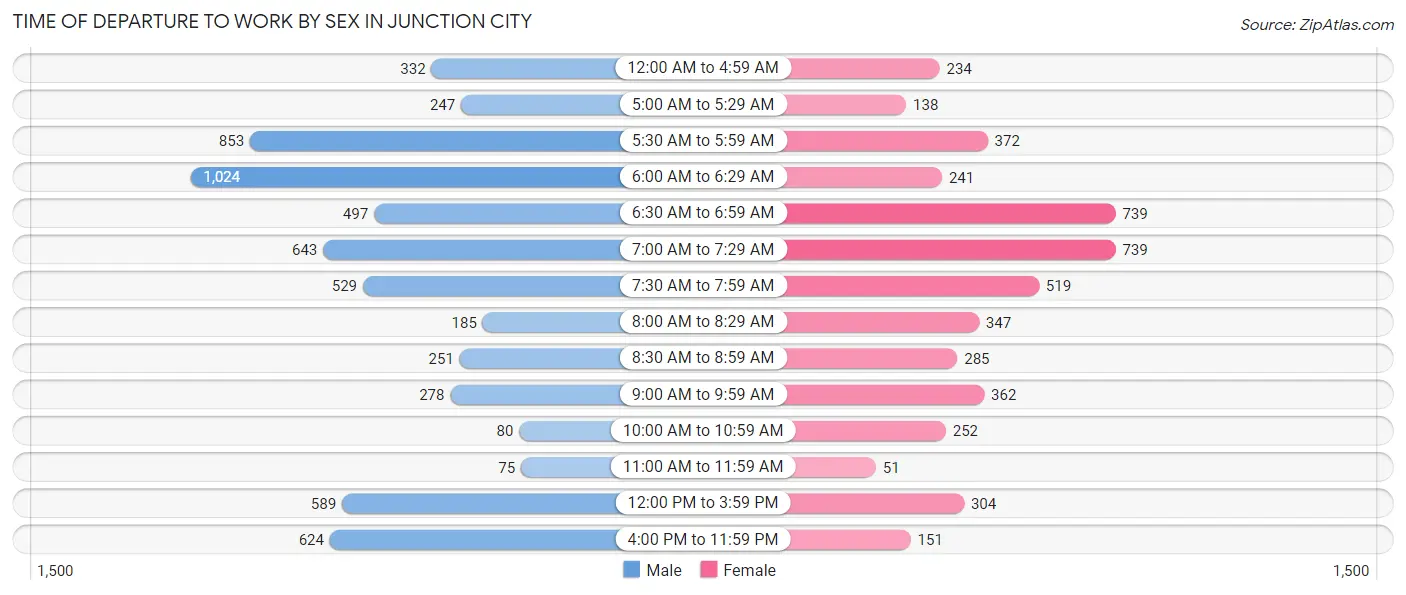
| Time of Departure | Male | Female |
| 12:00 AM to 4:59 AM | 332 (5.3%) | 234 (4.9%) |
| 5:00 AM to 5:29 AM | 247 (4.0%) | 138 (2.9%) |
| 5:30 AM to 5:59 AM | 853 (13.7%) | 372 (7.9%) |
| 6:00 AM to 6:29 AM | 1,024 (16.5%) | 241 (5.1%) |
| 6:30 AM to 6:59 AM | 497 (8.0%) | 739 (15.6%) |
| 7:00 AM to 7:29 AM | 643 (10.4%) | 739 (15.6%) |
| 7:30 AM to 7:59 AM | 529 (8.5%) | 519 (11.0%) |
| 8:00 AM to 8:29 AM | 185 (3.0%) | 347 (7.3%) |
| 8:30 AM to 8:59 AM | 251 (4.0%) | 285 (6.0%) |
| 9:00 AM to 9:59 AM | 278 (4.5%) | 362 (7.6%) |
| 10:00 AM to 10:59 AM | 80 (1.3%) | 252 (5.3%) |
| 11:00 AM to 11:59 AM | 75 (1.2%) | 51 (1.1%) |
| 12:00 PM to 3:59 PM | 589 (9.5%) | 304 (6.4%) |
| 4:00 PM to 11:59 PM | 624 (10.1%) | 151 (3.2%) |
| Total | 6,207 (100.0%) | 4,734 (100.0%) |
Housing Occupancy in Junction City
Occupancy by Ownership in Junction City
Of the total 8,969 dwellings in Junction City, owner-occupied units account for 4,457 (49.7%), while renter-occupied units make up 4,512 (50.3%).
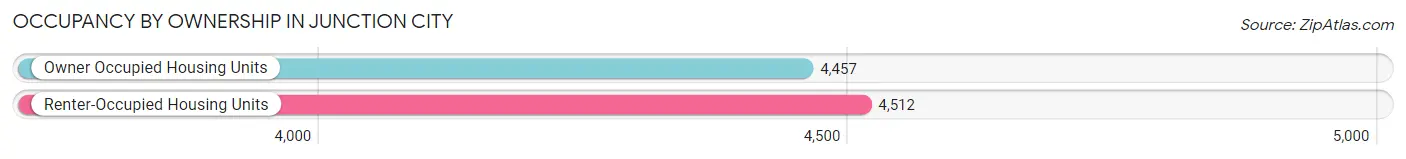
| Occupancy | # Housing Units | % Housing Units |
| Owner Occupied Housing Units | 4,457 | 49.7% |
| Renter-Occupied Housing Units | 4,512 | 50.3% |
| Total Occupied Housing Units | 8,969 | 100.0% |
Occupancy by Household Size in Junction City
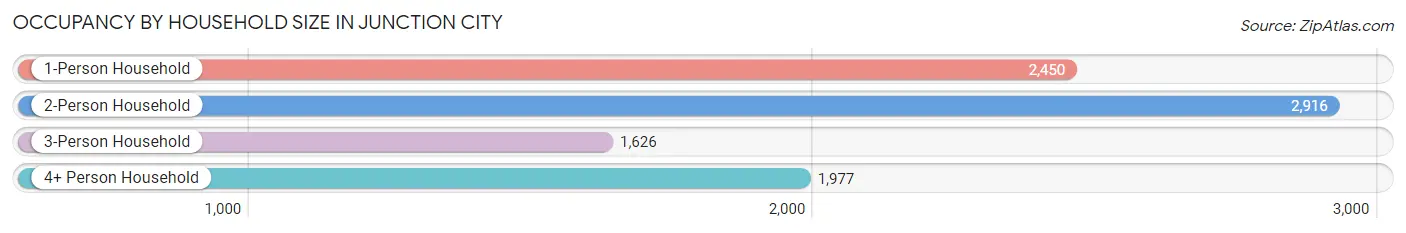
| Household Size | # Housing Units | % Housing Units |
| 1-Person Household | 2,450 | 27.3% |
| 2-Person Household | 2,916 | 32.5% |
| 3-Person Household | 1,626 | 18.1% |
| 4+ Person Household | 1,977 | 22.0% |
| Total Housing Units | 8,969 | 100.0% |
Occupancy by Ownership by Household Size in Junction City
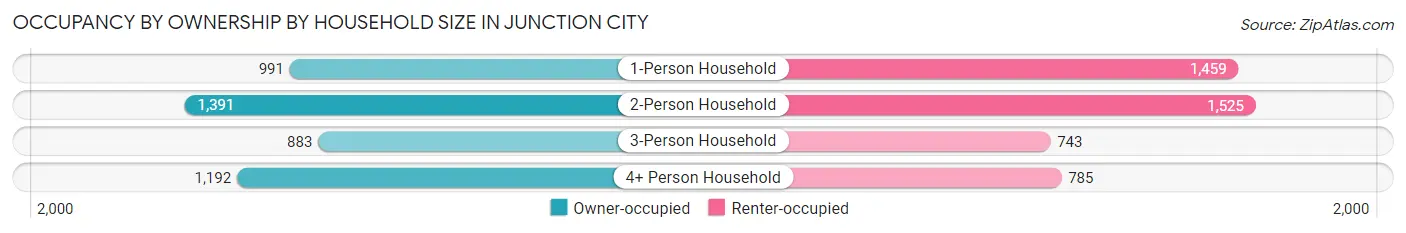
| Household Size | Owner-occupied | Renter-occupied |
| 1-Person Household | 991 (40.5%) | 1,459 (59.6%) |
| 2-Person Household | 1,391 (47.7%) | 1,525 (52.3%) |
| 3-Person Household | 883 (54.3%) | 743 (45.7%) |
| 4+ Person Household | 1,192 (60.3%) | 785 (39.7%) |
| Total Housing Units | 4,457 (49.7%) | 4,512 (50.3%) |
Occupancy by Educational Attainment in Junction City
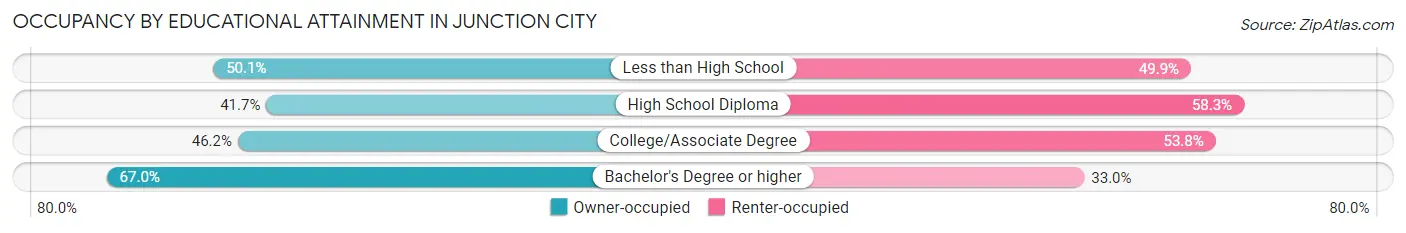
| Household Size | Owner-occupied | Renter-occupied |
| Less than High School | 307 (50.1%) | 306 (49.9%) |
| High School Diploma | 998 (41.7%) | 1,397 (58.3%) |
| College/Associate Degree | 1,866 (46.2%) | 2,175 (53.8%) |
| Bachelor's Degree or higher | 1,286 (67.0%) | 634 (33.0%) |
Occupancy by Age of Householder in Junction City
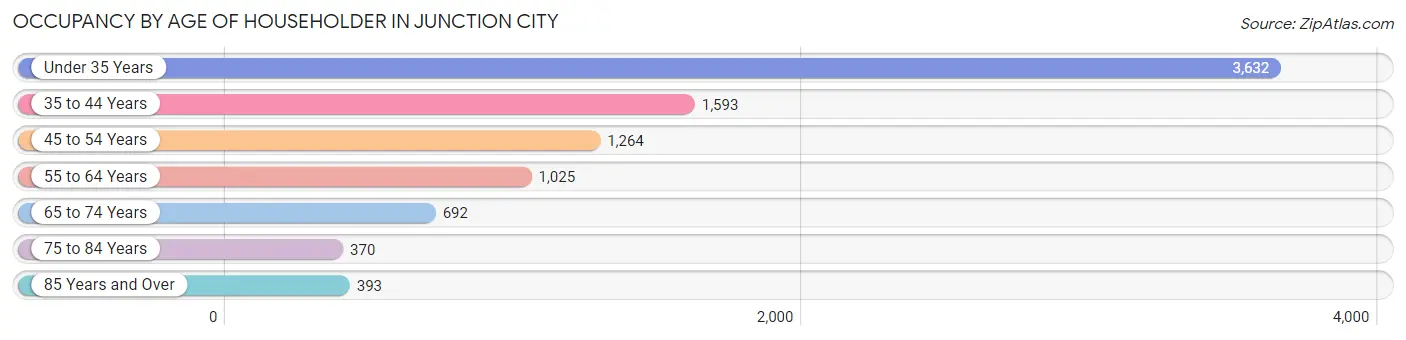
| Age Bracket | # Households | % Households |
| Under 35 Years | 3,632 | 40.5% |
| 35 to 44 Years | 1,593 | 17.8% |
| 45 to 54 Years | 1,264 | 14.1% |
| 55 to 64 Years | 1,025 | 11.4% |
| 65 to 74 Years | 692 | 7.7% |
| 75 to 84 Years | 370 | 4.1% |
| 85 Years and Over | 393 | 4.4% |
| Total | 8,969 | 100.0% |
Housing Finances in Junction City
Median Income by Occupancy in Junction City
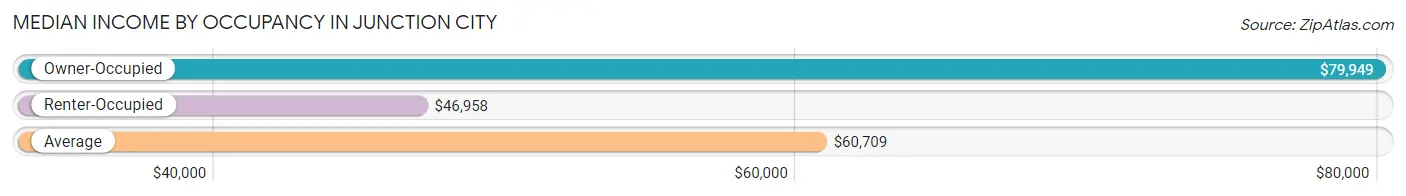
| Occupancy Type | # Households | Median Income |
| Owner-Occupied | 4,457 (49.7%) | $79,949 |
| Renter-Occupied | 4,512 (50.3%) | $46,958 |
| Average | 8,969 (100.0%) | $60,709 |
Occupancy by Householder Income Bracket in Junction City
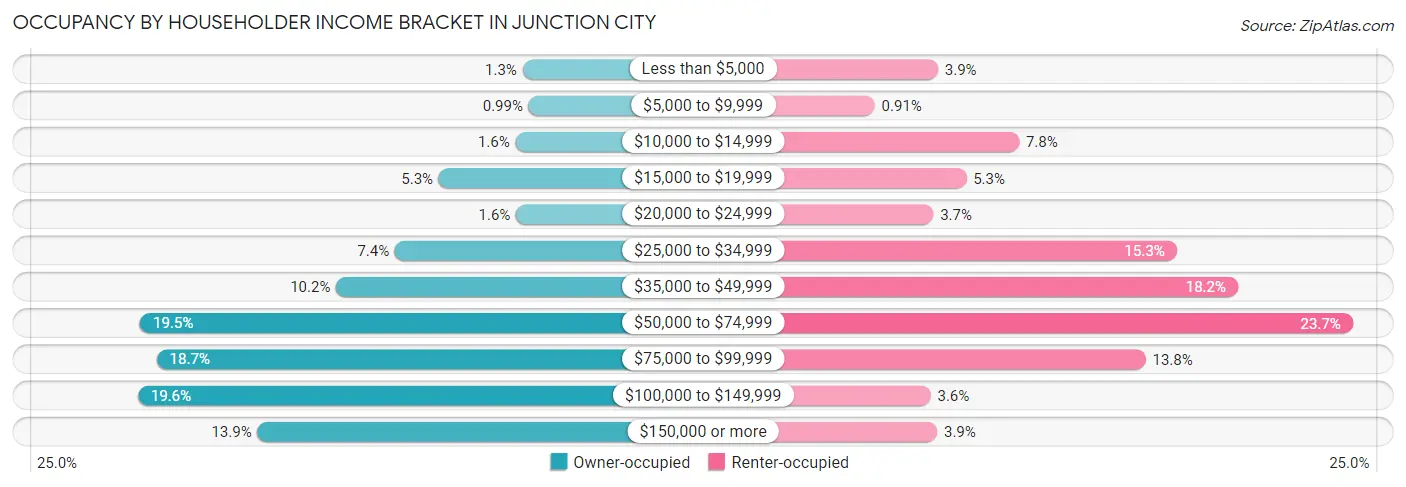
| Income Bracket | Owner-occupied | Renter-occupied |
| Less than $5,000 | 57 (1.3%) | 177 (3.9%) |
| $5,000 to $9,999 | 44 (1.0%) | 41 (0.9%) |
| $10,000 to $14,999 | 72 (1.6%) | 351 (7.8%) |
| $15,000 to $19,999 | 235 (5.3%) | 238 (5.3%) |
| $20,000 to $24,999 | 71 (1.6%) | 167 (3.7%) |
| $25,000 to $34,999 | 328 (7.4%) | 690 (15.3%) |
| $35,000 to $49,999 | 453 (10.2%) | 821 (18.2%) |
| $50,000 to $74,999 | 869 (19.5%) | 1,068 (23.7%) |
| $75,000 to $99,999 | 834 (18.7%) | 623 (13.8%) |
| $100,000 to $149,999 | 874 (19.6%) | 161 (3.6%) |
| $150,000 or more | 620 (13.9%) | 175 (3.9%) |
| Total | 4,457 (100.0%) | 4,512 (100.0%) |
Monthly Housing Cost Tiers in Junction City
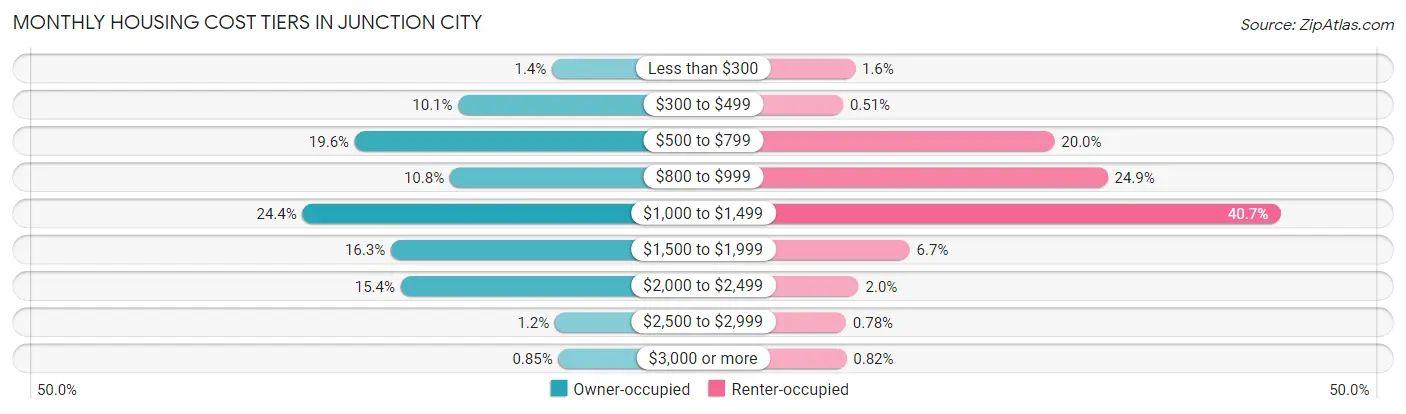
| Monthly Cost | Owner-occupied | Renter-occupied |
| Less than $300 | 64 (1.4%) | 73 (1.6%) |
| $300 to $499 | 449 (10.1%) | 23 (0.5%) |
| $500 to $799 | 873 (19.6%) | 901 (20.0%) |
| $800 to $999 | 483 (10.8%) | 1,122 (24.9%) |
| $1,000 to $1,499 | 1,088 (24.4%) | 1,838 (40.7%) |
| $1,500 to $1,999 | 725 (16.3%) | 300 (6.7%) |
| $2,000 to $2,499 | 685 (15.4%) | 88 (1.9%) |
| $2,500 to $2,999 | 52 (1.2%) | 35 (0.8%) |
| $3,000 or more | 38 (0.9%) | 37 (0.8%) |
| Total | 4,457 (100.0%) | 4,512 (100.0%) |
Physical Housing Characteristics in Junction City
Housing Structures in Junction City
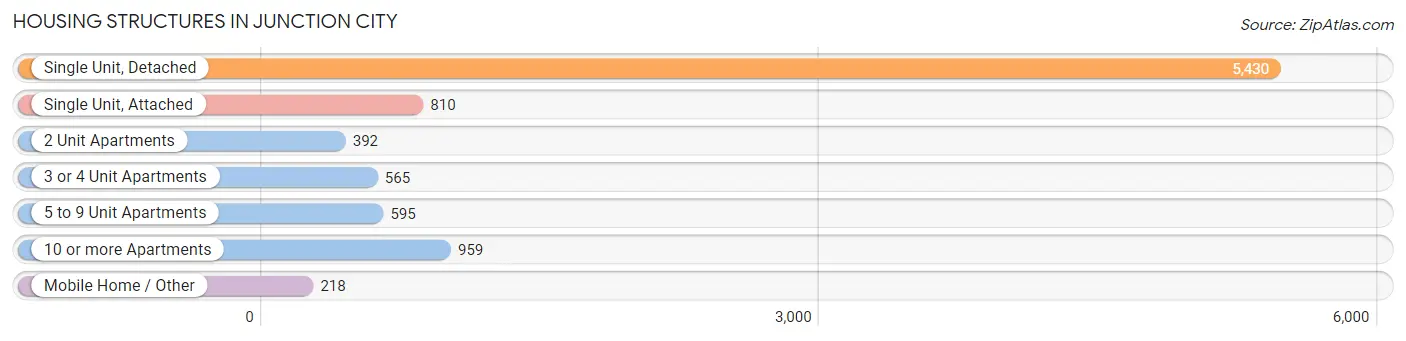
| Structure Type | # Housing Units | % Housing Units |
| Single Unit, Detached | 5,430 | 60.5% |
| Single Unit, Attached | 810 | 9.0% |
| 2 Unit Apartments | 392 | 4.4% |
| 3 or 4 Unit Apartments | 565 | 6.3% |
| 5 to 9 Unit Apartments | 595 | 6.6% |
| 10 or more Apartments | 959 | 10.7% |
| Mobile Home / Other | 218 | 2.4% |
| Total | 8,969 | 100.0% |
Housing Structures by Occupancy in Junction City
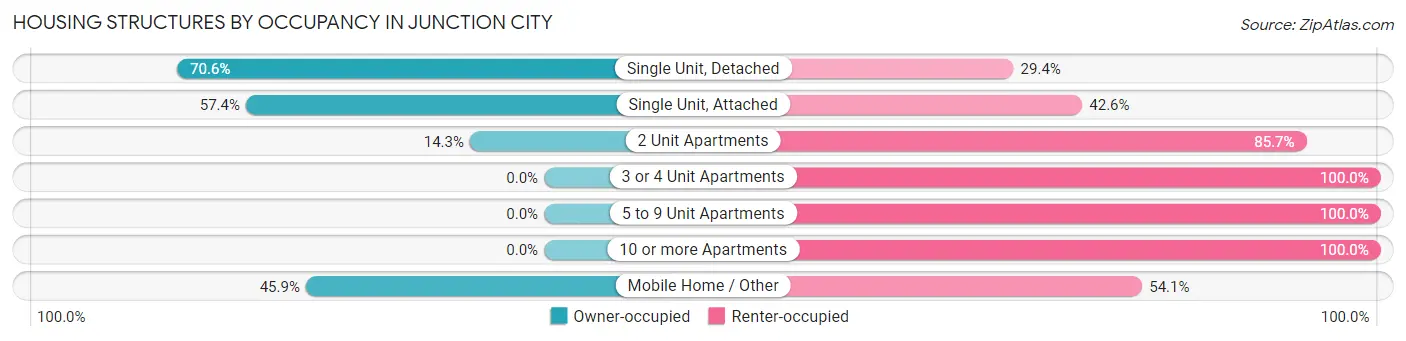
| Structure Type | Owner-occupied | Renter-occupied |
| Single Unit, Detached | 3,836 (70.6%) | 1,594 (29.4%) |
| Single Unit, Attached | 465 (57.4%) | 345 (42.6%) |
| 2 Unit Apartments | 56 (14.3%) | 336 (85.7%) |
| 3 or 4 Unit Apartments | 0 (0.0%) | 565 (100.0%) |
| 5 to 9 Unit Apartments | 0 (0.0%) | 595 (100.0%) |
| 10 or more Apartments | 0 (0.0%) | 959 (100.0%) |
| Mobile Home / Other | 100 (45.9%) | 118 (54.1%) |
| Total | 4,457 (49.7%) | 4,512 (50.3%) |
Housing Structures by Number of Rooms in Junction City
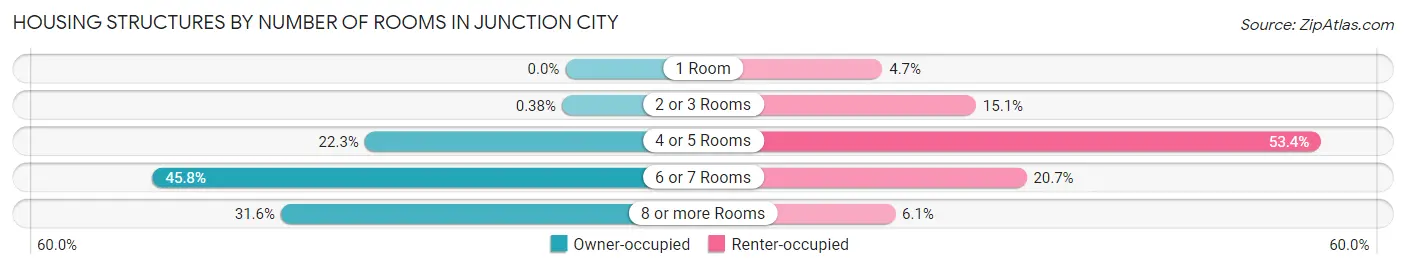
| Number of Rooms | Owner-occupied | Renter-occupied |
| 1 Room | 0 (0.0%) | 212 (4.7%) |
| 2 or 3 Rooms | 17 (0.4%) | 681 (15.1%) |
| 4 or 5 Rooms | 992 (22.3%) | 2,409 (53.4%) |
| 6 or 7 Rooms | 2,041 (45.8%) | 934 (20.7%) |
| 8 or more Rooms | 1,407 (31.6%) | 276 (6.1%) |
| Total | 4,457 (100.0%) | 4,512 (100.0%) |
Housing Structure by Heating Type in Junction City
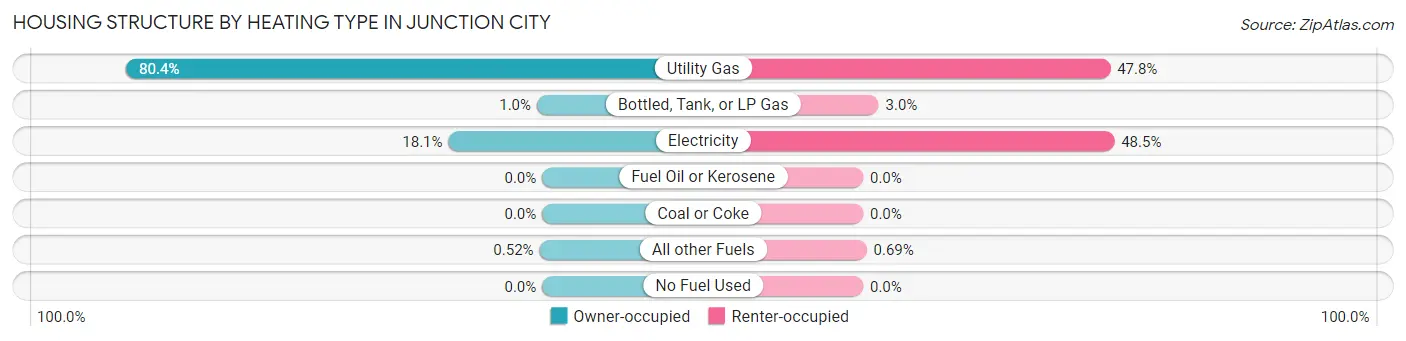
| Heating Type | Owner-occupied | Renter-occupied |
| Utility Gas | 3,582 (80.4%) | 2,155 (47.8%) |
| Bottled, Tank, or LP Gas | 45 (1.0%) | 136 (3.0%) |
| Electricity | 807 (18.1%) | 2,190 (48.5%) |
| Fuel Oil or Kerosene | 0 (0.0%) | 0 (0.0%) |
| Coal or Coke | 0 (0.0%) | 0 (0.0%) |
| All other Fuels | 23 (0.5%) | 31 (0.7%) |
| No Fuel Used | 0 (0.0%) | 0 (0.0%) |
| Total | 4,457 (100.0%) | 4,512 (100.0%) |
Household Vehicle Usage in Junction City
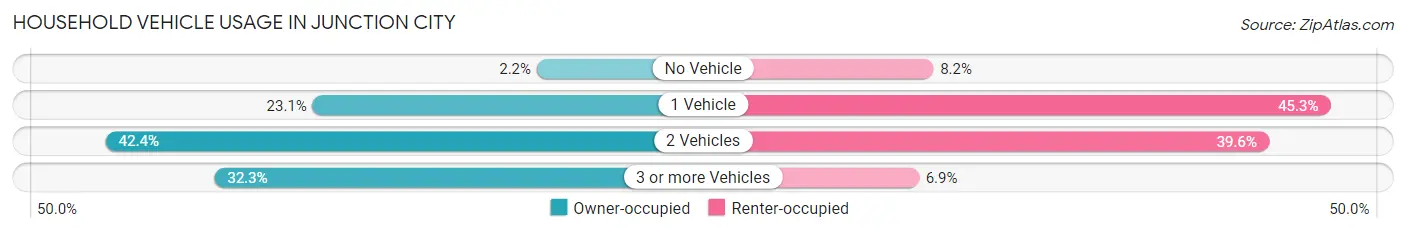
| Vehicles per Household | Owner-occupied | Renter-occupied |
| No Vehicle | 97 (2.2%) | 372 (8.2%) |
| 1 Vehicle | 1,030 (23.1%) | 2,044 (45.3%) |
| 2 Vehicles | 1,891 (42.4%) | 1,785 (39.6%) |
| 3 or more Vehicles | 1,439 (32.3%) | 311 (6.9%) |
| Total | 4,457 (100.0%) | 4,512 (100.0%) |
Real Estate & Mortgages in Junction City
Real Estate and Mortgage Overview in Junction City
| Characteristic | Without Mortgage | With Mortgage |
| Housing Units | 1,532 | 2,925 |
| Median Property Value | $152,700 | $167,500 |
| Median Household Income | $71,500 | $512 |
| Monthly Housing Costs | $619 | $38 |
| Real Estate Taxes | $2,408 | $121 |
Property Value by Mortgage Status in Junction City
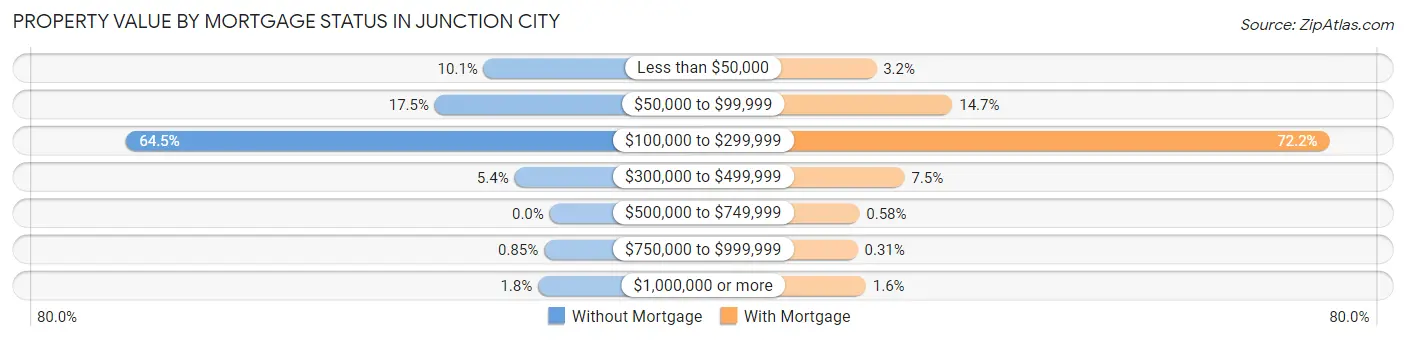
| Property Value | Without Mortgage | With Mortgage |
| Less than $50,000 | 154 (10.1%) | 92 (3.2%) |
| $50,000 to $99,999 | 268 (17.5%) | 431 (14.7%) |
| $100,000 to $299,999 | 988 (64.5%) | 2,112 (72.2%) |
| $300,000 to $499,999 | 82 (5.3%) | 218 (7.4%) |
| $500,000 to $749,999 | 0 (0.0%) | 17 (0.6%) |
| $750,000 to $999,999 | 13 (0.9%) | 9 (0.3%) |
| $1,000,000 or more | 27 (1.8%) | 46 (1.6%) |
| Total | 1,532 (100.0%) | 2,925 (100.0%) |
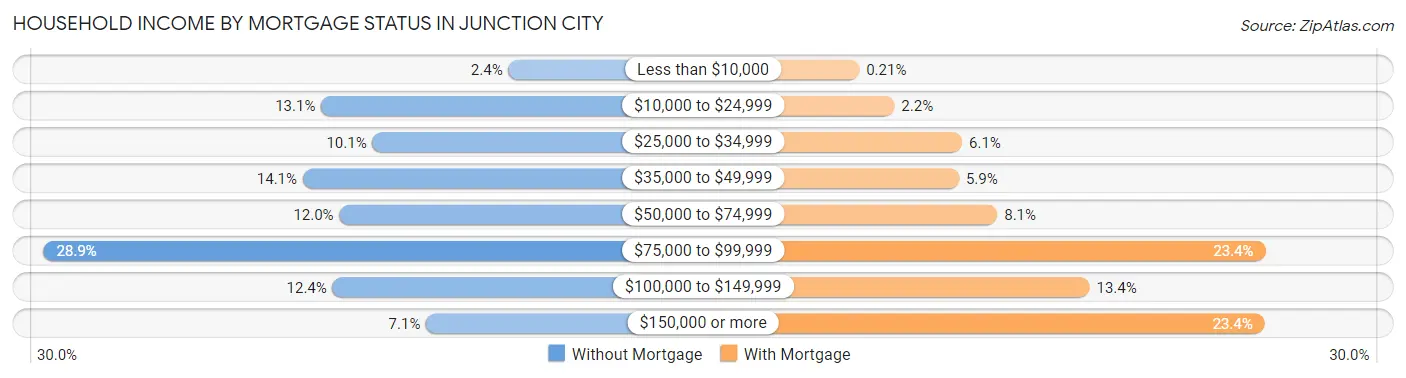
Household Income by Mortgage Status in Junction City
| Household Income | Without Mortgage | With Mortgage |
| Less than $10,000 | 36 (2.4%) | 6 (0.2%) |
| $10,000 to $24,999 | 200 (13.1%) | 65 (2.2%) |
| $25,000 to $34,999 | 155 (10.1%) | 178 (6.1%) |
| $35,000 to $49,999 | 216 (14.1%) | 173 (5.9%) |
| $50,000 to $74,999 | 184 (12.0%) | 237 (8.1%) |
| $75,000 to $99,999 | 443 (28.9%) | 685 (23.4%) |
| $100,000 to $149,999 | 190 (12.4%) | 391 (13.4%) |
| $150,000 or more | 108 (7.0%) | 684 (23.4%) |
| Total | 1,532 (100.0%) | 2,925 (100.0%) |
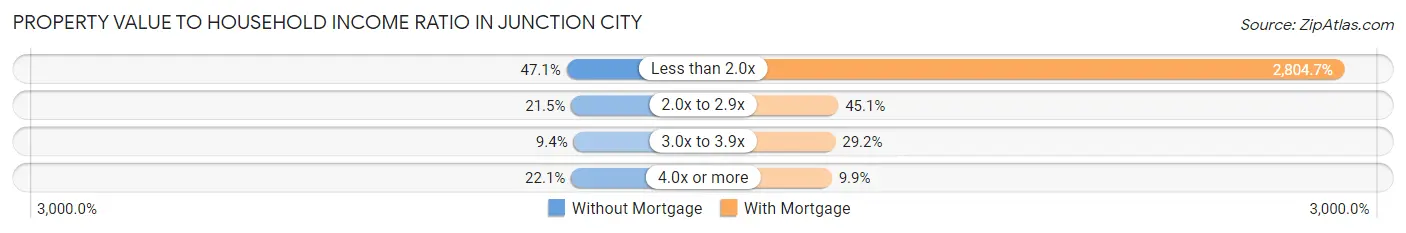
Property Value to Household Income Ratio in Junction City
| Value-to-Income Ratio | Without Mortgage | With Mortgage |
| Less than 2.0x | 721 (47.1%) | 82,038 (2,804.7%) |
| 2.0x to 2.9x | 329 (21.5%) | 1,320 (45.1%) |
| 3.0x to 3.9x | 144 (9.4%) | 854 (29.2%) |
| 4.0x or more | 338 (22.1%) | 288 (9.9%) |
| Total | 1,532 (100.0%) | 2,925 (100.0%) |
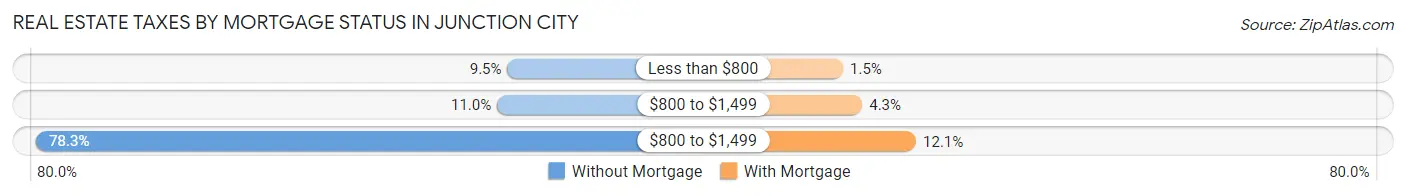
Real Estate Taxes by Mortgage Status in Junction City
| Property Taxes | Without Mortgage | With Mortgage |
| Less than $800 | 145 (9.5%) | 43 (1.5%) |
| $800 to $1,499 | 168 (11.0%) | 125 (4.3%) |
| $800 to $1,499 | 1,200 (78.3%) | 355 (12.1%) |
| Total | 1,532 (100.0%) | 2,925 (100.0%) |
Health & Disability in Junction City
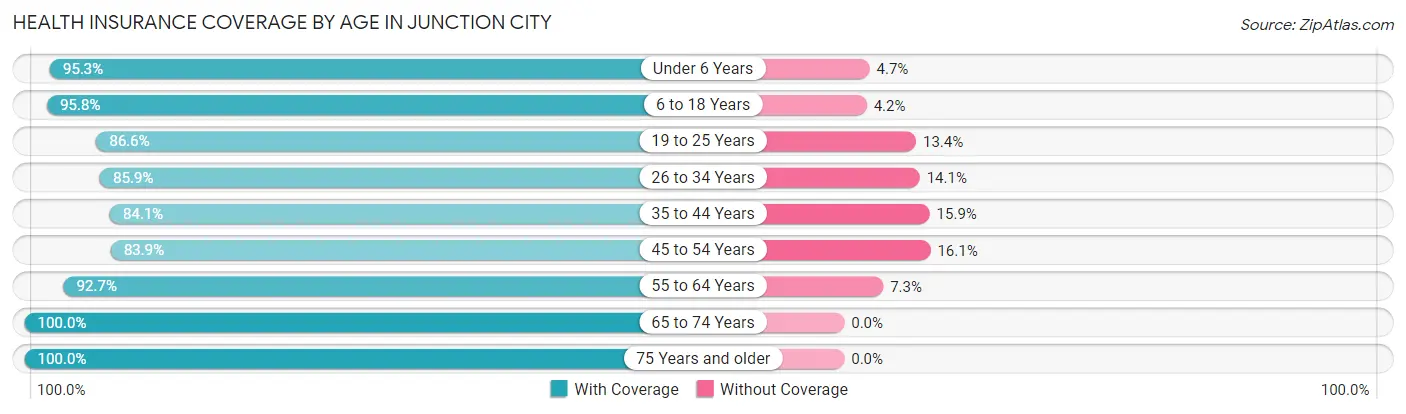
Health Insurance Coverage by Age in Junction City
| Age Bracket | With Coverage | Without Coverage |
| Under 6 Years | 2,420 (95.3%) | 120 (4.7%) |
| 6 to 18 Years | 4,307 (95.8%) | 188 (4.2%) |
| 19 to 25 Years | 2,098 (86.6%) | 324 (13.4%) |
| 26 to 34 Years | 2,998 (85.9%) | 491 (14.1%) |
| 35 to 44 Years | 1,922 (84.1%) | 364 (15.9%) |
| 45 to 54 Years | 1,583 (83.9%) | 303 (16.1%) |
| 55 to 64 Years | 1,470 (92.7%) | 115 (7.3%) |
| 65 to 74 Years | 1,269 (100.0%) | 0 (0.0%) |
| 75 Years and older | 935 (100.0%) | 0 (0.0%) |
| Total | 19,002 (90.9%) | 1,905 (9.1%) |
Health Insurance Coverage by Citizenship Status in Junction City
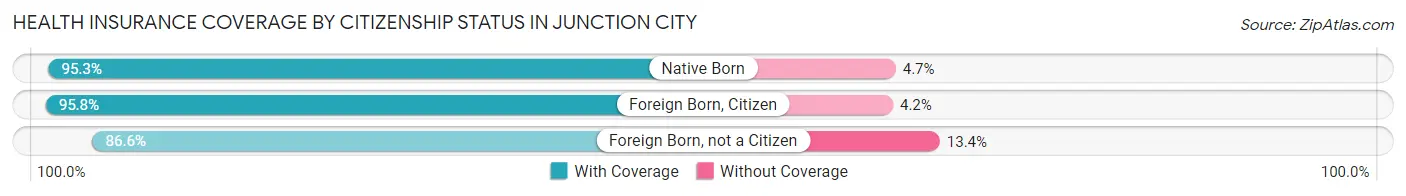
| Citizenship Status | With Coverage | Without Coverage |
| Native Born | 2,420 (95.3%) | 120 (4.7%) |
| Foreign Born, Citizen | 4,307 (95.8%) | 188 (4.2%) |
| Foreign Born, not a Citizen | 2,098 (86.6%) | 324 (13.4%) |
Health Insurance Coverage by Household Income in Junction City
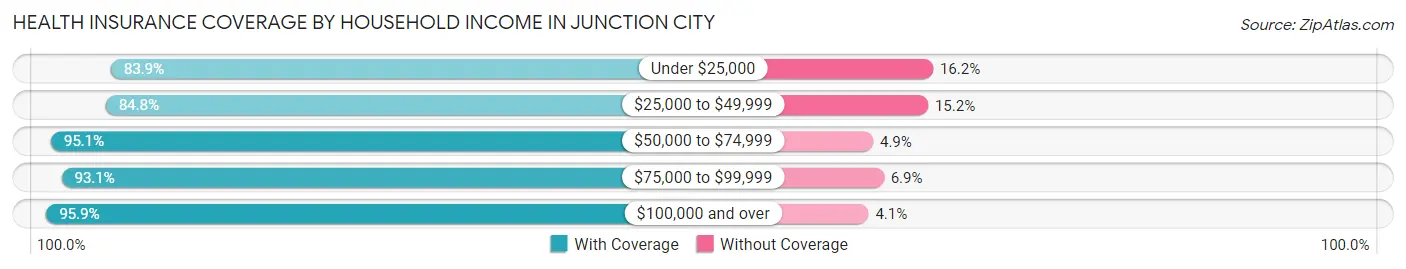
| Household Income | With Coverage | Without Coverage |
| Under $25,000 | 2,476 (83.9%) | 477 (16.2%) |
| $25,000 to $49,999 | 4,299 (84.8%) | 771 (15.2%) |
| $50,000 to $74,999 | 3,572 (95.1%) | 185 (4.9%) |
| $75,000 to $99,999 | 3,111 (93.1%) | 231 (6.9%) |
| $100,000 and over | 5,532 (95.9%) | 234 (4.1%) |
Public vs Private Health Insurance Coverage by Age in Junction City
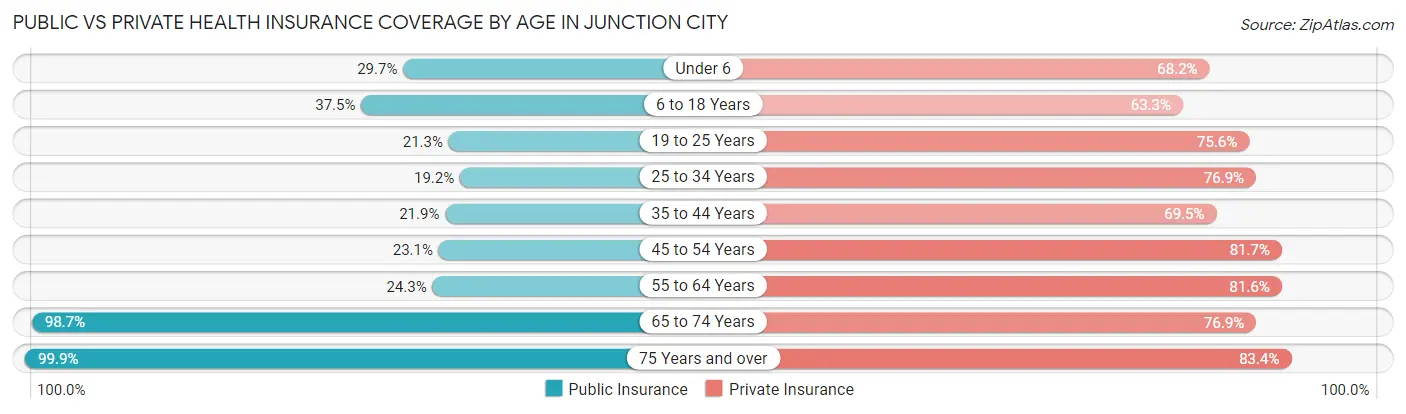
| Age Bracket | Public Insurance | Private Insurance |
| Under 6 | 755 (29.7%) | 1,733 (68.2%) |
| 6 to 18 Years | 1,686 (37.5%) | 2,845 (63.3%) |
| 19 to 25 Years | 515 (21.3%) | 1,831 (75.6%) |
| 25 to 34 Years | 669 (19.2%) | 2,682 (76.9%) |
| 35 to 44 Years | 501 (21.9%) | 1,589 (69.5%) |
| 45 to 54 Years | 436 (23.1%) | 1,540 (81.7%) |
| 55 to 64 Years | 385 (24.3%) | 1,294 (81.6%) |
| 65 to 74 Years | 1,252 (98.7%) | 976 (76.9%) |
| 75 Years and over | 934 (99.9%) | 780 (83.4%) |
| Total | 7,133 (34.1%) | 15,270 (73.0%) |
Disability Status by Sex by Age in Junction City
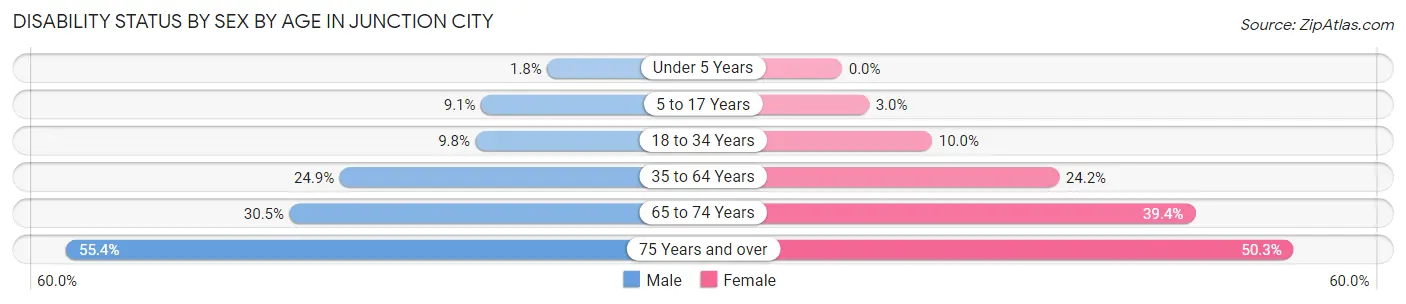
| Age Bracket | Male | Female |
| Under 5 Years | 18 (1.8%) | 0 (0.0%) |
| 5 to 17 Years | 233 (9.1%) | 61 (3.0%) |
| 18 to 34 Years | 320 (9.8%) | 309 (10.0%) |
| 35 to 64 Years | 680 (24.9%) | 731 (24.2%) |
| 65 to 74 Years | 152 (30.5%) | 303 (39.4%) |
| 75 Years and over | 247 (55.4%) | 246 (50.3%) |
Disability Class by Sex by Age in Junction City
Disability Class: Hearing Difficulty
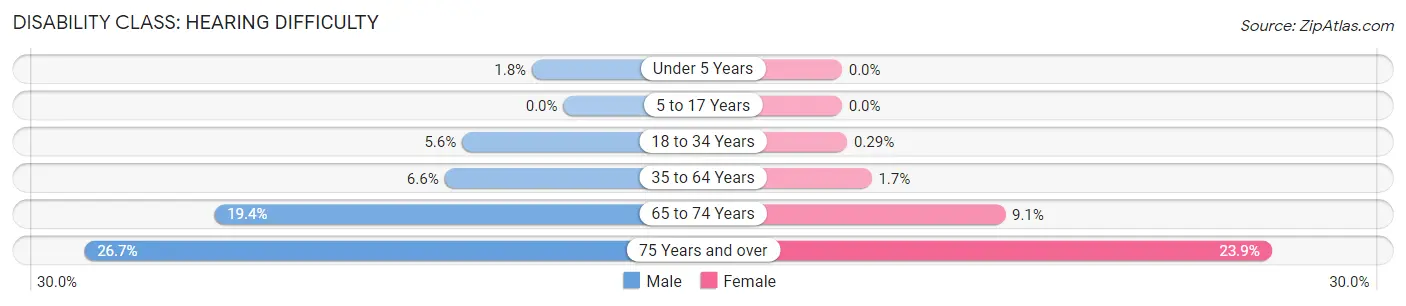
| Age Bracket | Male | Female |
| Under 5 Years | 18 (1.8%) | 0 (0.0%) |
| 5 to 17 Years | 0 (0.0%) | 0 (0.0%) |
| 18 to 34 Years | 185 (5.6%) | 9 (0.3%) |
| 35 to 64 Years | 181 (6.6%) | 50 (1.7%) |
| 65 to 74 Years | 97 (19.4%) | 70 (9.1%) |
| 75 Years and over | 119 (26.7%) | 117 (23.9%) |
Disability Class: Vision Difficulty
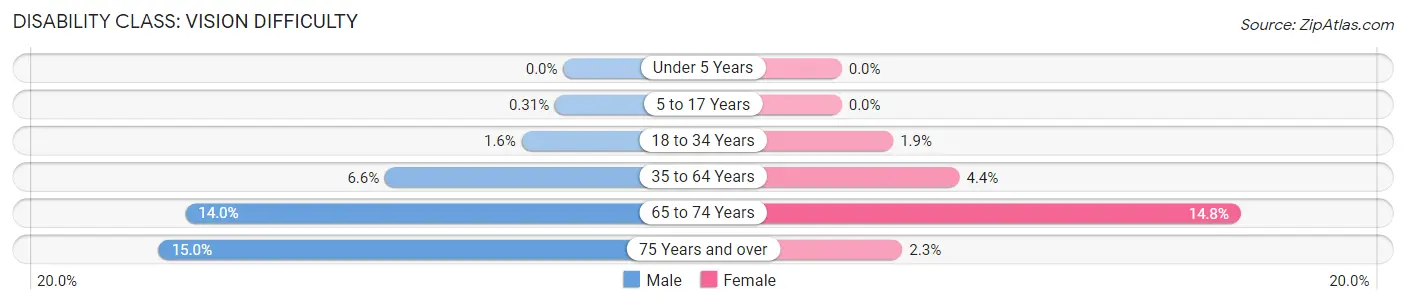
| Age Bracket | Male | Female |
| Under 5 Years | 0 (0.0%) | 0 (0.0%) |
| 5 to 17 Years | 8 (0.3%) | 0 (0.0%) |
| 18 to 34 Years | 51 (1.5%) | 59 (1.9%) |
| 35 to 64 Years | 181 (6.6%) | 132 (4.4%) |
| 65 to 74 Years | 70 (14.0%) | 114 (14.8%) |
| 75 Years and over | 67 (15.0%) | 11 (2.2%) |
Disability Class: Cognitive Difficulty
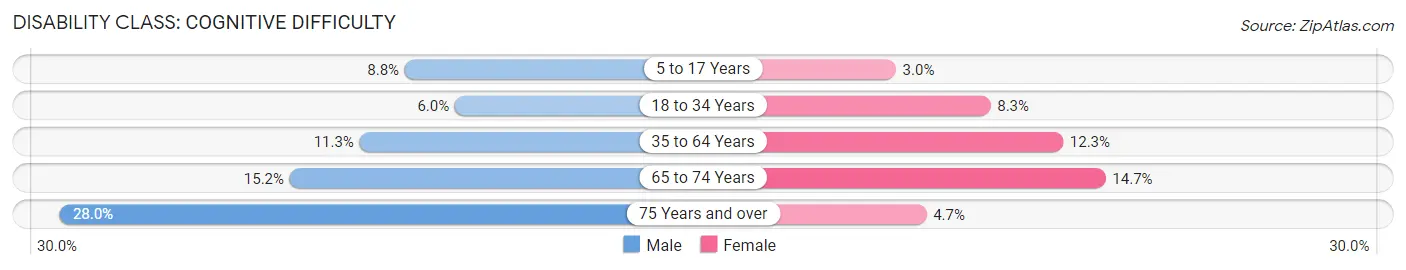
| Age Bracket | Male | Female |
| 5 to 17 Years | 225 (8.8%) | 61 (3.0%) |
| 18 to 34 Years | 198 (6.0%) | 255 (8.3%) |
| 35 to 64 Years | 310 (11.3%) | 372 (12.3%) |
| 65 to 74 Years | 76 (15.2%) | 113 (14.7%) |
| 75 Years and over | 125 (28.0%) | 23 (4.7%) |
Disability Class: Ambulatory Difficulty
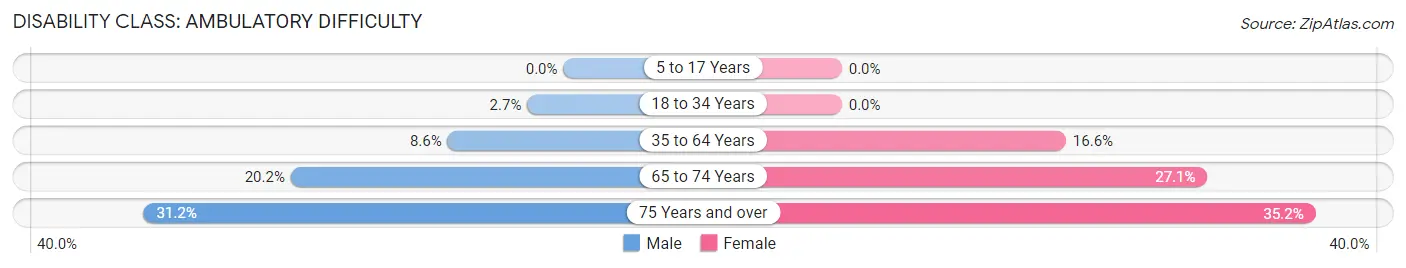
| Age Bracket | Male | Female |
| 5 to 17 Years | 0 (0.0%) | 0 (0.0%) |
| 18 to 34 Years | 88 (2.7%) | 0 (0.0%) |
| 35 to 64 Years | 235 (8.6%) | 503 (16.6%) |
| 65 to 74 Years | 101 (20.2%) | 209 (27.1%) |
| 75 Years and over | 139 (31.2%) | 172 (35.2%) |
Disability Class: Self-Care Difficulty
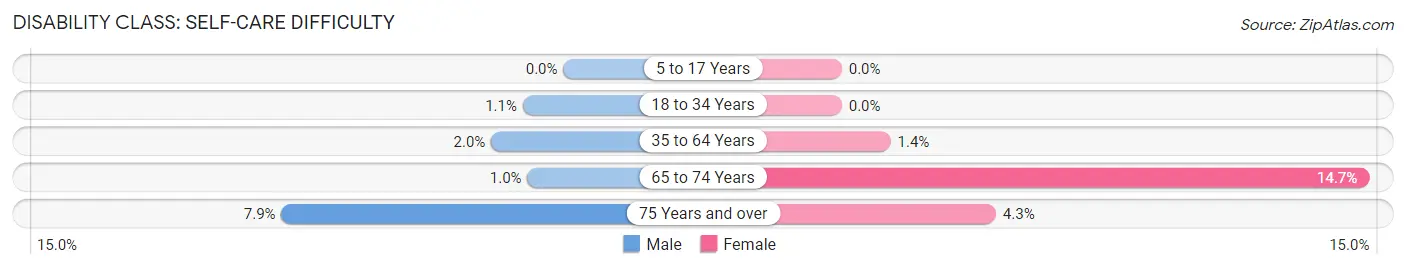
| Age Bracket | Male | Female |
| 5 to 17 Years | 0 (0.0%) | 0 (0.0%) |
| 18 to 34 Years | 37 (1.1%) | 0 (0.0%) |
| 35 to 64 Years | 55 (2.0%) | 41 (1.4%) |
| 65 to 74 Years | 5 (1.0%) | 113 (14.7%) |
| 75 Years and over | 35 (7.9%) | 21 (4.3%) |
Technology Access in Junction City
Computing Device Access in Junction City
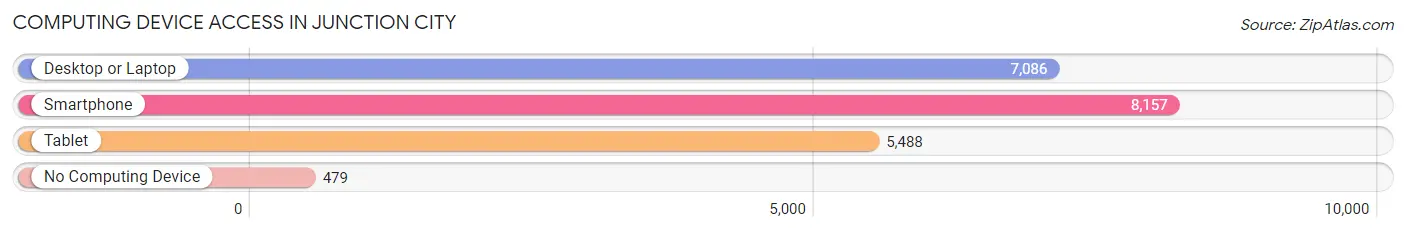
| Device Type | # Households | % Households |
| Desktop or Laptop | 7,086 | 79.0% |
| Smartphone | 8,157 | 90.9% |
| Tablet | 5,488 | 61.2% |
| No Computing Device | 479 | 5.3% |
| Total | 8,969 | 100.0% |
Internet Access in Junction City
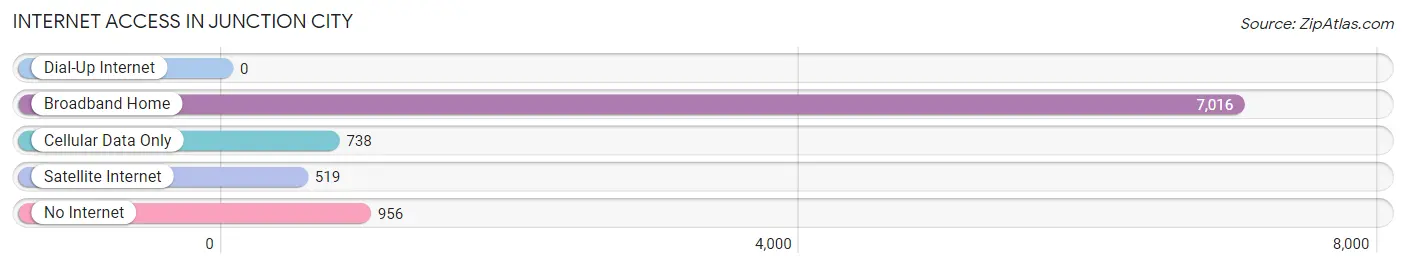
| Internet Type | # Households | % Households |
| Dial-Up Internet | 0 | 0.0% |
| Broadband Home | 7,016 | 78.2% |
| Cellular Data Only | 738 | 8.2% |
| Satellite Internet | 519 | 5.8% |
| No Internet | 956 | 10.7% |
| Total | 8,969 | 100.0% |
Junction City Summary
Junction City is a city located in Geary County, Kansas, United States. It is the county seat of Geary County and is located along the Republican River in the Flint Hills region of the state. As of the 2010 census, the city population was 23,353.
History
Junction City was founded in 1859 as a military post to protect travelers on the Oregon Trail. The post was named Camp Geary in honor of Brigadier General John W. Geary, the first governor of the Kansas Territory. In 1862, the post was renamed Fort Riley in honor of Major General Bennett C. Riley, who had served in the Mexican-American War.
In 1866, the fort was abandoned and the town of Junction City was established. The town was named for its location at the junction of the Republican and Smoky Hill rivers. The town quickly grew and by 1870, it had a population of 1,072.
In 1887, the Kansas Pacific Railway arrived in Junction City, connecting it to the rest of the state and the nation. This allowed the town to become a major shipping center for the region.
In the early 20th century, Junction City was a major stop on the Santa Fe Trail. The town was also home to a large military base, Fort Riley, which was established in 1917. The base has been a major employer in the area ever since.
Geography
Junction City is located at 39°3'25" North, 96°50'25" West (39.056944, -96.840278). According to the United States Census Bureau, the city has a total area of 11.2 square miles (29.0 km2), of which 11.1 square miles (28.7 km2) is land and 0.1 square miles (0.3 km2) is water.
Economy
Junction City is a major economic center for the region. The city is home to Fort Riley, a major military base, which is the largest employer in the area. Other major employers include the Geary County School District, Geary Community Hospital, and the city government.
The city is also home to several manufacturing companies, including a Tyson Foods plant, a Cargill plant, and a ConAgra plant. The city is also home to several retail stores, including Walmart, Target, and Lowe's.
Demographics
As of the 2010 census, there were 23,353 people, 8,845 households, and 5,945 families residing in the city. The population density was 2,097.3 people per square mile (808.7/km2). There were 9,717 housing units at an average density of 871.2 per square mile (336.3/km2). The racial makeup of the city was 73.2% White, 11.2% African American, 0.7% Native American, 2.2% Asian, 0.1% Pacific Islander, 9.7% from other races, and 3.5% from two or more races. Hispanic or Latino of any race were 17.7% of the population.
There were 8,845 households, out of which 33.2% had children under the age of 18 living with them, 46.2% were married couples living together, 14.2% had a female householder with no husband present, and 34.2% were non-families. 28.2% of all households were made up of individuals, and 9.2% had someone living alone who was 65 years of age or older. The average household size was 2.60 and the average family size was 3.17.
In the city, the population was spread out, with 27.2% under the age of 18, 11.2% from 18 to 24, 30.2% from 25 to 44, 20.2% from 45 to 64, and 11.2% who were 65 years of age or older. The median age was 32 years. For every 100 females, there were 103.2 males. For every 100 females age 18 and over, there were 101.7 males.
The median income for a household in the city was $37,845, and the median income for a family was $45,945. Males had a median income of $31,945 versus $23,945 for females. The per capita income for the city was $18,945. About 9.2% of families and 11.2% of the population were below the poverty line, including 14.2% of those under age 18 and 8.2% of those age 65 or over.
Common Questions
What is Per Capita Income in Junction City?
Per Capita income in Junction City is $28,075.
What is the Median Family Income in Junction City?
Median Family Income in Junction City is $68,362.
What is the Median Household income in Junction City?
Median Household Income in Junction City is $60,709.
What is Income or Wage Gap in Junction City?
Income or Wage Gap in Junction City is 34.2%.
Women in Junction City earn 65.8 cents for every dollar earned by a man.
What is Family Income Deficit in Junction City?
Family Income Deficit in Junction City is $10,102.
Families that are below poverty line in Junction City earn $10,102 less on average than the poverty threshold level.
What is Inequality or Gini Index in Junction City?
Inequality or Gini Index in Junction City is 0.38.
What is the Total Population of Junction City?
Total Population of Junction City is 22,738.
What is the Total Male Population of Junction City?
Total Male Population of Junction City is 12,078.
What is the Total Female Population of Junction City?
Total Female Population of Junction City is 10,660.
What is the Ratio of Males per 100 Females in Junction City?
There are 113.30 Males per 100 Females in Junction City.
What is the Ratio of Females per 100 Males in Junction City?
There are 88.26 Females per 100 Males in Junction City.
What is the Median Population Age in Junction City?
Median Population Age in Junction City is 28.5 Years.
What is the Average Family Size in Junction City
Average Family Size in Junction City is 3.0 People.
What is the Average Household Size in Junction City
Average Household Size in Junction City is 2.5 People.
How Large is the Labor Force in Junction City?
There are 11,964 People in the Labor Forcein in Junction City.
What is the Percentage of People in the Labor Force in Junction City?
71.8% of People are in the Labor Force in Junction City.
What is the Unemployment Rate in Junction City?
Unemployment Rate in Junction City is 4.4%.