Jetmore, KS Map & Demographics
Jetmore Map
Jetmore Overview
$31,485
PER CAPITA INCOME
$84,531
AVG FAMILY INCOME
$67,885
AVG HOUSEHOLD INCOME
27.8%
WAGE / INCOME GAP [ % ]
72.2¢/ $1
WAGE / INCOME GAP [ $ ]
0.39
INEQUALITY / GINI INDEX
708
TOTAL POPULATION
345
MALE POPULATION
363
FEMALE POPULATION
95.04
MALES / 100 FEMALES
105.22
FEMALES / 100 MALES
41.3
MEDIAN AGE
3.2
AVG FAMILY SIZE
2.5
AVG HOUSEHOLD SIZE
362
LABOR FORCE [ PEOPLE ]
62.0%
PERCENT IN LABOR FORCE
1.4%
UNEMPLOYMENT RATE
Jetmore Zip Codes
Jetmore Area Codes
Income in Jetmore
Income Overview in Jetmore
Per Capita Income in Jetmore is $31,485, while median incomes of families and households are $84,531 and $67,885 respectively.
| Characteristic | Number | Measure |
| Per Capita Income | 708 | $31,485 |
| Median Family Income | 181 | $84,531 |
| Mean Family Income | 181 | $99,122 |
| Median Household Income | 280 | $67,885 |
| Mean Household Income | 280 | $77,695 |
| Income Deficit | 181 | $0 |
| Wage / Income Gap (%) | 708 | 27.75% |
| Wage / Income Gap ($) | 708 | 72.25¢ per $1 |
| Gini / Inequality Index | 708 | 0.39 |
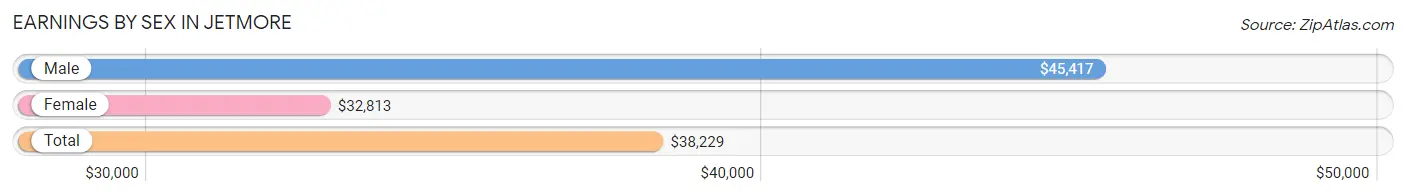
Earnings by Sex in Jetmore
Average Earnings in Jetmore are $38,229, $45,417 for men and $32,813 for women, a difference of 27.8%.
| Sex | Number | Average Earnings |
| Male | 192 (50.4%) | $45,417 |
| Female | 189 (49.6%) | $32,813 |
| Total | 381 (100.0%) | $38,229 |
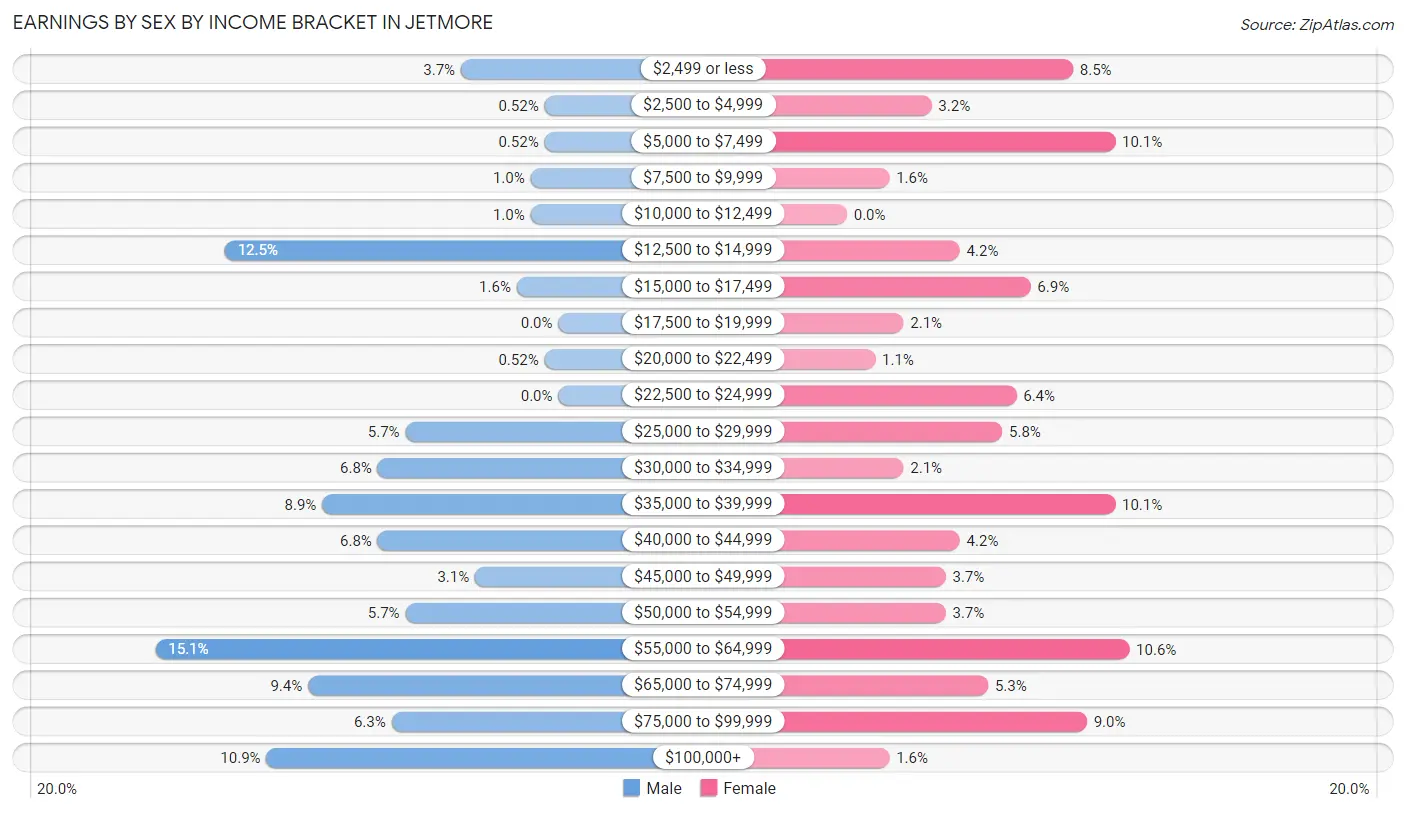
Earnings by Sex by Income Bracket in Jetmore
The most common earnings brackets in Jetmore are $55,000 to $64,999 for men (29 | 15.1%) and $55,000 to $64,999 for women (20 | 10.6%).
| Income | Male | Female |
| $2,499 or less | 7 (3.6%) | 16 (8.5%) |
| $2,500 to $4,999 | 1 (0.5%) | 6 (3.2%) |
| $5,000 to $7,499 | 1 (0.5%) | 19 (10.1%) |
| $7,500 to $9,999 | 2 (1.0%) | 3 (1.6%) |
| $10,000 to $12,499 | 2 (1.0%) | 0 (0.0%) |
| $12,500 to $14,999 | 24 (12.5%) | 8 (4.2%) |
| $15,000 to $17,499 | 3 (1.6%) | 13 (6.9%) |
| $17,500 to $19,999 | 0 (0.0%) | 4 (2.1%) |
| $20,000 to $22,499 | 1 (0.5%) | 2 (1.1%) |
| $22,500 to $24,999 | 0 (0.0%) | 12 (6.4%) |
| $25,000 to $29,999 | 11 (5.7%) | 11 (5.8%) |
| $30,000 to $34,999 | 13 (6.8%) | 4 (2.1%) |
| $35,000 to $39,999 | 17 (8.8%) | 19 (10.1%) |
| $40,000 to $44,999 | 13 (6.8%) | 8 (4.2%) |
| $45,000 to $49,999 | 6 (3.1%) | 7 (3.7%) |
| $50,000 to $54,999 | 11 (5.7%) | 7 (3.7%) |
| $55,000 to $64,999 | 29 (15.1%) | 20 (10.6%) |
| $65,000 to $74,999 | 18 (9.4%) | 10 (5.3%) |
| $75,000 to $99,999 | 12 (6.2%) | 17 (9.0%) |
| $100,000+ | 21 (10.9%) | 3 (1.6%) |
| Total | 192 (100.0%) | 189 (100.0%) |
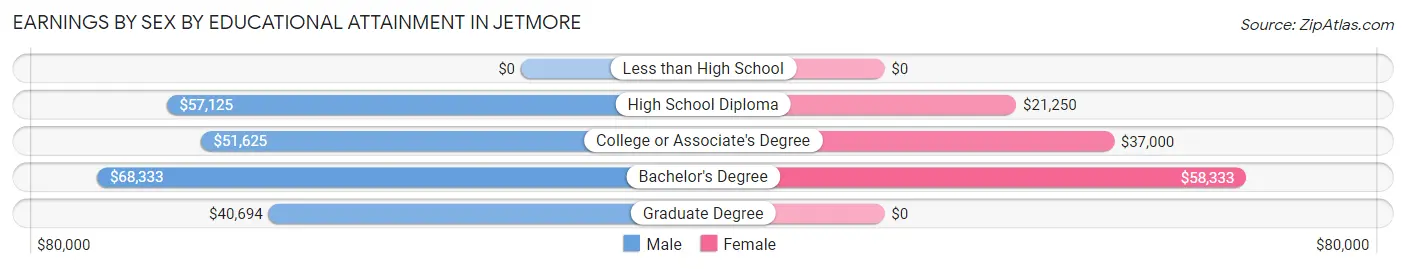
Earnings by Sex by Educational Attainment in Jetmore
Average earnings in Jetmore are $55,417 for men and $39,792 for women, a difference of 28.2%. Men with an educational attainment of bachelor's degree enjoy the highest average annual earnings of $68,333, while those with graduate degree education earn the least with $40,694. Women with an educational attainment of bachelor's degree earn the most with the average annual earnings of $58,333, while those with high school diploma education have the smallest earnings of $21,250.
| Educational Attainment | Male Income | Female Income |
| Less than High School | - | - |
| High School Diploma | $57,125 | $21,250 |
| College or Associate's Degree | $51,625 | $37,000 |
| Bachelor's Degree | $68,333 | $58,333 |
| Graduate Degree | $40,694 | $0 |
| Total | $55,417 | $39,792 |
Family Income in Jetmore
Family Income Brackets in Jetmore
According to the Jetmore family income data, there are 50 families falling into the $100,000 to $149,999 income range, which is the most common income bracket and makes up 27.6% of all families.
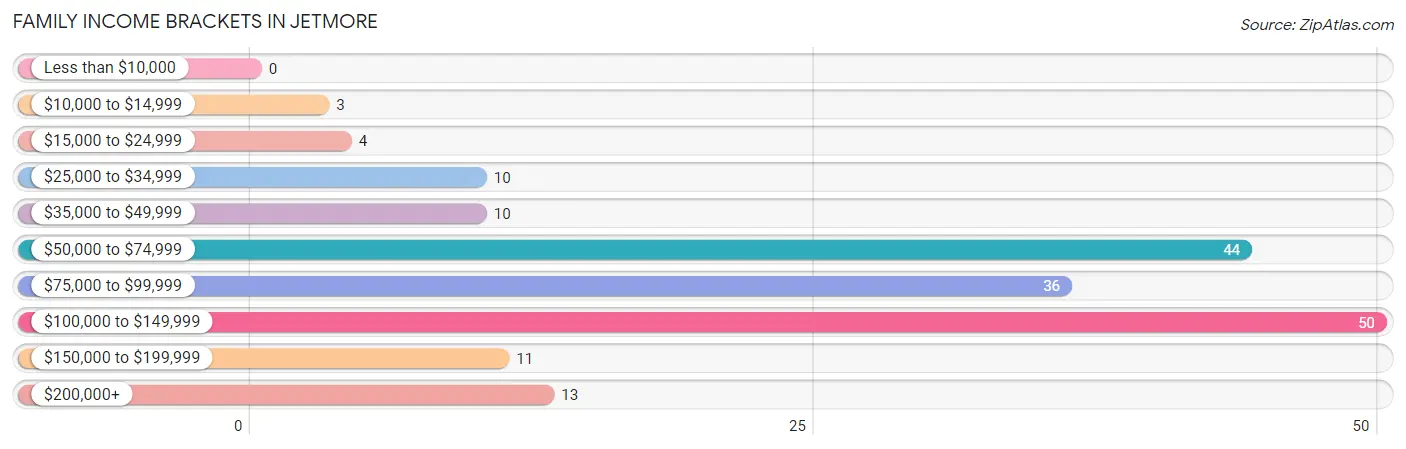
| Income Bracket | # Families | % Families |
| Less than $10,000 | 0 | 0.0% |
| $10,000 to $14,999 | 3 | 1.7% |
| $15,000 to $24,999 | 4 | 2.2% |
| $25,000 to $34,999 | 10 | 5.5% |
| $35,000 to $49,999 | 10 | 5.5% |
| $50,000 to $74,999 | 44 | 24.3% |
| $75,000 to $99,999 | 36 | 19.9% |
| $100,000 to $149,999 | 50 | 27.6% |
| $150,000 to $199,999 | 11 | 6.1% |
| $200,000+ | 13 | 7.2% |
Family Income by Famaliy Size in Jetmore
5-person families (8 | 4.4%) account for the highest median family income in Jetmore with $191,667 per family, while 2-person families (87 | 48.1%) have the highest median income of $42,422 per family member.
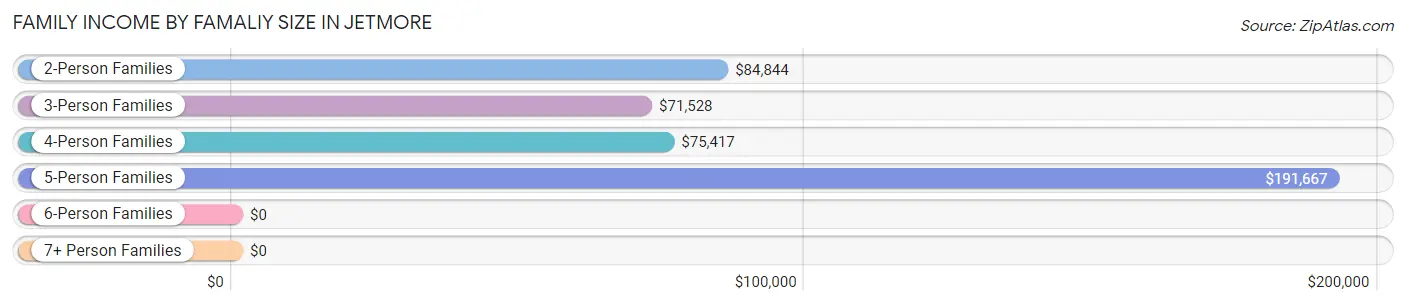
| Income Bracket | # Families | Median Income |
| 2-Person Families | 87 (48.1%) | $84,844 |
| 3-Person Families | 43 (23.8%) | $71,528 |
| 4-Person Families | 32 (17.7%) | $75,417 |
| 5-Person Families | 8 (4.4%) | $191,667 |
| 6-Person Families | 11 (6.1%) | $0 |
| 7+ Person Families | 0 (0.0%) | $0 |
| Total | 181 (100.0%) | $84,531 |
Family Income by Number of Earners in Jetmore
The median family income in Jetmore is $84,531, with families comprising 3+ earners (33) having the highest median family income of $145,341, while families with no earners (18) have the lowest median family income of $64,167, accounting for 18.2% and 9.9% of families, respectively.
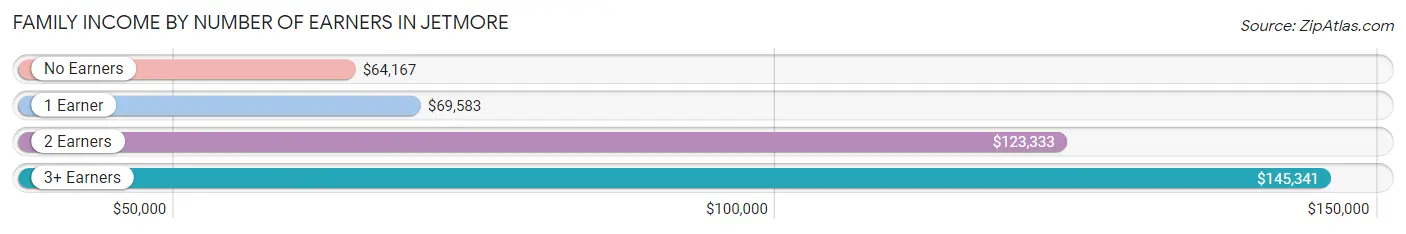
| Number of Earners | # Families | Median Income |
| No Earners | 18 (9.9%) | $64,167 |
| 1 Earner | 48 (26.5%) | $69,583 |
| 2 Earners | 82 (45.3%) | $123,333 |
| 3+ Earners | 33 (18.2%) | $145,341 |
| Total | 181 (100.0%) | $84,531 |
Household Income in Jetmore
Household Income Brackets in Jetmore
With 60 households falling in the category, the $100,000 to $149,999 income range is the most frequent in Jetmore, accounting for 21.4% of all households. In contrast, only 4 households (1.4%) fall into the $10,000 to $14,999 income bracket, making it the least populous group.
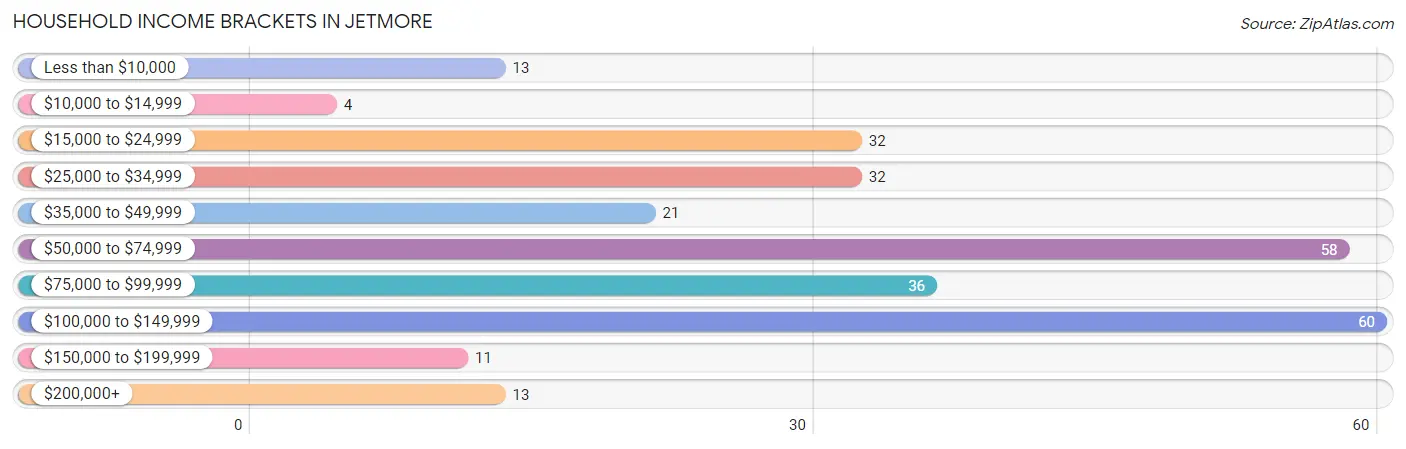
| Income Bracket | # Households | % Households |
| Less than $10,000 | 13 | 4.6% |
| $10,000 to $14,999 | 4 | 1.4% |
| $15,000 to $24,999 | 32 | 11.4% |
| $25,000 to $34,999 | 32 | 11.4% |
| $35,000 to $49,999 | 21 | 7.5% |
| $50,000 to $74,999 | 58 | 20.7% |
| $75,000 to $99,999 | 36 | 12.9% |
| $100,000 to $149,999 | 60 | 21.4% |
| $150,000 to $199,999 | 11 | 3.9% |
| $200,000+ | 13 | 4.6% |
Household Income by Householder Age in Jetmore
The median household income in Jetmore is $67,885, with the highest median household income of $99,167 found in the 25 to 44 years age bracket for the primary householder. A total of 76 households (27.1%) fall into this category. Meanwhile, the 15 to 24 years age bracket for the primary householder has the lowest median household income of $0, with 10 households (3.6%) in this group.
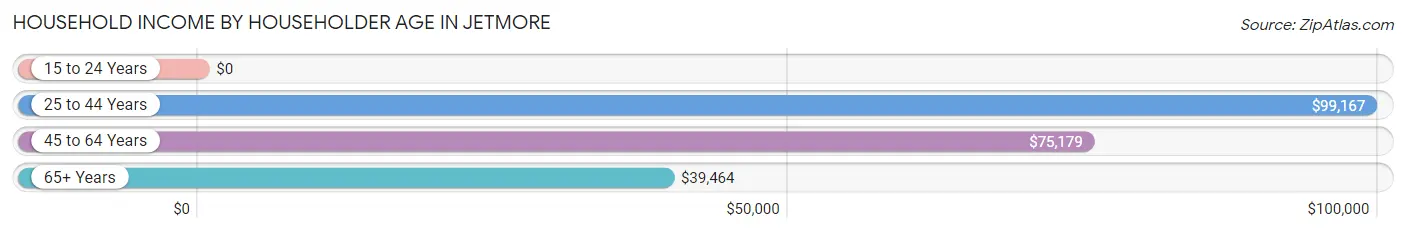
| Income Bracket | # Households | Median Income |
| 15 to 24 Years | 10 (3.6%) | $0 |
| 25 to 44 Years | 76 (27.1%) | $99,167 |
| 45 to 64 Years | 103 (36.8%) | $75,179 |
| 65+ Years | 91 (32.5%) | $39,464 |
| Total | 280 (100.0%) | $67,885 |
Poverty in Jetmore
Income Below Poverty by Sex and Age in Jetmore
With 6.2% poverty level for males and 7.8% for females among the residents of Jetmore, 45 to 54 year old males and 35 to 44 year old females are the most vulnerable to poverty, with 7 males (22.6%) and 6 females (20.7%) in their respective age groups living below the poverty level.
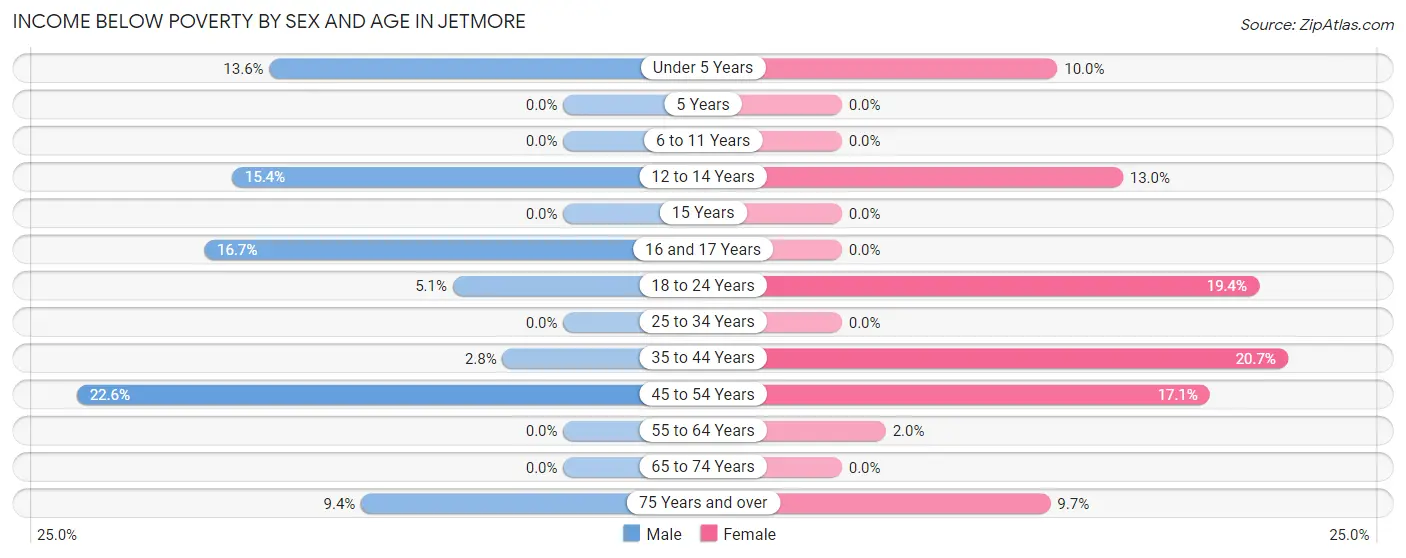
| Age Bracket | Male | Female |
| Under 5 Years | 3 (13.6%) | 1 (10.0%) |
| 5 Years | 0 (0.0%) | 0 (0.0%) |
| 6 to 11 Years | 0 (0.0%) | 0 (0.0%) |
| 12 to 14 Years | 2 (15.4%) | 3 (13.0%) |
| 15 Years | 0 (0.0%) | 0 (0.0%) |
| 16 and 17 Years | 2 (16.7%) | 0 (0.0%) |
| 18 to 24 Years | 2 (5.1%) | 6 (19.4%) |
| 25 to 34 Years | 0 (0.0%) | 0 (0.0%) |
| 35 to 44 Years | 2 (2.8%) | 6 (20.7%) |
| 45 to 54 Years | 7 (22.6%) | 7 (17.1%) |
| 55 to 64 Years | 0 (0.0%) | 1 (2.0%) |
| 65 to 74 Years | 0 (0.0%) | 0 (0.0%) |
| 75 Years and over | 3 (9.4%) | 3 (9.7%) |
| Total | 21 (6.2%) | 27 (7.8%) |
Income Above Poverty by Sex and Age in Jetmore
According to the poverty statistics in Jetmore, males aged 5 years and females aged 5 years are the age groups that are most secure financially, with 100.0% of males and 100.0% of females in these age groups living above the poverty line.
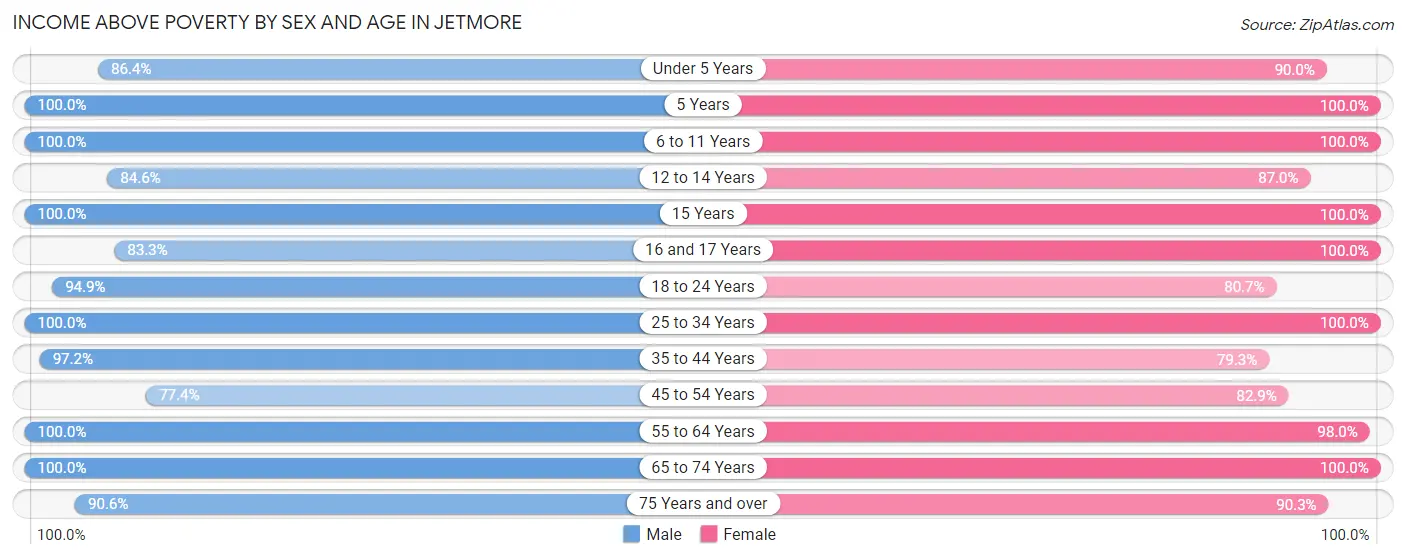
| Age Bracket | Male | Female |
| Under 5 Years | 19 (86.4%) | 9 (90.0%) |
| 5 Years | 3 (100.0%) | 10 (100.0%) |
| 6 to 11 Years | 8 (100.0%) | 24 (100.0%) |
| 12 to 14 Years | 11 (84.6%) | 20 (87.0%) |
| 15 Years | 5 (100.0%) | 6 (100.0%) |
| 16 and 17 Years | 10 (83.3%) | 25 (100.0%) |
| 18 to 24 Years | 37 (94.9%) | 25 (80.6%) |
| 25 to 34 Years | 17 (100.0%) | 36 (100.0%) |
| 35 to 44 Years | 69 (97.2%) | 23 (79.3%) |
| 45 to 54 Years | 24 (77.4%) | 34 (82.9%) |
| 55 to 64 Years | 45 (100.0%) | 48 (98.0%) |
| 65 to 74 Years | 39 (100.0%) | 33 (100.0%) |
| 75 Years and over | 29 (90.6%) | 28 (90.3%) |
| Total | 316 (93.8%) | 321 (92.2%) |
Income Below Poverty Among Married-Couple Families in Jetmore
The poverty statistics for married-couple families in Jetmore show that 2.5% or 4 of the total 162 families live below the poverty line. Families with 1 or 2 children have the highest poverty rate of 8.2%, comprising of 4 families. On the other hand, families with no children have the lowest poverty rate of 0.0%, which includes 0 families.
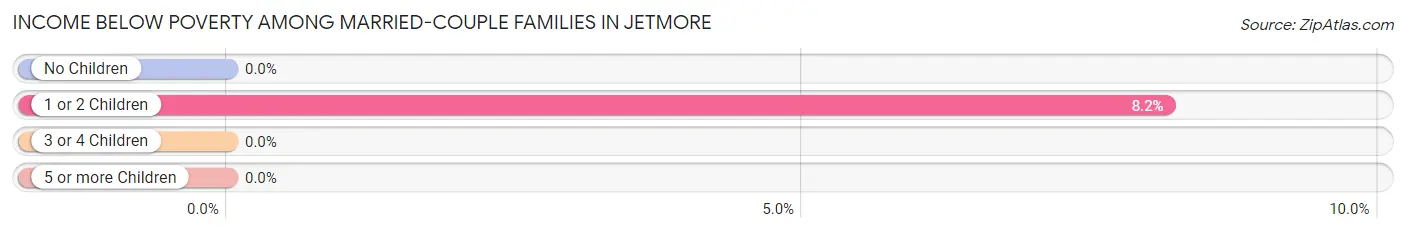
| Children | Above Poverty | Below Poverty |
| No Children | 96 (100.0%) | 0 (0.0%) |
| 1 or 2 Children | 45 (91.8%) | 4 (8.2%) |
| 3 or 4 Children | 17 (100.0%) | 0 (0.0%) |
| 5 or more Children | 0 (0.0%) | 0 (0.0%) |
| Total | 158 (97.5%) | 4 (2.5%) |
Income Below Poverty Among Single-Parent Households in Jetmore
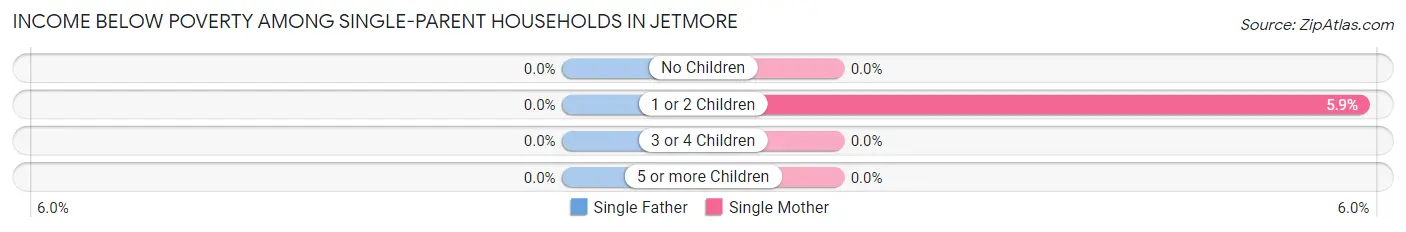
| Children | Single Father | Single Mother |
| No Children | 0 (0.0%) | 0 (0.0%) |
| 1 or 2 Children | 0 (0.0%) | 1 (5.9%) |
| 3 or 4 Children | 0 (0.0%) | 0 (0.0%) |
| 5 or more Children | 0 (0.0%) | 0 (0.0%) |
| Total | 0 (0.0%) | 1 (5.3%) |
Income Below Poverty Among Married-Couple vs Single-Parent Households in Jetmore
The poverty data for Jetmore shows that 4 of the married-couple family households (2.5%) and 1 of the single-parent households (5.3%) are living below the poverty level. Within the married-couple family households, those with 1 or 2 children have the highest poverty rate, with 4 households (8.2%) falling below the poverty line. Among the single-parent households, those with 1 or 2 children have the highest poverty rate, with 1 household (5.9%) living below poverty.
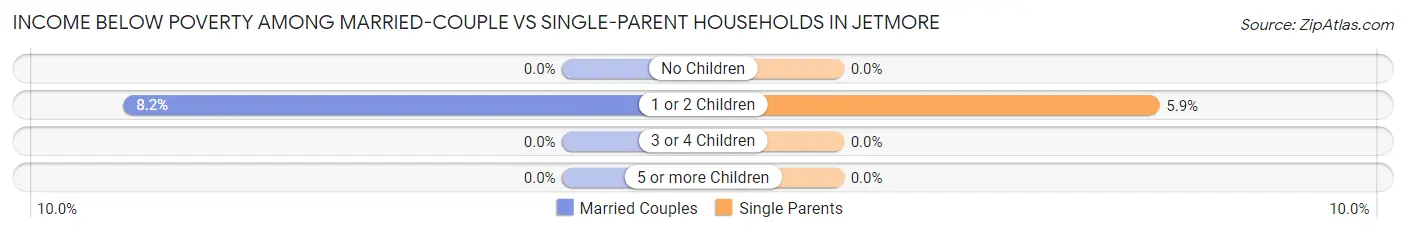
| Children | Married-Couple Families | Single-Parent Households |
| No Children | 0 (0.0%) | 0 (0.0%) |
| 1 or 2 Children | 4 (8.2%) | 1 (5.9%) |
| 3 or 4 Children | 0 (0.0%) | 0 (0.0%) |
| 5 or more Children | 0 (0.0%) | 0 (0.0%) |
| Total | 4 (2.5%) | 1 (5.3%) |
Race in Jetmore
The most populous races in Jetmore are White / Caucasian (687 | 97.0%), Hispanic or Latino (39 | 5.5%), and Two or more Races (19 | 2.7%).
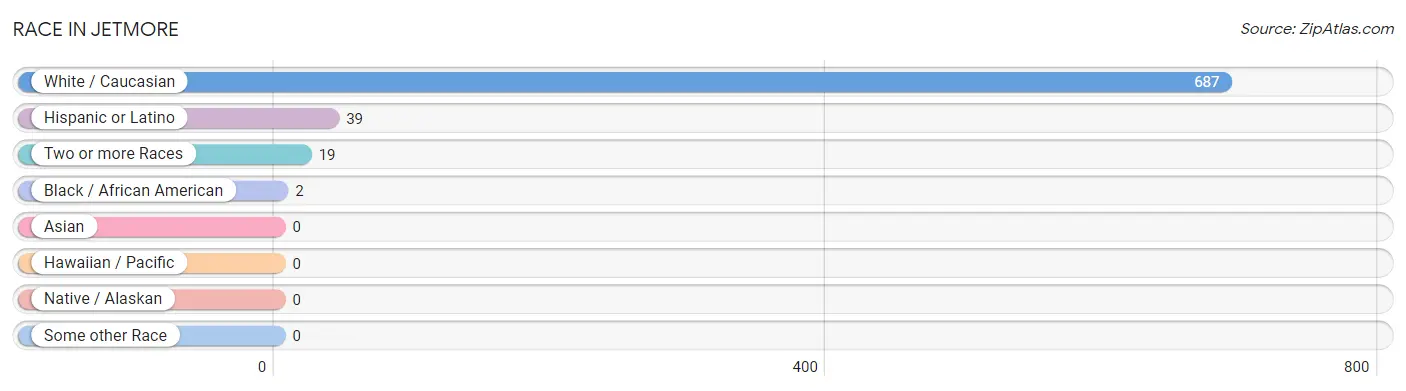
| Race | # Population | % Population |
| Asian | 0 | 0.0% |
| Black / African American | 2 | 0.3% |
| Hawaiian / Pacific | 0 | 0.0% |
| Hispanic or Latino | 39 | 5.5% |
| Native / Alaskan | 0 | 0.0% |
| White / Caucasian | 687 | 97.0% |
| Two or more Races | 19 | 2.7% |
| Some other Race | 0 | 0.0% |
| Total | 708 | 100.0% |
Ancestry in Jetmore
The most populous ancestries reported in Jetmore are German (311 | 43.9%), Irish (132 | 18.6%), English (69 | 9.8%), Mexican (37 | 5.2%), and Polish (28 | 4.0%), together accounting for 81.5% of all Jetmore residents.
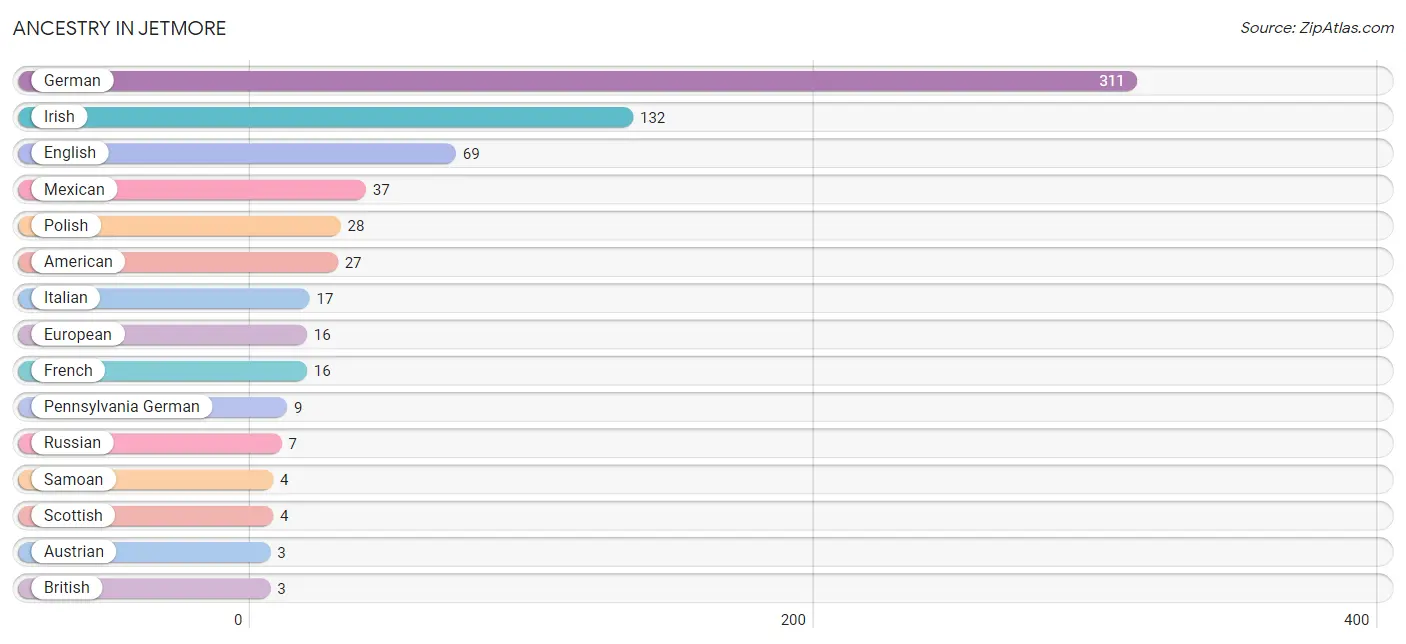
| Ancestry | # Population | % Population |
| American | 27 | 3.8% |
| Austrian | 3 | 0.4% |
| Belgian | 2 | 0.3% |
| British | 3 | 0.4% |
| Cherokee | 2 | 0.3% |
| Colombian | 2 | 0.3% |
| Czech | 1 | 0.1% |
| Dutch | 2 | 0.3% |
| English | 69 | 9.8% |
| European | 16 | 2.3% |
| French | 16 | 2.3% |
| German | 311 | 43.9% |
| Irish | 132 | 18.6% |
| Italian | 17 | 2.4% |
| Mexican | 37 | 5.2% |
| Pennsylvania German | 9 | 1.3% |
| Polish | 28 | 4.0% |
| Russian | 7 | 1.0% |
| Samoan | 4 | 0.6% |
| Scandinavian | 3 | 0.4% |
| Scotch-Irish | 2 | 0.3% |
| Scottish | 4 | 0.6% |
| South American | 2 | 0.3% |
| Welsh | 2 | 0.3% | View All 24 Rows |
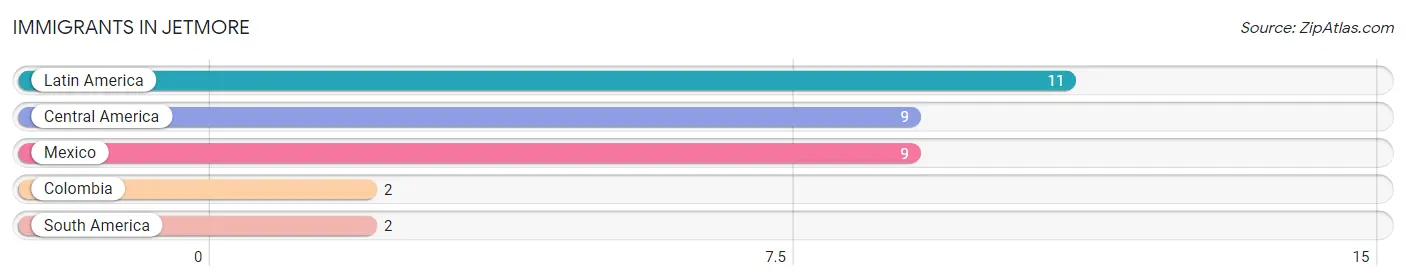
Immigrants in Jetmore
The most numerous immigrant groups reported in Jetmore came from Latin America (11 | 1.5%), Central America (9 | 1.3%), Mexico (9 | 1.3%), Colombia (2 | 0.3%), and South America (2 | 0.3%), together accounting for 4.6% of all Jetmore residents.
| Immigration Origin | # Population | % Population |
| Central America | 9 | 1.3% |
| Colombia | 2 | 0.3% |
| Latin America | 11 | 1.5% |
| Mexico | 9 | 1.3% |
| South America | 2 | 0.3% | View All 5 Rows |
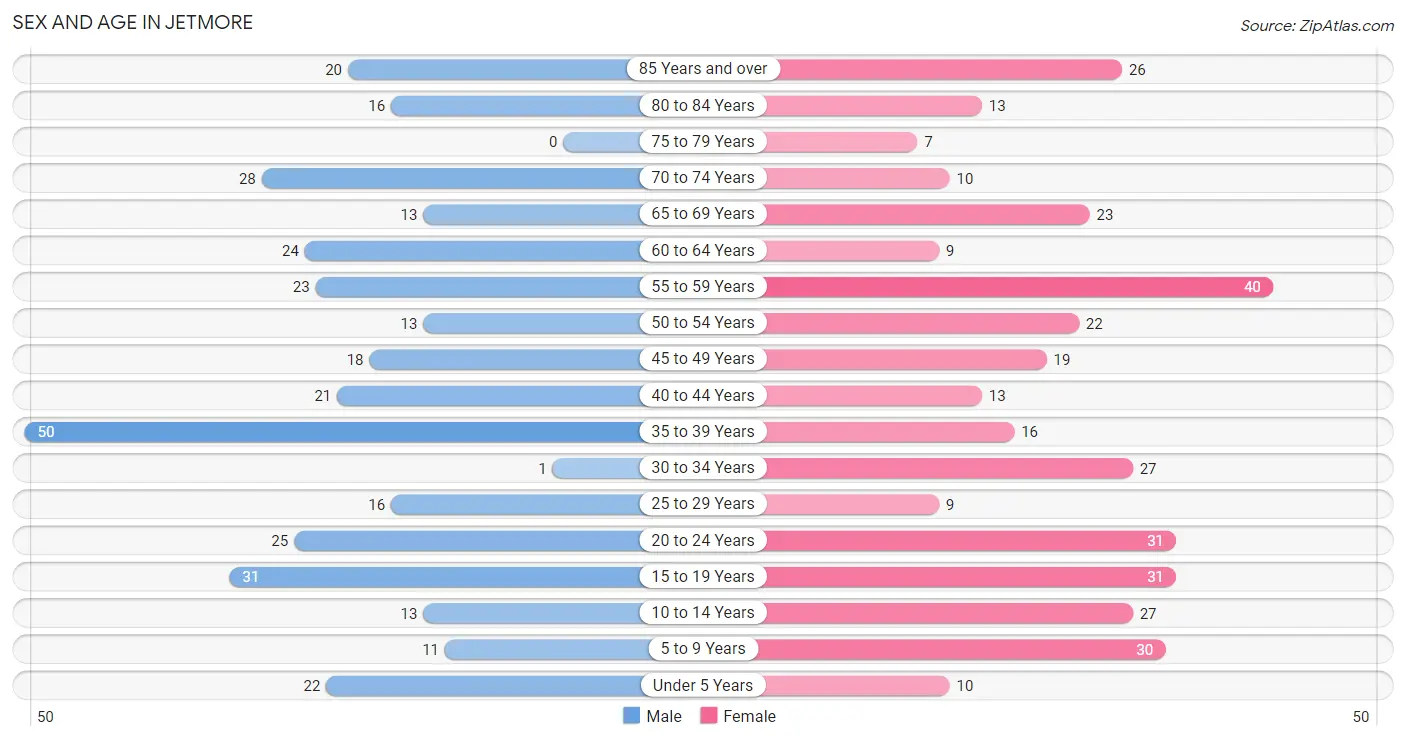
Sex and Age in Jetmore
Sex and Age in Jetmore
The most populous age groups in Jetmore are 35 to 39 Years (50 | 14.5%) for men and 55 to 59 Years (40 | 11.0%) for women.
| Age Bracket | Male | Female |
| Under 5 Years | 22 (6.4%) | 10 (2.8%) |
| 5 to 9 Years | 11 (3.2%) | 30 (8.3%) |
| 10 to 14 Years | 13 (3.8%) | 27 (7.4%) |
| 15 to 19 Years | 31 (9.0%) | 31 (8.5%) |
| 20 to 24 Years | 25 (7.2%) | 31 (8.5%) |
| 25 to 29 Years | 16 (4.6%) | 9 (2.5%) |
| 30 to 34 Years | 1 (0.3%) | 27 (7.4%) |
| 35 to 39 Years | 50 (14.5%) | 16 (4.4%) |
| 40 to 44 Years | 21 (6.1%) | 13 (3.6%) |
| 45 to 49 Years | 18 (5.2%) | 19 (5.2%) |
| 50 to 54 Years | 13 (3.8%) | 22 (6.1%) |
| 55 to 59 Years | 23 (6.7%) | 40 (11.0%) |
| 60 to 64 Years | 24 (7.0%) | 9 (2.5%) |
| 65 to 69 Years | 13 (3.8%) | 23 (6.3%) |
| 70 to 74 Years | 28 (8.1%) | 10 (2.8%) |
| 75 to 79 Years | 0 (0.0%) | 7 (1.9%) |
| 80 to 84 Years | 16 (4.6%) | 13 (3.6%) |
| 85 Years and over | 20 (5.8%) | 26 (7.2%) |
| Total | 345 (100.0%) | 363 (100.0%) |
Families and Households in Jetmore
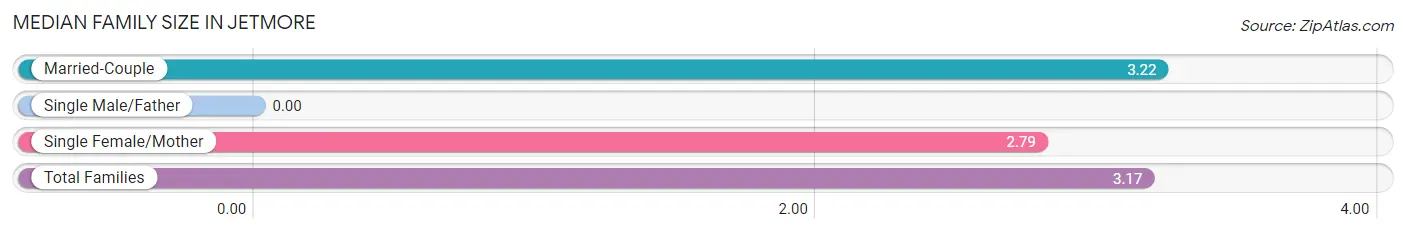
Median Family Size in Jetmore
| Family Type | # Families | Family Size |
| Married-Couple | 162 (89.5%) | 3.22 |
| Single Male/Father | 0 (0.0%) | - |
| Single Female/Mother | 19 (10.5%) | 2.79 |
| Total Families | 181 (100.0%) | 3.17 |
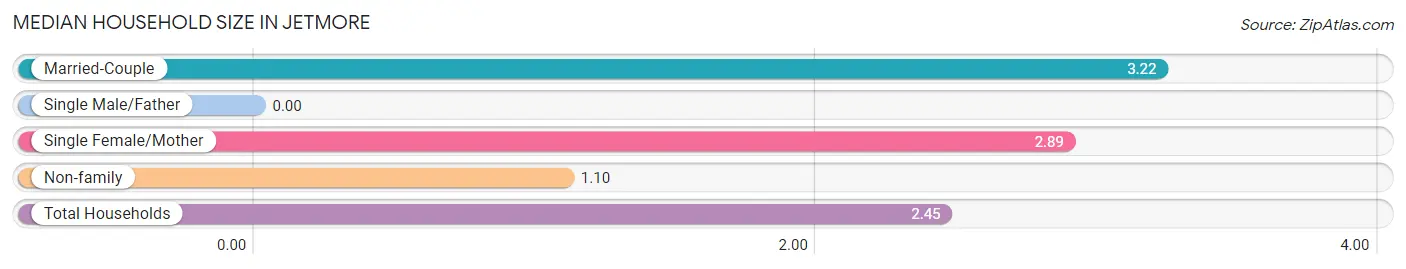
Median Household Size in Jetmore
| Household Type | # Households | Household Size |
| Married-Couple | 162 (57.9%) | 3.22 |
| Single Male/Father | 0 (0.0%) | - |
| Single Female/Mother | 19 (6.8%) | 2.89 |
| Non-family | 99 (35.4%) | 1.10 |
| Total Households | 280 (100.0%) | 2.45 |
Household Size by Marriage Status in Jetmore
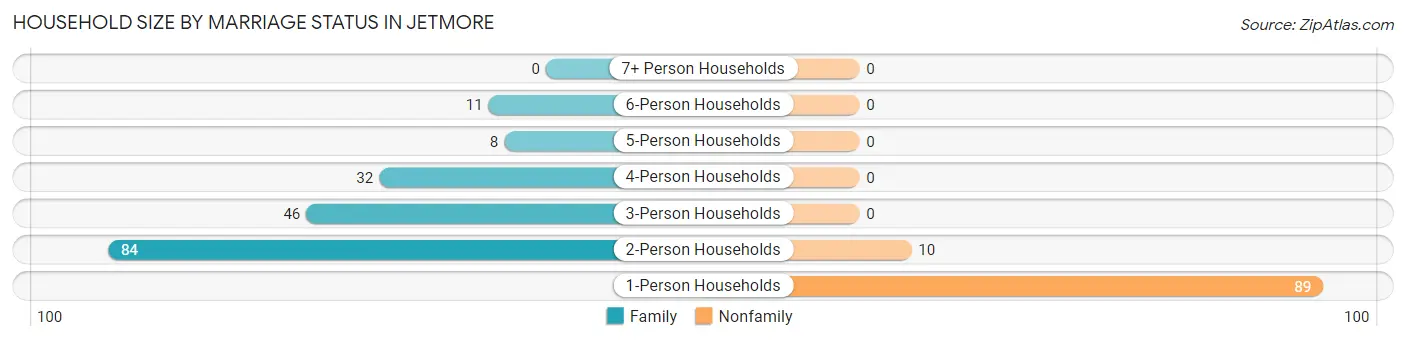
Out of a total of 280 households in Jetmore, 181 (64.6%) are family households, while 99 (35.4%) are nonfamily households. The most numerous type of family households are 2-person households, comprising 84, and the most common type of nonfamily households are 1-person households, comprising 89.
| Household Size | Family Households | Nonfamily Households |
| 1-Person Households | - | 89 (31.8%) |
| 2-Person Households | 84 (30.0%) | 10 (3.6%) |
| 3-Person Households | 46 (16.4%) | 0 (0.0%) |
| 4-Person Households | 32 (11.4%) | 0 (0.0%) |
| 5-Person Households | 8 (2.9%) | 0 (0.0%) |
| 6-Person Households | 11 (3.9%) | 0 (0.0%) |
| 7+ Person Households | 0 (0.0%) | 0 (0.0%) |
| Total | 181 (64.6%) | 99 (35.4%) |
Female Fertility in Jetmore
Fertility by Age in Jetmore
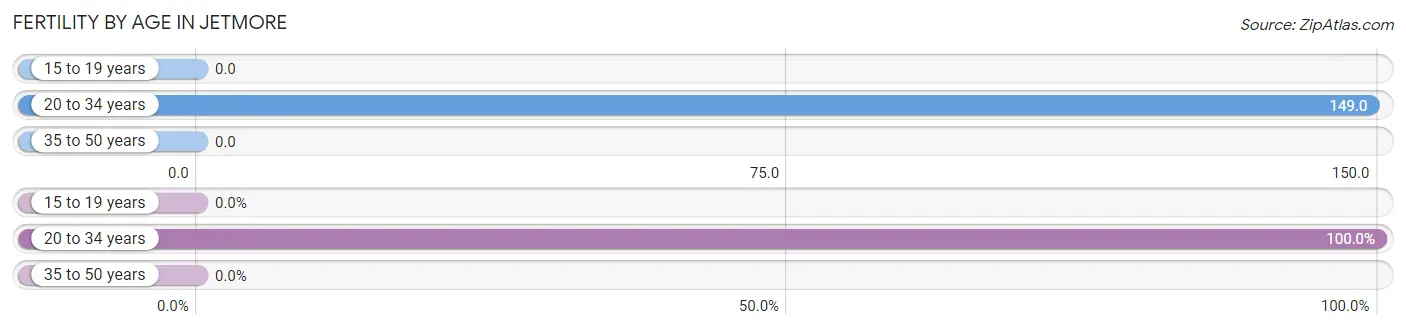
Average fertility rate in Jetmore is 68.0 births per 1,000 women. Women in the age bracket of 20 to 34 years have the highest fertility rate with 149.0 births per 1,000 women. Women in the age bracket of 20 to 34 years acount for 100.0% of all women with births.
| Age Bracket | Women with Births | Births / 1,000 Women |
| 15 to 19 years | 0 (0.0%) | 0.0 |
| 20 to 34 years | 10 (100.0%) | 149.0 |
| 35 to 50 years | 0 (0.0%) | 0.0 |
| Total | 10 (100.0%) | 68.0 |
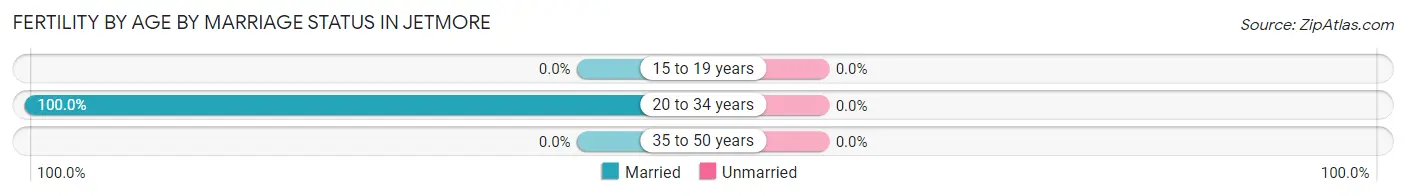
Fertility by Age by Marriage Status in Jetmore
| Age Bracket | Married | Unmarried |
| 15 to 19 years | 0 (0.0%) | 0 (0.0%) |
| 20 to 34 years | 10 (100.0%) | 0 (0.0%) |
| 35 to 50 years | 0 (0.0%) | 0 (0.0%) |
| Total | 10 (100.0%) | 0 (0.0%) |
Fertility by Education in Jetmore
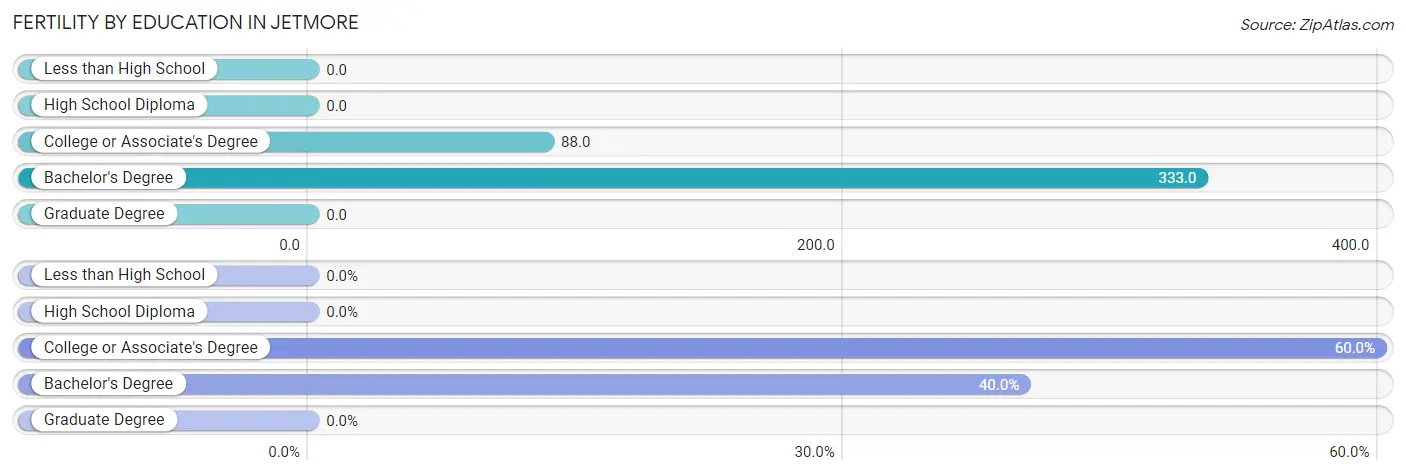
| Educational Attainment | Women with Births | Births / 1,000 Women |
| Less than High School | 0 (0.0%) | 0.0 |
| High School Diploma | 0 (0.0%) | 0.0 |
| College or Associate's Degree | 6 (60.0%) | 88.0 |
| Bachelor's Degree | 4 (40.0%) | 333.0 |
| Graduate Degree | 0 (0.0%) | 0.0 |
| Total | 10 (100.0%) | 68.0 |
Fertility by Education by Marriage Status in Jetmore
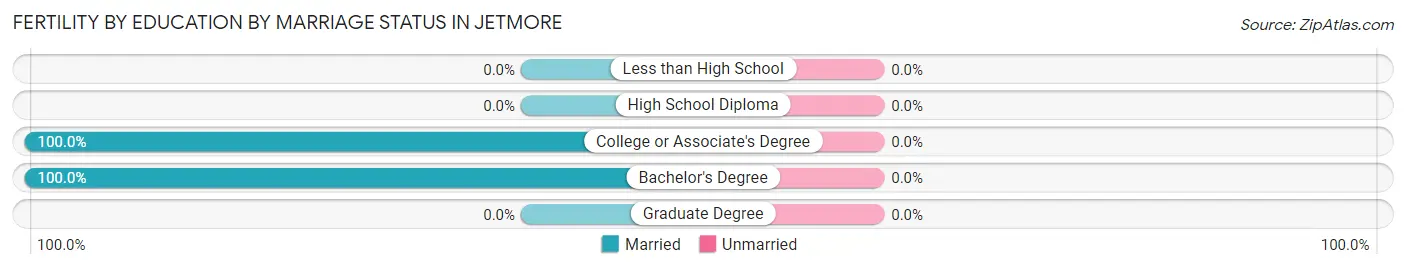
| Educational Attainment | Married | Unmarried |
| Less than High School | 0 (0.0%) | 0 (0.0%) |
| High School Diploma | 0 (0.0%) | 0 (0.0%) |
| College or Associate's Degree | 6 (100.0%) | 0 (0.0%) |
| Bachelor's Degree | 4 (100.0%) | 0 (0.0%) |
| Graduate Degree | 0 (0.0%) | 0 (0.0%) |
| Total | 10 (100.0%) | 0 (0.0%) |
Employment Characteristics in Jetmore
Employment by Class of Employer in Jetmore
Among the 357 employed individuals in Jetmore, private company employees (185 | 51.8%), local government employees (82 | 23.0%), and not-for-profit organizations (40 | 11.2%) make up the most common classes of employment.
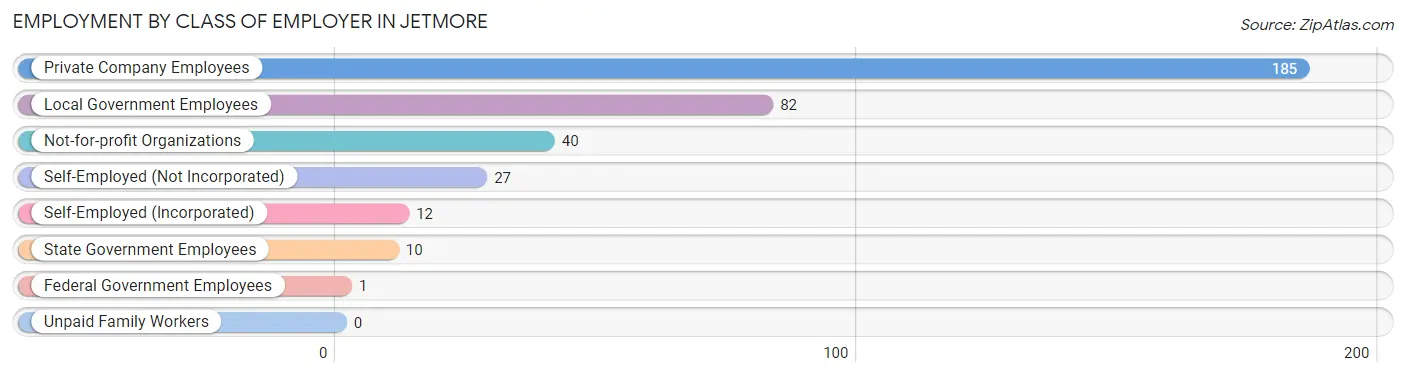
| Employer Class | # Employees | % Employees |
| Private Company Employees | 185 | 51.8% |
| Self-Employed (Incorporated) | 12 | 3.4% |
| Self-Employed (Not Incorporated) | 27 | 7.6% |
| Not-for-profit Organizations | 40 | 11.2% |
| Local Government Employees | 82 | 23.0% |
| State Government Employees | 10 | 2.8% |
| Federal Government Employees | 1 | 0.3% |
| Unpaid Family Workers | 0 | 0.0% |
| Total | 357 | 100.0% |
Employment Status by Age in Jetmore
According to the labor force statistics for Jetmore, out of the total population over 16 years of age (584), 62.0% or 362 individuals are in the labor force, with 1.4% or 5 of them unemployed. The age group with the highest labor force participation rate is 20 to 24 years, with 89.3% or 50 individuals in the labor force. Within the labor force, the 16 to 19 years age range has the highest percentage of unemployed individuals, with 31.3% or 5 of them being unemployed.
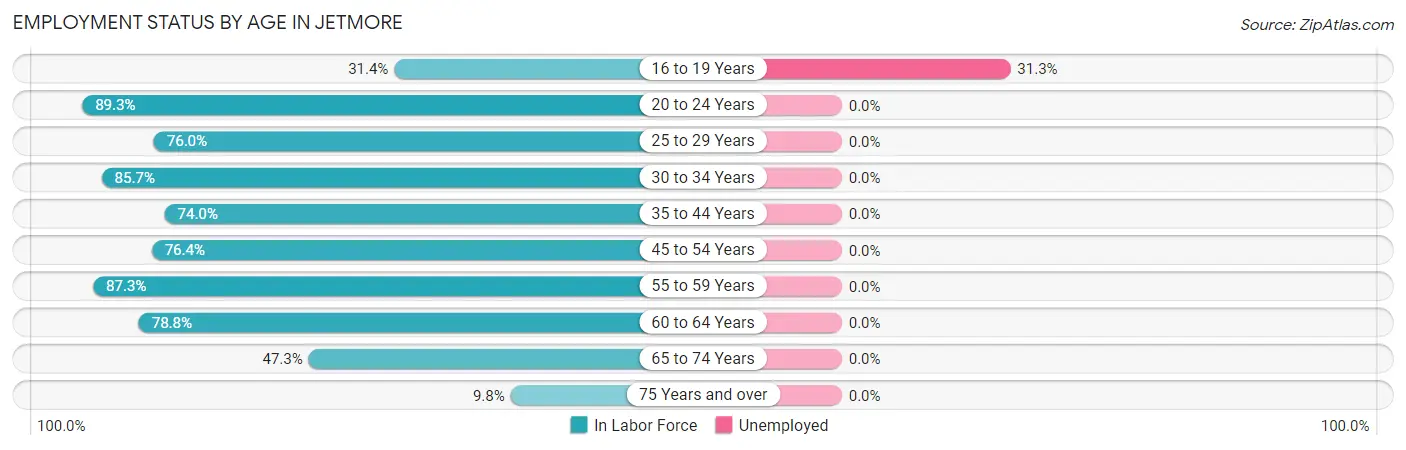
| Age Bracket | In Labor Force | Unemployed |
| 16 to 19 Years | 16 (31.4%) | 5 (31.3%) |
| 20 to 24 Years | 50 (89.3%) | 0 (0.0%) |
| 25 to 29 Years | 19 (76.0%) | 0 (0.0%) |
| 30 to 34 Years | 24 (85.7%) | 0 (0.0%) |
| 35 to 44 Years | 74 (74.0%) | 0 (0.0%) |
| 45 to 54 Years | 55 (76.4%) | 0 (0.0%) |
| 55 to 59 Years | 55 (87.3%) | 0 (0.0%) |
| 60 to 64 Years | 26 (78.8%) | 0 (0.0%) |
| 65 to 74 Years | 35 (47.3%) | 0 (0.0%) |
| 75 Years and over | 8 (9.8%) | 0 (0.0%) |
| Total | 362 (62.0%) | 5 (1.4%) |
Employment Status by Educational Attainment in Jetmore
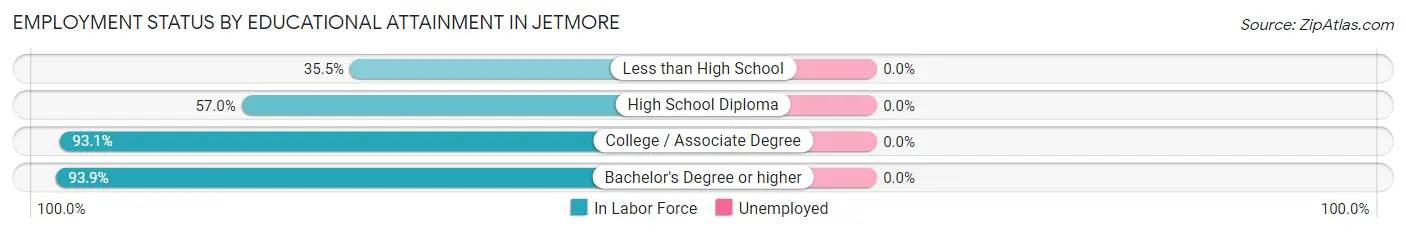
| Educational Attainment | In Labor Force | Unemployed |
| Less than High School | 11 (35.5%) | 0 (0.0%) |
| High School Diploma | 45 (57.0%) | 0 (0.0%) |
| College / Associate Degree | 135 (93.1%) | 0 (0.0%) |
| Bachelor's Degree or higher | 62 (93.9%) | 0 (0.0%) |
| Total | 253 (78.8%) | 0 (0.0%) |
Employment Occupations by Sex in Jetmore
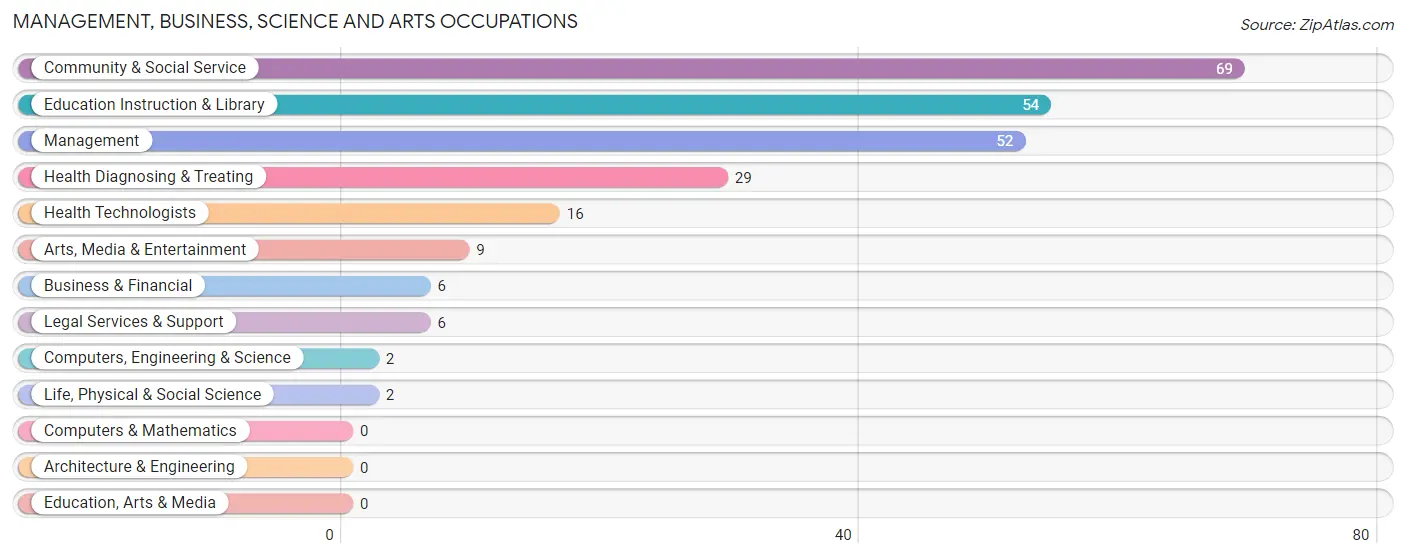
Management, Business, Science and Arts Occupations
The most common Management, Business, Science and Arts occupations in Jetmore are Community & Social Service (69 | 19.3%), Education Instruction & Library (54 | 15.1%), Management (52 | 14.6%), Health Diagnosing & Treating (29 | 8.1%), and Health Technologists (16 | 4.5%).
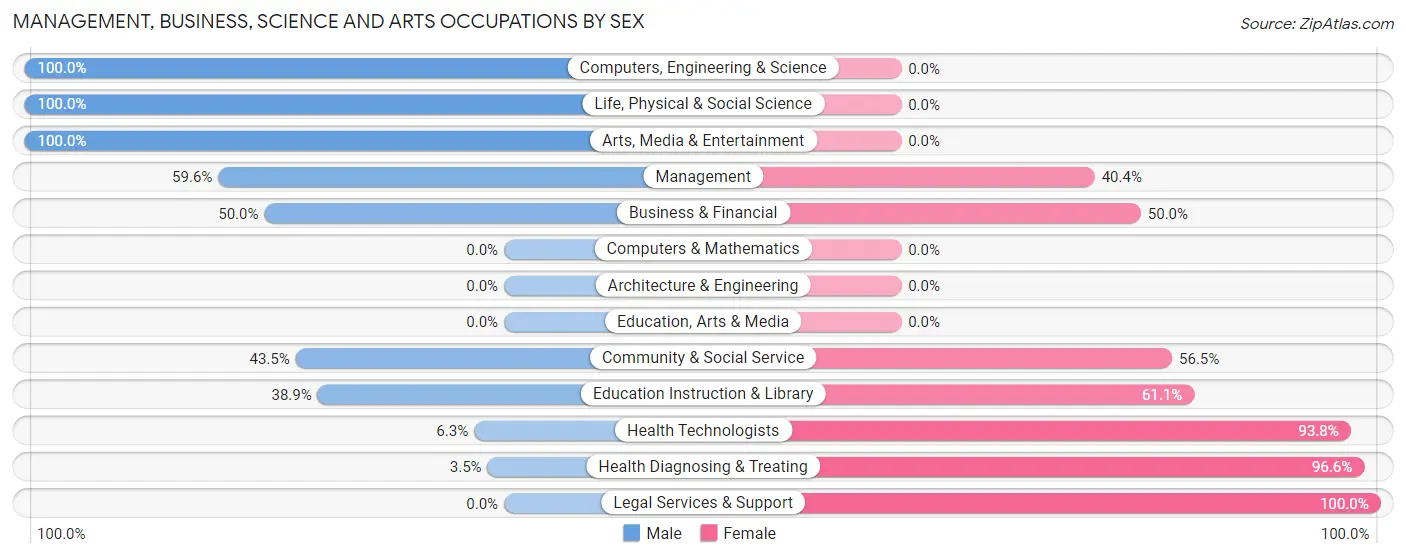
Management, Business, Science and Arts Occupations by Sex
Within the Management, Business, Science and Arts occupations in Jetmore, the most male-oriented occupations are Computers, Engineering & Science (100.0%), Life, Physical & Social Science (100.0%), and Arts, Media & Entertainment (100.0%), while the most female-oriented occupations are Legal Services & Support (100.0%), Health Diagnosing & Treating (96.6%), and Health Technologists (93.8%).
| Occupation | Male | Female |
| Management | 31 (59.6%) | 21 (40.4%) |
| Business & Financial | 3 (50.0%) | 3 (50.0%) |
| Computers, Engineering & Science | 2 (100.0%) | 0 (0.0%) |
| Computers & Mathematics | 0 (0.0%) | 0 (0.0%) |
| Architecture & Engineering | 0 (0.0%) | 0 (0.0%) |
| Life, Physical & Social Science | 2 (100.0%) | 0 (0.0%) |
| Community & Social Service | 30 (43.5%) | 39 (56.5%) |
| Education, Arts & Media | 0 (0.0%) | 0 (0.0%) |
| Legal Services & Support | 0 (0.0%) | 6 (100.0%) |
| Education Instruction & Library | 21 (38.9%) | 33 (61.1%) |
| Arts, Media & Entertainment | 9 (100.0%) | 0 (0.0%) |
| Health Diagnosing & Treating | 1 (3.5%) | 28 (96.6%) |
| Health Technologists | 1 (6.2%) | 15 (93.8%) |
| Total (Category) | 67 (42.4%) | 91 (57.6%) |
| Total (Overall) | 181 (50.7%) | 176 (49.3%) |
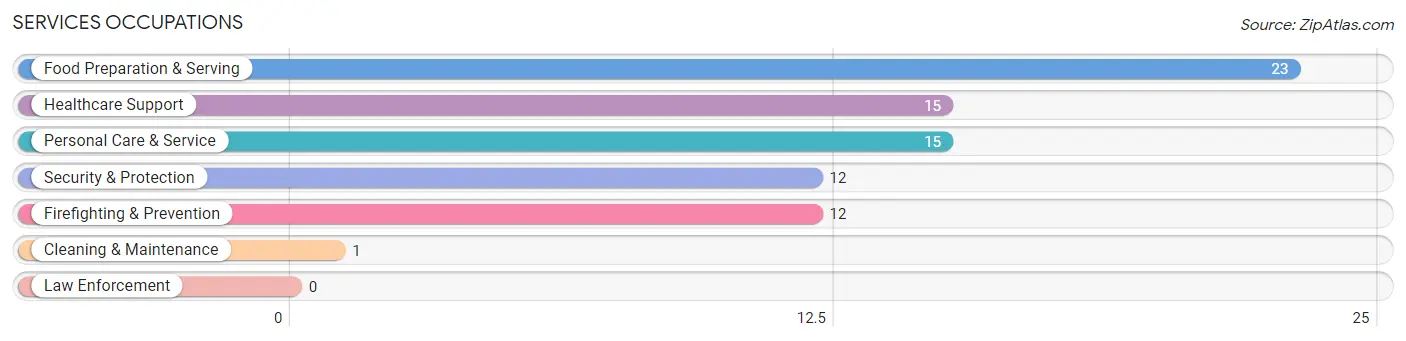
Services Occupations
The most common Services occupations in Jetmore are Food Preparation & Serving (23 | 6.4%), Healthcare Support (15 | 4.2%), Personal Care & Service (15 | 4.2%), Security & Protection (12 | 3.4%), and Firefighting & Prevention (12 | 3.4%).
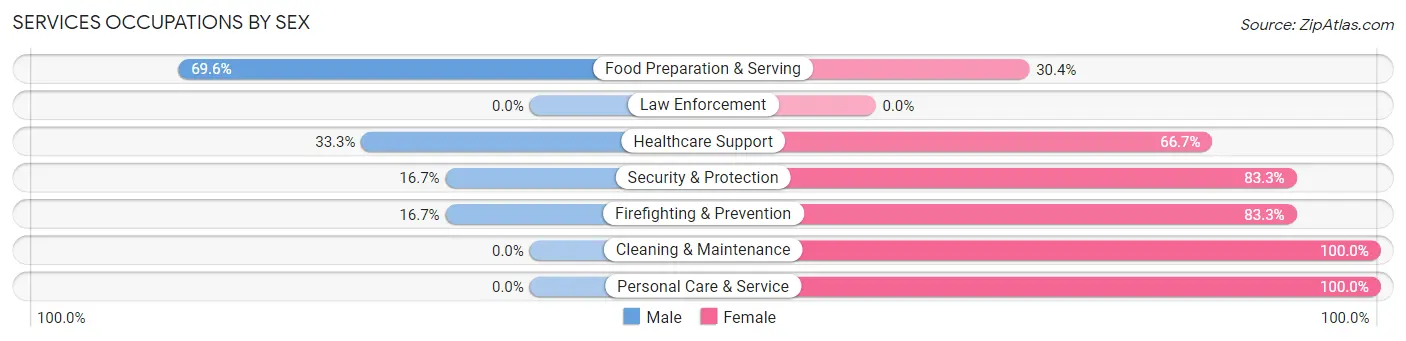
Services Occupations by Sex
Within the Services occupations in Jetmore, the most male-oriented occupations are Food Preparation & Serving (69.6%), Healthcare Support (33.3%), and Security & Protection (16.7%), while the most female-oriented occupations are Cleaning & Maintenance (100.0%), Personal Care & Service (100.0%), and Security & Protection (83.3%).
| Occupation | Male | Female |
| Healthcare Support | 5 (33.3%) | 10 (66.7%) |
| Security & Protection | 2 (16.7%) | 10 (83.3%) |
| Firefighting & Prevention | 2 (16.7%) | 10 (83.3%) |
| Law Enforcement | 0 (0.0%) | 0 (0.0%) |
| Food Preparation & Serving | 16 (69.6%) | 7 (30.4%) |
| Cleaning & Maintenance | 0 (0.0%) | 1 (100.0%) |
| Personal Care & Service | 0 (0.0%) | 15 (100.0%) |
| Total (Category) | 23 (34.8%) | 43 (65.1%) |
| Total (Overall) | 181 (50.7%) | 176 (49.3%) |
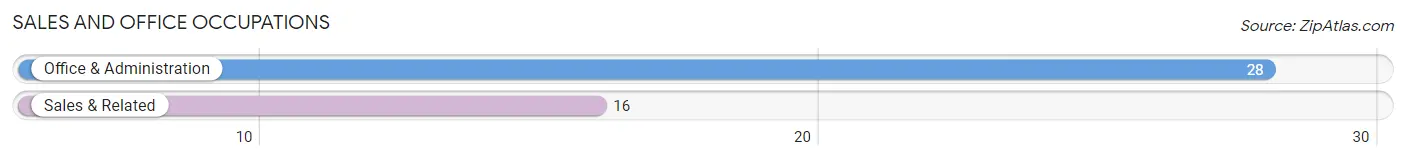
Sales and Office Occupations
The most common Sales and Office occupations in Jetmore are Office & Administration (28 | 7.8%), and Sales & Related (16 | 4.5%).
Sales and Office Occupations by Sex
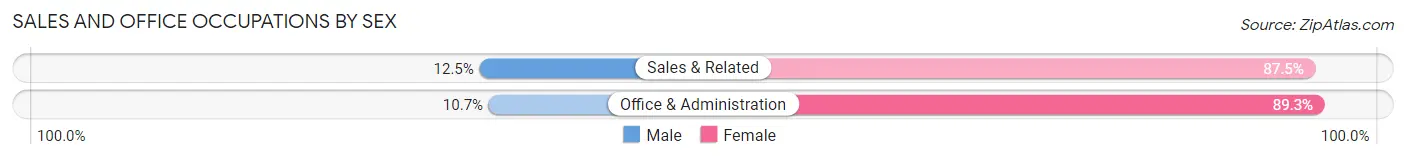
| Occupation | Male | Female |
| Sales & Related | 2 (12.5%) | 14 (87.5%) |
| Office & Administration | 3 (10.7%) | 25 (89.3%) |
| Total (Category) | 5 (11.4%) | 39 (88.6%) |
| Total (Overall) | 181 (50.7%) | 176 (49.3%) |
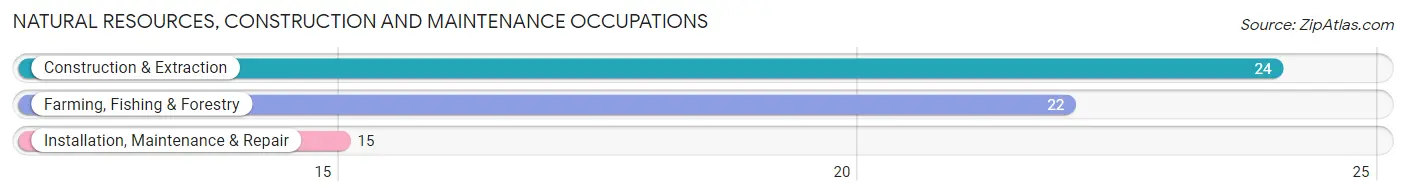
Natural Resources, Construction and Maintenance Occupations
The most common Natural Resources, Construction and Maintenance occupations in Jetmore are Construction & Extraction (24 | 6.7%), Farming, Fishing & Forestry (22 | 6.2%), and Installation, Maintenance & Repair (15 | 4.2%).
Natural Resources, Construction and Maintenance Occupations by Sex
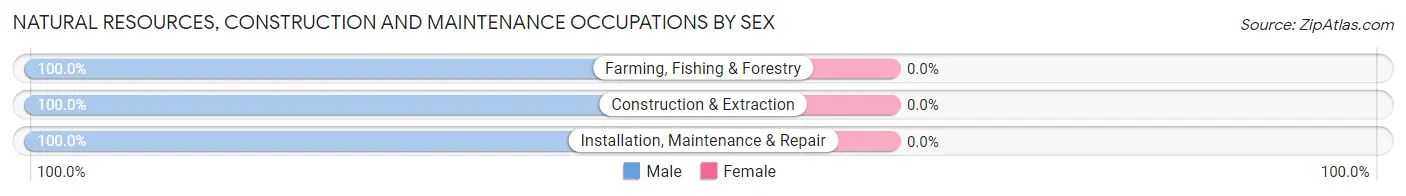
| Occupation | Male | Female |
| Farming, Fishing & Forestry | 22 (100.0%) | 0 (0.0%) |
| Construction & Extraction | 24 (100.0%) | 0 (0.0%) |
| Installation, Maintenance & Repair | 15 (100.0%) | 0 (0.0%) |
| Total (Category) | 61 (100.0%) | 0 (0.0%) |
| Total (Overall) | 181 (50.7%) | 176 (49.3%) |
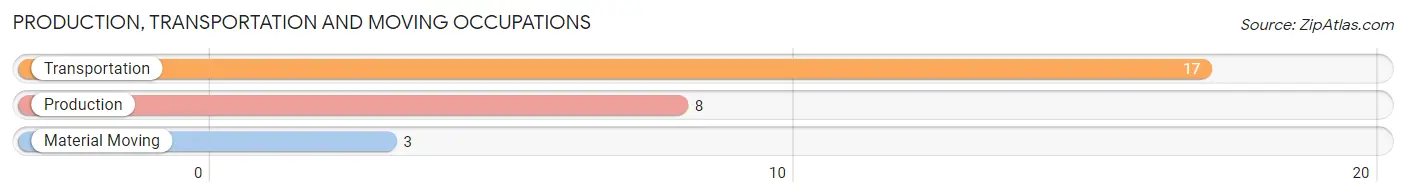
Production, Transportation and Moving Occupations
The most common Production, Transportation and Moving occupations in Jetmore are Transportation (17 | 4.8%), Production (8 | 2.2%), and Material Moving (3 | 0.8%).
Production, Transportation and Moving Occupations by Sex
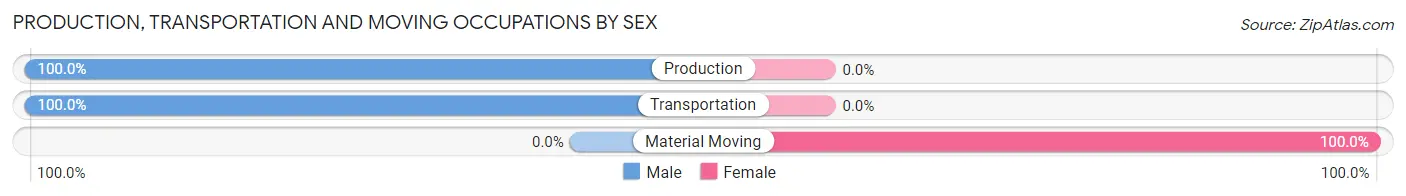
| Occupation | Male | Female |
| Production | 8 (100.0%) | 0 (0.0%) |
| Transportation | 17 (100.0%) | 0 (0.0%) |
| Material Moving | 0 (0.0%) | 3 (100.0%) |
| Total (Category) | 25 (89.3%) | 3 (10.7%) |
| Total (Overall) | 181 (50.7%) | 176 (49.3%) |
Employment Industries by Sex in Jetmore
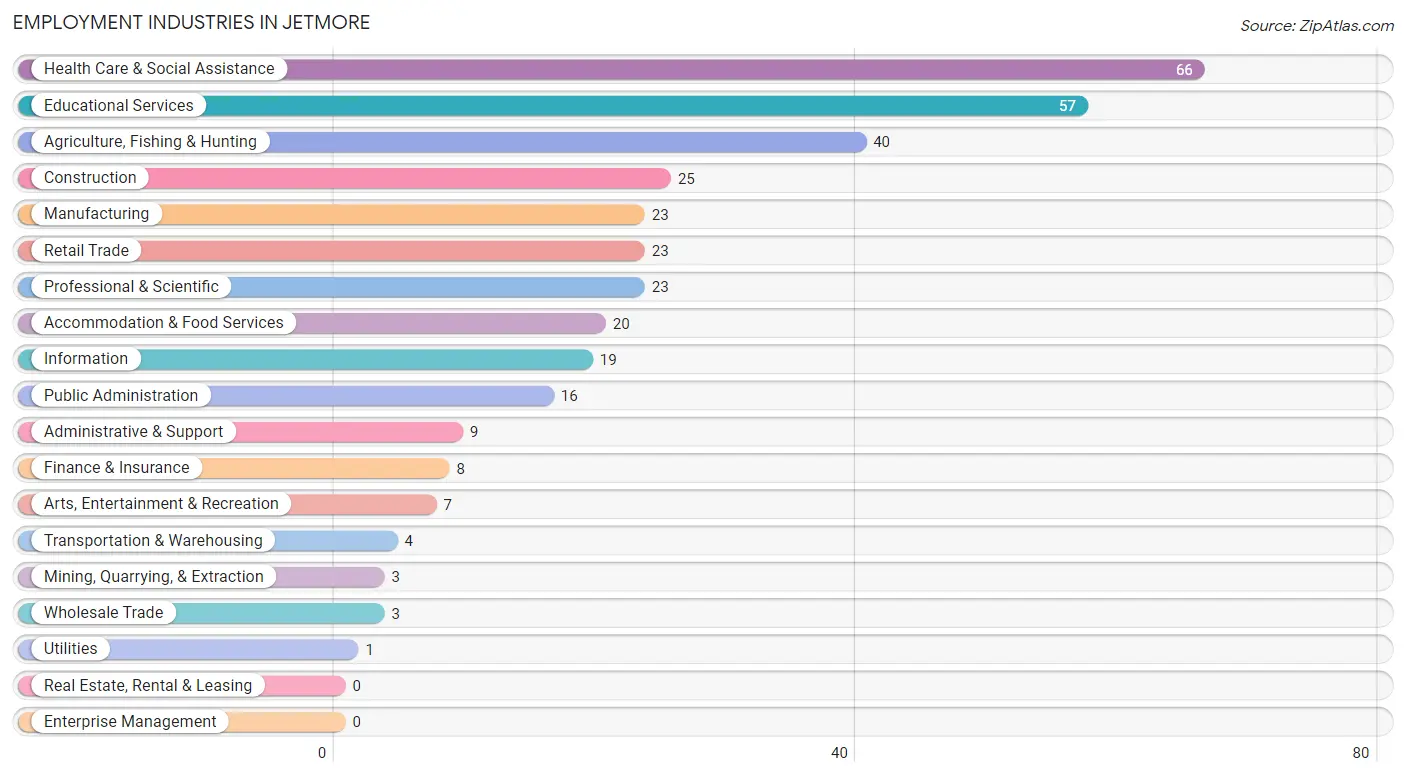
Employment Industries in Jetmore
The major employment industries in Jetmore include Health Care & Social Assistance (66 | 18.5%), Educational Services (57 | 16.0%), Agriculture, Fishing & Hunting (40 | 11.2%), Construction (25 | 7.0%), and Manufacturing (23 | 6.4%).
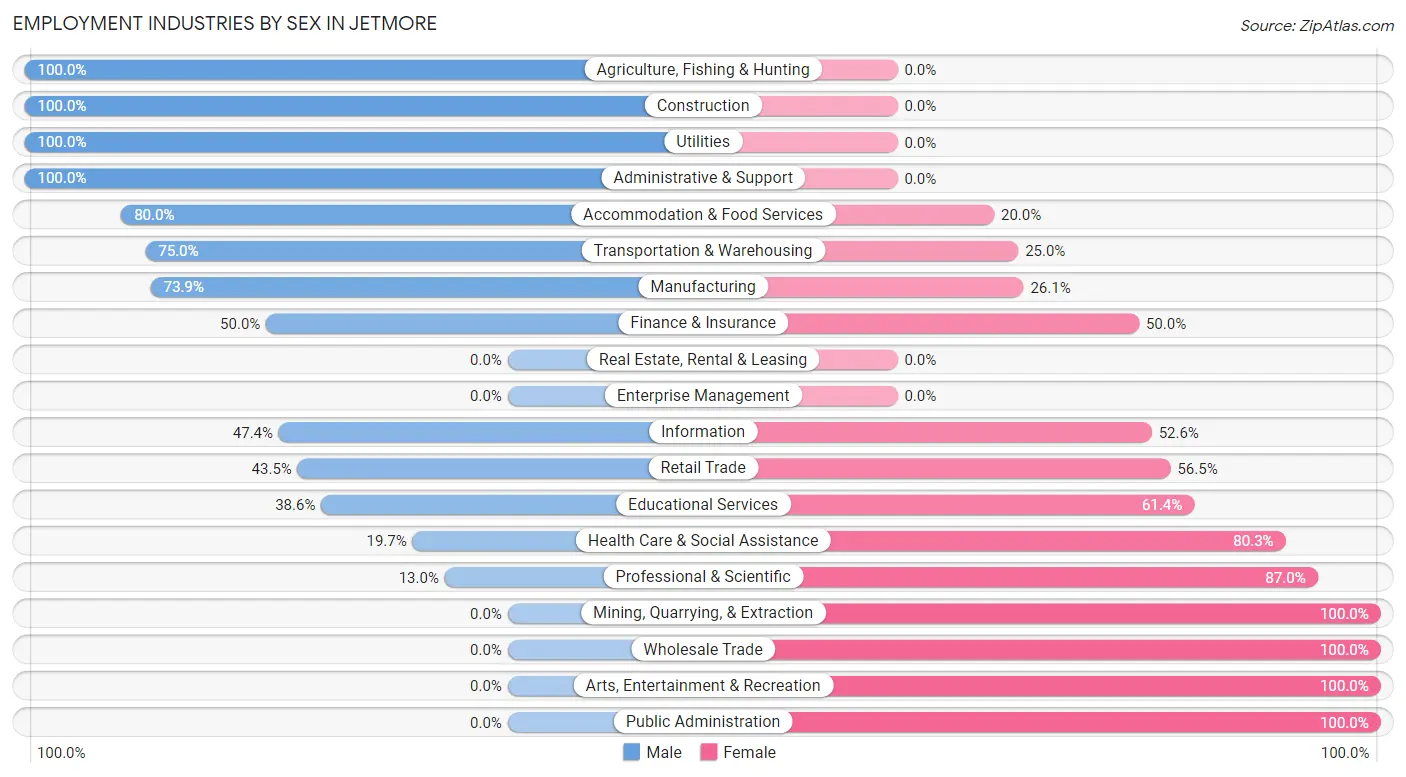
Employment Industries by Sex in Jetmore
The Jetmore industries that see more men than women are Agriculture, Fishing & Hunting (100.0%), Construction (100.0%), and Utilities (100.0%), whereas the industries that tend to have a higher number of women are Mining, Quarrying, & Extraction (100.0%), Wholesale Trade (100.0%), and Arts, Entertainment & Recreation (100.0%).
| Industry | Male | Female |
| Agriculture, Fishing & Hunting | 40 (100.0%) | 0 (0.0%) |
| Mining, Quarrying, & Extraction | 0 (0.0%) | 3 (100.0%) |
| Construction | 25 (100.0%) | 0 (0.0%) |
| Manufacturing | 17 (73.9%) | 6 (26.1%) |
| Wholesale Trade | 0 (0.0%) | 3 (100.0%) |
| Retail Trade | 10 (43.5%) | 13 (56.5%) |
| Transportation & Warehousing | 3 (75.0%) | 1 (25.0%) |
| Utilities | 1 (100.0%) | 0 (0.0%) |
| Information | 9 (47.4%) | 10 (52.6%) |
| Finance & Insurance | 4 (50.0%) | 4 (50.0%) |
| Real Estate, Rental & Leasing | 0 (0.0%) | 0 (0.0%) |
| Professional & Scientific | 3 (13.0%) | 20 (87.0%) |
| Enterprise Management | 0 (0.0%) | 0 (0.0%) |
| Administrative & Support | 9 (100.0%) | 0 (0.0%) |
| Educational Services | 22 (38.6%) | 35 (61.4%) |
| Health Care & Social Assistance | 13 (19.7%) | 53 (80.3%) |
| Arts, Entertainment & Recreation | 0 (0.0%) | 7 (100.0%) |
| Accommodation & Food Services | 16 (80.0%) | 4 (20.0%) |
| Public Administration | 0 (0.0%) | 16 (100.0%) |
| Total | 181 (50.7%) | 176 (49.3%) |
Education in Jetmore
School Enrollment in Jetmore
The most common levels of schooling among the 177 students in Jetmore are high school (61 | 34.5%), middle school (38 | 21.5%), and college / undergraduate (28 | 15.8%).
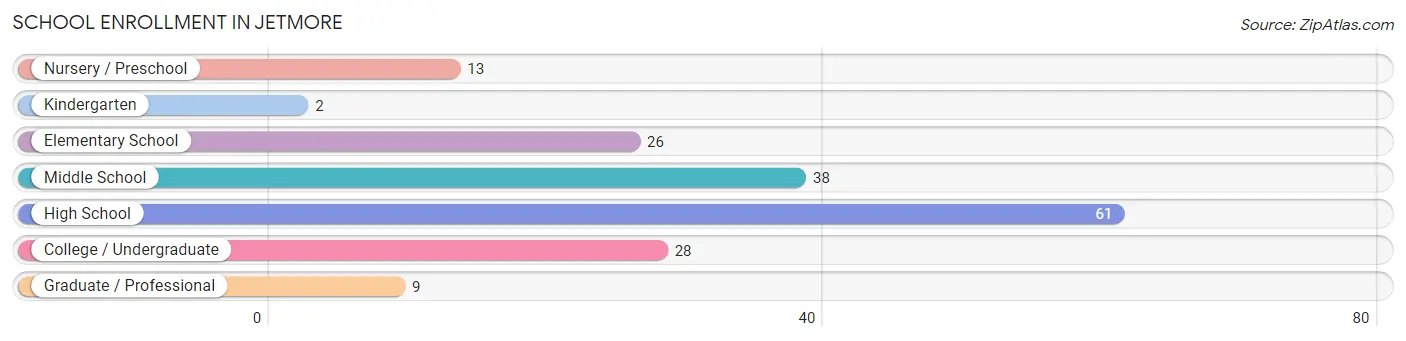
| School Level | # Students | % Students |
| Nursery / Preschool | 13 | 7.3% |
| Kindergarten | 2 | 1.1% |
| Elementary School | 26 | 14.7% |
| Middle School | 38 | 21.5% |
| High School | 61 | 34.5% |
| College / Undergraduate | 28 | 15.8% |
| Graduate / Professional | 9 | 5.1% |
| Total | 177 | 100.0% |
School Enrollment by Age by Funding Source in Jetmore
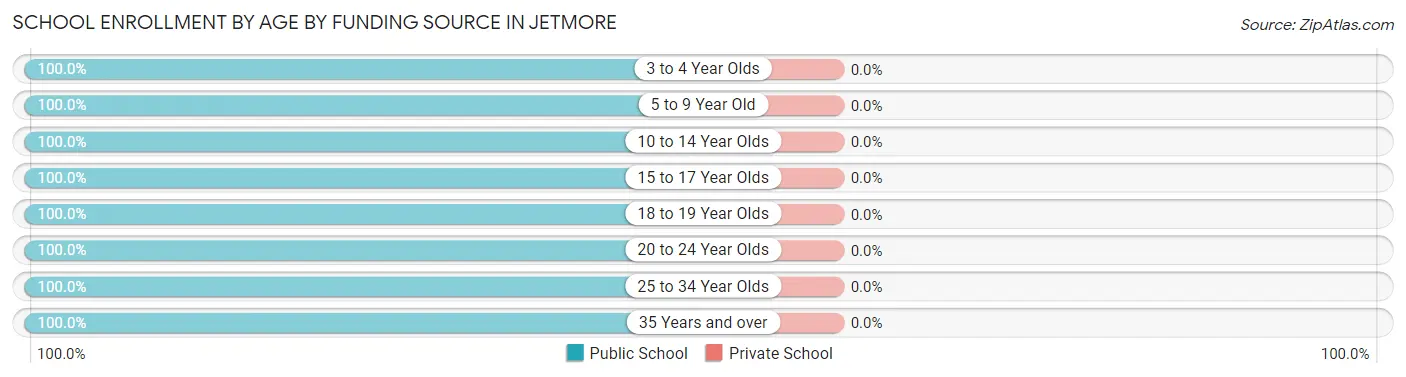
| Age Bracket | Public School | Private School |
| 3 to 4 Year Olds | 4 (100.0%) | 0 (0.0%) |
| 5 to 9 Year Old | 37 (100.0%) | 0 (0.0%) |
| 10 to 14 Year Olds | 40 (100.0%) | 0 (0.0%) |
| 15 to 17 Year Olds | 48 (100.0%) | 0 (0.0%) |
| 18 to 19 Year Olds | 14 (100.0%) | 0 (0.0%) |
| 20 to 24 Year Olds | 17 (100.0%) | 0 (0.0%) |
| 25 to 34 Year Olds | 2 (100.0%) | 0 (0.0%) |
| 35 Years and over | 15 (100.0%) | 0 (0.0%) |
| Total | 177 (100.0%) | 0 (0.0%) |
Educational Attainment by Field of Study in Jetmore
Education (44 | 32.1%), science & technology (25 | 18.2%), bio, nature & agricultural (22 | 16.1%), business (12 | 8.8%), and computers & mathematics (9 | 6.6%) are the most common fields of study among 137 individuals in Jetmore who have obtained a bachelor's degree or higher.
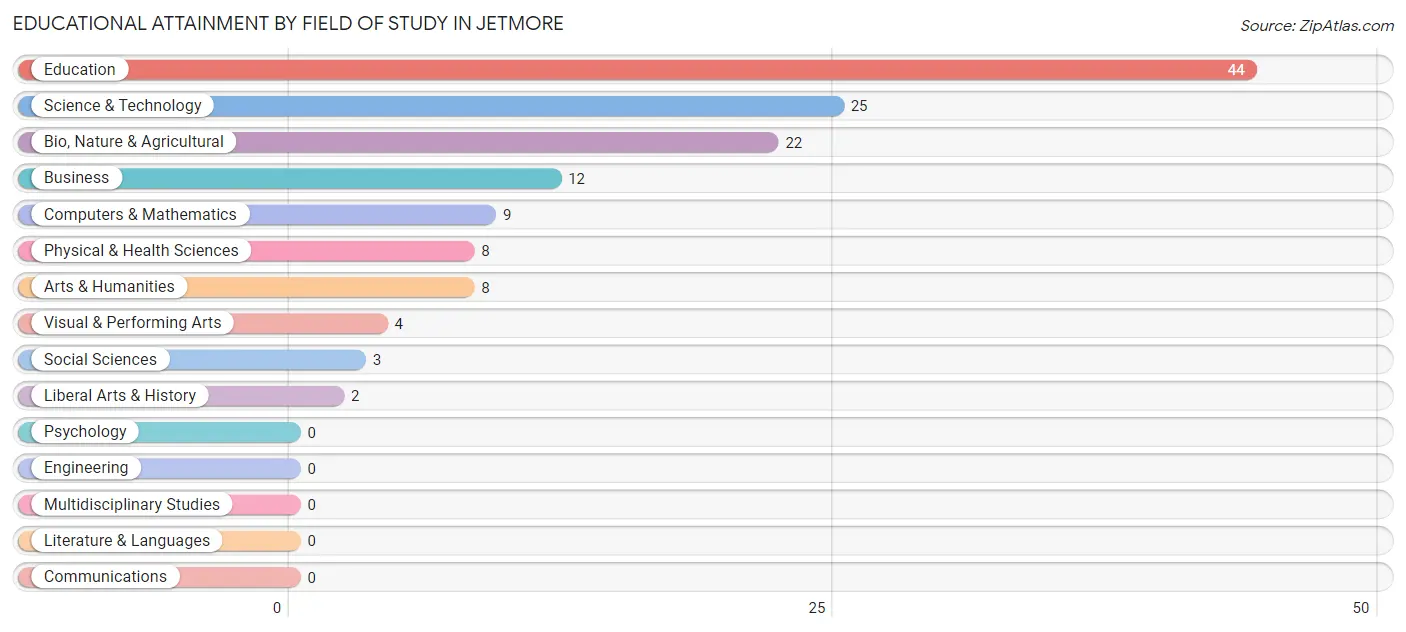
| Field of Study | # Graduates | % Graduates |
| Computers & Mathematics | 9 | 6.6% |
| Bio, Nature & Agricultural | 22 | 16.1% |
| Physical & Health Sciences | 8 | 5.8% |
| Psychology | 0 | 0.0% |
| Social Sciences | 3 | 2.2% |
| Engineering | 0 | 0.0% |
| Multidisciplinary Studies | 0 | 0.0% |
| Science & Technology | 25 | 18.2% |
| Business | 12 | 8.8% |
| Education | 44 | 32.1% |
| Literature & Languages | 0 | 0.0% |
| Liberal Arts & History | 2 | 1.5% |
| Visual & Performing Arts | 4 | 2.9% |
| Communications | 0 | 0.0% |
| Arts & Humanities | 8 | 5.8% |
| Total | 137 | 100.0% |
Transportation & Commute in Jetmore
Vehicle Availability by Sex in Jetmore
The most prevalent vehicle ownership categories in Jetmore are males with 2 vehicles (57, accounting for 31.5%) and females with 2 vehicles (44, making up 32.4%).
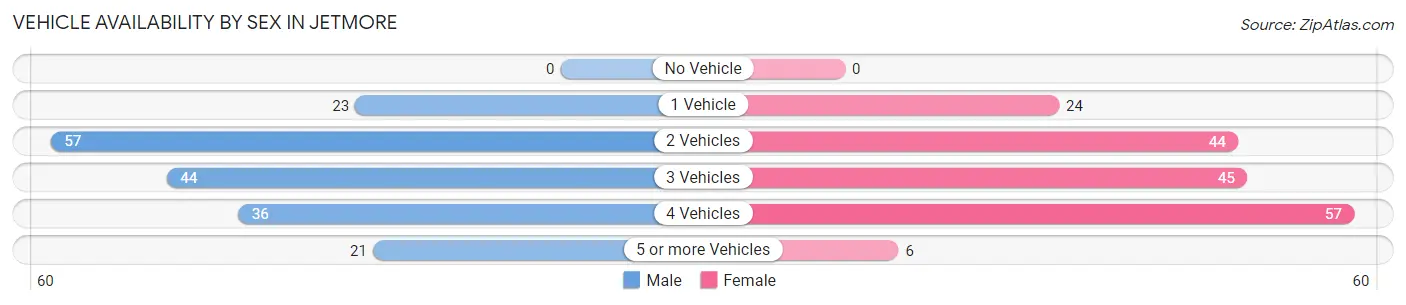
| Vehicles Available | Male | Female |
| No Vehicle | 0 (0.0%) | 0 (0.0%) |
| 1 Vehicle | 23 (12.7%) | 24 (13.6%) |
| 2 Vehicles | 57 (31.5%) | 44 (25.0%) |
| 3 Vehicles | 44 (24.3%) | 45 (25.6%) |
| 4 Vehicles | 36 (19.9%) | 57 (32.4%) |
| 5 or more Vehicles | 21 (11.6%) | 6 (3.4%) |
| Total | 181 (100.0%) | 176 (100.0%) |
Commute Time in Jetmore
The most frequently occuring commute durations in Jetmore are less than 5 minutes (120 commuters, 35.0%), 30 to 34 minutes (84 commuters, 24.5%), and 5 to 9 minutes (62 commuters, 18.1%).
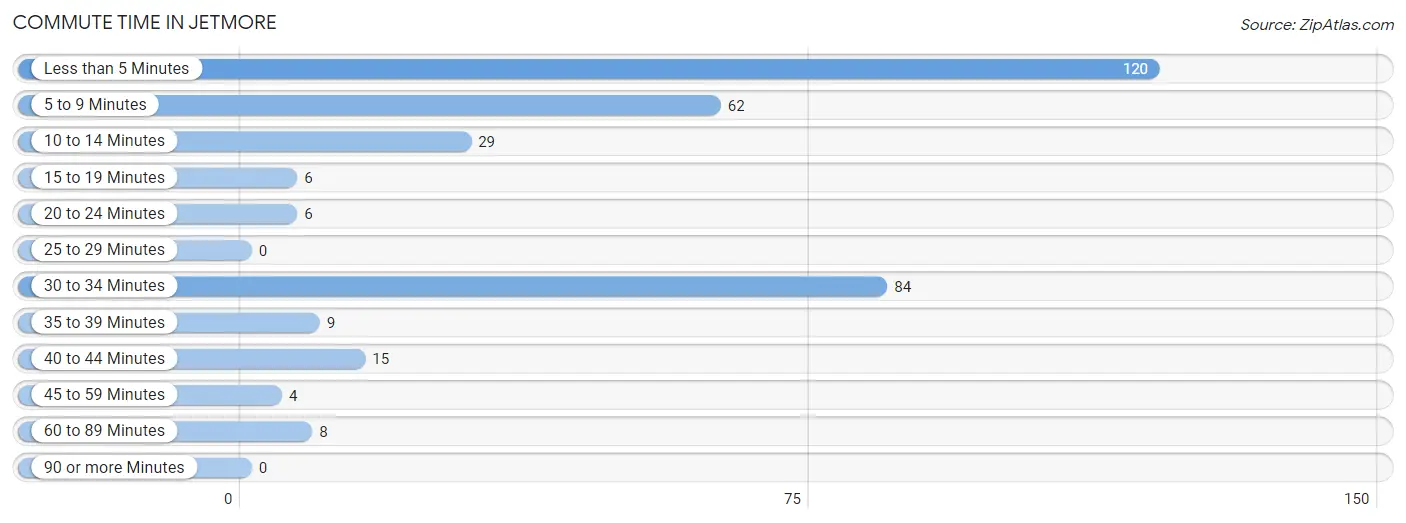
| Commute Time | # Commuters | % Commuters |
| Less than 5 Minutes | 120 | 35.0% |
| 5 to 9 Minutes | 62 | 18.1% |
| 10 to 14 Minutes | 29 | 8.5% |
| 15 to 19 Minutes | 6 | 1.8% |
| 20 to 24 Minutes | 6 | 1.8% |
| 25 to 29 Minutes | 0 | 0.0% |
| 30 to 34 Minutes | 84 | 24.5% |
| 35 to 39 Minutes | 9 | 2.6% |
| 40 to 44 Minutes | 15 | 4.4% |
| 45 to 59 Minutes | 4 | 1.2% |
| 60 to 89 Minutes | 8 | 2.3% |
| 90 or more Minutes | 0 | 0.0% |
Commute Time by Sex in Jetmore
The most common commute times in Jetmore are less than 5 minutes (56 commuters, 30.9%) for males and less than 5 minutes (64 commuters, 39.5%) for females.
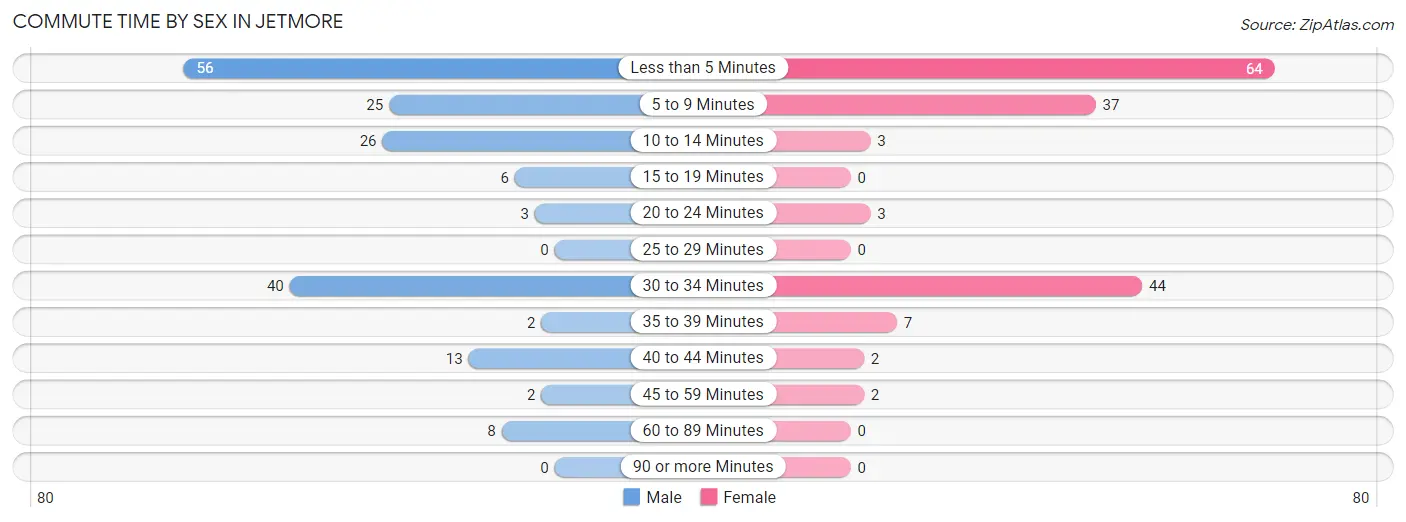
| Commute Time | Male | Female |
| Less than 5 Minutes | 56 (30.9%) | 64 (39.5%) |
| 5 to 9 Minutes | 25 (13.8%) | 37 (22.8%) |
| 10 to 14 Minutes | 26 (14.4%) | 3 (1.8%) |
| 15 to 19 Minutes | 6 (3.3%) | 0 (0.0%) |
| 20 to 24 Minutes | 3 (1.7%) | 3 (1.8%) |
| 25 to 29 Minutes | 0 (0.0%) | 0 (0.0%) |
| 30 to 34 Minutes | 40 (22.1%) | 44 (27.2%) |
| 35 to 39 Minutes | 2 (1.1%) | 7 (4.3%) |
| 40 to 44 Minutes | 13 (7.2%) | 2 (1.2%) |
| 45 to 59 Minutes | 2 (1.1%) | 2 (1.2%) |
| 60 to 89 Minutes | 8 (4.4%) | 0 (0.0%) |
| 90 or more Minutes | 0 (0.0%) | 0 (0.0%) |
Time of Departure to Work by Sex in Jetmore
The most frequent times of departure to work in Jetmore are 7:00 AM to 7:29 AM (29, 16.0%) for males and 7:30 AM to 7:59 AM (56, 34.6%) for females.
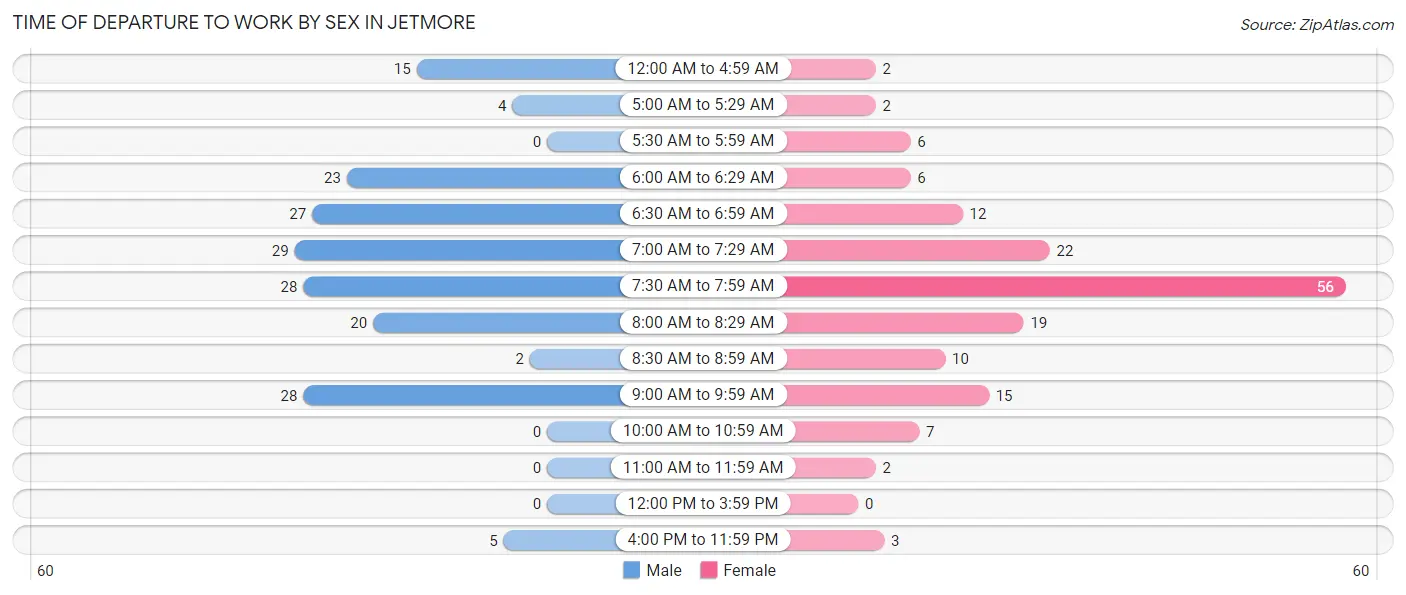
| Time of Departure | Male | Female |
| 12:00 AM to 4:59 AM | 15 (8.3%) | 2 (1.2%) |
| 5:00 AM to 5:29 AM | 4 (2.2%) | 2 (1.2%) |
| 5:30 AM to 5:59 AM | 0 (0.0%) | 6 (3.7%) |
| 6:00 AM to 6:29 AM | 23 (12.7%) | 6 (3.7%) |
| 6:30 AM to 6:59 AM | 27 (14.9%) | 12 (7.4%) |
| 7:00 AM to 7:29 AM | 29 (16.0%) | 22 (13.6%) |
| 7:30 AM to 7:59 AM | 28 (15.5%) | 56 (34.6%) |
| 8:00 AM to 8:29 AM | 20 (11.1%) | 19 (11.7%) |
| 8:30 AM to 8:59 AM | 2 (1.1%) | 10 (6.2%) |
| 9:00 AM to 9:59 AM | 28 (15.5%) | 15 (9.3%) |
| 10:00 AM to 10:59 AM | 0 (0.0%) | 7 (4.3%) |
| 11:00 AM to 11:59 AM | 0 (0.0%) | 2 (1.2%) |
| 12:00 PM to 3:59 PM | 0 (0.0%) | 0 (0.0%) |
| 4:00 PM to 11:59 PM | 5 (2.8%) | 3 (1.8%) |
| Total | 181 (100.0%) | 162 (100.0%) |
Housing Occupancy in Jetmore
Occupancy by Ownership in Jetmore
Of the total 280 dwellings in Jetmore, owner-occupied units account for 215 (76.8%), while renter-occupied units make up 65 (23.2%).
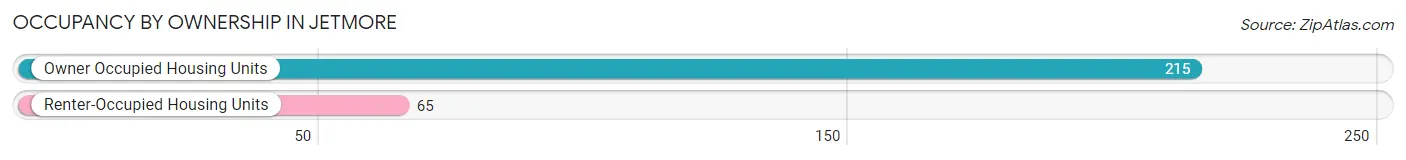
| Occupancy | # Housing Units | % Housing Units |
| Owner Occupied Housing Units | 215 | 76.8% |
| Renter-Occupied Housing Units | 65 | 23.2% |
| Total Occupied Housing Units | 280 | 100.0% |
Occupancy by Household Size in Jetmore
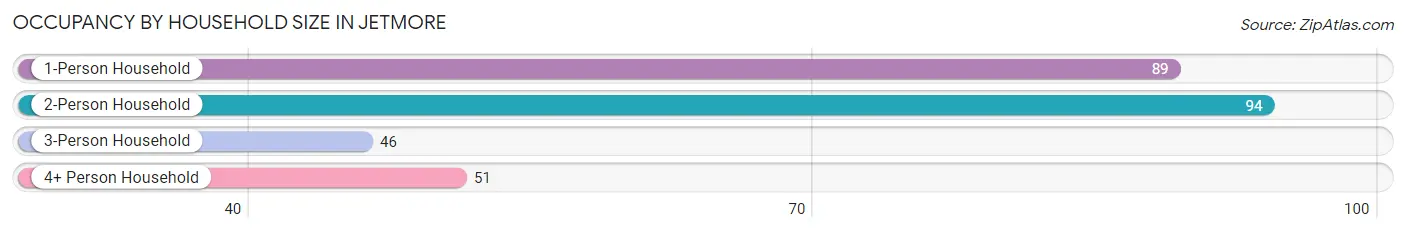
| Household Size | # Housing Units | % Housing Units |
| 1-Person Household | 89 | 31.8% |
| 2-Person Household | 94 | 33.6% |
| 3-Person Household | 46 | 16.4% |
| 4+ Person Household | 51 | 18.2% |
| Total Housing Units | 280 | 100.0% |
Occupancy by Ownership by Household Size in Jetmore
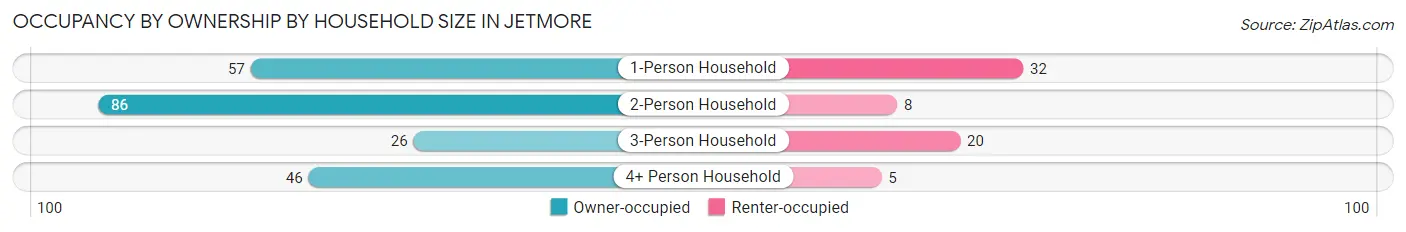
| Household Size | Owner-occupied | Renter-occupied |
| 1-Person Household | 57 (64.0%) | 32 (36.0%) |
| 2-Person Household | 86 (91.5%) | 8 (8.5%) |
| 3-Person Household | 26 (56.5%) | 20 (43.5%) |
| 4+ Person Household | 46 (90.2%) | 5 (9.8%) |
| Total Housing Units | 215 (76.8%) | 65 (23.2%) |
Occupancy by Educational Attainment in Jetmore
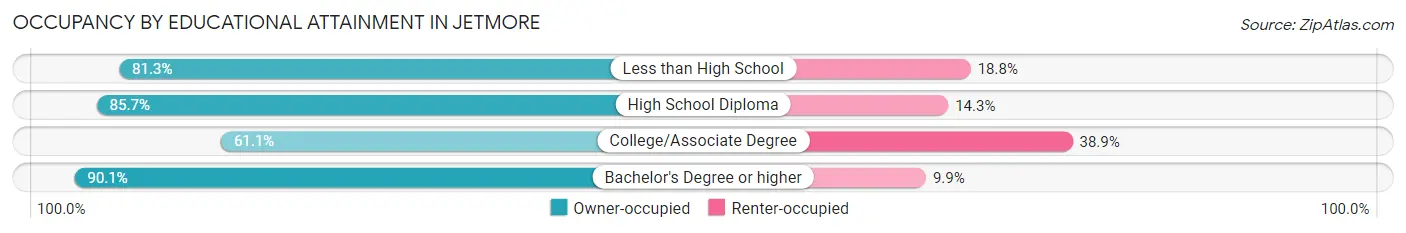
| Household Size | Owner-occupied | Renter-occupied |
| Less than High School | 13 (81.2%) | 3 (18.8%) |
| High School Diploma | 60 (85.7%) | 10 (14.3%) |
| College/Associate Degree | 69 (61.1%) | 44 (38.9%) |
| Bachelor's Degree or higher | 73 (90.1%) | 8 (9.9%) |
Occupancy by Age of Householder in Jetmore
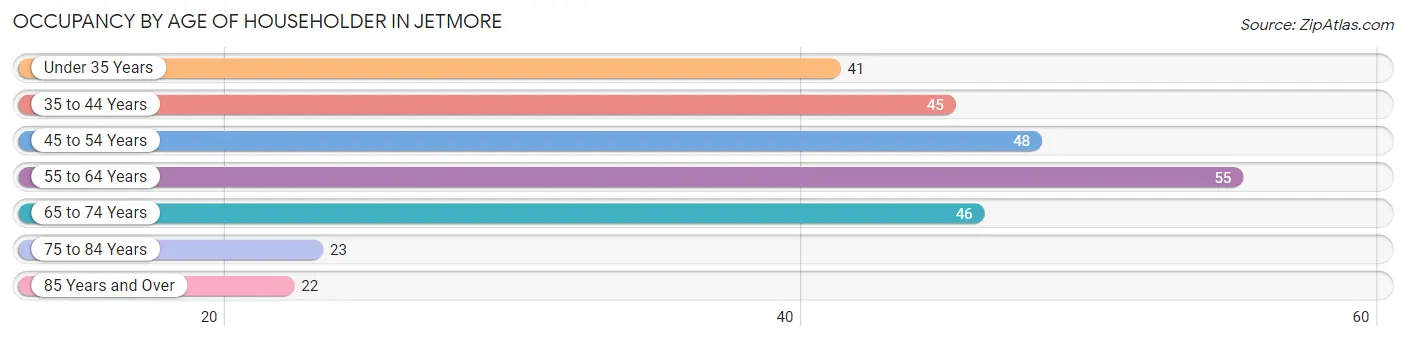
| Age Bracket | # Households | % Households |
| Under 35 Years | 41 | 14.6% |
| 35 to 44 Years | 45 | 16.1% |
| 45 to 54 Years | 48 | 17.1% |
| 55 to 64 Years | 55 | 19.6% |
| 65 to 74 Years | 46 | 16.4% |
| 75 to 84 Years | 23 | 8.2% |
| 85 Years and Over | 22 | 7.9% |
| Total | 280 | 100.0% |
Housing Finances in Jetmore
Median Income by Occupancy in Jetmore
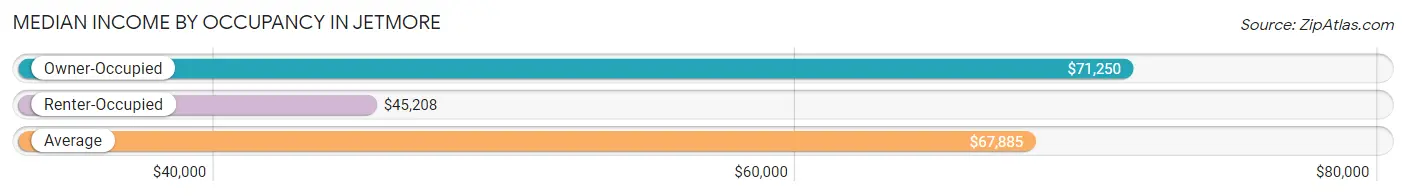
| Occupancy Type | # Households | Median Income |
| Owner-Occupied | 215 (76.8%) | $71,250 |
| Renter-Occupied | 65 (23.2%) | $45,208 |
| Average | 280 (100.0%) | $67,885 |
Occupancy by Householder Income Bracket in Jetmore
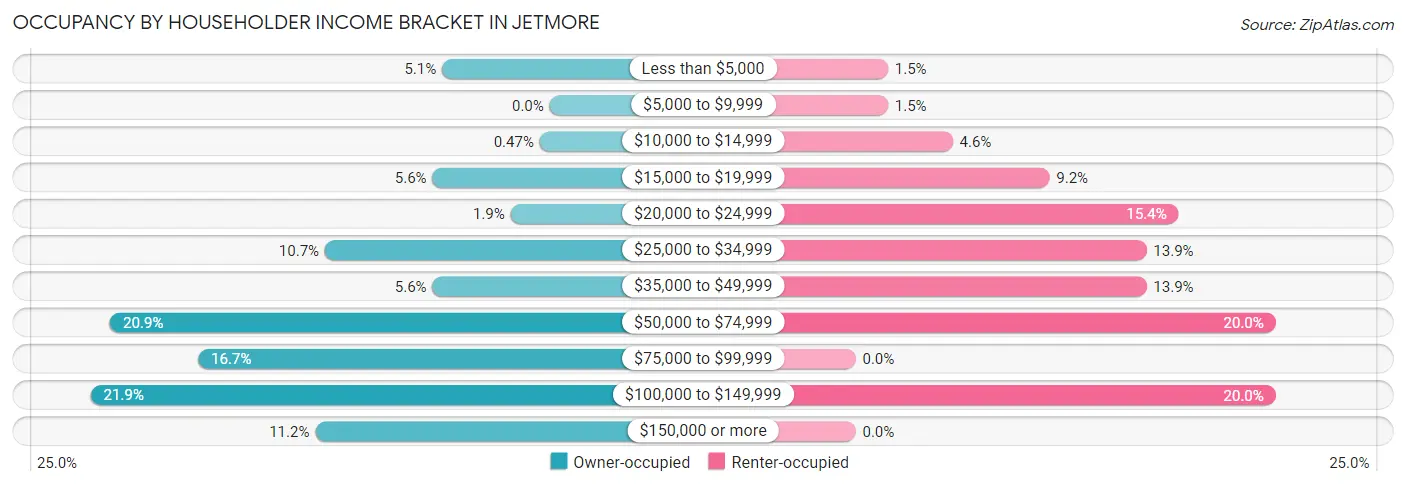
| Income Bracket | Owner-occupied | Renter-occupied |
| Less than $5,000 | 11 (5.1%) | 1 (1.5%) |
| $5,000 to $9,999 | 0 (0.0%) | 1 (1.5%) |
| $10,000 to $14,999 | 1 (0.5%) | 3 (4.6%) |
| $15,000 to $19,999 | 12 (5.6%) | 6 (9.2%) |
| $20,000 to $24,999 | 4 (1.9%) | 10 (15.4%) |
| $25,000 to $34,999 | 23 (10.7%) | 9 (13.9%) |
| $35,000 to $49,999 | 12 (5.6%) | 9 (13.9%) |
| $50,000 to $74,999 | 45 (20.9%) | 13 (20.0%) |
| $75,000 to $99,999 | 36 (16.7%) | 0 (0.0%) |
| $100,000 to $149,999 | 47 (21.9%) | 13 (20.0%) |
| $150,000 or more | 24 (11.2%) | 0 (0.0%) |
| Total | 215 (100.0%) | 65 (100.0%) |
Monthly Housing Cost Tiers in Jetmore
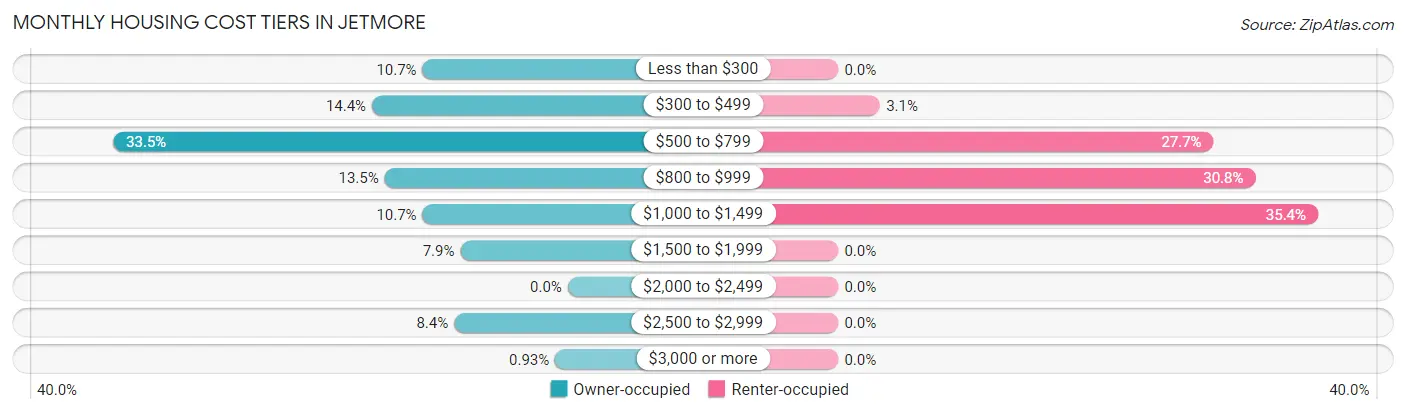
| Monthly Cost | Owner-occupied | Renter-occupied |
| Less than $300 | 23 (10.7%) | 0 (0.0%) |
| $300 to $499 | 31 (14.4%) | 2 (3.1%) |
| $500 to $799 | 72 (33.5%) | 18 (27.7%) |
| $800 to $999 | 29 (13.5%) | 20 (30.8%) |
| $1,000 to $1,499 | 23 (10.7%) | 23 (35.4%) |
| $1,500 to $1,999 | 17 (7.9%) | 0 (0.0%) |
| $2,000 to $2,499 | 0 (0.0%) | 0 (0.0%) |
| $2,500 to $2,999 | 18 (8.4%) | 0 (0.0%) |
| $3,000 or more | 2 (0.9%) | 0 (0.0%) |
| Total | 215 (100.0%) | 65 (100.0%) |
Physical Housing Characteristics in Jetmore
Housing Structures in Jetmore
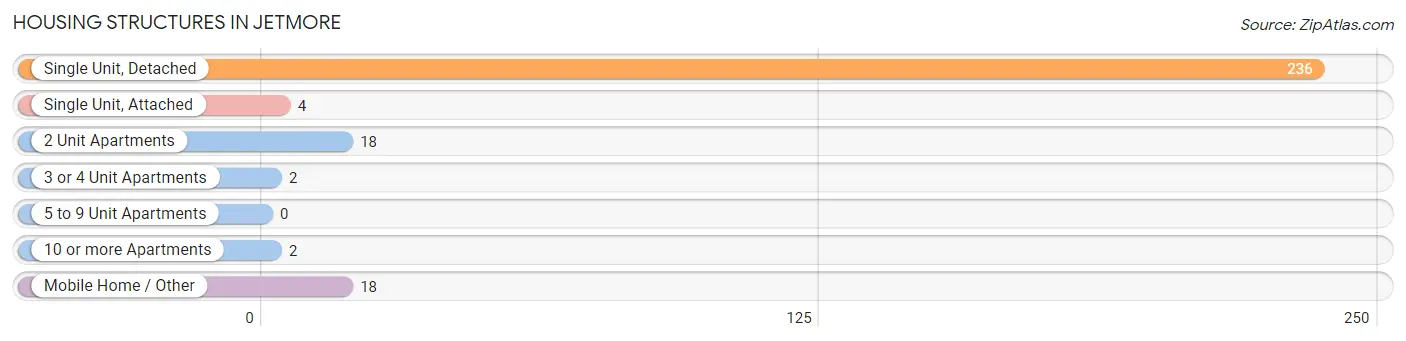
| Structure Type | # Housing Units | % Housing Units |
| Single Unit, Detached | 236 | 84.3% |
| Single Unit, Attached | 4 | 1.4% |
| 2 Unit Apartments | 18 | 6.4% |
| 3 or 4 Unit Apartments | 2 | 0.7% |
| 5 to 9 Unit Apartments | 0 | 0.0% |
| 10 or more Apartments | 2 | 0.7% |
| Mobile Home / Other | 18 | 6.4% |
| Total | 280 | 100.0% |
Housing Structures by Occupancy in Jetmore
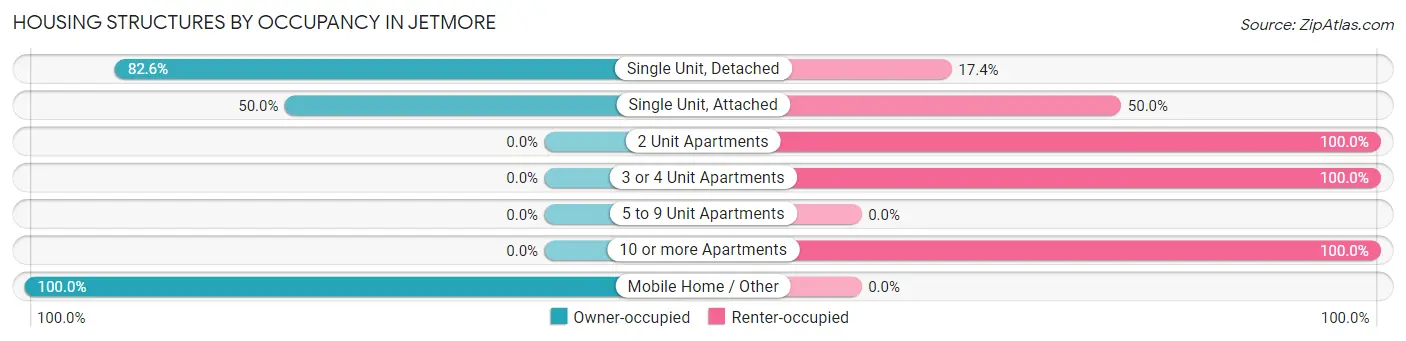
| Structure Type | Owner-occupied | Renter-occupied |
| Single Unit, Detached | 195 (82.6%) | 41 (17.4%) |
| Single Unit, Attached | 2 (50.0%) | 2 (50.0%) |
| 2 Unit Apartments | 0 (0.0%) | 18 (100.0%) |
| 3 or 4 Unit Apartments | 0 (0.0%) | 2 (100.0%) |
| 5 to 9 Unit Apartments | 0 (0.0%) | 0 (0.0%) |
| 10 or more Apartments | 0 (0.0%) | 2 (100.0%) |
| Mobile Home / Other | 18 (100.0%) | 0 (0.0%) |
| Total | 215 (76.8%) | 65 (23.2%) |
Housing Structures by Number of Rooms in Jetmore
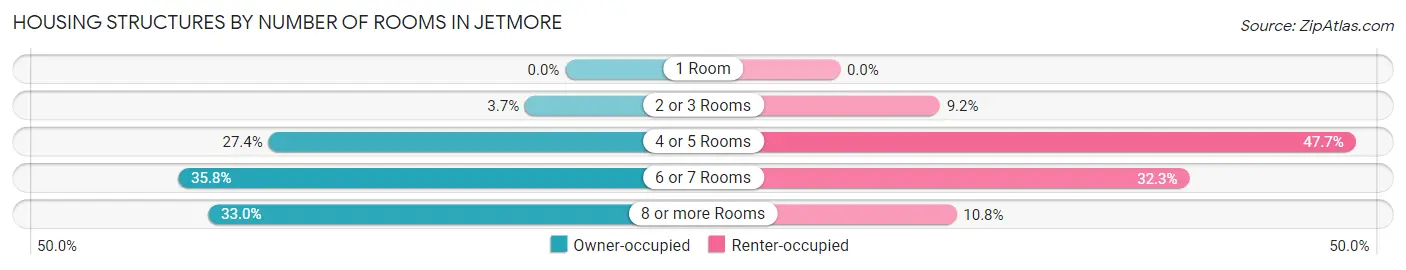
| Number of Rooms | Owner-occupied | Renter-occupied |
| 1 Room | 0 (0.0%) | 0 (0.0%) |
| 2 or 3 Rooms | 8 (3.7%) | 6 (9.2%) |
| 4 or 5 Rooms | 59 (27.4%) | 31 (47.7%) |
| 6 or 7 Rooms | 77 (35.8%) | 21 (32.3%) |
| 8 or more Rooms | 71 (33.0%) | 7 (10.8%) |
| Total | 215 (100.0%) | 65 (100.0%) |
Housing Structure by Heating Type in Jetmore
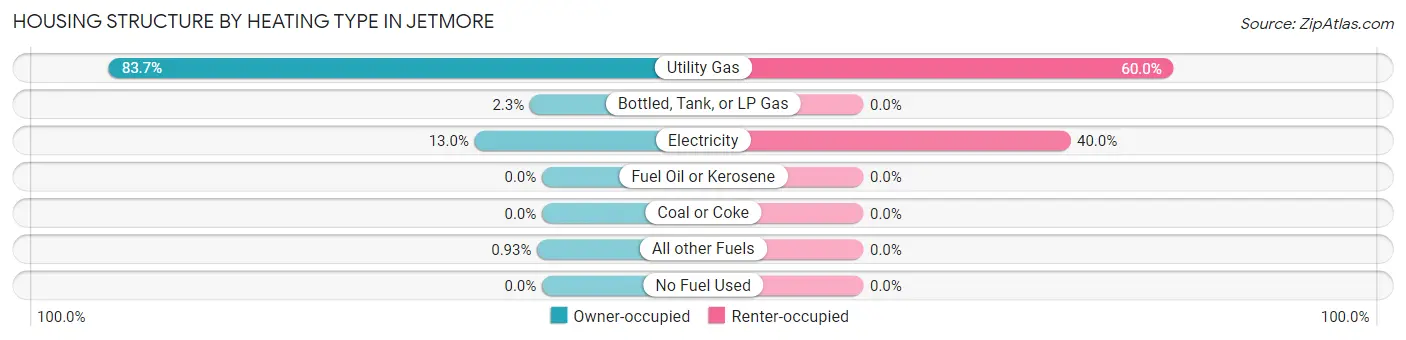
| Heating Type | Owner-occupied | Renter-occupied |
| Utility Gas | 180 (83.7%) | 39 (60.0%) |
| Bottled, Tank, or LP Gas | 5 (2.3%) | 0 (0.0%) |
| Electricity | 28 (13.0%) | 26 (40.0%) |
| Fuel Oil or Kerosene | 0 (0.0%) | 0 (0.0%) |
| Coal or Coke | 0 (0.0%) | 0 (0.0%) |
| All other Fuels | 2 (0.9%) | 0 (0.0%) |
| No Fuel Used | 0 (0.0%) | 0 (0.0%) |
| Total | 215 (100.0%) | 65 (100.0%) |
Household Vehicle Usage in Jetmore
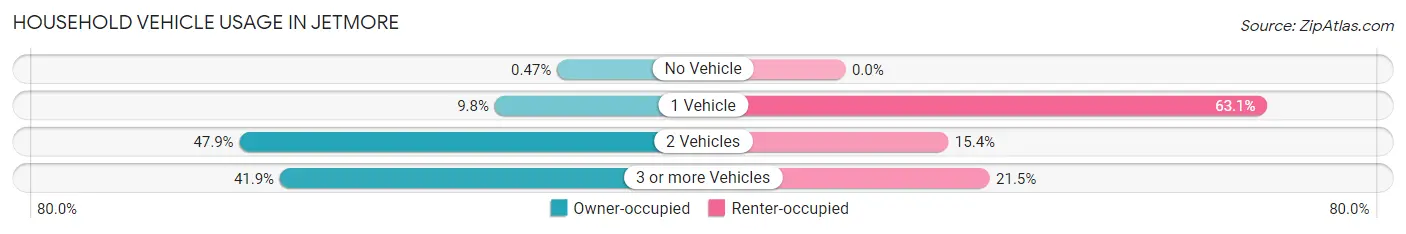
| Vehicles per Household | Owner-occupied | Renter-occupied |
| No Vehicle | 1 (0.5%) | 0 (0.0%) |
| 1 Vehicle | 21 (9.8%) | 41 (63.1%) |
| 2 Vehicles | 103 (47.9%) | 10 (15.4%) |
| 3 or more Vehicles | 90 (41.9%) | 14 (21.5%) |
| Total | 215 (100.0%) | 65 (100.0%) |
Real Estate & Mortgages in Jetmore
Real Estate and Mortgage Overview in Jetmore
| Characteristic | Without Mortgage | With Mortgage |
| Housing Units | 127 | 88 |
| Median Property Value | $67,100 | $137,500 |
| Median Household Income | $61,607 | $18 |
| Monthly Housing Costs | $543 | $0 |
| Real Estate Taxes | $1,519 | $0 |
Property Value by Mortgage Status in Jetmore
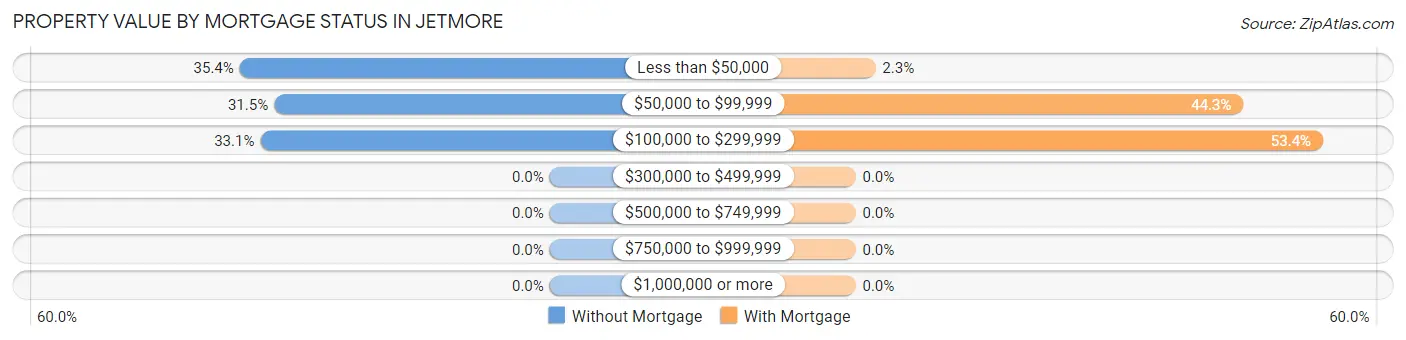
| Property Value | Without Mortgage | With Mortgage |
| Less than $50,000 | 45 (35.4%) | 2 (2.3%) |
| $50,000 to $99,999 | 40 (31.5%) | 39 (44.3%) |
| $100,000 to $299,999 | 42 (33.1%) | 47 (53.4%) |
| $300,000 to $499,999 | 0 (0.0%) | 0 (0.0%) |
| $500,000 to $749,999 | 0 (0.0%) | 0 (0.0%) |
| $750,000 to $999,999 | 0 (0.0%) | 0 (0.0%) |
| $1,000,000 or more | 0 (0.0%) | 0 (0.0%) |
| Total | 127 (100.0%) | 88 (100.0%) |
Household Income by Mortgage Status in Jetmore
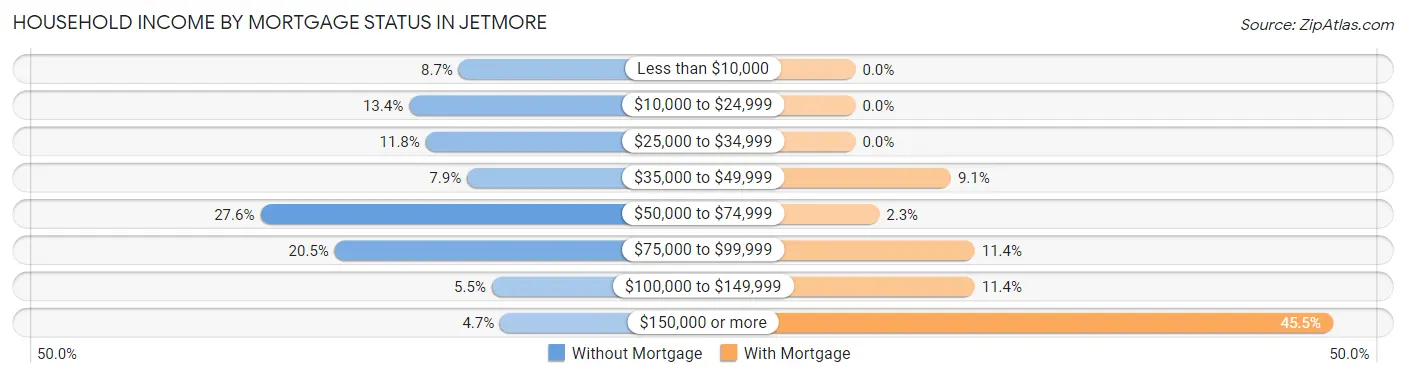
| Household Income | Without Mortgage | With Mortgage |
| Less than $10,000 | 11 (8.7%) | 0 (0.0%) |
| $10,000 to $24,999 | 17 (13.4%) | 0 (0.0%) |
| $25,000 to $34,999 | 15 (11.8%) | 0 (0.0%) |
| $35,000 to $49,999 | 10 (7.9%) | 8 (9.1%) |
| $50,000 to $74,999 | 35 (27.6%) | 2 (2.3%) |
| $75,000 to $99,999 | 26 (20.5%) | 10 (11.4%) |
| $100,000 to $149,999 | 7 (5.5%) | 10 (11.4%) |
| $150,000 or more | 6 (4.7%) | 40 (45.5%) |
| Total | 127 (100.0%) | 88 (100.0%) |
Property Value to Household Income Ratio in Jetmore
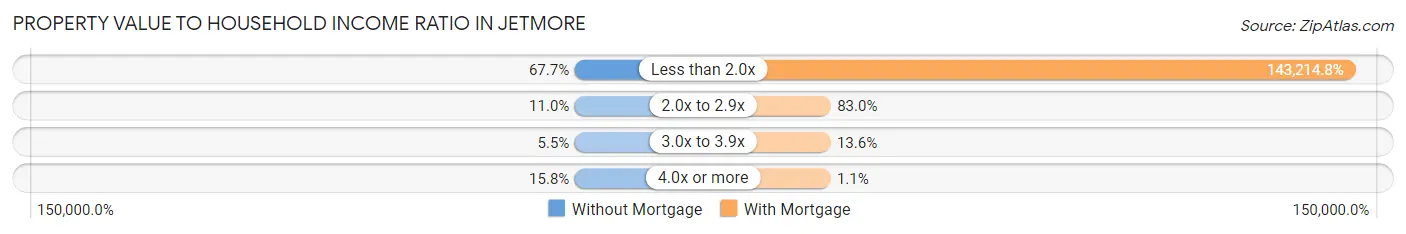
| Value-to-Income Ratio | Without Mortgage | With Mortgage |
| Less than 2.0x | 86 (67.7%) | 126,029 (143,214.8%) |
| 2.0x to 2.9x | 14 (11.0%) | 73 (83.0%) |
| 3.0x to 3.9x | 7 (5.5%) | 12 (13.6%) |
| 4.0x or more | 20 (15.8%) | 1 (1.1%) |
| Total | 127 (100.0%) | 88 (100.0%) |
Real Estate Taxes by Mortgage Status in Jetmore
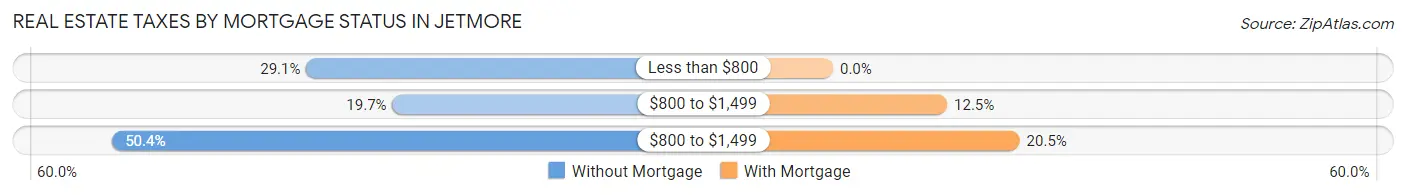
| Property Taxes | Without Mortgage | With Mortgage |
| Less than $800 | 37 (29.1%) | 0 (0.0%) |
| $800 to $1,499 | 25 (19.7%) | 11 (12.5%) |
| $800 to $1,499 | 64 (50.4%) | 18 (20.4%) |
| Total | 127 (100.0%) | 88 (100.0%) |
Health & Disability in Jetmore
Health Insurance Coverage by Age in Jetmore
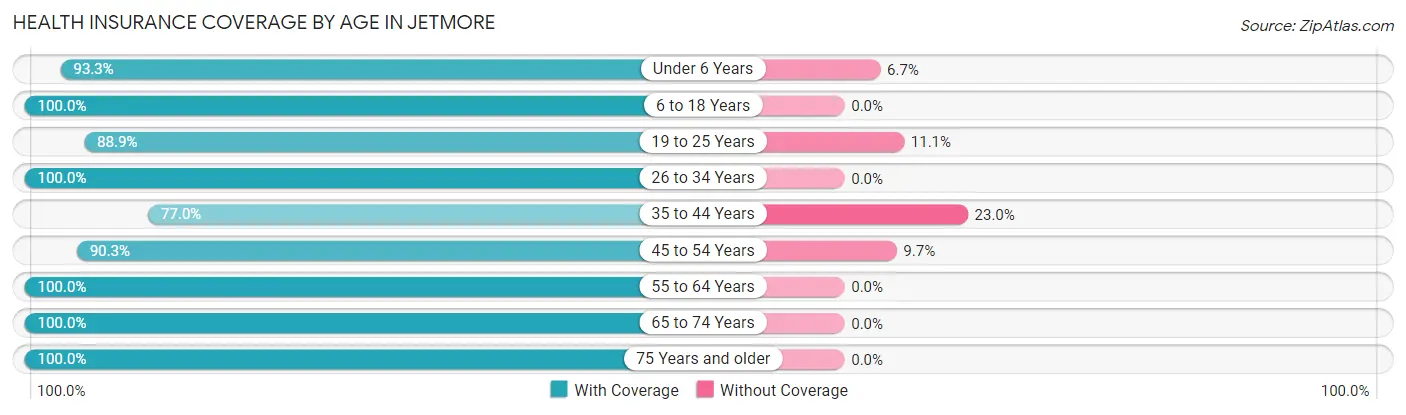
| Age Bracket | With Coverage | Without Coverage |
| Under 6 Years | 42 (93.3%) | 3 (6.7%) |
| 6 to 18 Years | 126 (100.0%) | 0 (0.0%) |
| 19 to 25 Years | 64 (88.9%) | 8 (11.1%) |
| 26 to 34 Years | 41 (100.0%) | 0 (0.0%) |
| 35 to 44 Years | 77 (77.0%) | 23 (23.0%) |
| 45 to 54 Years | 65 (90.3%) | 7 (9.7%) |
| 55 to 64 Years | 94 (100.0%) | 0 (0.0%) |
| 65 to 74 Years | 72 (100.0%) | 0 (0.0%) |
| 75 Years and older | 63 (100.0%) | 0 (0.0%) |
| Total | 644 (94.0%) | 41 (6.0%) |
Health Insurance Coverage by Citizenship Status in Jetmore
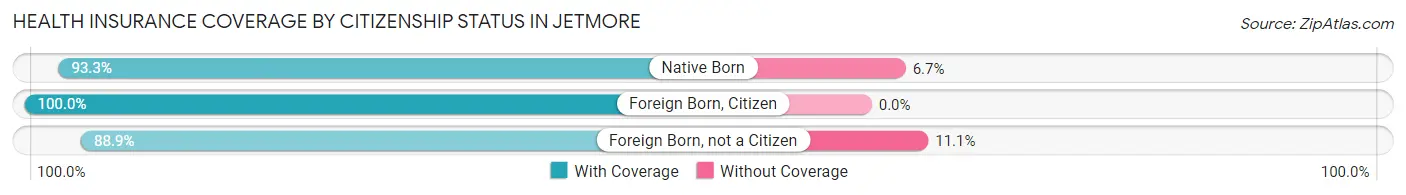
| Citizenship Status | With Coverage | Without Coverage |
| Native Born | 42 (93.3%) | 3 (6.7%) |
| Foreign Born, Citizen | 126 (100.0%) | 0 (0.0%) |
| Foreign Born, not a Citizen | 64 (88.9%) | 8 (11.1%) |
Health Insurance Coverage by Household Income in Jetmore
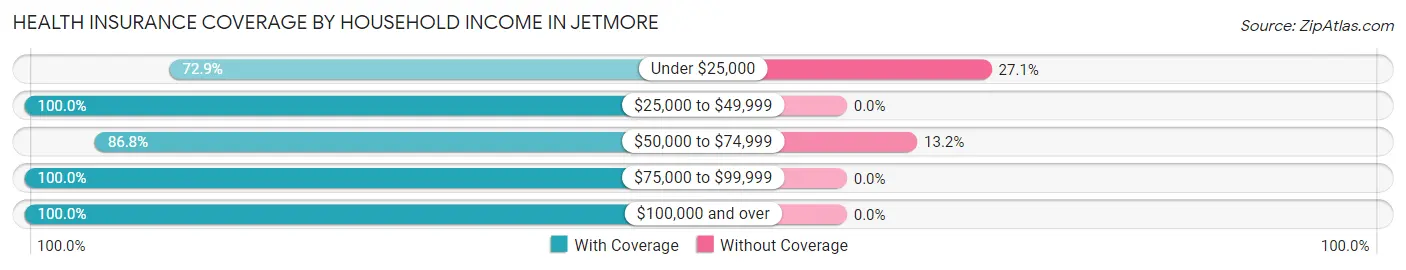
| Household Income | With Coverage | Without Coverage |
| Under $25,000 | 51 (72.9%) | 19 (27.1%) |
| $25,000 to $49,999 | 85 (100.0%) | 0 (0.0%) |
| $50,000 to $74,999 | 145 (86.8%) | 22 (13.2%) |
| $75,000 to $99,999 | 105 (100.0%) | 0 (0.0%) |
| $100,000 and over | 258 (100.0%) | 0 (0.0%) |
Public vs Private Health Insurance Coverage by Age in Jetmore
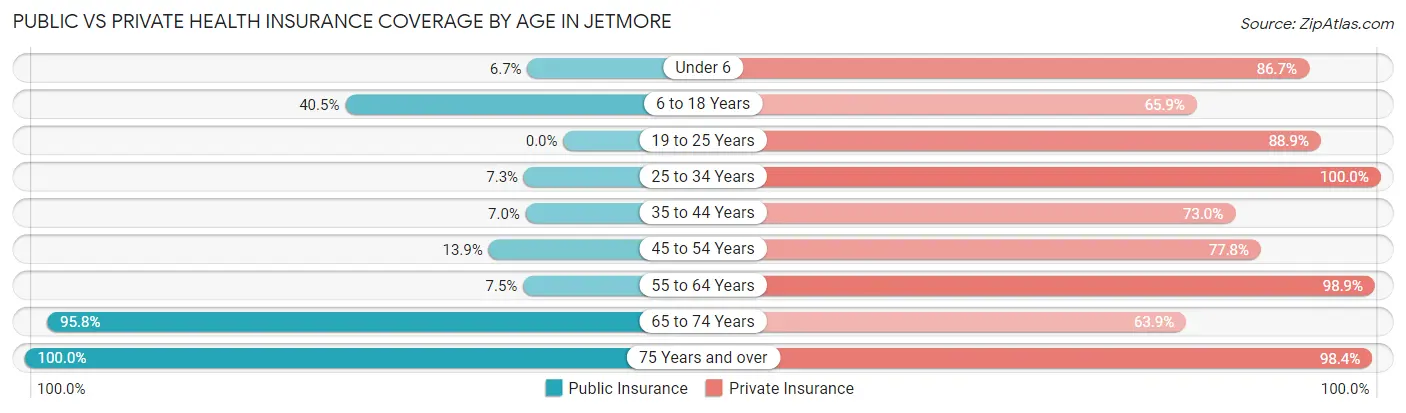
| Age Bracket | Public Insurance | Private Insurance |
| Under 6 | 3 (6.7%) | 39 (86.7%) |
| 6 to 18 Years | 51 (40.5%) | 83 (65.9%) |
| 19 to 25 Years | 0 (0.0%) | 64 (88.9%) |
| 25 to 34 Years | 3 (7.3%) | 41 (100.0%) |
| 35 to 44 Years | 7 (7.0%) | 73 (73.0%) |
| 45 to 54 Years | 10 (13.9%) | 56 (77.8%) |
| 55 to 64 Years | 7 (7.4%) | 93 (98.9%) |
| 65 to 74 Years | 69 (95.8%) | 46 (63.9%) |
| 75 Years and over | 63 (100.0%) | 62 (98.4%) |
| Total | 213 (31.1%) | 557 (81.3%) |
Disability Status by Sex by Age in Jetmore
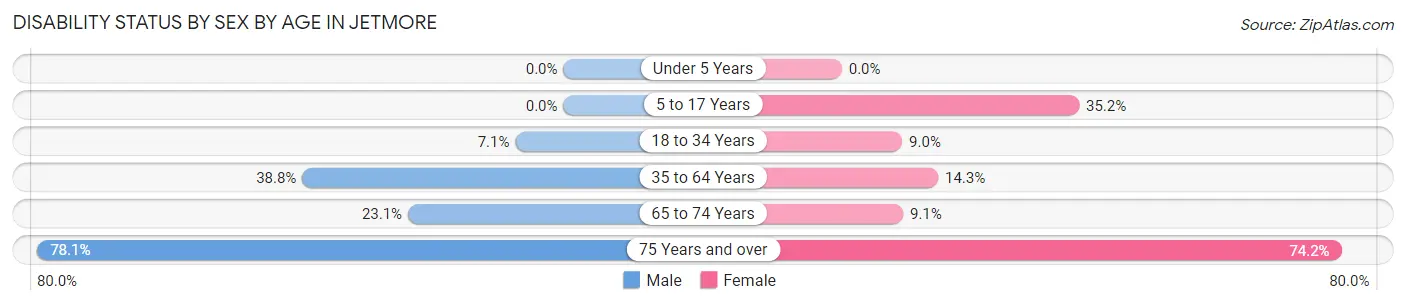
| Age Bracket | Male | Female |
| Under 5 Years | 0 (0.0%) | 0 (0.0%) |
| 5 to 17 Years | 0 (0.0%) | 31 (35.2%) |
| 18 to 34 Years | 4 (7.1%) | 6 (9.0%) |
| 35 to 64 Years | 57 (38.8%) | 17 (14.3%) |
| 65 to 74 Years | 9 (23.1%) | 3 (9.1%) |
| 75 Years and over | 25 (78.1%) | 23 (74.2%) |
Disability Class by Sex by Age in Jetmore
Disability Class: Hearing Difficulty
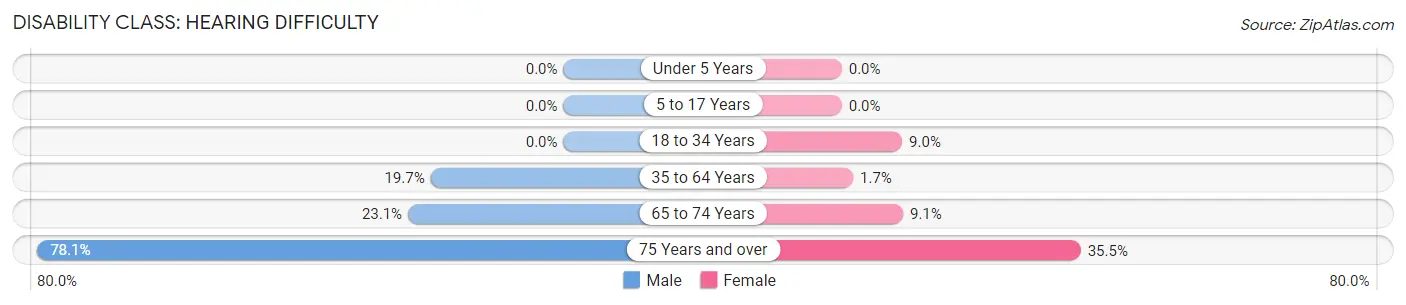
| Age Bracket | Male | Female |
| Under 5 Years | 0 (0.0%) | 0 (0.0%) |
| 5 to 17 Years | 0 (0.0%) | 0 (0.0%) |
| 18 to 34 Years | 0 (0.0%) | 6 (9.0%) |
| 35 to 64 Years | 29 (19.7%) | 2 (1.7%) |
| 65 to 74 Years | 9 (23.1%) | 3 (9.1%) |
| 75 Years and over | 25 (78.1%) | 11 (35.5%) |
Disability Class: Vision Difficulty
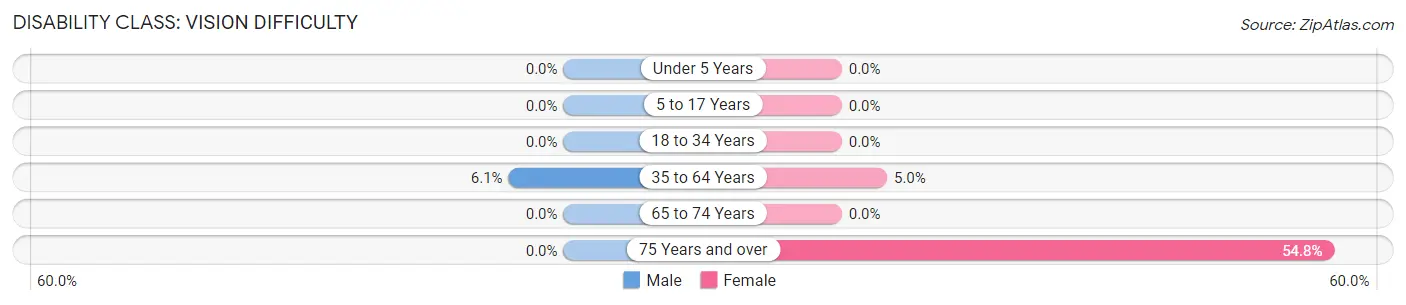
| Age Bracket | Male | Female |
| Under 5 Years | 0 (0.0%) | 0 (0.0%) |
| 5 to 17 Years | 0 (0.0%) | 0 (0.0%) |
| 18 to 34 Years | 0 (0.0%) | 0 (0.0%) |
| 35 to 64 Years | 9 (6.1%) | 6 (5.0%) |
| 65 to 74 Years | 0 (0.0%) | 0 (0.0%) |
| 75 Years and over | 0 (0.0%) | 17 (54.8%) |
Disability Class: Cognitive Difficulty
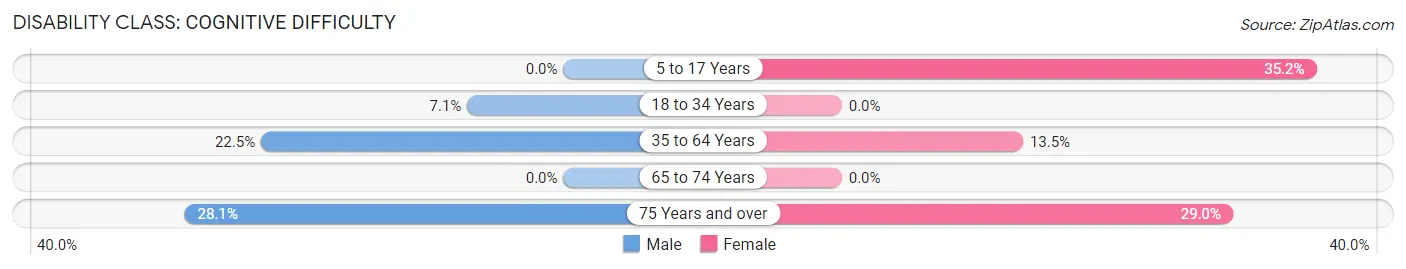
| Age Bracket | Male | Female |
| 5 to 17 Years | 0 (0.0%) | 31 (35.2%) |
| 18 to 34 Years | 4 (7.1%) | 0 (0.0%) |
| 35 to 64 Years | 33 (22.5%) | 16 (13.5%) |
| 65 to 74 Years | 0 (0.0%) | 0 (0.0%) |
| 75 Years and over | 9 (28.1%) | 9 (29.0%) |
Disability Class: Ambulatory Difficulty
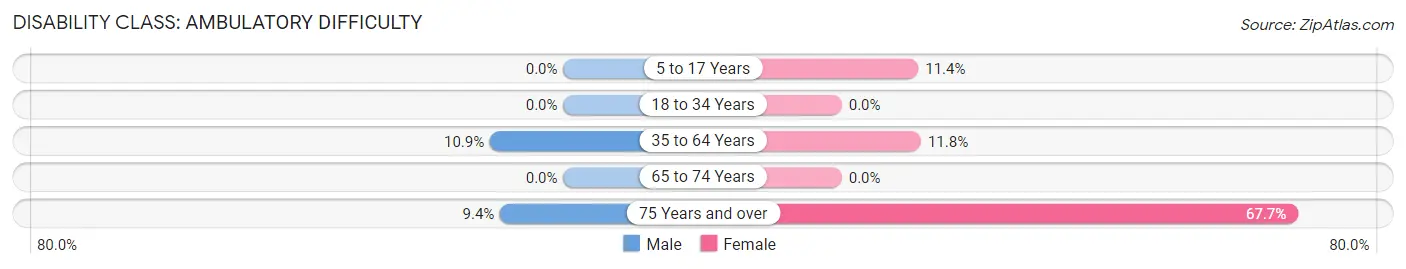
| Age Bracket | Male | Female |
| 5 to 17 Years | 0 (0.0%) | 10 (11.4%) |
| 18 to 34 Years | 0 (0.0%) | 0 (0.0%) |
| 35 to 64 Years | 16 (10.9%) | 14 (11.8%) |
| 65 to 74 Years | 0 (0.0%) | 0 (0.0%) |
| 75 Years and over | 3 (9.4%) | 21 (67.7%) |
Disability Class: Self-Care Difficulty
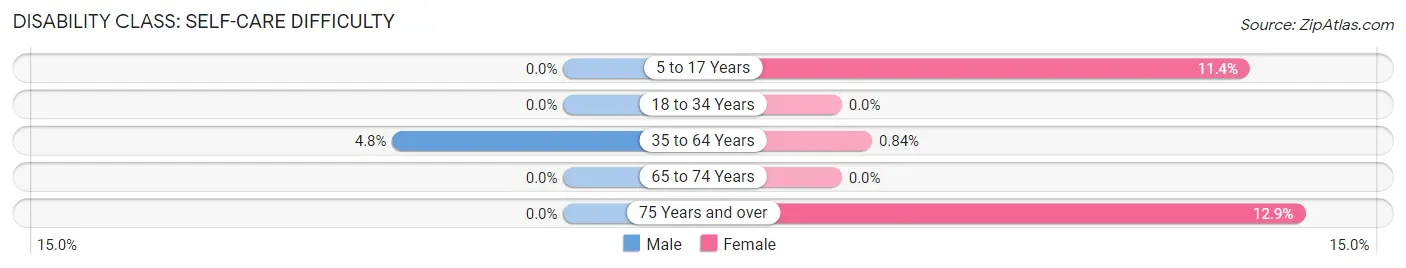
| Age Bracket | Male | Female |
| 5 to 17 Years | 0 (0.0%) | 10 (11.4%) |
| 18 to 34 Years | 0 (0.0%) | 0 (0.0%) |
| 35 to 64 Years | 7 (4.8%) | 1 (0.8%) |
| 65 to 74 Years | 0 (0.0%) | 0 (0.0%) |
| 75 Years and over | 0 (0.0%) | 4 (12.9%) |
Technology Access in Jetmore
Computing Device Access in Jetmore
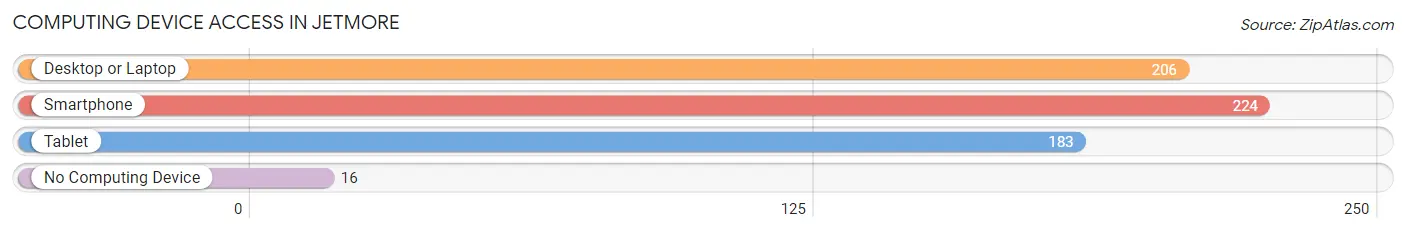
| Device Type | # Households | % Households |
| Desktop or Laptop | 206 | 73.6% |
| Smartphone | 224 | 80.0% |
| Tablet | 183 | 65.4% |
| No Computing Device | 16 | 5.7% |
| Total | 280 | 100.0% |
Internet Access in Jetmore
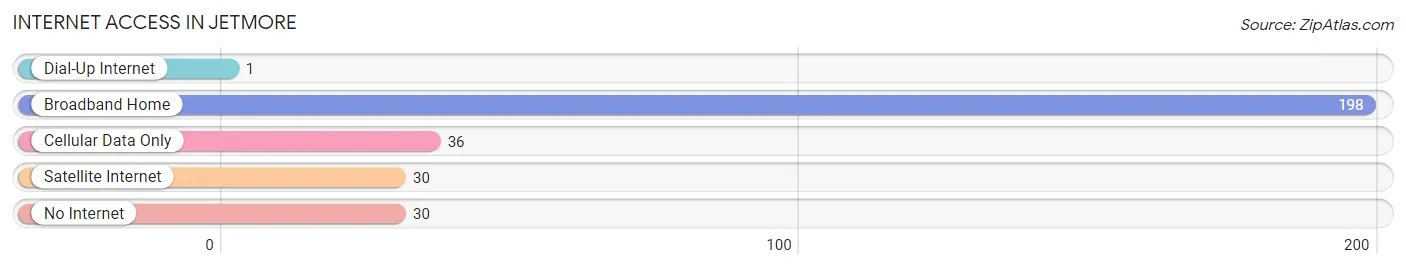
| Internet Type | # Households | % Households |
| Dial-Up Internet | 1 | 0.4% |
| Broadband Home | 198 | 70.7% |
| Cellular Data Only | 36 | 12.9% |
| Satellite Internet | 30 | 10.7% |
| No Internet | 30 | 10.7% |
| Total | 280 | 100.0% |
Jetmore Summary
History
The city of Jetmore, Kansas is located in Hodgeman County in the southwestern part of the state. It was founded in 1885 and was named after the Jetmore family, who were early settlers in the area. The city was incorporated in 1887 and has a population of 1,619 as of the 2010 census.
The first settlers in the area were the Jetmore family, who arrived in 1878. They were followed by other settlers, including the families of William and Mary Ann Johnson, who arrived in 1879. The Johnson family built the first house in the area, which is now the site of the Jetmore Museum.
The city was officially founded in 1885 and was named after the Jetmore family. The first post office was established in 1886 and the first school was built in 1887. The city was incorporated in 1887 and the first mayor was elected in 1888.
The city grew rapidly in the late 19th and early 20th centuries, with the population reaching 1,000 by 1910. The city was a major agricultural center, with wheat, corn, and other crops being grown in the area. The city also had a number of businesses, including a bank, a newspaper, a hotel, and a number of stores.
The city experienced a period of decline in the mid-20th century, as many of the businesses closed and the population decreased. However, the city has seen a resurgence in recent years, with new businesses opening and the population increasing.
Geography
Jetmore is located in southwestern Kansas, in Hodgeman County. It is situated at the intersection of U.S. Route 56 and Kansas Highway 4. The city is located about 50 miles west of Dodge City and about 100 miles east of Garden City.
The city is located in the High Plains region of the Great Plains, with an elevation of 2,845 feet. The climate is semi-arid, with hot summers and cold winters. The average annual precipitation is about 17 inches.
Economy
The economy of Jetmore is largely based on agriculture. Wheat, corn, and other crops are grown in the area, and the city is home to several grain elevators. The city also has a number of businesses, including a bank, a newspaper, a hotel, and a number of stores.
The city is also home to a number of manufacturing companies, including a plastics manufacturer and a metal fabrication company. The city is also home to a number of service-based businesses, including a hospital, a nursing home, and a number of restaurants.
Demographics
As of the 2010 census, the population of Jetmore was 1,619. The racial makeup of the city was 95.2% White, 0.6% African American, 0.4% Native American, 0.2% Asian, 0.1% Pacific Islander, 1.7% from other races, and 1.8% from two or more races. Hispanic or Latino of any race were 4.2% of the population.
The median household income in Jetmore was $37,917, and the median family income was $45,625. The per capita income was $19,945. About 11.2% of families and 14.2% of the population were below the poverty line, including 19.2% of those under age 18 and 8.2% of those age 65 or over.
Common Questions
What is Per Capita Income in Jetmore?
Per Capita income in Jetmore is $31,485.
What is the Median Family Income in Jetmore?
Median Family Income in Jetmore is $84,531.
What is the Median Household income in Jetmore?
Median Household Income in Jetmore is $67,885.
What is Income or Wage Gap in Jetmore?
Income or Wage Gap in Jetmore is 27.8%.
Women in Jetmore earn 72.2 cents for every dollar earned by a man.
What is Inequality or Gini Index in Jetmore?
Inequality or Gini Index in Jetmore is 0.39.
What is the Total Population of Jetmore?
Total Population of Jetmore is 708.
What is the Total Male Population of Jetmore?
Total Male Population of Jetmore is 345.
What is the Total Female Population of Jetmore?
Total Female Population of Jetmore is 363.
What is the Ratio of Males per 100 Females in Jetmore?
There are 95.04 Males per 100 Females in Jetmore.
What is the Ratio of Females per 100 Males in Jetmore?
There are 105.22 Females per 100 Males in Jetmore.
What is the Median Population Age in Jetmore?
Median Population Age in Jetmore is 41.3 Years.
What is the Average Family Size in Jetmore
Average Family Size in Jetmore is 3.2 People.
What is the Average Household Size in Jetmore
Average Household Size in Jetmore is 2.5 People.
How Large is the Labor Force in Jetmore?
There are 362 People in the Labor Forcein in Jetmore.
What is the Percentage of People in the Labor Force in Jetmore?
62.0% of People are in the Labor Force in Jetmore.
What is the Unemployment Rate in Jetmore?
Unemployment Rate in Jetmore is 1.4%.