Iola, KS Map & Demographics
Iola Map
Iola Overview
$23,718
PER CAPITA INCOME
$56,823
AVG FAMILY INCOME
$46,351
AVG HOUSEHOLD INCOME
31.9%
WAGE / INCOME GAP [ % ]
68.1¢/ $1
WAGE / INCOME GAP [ $ ]
0.38
INEQUALITY / GINI INDEX
5,395
TOTAL POPULATION
2,566
MALE POPULATION
2,829
FEMALE POPULATION
90.70
MALES / 100 FEMALES
110.25
FEMALES / 100 MALES
37.2
MEDIAN AGE
3.0
AVG FAMILY SIZE
2.3
AVG HOUSEHOLD SIZE
2,479
LABOR FORCE [ PEOPLE ]
57.6%
PERCENT IN LABOR FORCE
6.7%
UNEMPLOYMENT RATE
Iola Zip Codes
Iola Area Codes
Income in Iola
Income Overview in Iola
Per Capita Income in Iola is $23,718, while median incomes of families and households are $56,823 and $46,351 respectively.
| Characteristic | Number | Measure |
| Per Capita Income | 5,395 | $23,718 |
| Median Family Income | 1,331 | $56,823 |
| Mean Family Income | 1,331 | $65,202 |
| Median Household Income | 2,178 | $46,351 |
| Mean Household Income | 2,178 | $55,991 |
| Income Deficit | 1,331 | $0 |
| Wage / Income Gap (%) | 5,395 | 31.88% |
| Wage / Income Gap ($) | 5,395 | 68.12¢ per $1 |
| Gini / Inequality Index | 5,395 | 0.38 |
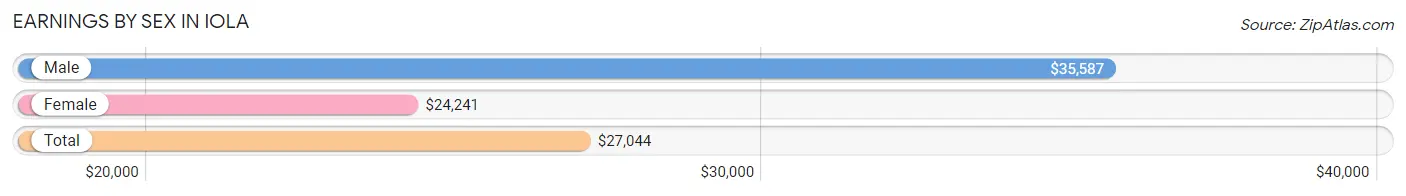
Earnings by Sex in Iola
Average Earnings in Iola are $27,044, $35,587 for men and $24,241 for women, a difference of 31.9%.
| Sex | Number | Average Earnings |
| Male | 1,323 (50.1%) | $35,587 |
| Female | 1,316 (49.9%) | $24,241 |
| Total | 2,639 (100.0%) | $27,044 |
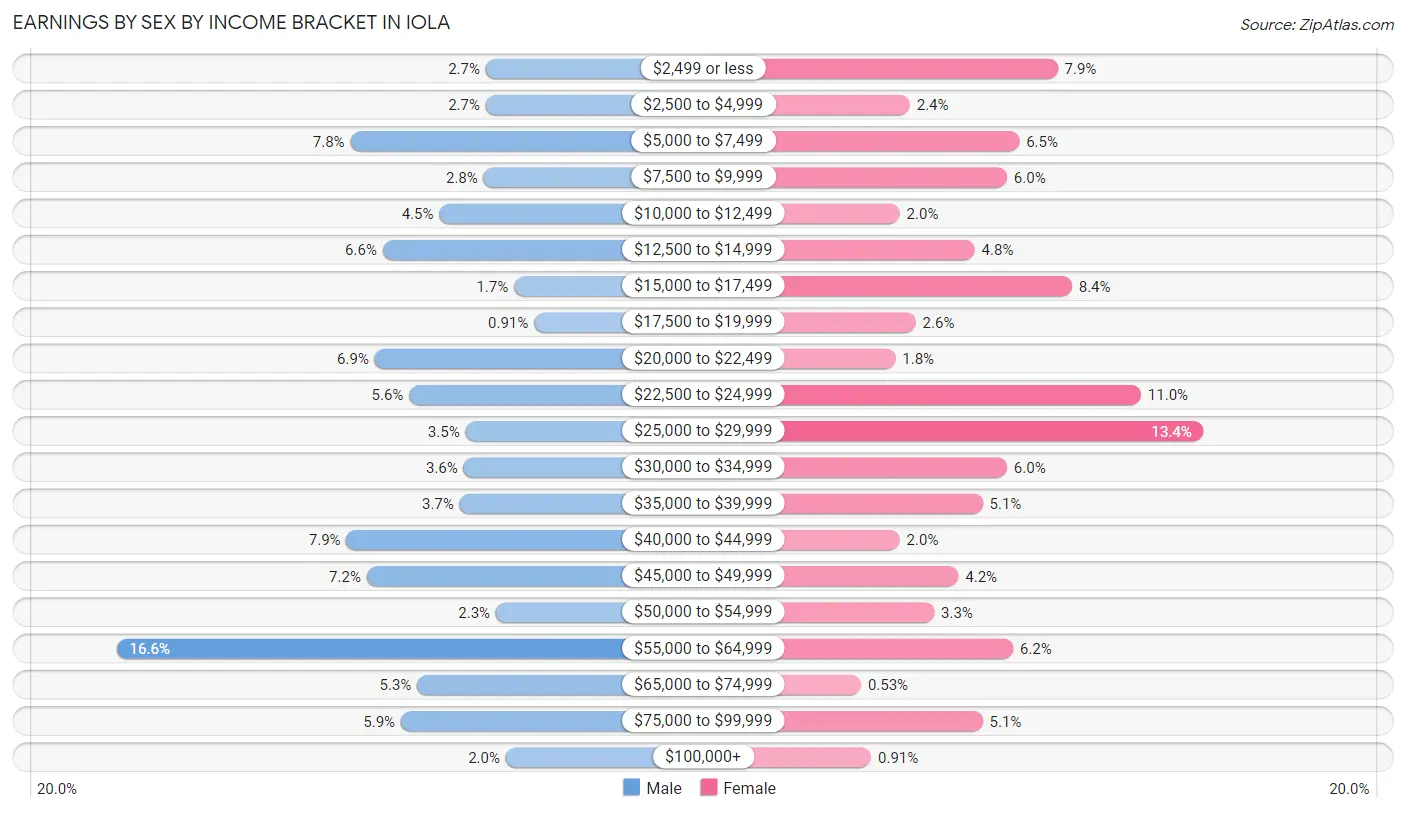
Earnings by Sex by Income Bracket in Iola
The most common earnings brackets in Iola are $55,000 to $64,999 for men (219 | 16.6%) and $25,000 to $29,999 for women (176 | 13.4%).
| Income | Male | Female |
| $2,499 or less | 36 (2.7%) | 104 (7.9%) |
| $2,500 to $4,999 | 36 (2.7%) | 31 (2.4%) |
| $5,000 to $7,499 | 103 (7.8%) | 85 (6.5%) |
| $7,500 to $9,999 | 37 (2.8%) | 79 (6.0%) |
| $10,000 to $12,499 | 59 (4.5%) | 26 (2.0%) |
| $12,500 to $14,999 | 87 (6.6%) | 63 (4.8%) |
| $15,000 to $17,499 | 22 (1.7%) | 111 (8.4%) |
| $17,500 to $19,999 | 12 (0.9%) | 34 (2.6%) |
| $20,000 to $22,499 | 91 (6.9%) | 24 (1.8%) |
| $22,500 to $24,999 | 74 (5.6%) | 145 (11.0%) |
| $25,000 to $29,999 | 46 (3.5%) | 176 (13.4%) |
| $30,000 to $34,999 | 47 (3.5%) | 79 (6.0%) |
| $35,000 to $39,999 | 49 (3.7%) | 67 (5.1%) |
| $40,000 to $44,999 | 105 (7.9%) | 26 (2.0%) |
| $45,000 to $49,999 | 95 (7.2%) | 55 (4.2%) |
| $50,000 to $54,999 | 31 (2.3%) | 43 (3.3%) |
| $55,000 to $64,999 | 219 (16.6%) | 82 (6.2%) |
| $65,000 to $74,999 | 70 (5.3%) | 7 (0.5%) |
| $75,000 to $99,999 | 78 (5.9%) | 67 (5.1%) |
| $100,000+ | 26 (2.0%) | 12 (0.9%) |
| Total | 1,323 (100.0%) | 1,316 (100.0%) |
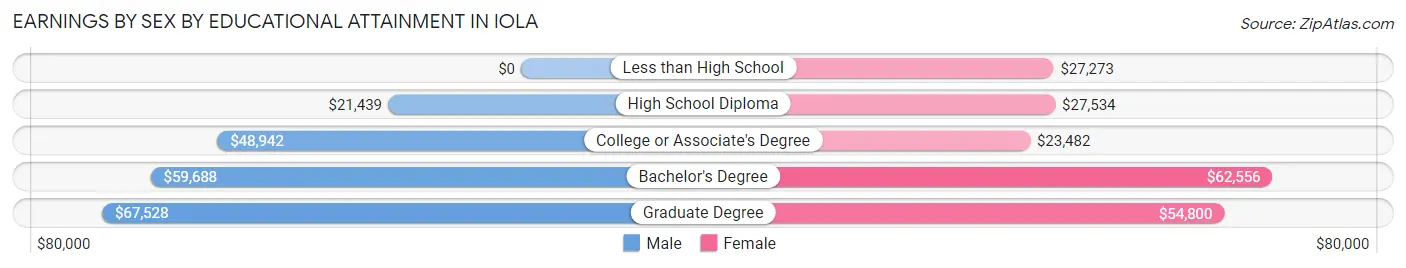
Earnings by Sex by Educational Attainment in Iola
Average earnings in Iola are $41,315 for men and $27,920 for women, a difference of 32.4%. Men with an educational attainment of graduate degree enjoy the highest average annual earnings of $67,528, while those with high school diploma education earn the least with $21,439. Women with an educational attainment of bachelor's degree earn the most with the average annual earnings of $62,556, while those with college or associate's degree education have the smallest earnings of $23,482.
| Educational Attainment | Male Income | Female Income |
| Less than High School | - | - |
| High School Diploma | $21,439 | $27,534 |
| College or Associate's Degree | $48,942 | $23,482 |
| Bachelor's Degree | $59,688 | $62,556 |
| Graduate Degree | $67,528 | $54,800 |
| Total | $41,315 | $27,920 |
Family Income in Iola
Family Income Brackets in Iola
According to the Iola family income data, there are 302 families falling into the $50,000 to $74,999 income range, which is the most common income bracket and makes up 22.7% of all families. Conversely, the $150,000 to $199,999 income bracket is the least frequent group with only 9 families (0.7%) belonging to this category.
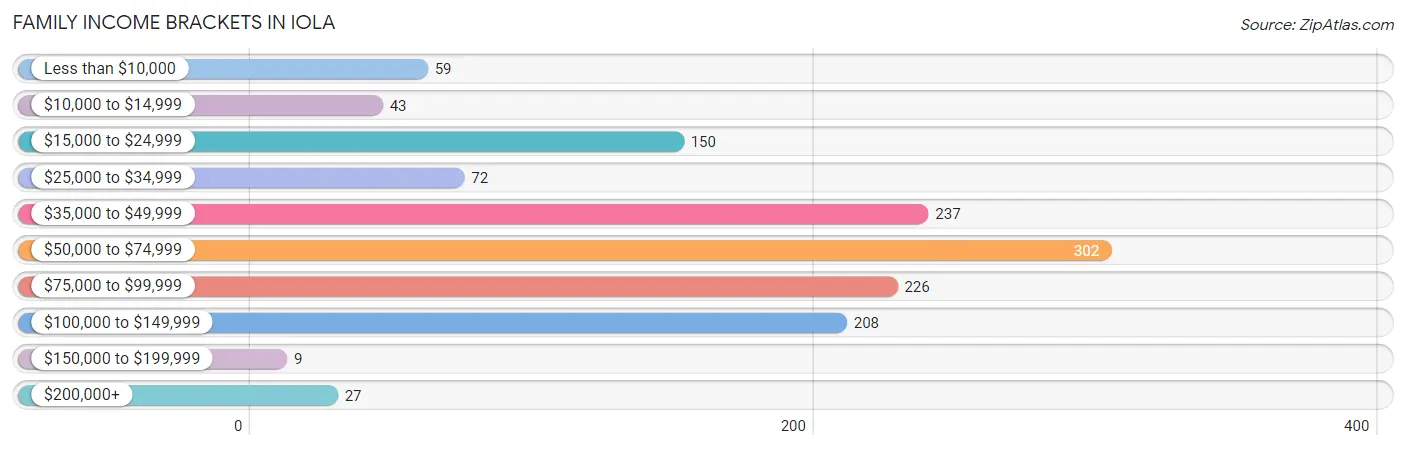
| Income Bracket | # Families | % Families |
| Less than $10,000 | 59 | 4.4% |
| $10,000 to $14,999 | 43 | 3.2% |
| $15,000 to $24,999 | 150 | 11.3% |
| $25,000 to $34,999 | 72 | 5.4% |
| $35,000 to $49,999 | 237 | 17.8% |
| $50,000 to $74,999 | 302 | 22.7% |
| $75,000 to $99,999 | 226 | 17.0% |
| $100,000 to $149,999 | 208 | 15.6% |
| $150,000 to $199,999 | 9 | 0.7% |
| $200,000+ | 27 | 2.0% |
Family Income by Famaliy Size in Iola
4-person families (204 | 15.3%) account for the highest median family income in Iola with $57,375 per family, while 2-person families (818 | 61.5%) have the highest median income of $27,716 per family member.
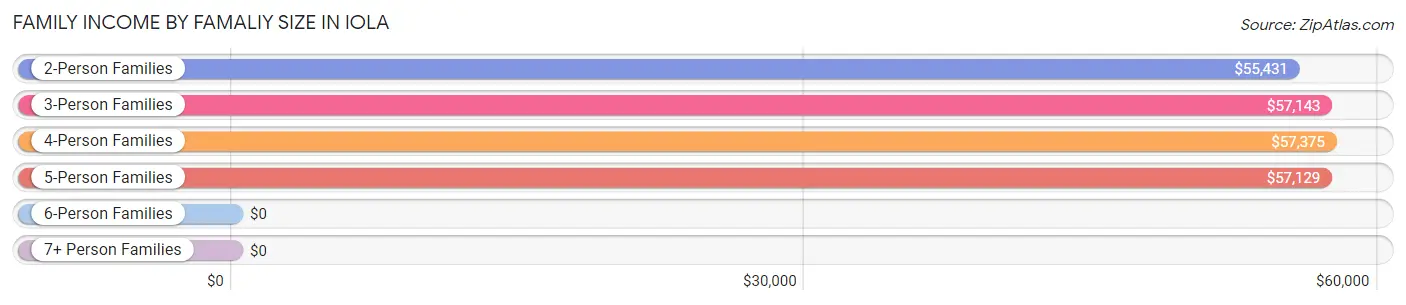
| Income Bracket | # Families | Median Income |
| 2-Person Families | 818 (61.5%) | $55,431 |
| 3-Person Families | 130 (9.8%) | $57,143 |
| 4-Person Families | 204 (15.3%) | $57,375 |
| 5-Person Families | 157 (11.8%) | $57,129 |
| 6-Person Families | 8 (0.6%) | $0 |
| 7+ Person Families | 14 (1.1%) | $0 |
| Total | 1,331 (100.0%) | $56,823 |
Family Income by Number of Earners in Iola
The median family income in Iola is $56,823, with families comprising 2 earners (468) having the highest median family income of $94,500, while families with no earners (322) have the lowest median family income of $31,136, accounting for 35.2% and 24.2% of families, respectively.
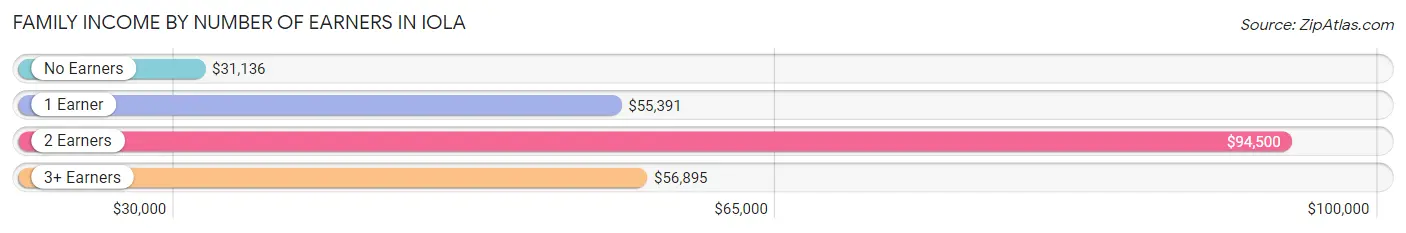
| Number of Earners | # Families | Median Income |
| No Earners | 322 (24.2%) | $31,136 |
| 1 Earner | 422 (31.7%) | $55,391 |
| 2 Earners | 468 (35.2%) | $94,500 |
| 3+ Earners | 119 (8.9%) | $56,895 |
| Total | 1,331 (100.0%) | $56,823 |
Household Income in Iola
Household Income Brackets in Iola
With 486 households falling in the category, the $50,000 to $74,999 income range is the most frequent in Iola, accounting for 22.3% of all households. In contrast, only 22 households (1.0%) fall into the $150,000 to $199,999 income bracket, making it the least populous group.
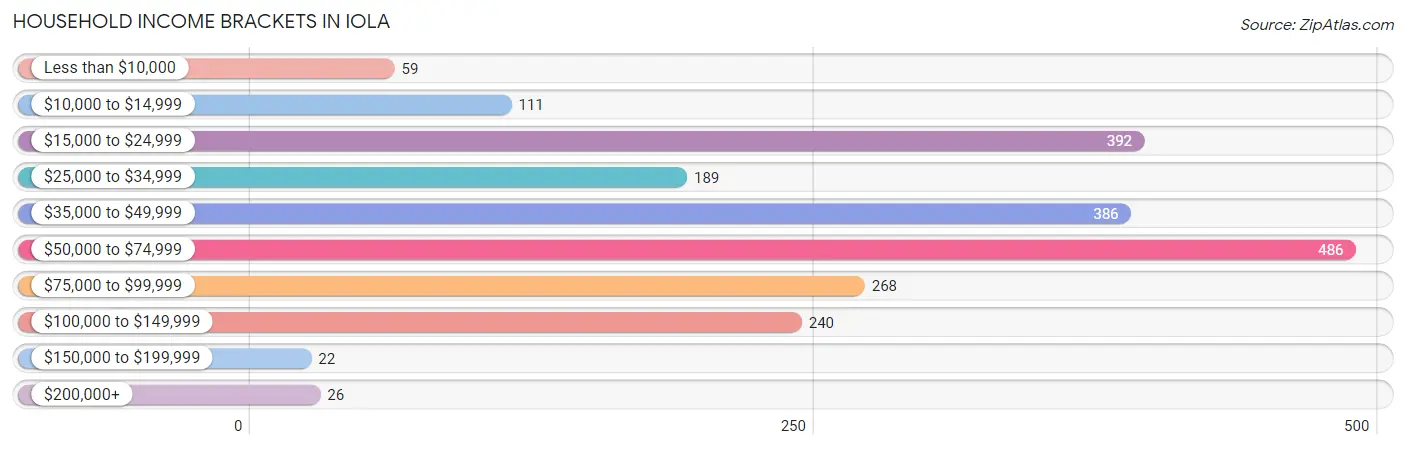
| Income Bracket | # Households | % Households |
| Less than $10,000 | 59 | 2.7% |
| $10,000 to $14,999 | 111 | 5.1% |
| $15,000 to $24,999 | 392 | 18.0% |
| $25,000 to $34,999 | 189 | 8.7% |
| $35,000 to $49,999 | 386 | 17.7% |
| $50,000 to $74,999 | 486 | 22.3% |
| $75,000 to $99,999 | 268 | 12.3% |
| $100,000 to $149,999 | 240 | 11.0% |
| $150,000 to $199,999 | 22 | 1.0% |
| $200,000+ | 26 | 1.2% |
Household Income by Householder Age in Iola
The median household income in Iola is $46,351, with the highest median household income of $57,972 found in the 45 to 64 years age bracket for the primary householder. A total of 657 households (30.2%) fall into this category. Meanwhile, the 15 to 24 years age bracket for the primary householder has the lowest median household income of $36,477, with 132 households (6.1%) in this group.
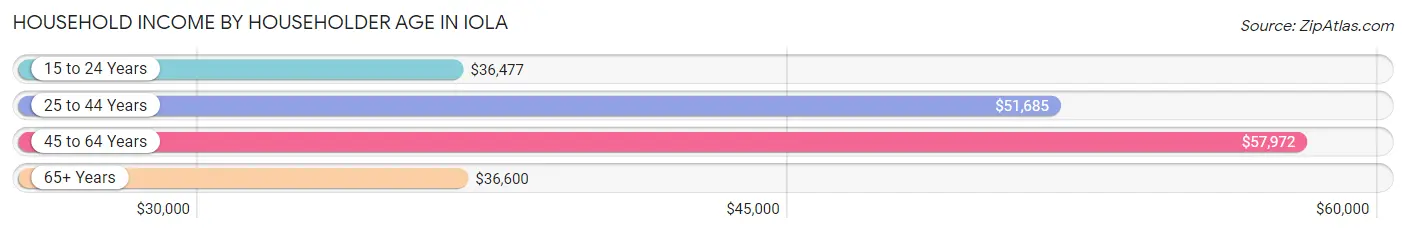
| Income Bracket | # Households | Median Income |
| 15 to 24 Years | 132 (6.1%) | $36,477 |
| 25 to 44 Years | 665 (30.5%) | $51,685 |
| 45 to 64 Years | 657 (30.2%) | $57,972 |
| 65+ Years | 724 (33.2%) | $36,600 |
| Total | 2,178 (100.0%) | $46,351 |
Poverty in Iola
Income Below Poverty by Sex and Age in Iola
With 18.0% poverty level for males and 20.8% for females among the residents of Iola, 12 to 14 year old males and 6 to 11 year old females are the most vulnerable to poverty, with 61 males (64.9%) and 109 females (48.0%) in their respective age groups living below the poverty level.
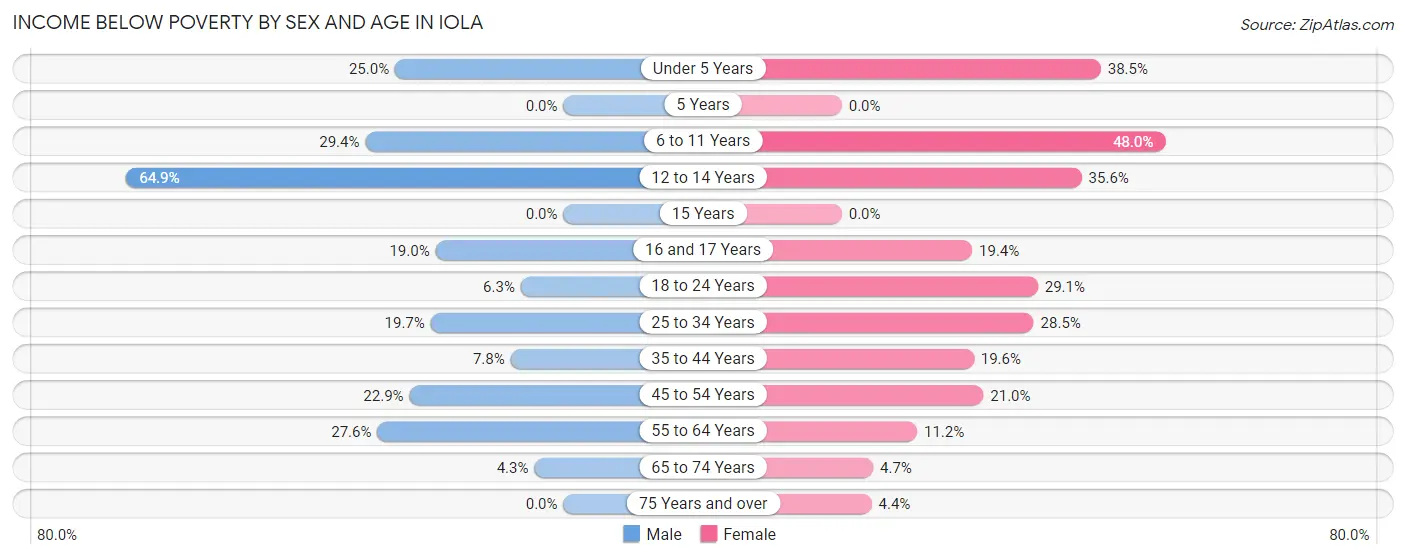
| Age Bracket | Male | Female |
| Under 5 Years | 33 (25.0%) | 60 (38.5%) |
| 5 Years | 0 (0.0%) | 0 (0.0%) |
| 6 to 11 Years | 95 (29.4%) | 109 (48.0%) |
| 12 to 14 Years | 61 (64.9%) | 26 (35.6%) |
| 15 Years | 0 (0.0%) | 0 (0.0%) |
| 16 and 17 Years | 15 (19.0%) | 12 (19.4%) |
| 18 to 24 Years | 14 (6.3%) | 55 (29.1%) |
| 25 to 34 Years | 67 (19.7%) | 102 (28.5%) |
| 35 to 44 Years | 24 (7.8%) | 49 (19.6%) |
| 45 to 54 Years | 48 (22.9%) | 66 (21.0%) |
| 55 to 64 Years | 63 (27.6%) | 44 (11.2%) |
| 65 to 74 Years | 10 (4.3%) | 12 (4.6%) |
| 75 Years and over | 0 (0.0%) | 14 (4.4%) |
| Total | 430 (18.0%) | 549 (20.8%) |
Income Above Poverty by Sex and Age in Iola
According to the poverty statistics in Iola, males aged 5 years and females aged 5 years are the age groups that are most secure financially, with 100.0% of males and 100.0% of females in these age groups living above the poverty line.
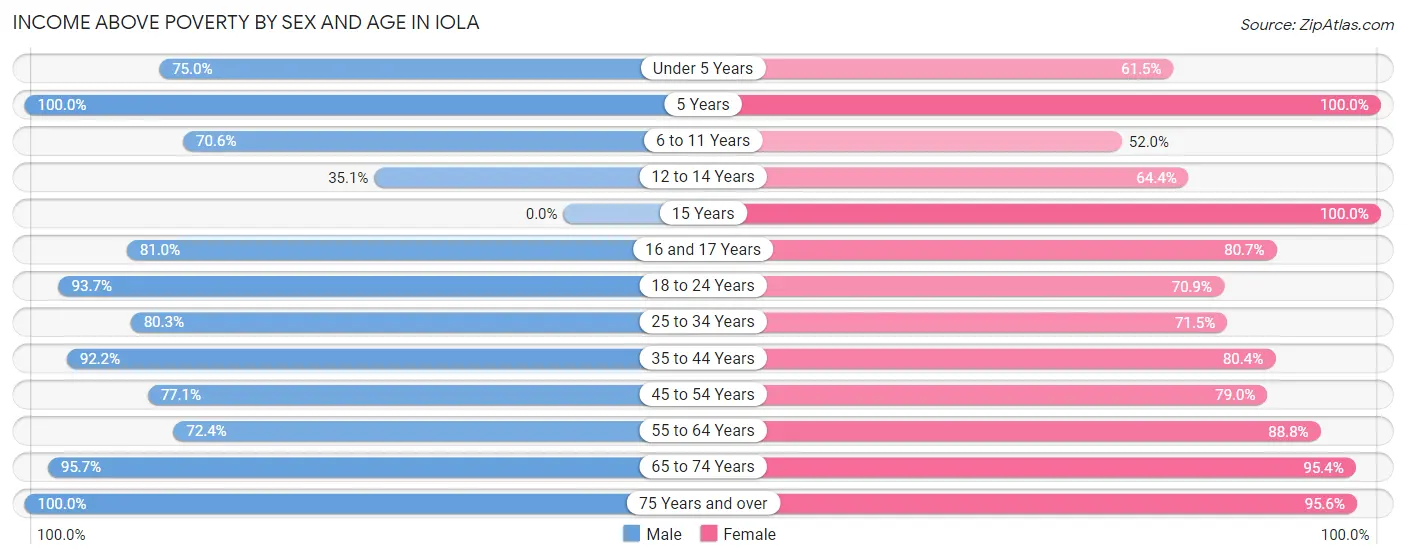
| Age Bracket | Male | Female |
| Under 5 Years | 99 (75.0%) | 96 (61.5%) |
| 5 Years | 45 (100.0%) | 22 (100.0%) |
| 6 to 11 Years | 228 (70.6%) | 118 (52.0%) |
| 12 to 14 Years | 33 (35.1%) | 47 (64.4%) |
| 15 Years | 0 (0.0%) | 19 (100.0%) |
| 16 and 17 Years | 64 (81.0%) | 50 (80.6%) |
| 18 to 24 Years | 207 (93.7%) | 134 (70.9%) |
| 25 to 34 Years | 273 (80.3%) | 256 (71.5%) |
| 35 to 44 Years | 282 (92.2%) | 201 (80.4%) |
| 45 to 54 Years | 162 (77.1%) | 248 (79.0%) |
| 55 to 64 Years | 165 (72.4%) | 350 (88.8%) |
| 65 to 74 Years | 222 (95.7%) | 246 (95.4%) |
| 75 Years and over | 177 (100.0%) | 303 (95.6%) |
| Total | 1,957 (82.0%) | 2,090 (79.2%) |
Income Below Poverty Among Married-Couple Families in Iola
The poverty statistics for married-couple families in Iola show that 7.3% or 58 of the total 792 families live below the poverty line. Families with 3 or 4 children have the highest poverty rate of 35.4%, comprising of 17 families. On the other hand, families with 1 or 2 children have the lowest poverty rate of 0.0%, which includes 0 families.
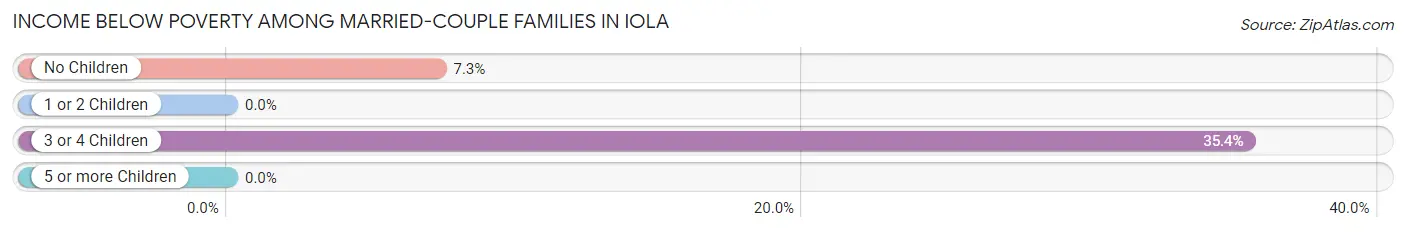
| Children | Above Poverty | Below Poverty |
| No Children | 524 (92.7%) | 41 (7.3%) |
| 1 or 2 Children | 179 (100.0%) | 0 (0.0%) |
| 3 or 4 Children | 31 (64.6%) | 17 (35.4%) |
| 5 or more Children | 0 (0.0%) | 0 (0.0%) |
| Total | 734 (92.7%) | 58 (7.3%) |
Income Below Poverty Among Single-Parent Households in Iola
According to the poverty data in Iola, 17.6% or 25 single-father households and 31.5% or 125 single-mother households are living below the poverty line. Among single-father households, those with 1 or 2 children have the highest poverty rate, with 25 households (28.1%) experiencing poverty. Likewise, among single-mother households, those with 3 or 4 children have the highest poverty rate, with 49 households (100.0%) falling below the poverty line.
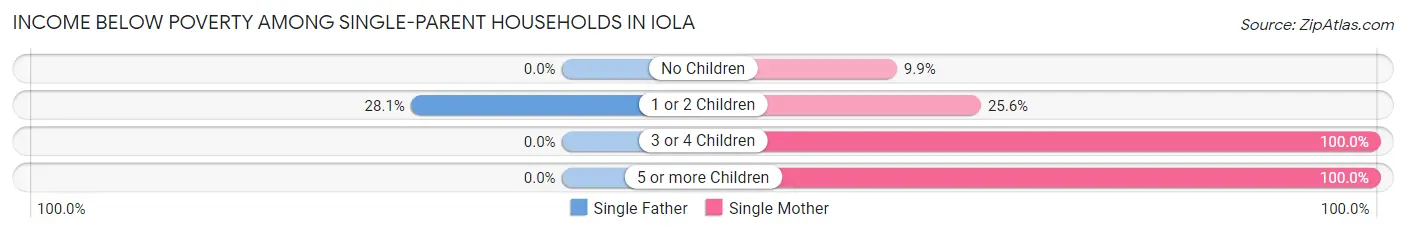
| Children | Single Father | Single Mother |
| No Children | 0 (0.0%) | 12 (9.9%) |
| 1 or 2 Children | 25 (28.1%) | 56 (25.6%) |
| 3 or 4 Children | 0 (0.0%) | 49 (100.0%) |
| 5 or more Children | 0 (0.0%) | 8 (100.0%) |
| Total | 25 (17.6%) | 125 (31.5%) |
Income Below Poverty Among Married-Couple vs Single-Parent Households in Iola
The poverty data for Iola shows that 58 of the married-couple family households (7.3%) and 150 of the single-parent households (27.8%) are living below the poverty level. Within the married-couple family households, those with 3 or 4 children have the highest poverty rate, with 17 households (35.4%) falling below the poverty line. Among the single-parent households, those with 5 or more children have the highest poverty rate, with 8 household (100.0%) living below poverty.
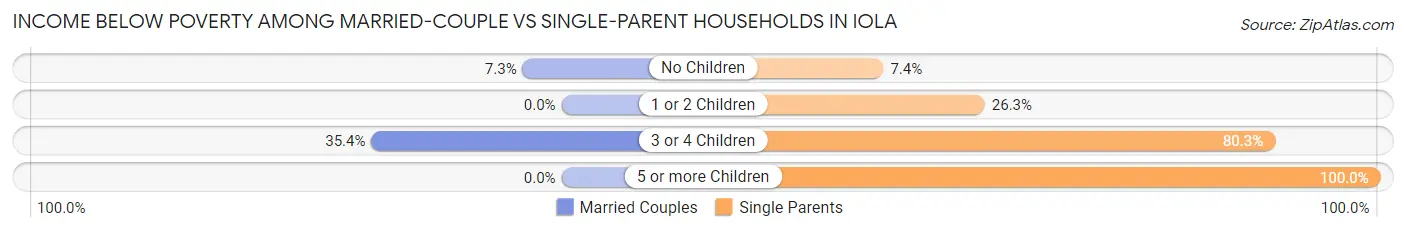
| Children | Married-Couple Families | Single-Parent Households |
| No Children | 41 (7.3%) | 12 (7.4%) |
| 1 or 2 Children | 0 (0.0%) | 81 (26.3%) |
| 3 or 4 Children | 17 (35.4%) | 49 (80.3%) |
| 5 or more Children | 0 (0.0%) | 8 (100.0%) |
| Total | 58 (7.3%) | 150 (27.8%) |
Race in Iola
The most populous races in Iola are White / Caucasian (4,672 | 86.6%), Two or more Races (410 | 7.6%), and Hispanic or Latino (317 | 5.9%).
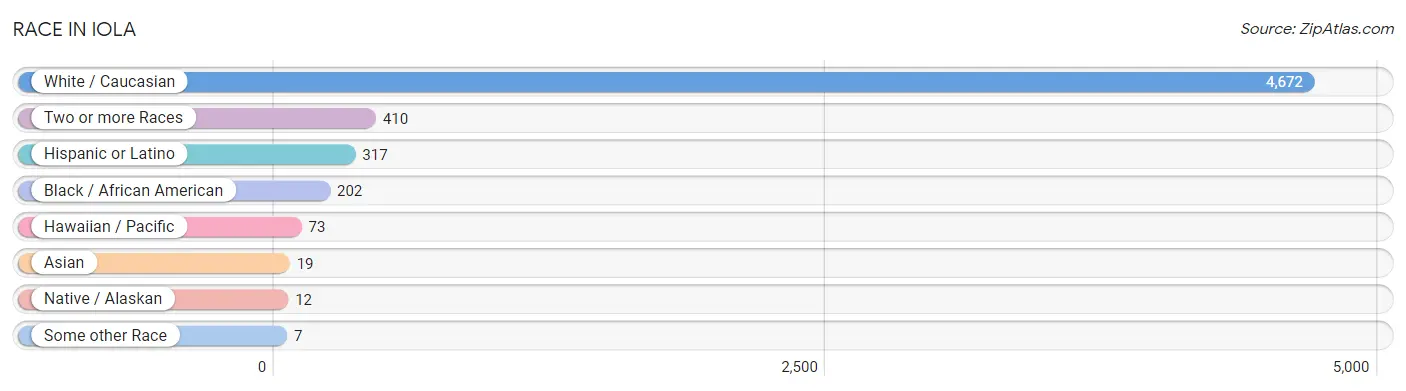
| Race | # Population | % Population |
| Asian | 19 | 0.4% |
| Black / African American | 202 | 3.7% |
| Hawaiian / Pacific | 73 | 1.3% |
| Hispanic or Latino | 317 | 5.9% |
| Native / Alaskan | 12 | 0.2% |
| White / Caucasian | 4,672 | 86.6% |
| Two or more Races | 410 | 7.6% |
| Some other Race | 7 | 0.1% |
| Total | 5,395 | 100.0% |
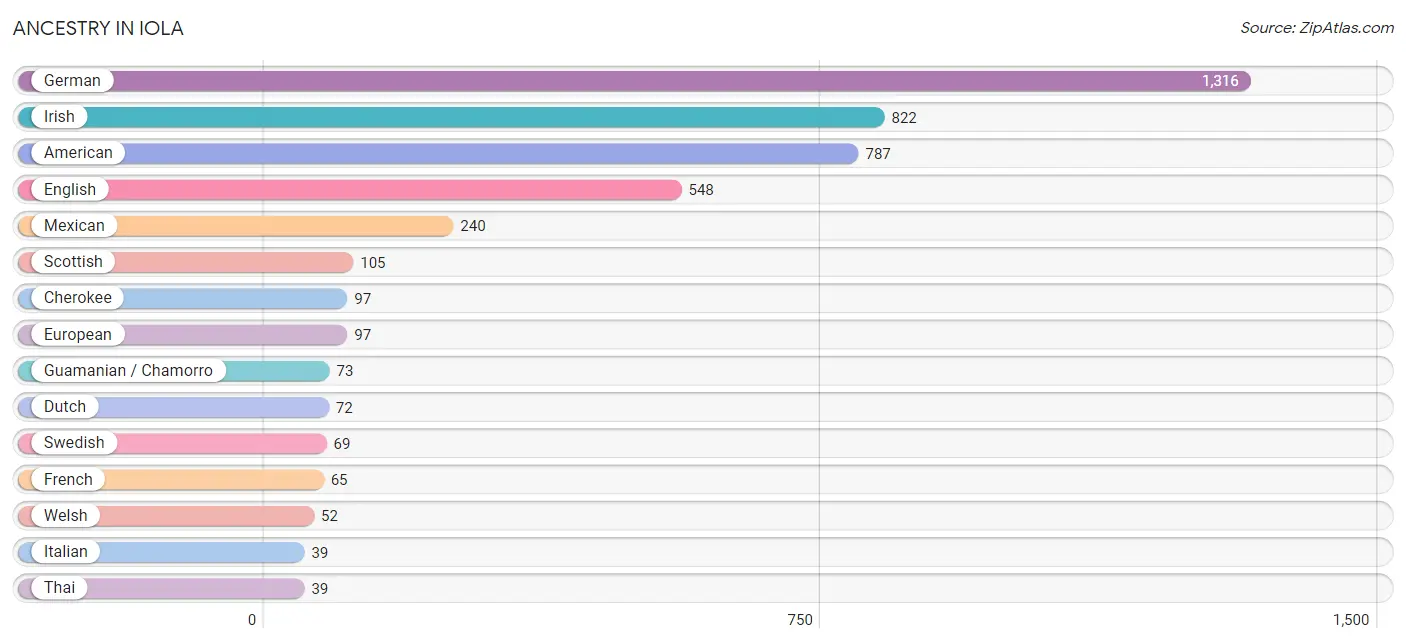
Ancestry in Iola
The most populous ancestries reported in Iola are German (1,316 | 24.4%), Irish (822 | 15.2%), American (787 | 14.6%), English (548 | 10.2%), and Mexican (240 | 4.4%), together accounting for 68.8% of all Iola residents.
| Ancestry | # Population | % Population |
| American | 787 | 14.6% |
| Apache | 27 | 0.5% |
| Arab | 35 | 0.6% |
| Austrian | 18 | 0.3% |
| Bhutanese | 3 | 0.1% |
| Cherokee | 97 | 1.8% |
| Chickasaw | 2 | 0.0% |
| Creek | 6 | 0.1% |
| Czech | 26 | 0.5% |
| Dutch | 72 | 1.3% |
| English | 548 | 10.2% |
| European | 97 | 1.8% |
| French | 65 | 1.2% |
| German | 1,316 | 24.4% |
| Guamanian / Chamorro | 73 | 1.3% |
| Haitian | 3 | 0.1% |
| Irish | 822 | 15.2% |
| Italian | 39 | 0.7% |
| Lebanese | 35 | 0.6% |
| Mexican | 240 | 4.4% |
| Polish | 27 | 0.5% |
| Potawatomi | 2 | 0.0% |
| Romanian | 5 | 0.1% |
| Scotch-Irish | 6 | 0.1% |
| Scottish | 105 | 1.9% |
| Slavic | 3 | 0.1% |
| Slovak | 13 | 0.2% |
| Slovene | 10 | 0.2% |
| Spaniard | 3 | 0.1% |
| Spanish | 34 | 0.6% |
| Swedish | 69 | 1.3% |
| Thai | 39 | 0.7% |
| Welsh | 52 | 1.0% | View All 33 Rows |
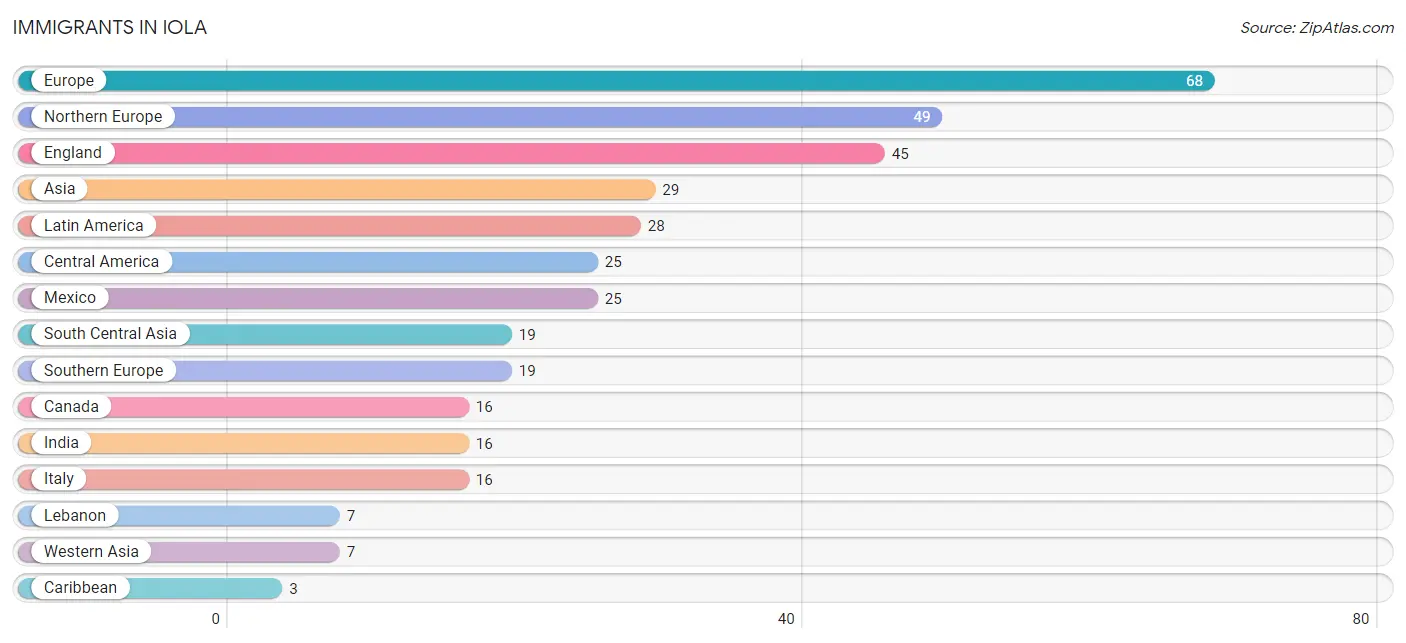
Immigrants in Iola
The most numerous immigrant groups reported in Iola came from Europe (68 | 1.3%), Northern Europe (49 | 0.9%), England (45 | 0.8%), Asia (29 | 0.5%), and Latin America (28 | 0.5%), together accounting for 4.1% of all Iola residents.
| Immigration Origin | # Population | % Population |
| Asia | 29 | 0.5% |
| Canada | 16 | 0.3% |
| Caribbean | 3 | 0.1% |
| Central America | 25 | 0.5% |
| Eastern Asia | 3 | 0.1% |
| England | 45 | 0.8% |
| Europe | 68 | 1.3% |
| Haiti | 3 | 0.1% |
| India | 16 | 0.3% |
| Italy | 16 | 0.3% |
| Japan | 3 | 0.1% |
| Latin America | 28 | 0.5% |
| Lebanon | 7 | 0.1% |
| Mexico | 25 | 0.5% |
| Northern Europe | 49 | 0.9% |
| South Central Asia | 19 | 0.4% |
| Southern Europe | 19 | 0.4% |
| Spain | 3 | 0.1% |
| Western Asia | 7 | 0.1% | View All 19 Rows |
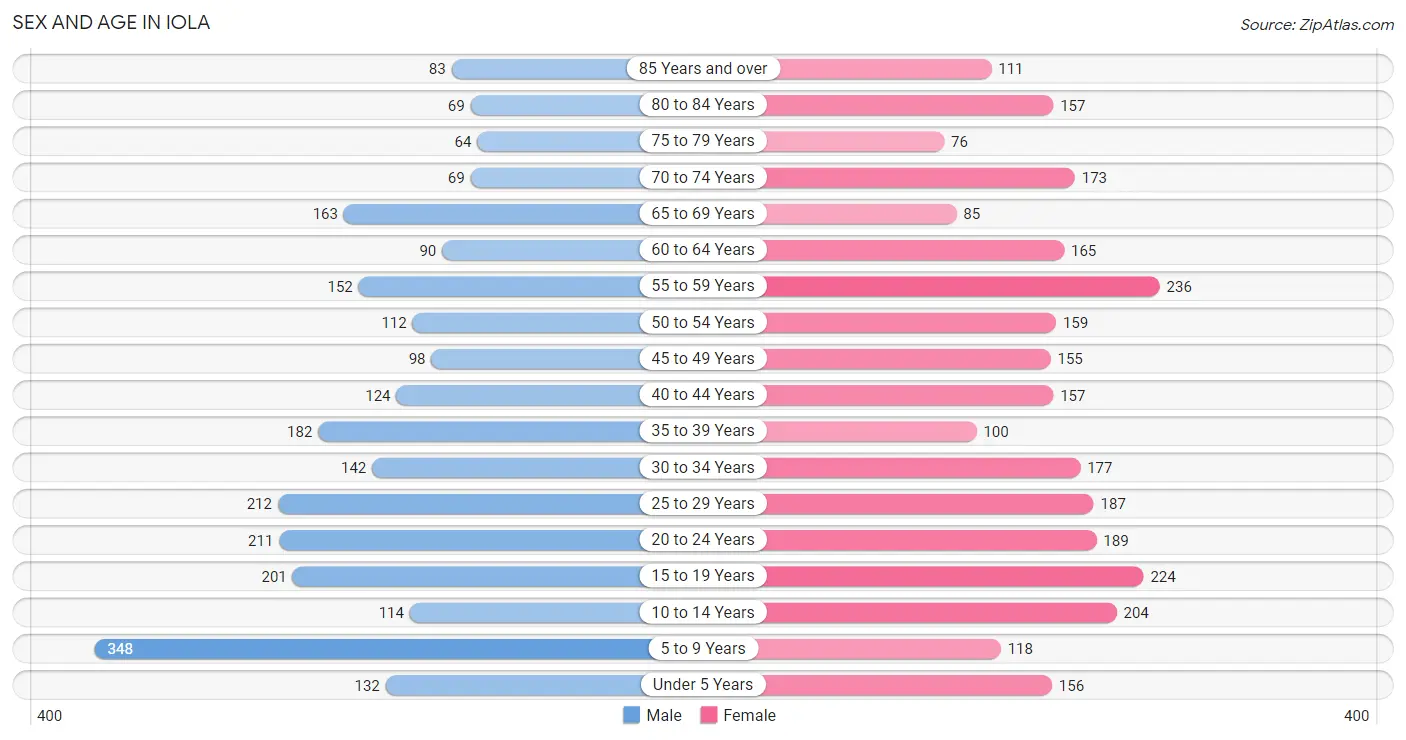
Sex and Age in Iola
Sex and Age in Iola
The most populous age groups in Iola are 5 to 9 Years (348 | 13.6%) for men and 55 to 59 Years (236 | 8.3%) for women.
| Age Bracket | Male | Female |
| Under 5 Years | 132 (5.1%) | 156 (5.5%) |
| 5 to 9 Years | 348 (13.6%) | 118 (4.2%) |
| 10 to 14 Years | 114 (4.4%) | 204 (7.2%) |
| 15 to 19 Years | 201 (7.8%) | 224 (7.9%) |
| 20 to 24 Years | 211 (8.2%) | 189 (6.7%) |
| 25 to 29 Years | 212 (8.3%) | 187 (6.6%) |
| 30 to 34 Years | 142 (5.5%) | 177 (6.3%) |
| 35 to 39 Years | 182 (7.1%) | 100 (3.5%) |
| 40 to 44 Years | 124 (4.8%) | 157 (5.6%) |
| 45 to 49 Years | 98 (3.8%) | 155 (5.5%) |
| 50 to 54 Years | 112 (4.4%) | 159 (5.6%) |
| 55 to 59 Years | 152 (5.9%) | 236 (8.3%) |
| 60 to 64 Years | 90 (3.5%) | 165 (5.8%) |
| 65 to 69 Years | 163 (6.4%) | 85 (3.0%) |
| 70 to 74 Years | 69 (2.7%) | 173 (6.1%) |
| 75 to 79 Years | 64 (2.5%) | 76 (2.7%) |
| 80 to 84 Years | 69 (2.7%) | 157 (5.6%) |
| 85 Years and over | 83 (3.2%) | 111 (3.9%) |
| Total | 2,566 (100.0%) | 2,829 (100.0%) |
Families and Households in Iola
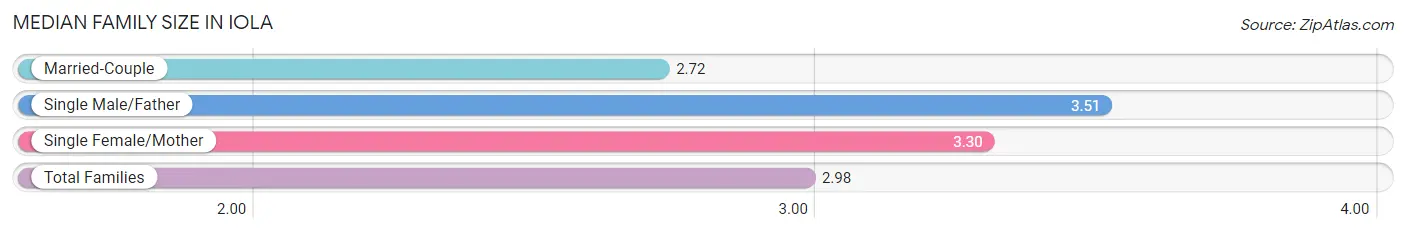
Median Family Size in Iola
The median family size in Iola is 2.98 persons per family, with single male/father families (142 | 10.7%) accounting for the largest median family size of 3.51 persons per family. On the other hand, married-couple families (792 | 59.5%) represent the smallest median family size with 2.72 persons per family.
| Family Type | # Families | Family Size |
| Married-Couple | 792 (59.5%) | 2.72 |
| Single Male/Father | 142 (10.7%) | 3.51 |
| Single Female/Mother | 397 (29.8%) | 3.30 |
| Total Families | 1,331 (100.0%) | 2.98 |
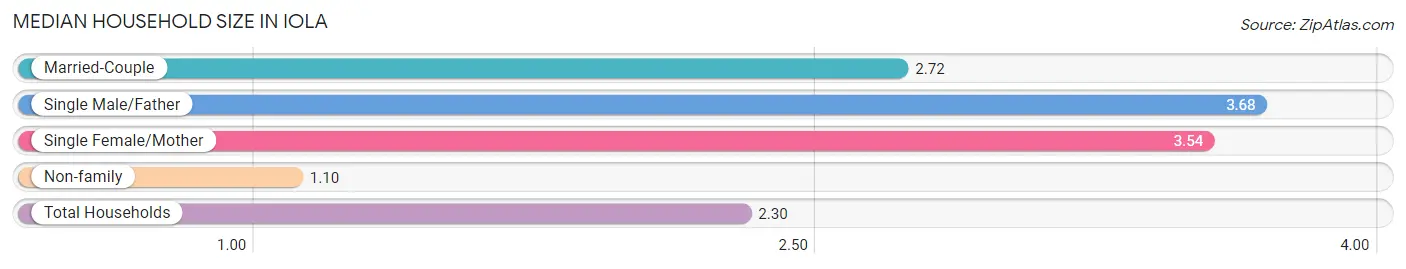
Median Household Size in Iola
The median household size in Iola is 2.30 persons per household, with single male/father households (142 | 6.5%) accounting for the largest median household size of 3.68 persons per household. non-family households (847 | 38.9%) represent the smallest median household size with 1.10 persons per household.
| Household Type | # Households | Household Size |
| Married-Couple | 792 (36.4%) | 2.72 |
| Single Male/Father | 142 (6.5%) | 3.68 |
| Single Female/Mother | 397 (18.2%) | 3.54 |
| Non-family | 847 (38.9%) | 1.10 |
| Total Households | 2,178 (100.0%) | 2.30 |
Household Size by Marriage Status in Iola
Out of a total of 2,178 households in Iola, 1,331 (61.1%) are family households, while 847 (38.9%) are nonfamily households. The most numerous type of family households are 2-person households, comprising 758, and the most common type of nonfamily households are 1-person households, comprising 768.
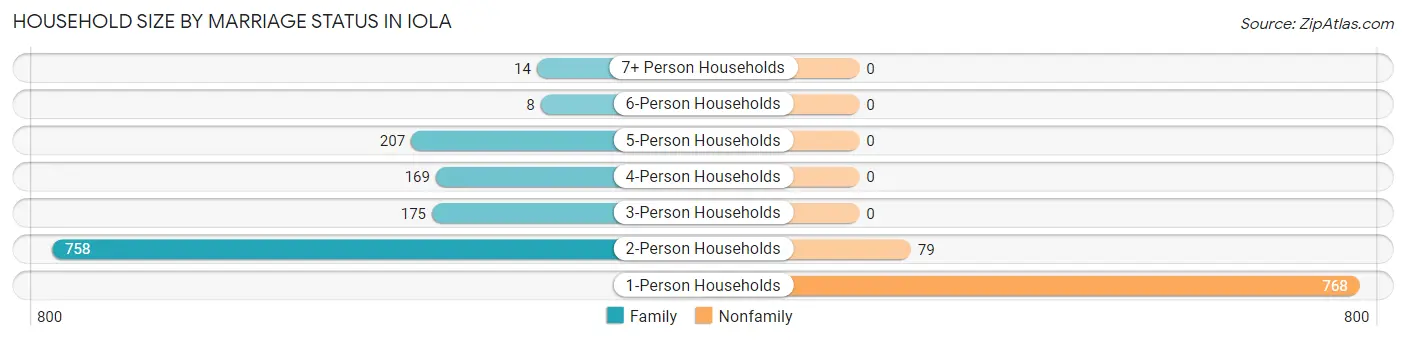
| Household Size | Family Households | Nonfamily Households |
| 1-Person Households | - | 768 (35.3%) |
| 2-Person Households | 758 (34.8%) | 79 (3.6%) |
| 3-Person Households | 175 (8.0%) | 0 (0.0%) |
| 4-Person Households | 169 (7.8%) | 0 (0.0%) |
| 5-Person Households | 207 (9.5%) | 0 (0.0%) |
| 6-Person Households | 8 (0.4%) | 0 (0.0%) |
| 7+ Person Households | 14 (0.6%) | 0 (0.0%) |
| Total | 1,331 (61.1%) | 847 (38.9%) |
Female Fertility in Iola
Fertility by Age in Iola
Average fertility rate in Iola is 49.0 births per 1,000 women. Women in the age bracket of 20 to 34 years have the highest fertility rate with 96.0 births per 1,000 women. Women in the age bracket of 20 to 34 years acount for 88.3% of all women with births.
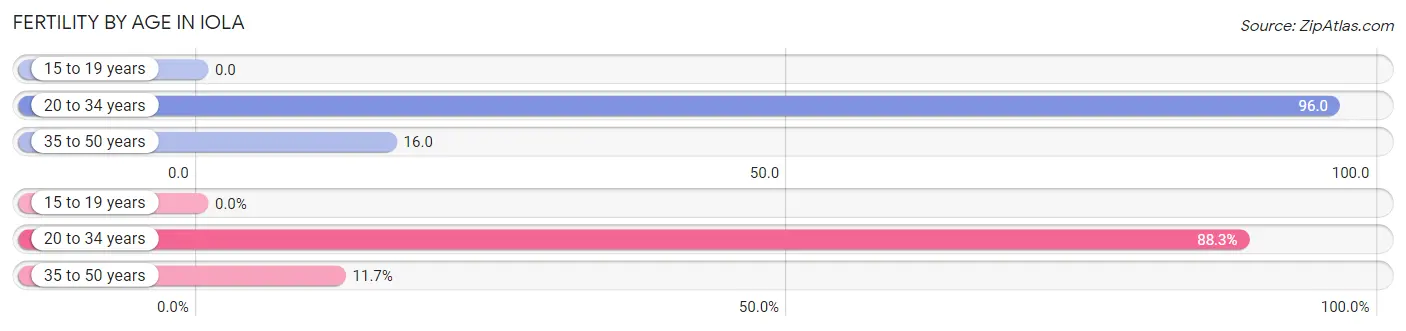
| Age Bracket | Women with Births | Births / 1,000 Women |
| 15 to 19 years | 0 (0.0%) | 0.0 |
| 20 to 34 years | 53 (88.3%) | 96.0 |
| 35 to 50 years | 7 (11.7%) | 16.0 |
| Total | 60 (100.0%) | 49.0 |
Fertility by Age by Marriage Status in Iola
73.3% of women with births (60) in Iola are married. The highest percentage of unmarried women with births falls into 35 to 50 years age bracket with 100.0% of them unmarried at the time of birth, while the lowest percentage of unmarried women with births belong to 20 to 34 years age bracket with 17.0% of them unmarried.
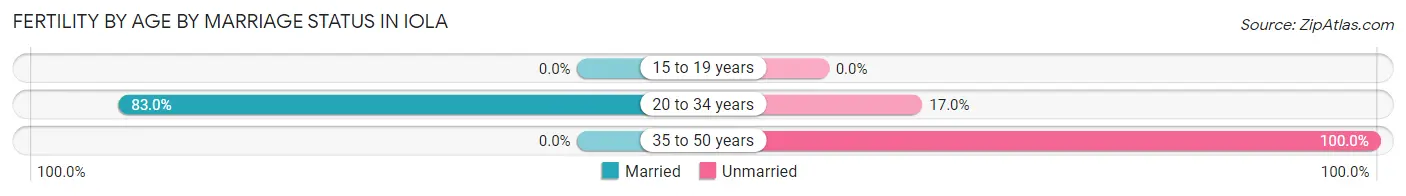
| Age Bracket | Married | Unmarried |
| 15 to 19 years | 0 (0.0%) | 0 (0.0%) |
| 20 to 34 years | 44 (83.0%) | 9 (17.0%) |
| 35 to 50 years | 0 (0.0%) | 7 (100.0%) |
| Total | 44 (73.3%) | 16 (26.7%) |
Fertility by Education in Iola
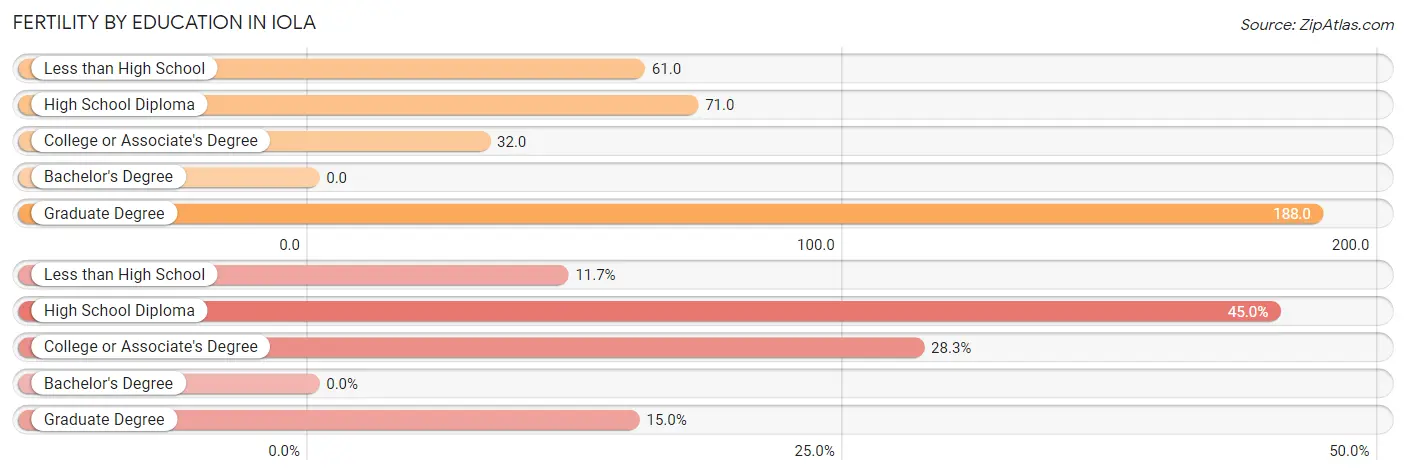
| Educational Attainment | Women with Births | Births / 1,000 Women |
| Less than High School | 7 (11.7%) | 61.0 |
| High School Diploma | 27 (45.0%) | 71.0 |
| College or Associate's Degree | 17 (28.3%) | 32.0 |
| Bachelor's Degree | 0 (0.0%) | 0.0 |
| Graduate Degree | 9 (15.0%) | 188.0 |
| Total | 60 (100.0%) | 49.0 |
Fertility by Education by Marriage Status in Iola
26.7% of women with births in Iola are unmarried. Women with the educational attainment of high school diploma are most likely to be married with 100.0% of them married at childbirth, while women with the educational attainment of less than high school are least likely to be married with 100.0% of them unmarried at childbirth.
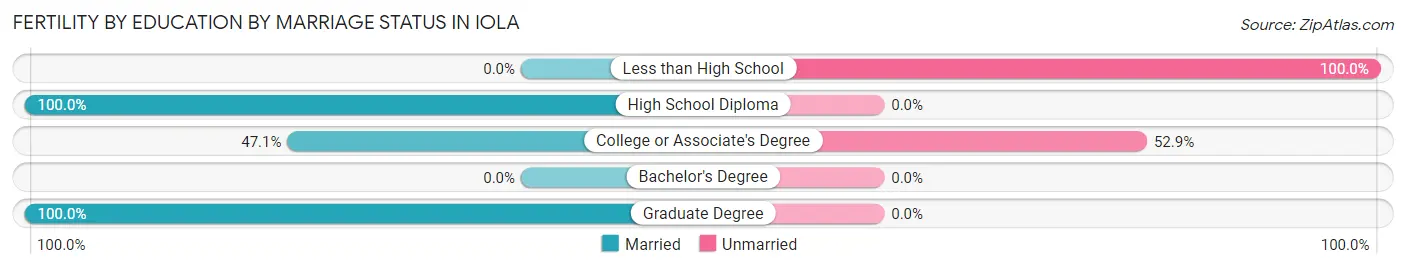
| Educational Attainment | Married | Unmarried |
| Less than High School | 0 (0.0%) | 7 (100.0%) |
| High School Diploma | 27 (100.0%) | 0 (0.0%) |
| College or Associate's Degree | 8 (47.1%) | 9 (52.9%) |
| Bachelor's Degree | 0 (0.0%) | 0 (0.0%) |
| Graduate Degree | 9 (100.0%) | 0 (0.0%) |
| Total | 44 (73.3%) | 16 (26.7%) |
Employment Characteristics in Iola
Employment by Class of Employer in Iola
Among the 2,302 employed individuals in Iola, private company employees (1,435 | 62.3%), local government employees (298 | 13.0%), and state government employees (189 | 8.2%) make up the most common classes of employment.
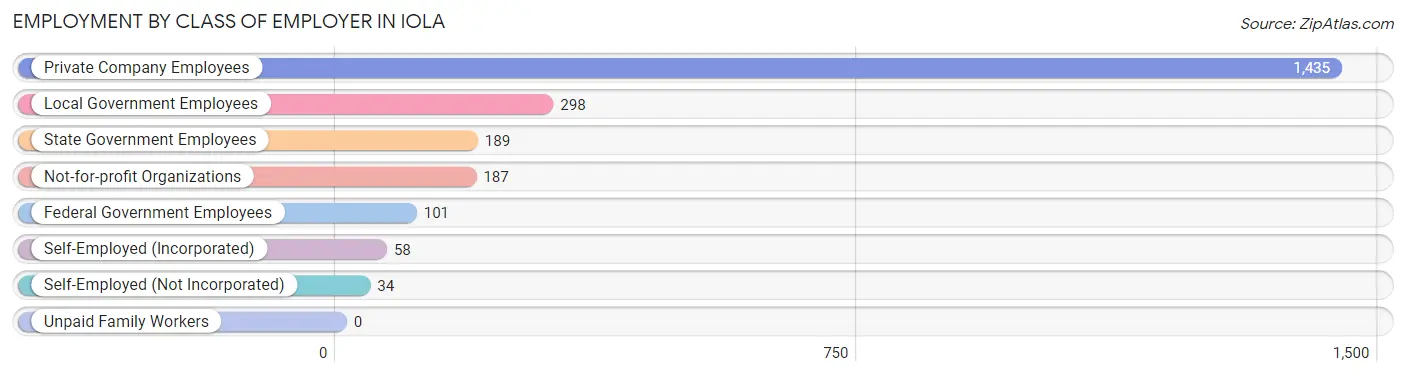
| Employer Class | # Employees | % Employees |
| Private Company Employees | 1,435 | 62.3% |
| Self-Employed (Incorporated) | 58 | 2.5% |
| Self-Employed (Not Incorporated) | 34 | 1.5% |
| Not-for-profit Organizations | 187 | 8.1% |
| Local Government Employees | 298 | 13.0% |
| State Government Employees | 189 | 8.2% |
| Federal Government Employees | 101 | 4.4% |
| Unpaid Family Workers | 0 | 0.0% |
| Total | 2,302 | 100.0% |
Employment Status by Age in Iola
According to the labor force statistics for Iola, out of the total population over 16 years of age (4,304), 57.6% or 2,479 individuals are in the labor force, with 6.7% or 166 of them unemployed. The age group with the highest labor force participation rate is 25 to 29 years, with 87.7% or 350 individuals in the labor force. Within the labor force, the 25 to 29 years age range has the highest percentage of unemployed individuals, with 13.4% or 47 of them being unemployed.
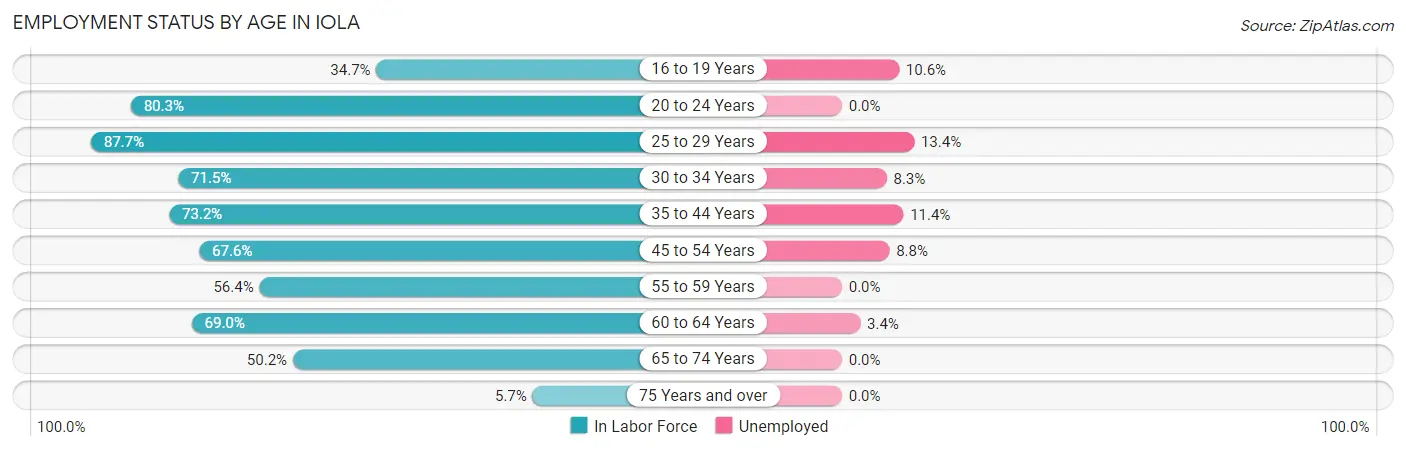
| Age Bracket | In Labor Force | Unemployed |
| 16 to 19 Years | 141 (34.7%) | 15 (10.6%) |
| 20 to 24 Years | 321 (80.3%) | 0 (0.0%) |
| 25 to 29 Years | 350 (87.7%) | 47 (13.4%) |
| 30 to 34 Years | 228 (71.5%) | 19 (8.3%) |
| 35 to 44 Years | 412 (73.2%) | 47 (11.4%) |
| 45 to 54 Years | 354 (67.6%) | 31 (8.8%) |
| 55 to 59 Years | 219 (56.4%) | 0 (0.0%) |
| 60 to 64 Years | 176 (69.0%) | 6 (3.4%) |
| 65 to 74 Years | 246 (50.2%) | 0 (0.0%) |
| 75 Years and over | 32 (5.7%) | 0 (0.0%) |
| Total | 2,479 (57.6%) | 166 (6.7%) |
Employment Status by Educational Attainment in Iola
According to labor force statistics for Iola, 71.0% of individuals (1,738) out of the total population between 25 and 64 years of age (2,448) are in the labor force, with 8.6% or 149 of them being unemployed. The group with the highest labor force participation rate are those with the educational attainment of bachelor's degree or higher, with 89.5% or 461 individuals in the labor force. Within the labor force, individuals with less than high school education have the highest percentage of unemployment, with 60.7% or 54 of them being unemployed.
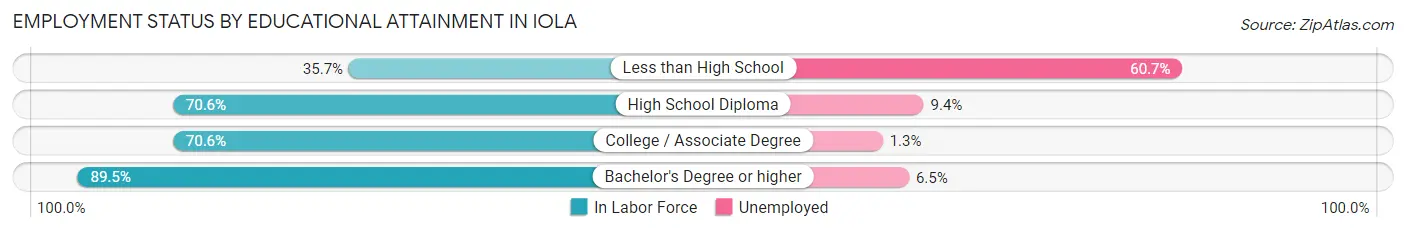
| Educational Attainment | In Labor Force | Unemployed |
| Less than High School | 89 (35.7%) | 151 (60.7%) |
| High School Diploma | 630 (70.6%) | 84 (9.4%) |
| College / Associate Degree | 559 (70.6%) | 10 (1.3%) |
| Bachelor's Degree or higher | 461 (89.5%) | 33 (6.5%) |
| Total | 1,738 (71.0%) | 211 (8.6%) |
Employment Occupations by Sex in Iola
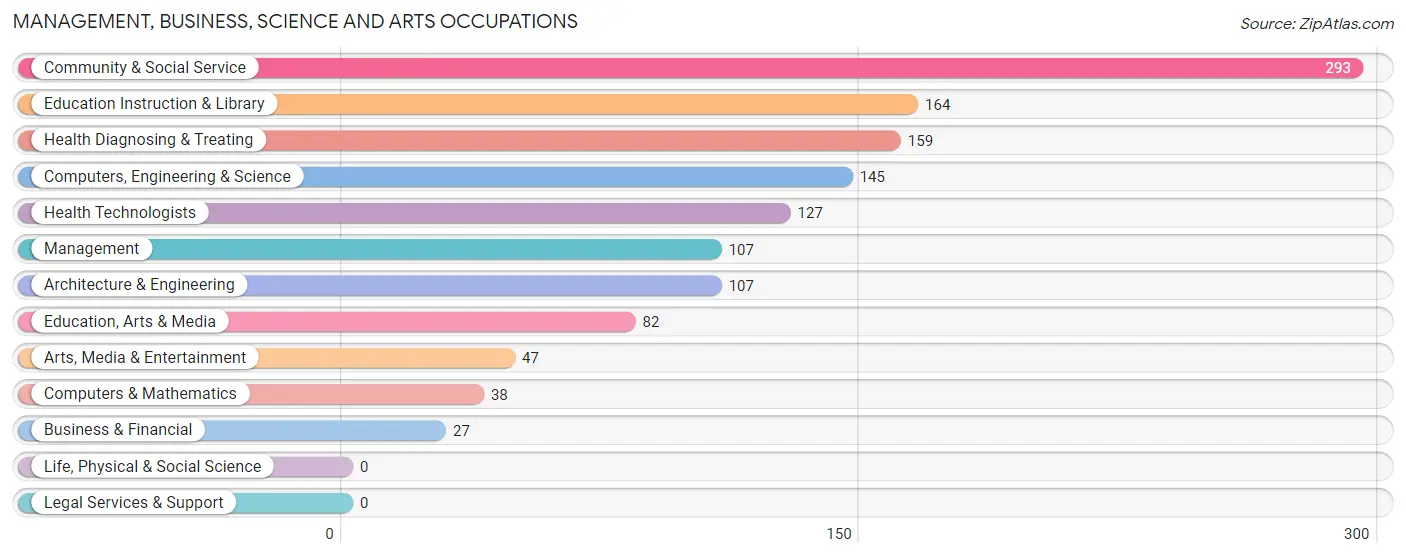
Management, Business, Science and Arts Occupations
The most common Management, Business, Science and Arts occupations in Iola are Community & Social Service (293 | 12.7%), Education Instruction & Library (164 | 7.1%), Health Diagnosing & Treating (159 | 6.9%), Computers, Engineering & Science (145 | 6.3%), and Health Technologists (127 | 5.5%).
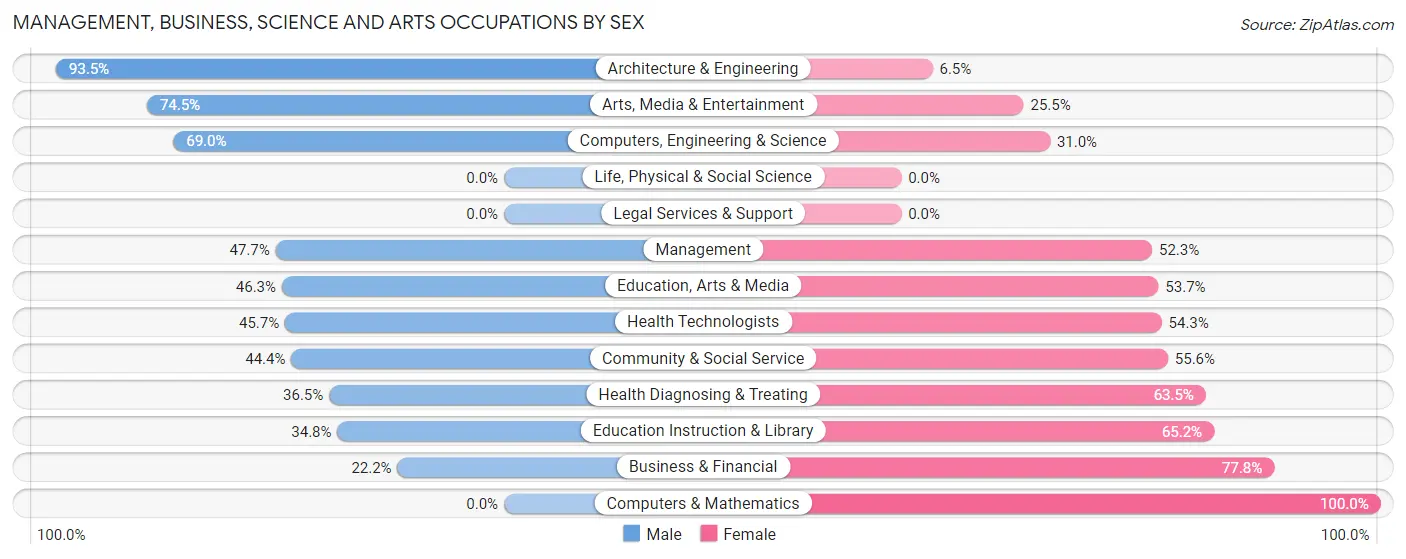
Management, Business, Science and Arts Occupations by Sex
Within the Management, Business, Science and Arts occupations in Iola, the most male-oriented occupations are Architecture & Engineering (93.5%), Arts, Media & Entertainment (74.5%), and Computers, Engineering & Science (69.0%), while the most female-oriented occupations are Computers & Mathematics (100.0%), Business & Financial (77.8%), and Education Instruction & Library (65.2%).
| Occupation | Male | Female |
| Management | 51 (47.7%) | 56 (52.3%) |
| Business & Financial | 6 (22.2%) | 21 (77.8%) |
| Computers, Engineering & Science | 100 (69.0%) | 45 (31.0%) |
| Computers & Mathematics | 0 (0.0%) | 38 (100.0%) |
| Architecture & Engineering | 100 (93.5%) | 7 (6.5%) |
| Life, Physical & Social Science | 0 (0.0%) | 0 (0.0%) |
| Community & Social Service | 130 (44.4%) | 163 (55.6%) |
| Education, Arts & Media | 38 (46.3%) | 44 (53.7%) |
| Legal Services & Support | 0 (0.0%) | 0 (0.0%) |
| Education Instruction & Library | 57 (34.8%) | 107 (65.2%) |
| Arts, Media & Entertainment | 35 (74.5%) | 12 (25.5%) |
| Health Diagnosing & Treating | 58 (36.5%) | 101 (63.5%) |
| Health Technologists | 58 (45.7%) | 69 (54.3%) |
| Total (Category) | 345 (47.2%) | 386 (52.8%) |
| Total (Overall) | 1,200 (51.9%) | 1,114 (48.1%) |
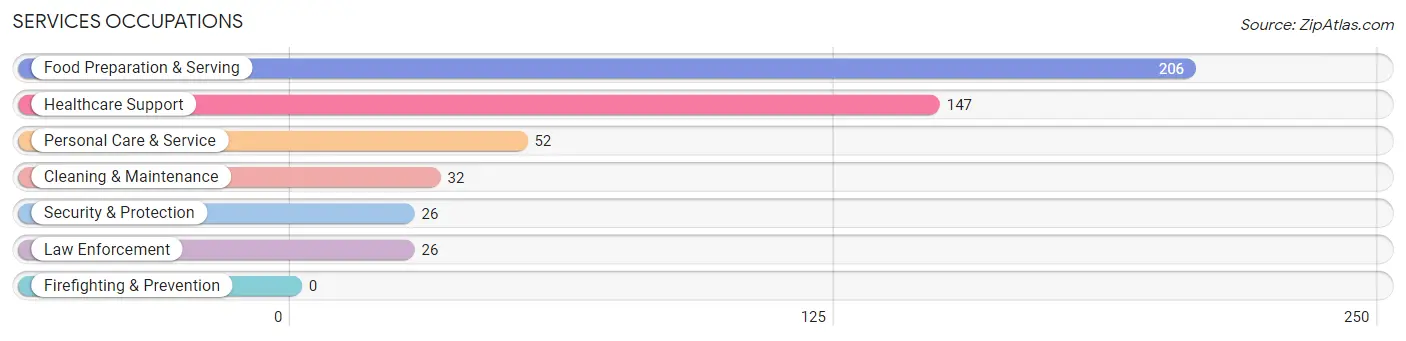
Services Occupations
The most common Services occupations in Iola are Food Preparation & Serving (206 | 8.9%), Healthcare Support (147 | 6.4%), Personal Care & Service (52 | 2.2%), Cleaning & Maintenance (32 | 1.4%), and Security & Protection (26 | 1.1%).
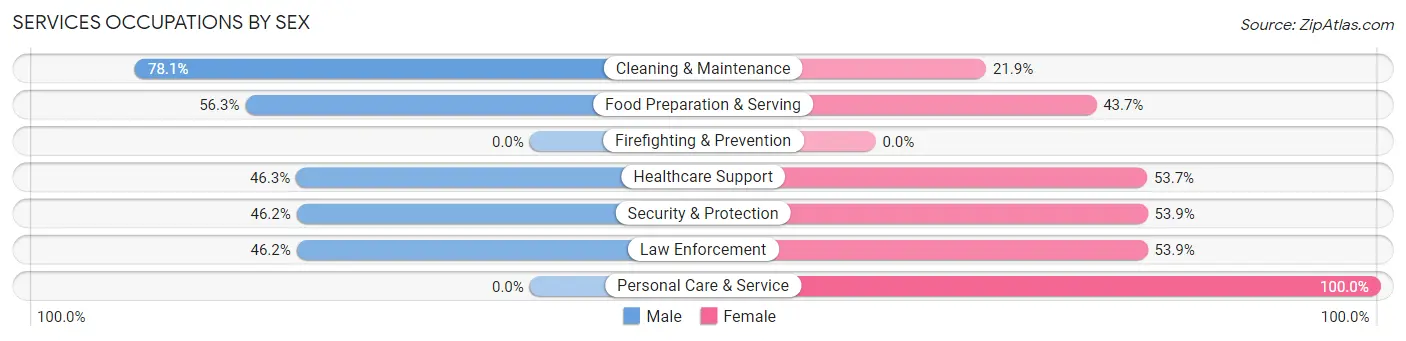
Services Occupations by Sex
Within the Services occupations in Iola, the most male-oriented occupations are Cleaning & Maintenance (78.1%), Food Preparation & Serving (56.3%), and Healthcare Support (46.3%), while the most female-oriented occupations are Personal Care & Service (100.0%), Security & Protection (53.8%), and Law Enforcement (53.8%).
| Occupation | Male | Female |
| Healthcare Support | 68 (46.3%) | 79 (53.7%) |
| Security & Protection | 12 (46.2%) | 14 (53.8%) |
| Firefighting & Prevention | 0 (0.0%) | 0 (0.0%) |
| Law Enforcement | 12 (46.2%) | 14 (53.8%) |
| Food Preparation & Serving | 116 (56.3%) | 90 (43.7%) |
| Cleaning & Maintenance | 25 (78.1%) | 7 (21.9%) |
| Personal Care & Service | 0 (0.0%) | 52 (100.0%) |
| Total (Category) | 221 (47.7%) | 242 (52.3%) |
| Total (Overall) | 1,200 (51.9%) | 1,114 (48.1%) |
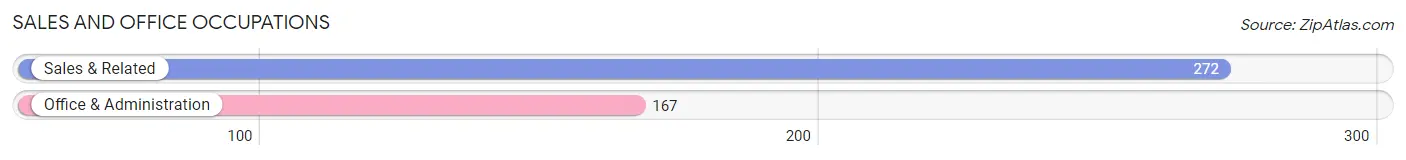
Sales and Office Occupations
The most common Sales and Office occupations in Iola are Sales & Related (272 | 11.7%), and Office & Administration (167 | 7.2%).
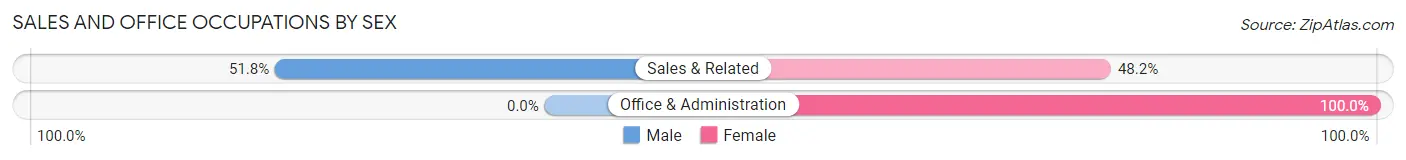
Sales and Office Occupations by Sex
| Occupation | Male | Female |
| Sales & Related | 141 (51.8%) | 131 (48.2%) |
| Office & Administration | 0 (0.0%) | 167 (100.0%) |
| Total (Category) | 141 (32.1%) | 298 (67.9%) |
| Total (Overall) | 1,200 (51.9%) | 1,114 (48.1%) |
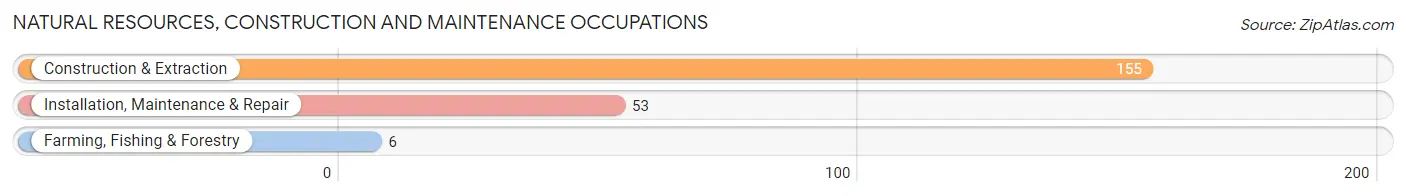
Natural Resources, Construction and Maintenance Occupations
The most common Natural Resources, Construction and Maintenance occupations in Iola are Construction & Extraction (155 | 6.7%), Installation, Maintenance & Repair (53 | 2.3%), and Farming, Fishing & Forestry (6 | 0.3%).
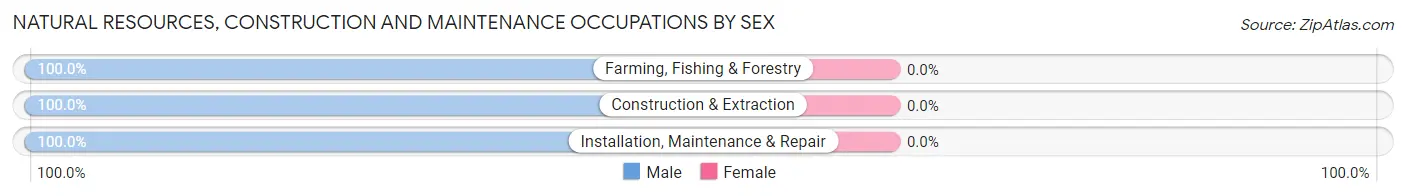
Natural Resources, Construction and Maintenance Occupations by Sex
| Occupation | Male | Female |
| Farming, Fishing & Forestry | 6 (100.0%) | 0 (0.0%) |
| Construction & Extraction | 155 (100.0%) | 0 (0.0%) |
| Installation, Maintenance & Repair | 53 (100.0%) | 0 (0.0%) |
| Total (Category) | 214 (100.0%) | 0 (0.0%) |
| Total (Overall) | 1,200 (51.9%) | 1,114 (48.1%) |
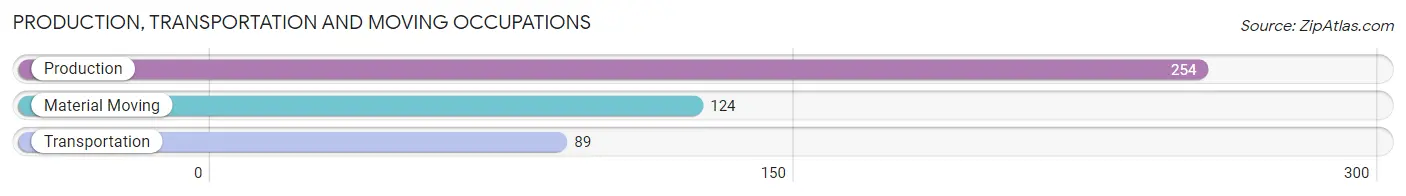
Production, Transportation and Moving Occupations
The most common Production, Transportation and Moving occupations in Iola are Production (254 | 11.0%), Material Moving (124 | 5.4%), and Transportation (89 | 3.8%).
Production, Transportation and Moving Occupations by Sex
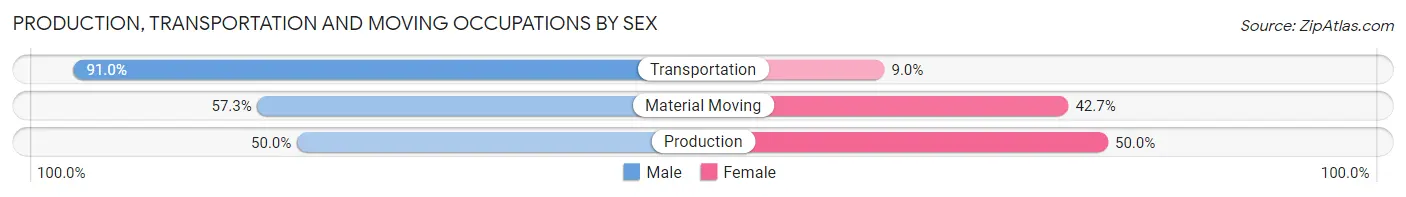
| Occupation | Male | Female |
| Production | 127 (50.0%) | 127 (50.0%) |
| Transportation | 81 (91.0%) | 8 (9.0%) |
| Material Moving | 71 (57.3%) | 53 (42.7%) |
| Total (Category) | 279 (59.7%) | 188 (40.3%) |
| Total (Overall) | 1,200 (51.9%) | 1,114 (48.1%) |
Employment Industries by Sex in Iola
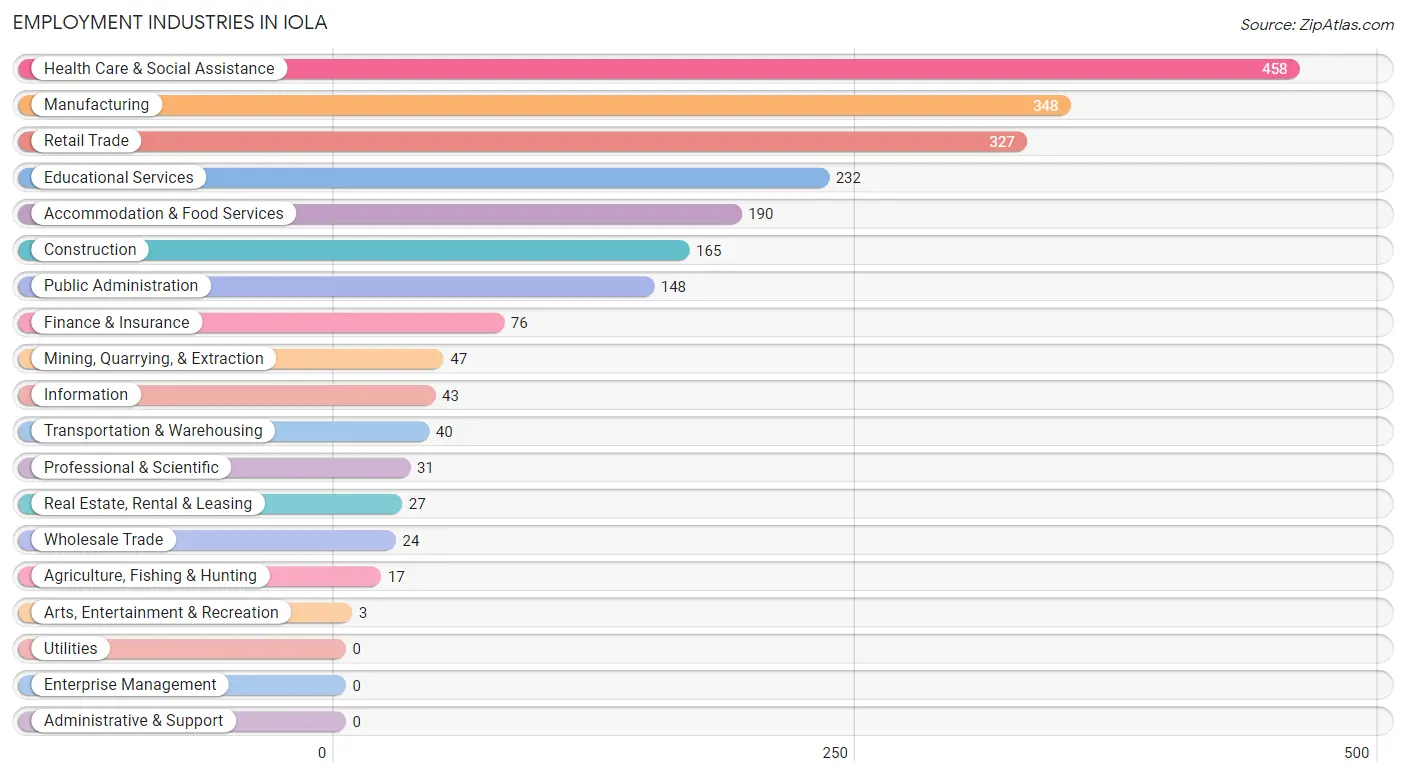
Employment Industries in Iola
The major employment industries in Iola include Health Care & Social Assistance (458 | 19.8%), Manufacturing (348 | 15.0%), Retail Trade (327 | 14.1%), Educational Services (232 | 10.0%), and Accommodation & Food Services (190 | 8.2%).
Employment Industries by Sex in Iola
The Iola industries that see more men than women are Agriculture, Fishing & Hunting (100.0%), Mining, Quarrying, & Extraction (100.0%), and Construction (100.0%), whereas the industries that tend to have a higher number of women are Arts, Entertainment & Recreation (100.0%), Health Care & Social Assistance (71.6%), and Public Administration (64.2%).
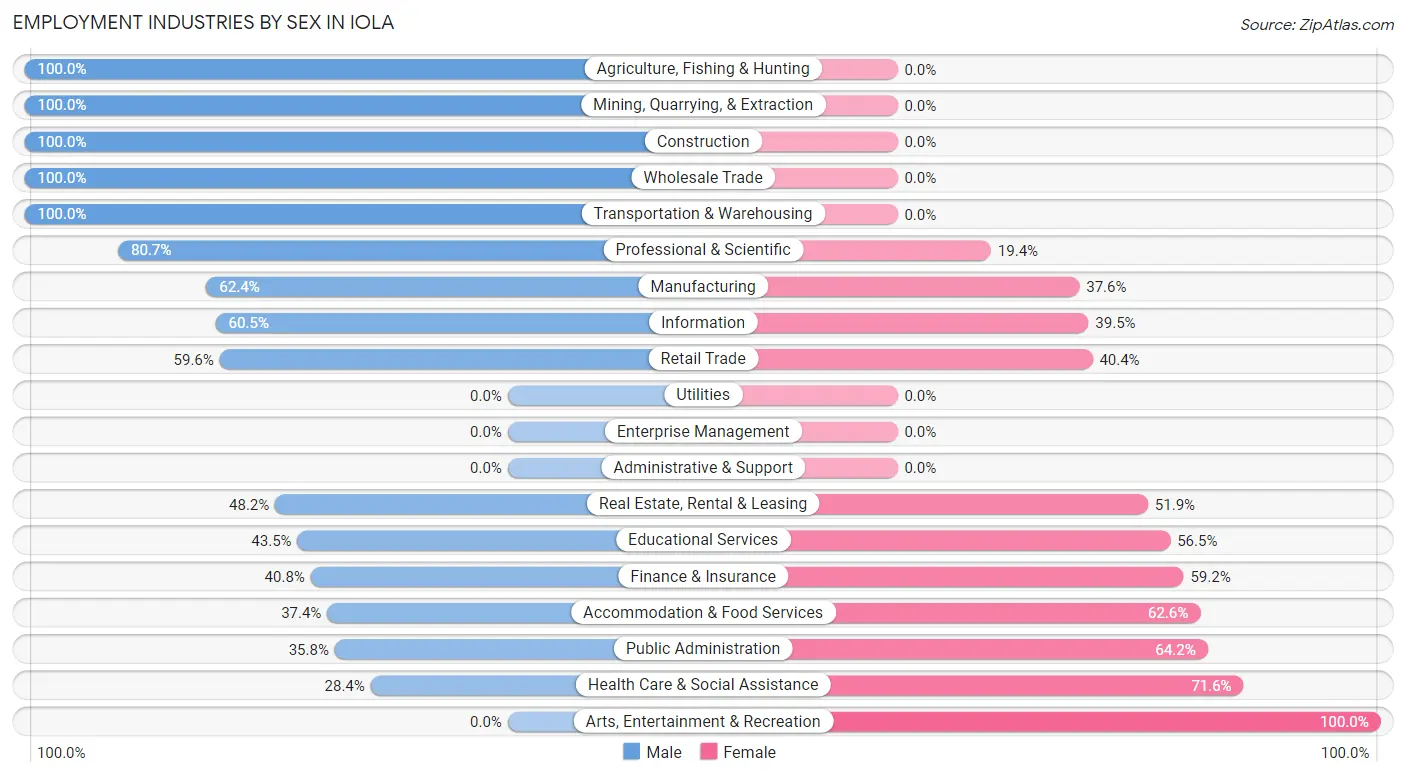
| Industry | Male | Female |
| Agriculture, Fishing & Hunting | 17 (100.0%) | 0 (0.0%) |
| Mining, Quarrying, & Extraction | 47 (100.0%) | 0 (0.0%) |
| Construction | 165 (100.0%) | 0 (0.0%) |
| Manufacturing | 217 (62.4%) | 131 (37.6%) |
| Wholesale Trade | 24 (100.0%) | 0 (0.0%) |
| Retail Trade | 195 (59.6%) | 132 (40.4%) |
| Transportation & Warehousing | 40 (100.0%) | 0 (0.0%) |
| Utilities | 0 (0.0%) | 0 (0.0%) |
| Information | 26 (60.5%) | 17 (39.5%) |
| Finance & Insurance | 31 (40.8%) | 45 (59.2%) |
| Real Estate, Rental & Leasing | 13 (48.1%) | 14 (51.8%) |
| Professional & Scientific | 25 (80.6%) | 6 (19.4%) |
| Enterprise Management | 0 (0.0%) | 0 (0.0%) |
| Administrative & Support | 0 (0.0%) | 0 (0.0%) |
| Educational Services | 101 (43.5%) | 131 (56.5%) |
| Health Care & Social Assistance | 130 (28.4%) | 328 (71.6%) |
| Arts, Entertainment & Recreation | 0 (0.0%) | 3 (100.0%) |
| Accommodation & Food Services | 71 (37.4%) | 119 (62.6%) |
| Public Administration | 53 (35.8%) | 95 (64.2%) |
| Total | 1,200 (51.9%) | 1,114 (48.1%) |
Education in Iola
School Enrollment in Iola
The most common levels of schooling among the 1,419 students in Iola are elementary school (495 | 34.9%), college / undergraduate (393 | 27.7%), and high school (212 | 14.9%).
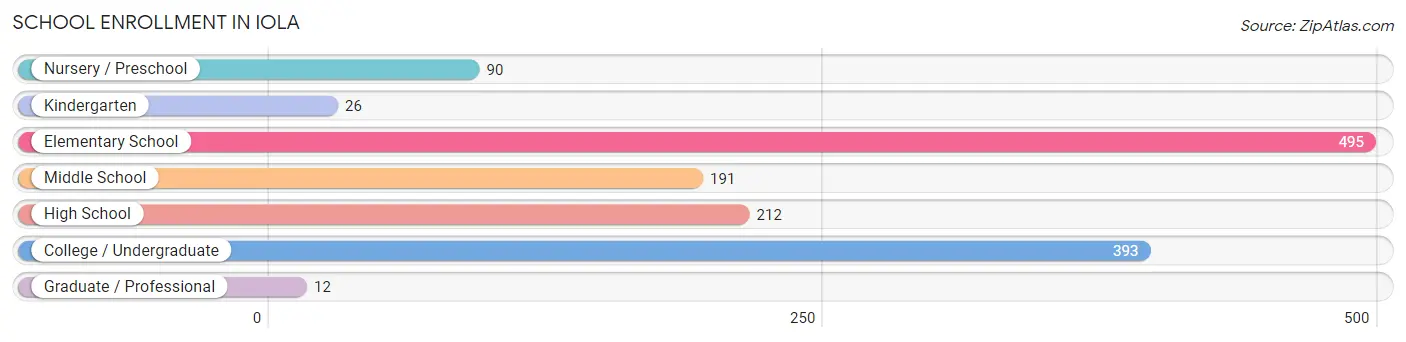
| School Level | # Students | % Students |
| Nursery / Preschool | 90 | 6.3% |
| Kindergarten | 26 | 1.8% |
| Elementary School | 495 | 34.9% |
| Middle School | 191 | 13.5% |
| High School | 212 | 14.9% |
| College / Undergraduate | 393 | 27.7% |
| Graduate / Professional | 12 | 0.9% |
| Total | 1,419 | 100.0% |
School Enrollment by Age by Funding Source in Iola
Out of a total of 1,419 students who are enrolled in schools in Iola, 128 (9.0%) attend a private institution, while the remaining 1,291 (91.0%) are enrolled in public schools. The age group of 3 to 4 year olds has the highest likelihood of being enrolled in private schools, with 17 (53.1% in the age bracket) enrolled. Conversely, the age group of 15 to 17 year olds has the lowest likelihood of being enrolled in a private school, with 160 (100.0% in the age bracket) attending a public institution.
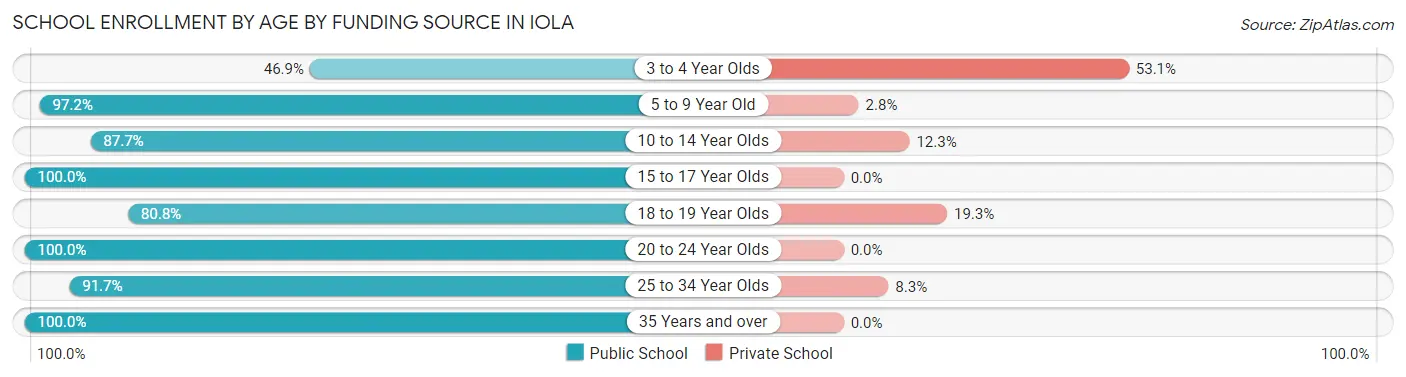
| Age Bracket | Public School | Private School |
| 3 to 4 Year Olds | 15 (46.9%) | 17 (53.1%) |
| 5 to 9 Year Old | 453 (97.2%) | 13 (2.8%) |
| 10 to 14 Year Olds | 279 (87.7%) | 39 (12.3%) |
| 15 to 17 Year Olds | 160 (100.0%) | 0 (0.0%) |
| 18 to 19 Year Olds | 214 (80.7%) | 51 (19.3%) |
| 20 to 24 Year Olds | 67 (100.0%) | 0 (0.0%) |
| 25 to 34 Year Olds | 88 (91.7%) | 8 (8.3%) |
| 35 Years and over | 15 (100.0%) | 0 (0.0%) |
| Total | 1,291 (91.0%) | 128 (9.0%) |
Educational Attainment by Field of Study in Iola
Business (177 | 23.3%), education (163 | 21.4%), arts & humanities (78 | 10.3%), science & technology (77 | 10.1%), and physical & health sciences (60 | 7.9%) are the most common fields of study among 760 individuals in Iola who have obtained a bachelor's degree or higher.
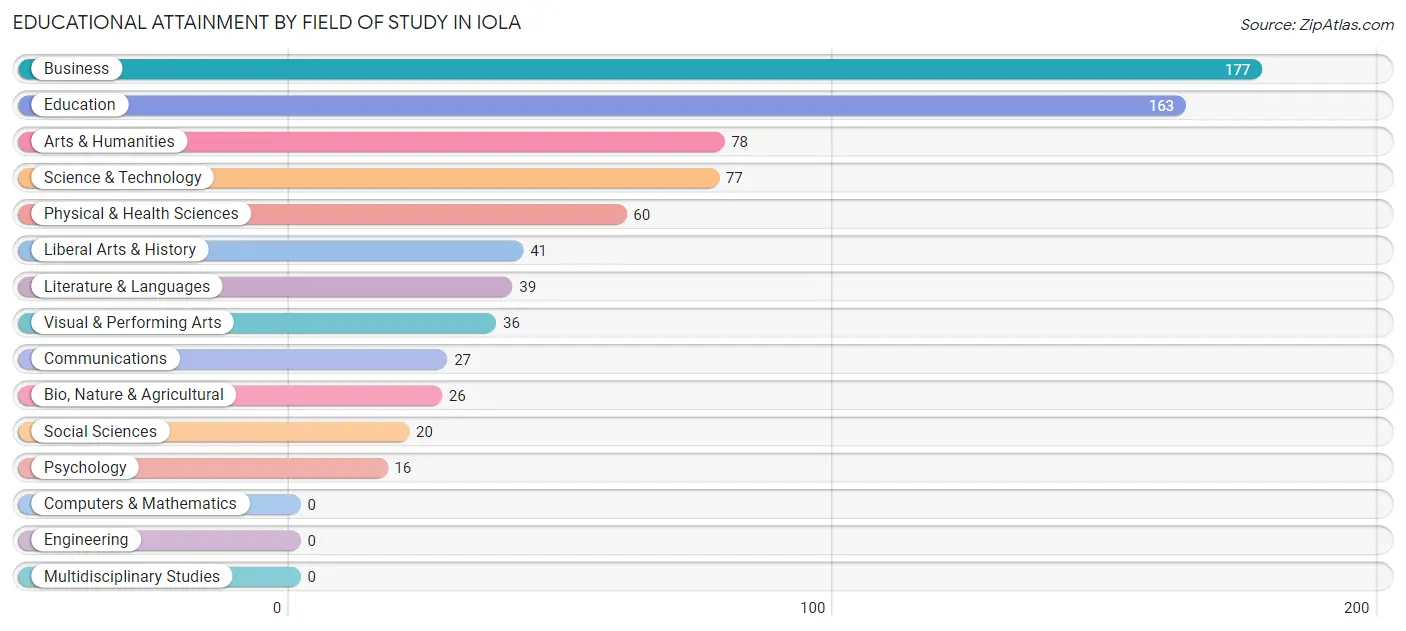
| Field of Study | # Graduates | % Graduates |
| Computers & Mathematics | 0 | 0.0% |
| Bio, Nature & Agricultural | 26 | 3.4% |
| Physical & Health Sciences | 60 | 7.9% |
| Psychology | 16 | 2.1% |
| Social Sciences | 20 | 2.6% |
| Engineering | 0 | 0.0% |
| Multidisciplinary Studies | 0 | 0.0% |
| Science & Technology | 77 | 10.1% |
| Business | 177 | 23.3% |
| Education | 163 | 21.4% |
| Literature & Languages | 39 | 5.1% |
| Liberal Arts & History | 41 | 5.4% |
| Visual & Performing Arts | 36 | 4.7% |
| Communications | 27 | 3.5% |
| Arts & Humanities | 78 | 10.3% |
| Total | 760 | 100.0% |
Transportation & Commute in Iola
Vehicle Availability by Sex in Iola
The most prevalent vehicle ownership categories in Iola are males with 2 vehicles (514, accounting for 44.0%) and females with 2 vehicles (341, making up 48.5%).
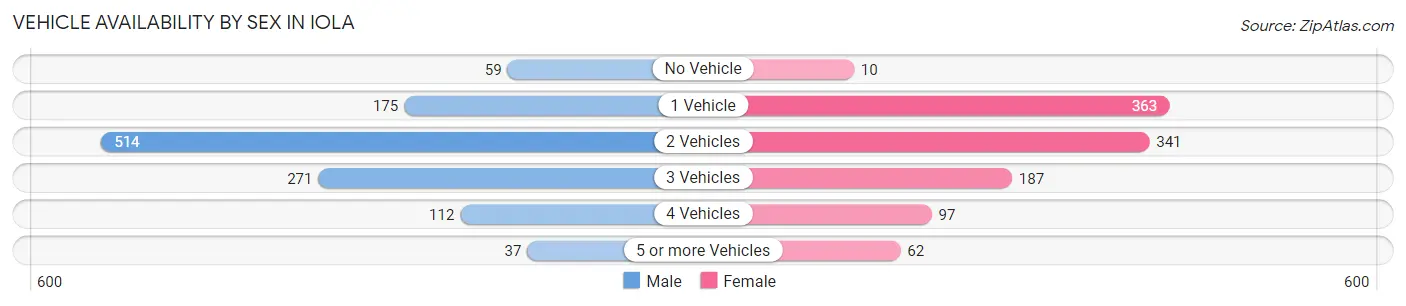
| Vehicles Available | Male | Female |
| No Vehicle | 59 (5.1%) | 10 (0.9%) |
| 1 Vehicle | 175 (15.0%) | 363 (34.3%) |
| 2 Vehicles | 514 (44.0%) | 341 (32.2%) |
| 3 Vehicles | 271 (23.2%) | 187 (17.6%) |
| 4 Vehicles | 112 (9.6%) | 97 (9.1%) |
| 5 or more Vehicles | 37 (3.2%) | 62 (5.9%) |
| Total | 1,168 (100.0%) | 1,060 (100.0%) |
Commute Time in Iola
The most frequently occuring commute durations in Iola are 5 to 9 minutes (688 commuters, 30.5%), 10 to 14 minutes (350 commuters, 15.5%), and less than 5 minutes (318 commuters, 14.1%).
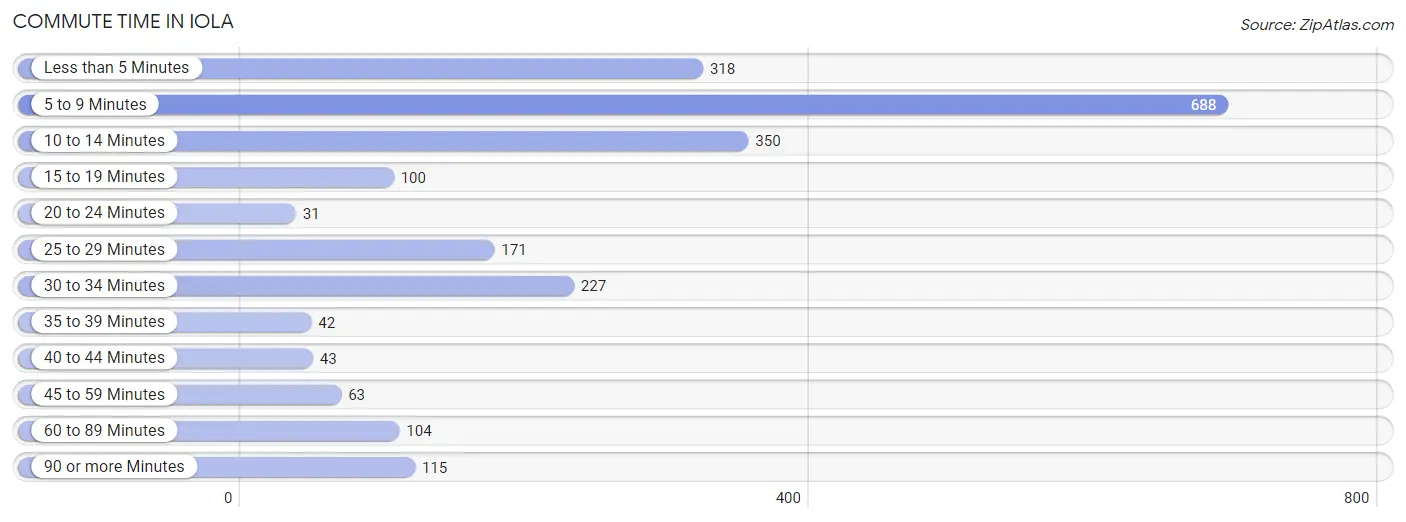
| Commute Time | # Commuters | % Commuters |
| Less than 5 Minutes | 318 | 14.1% |
| 5 to 9 Minutes | 688 | 30.5% |
| 10 to 14 Minutes | 350 | 15.5% |
| 15 to 19 Minutes | 100 | 4.4% |
| 20 to 24 Minutes | 31 | 1.4% |
| 25 to 29 Minutes | 171 | 7.6% |
| 30 to 34 Minutes | 227 | 10.1% |
| 35 to 39 Minutes | 42 | 1.9% |
| 40 to 44 Minutes | 43 | 1.9% |
| 45 to 59 Minutes | 63 | 2.8% |
| 60 to 89 Minutes | 104 | 4.6% |
| 90 or more Minutes | 115 | 5.1% |
Commute Time by Sex in Iola
The most common commute times in Iola are 5 to 9 minutes (249 commuters, 21.5%) for males and 5 to 9 minutes (439 commuters, 40.1%) for females.
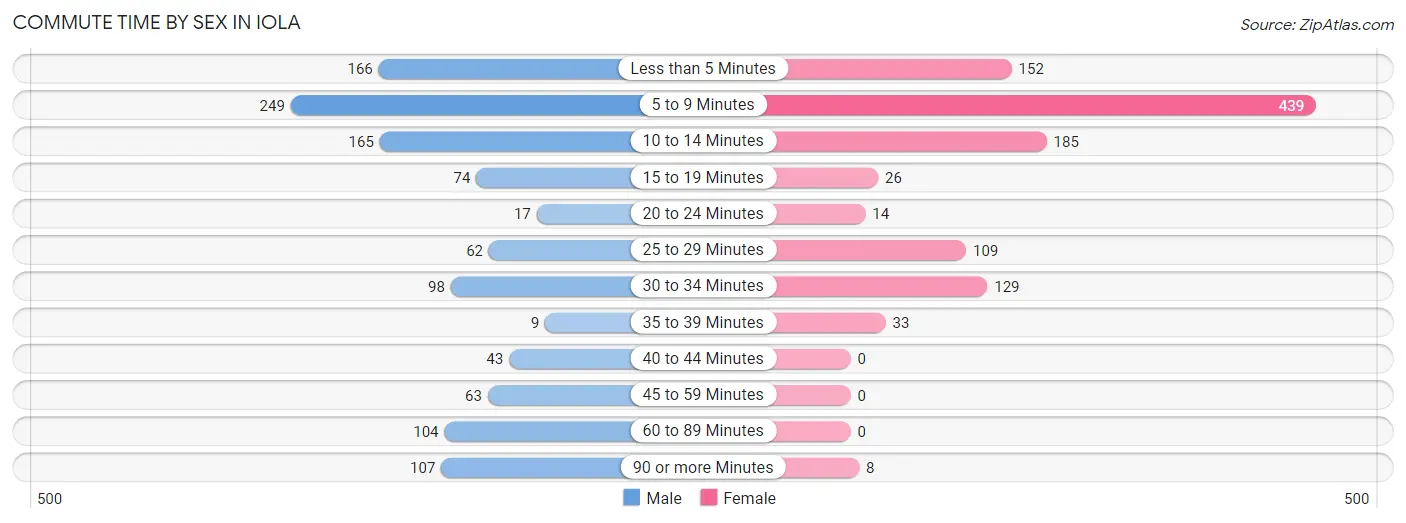
| Commute Time | Male | Female |
| Less than 5 Minutes | 166 (14.3%) | 152 (13.9%) |
| 5 to 9 Minutes | 249 (21.5%) | 439 (40.1%) |
| 10 to 14 Minutes | 165 (14.3%) | 185 (16.9%) |
| 15 to 19 Minutes | 74 (6.4%) | 26 (2.4%) |
| 20 to 24 Minutes | 17 (1.5%) | 14 (1.3%) |
| 25 to 29 Minutes | 62 (5.4%) | 109 (10.0%) |
| 30 to 34 Minutes | 98 (8.5%) | 129 (11.8%) |
| 35 to 39 Minutes | 9 (0.8%) | 33 (3.0%) |
| 40 to 44 Minutes | 43 (3.7%) | 0 (0.0%) |
| 45 to 59 Minutes | 63 (5.4%) | 0 (0.0%) |
| 60 to 89 Minutes | 104 (9.0%) | 0 (0.0%) |
| 90 or more Minutes | 107 (9.2%) | 8 (0.7%) |
Time of Departure to Work by Sex in Iola
The most frequent times of departure to work in Iola are 12:00 AM to 4:59 AM (191, 16.5%) for males and 7:30 AM to 7:59 AM (169, 15.4%) for females.
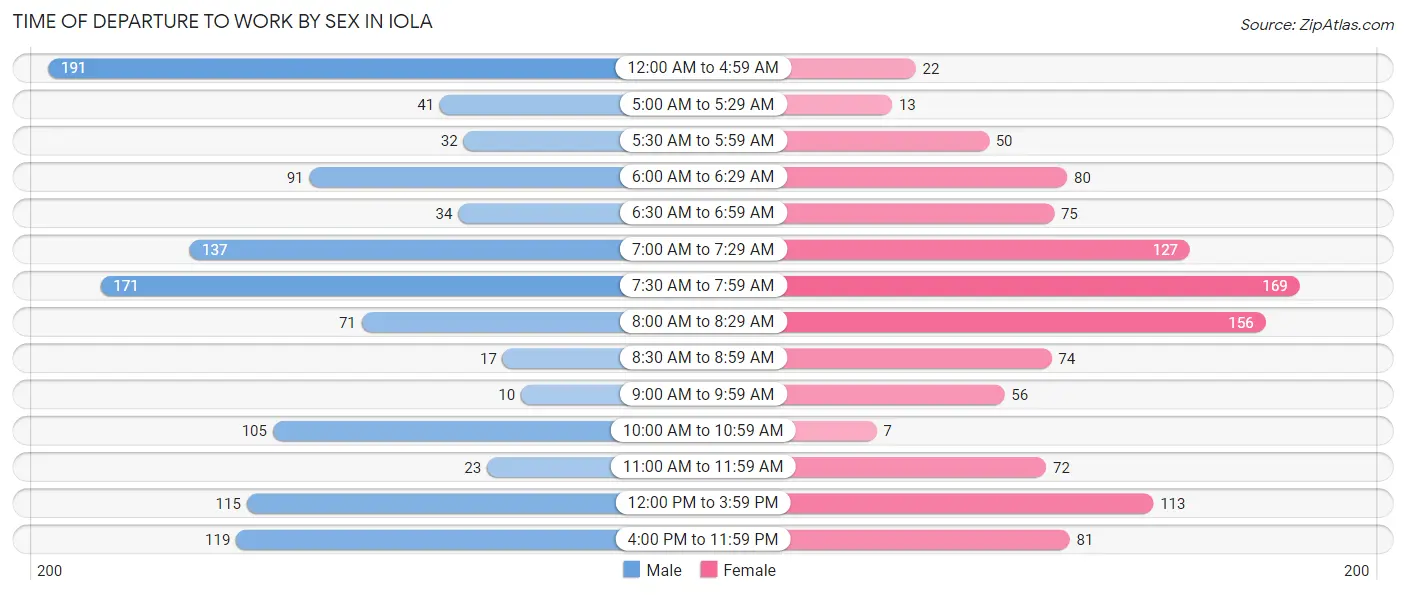
| Time of Departure | Male | Female |
| 12:00 AM to 4:59 AM | 191 (16.5%) | 22 (2.0%) |
| 5:00 AM to 5:29 AM | 41 (3.5%) | 13 (1.2%) |
| 5:30 AM to 5:59 AM | 32 (2.8%) | 50 (4.6%) |
| 6:00 AM to 6:29 AM | 91 (7.9%) | 80 (7.3%) |
| 6:30 AM to 6:59 AM | 34 (2.9%) | 75 (6.9%) |
| 7:00 AM to 7:29 AM | 137 (11.8%) | 127 (11.6%) |
| 7:30 AM to 7:59 AM | 171 (14.8%) | 169 (15.4%) |
| 8:00 AM to 8:29 AM | 71 (6.1%) | 156 (14.2%) |
| 8:30 AM to 8:59 AM | 17 (1.5%) | 74 (6.8%) |
| 9:00 AM to 9:59 AM | 10 (0.9%) | 56 (5.1%) |
| 10:00 AM to 10:59 AM | 105 (9.1%) | 7 (0.6%) |
| 11:00 AM to 11:59 AM | 23 (2.0%) | 72 (6.6%) |
| 12:00 PM to 3:59 PM | 115 (9.9%) | 113 (10.3%) |
| 4:00 PM to 11:59 PM | 119 (10.3%) | 81 (7.4%) |
| Total | 1,157 (100.0%) | 1,095 (100.0%) |
Housing Occupancy in Iola
Occupancy by Ownership in Iola
Of the total 2,178 dwellings in Iola, owner-occupied units account for 1,280 (58.8%), while renter-occupied units make up 898 (41.2%).
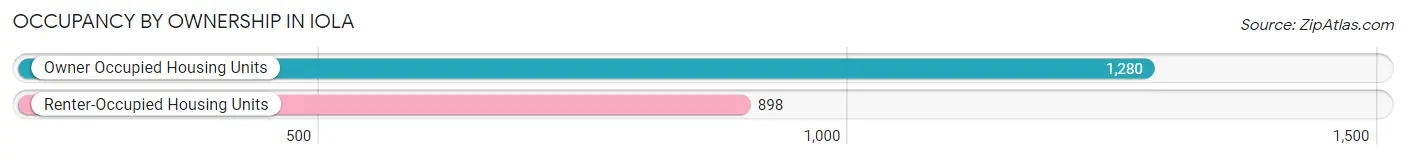
| Occupancy | # Housing Units | % Housing Units |
| Owner Occupied Housing Units | 1,280 | 58.8% |
| Renter-Occupied Housing Units | 898 | 41.2% |
| Total Occupied Housing Units | 2,178 | 100.0% |
Occupancy by Household Size in Iola
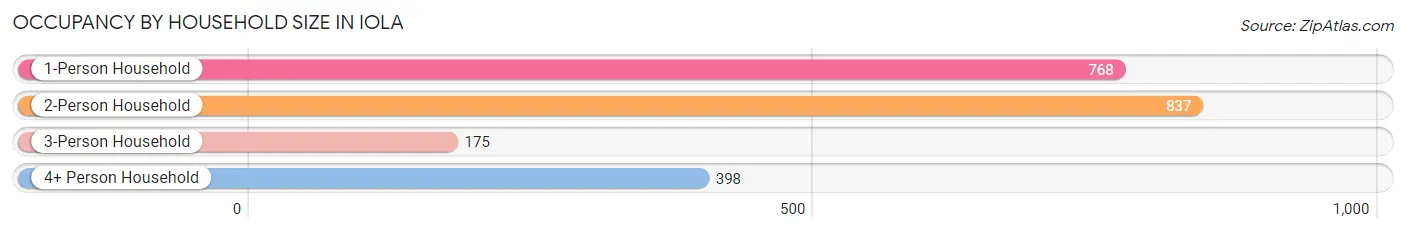
| Household Size | # Housing Units | % Housing Units |
| 1-Person Household | 768 | 35.3% |
| 2-Person Household | 837 | 38.4% |
| 3-Person Household | 175 | 8.0% |
| 4+ Person Household | 398 | 18.3% |
| Total Housing Units | 2,178 | 100.0% |
Occupancy by Ownership by Household Size in Iola
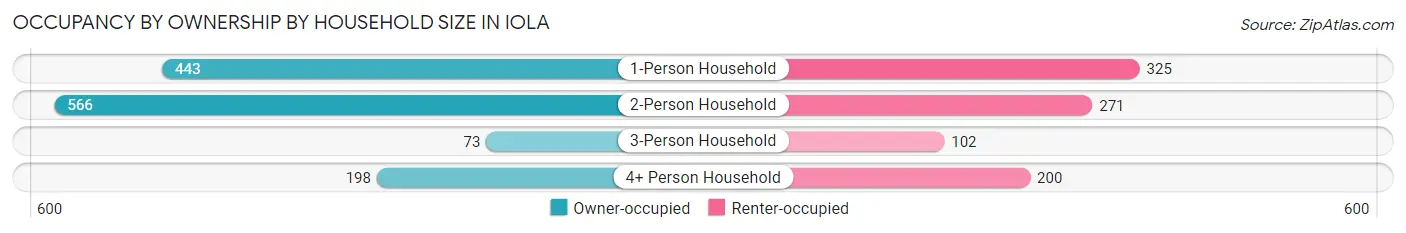
| Household Size | Owner-occupied | Renter-occupied |
| 1-Person Household | 443 (57.7%) | 325 (42.3%) |
| 2-Person Household | 566 (67.6%) | 271 (32.4%) |
| 3-Person Household | 73 (41.7%) | 102 (58.3%) |
| 4+ Person Household | 198 (49.7%) | 200 (50.2%) |
| Total Housing Units | 1,280 (58.8%) | 898 (41.2%) |
Occupancy by Educational Attainment in Iola
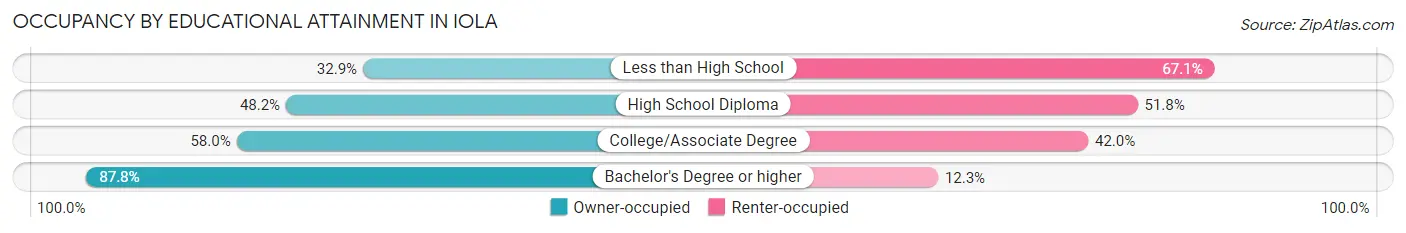
| Household Size | Owner-occupied | Renter-occupied |
| Less than High School | 54 (32.9%) | 110 (67.1%) |
| High School Diploma | 371 (48.2%) | 399 (51.8%) |
| College/Associate Degree | 461 (58.0%) | 334 (42.0%) |
| Bachelor's Degree or higher | 394 (87.7%) | 55 (12.2%) |
Occupancy by Age of Householder in Iola
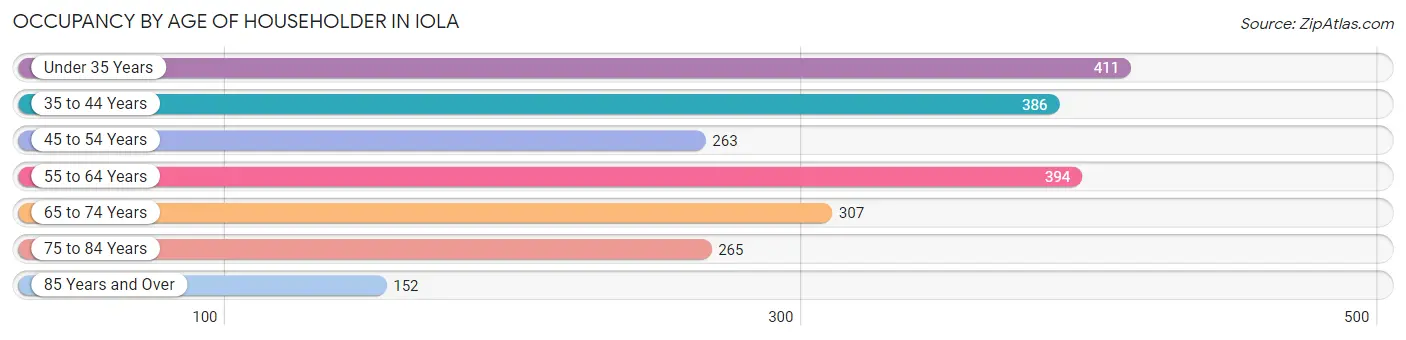
| Age Bracket | # Households | % Households |
| Under 35 Years | 411 | 18.9% |
| 35 to 44 Years | 386 | 17.7% |
| 45 to 54 Years | 263 | 12.1% |
| 55 to 64 Years | 394 | 18.1% |
| 65 to 74 Years | 307 | 14.1% |
| 75 to 84 Years | 265 | 12.2% |
| 85 Years and Over | 152 | 7.0% |
| Total | 2,178 | 100.0% |
Housing Finances in Iola
Median Income by Occupancy in Iola
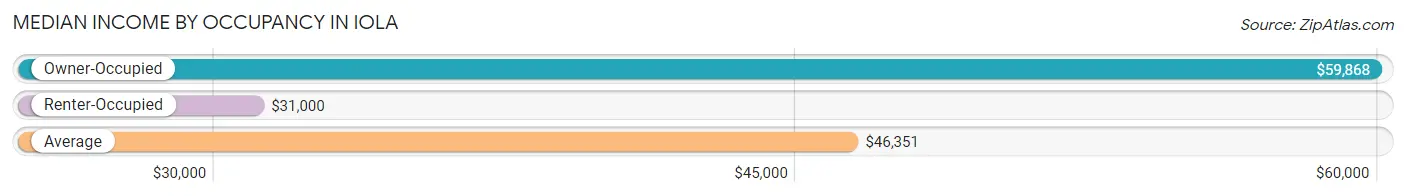
| Occupancy Type | # Households | Median Income |
| Owner-Occupied | 1,280 (58.8%) | $59,868 |
| Renter-Occupied | 898 (41.2%) | $31,000 |
| Average | 2,178 (100.0%) | $46,351 |
Occupancy by Householder Income Bracket in Iola
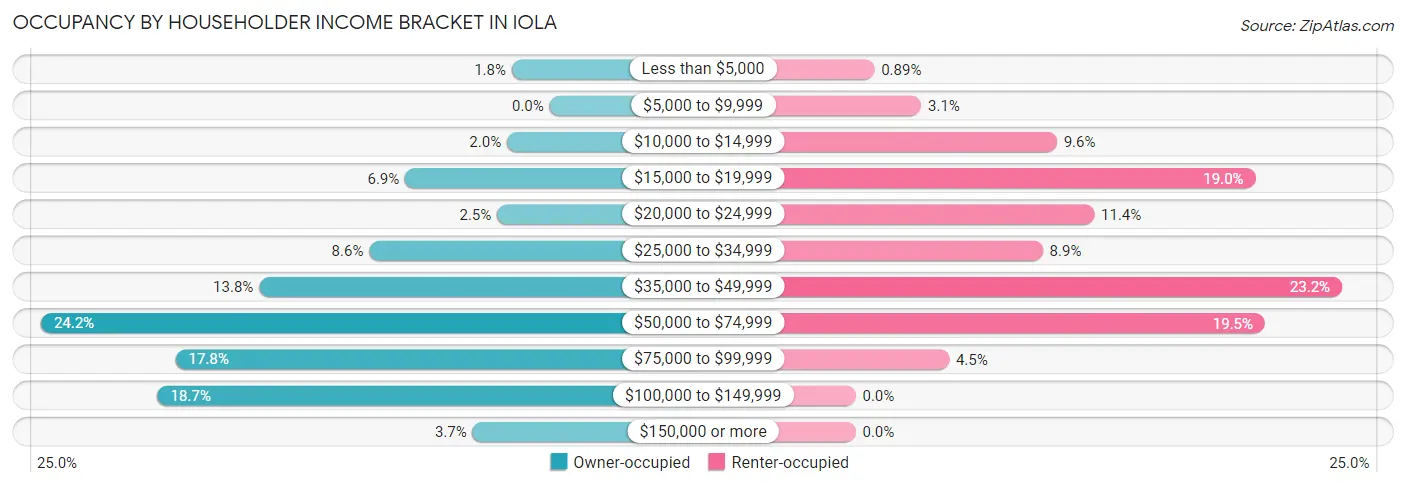
| Income Bracket | Owner-occupied | Renter-occupied |
| Less than $5,000 | 23 (1.8%) | 8 (0.9%) |
| $5,000 to $9,999 | 0 (0.0%) | 28 (3.1%) |
| $10,000 to $14,999 | 26 (2.0%) | 86 (9.6%) |
| $15,000 to $19,999 | 88 (6.9%) | 171 (19.0%) |
| $20,000 to $24,999 | 32 (2.5%) | 102 (11.4%) |
| $25,000 to $34,999 | 110 (8.6%) | 80 (8.9%) |
| $35,000 to $49,999 | 177 (13.8%) | 208 (23.2%) |
| $50,000 to $74,999 | 310 (24.2%) | 175 (19.5%) |
| $75,000 to $99,999 | 228 (17.8%) | 40 (4.4%) |
| $100,000 to $149,999 | 239 (18.7%) | 0 (0.0%) |
| $150,000 or more | 47 (3.7%) | 0 (0.0%) |
| Total | 1,280 (100.0%) | 898 (100.0%) |
Monthly Housing Cost Tiers in Iola
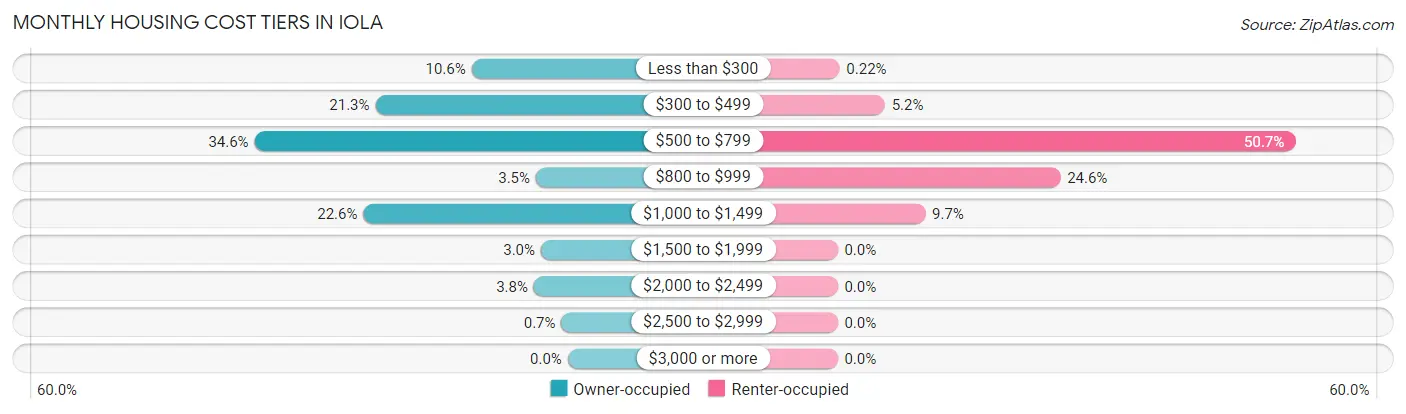
| Monthly Cost | Owner-occupied | Renter-occupied |
| Less than $300 | 136 (10.6%) | 2 (0.2%) |
| $300 to $499 | 272 (21.2%) | 47 (5.2%) |
| $500 to $799 | 443 (34.6%) | 455 (50.7%) |
| $800 to $999 | 45 (3.5%) | 221 (24.6%) |
| $1,000 to $1,499 | 289 (22.6%) | 87 (9.7%) |
| $1,500 to $1,999 | 38 (3.0%) | 0 (0.0%) |
| $2,000 to $2,499 | 48 (3.7%) | 0 (0.0%) |
| $2,500 to $2,999 | 9 (0.7%) | 0 (0.0%) |
| $3,000 or more | 0 (0.0%) | 0 (0.0%) |
| Total | 1,280 (100.0%) | 898 (100.0%) |
Physical Housing Characteristics in Iola
Housing Structures in Iola
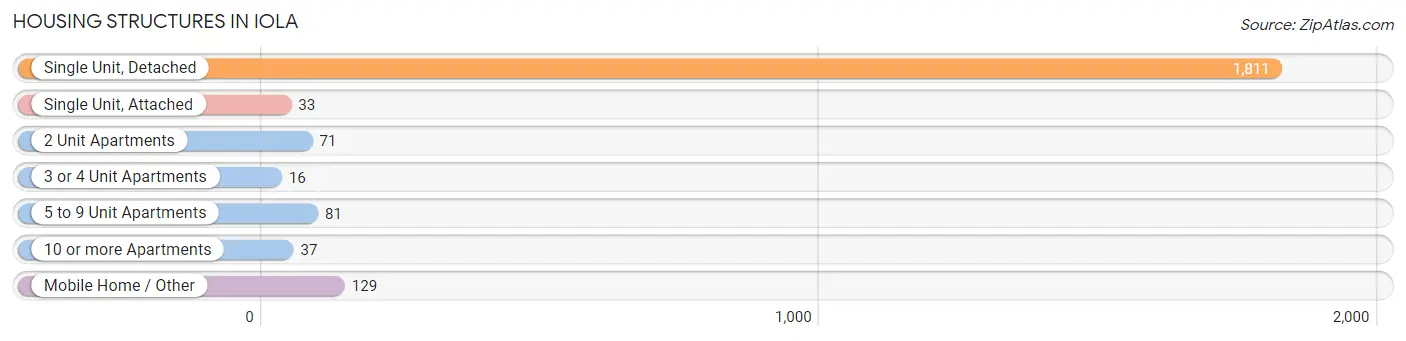
| Structure Type | # Housing Units | % Housing Units |
| Single Unit, Detached | 1,811 | 83.2% |
| Single Unit, Attached | 33 | 1.5% |
| 2 Unit Apartments | 71 | 3.3% |
| 3 or 4 Unit Apartments | 16 | 0.7% |
| 5 to 9 Unit Apartments | 81 | 3.7% |
| 10 or more Apartments | 37 | 1.7% |
| Mobile Home / Other | 129 | 5.9% |
| Total | 2,178 | 100.0% |
Housing Structures by Occupancy in Iola
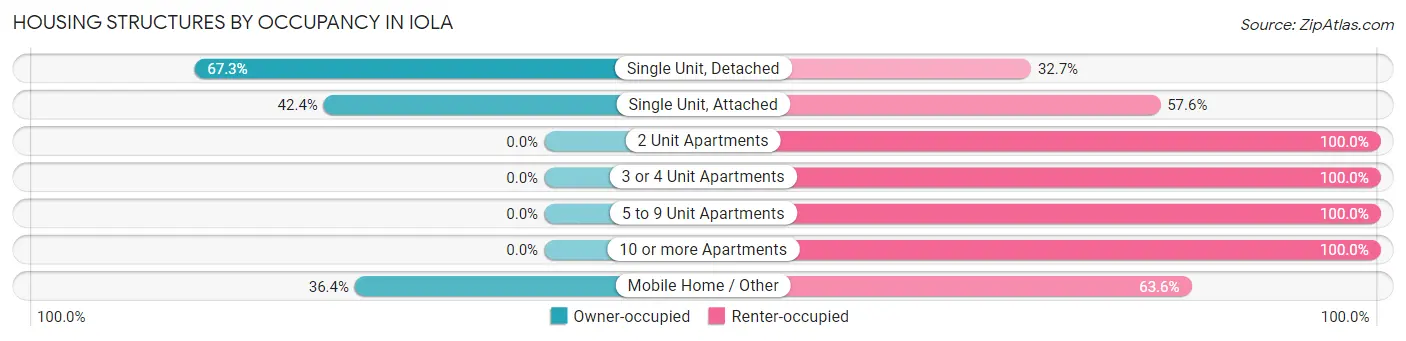
| Structure Type | Owner-occupied | Renter-occupied |
| Single Unit, Detached | 1,219 (67.3%) | 592 (32.7%) |
| Single Unit, Attached | 14 (42.4%) | 19 (57.6%) |
| 2 Unit Apartments | 0 (0.0%) | 71 (100.0%) |
| 3 or 4 Unit Apartments | 0 (0.0%) | 16 (100.0%) |
| 5 to 9 Unit Apartments | 0 (0.0%) | 81 (100.0%) |
| 10 or more Apartments | 0 (0.0%) | 37 (100.0%) |
| Mobile Home / Other | 47 (36.4%) | 82 (63.6%) |
| Total | 1,280 (58.8%) | 898 (41.2%) |
Housing Structures by Number of Rooms in Iola
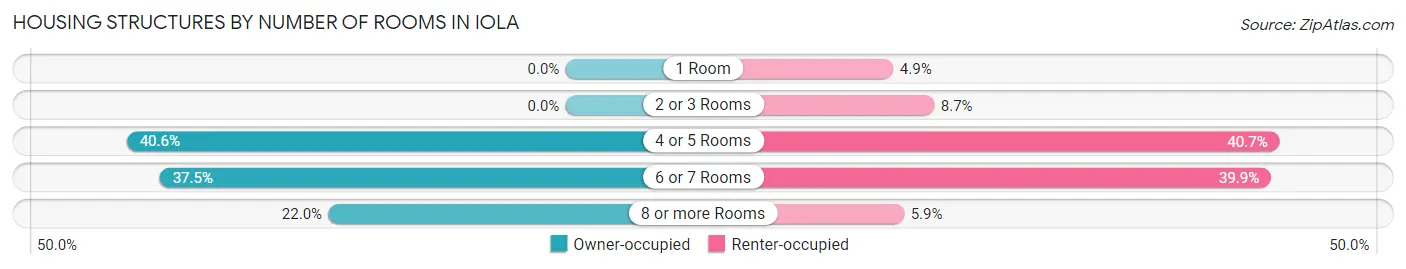
| Number of Rooms | Owner-occupied | Renter-occupied |
| 1 Room | 0 (0.0%) | 44 (4.9%) |
| 2 or 3 Rooms | 0 (0.0%) | 78 (8.7%) |
| 4 or 5 Rooms | 519 (40.6%) | 365 (40.6%) |
| 6 or 7 Rooms | 480 (37.5%) | 358 (39.9%) |
| 8 or more Rooms | 281 (22.0%) | 53 (5.9%) |
| Total | 1,280 (100.0%) | 898 (100.0%) |
Housing Structure by Heating Type in Iola
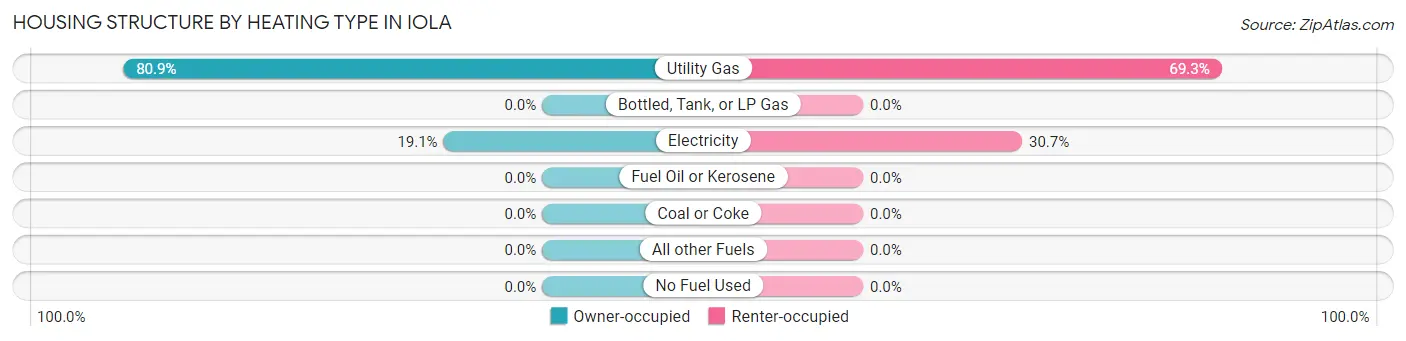
| Heating Type | Owner-occupied | Renter-occupied |
| Utility Gas | 1,036 (80.9%) | 622 (69.3%) |
| Bottled, Tank, or LP Gas | 0 (0.0%) | 0 (0.0%) |
| Electricity | 244 (19.1%) | 276 (30.7%) |
| Fuel Oil or Kerosene | 0 (0.0%) | 0 (0.0%) |
| Coal or Coke | 0 (0.0%) | 0 (0.0%) |
| All other Fuels | 0 (0.0%) | 0 (0.0%) |
| No Fuel Used | 0 (0.0%) | 0 (0.0%) |
| Total | 1,280 (100.0%) | 898 (100.0%) |
Household Vehicle Usage in Iola
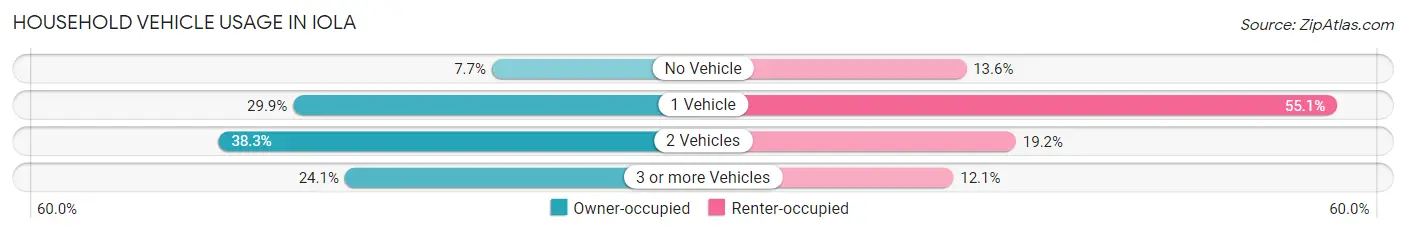
| Vehicles per Household | Owner-occupied | Renter-occupied |
| No Vehicle | 98 (7.7%) | 122 (13.6%) |
| 1 Vehicle | 383 (29.9%) | 495 (55.1%) |
| 2 Vehicles | 490 (38.3%) | 172 (19.2%) |
| 3 or more Vehicles | 309 (24.1%) | 109 (12.1%) |
| Total | 1,280 (100.0%) | 898 (100.0%) |
Real Estate & Mortgages in Iola
Real Estate and Mortgage Overview in Iola
| Characteristic | Without Mortgage | With Mortgage |
| Housing Units | 690 | 590 |
| Median Property Value | $70,000 | $100,600 |
| Median Household Income | $57,347 | $37 |
| Monthly Housing Costs | $427 | $0 |
| Real Estate Taxes | $1,195 | $21 |
Property Value by Mortgage Status in Iola
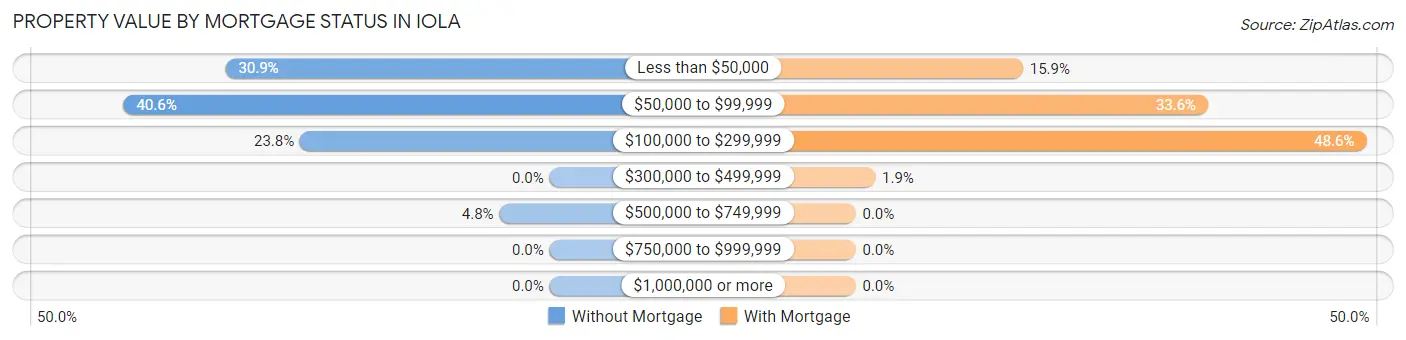
| Property Value | Without Mortgage | With Mortgage |
| Less than $50,000 | 213 (30.9%) | 94 (15.9%) |
| $50,000 to $99,999 | 280 (40.6%) | 198 (33.6%) |
| $100,000 to $299,999 | 164 (23.8%) | 287 (48.6%) |
| $300,000 to $499,999 | 0 (0.0%) | 11 (1.9%) |
| $500,000 to $749,999 | 33 (4.8%) | 0 (0.0%) |
| $750,000 to $999,999 | 0 (0.0%) | 0 (0.0%) |
| $1,000,000 or more | 0 (0.0%) | 0 (0.0%) |
| Total | 690 (100.0%) | 590 (100.0%) |
Household Income by Mortgage Status in Iola
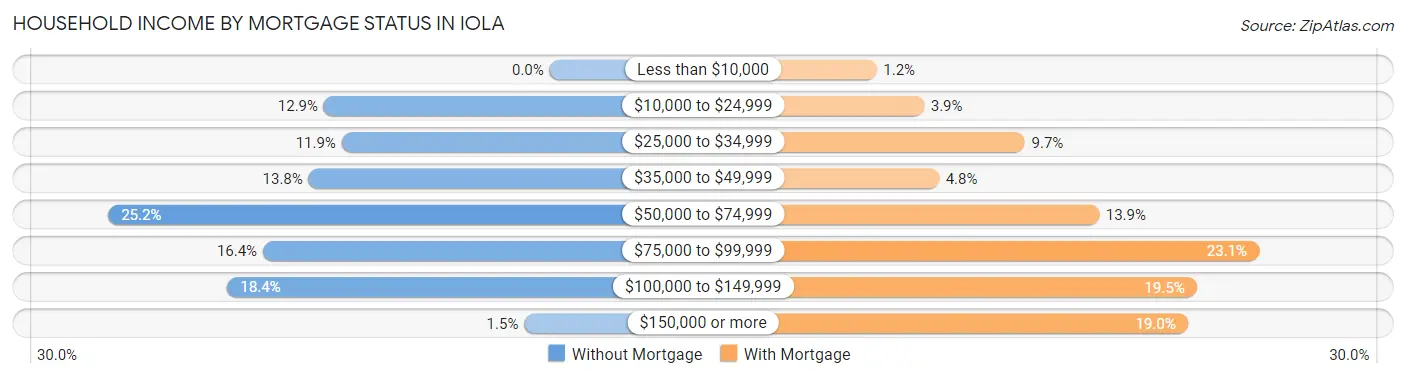
| Household Income | Without Mortgage | With Mortgage |
| Less than $10,000 | 0 (0.0%) | 7 (1.2%) |
| $10,000 to $24,999 | 89 (12.9%) | 23 (3.9%) |
| $25,000 to $34,999 | 82 (11.9%) | 57 (9.7%) |
| $35,000 to $49,999 | 95 (13.8%) | 28 (4.8%) |
| $50,000 to $74,999 | 174 (25.2%) | 82 (13.9%) |
| $75,000 to $99,999 | 113 (16.4%) | 136 (23.1%) |
| $100,000 to $149,999 | 127 (18.4%) | 115 (19.5%) |
| $150,000 or more | 10 (1.5%) | 112 (19.0%) |
| Total | 690 (100.0%) | 590 (100.0%) |
Property Value to Household Income Ratio in Iola
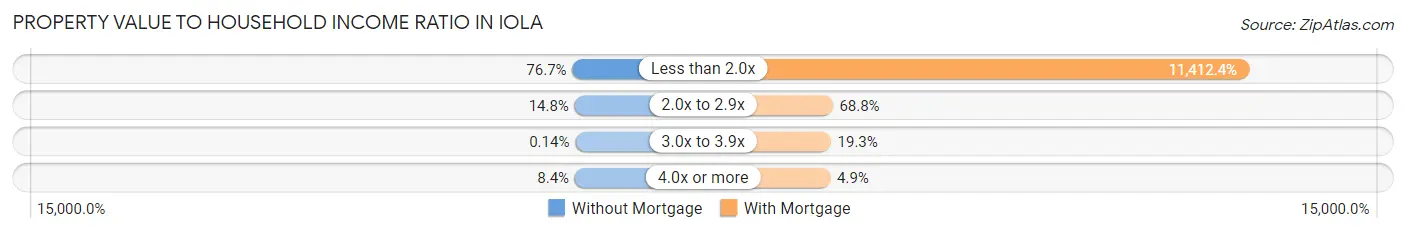
| Value-to-Income Ratio | Without Mortgage | With Mortgage |
| Less than 2.0x | 529 (76.7%) | 67,333 (11,412.4%) |
| 2.0x to 2.9x | 102 (14.8%) | 406 (68.8%) |
| 3.0x to 3.9x | 1 (0.1%) | 114 (19.3%) |
| 4.0x or more | 58 (8.4%) | 29 (4.9%) |
| Total | 690 (100.0%) | 590 (100.0%) |
Real Estate Taxes by Mortgage Status in Iola
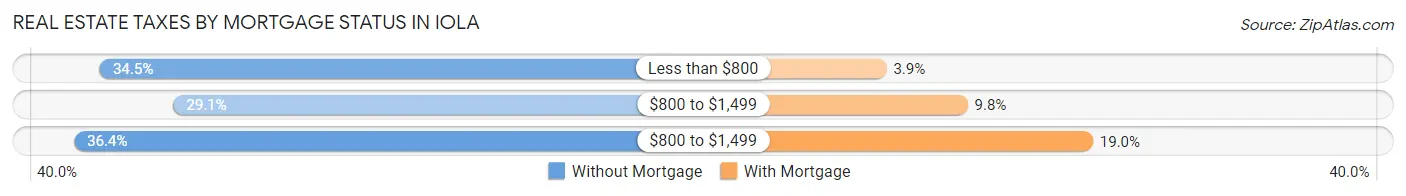
| Property Taxes | Without Mortgage | With Mortgage |
| Less than $800 | 238 (34.5%) | 23 (3.9%) |
| $800 to $1,499 | 201 (29.1%) | 58 (9.8%) |
| $800 to $1,499 | 251 (36.4%) | 112 (19.0%) |
| Total | 690 (100.0%) | 590 (100.0%) |
Health & Disability in Iola
Health Insurance Coverage by Age in Iola
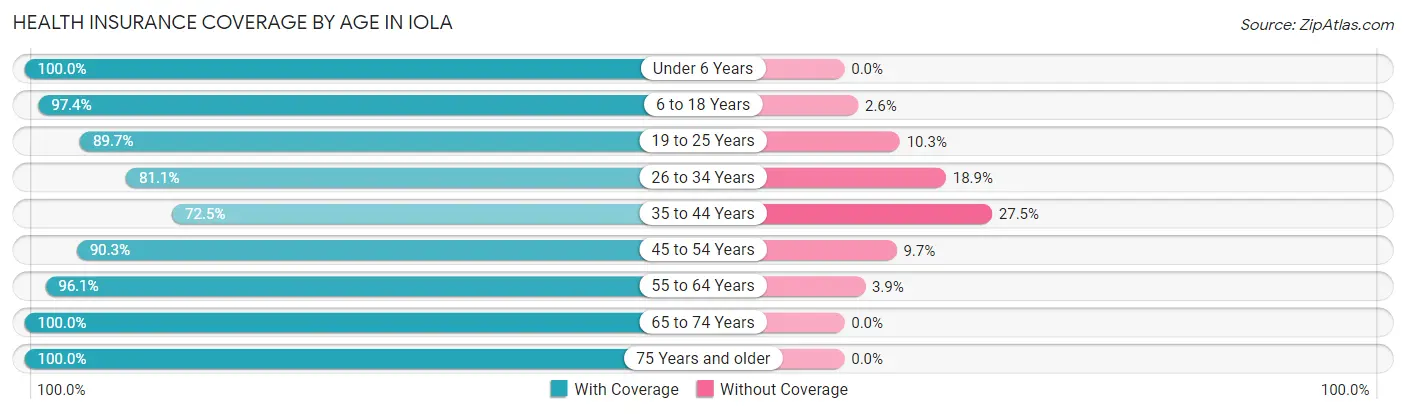
| Age Bracket | With Coverage | Without Coverage |
| Under 6 Years | 355 (100.0%) | 0 (0.0%) |
| 6 to 18 Years | 951 (97.4%) | 25 (2.6%) |
| 19 to 25 Years | 546 (89.7%) | 63 (10.3%) |
| 26 to 34 Years | 531 (81.1%) | 124 (18.9%) |
| 35 to 44 Years | 403 (72.5%) | 153 (27.5%) |
| 45 to 54 Years | 473 (90.3%) | 51 (9.7%) |
| 55 to 64 Years | 598 (96.1%) | 24 (3.9%) |
| 65 to 74 Years | 490 (100.0%) | 0 (0.0%) |
| 75 Years and older | 494 (100.0%) | 0 (0.0%) |
| Total | 4,841 (91.7%) | 440 (8.3%) |
Health Insurance Coverage by Citizenship Status in Iola
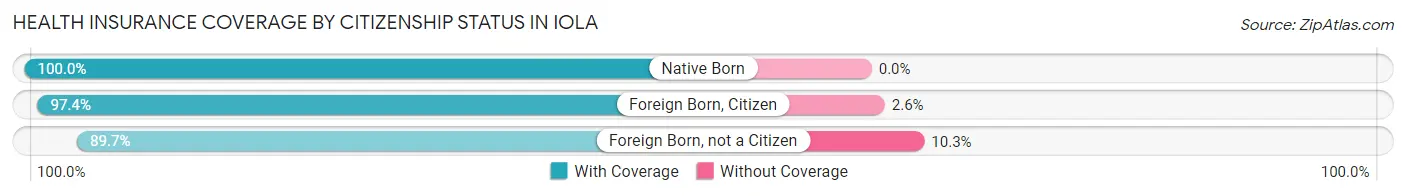
| Citizenship Status | With Coverage | Without Coverage |
| Native Born | 355 (100.0%) | 0 (0.0%) |
| Foreign Born, Citizen | 951 (97.4%) | 25 (2.6%) |
| Foreign Born, not a Citizen | 546 (89.7%) | 63 (10.3%) |
Health Insurance Coverage by Household Income in Iola
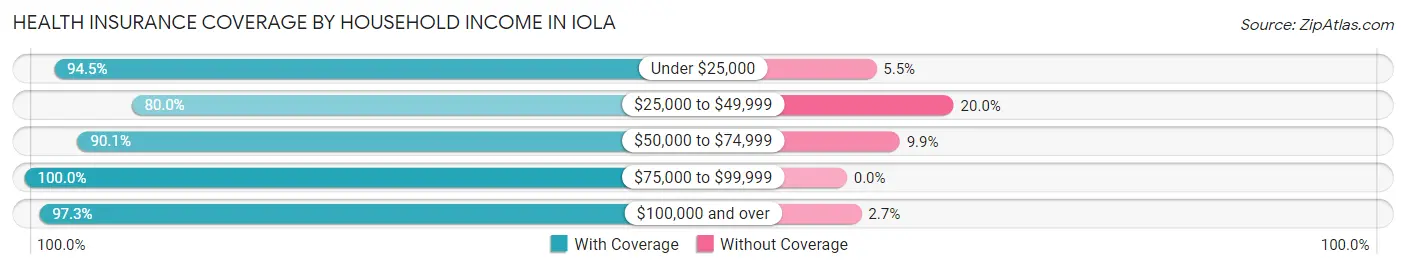
| Household Income | With Coverage | Without Coverage |
| Under $25,000 | 1,057 (94.5%) | 62 (5.5%) |
| $25,000 to $49,999 | 891 (80.0%) | 223 (20.0%) |
| $50,000 to $74,999 | 1,063 (90.1%) | 117 (9.9%) |
| $75,000 to $99,999 | 547 (100.0%) | 0 (0.0%) |
| $100,000 and over | 1,031 (97.3%) | 29 (2.7%) |
Public vs Private Health Insurance Coverage by Age in Iola
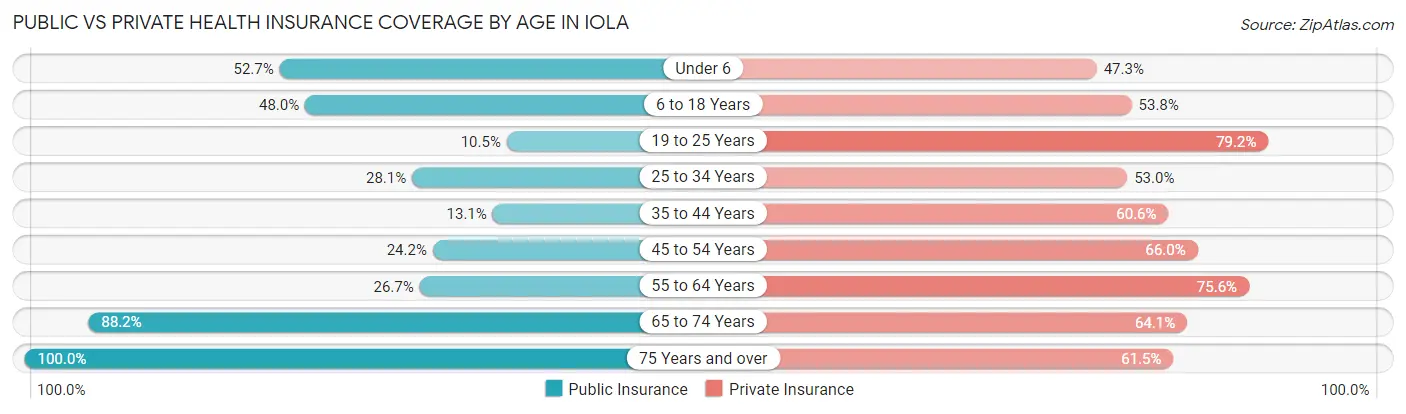
| Age Bracket | Public Insurance | Private Insurance |
| Under 6 | 187 (52.7%) | 168 (47.3%) |
| 6 to 18 Years | 468 (47.9%) | 525 (53.8%) |
| 19 to 25 Years | 64 (10.5%) | 482 (79.1%) |
| 25 to 34 Years | 184 (28.1%) | 347 (53.0%) |
| 35 to 44 Years | 73 (13.1%) | 337 (60.6%) |
| 45 to 54 Years | 127 (24.2%) | 346 (66.0%) |
| 55 to 64 Years | 166 (26.7%) | 470 (75.6%) |
| 65 to 74 Years | 432 (88.2%) | 314 (64.1%) |
| 75 Years and over | 494 (100.0%) | 304 (61.5%) |
| Total | 2,195 (41.6%) | 3,293 (62.4%) |
Disability Status by Sex by Age in Iola
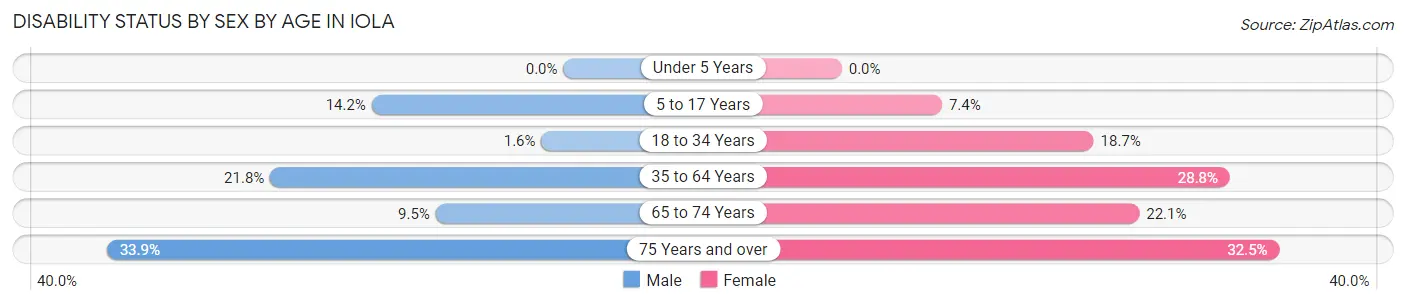
| Age Bracket | Male | Female |
| Under 5 Years | 0 (0.0%) | 0 (0.0%) |
| 5 to 17 Years | 77 (14.2%) | 30 (7.4%) |
| 18 to 34 Years | 11 (1.6%) | 129 (18.7%) |
| 35 to 64 Years | 162 (21.8%) | 276 (28.8%) |
| 65 to 74 Years | 22 (9.5%) | 57 (22.1%) |
| 75 Years and over | 60 (33.9%) | 103 (32.5%) |
Disability Class by Sex by Age in Iola
Disability Class: Hearing Difficulty
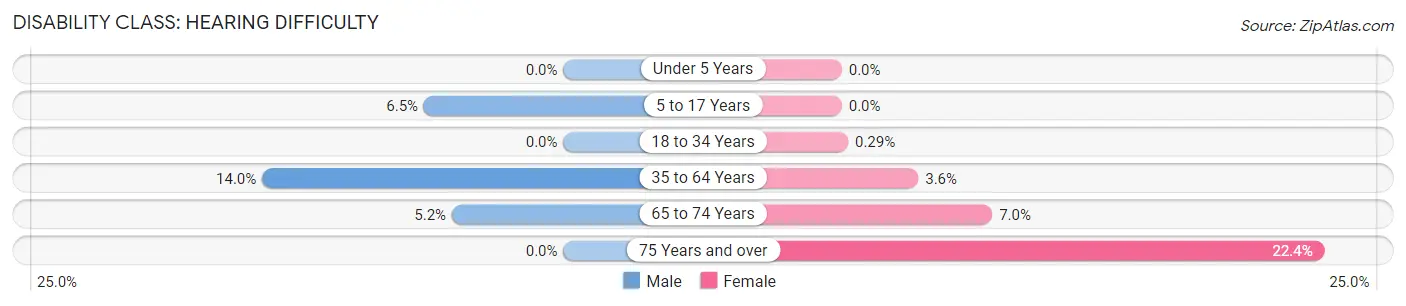
| Age Bracket | Male | Female |
| Under 5 Years | 0 (0.0%) | 0 (0.0%) |
| 5 to 17 Years | 35 (6.5%) | 0 (0.0%) |
| 18 to 34 Years | 0 (0.0%) | 2 (0.3%) |
| 35 to 64 Years | 104 (14.0%) | 34 (3.5%) |
| 65 to 74 Years | 12 (5.2%) | 18 (7.0%) |
| 75 Years and over | 0 (0.0%) | 71 (22.4%) |
Disability Class: Vision Difficulty
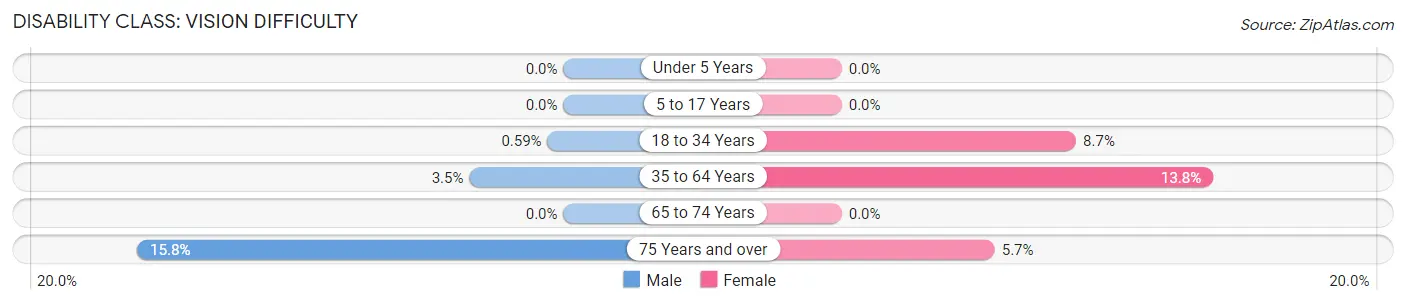
| Age Bracket | Male | Female |
| Under 5 Years | 0 (0.0%) | 0 (0.0%) |
| 5 to 17 Years | 0 (0.0%) | 0 (0.0%) |
| 18 to 34 Years | 4 (0.6%) | 60 (8.7%) |
| 35 to 64 Years | 26 (3.5%) | 132 (13.8%) |
| 65 to 74 Years | 0 (0.0%) | 0 (0.0%) |
| 75 Years and over | 28 (15.8%) | 18 (5.7%) |
Disability Class: Cognitive Difficulty
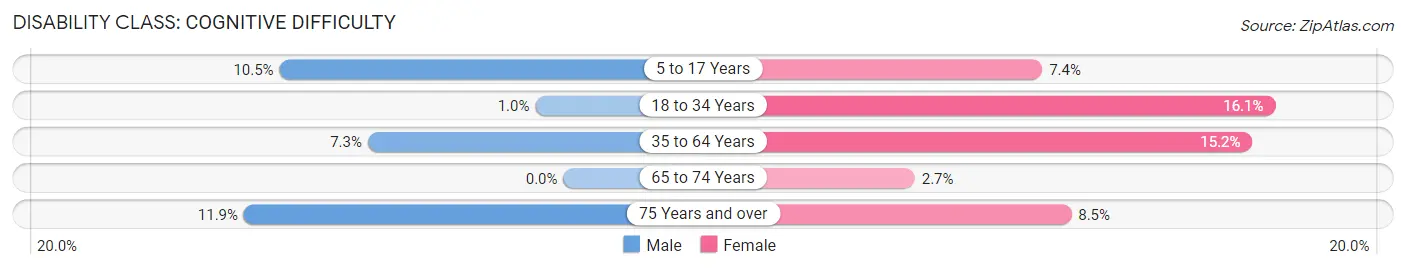
| Age Bracket | Male | Female |
| 5 to 17 Years | 57 (10.5%) | 30 (7.4%) |
| 18 to 34 Years | 7 (1.0%) | 111 (16.1%) |
| 35 to 64 Years | 54 (7.3%) | 146 (15.2%) |
| 65 to 74 Years | 0 (0.0%) | 7 (2.7%) |
| 75 Years and over | 21 (11.9%) | 27 (8.5%) |
Disability Class: Ambulatory Difficulty
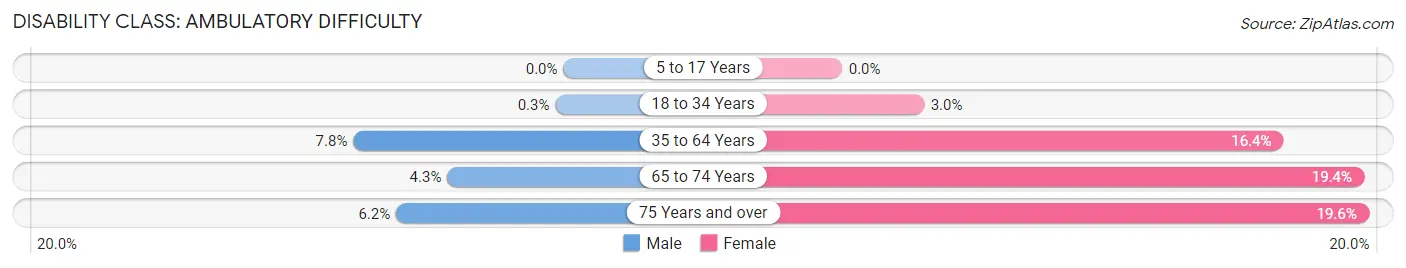
| Age Bracket | Male | Female |
| 5 to 17 Years | 0 (0.0%) | 0 (0.0%) |
| 18 to 34 Years | 2 (0.3%) | 21 (3.0%) |
| 35 to 64 Years | 58 (7.8%) | 157 (16.4%) |
| 65 to 74 Years | 10 (4.3%) | 50 (19.4%) |
| 75 Years and over | 11 (6.2%) | 62 (19.6%) |
Disability Class: Self-Care Difficulty
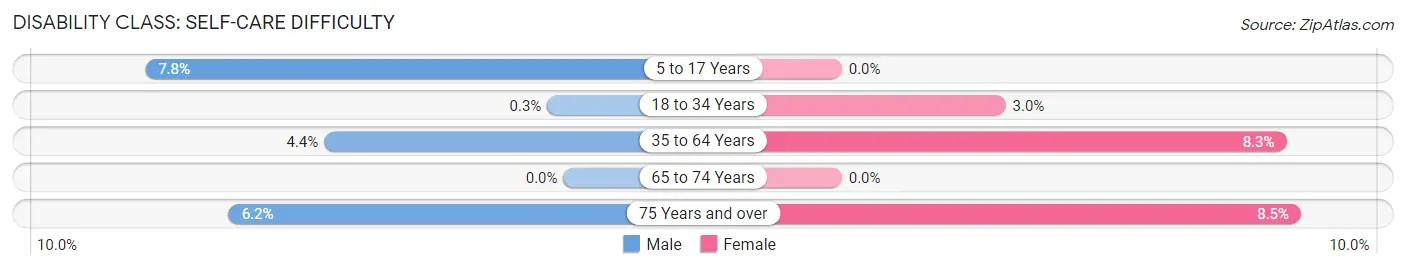
| Age Bracket | Male | Female |
| 5 to 17 Years | 42 (7.8%) | 0 (0.0%) |
| 18 to 34 Years | 2 (0.3%) | 21 (3.0%) |
| 35 to 64 Years | 33 (4.4%) | 79 (8.3%) |
| 65 to 74 Years | 0 (0.0%) | 0 (0.0%) |
| 75 Years and over | 11 (6.2%) | 27 (8.5%) |
Technology Access in Iola
Computing Device Access in Iola
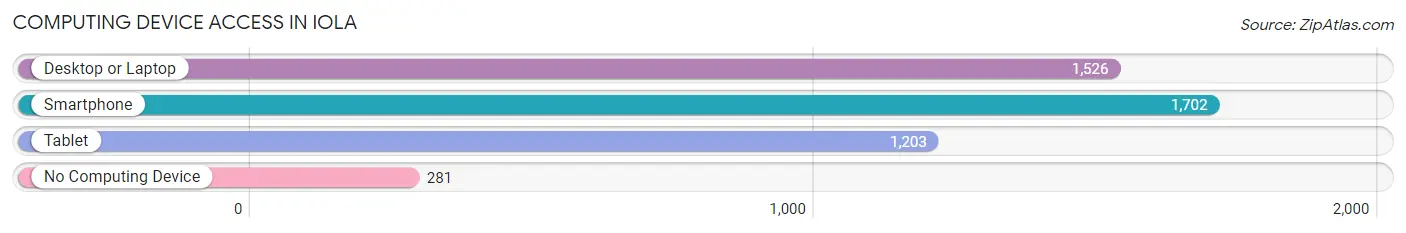
| Device Type | # Households | % Households |
| Desktop or Laptop | 1,526 | 70.1% |
| Smartphone | 1,702 | 78.1% |
| Tablet | 1,203 | 55.2% |
| No Computing Device | 281 | 12.9% |
| Total | 2,178 | 100.0% |
Internet Access in Iola
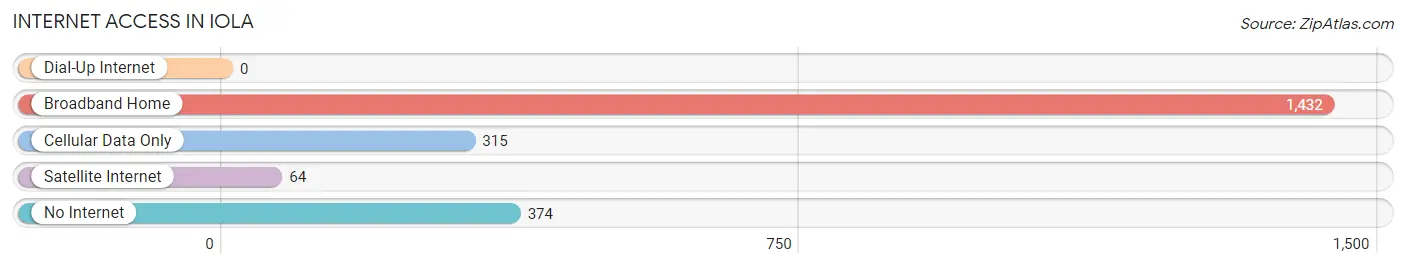
| Internet Type | # Households | % Households |
| Dial-Up Internet | 0 | 0.0% |
| Broadband Home | 1,432 | 65.7% |
| Cellular Data Only | 315 | 14.5% |
| Satellite Internet | 64 | 2.9% |
| No Internet | 374 | 17.2% |
| Total | 2,178 | 100.0% |
Iola Summary
Iola, Kansas is a small city located in Allen County, in the southeastern part of the state. It is the county seat of Allen County and is situated on the Neosho River. The city has a population of 5,704 people, according to the 2010 census.
Geography
Iola is located in the southeastern part of Kansas, in Allen County. It is situated on the Neosho River, which flows through the city. The city is located at an elevation of 890 feet above sea level. The city has a total area of 4.2 square miles, of which 4.1 square miles is land and 0.1 square miles is water.
The climate in Iola is classified as humid subtropical, with hot, humid summers and mild winters. The average temperature in the summer is around 80 degrees Fahrenheit, while the average temperature in the winter is around 40 degrees Fahrenheit. The average annual precipitation is around 37 inches.
History
Iola was founded in 1858 by settlers from Ohio. The city was named after Iola Colborn, the daughter of one of the settlers. The city was incorporated in 1859 and was designated as the county seat of Allen County in 1864.
In the late 19th century, Iola was a major center for the production of agricultural products, such as wheat, corn, and oats. The city also had a thriving lumber industry. In the early 20th century, Iola was a major center for the production of oil and gas.
Economy
Iola’s economy is largely based on agriculture and manufacturing. The city is home to several large agricultural companies, such as Cargill, Inc., and Tyson Foods. The city also has several manufacturing companies, such as Iola Industries, which produces plastic products, and Iola Foundry, which produces castings for the automotive industry.
The city also has a thriving retail sector, with several large stores, such as Walmart and Target, located in the city. The city also has several restaurants, bars, and other entertainment venues.
Demographics
According to the 2010 census, Iola has a population of 5,704 people. The racial makeup of the city is 87.3% White, 8.2% African American, 0.5% Native American, 0.4% Asian, 0.1% Pacific Islander, 1.2% from other races, and 2.3% from two or more races. The median household income in Iola is $37,941, and the median family income is $45,941.
Conclusion
Iola, Kansas is a small city located in Allen County, in the southeastern part of the state. It is the county seat of Allen County and is situated on the Neosho River. The city has a population of 5,704 people, according to the 2010 census. The city’s economy is largely based on agriculture and manufacturing, and it has a thriving retail sector. The city also has a diverse population, with a median household income of $37,941.
Common Questions
What is Per Capita Income in Iola?
Per Capita income in Iola is $23,718.
What is the Median Family Income in Iola?
Median Family Income in Iola is $56,823.
What is the Median Household income in Iola?
Median Household Income in Iola is $46,351.
What is Income or Wage Gap in Iola?
Income or Wage Gap in Iola is 31.9%.
Women in Iola earn 68.1 cents for every dollar earned by a man.
What is Inequality or Gini Index in Iola?
Inequality or Gini Index in Iola is 0.38.
What is the Total Population of Iola?
Total Population of Iola is 5,395.
What is the Total Male Population of Iola?
Total Male Population of Iola is 2,566.
What is the Total Female Population of Iola?
Total Female Population of Iola is 2,829.
What is the Ratio of Males per 100 Females in Iola?
There are 90.70 Males per 100 Females in Iola.
What is the Ratio of Females per 100 Males in Iola?
There are 110.25 Females per 100 Males in Iola.
What is the Median Population Age in Iola?
Median Population Age in Iola is 37.2 Years.
What is the Average Family Size in Iola
Average Family Size in Iola is 3.0 People.
What is the Average Household Size in Iola
Average Household Size in Iola is 2.3 People.
How Large is the Labor Force in Iola?
There are 2,479 People in the Labor Forcein in Iola.
What is the Percentage of People in the Labor Force in Iola?
57.6% of People are in the Labor Force in Iola.
What is the Unemployment Rate in Iola?
Unemployment Rate in Iola is 6.7%.