Holton, KS Map & Demographics
Holton Map
Holton Overview
$26,104
PER CAPITA INCOME
$86,875
AVG FAMILY INCOME
$47,188
AVG HOUSEHOLD INCOME
39.1%
WAGE / INCOME GAP [ % ]
60.9¢/ $1
WAGE / INCOME GAP [ $ ]
0.41
INEQUALITY / GINI INDEX
3,386
TOTAL POPULATION
1,643
MALE POPULATION
1,743
FEMALE POPULATION
94.26
MALES / 100 FEMALES
106.09
FEMALES / 100 MALES
37.6
MEDIAN AGE
3.4
AVG FAMILY SIZE
2.3
AVG HOUSEHOLD SIZE
1,750
LABOR FORCE [ PEOPLE ]
63.7%
PERCENT IN LABOR FORCE
2.8%
UNEMPLOYMENT RATE
Holton Zip Codes
Holton Area Codes
Income in Holton
Income Overview in Holton
Per Capita Income in Holton is $26,104, while median incomes of families and households are $86,875 and $47,188 respectively.
| Characteristic | Number | Measure |
| Per Capita Income | 3,386 | $26,104 |
| Median Family Income | 698 | $86,875 |
| Mean Family Income | 698 | $84,670 |
| Median Household Income | 1,369 | $47,188 |
| Mean Household Income | 1,369 | $61,256 |
| Income Deficit | 698 | $0 |
| Wage / Income Gap (%) | 3,386 | 39.13% |
| Wage / Income Gap ($) | 3,386 | 60.87¢ per $1 |
| Gini / Inequality Index | 3,386 | 0.41 |
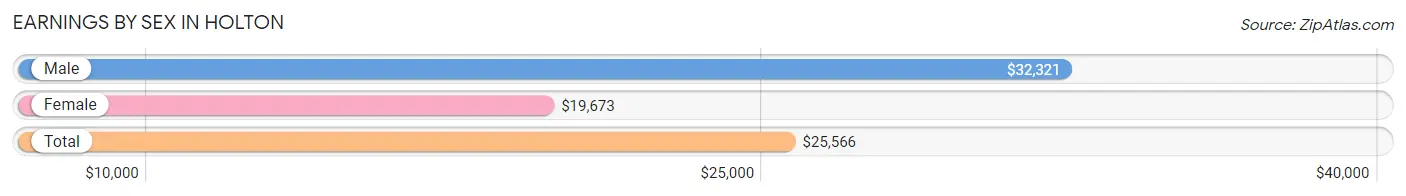
Earnings by Sex in Holton
Average Earnings in Holton are $25,566, $32,321 for men and $19,673 for women, a difference of 39.1%.
| Sex | Number | Average Earnings |
| Male | 871 (46.7%) | $32,321 |
| Female | 993 (53.3%) | $19,673 |
| Total | 1,864 (100.0%) | $25,566 |
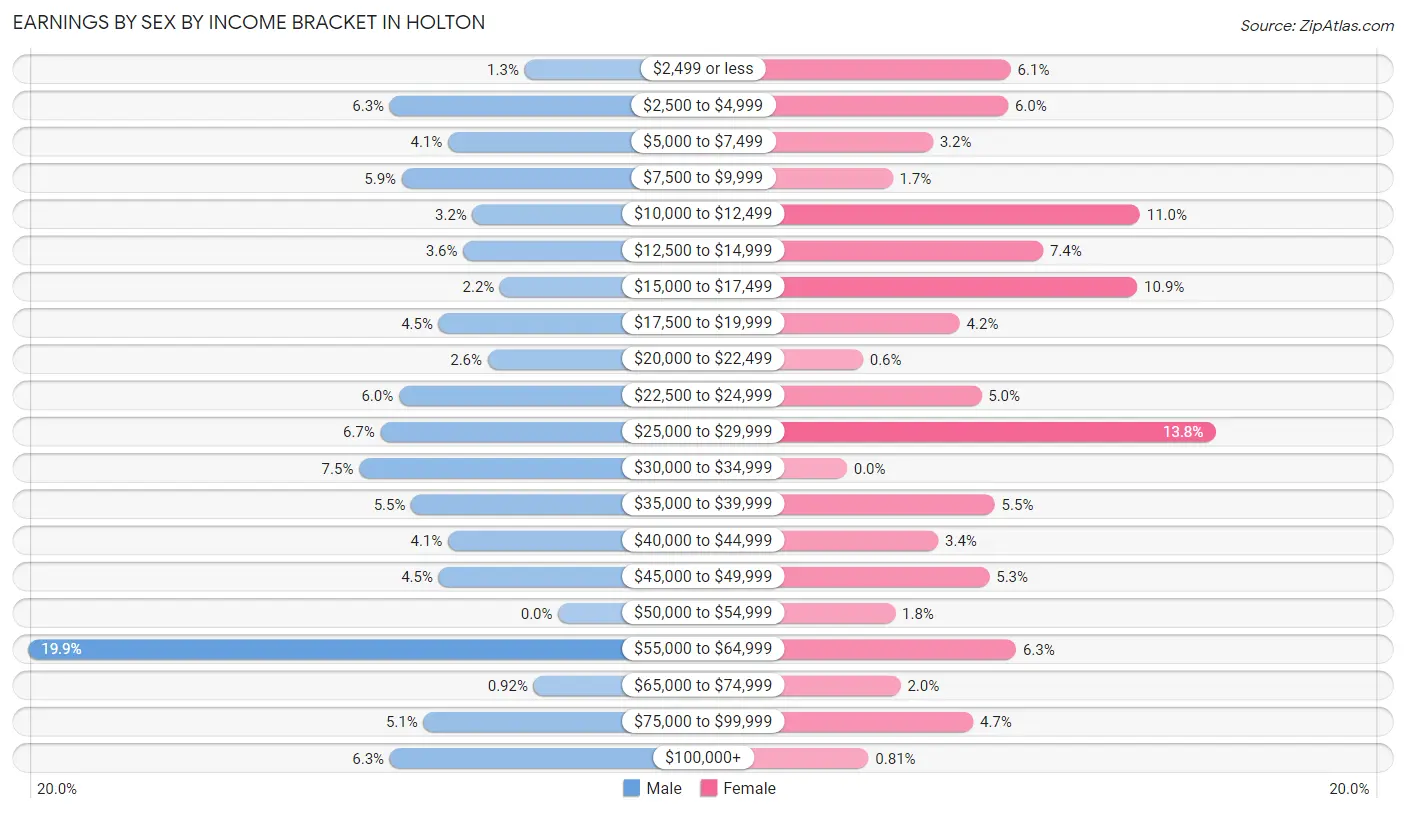
Earnings by Sex by Income Bracket in Holton
The most common earnings brackets in Holton are $55,000 to $64,999 for men (173 | 19.9%) and $25,000 to $29,999 for women (137 | 13.8%).
| Income | Male | Female |
| $2,499 or less | 11 (1.3%) | 61 (6.1%) |
| $2,500 to $4,999 | 55 (6.3%) | 60 (6.0%) |
| $5,000 to $7,499 | 36 (4.1%) | 32 (3.2%) |
| $7,500 to $9,999 | 51 (5.9%) | 17 (1.7%) |
| $10,000 to $12,499 | 28 (3.2%) | 109 (11.0%) |
| $12,500 to $14,999 | 31 (3.6%) | 73 (7.3%) |
| $15,000 to $17,499 | 19 (2.2%) | 108 (10.9%) |
| $17,500 to $19,999 | 39 (4.5%) | 42 (4.2%) |
| $20,000 to $22,499 | 23 (2.6%) | 6 (0.6%) |
| $22,500 to $24,999 | 52 (6.0%) | 50 (5.0%) |
| $25,000 to $29,999 | 58 (6.7%) | 137 (13.8%) |
| $30,000 to $34,999 | 65 (7.5%) | 0 (0.0%) |
| $35,000 to $39,999 | 48 (5.5%) | 55 (5.5%) |
| $40,000 to $44,999 | 36 (4.1%) | 34 (3.4%) |
| $45,000 to $49,999 | 39 (4.5%) | 53 (5.3%) |
| $50,000 to $54,999 | 0 (0.0%) | 18 (1.8%) |
| $55,000 to $64,999 | 173 (19.9%) | 63 (6.3%) |
| $65,000 to $74,999 | 8 (0.9%) | 20 (2.0%) |
| $75,000 to $99,999 | 44 (5.1%) | 47 (4.7%) |
| $100,000+ | 55 (6.3%) | 8 (0.8%) |
| Total | 871 (100.0%) | 993 (100.0%) |
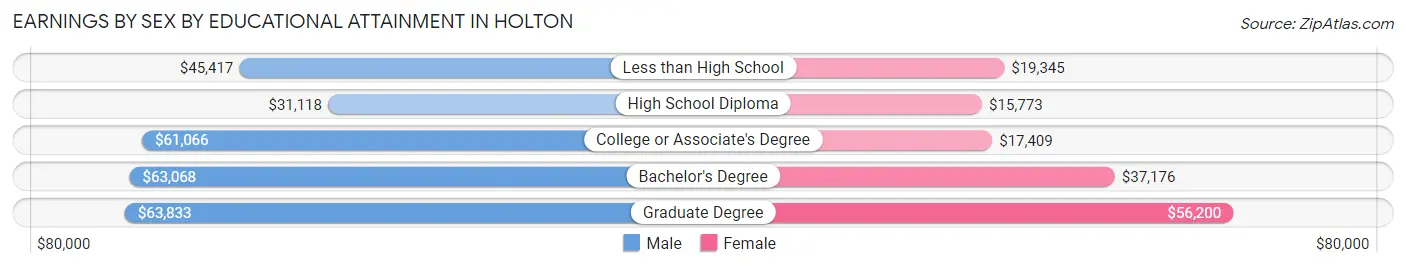
Earnings by Sex by Educational Attainment in Holton
Average earnings in Holton are $47,276 for men and $24,094 for women, a difference of 49.0%. Men with an educational attainment of graduate degree enjoy the highest average annual earnings of $63,833, while those with high school diploma education earn the least with $31,118. Women with an educational attainment of graduate degree earn the most with the average annual earnings of $56,200, while those with high school diploma education have the smallest earnings of $15,773.
| Educational Attainment | Male Income | Female Income |
| Less than High School | $45,417 | $19,345 |
| High School Diploma | $31,118 | $15,773 |
| College or Associate's Degree | $61,066 | $17,409 |
| Bachelor's Degree | $63,068 | $37,176 |
| Graduate Degree | $63,833 | $56,200 |
| Total | $47,276 | $24,094 |
Family Income in Holton
Family Income Brackets in Holton
According to the Holton family income data, there are 181 families falling into the $75,000 to $99,999 income range, which is the most common income bracket and makes up 25.9% of all families. Conversely, the $15,000 to $24,999 income bracket is the least frequent group with only 11 families (1.6%) belonging to this category.
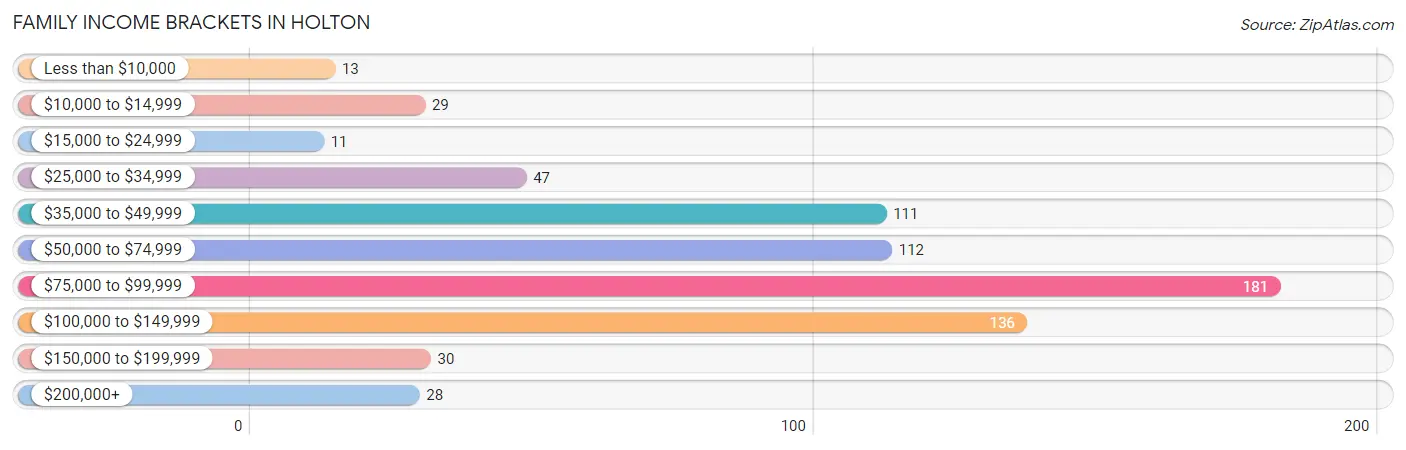
| Income Bracket | # Families | % Families |
| Less than $10,000 | 13 | 1.9% |
| $10,000 to $14,999 | 29 | 4.2% |
| $15,000 to $24,999 | 11 | 1.6% |
| $25,000 to $34,999 | 47 | 6.7% |
| $35,000 to $49,999 | 111 | 15.9% |
| $50,000 to $74,999 | 112 | 16.0% |
| $75,000 to $99,999 | 181 | 25.9% |
| $100,000 to $149,999 | 136 | 19.5% |
| $150,000 to $199,999 | 30 | 4.3% |
| $200,000+ | 28 | 4.0% |
Family Income by Famaliy Size in Holton
6-person families (38 | 5.4%) account for the highest median family income in Holton with $124,342 per family, while 3-person families (131 | 18.8%) have the highest median income of $31,372 per family member.
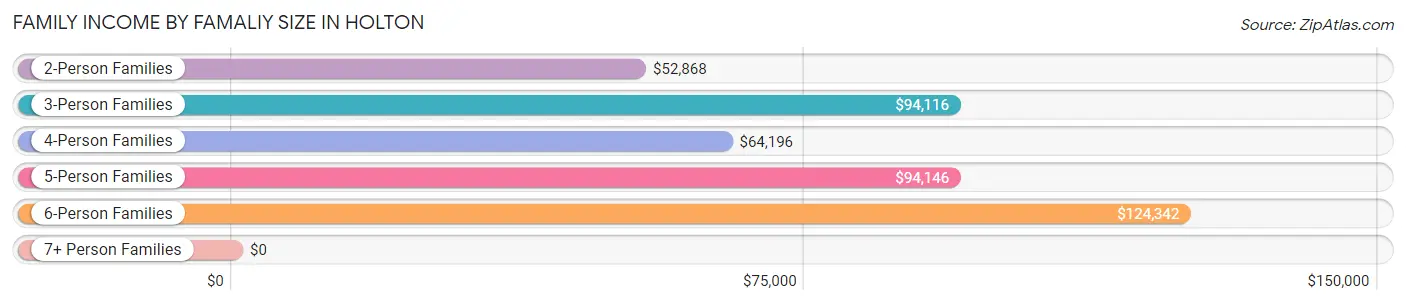
| Income Bracket | # Families | Median Income |
| 2-Person Families | 343 (49.1%) | $52,868 |
| 3-Person Families | 131 (18.8%) | $94,116 |
| 4-Person Families | 89 (12.8%) | $64,196 |
| 5-Person Families | 76 (10.9%) | $94,146 |
| 6-Person Families | 38 (5.4%) | $124,342 |
| 7+ Person Families | 21 (3.0%) | $0 |
| Total | 698 (100.0%) | $86,875 |
Family Income by Number of Earners in Holton
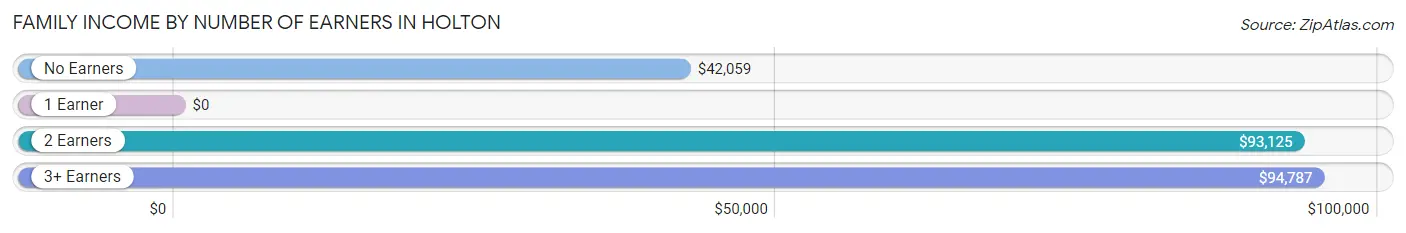
| Number of Earners | # Families | Median Income |
| No Earners | 102 (14.6%) | $42,059 |
| 1 Earner | 155 (22.2%) | $0 |
| 2 Earners | 294 (42.1%) | $93,125 |
| 3+ Earners | 147 (21.1%) | $94,787 |
| Total | 698 (100.0%) | $86,875 |
Household Income in Holton
Household Income Brackets in Holton
With 233 households falling in the category, the $50,000 to $74,999 income range is the most frequent in Holton, accounting for 17.0% of all households. In contrast, only 27 households (2.0%) fall into the $200,000+ income bracket, making it the least populous group.
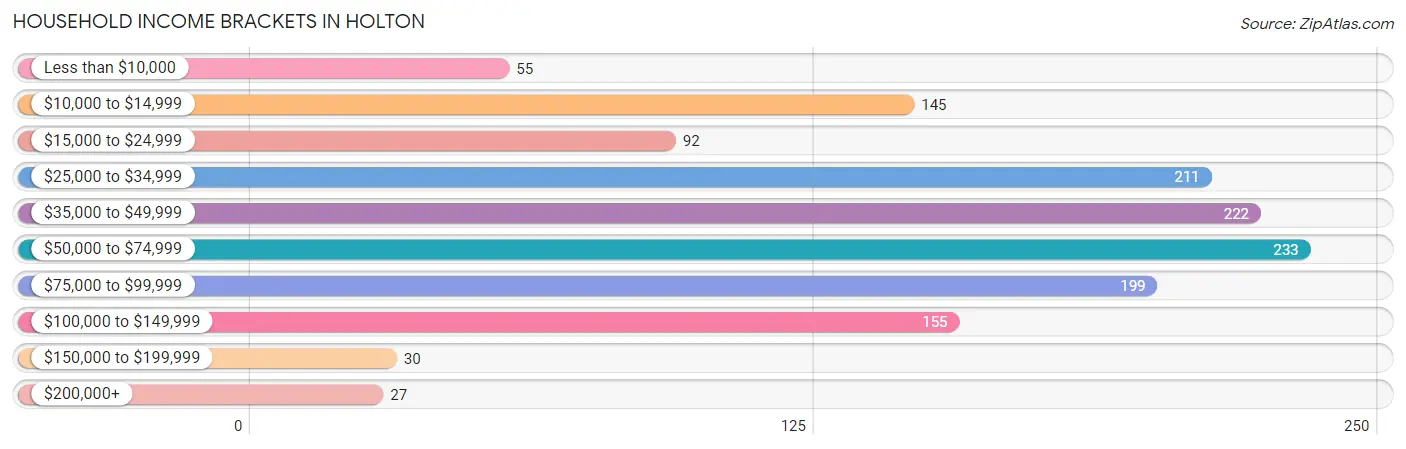
| Income Bracket | # Households | % Households |
| Less than $10,000 | 55 | 4.0% |
| $10,000 to $14,999 | 145 | 10.6% |
| $15,000 to $24,999 | 92 | 6.7% |
| $25,000 to $34,999 | 211 | 15.4% |
| $35,000 to $49,999 | 222 | 16.2% |
| $50,000 to $74,999 | 233 | 17.0% |
| $75,000 to $99,999 | 199 | 14.5% |
| $100,000 to $149,999 | 155 | 11.3% |
| $150,000 to $199,999 | 30 | 2.2% |
| $200,000+ | 27 | 2.0% |
Household Income by Householder Age in Holton
The median household income in Holton is $47,188, with the highest median household income of $70,250 found in the 45 to 64 years age bracket for the primary householder. A total of 464 households (33.9%) fall into this category. Meanwhile, the 15 to 24 years age bracket for the primary householder has the lowest median household income of $0, with 179 households (13.1%) in this group.
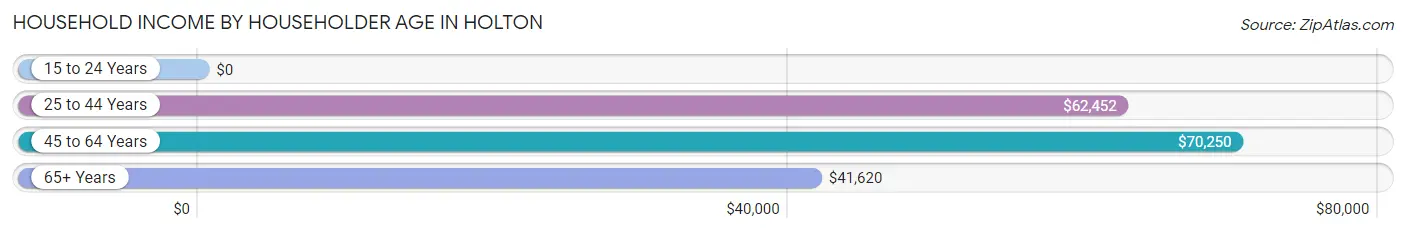
| Income Bracket | # Households | Median Income |
| 15 to 24 Years | 179 (13.1%) | $0 |
| 25 to 44 Years | 321 (23.4%) | $62,452 |
| 45 to 64 Years | 464 (33.9%) | $70,250 |
| 65+ Years | 405 (29.6%) | $41,620 |
| Total | 1,369 (100.0%) | $47,188 |
Poverty in Holton
Income Below Poverty by Sex and Age in Holton
With 5.4% poverty level for males and 15.2% for females among the residents of Holton, 55 to 64 year old males and 5 year old females are the most vulnerable to poverty, with 31 males (15.1%) and 8 females (61.5%) in their respective age groups living below the poverty level.
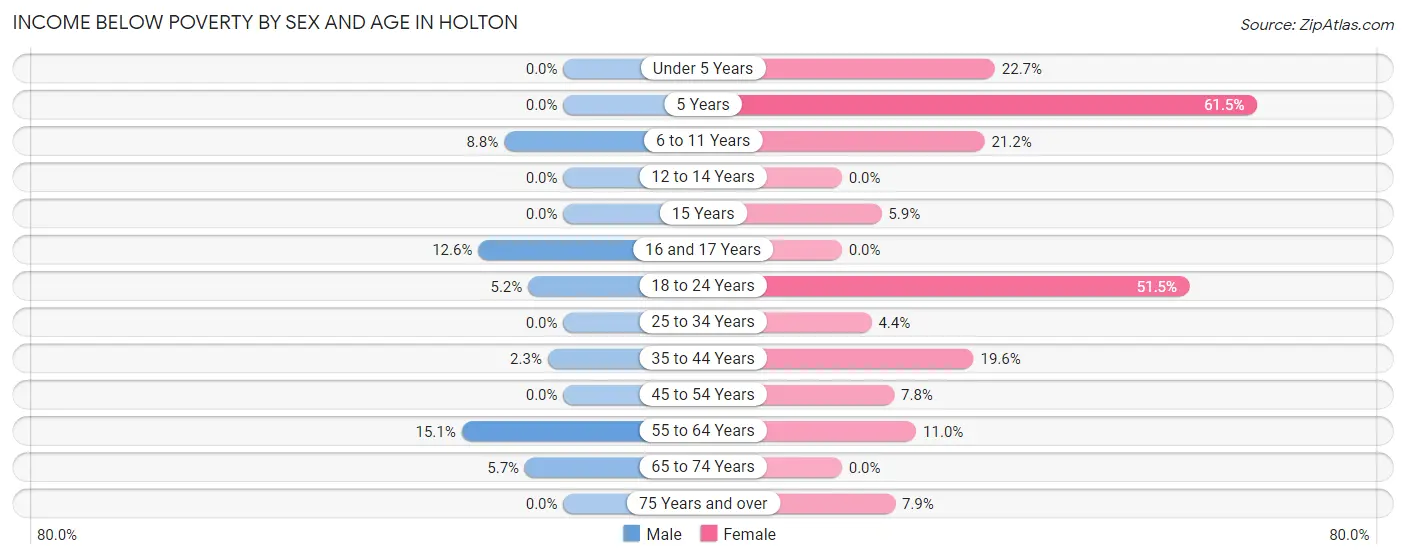
| Age Bracket | Male | Female |
| Under 5 Years | 0 (0.0%) | 15 (22.7%) |
| 5 Years | 0 (0.0%) | 8 (61.5%) |
| 6 to 11 Years | 11 (8.8%) | 32 (21.2%) |
| 12 to 14 Years | 0 (0.0%) | 0 (0.0%) |
| 15 Years | 0 (0.0%) | 3 (5.9%) |
| 16 and 17 Years | 11 (12.6%) | 0 (0.0%) |
| 18 to 24 Years | 15 (5.2%) | 101 (51.5%) |
| 25 to 34 Years | 0 (0.0%) | 8 (4.4%) |
| 35 to 44 Years | 6 (2.3%) | 44 (19.6%) |
| 45 to 54 Years | 0 (0.0%) | 16 (7.8%) |
| 55 to 64 Years | 31 (15.1%) | 18 (11.0%) |
| 65 to 74 Years | 9 (5.7%) | 0 (0.0%) |
| 75 Years and over | 0 (0.0%) | 9 (7.9%) |
| Total | 83 (5.4%) | 254 (15.2%) |
Income Above Poverty by Sex and Age in Holton
According to the poverty statistics in Holton, males aged under 5 years and females aged 12 to 14 years are the age groups that are most secure financially, with 100.0% of males and 100.0% of females in these age groups living above the poverty line.
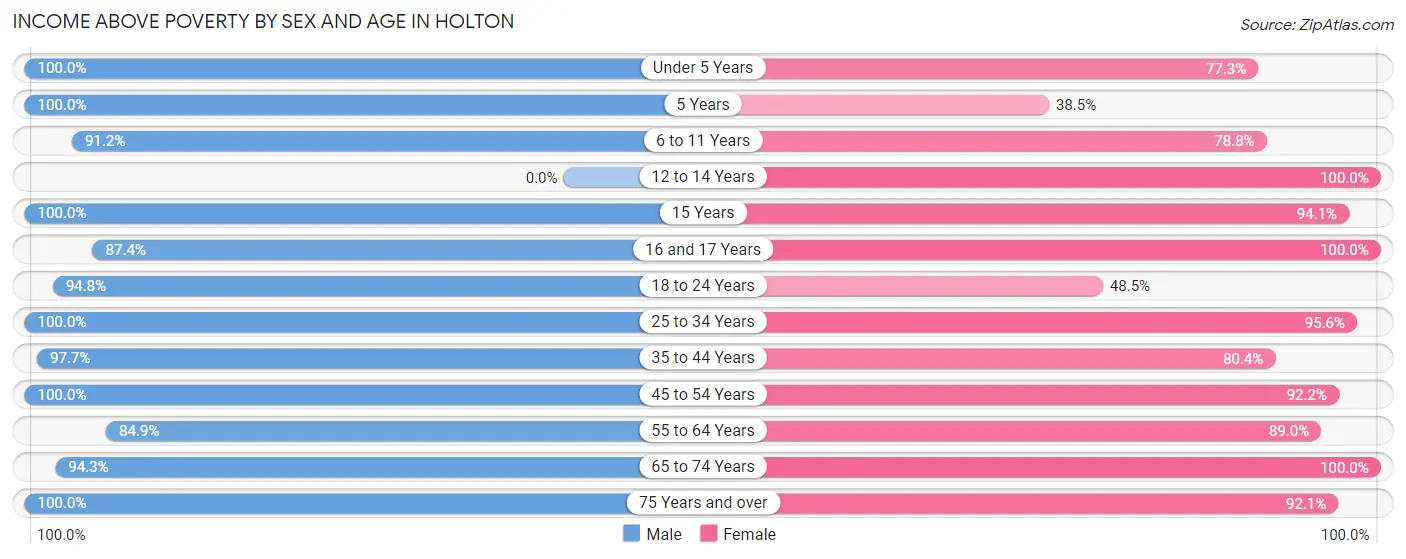
| Age Bracket | Male | Female |
| Under 5 Years | 99 (100.0%) | 51 (77.3%) |
| 5 Years | 21 (100.0%) | 5 (38.5%) |
| 6 to 11 Years | 114 (91.2%) | 119 (78.8%) |
| 12 to 14 Years | 0 (0.0%) | 84 (100.0%) |
| 15 Years | 12 (100.0%) | 48 (94.1%) |
| 16 and 17 Years | 76 (87.4%) | 27 (100.0%) |
| 18 to 24 Years | 272 (94.8%) | 95 (48.5%) |
| 25 to 34 Years | 84 (100.0%) | 174 (95.6%) |
| 35 to 44 Years | 253 (97.7%) | 181 (80.4%) |
| 45 to 54 Years | 129 (100.0%) | 190 (92.2%) |
| 55 to 64 Years | 174 (84.9%) | 145 (89.0%) |
| 65 to 74 Years | 149 (94.3%) | 190 (100.0%) |
| 75 Years and over | 77 (100.0%) | 105 (92.1%) |
| Total | 1,460 (94.6%) | 1,414 (84.8%) |
Income Below Poverty Among Married-Couple Families in Holton
The poverty statistics for married-couple families in Holton show that 1.4% or 8 of the total 558 families live below the poverty line. Families with no children have the highest poverty rate of 2.7%, comprising of 8 families. On the other hand, families with 1 or 2 children have the lowest poverty rate of 0.0%, which includes 0 families.
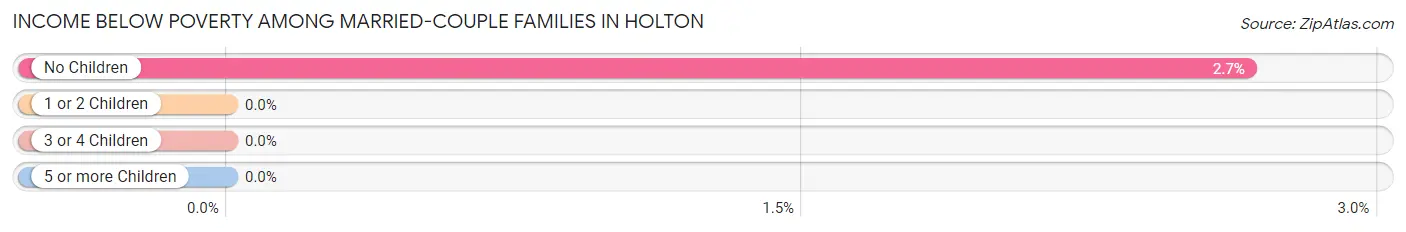
| Children | Above Poverty | Below Poverty |
| No Children | 293 (97.3%) | 8 (2.7%) |
| 1 or 2 Children | 179 (100.0%) | 0 (0.0%) |
| 3 or 4 Children | 78 (100.0%) | 0 (0.0%) |
| 5 or more Children | 0 (0.0%) | 0 (0.0%) |
| Total | 550 (98.6%) | 8 (1.4%) |
Income Below Poverty Among Single-Parent Households in Holton
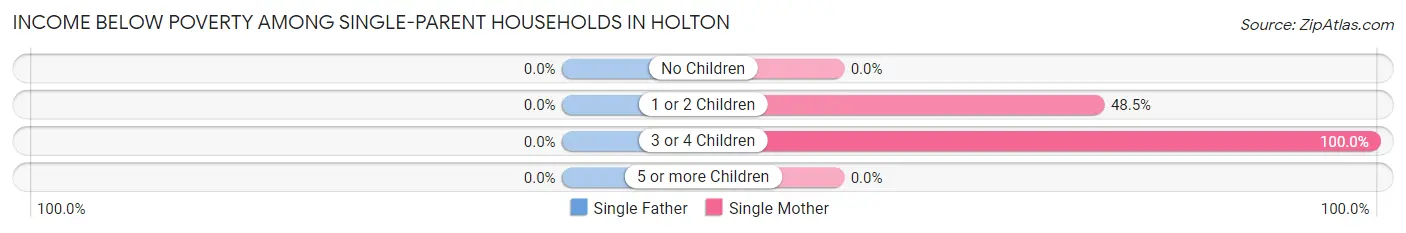
| Children | Single Father | Single Mother |
| No Children | 0 (0.0%) | 0 (0.0%) |
| 1 or 2 Children | 0 (0.0%) | 32 (48.5%) |
| 3 or 4 Children | 0 (0.0%) | 13 (100.0%) |
| 5 or more Children | 0 (0.0%) | 0 (0.0%) |
| Total | 0 (0.0%) | 45 (35.7%) |
Income Below Poverty Among Married-Couple vs Single-Parent Households in Holton
The poverty data for Holton shows that 8 of the married-couple family households (1.4%) and 45 of the single-parent households (32.1%) are living below the poverty level. Within the married-couple family households, those with no children have the highest poverty rate, with 8 households (2.7%) falling below the poverty line. Among the single-parent households, those with 3 or 4 children have the highest poverty rate, with 13 household (100.0%) living below poverty.
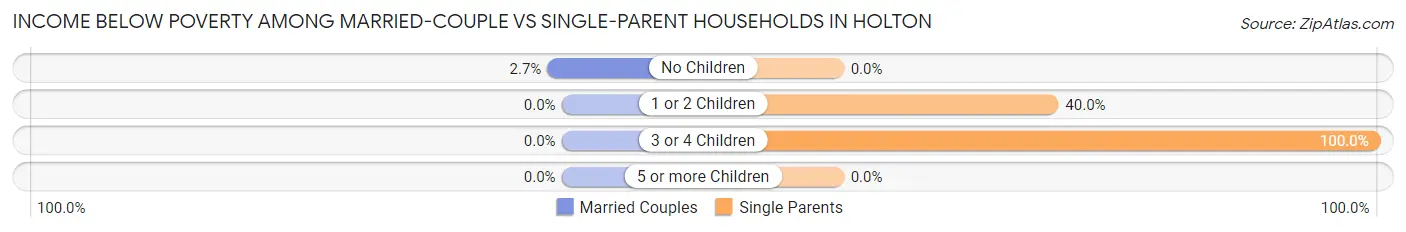
| Children | Married-Couple Families | Single-Parent Households |
| No Children | 8 (2.7%) | 0 (0.0%) |
| 1 or 2 Children | 0 (0.0%) | 32 (40.0%) |
| 3 or 4 Children | 0 (0.0%) | 13 (100.0%) |
| 5 or more Children | 0 (0.0%) | 0 (0.0%) |
| Total | 8 (1.4%) | 45 (32.1%) |
Race in Holton
The most populous races in Holton are White / Caucasian (2,856 | 84.4%), Hispanic or Latino (446 | 13.2%), and Two or more Races (188 | 5.6%).
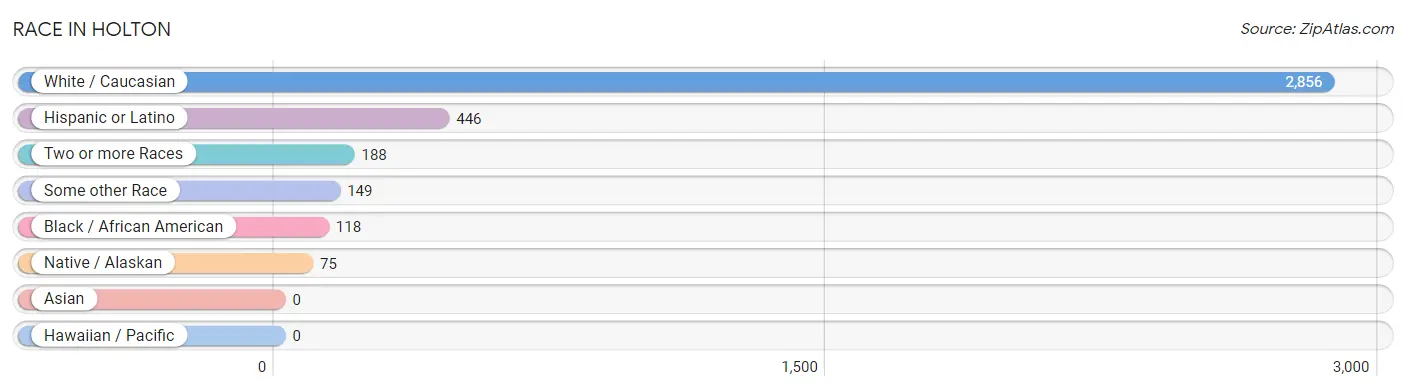
| Race | # Population | % Population |
| Asian | 0 | 0.0% |
| Black / African American | 118 | 3.5% |
| Hawaiian / Pacific | 0 | 0.0% |
| Hispanic or Latino | 446 | 13.2% |
| Native / Alaskan | 75 | 2.2% |
| White / Caucasian | 2,856 | 84.4% |
| Two or more Races | 188 | 5.6% |
| Some other Race | 149 | 4.4% |
| Total | 3,386 | 100.0% |
Ancestry in Holton
The most populous ancestries reported in Holton are German (1,113 | 32.9%), English (506 | 14.9%), Irish (425 | 12.6%), Central American (282 | 8.3%), and Guatemalan (282 | 8.3%), together accounting for 77.0% of all Holton residents.
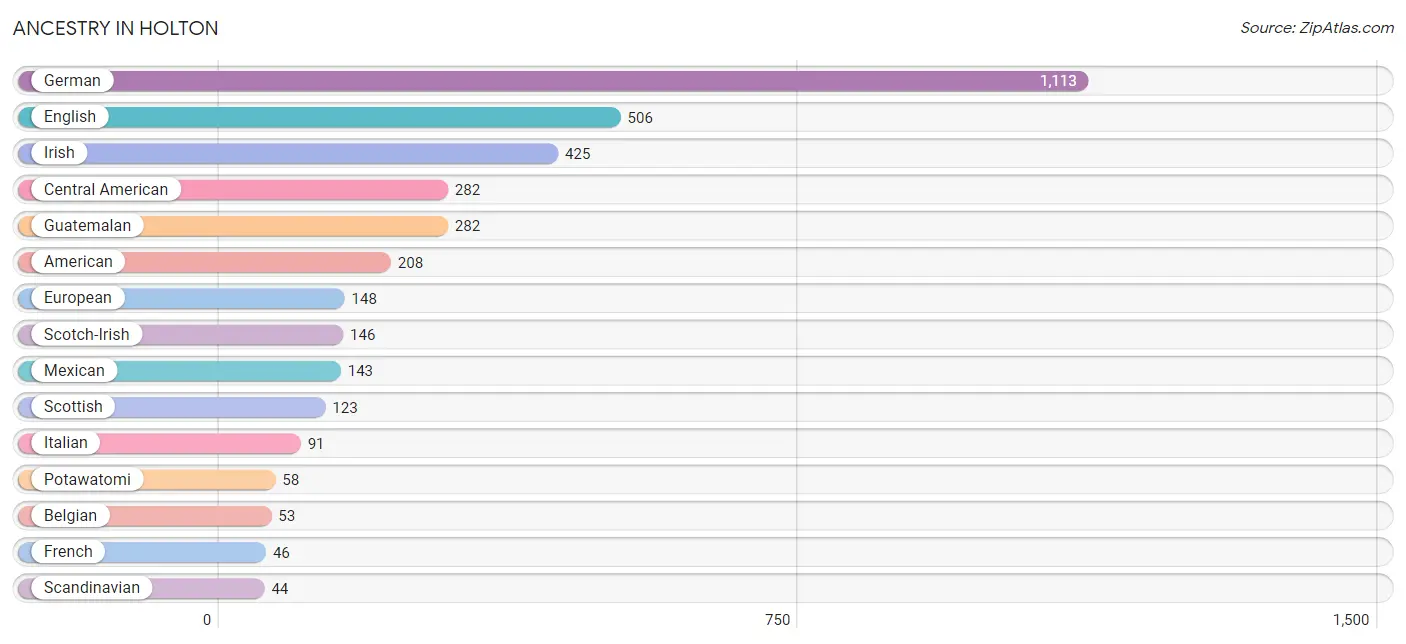
| Ancestry | # Population | % Population |
| African | 3 | 0.1% |
| American | 208 | 6.1% |
| Belgian | 53 | 1.6% |
| Blackfeet | 10 | 0.3% |
| Central American | 282 | 8.3% |
| Cherokee | 13 | 0.4% |
| Chickasaw | 3 | 0.1% |
| Choctaw | 3 | 0.1% |
| Crow | 17 | 0.5% |
| Cuban | 4 | 0.1% |
| Czech | 35 | 1.0% |
| Dutch | 28 | 0.8% |
| English | 506 | 14.9% |
| European | 148 | 4.4% |
| French | 46 | 1.4% |
| French Canadian | 12 | 0.4% |
| German | 1,113 | 32.9% |
| Guatemalan | 282 | 8.3% |
| Irish | 425 | 12.6% |
| Italian | 91 | 2.7% |
| Jamaican | 37 | 1.1% |
| Mexican | 143 | 4.2% |
| Polish | 16 | 0.5% |
| Potawatomi | 58 | 1.7% |
| Russian | 10 | 0.3% |
| Scandinavian | 44 | 1.3% |
| Scotch-Irish | 146 | 4.3% |
| Scottish | 123 | 3.6% |
| Sioux | 10 | 0.3% |
| Subsaharan African | 3 | 0.1% |
| Swedish | 35 | 1.0% |
| Swiss | 26 | 0.8% |
| Welsh | 15 | 0.4% | View All 33 Rows |
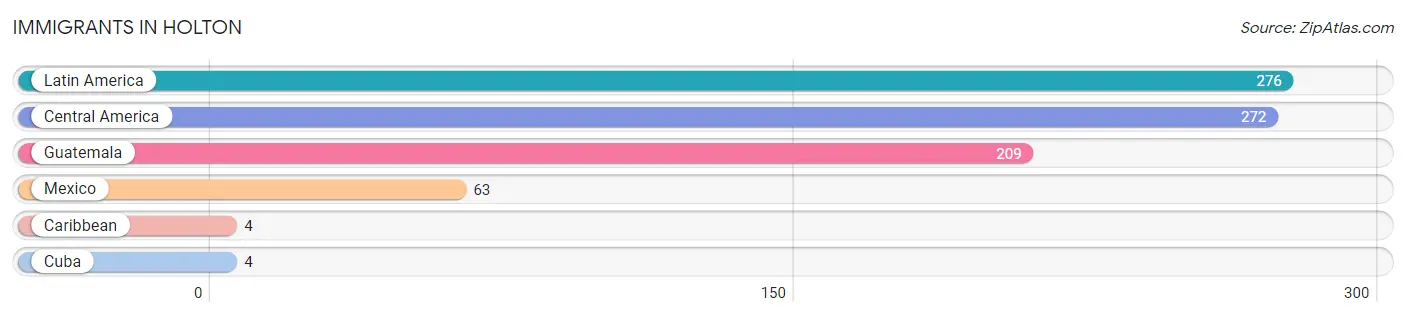
Immigrants in Holton
The most numerous immigrant groups reported in Holton came from Latin America (276 | 8.2%), Central America (272 | 8.0%), Guatemala (209 | 6.2%), Mexico (63 | 1.9%), and Caribbean (4 | 0.1%), together accounting for 24.3% of all Holton residents.
| Immigration Origin | # Population | % Population |
| Caribbean | 4 | 0.1% |
| Central America | 272 | 8.0% |
| Cuba | 4 | 0.1% |
| Guatemala | 209 | 6.2% |
| Latin America | 276 | 8.2% |
| Mexico | 63 | 1.9% | View All 6 Rows |
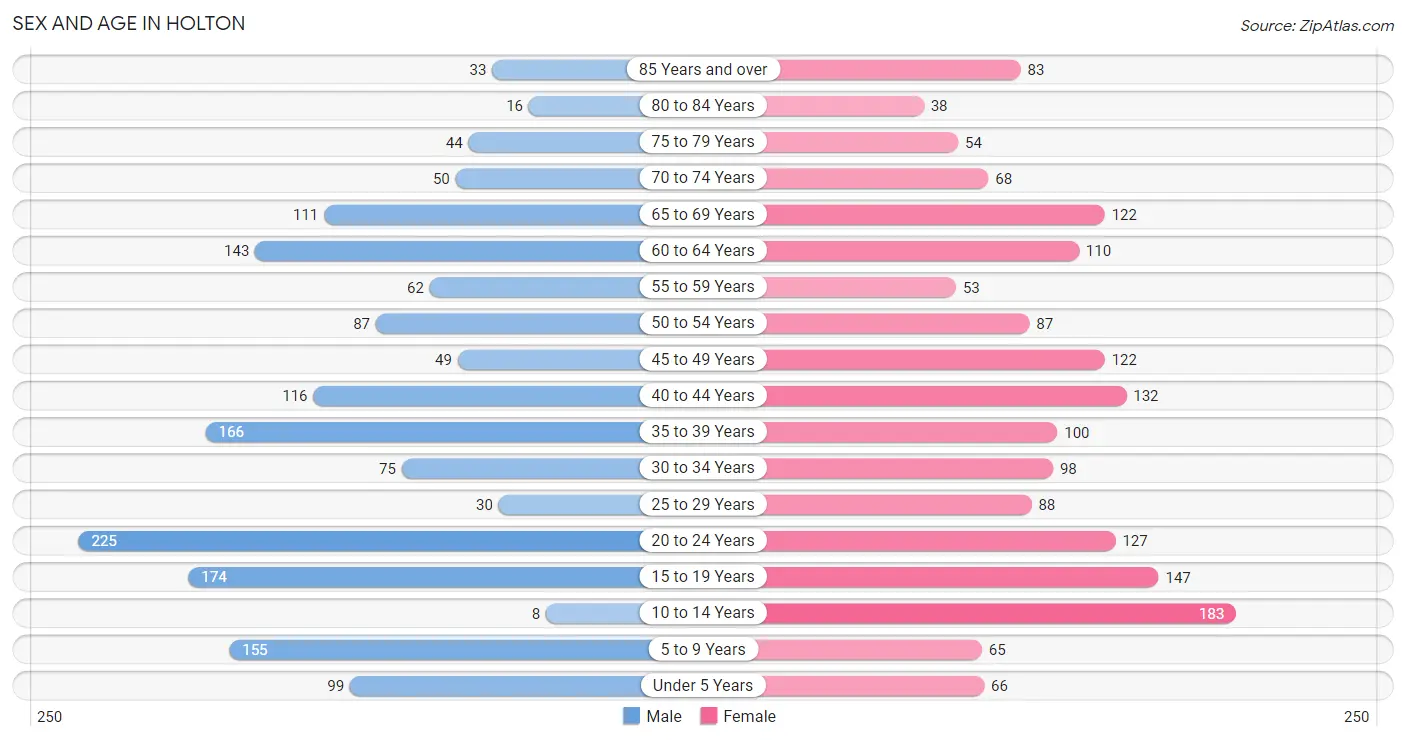
Sex and Age in Holton
Sex and Age in Holton
The most populous age groups in Holton are 20 to 24 Years (225 | 13.7%) for men and 10 to 14 Years (183 | 10.5%) for women.
| Age Bracket | Male | Female |
| Under 5 Years | 99 (6.0%) | 66 (3.8%) |
| 5 to 9 Years | 155 (9.4%) | 65 (3.7%) |
| 10 to 14 Years | 8 (0.5%) | 183 (10.5%) |
| 15 to 19 Years | 174 (10.6%) | 147 (8.4%) |
| 20 to 24 Years | 225 (13.7%) | 127 (7.3%) |
| 25 to 29 Years | 30 (1.8%) | 88 (5.1%) |
| 30 to 34 Years | 75 (4.6%) | 98 (5.6%) |
| 35 to 39 Years | 166 (10.1%) | 100 (5.7%) |
| 40 to 44 Years | 116 (7.1%) | 132 (7.6%) |
| 45 to 49 Years | 49 (3.0%) | 122 (7.0%) |
| 50 to 54 Years | 87 (5.3%) | 87 (5.0%) |
| 55 to 59 Years | 62 (3.8%) | 53 (3.0%) |
| 60 to 64 Years | 143 (8.7%) | 110 (6.3%) |
| 65 to 69 Years | 111 (6.8%) | 122 (7.0%) |
| 70 to 74 Years | 50 (3.0%) | 68 (3.9%) |
| 75 to 79 Years | 44 (2.7%) | 54 (3.1%) |
| 80 to 84 Years | 16 (1.0%) | 38 (2.2%) |
| 85 Years and over | 33 (2.0%) | 83 (4.8%) |
| Total | 1,643 (100.0%) | 1,743 (100.0%) |
Families and Households in Holton
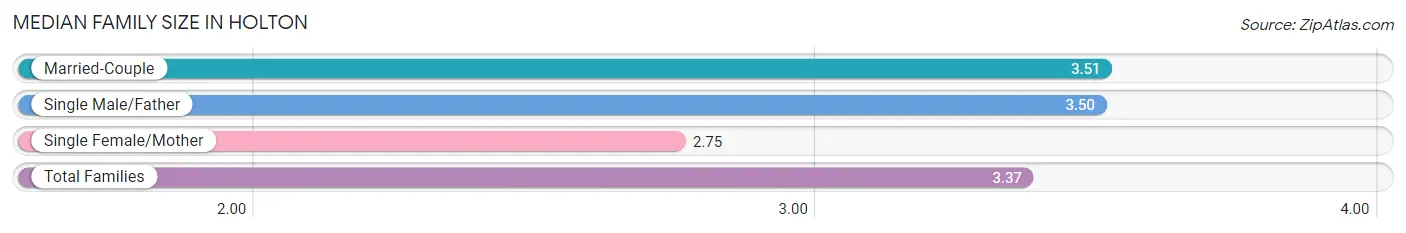
Median Family Size in Holton
The median family size in Holton is 3.37 persons per family, with married-couple families (558 | 79.9%) accounting for the largest median family size of 3.51 persons per family. On the other hand, single female/mother families (126 | 18.0%) represent the smallest median family size with 2.75 persons per family.
| Family Type | # Families | Family Size |
| Married-Couple | 558 (79.9%) | 3.51 |
| Single Male/Father | 14 (2.0%) | 3.50 |
| Single Female/Mother | 126 (18.0%) | 2.75 |
| Total Families | 698 (100.0%) | 3.37 |
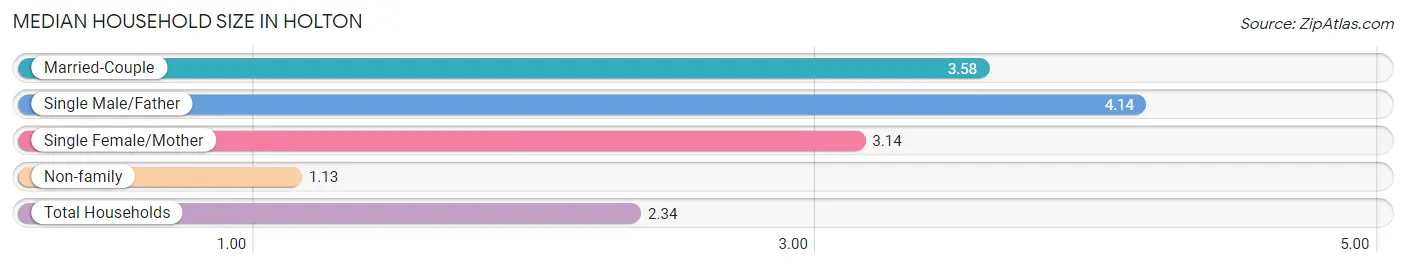
Median Household Size in Holton
The median household size in Holton is 2.34 persons per household, with single male/father households (14 | 1.0%) accounting for the largest median household size of 4.14 persons per household. non-family households (671 | 49.0%) represent the smallest median household size with 1.13 persons per household.
| Household Type | # Households | Household Size |
| Married-Couple | 558 (40.8%) | 3.58 |
| Single Male/Father | 14 (1.0%) | 4.14 |
| Single Female/Mother | 126 (9.2%) | 3.14 |
| Non-family | 671 (49.0%) | 1.13 |
| Total Households | 1,369 (100.0%) | 2.34 |
Household Size by Marriage Status in Holton
Out of a total of 1,369 households in Holton, 698 (51.0%) are family households, while 671 (49.0%) are nonfamily households. The most numerous type of family households are 2-person households, comprising 313, and the most common type of nonfamily households are 1-person households, comprising 570.
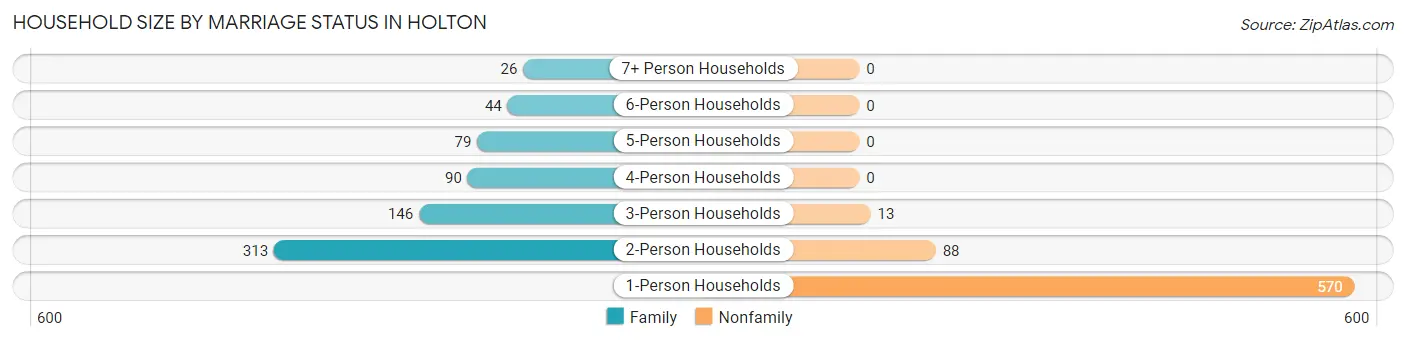
| Household Size | Family Households | Nonfamily Households |
| 1-Person Households | - | 570 (41.6%) |
| 2-Person Households | 313 (22.9%) | 88 (6.4%) |
| 3-Person Households | 146 (10.7%) | 13 (0.9%) |
| 4-Person Households | 90 (6.6%) | 0 (0.0%) |
| 5-Person Households | 79 (5.8%) | 0 (0.0%) |
| 6-Person Households | 44 (3.2%) | 0 (0.0%) |
| 7+ Person Households | 26 (1.9%) | 0 (0.0%) |
| Total | 698 (51.0%) | 671 (49.0%) |
Female Fertility in Holton
Fertility by Age in Holton
Average fertility rate in Holton is 18.0 births per 1,000 women. Women in the age bracket of 20 to 34 years have the highest fertility rate with 48.0 births per 1,000 women. Women in the age bracket of 20 to 34 years acount for 100.0% of all women with births.
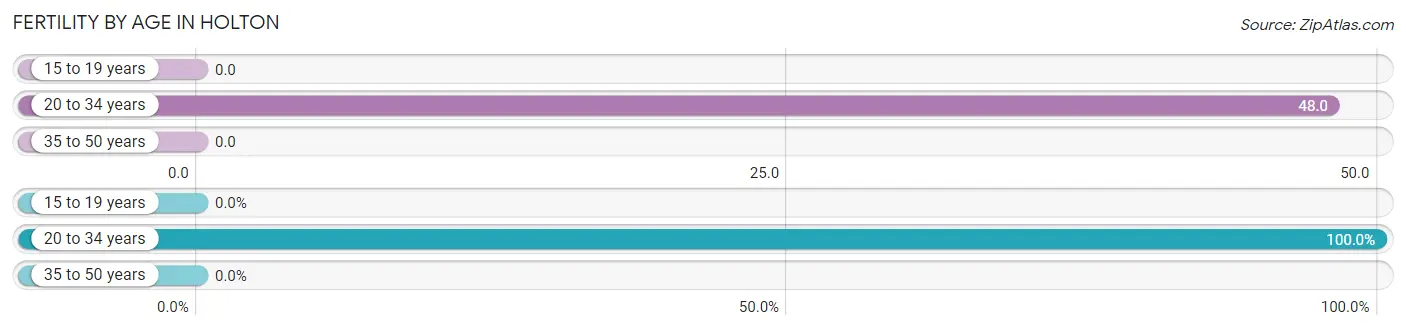
| Age Bracket | Women with Births | Births / 1,000 Women |
| 15 to 19 years | 0 (0.0%) | 0.0 |
| 20 to 34 years | 15 (100.0%) | 48.0 |
| 35 to 50 years | 0 (0.0%) | 0.0 |
| Total | 15 (100.0%) | 18.0 |
Fertility by Age by Marriage Status in Holton
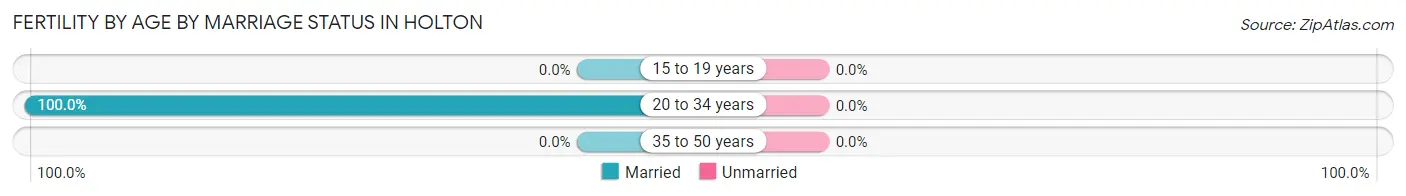
| Age Bracket | Married | Unmarried |
| 15 to 19 years | 0 (0.0%) | 0 (0.0%) |
| 20 to 34 years | 15 (100.0%) | 0 (0.0%) |
| 35 to 50 years | 0 (0.0%) | 0 (0.0%) |
| Total | 15 (100.0%) | 0 (0.0%) |
Fertility by Education in Holton
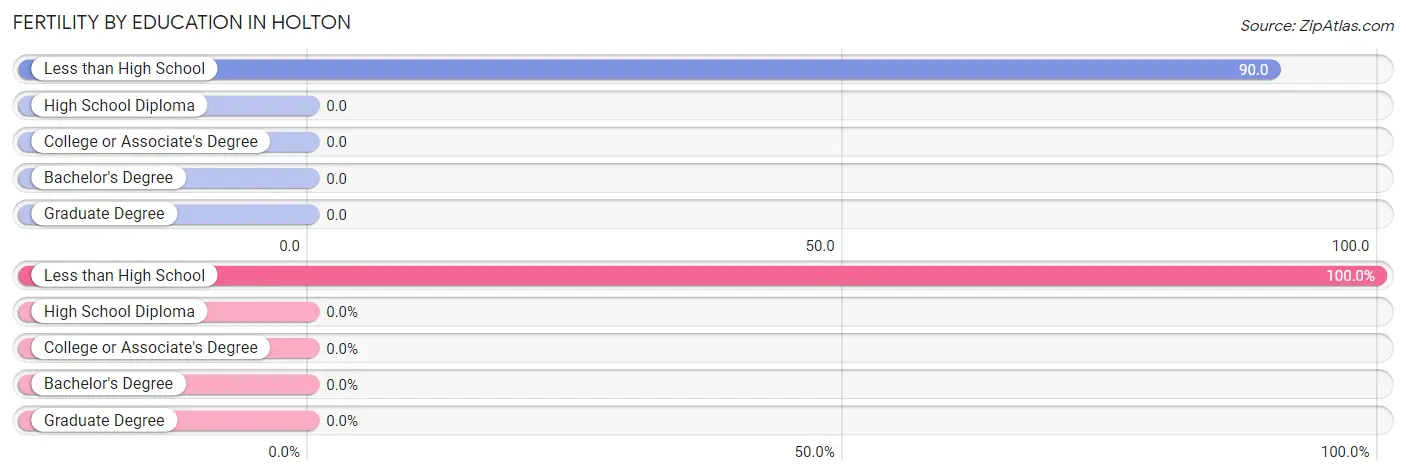
| Educational Attainment | Women with Births | Births / 1,000 Women |
| Less than High School | 15 (100.0%) | 90.0 |
| High School Diploma | 0 (0.0%) | 0.0 |
| College or Associate's Degree | 0 (0.0%) | 0.0 |
| Bachelor's Degree | 0 (0.0%) | 0.0 |
| Graduate Degree | 0 (0.0%) | 0.0 |
| Total | 15 (100.0%) | 18.0 |
Fertility by Education by Marriage Status in Holton
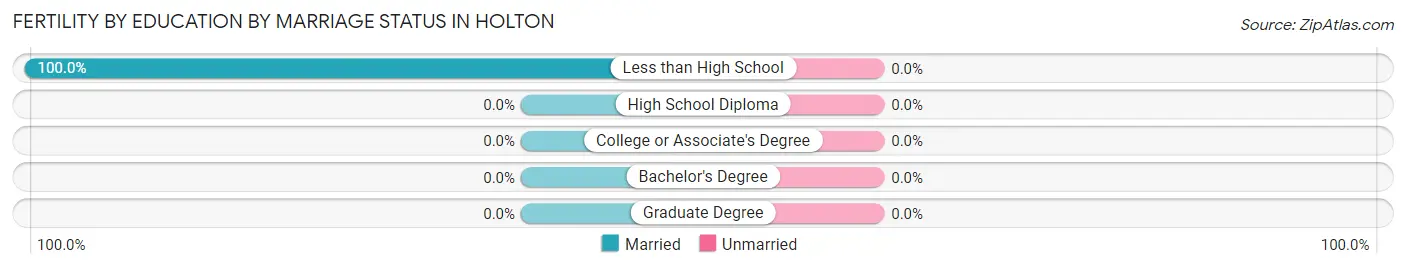
| Educational Attainment | Married | Unmarried |
| Less than High School | 15 (100.0%) | 0 (0.0%) |
| High School Diploma | 0 (0.0%) | 0 (0.0%) |
| College or Associate's Degree | 0 (0.0%) | 0 (0.0%) |
| Bachelor's Degree | 0 (0.0%) | 0 (0.0%) |
| Graduate Degree | 0 (0.0%) | 0 (0.0%) |
| Total | 15 (100.0%) | 0 (0.0%) |
Employment Characteristics in Holton
Employment by Class of Employer in Holton
Among the 1,685 employed individuals in Holton, private company employees (957 | 56.8%), local government employees (274 | 16.3%), and self-employed (not incorporated) (144 | 8.6%) make up the most common classes of employment.
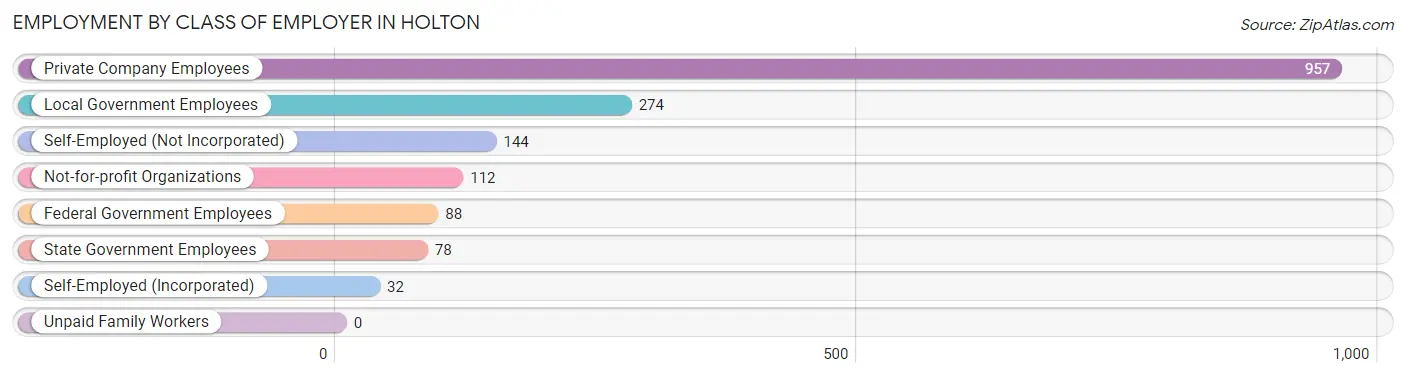
| Employer Class | # Employees | % Employees |
| Private Company Employees | 957 | 56.8% |
| Self-Employed (Incorporated) | 32 | 1.9% |
| Self-Employed (Not Incorporated) | 144 | 8.6% |
| Not-for-profit Organizations | 112 | 6.7% |
| Local Government Employees | 274 | 16.3% |
| State Government Employees | 78 | 4.6% |
| Federal Government Employees | 88 | 5.2% |
| Unpaid Family Workers | 0 | 0.0% |
| Total | 1,685 | 100.0% |
Employment Status by Age in Holton
According to the labor force statistics for Holton, out of the total population over 16 years of age (2,747), 63.7% or 1,750 individuals are in the labor force, with 2.8% or 49 of them unemployed. The age group with the highest labor force participation rate is 45 to 54 years, with 97.1% or 335 individuals in the labor force. Within the labor force, the 55 to 59 years age range has the highest percentage of unemployed individuals, with 9.0% or 8 of them being unemployed.
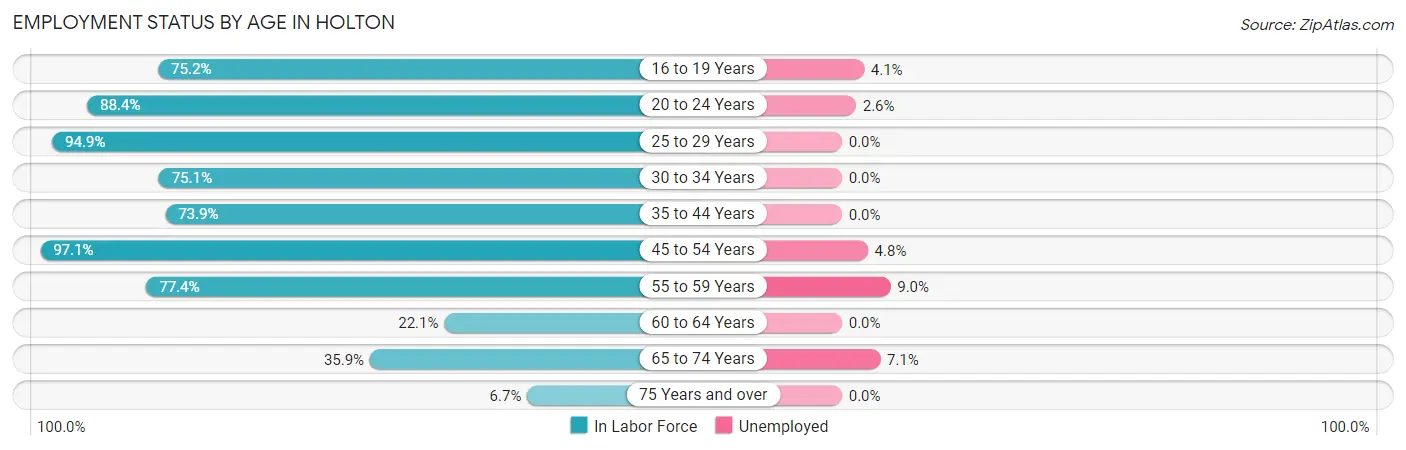
| Age Bracket | In Labor Force | Unemployed |
| 16 to 19 Years | 194 (75.2%) | 8 (4.1%) |
| 20 to 24 Years | 311 (88.4%) | 8 (2.6%) |
| 25 to 29 Years | 112 (94.9%) | 0 (0.0%) |
| 30 to 34 Years | 130 (75.1%) | 0 (0.0%) |
| 35 to 44 Years | 380 (73.9%) | 0 (0.0%) |
| 45 to 54 Years | 335 (97.1%) | 16 (4.8%) |
| 55 to 59 Years | 89 (77.4%) | 8 (9.0%) |
| 60 to 64 Years | 56 (22.1%) | 0 (0.0%) |
| 65 to 74 Years | 126 (35.9%) | 9 (7.1%) |
| 75 Years and over | 18 (6.7%) | 0 (0.0%) |
| Total | 1,750 (63.7%) | 49 (2.8%) |
Employment Status by Educational Attainment in Holton
According to labor force statistics for Holton, 72.6% of individuals (1,102) out of the total population between 25 and 64 years of age (1,518) are in the labor force, with 2.2% or 24 of them being unemployed. The group with the highest labor force participation rate are those with the educational attainment of bachelor's degree or higher, with 91.5% or 247 individuals in the labor force. Within the labor force, individuals with college / associate degree education have the highest percentage of unemployment, with 3.8% or 16 of them being unemployed.
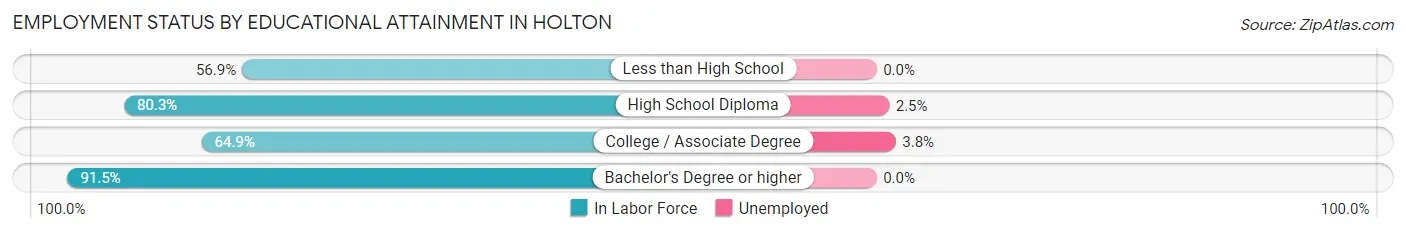
| Educational Attainment | In Labor Force | Unemployed |
| Less than High School | 112 (56.9%) | 0 (0.0%) |
| High School Diploma | 318 (80.3%) | 10 (2.5%) |
| College / Associate Degree | 425 (64.9%) | 25 (3.8%) |
| Bachelor's Degree or higher | 247 (91.5%) | 0 (0.0%) |
| Total | 1,102 (72.6%) | 33 (2.2%) |
Employment Occupations by Sex in Holton
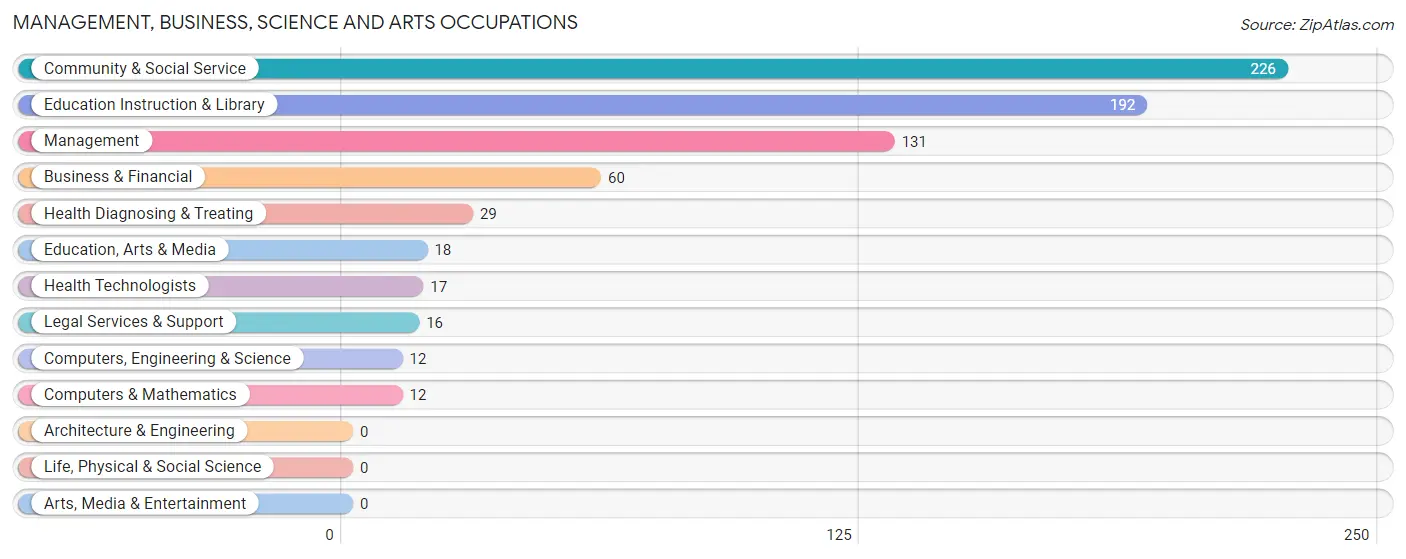
Management, Business, Science and Arts Occupations
The most common Management, Business, Science and Arts occupations in Holton are Community & Social Service (226 | 13.3%), Education Instruction & Library (192 | 11.3%), Management (131 | 7.7%), Business & Financial (60 | 3.5%), and Health Diagnosing & Treating (29 | 1.7%).
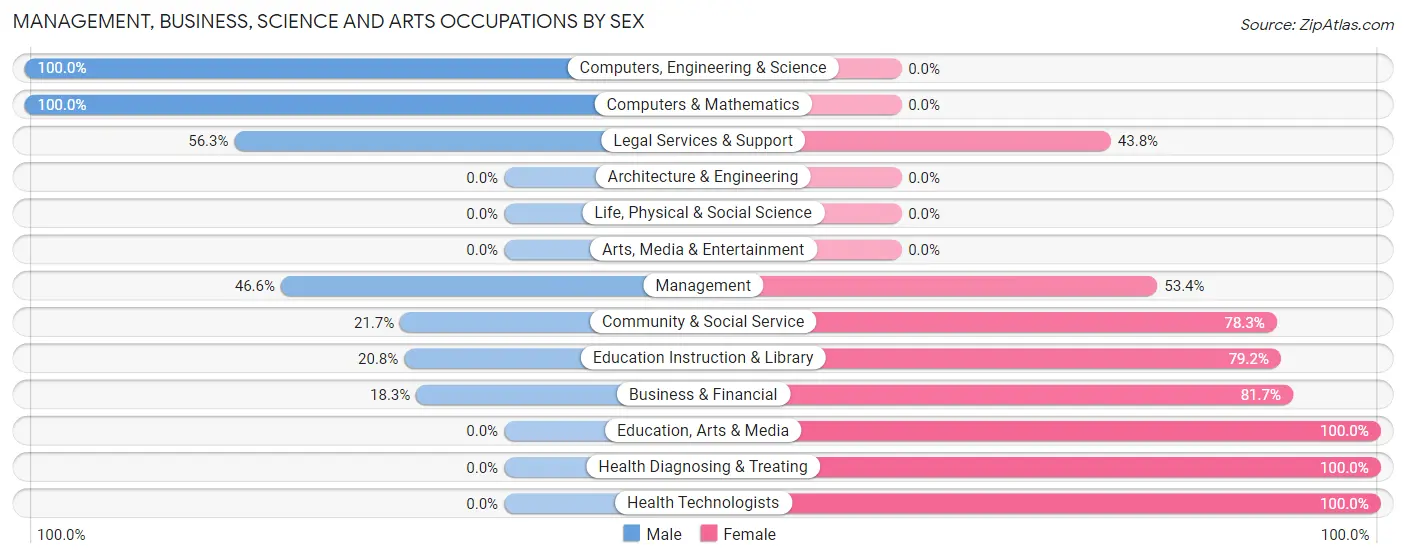
Management, Business, Science and Arts Occupations by Sex
Within the Management, Business, Science and Arts occupations in Holton, the most male-oriented occupations are Computers, Engineering & Science (100.0%), Computers & Mathematics (100.0%), and Legal Services & Support (56.2%), while the most female-oriented occupations are Education, Arts & Media (100.0%), Health Diagnosing & Treating (100.0%), and Health Technologists (100.0%).
| Occupation | Male | Female |
| Management | 61 (46.6%) | 70 (53.4%) |
| Business & Financial | 11 (18.3%) | 49 (81.7%) |
| Computers, Engineering & Science | 12 (100.0%) | 0 (0.0%) |
| Computers & Mathematics | 12 (100.0%) | 0 (0.0%) |
| Architecture & Engineering | 0 (0.0%) | 0 (0.0%) |
| Life, Physical & Social Science | 0 (0.0%) | 0 (0.0%) |
| Community & Social Service | 49 (21.7%) | 177 (78.3%) |
| Education, Arts & Media | 0 (0.0%) | 18 (100.0%) |
| Legal Services & Support | 9 (56.2%) | 7 (43.8%) |
| Education Instruction & Library | 40 (20.8%) | 152 (79.2%) |
| Arts, Media & Entertainment | 0 (0.0%) | 0 (0.0%) |
| Health Diagnosing & Treating | 0 (0.0%) | 29 (100.0%) |
| Health Technologists | 0 (0.0%) | 17 (100.0%) |
| Total (Category) | 133 (29.0%) | 325 (71.0%) |
| Total (Overall) | 825 (48.5%) | 877 (51.5%) |
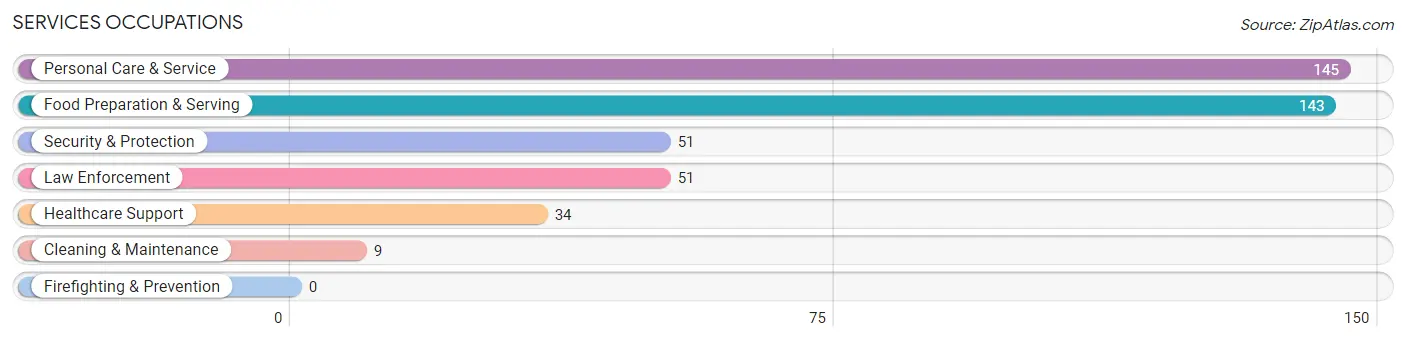
Services Occupations
The most common Services occupations in Holton are Personal Care & Service (145 | 8.5%), Food Preparation & Serving (143 | 8.4%), Security & Protection (51 | 3.0%), Law Enforcement (51 | 3.0%), and Healthcare Support (34 | 2.0%).
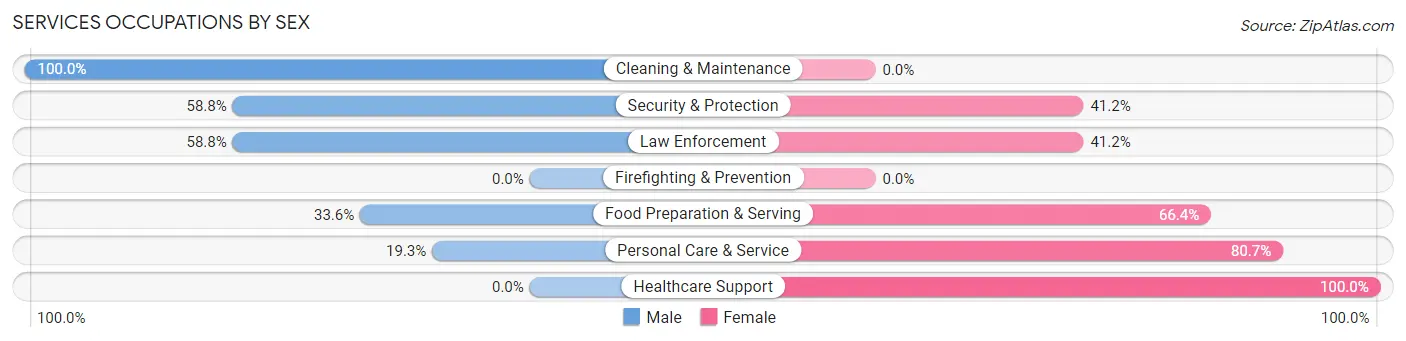
Services Occupations by Sex
Within the Services occupations in Holton, the most male-oriented occupations are Cleaning & Maintenance (100.0%), Security & Protection (58.8%), and Law Enforcement (58.8%), while the most female-oriented occupations are Healthcare Support (100.0%), Personal Care & Service (80.7%), and Food Preparation & Serving (66.4%).
| Occupation | Male | Female |
| Healthcare Support | 0 (0.0%) | 34 (100.0%) |
| Security & Protection | 30 (58.8%) | 21 (41.2%) |
| Firefighting & Prevention | 0 (0.0%) | 0 (0.0%) |
| Law Enforcement | 30 (58.8%) | 21 (41.2%) |
| Food Preparation & Serving | 48 (33.6%) | 95 (66.4%) |
| Cleaning & Maintenance | 9 (100.0%) | 0 (0.0%) |
| Personal Care & Service | 28 (19.3%) | 117 (80.7%) |
| Total (Category) | 115 (30.1%) | 267 (69.9%) |
| Total (Overall) | 825 (48.5%) | 877 (51.5%) |
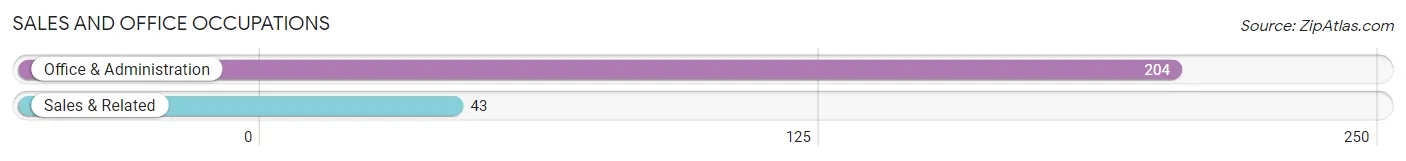
Sales and Office Occupations
The most common Sales and Office occupations in Holton are Office & Administration (204 | 12.0%), and Sales & Related (43 | 2.5%).
Sales and Office Occupations by Sex
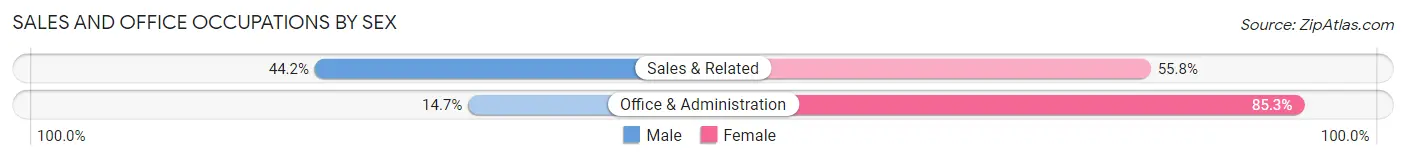
| Occupation | Male | Female |
| Sales & Related | 19 (44.2%) | 24 (55.8%) |
| Office & Administration | 30 (14.7%) | 174 (85.3%) |
| Total (Category) | 49 (19.8%) | 198 (80.2%) |
| Total (Overall) | 825 (48.5%) | 877 (51.5%) |
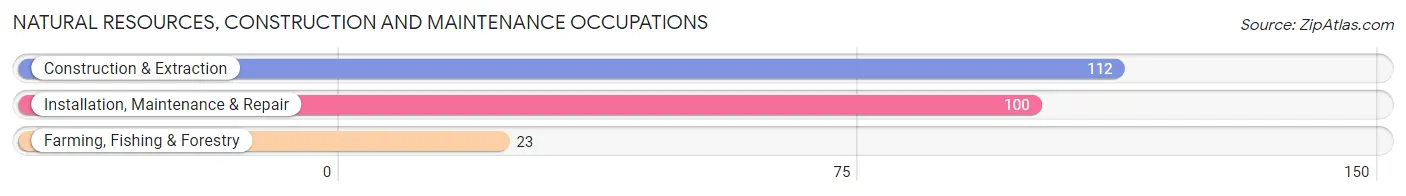
Natural Resources, Construction and Maintenance Occupations
The most common Natural Resources, Construction and Maintenance occupations in Holton are Construction & Extraction (112 | 6.6%), Installation, Maintenance & Repair (100 | 5.9%), and Farming, Fishing & Forestry (23 | 1.3%).
Natural Resources, Construction and Maintenance Occupations by Sex
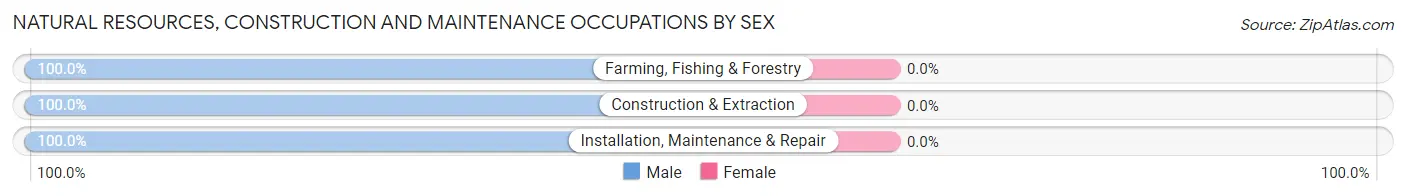
| Occupation | Male | Female |
| Farming, Fishing & Forestry | 23 (100.0%) | 0 (0.0%) |
| Construction & Extraction | 112 (100.0%) | 0 (0.0%) |
| Installation, Maintenance & Repair | 100 (100.0%) | 0 (0.0%) |
| Total (Category) | 235 (100.0%) | 0 (0.0%) |
| Total (Overall) | 825 (48.5%) | 877 (51.5%) |
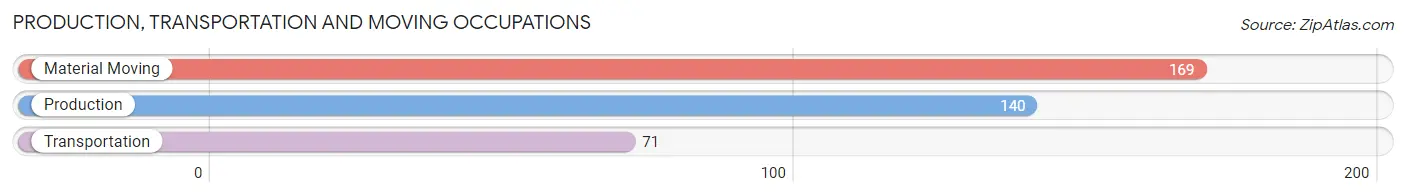
Production, Transportation and Moving Occupations
The most common Production, Transportation and Moving occupations in Holton are Material Moving (169 | 9.9%), Production (140 | 8.2%), and Transportation (71 | 4.2%).
Production, Transportation and Moving Occupations by Sex
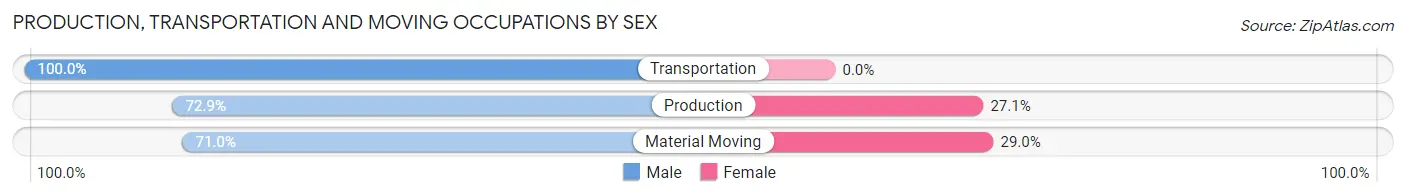
| Occupation | Male | Female |
| Production | 102 (72.9%) | 38 (27.1%) |
| Transportation | 71 (100.0%) | 0 (0.0%) |
| Material Moving | 120 (71.0%) | 49 (29.0%) |
| Total (Category) | 293 (77.1%) | 87 (22.9%) |
| Total (Overall) | 825 (48.5%) | 877 (51.5%) |
Employment Industries by Sex in Holton
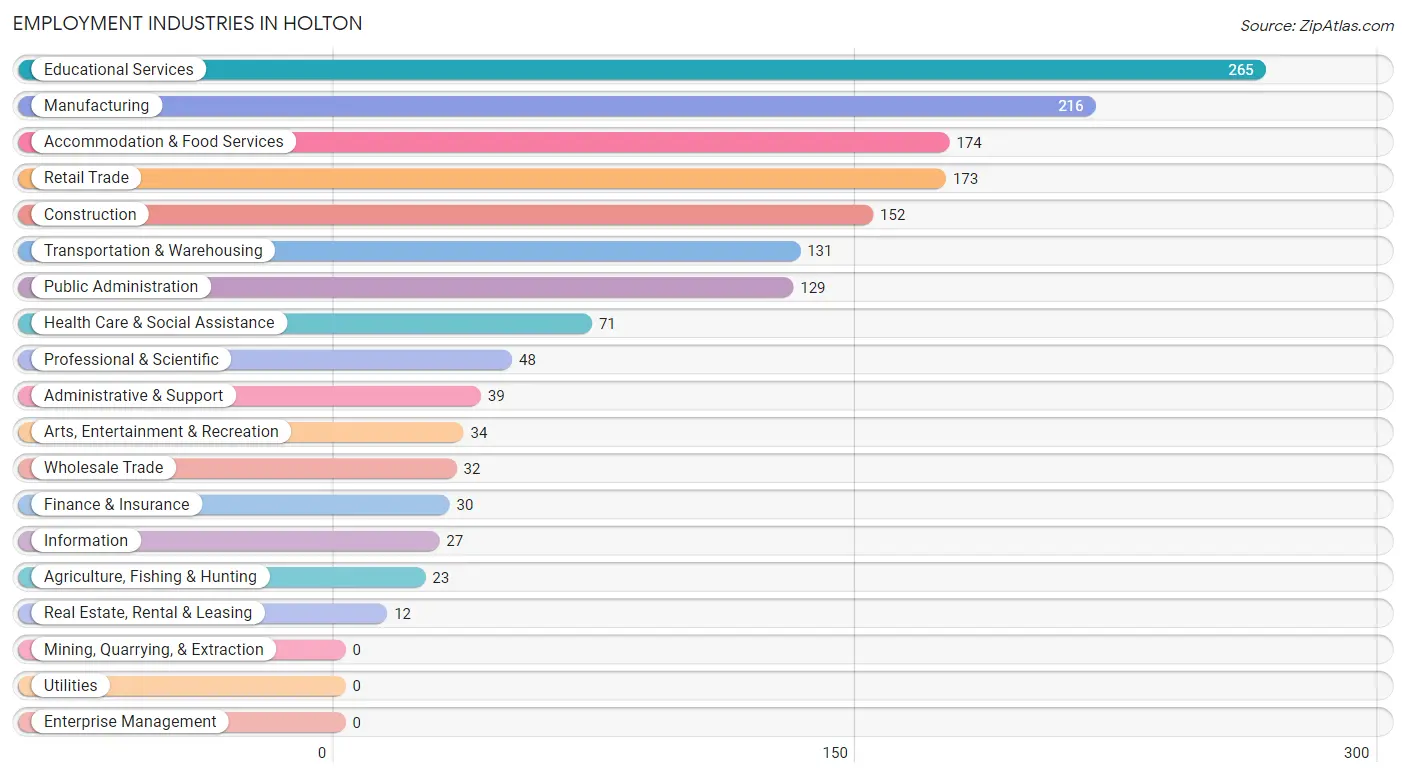
Employment Industries in Holton
The major employment industries in Holton include Educational Services (265 | 15.6%), Manufacturing (216 | 12.7%), Accommodation & Food Services (174 | 10.2%), Retail Trade (173 | 10.2%), and Construction (152 | 8.9%).
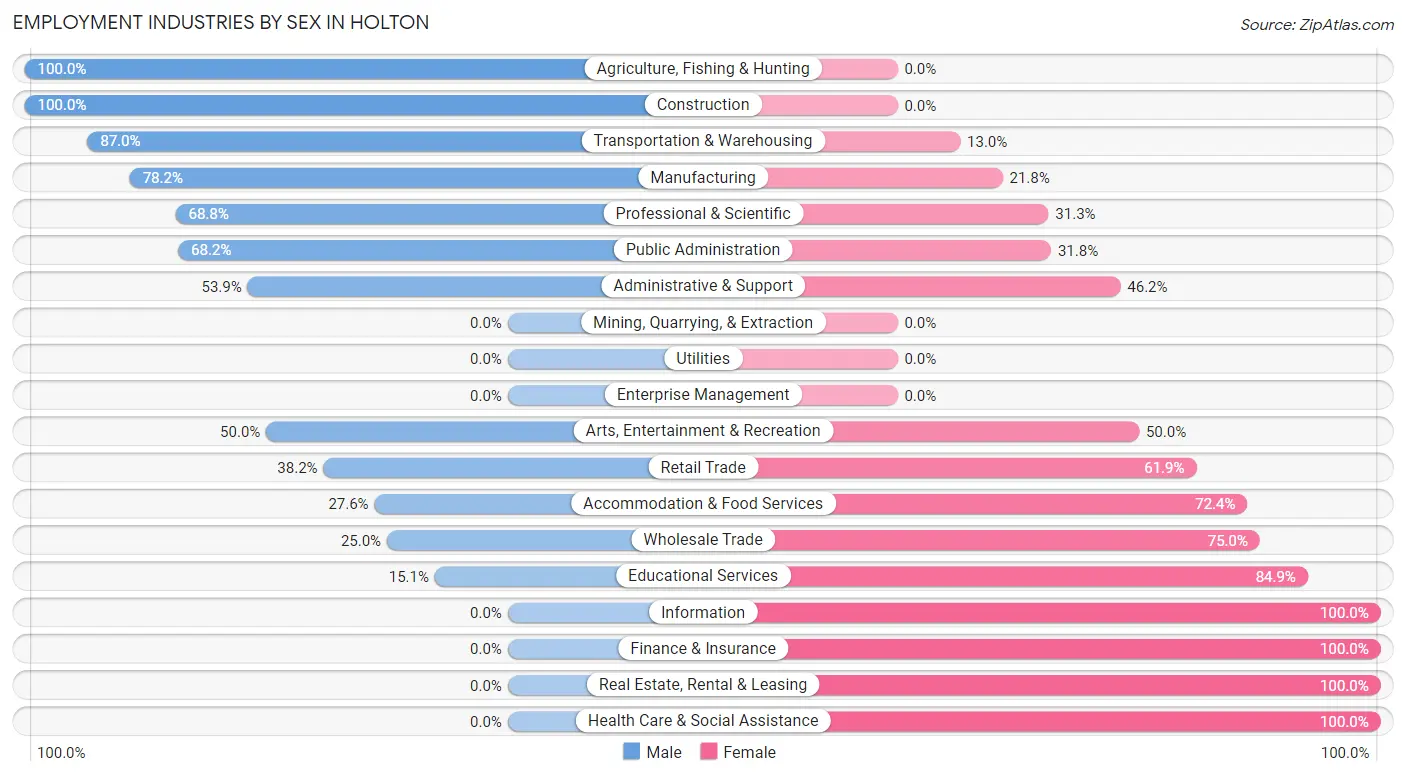
Employment Industries by Sex in Holton
The Holton industries that see more men than women are Agriculture, Fishing & Hunting (100.0%), Construction (100.0%), and Transportation & Warehousing (87.0%), whereas the industries that tend to have a higher number of women are Information (100.0%), Finance & Insurance (100.0%), and Real Estate, Rental & Leasing (100.0%).
| Industry | Male | Female |
| Agriculture, Fishing & Hunting | 23 (100.0%) | 0 (0.0%) |
| Mining, Quarrying, & Extraction | 0 (0.0%) | 0 (0.0%) |
| Construction | 152 (100.0%) | 0 (0.0%) |
| Manufacturing | 169 (78.2%) | 47 (21.8%) |
| Wholesale Trade | 8 (25.0%) | 24 (75.0%) |
| Retail Trade | 66 (38.2%) | 107 (61.9%) |
| Transportation & Warehousing | 114 (87.0%) | 17 (13.0%) |
| Utilities | 0 (0.0%) | 0 (0.0%) |
| Information | 0 (0.0%) | 27 (100.0%) |
| Finance & Insurance | 0 (0.0%) | 30 (100.0%) |
| Real Estate, Rental & Leasing | 0 (0.0%) | 12 (100.0%) |
| Professional & Scientific | 33 (68.8%) | 15 (31.2%) |
| Enterprise Management | 0 (0.0%) | 0 (0.0%) |
| Administrative & Support | 21 (53.8%) | 18 (46.2%) |
| Educational Services | 40 (15.1%) | 225 (84.9%) |
| Health Care & Social Assistance | 0 (0.0%) | 71 (100.0%) |
| Arts, Entertainment & Recreation | 17 (50.0%) | 17 (50.0%) |
| Accommodation & Food Services | 48 (27.6%) | 126 (72.4%) |
| Public Administration | 88 (68.2%) | 41 (31.8%) |
| Total | 825 (48.5%) | 877 (51.5%) |
Education in Holton
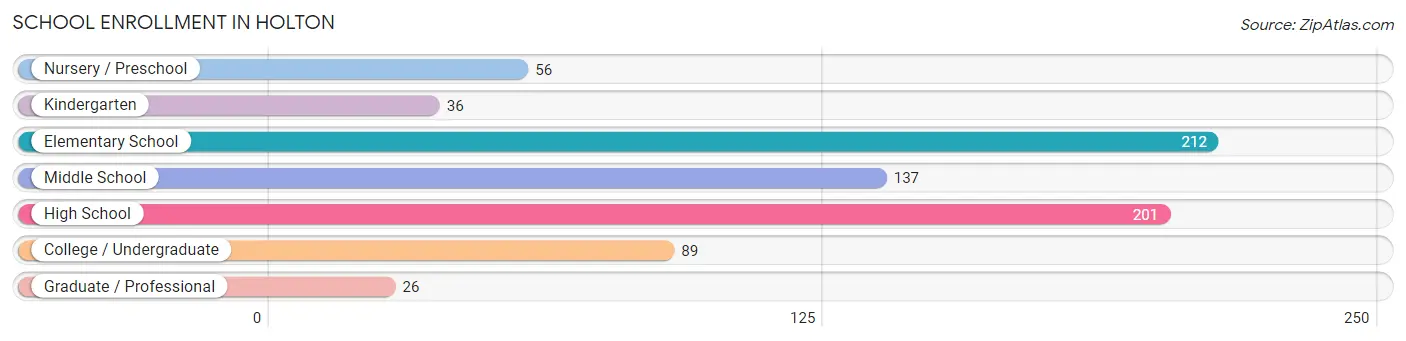
School Enrollment in Holton
The most common levels of schooling among the 757 students in Holton are elementary school (212 | 28.0%), high school (201 | 26.6%), and middle school (137 | 18.1%).
| School Level | # Students | % Students |
| Nursery / Preschool | 56 | 7.4% |
| Kindergarten | 36 | 4.8% |
| Elementary School | 212 | 28.0% |
| Middle School | 137 | 18.1% |
| High School | 201 | 26.6% |
| College / Undergraduate | 89 | 11.8% |
| Graduate / Professional | 26 | 3.4% |
| Total | 757 | 100.0% |
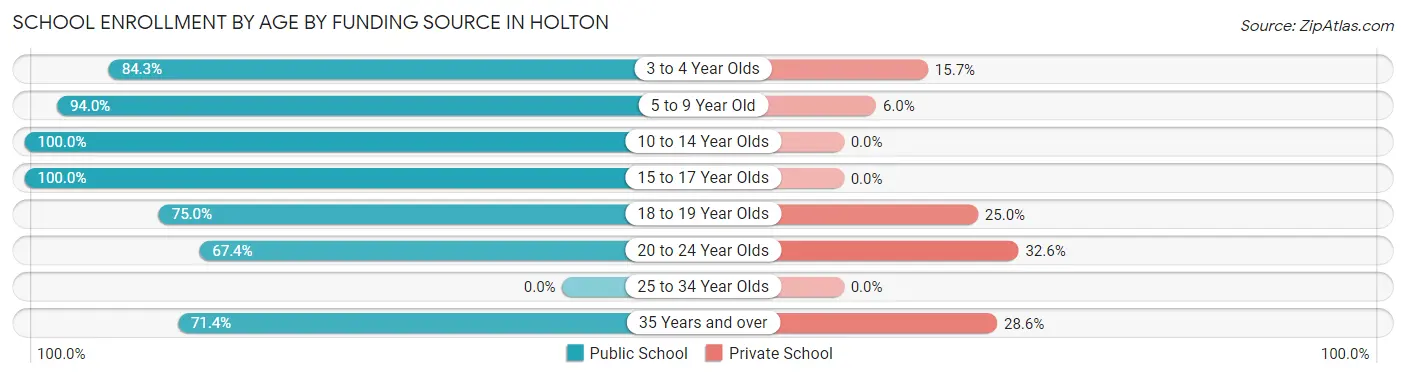
School Enrollment by Age by Funding Source in Holton
Out of a total of 757 students who are enrolled in schools in Holton, 61 (8.1%) attend a private institution, while the remaining 696 (91.9%) are enrolled in public schools. The age group of 20 to 24 year olds has the highest likelihood of being enrolled in private schools, with 14 (32.6% in the age bracket) enrolled. Conversely, the age group of 10 to 14 year olds has the lowest likelihood of being enrolled in a private school, with 191 (100.0% in the age bracket) attending a public institution.
| Age Bracket | Public School | Private School |
| 3 to 4 Year Olds | 43 (84.3%) | 8 (15.7%) |
| 5 to 9 Year Old | 187 (94.0%) | 12 (6.0%) |
| 10 to 14 Year Olds | 191 (100.0%) | 0 (0.0%) |
| 15 to 17 Year Olds | 174 (100.0%) | 0 (0.0%) |
| 18 to 19 Year Olds | 27 (75.0%) | 9 (25.0%) |
| 20 to 24 Year Olds | 29 (67.4%) | 14 (32.6%) |
| 25 to 34 Year Olds | 0 (0.0%) | 0 (0.0%) |
| 35 Years and over | 45 (71.4%) | 18 (28.6%) |
| Total | 696 (91.9%) | 61 (8.1%) |
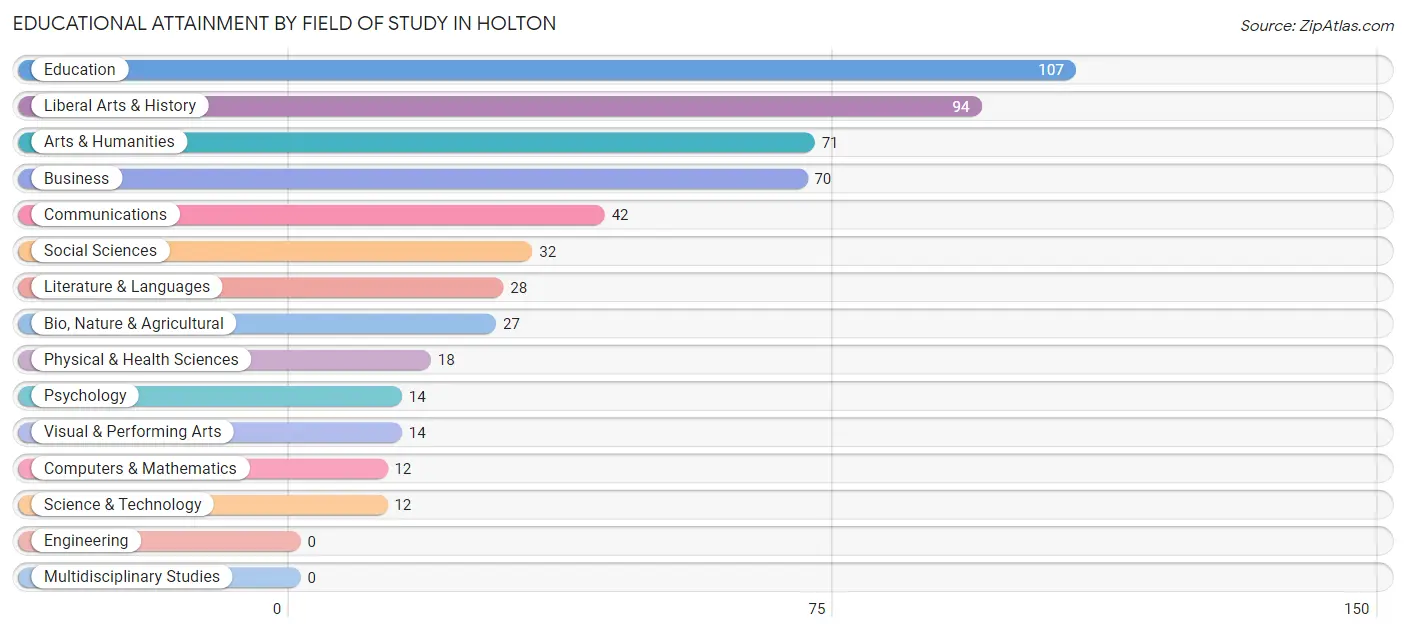
Educational Attainment by Field of Study in Holton
Education (107 | 19.8%), liberal arts & history (94 | 17.4%), arts & humanities (71 | 13.1%), business (70 | 12.9%), and communications (42 | 7.8%) are the most common fields of study among 541 individuals in Holton who have obtained a bachelor's degree or higher.
| Field of Study | # Graduates | % Graduates |
| Computers & Mathematics | 12 | 2.2% |
| Bio, Nature & Agricultural | 27 | 5.0% |
| Physical & Health Sciences | 18 | 3.3% |
| Psychology | 14 | 2.6% |
| Social Sciences | 32 | 5.9% |
| Engineering | 0 | 0.0% |
| Multidisciplinary Studies | 0 | 0.0% |
| Science & Technology | 12 | 2.2% |
| Business | 70 | 12.9% |
| Education | 107 | 19.8% |
| Literature & Languages | 28 | 5.2% |
| Liberal Arts & History | 94 | 17.4% |
| Visual & Performing Arts | 14 | 2.6% |
| Communications | 42 | 7.8% |
| Arts & Humanities | 71 | 13.1% |
| Total | 541 | 100.0% |
Transportation & Commute in Holton
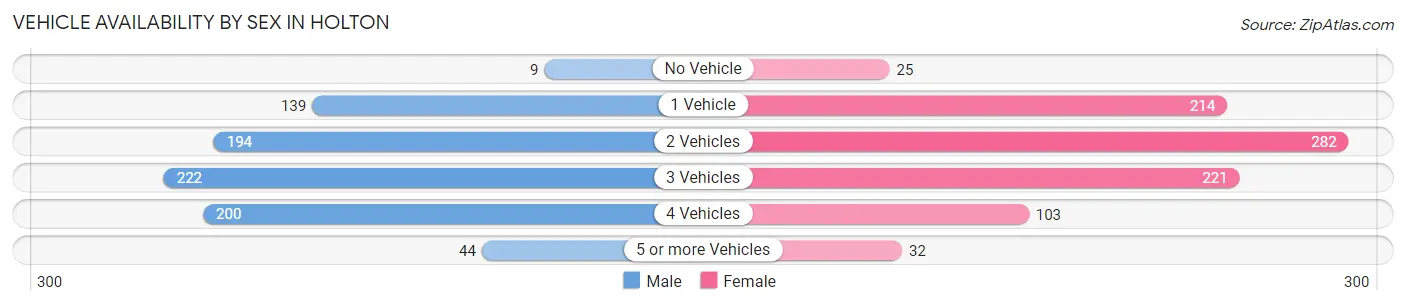
Vehicle Availability by Sex in Holton
The most prevalent vehicle ownership categories in Holton are males with 3 vehicles (222, accounting for 27.5%) and females with 3 vehicles (221, making up 25.3%).
| Vehicles Available | Male | Female |
| No Vehicle | 9 (1.1%) | 25 (2.9%) |
| 1 Vehicle | 139 (17.2%) | 214 (24.4%) |
| 2 Vehicles | 194 (24.0%) | 282 (32.2%) |
| 3 Vehicles | 222 (27.5%) | 221 (25.2%) |
| 4 Vehicles | 200 (24.7%) | 103 (11.7%) |
| 5 or more Vehicles | 44 (5.4%) | 32 (3.6%) |
| Total | 808 (100.0%) | 877 (100.0%) |
Commute Time in Holton
The most frequently occuring commute durations in Holton are 30 to 34 minutes (288 commuters, 18.0%), 5 to 9 minutes (272 commuters, 17.0%), and less than 5 minutes (251 commuters, 15.7%).
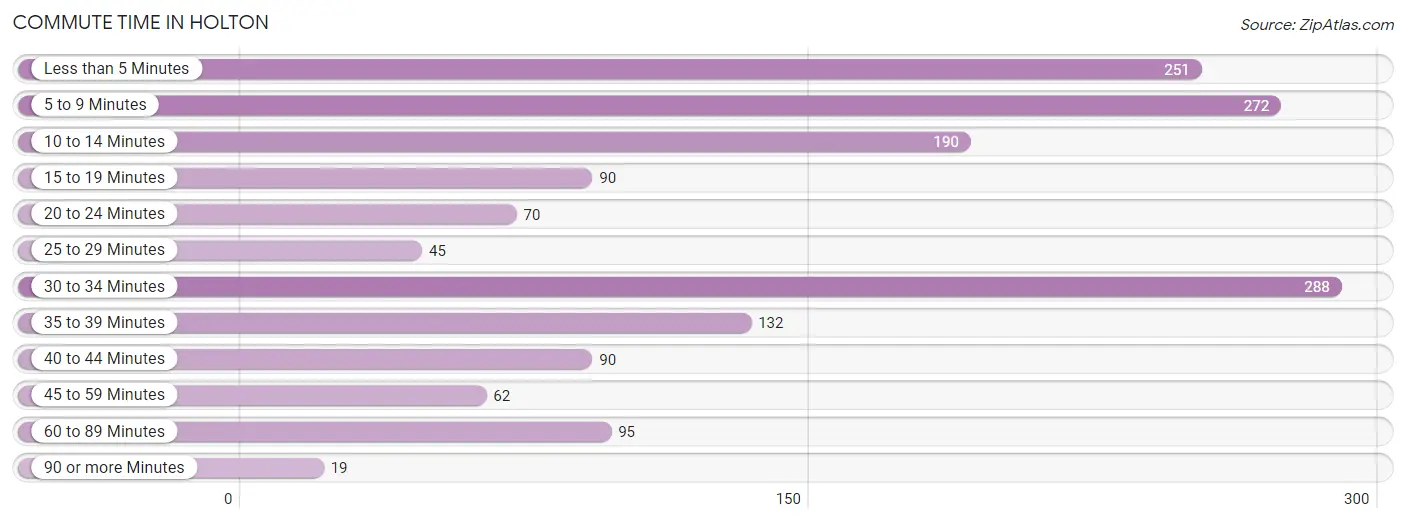
| Commute Time | # Commuters | % Commuters |
| Less than 5 Minutes | 251 | 15.7% |
| 5 to 9 Minutes | 272 | 17.0% |
| 10 to 14 Minutes | 190 | 11.8% |
| 15 to 19 Minutes | 90 | 5.6% |
| 20 to 24 Minutes | 70 | 4.4% |
| 25 to 29 Minutes | 45 | 2.8% |
| 30 to 34 Minutes | 288 | 18.0% |
| 35 to 39 Minutes | 132 | 8.2% |
| 40 to 44 Minutes | 90 | 5.6% |
| 45 to 59 Minutes | 62 | 3.9% |
| 60 to 89 Minutes | 95 | 5.9% |
| 90 or more Minutes | 19 | 1.2% |
Commute Time by Sex in Holton
The most common commute times in Holton are 30 to 34 minutes (152 commuters, 20.1%) for males and less than 5 minutes (182 commuters, 21.5%) for females.
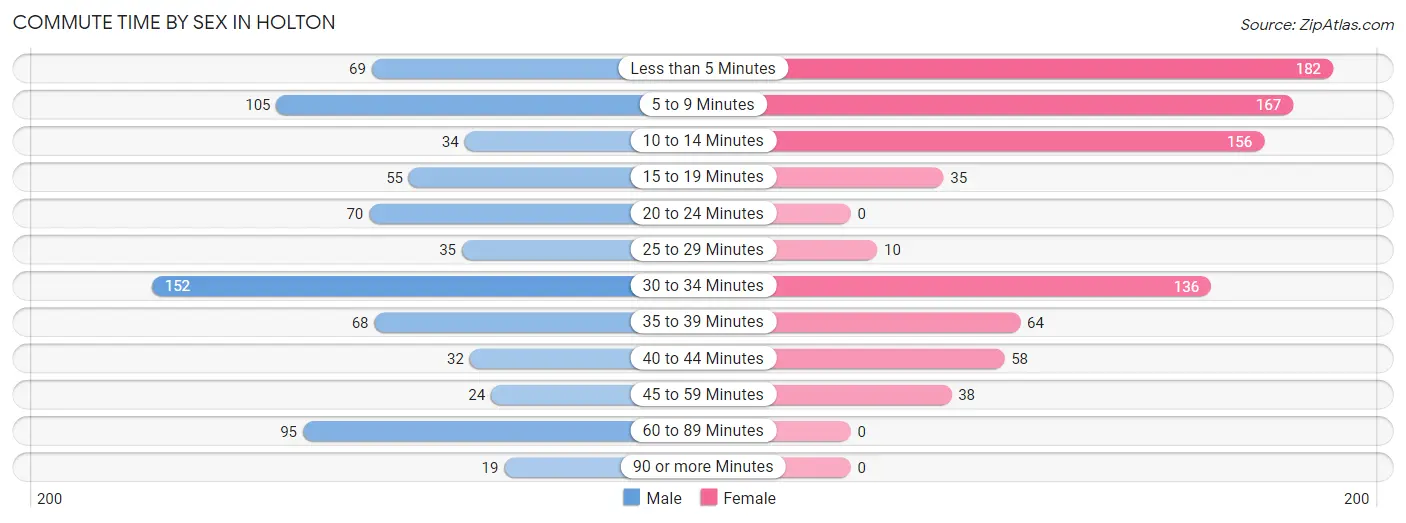
| Commute Time | Male | Female |
| Less than 5 Minutes | 69 (9.1%) | 182 (21.5%) |
| 5 to 9 Minutes | 105 (13.9%) | 167 (19.7%) |
| 10 to 14 Minutes | 34 (4.5%) | 156 (18.4%) |
| 15 to 19 Minutes | 55 (7.3%) | 35 (4.1%) |
| 20 to 24 Minutes | 70 (9.2%) | 0 (0.0%) |
| 25 to 29 Minutes | 35 (4.6%) | 10 (1.2%) |
| 30 to 34 Minutes | 152 (20.1%) | 136 (16.1%) |
| 35 to 39 Minutes | 68 (9.0%) | 64 (7.6%) |
| 40 to 44 Minutes | 32 (4.2%) | 58 (6.9%) |
| 45 to 59 Minutes | 24 (3.2%) | 38 (4.5%) |
| 60 to 89 Minutes | 95 (12.5%) | 0 (0.0%) |
| 90 or more Minutes | 19 (2.5%) | 0 (0.0%) |
Time of Departure to Work by Sex in Holton
The most frequent times of departure to work in Holton are 6:00 AM to 6:29 AM (159, 21.0%) for males and 12:00 AM to 4:59 AM (122, 14.4%) for females.
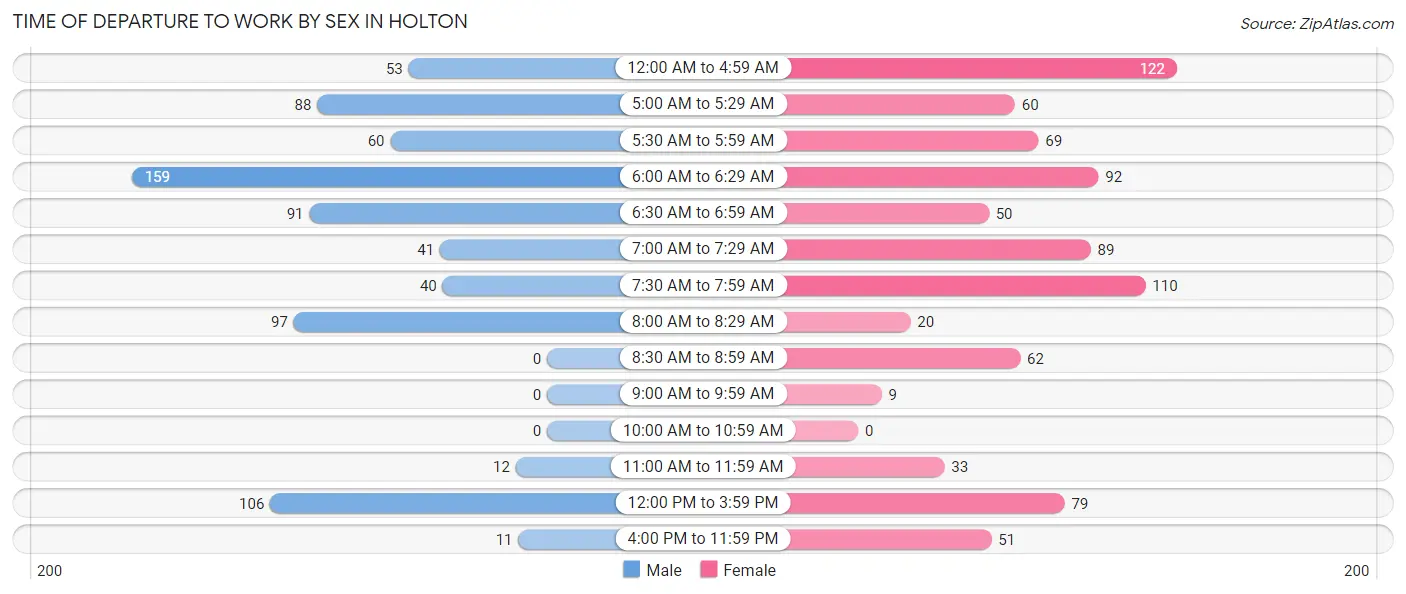
| Time of Departure | Male | Female |
| 12:00 AM to 4:59 AM | 53 (7.0%) | 122 (14.4%) |
| 5:00 AM to 5:29 AM | 88 (11.6%) | 60 (7.1%) |
| 5:30 AM to 5:59 AM | 60 (7.9%) | 69 (8.2%) |
| 6:00 AM to 6:29 AM | 159 (21.0%) | 92 (10.9%) |
| 6:30 AM to 6:59 AM | 91 (12.0%) | 50 (5.9%) |
| 7:00 AM to 7:29 AM | 41 (5.4%) | 89 (10.5%) |
| 7:30 AM to 7:59 AM | 40 (5.3%) | 110 (13.0%) |
| 8:00 AM to 8:29 AM | 97 (12.8%) | 20 (2.4%) |
| 8:30 AM to 8:59 AM | 0 (0.0%) | 62 (7.3%) |
| 9:00 AM to 9:59 AM | 0 (0.0%) | 9 (1.1%) |
| 10:00 AM to 10:59 AM | 0 (0.0%) | 0 (0.0%) |
| 11:00 AM to 11:59 AM | 12 (1.6%) | 33 (3.9%) |
| 12:00 PM to 3:59 PM | 106 (14.0%) | 79 (9.3%) |
| 4:00 PM to 11:59 PM | 11 (1.5%) | 51 (6.0%) |
| Total | 758 (100.0%) | 846 (100.0%) |
Housing Occupancy in Holton
Occupancy by Ownership in Holton
Of the total 1,369 dwellings in Holton, owner-occupied units account for 774 (56.5%), while renter-occupied units make up 595 (43.5%).
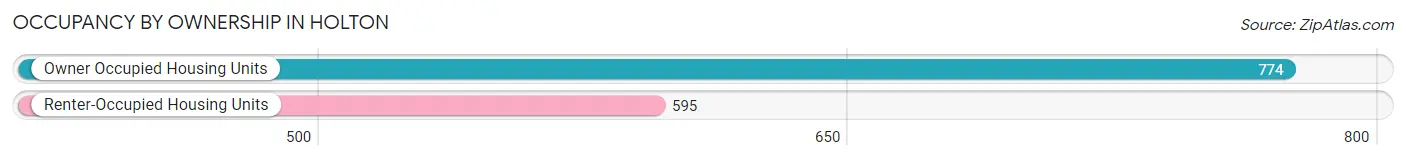
| Occupancy | # Housing Units | % Housing Units |
| Owner Occupied Housing Units | 774 | 56.5% |
| Renter-Occupied Housing Units | 595 | 43.5% |
| Total Occupied Housing Units | 1,369 | 100.0% |
Occupancy by Household Size in Holton
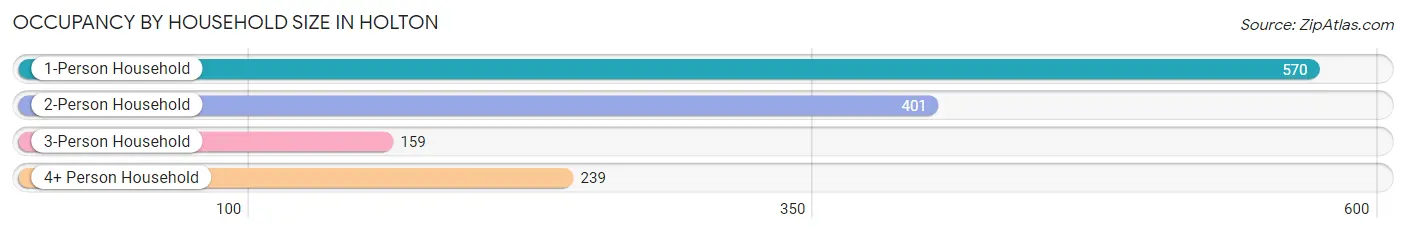
| Household Size | # Housing Units | % Housing Units |
| 1-Person Household | 570 | 41.6% |
| 2-Person Household | 401 | 29.3% |
| 3-Person Household | 159 | 11.6% |
| 4+ Person Household | 239 | 17.5% |
| Total Housing Units | 1,369 | 100.0% |
Occupancy by Ownership by Household Size in Holton
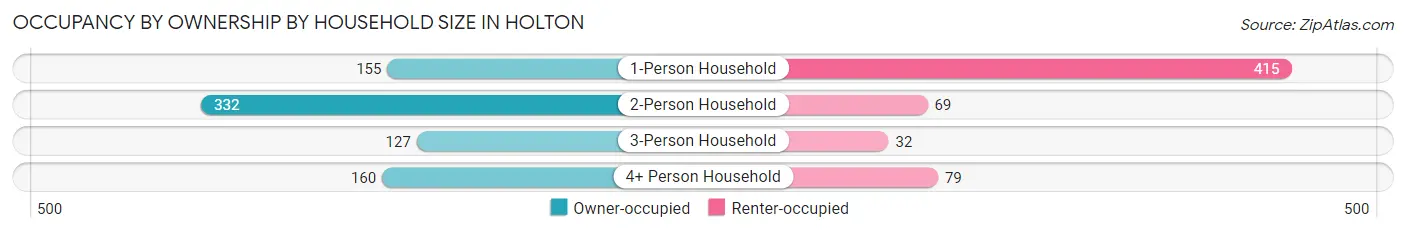
| Household Size | Owner-occupied | Renter-occupied |
| 1-Person Household | 155 (27.2%) | 415 (72.8%) |
| 2-Person Household | 332 (82.8%) | 69 (17.2%) |
| 3-Person Household | 127 (79.9%) | 32 (20.1%) |
| 4+ Person Household | 160 (66.9%) | 79 (33.1%) |
| Total Housing Units | 774 (56.5%) | 595 (43.5%) |
Occupancy by Educational Attainment in Holton
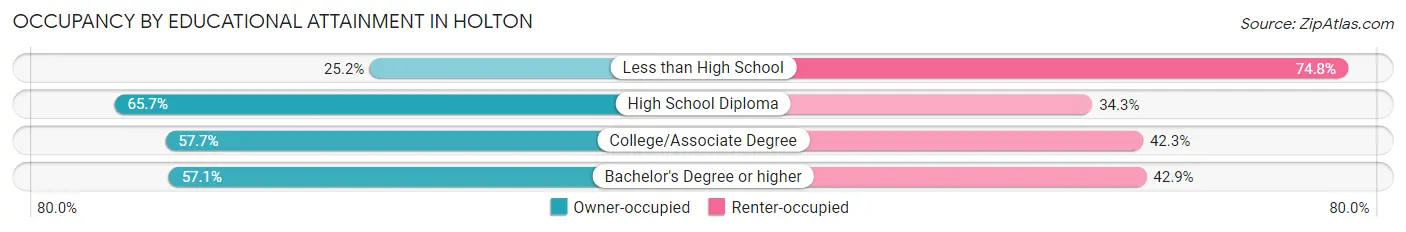
| Household Size | Owner-occupied | Renter-occupied |
| Less than High School | 33 (25.2%) | 98 (74.8%) |
| High School Diploma | 234 (65.7%) | 122 (34.3%) |
| College/Associate Degree | 323 (57.7%) | 237 (42.3%) |
| Bachelor's Degree or higher | 184 (57.1%) | 138 (42.9%) |
Occupancy by Age of Householder in Holton
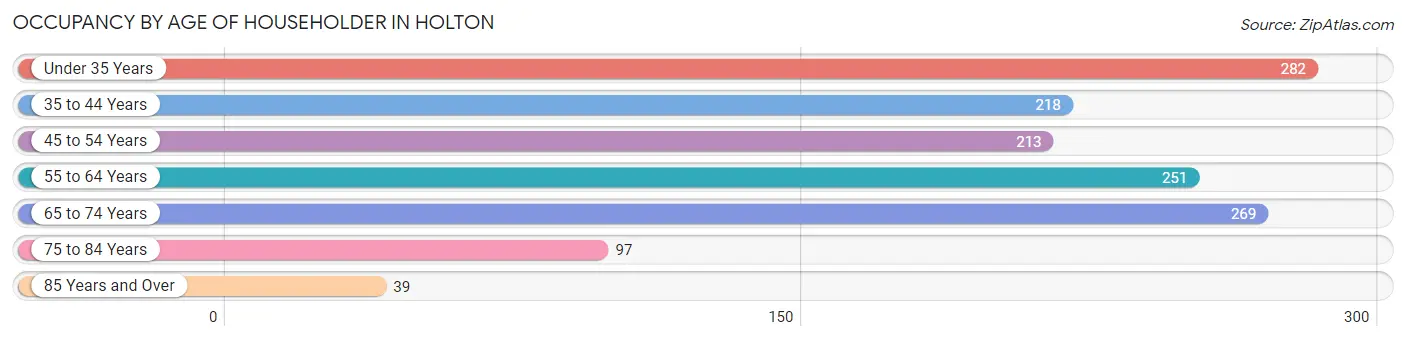
| Age Bracket | # Households | % Households |
| Under 35 Years | 282 | 20.6% |
| 35 to 44 Years | 218 | 15.9% |
| 45 to 54 Years | 213 | 15.6% |
| 55 to 64 Years | 251 | 18.3% |
| 65 to 74 Years | 269 | 19.7% |
| 75 to 84 Years | 97 | 7.1% |
| 85 Years and Over | 39 | 2.9% |
| Total | 1,369 | 100.0% |
Housing Finances in Holton
Median Income by Occupancy in Holton
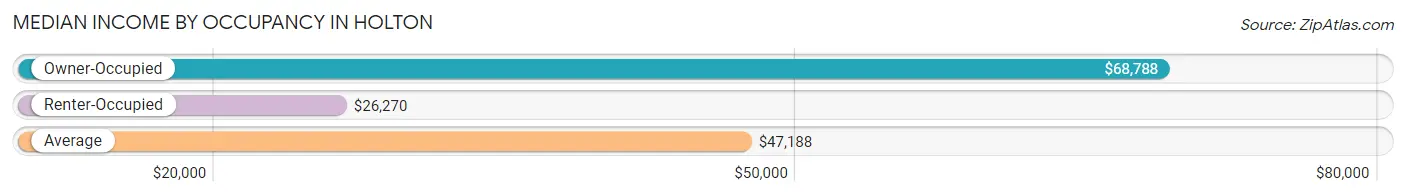
| Occupancy Type | # Households | Median Income |
| Owner-Occupied | 774 (56.5%) | $68,788 |
| Renter-Occupied | 595 (43.5%) | $26,270 |
| Average | 1,369 (100.0%) | $47,188 |
Occupancy by Householder Income Bracket in Holton
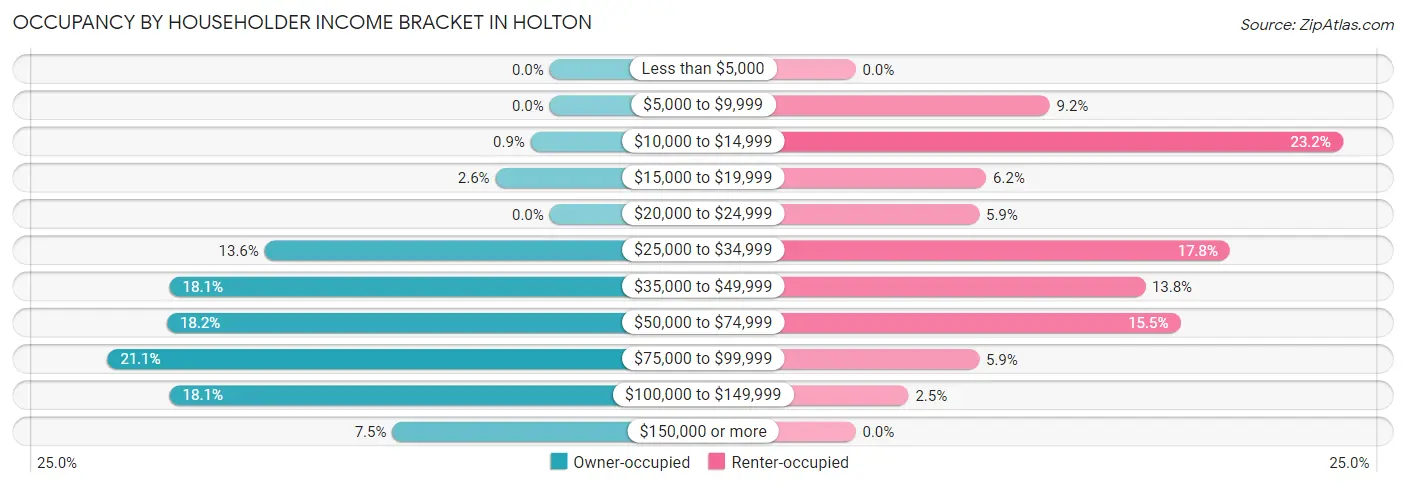
| Income Bracket | Owner-occupied | Renter-occupied |
| Less than $5,000 | 0 (0.0%) | 0 (0.0%) |
| $5,000 to $9,999 | 0 (0.0%) | 55 (9.2%) |
| $10,000 to $14,999 | 7 (0.9%) | 138 (23.2%) |
| $15,000 to $19,999 | 20 (2.6%) | 37 (6.2%) |
| $20,000 to $24,999 | 0 (0.0%) | 35 (5.9%) |
| $25,000 to $34,999 | 105 (13.6%) | 106 (17.8%) |
| $35,000 to $49,999 | 140 (18.1%) | 82 (13.8%) |
| $50,000 to $74,999 | 141 (18.2%) | 92 (15.5%) |
| $75,000 to $99,999 | 163 (21.1%) | 35 (5.9%) |
| $100,000 to $149,999 | 140 (18.1%) | 15 (2.5%) |
| $150,000 or more | 58 (7.5%) | 0 (0.0%) |
| Total | 774 (100.0%) | 595 (100.0%) |
Monthly Housing Cost Tiers in Holton
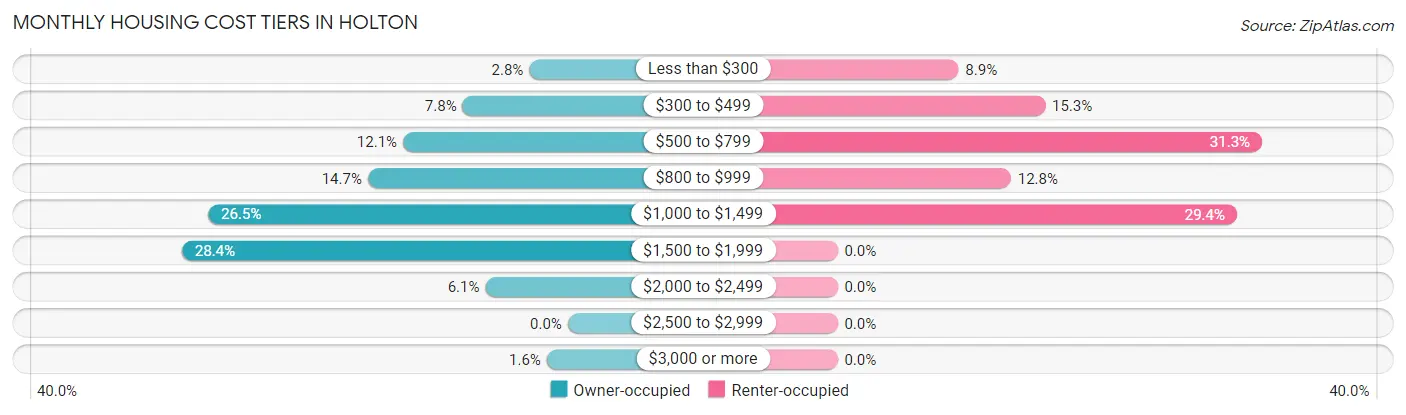
| Monthly Cost | Owner-occupied | Renter-occupied |
| Less than $300 | 22 (2.8%) | 53 (8.9%) |
| $300 to $499 | 60 (7.7%) | 91 (15.3%) |
| $500 to $799 | 94 (12.1%) | 186 (31.3%) |
| $800 to $999 | 114 (14.7%) | 76 (12.8%) |
| $1,000 to $1,499 | 205 (26.5%) | 175 (29.4%) |
| $1,500 to $1,999 | 220 (28.4%) | 0 (0.0%) |
| $2,000 to $2,499 | 47 (6.1%) | 0 (0.0%) |
| $2,500 to $2,999 | 0 (0.0%) | 0 (0.0%) |
| $3,000 or more | 12 (1.5%) | 0 (0.0%) |
| Total | 774 (100.0%) | 595 (100.0%) |
Physical Housing Characteristics in Holton
Housing Structures in Holton
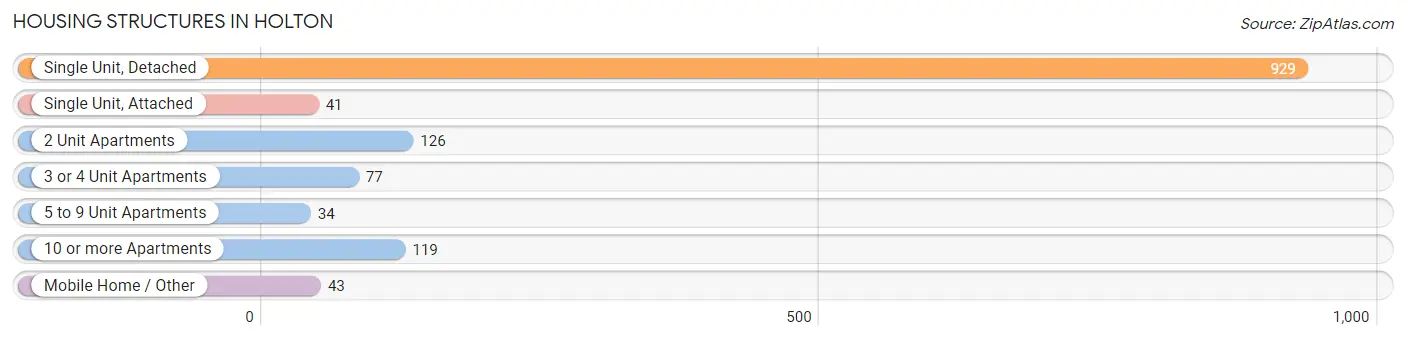
| Structure Type | # Housing Units | % Housing Units |
| Single Unit, Detached | 929 | 67.9% |
| Single Unit, Attached | 41 | 3.0% |
| 2 Unit Apartments | 126 | 9.2% |
| 3 or 4 Unit Apartments | 77 | 5.6% |
| 5 to 9 Unit Apartments | 34 | 2.5% |
| 10 or more Apartments | 119 | 8.7% |
| Mobile Home / Other | 43 | 3.1% |
| Total | 1,369 | 100.0% |
Housing Structures by Occupancy in Holton
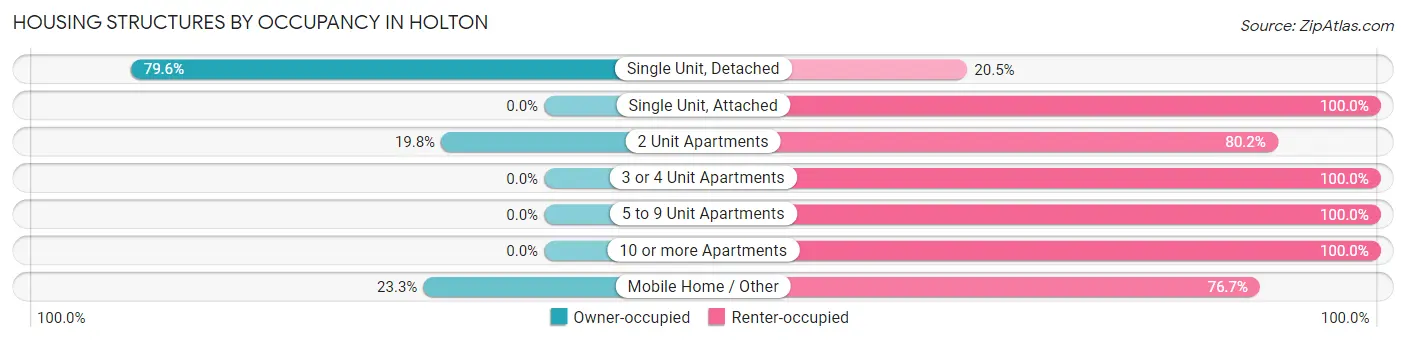
| Structure Type | Owner-occupied | Renter-occupied |
| Single Unit, Detached | 739 (79.5%) | 190 (20.4%) |
| Single Unit, Attached | 0 (0.0%) | 41 (100.0%) |
| 2 Unit Apartments | 25 (19.8%) | 101 (80.2%) |
| 3 or 4 Unit Apartments | 0 (0.0%) | 77 (100.0%) |
| 5 to 9 Unit Apartments | 0 (0.0%) | 34 (100.0%) |
| 10 or more Apartments | 0 (0.0%) | 119 (100.0%) |
| Mobile Home / Other | 10 (23.3%) | 33 (76.7%) |
| Total | 774 (56.5%) | 595 (43.5%) |
Housing Structures by Number of Rooms in Holton
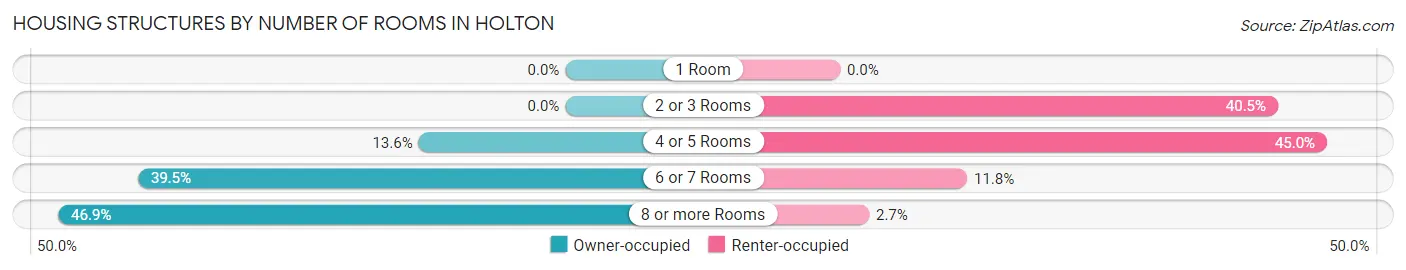
| Number of Rooms | Owner-occupied | Renter-occupied |
| 1 Room | 0 (0.0%) | 0 (0.0%) |
| 2 or 3 Rooms | 0 (0.0%) | 241 (40.5%) |
| 4 or 5 Rooms | 105 (13.6%) | 268 (45.0%) |
| 6 or 7 Rooms | 306 (39.5%) | 70 (11.8%) |
| 8 or more Rooms | 363 (46.9%) | 16 (2.7%) |
| Total | 774 (100.0%) | 595 (100.0%) |
Housing Structure by Heating Type in Holton
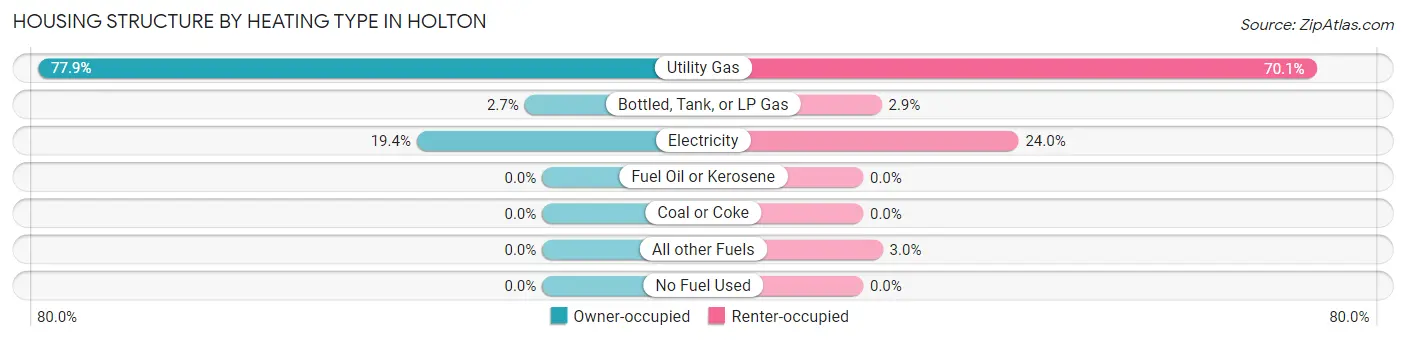
| Heating Type | Owner-occupied | Renter-occupied |
| Utility Gas | 603 (77.9%) | 417 (70.1%) |
| Bottled, Tank, or LP Gas | 21 (2.7%) | 17 (2.9%) |
| Electricity | 150 (19.4%) | 143 (24.0%) |
| Fuel Oil or Kerosene | 0 (0.0%) | 0 (0.0%) |
| Coal or Coke | 0 (0.0%) | 0 (0.0%) |
| All other Fuels | 0 (0.0%) | 18 (3.0%) |
| No Fuel Used | 0 (0.0%) | 0 (0.0%) |
| Total | 774 (100.0%) | 595 (100.0%) |
Household Vehicle Usage in Holton
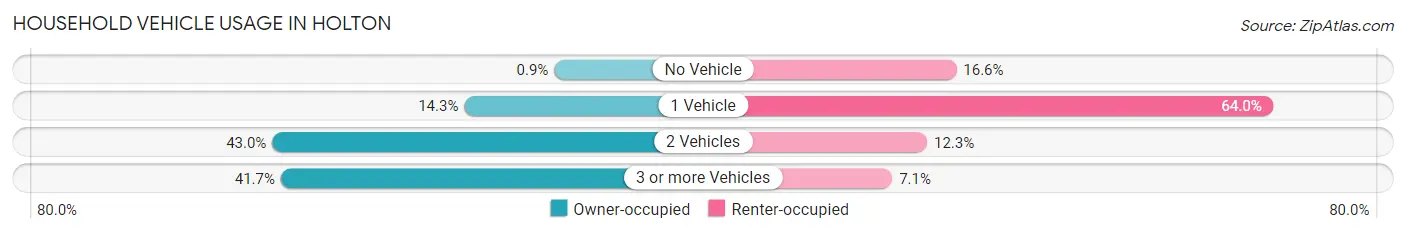
| Vehicles per Household | Owner-occupied | Renter-occupied |
| No Vehicle | 7 (0.9%) | 99 (16.6%) |
| 1 Vehicle | 111 (14.3%) | 381 (64.0%) |
| 2 Vehicles | 333 (43.0%) | 73 (12.3%) |
| 3 or more Vehicles | 323 (41.7%) | 42 (7.1%) |
| Total | 774 (100.0%) | 595 (100.0%) |
Real Estate & Mortgages in Holton
Real Estate and Mortgage Overview in Holton
| Characteristic | Without Mortgage | With Mortgage |
| Housing Units | 221 | 553 |
| Median Property Value | $99,500 | $148,000 |
| Median Household Income | $42,452 | $51 |
| Monthly Housing Costs | $650 | $12 |
| Real Estate Taxes | $2,240 | $9 |
Property Value by Mortgage Status in Holton

| Property Value | Without Mortgage | With Mortgage |
| Less than $50,000 | 11 (5.0%) | 19 (3.4%) |
| $50,000 to $99,999 | 102 (46.2%) | 116 (21.0%) |
| $100,000 to $299,999 | 108 (48.9%) | 388 (70.2%) |
| $300,000 to $499,999 | 0 (0.0%) | 18 (3.3%) |
| $500,000 to $749,999 | 0 (0.0%) | 0 (0.0%) |
| $750,000 to $999,999 | 0 (0.0%) | 0 (0.0%) |
| $1,000,000 or more | 0 (0.0%) | 12 (2.2%) |
| Total | 221 (100.0%) | 553 (100.0%) |
Household Income by Mortgage Status in Holton
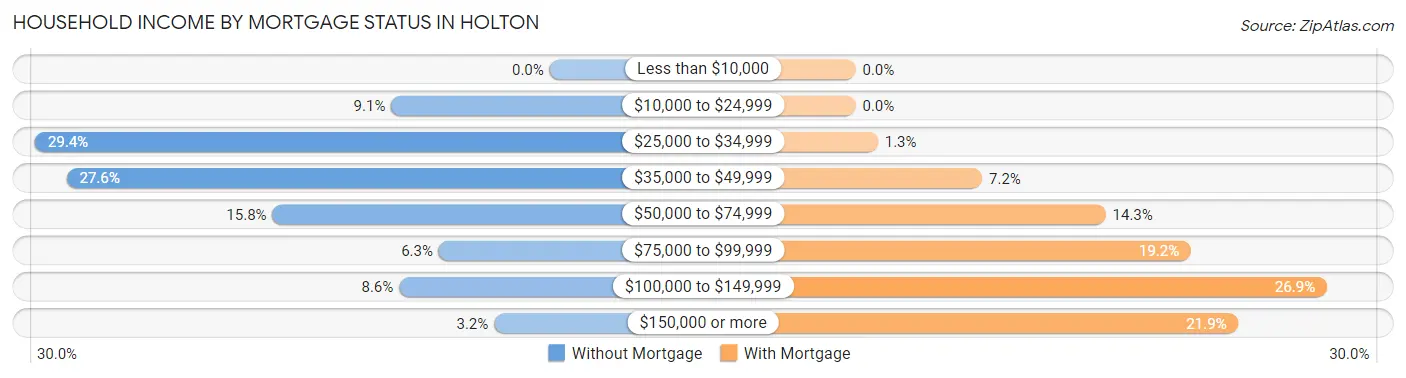
| Household Income | Without Mortgage | With Mortgage |
| Less than $10,000 | 0 (0.0%) | 0 (0.0%) |
| $10,000 to $24,999 | 20 (9.0%) | 0 (0.0%) |
| $25,000 to $34,999 | 65 (29.4%) | 7 (1.3%) |
| $35,000 to $49,999 | 61 (27.6%) | 40 (7.2%) |
| $50,000 to $74,999 | 35 (15.8%) | 79 (14.3%) |
| $75,000 to $99,999 | 14 (6.3%) | 106 (19.2%) |
| $100,000 to $149,999 | 19 (8.6%) | 149 (26.9%) |
| $150,000 or more | 7 (3.2%) | 121 (21.9%) |
| Total | 221 (100.0%) | 553 (100.0%) |
Property Value to Household Income Ratio in Holton
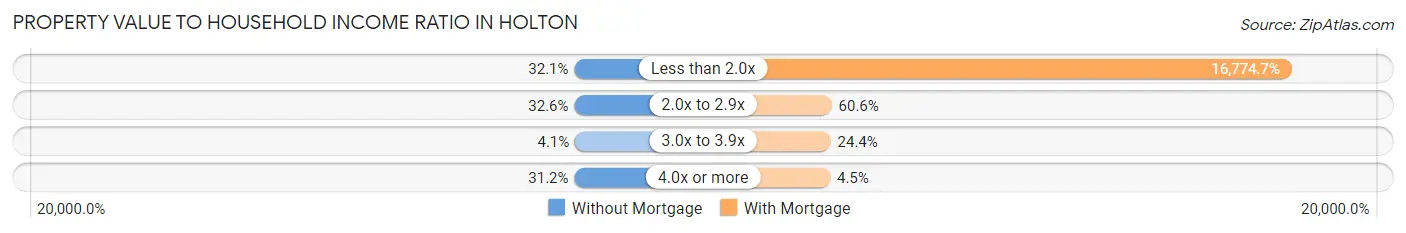
| Value-to-Income Ratio | Without Mortgage | With Mortgage |
| Less than 2.0x | 71 (32.1%) | 92,764 (16,774.7%) |
| 2.0x to 2.9x | 72 (32.6%) | 335 (60.6%) |
| 3.0x to 3.9x | 9 (4.1%) | 135 (24.4%) |
| 4.0x or more | 69 (31.2%) | 25 (4.5%) |
| Total | 221 (100.0%) | 553 (100.0%) |
Real Estate Taxes by Mortgage Status in Holton
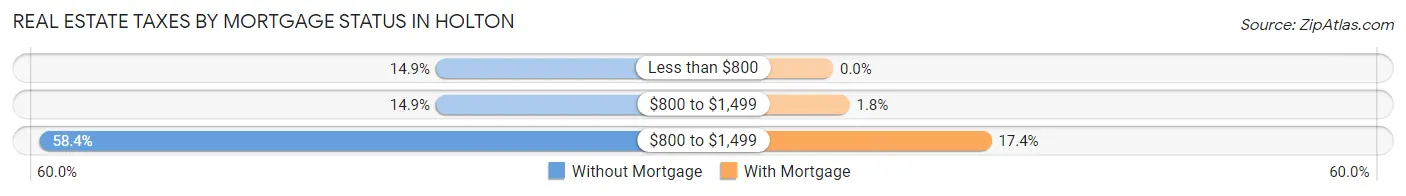
| Property Taxes | Without Mortgage | With Mortgage |
| Less than $800 | 33 (14.9%) | 0 (0.0%) |
| $800 to $1,499 | 33 (14.9%) | 10 (1.8%) |
| $800 to $1,499 | 129 (58.4%) | 96 (17.4%) |
| Total | 221 (100.0%) | 553 (100.0%) |
Health & Disability in Holton
Health Insurance Coverage by Age in Holton
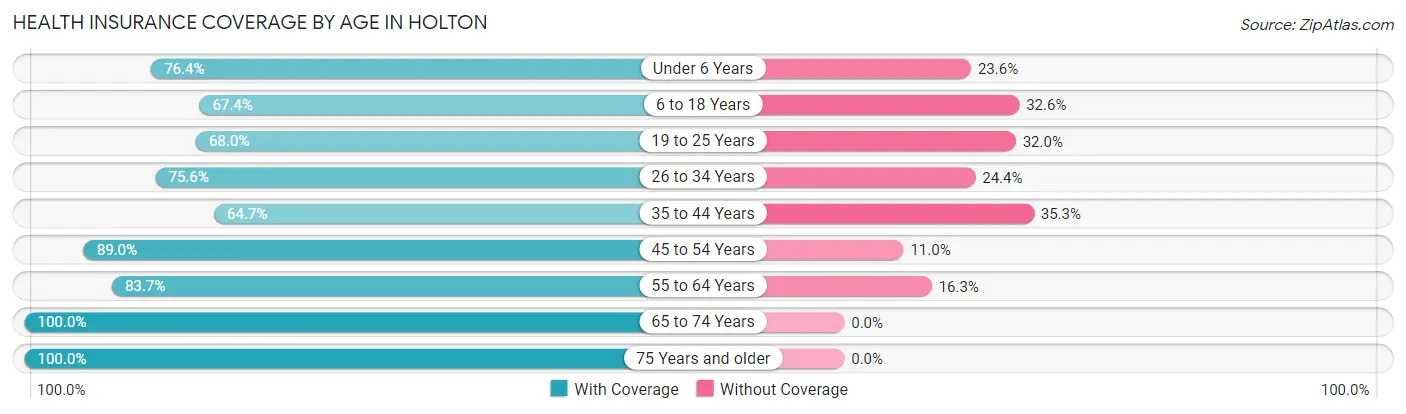
| Age Bracket | With Coverage | Without Coverage |
| Under 6 Years | 152 (76.4%) | 47 (23.6%) |
| 6 to 18 Years | 380 (67.4%) | 184 (32.6%) |
| 19 to 25 Years | 383 (68.0%) | 180 (32.0%) |
| 26 to 34 Years | 133 (75.6%) | 43 (24.4%) |
| 35 to 44 Years | 313 (64.7%) | 171 (35.3%) |
| 45 to 54 Years | 298 (89.0%) | 37 (11.0%) |
| 55 to 64 Years | 308 (83.7%) | 60 (16.3%) |
| 65 to 74 Years | 348 (100.0%) | 0 (0.0%) |
| 75 Years and older | 191 (100.0%) | 0 (0.0%) |
| Total | 2,506 (77.6%) | 722 (22.4%) |
Health Insurance Coverage by Citizenship Status in Holton
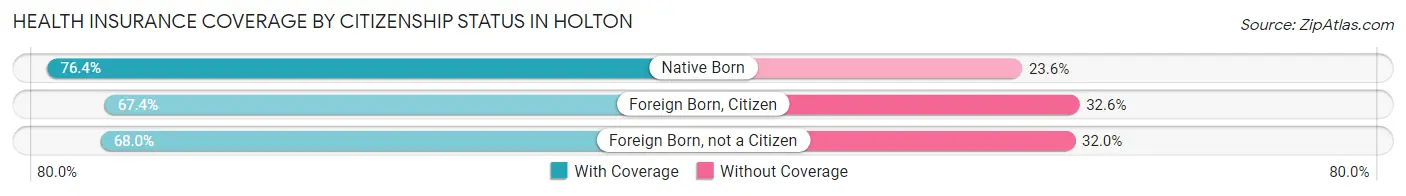
| Citizenship Status | With Coverage | Without Coverage |
| Native Born | 152 (76.4%) | 47 (23.6%) |
| Foreign Born, Citizen | 380 (67.4%) | 184 (32.6%) |
| Foreign Born, not a Citizen | 383 (68.0%) | 180 (32.0%) |
Health Insurance Coverage by Household Income in Holton
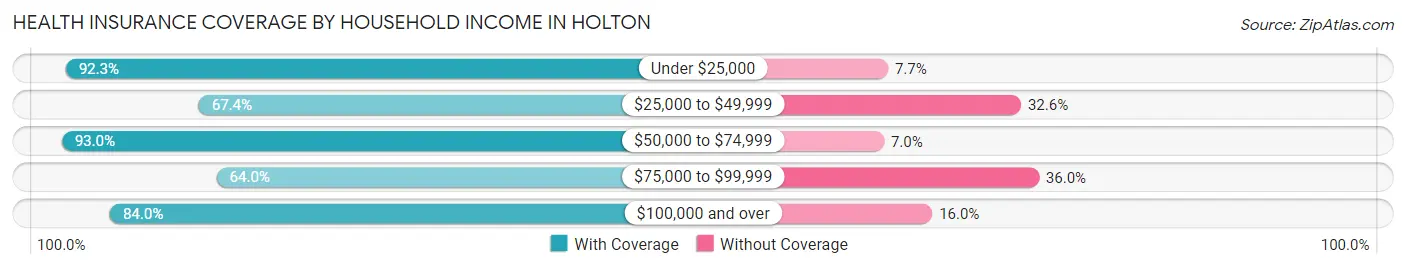
| Household Income | With Coverage | Without Coverage |
| Under $25,000 | 347 (92.3%) | 29 (7.7%) |
| $25,000 to $49,999 | 456 (67.4%) | 221 (32.6%) |
| $50,000 to $74,999 | 428 (93.0%) | 32 (7.0%) |
| $75,000 to $99,999 | 530 (64.0%) | 298 (36.0%) |
| $100,000 and over | 730 (84.0%) | 139 (16.0%) |
Public vs Private Health Insurance Coverage by Age in Holton
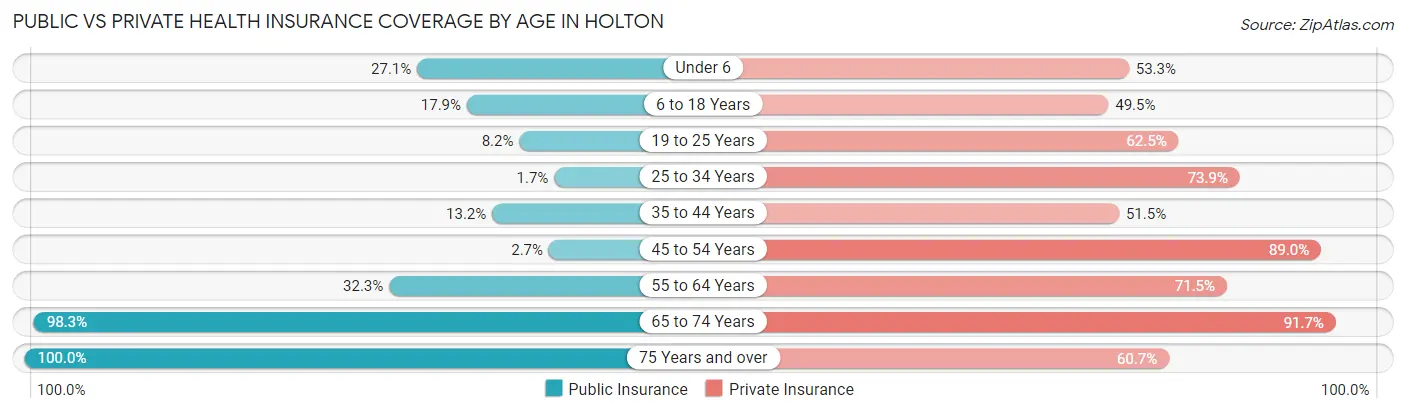
| Age Bracket | Public Insurance | Private Insurance |
| Under 6 | 54 (27.1%) | 106 (53.3%) |
| 6 to 18 Years | 101 (17.9%) | 279 (49.5%) |
| 19 to 25 Years | 46 (8.2%) | 352 (62.5%) |
| 25 to 34 Years | 3 (1.7%) | 130 (73.9%) |
| 35 to 44 Years | 64 (13.2%) | 249 (51.4%) |
| 45 to 54 Years | 9 (2.7%) | 298 (89.0%) |
| 55 to 64 Years | 119 (32.3%) | 263 (71.5%) |
| 65 to 74 Years | 342 (98.3%) | 319 (91.7%) |
| 75 Years and over | 191 (100.0%) | 116 (60.7%) |
| Total | 929 (28.8%) | 2,112 (65.4%) |
Disability Status by Sex by Age in Holton
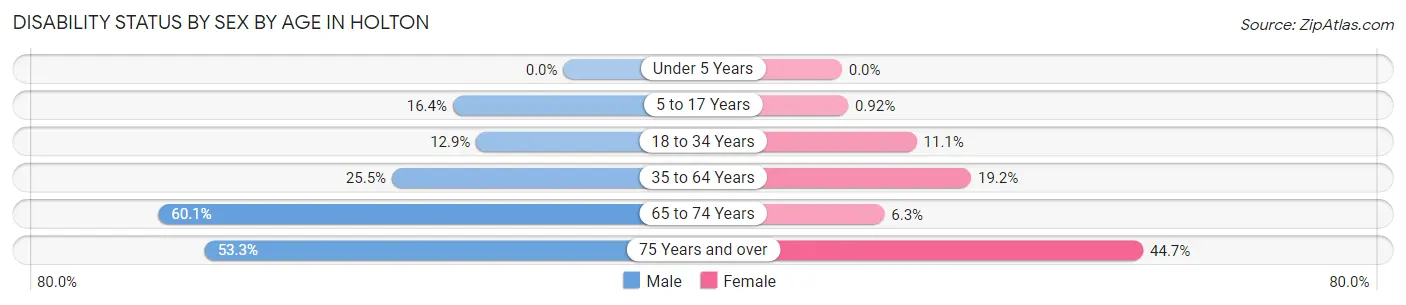
| Age Bracket | Male | Female |
| Under 5 Years | 0 (0.0%) | 0 (0.0%) |
| 5 to 17 Years | 43 (16.4%) | 3 (0.9%) |
| 18 to 34 Years | 48 (12.9%) | 42 (11.1%) |
| 35 to 64 Years | 151 (25.5%) | 114 (19.2%) |
| 65 to 74 Years | 95 (60.1%) | 12 (6.3%) |
| 75 Years and over | 41 (53.2%) | 51 (44.7%) |
Disability Class by Sex by Age in Holton
Disability Class: Hearing Difficulty
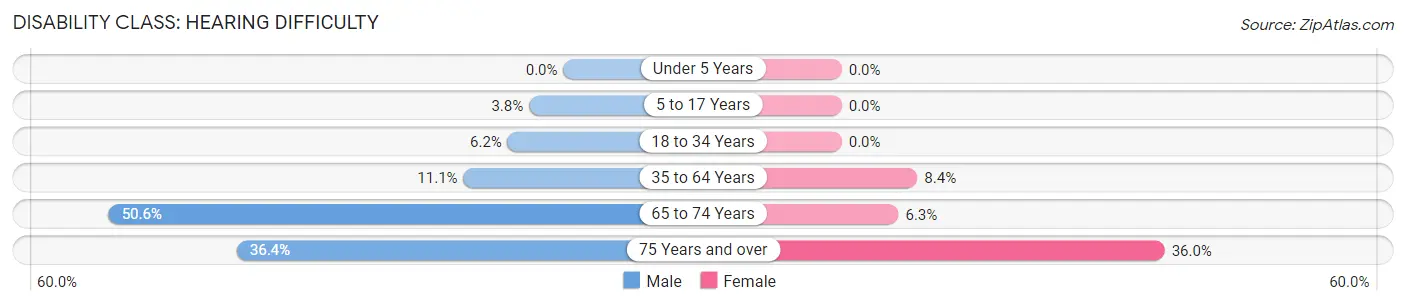
| Age Bracket | Male | Female |
| Under 5 Years | 0 (0.0%) | 0 (0.0%) |
| 5 to 17 Years | 10 (3.8%) | 0 (0.0%) |
| 18 to 34 Years | 23 (6.2%) | 0 (0.0%) |
| 35 to 64 Years | 66 (11.1%) | 50 (8.4%) |
| 65 to 74 Years | 80 (50.6%) | 12 (6.3%) |
| 75 Years and over | 28 (36.4%) | 41 (36.0%) |
Disability Class: Vision Difficulty
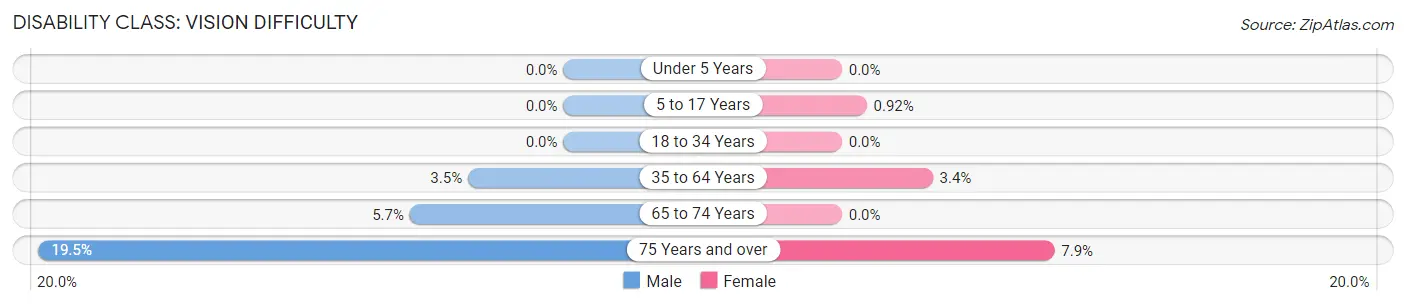
| Age Bracket | Male | Female |
| Under 5 Years | 0 (0.0%) | 0 (0.0%) |
| 5 to 17 Years | 0 (0.0%) | 3 (0.9%) |
| 18 to 34 Years | 0 (0.0%) | 0 (0.0%) |
| 35 to 64 Years | 21 (3.5%) | 20 (3.4%) |
| 65 to 74 Years | 9 (5.7%) | 0 (0.0%) |
| 75 Years and over | 15 (19.5%) | 9 (7.9%) |
Disability Class: Cognitive Difficulty
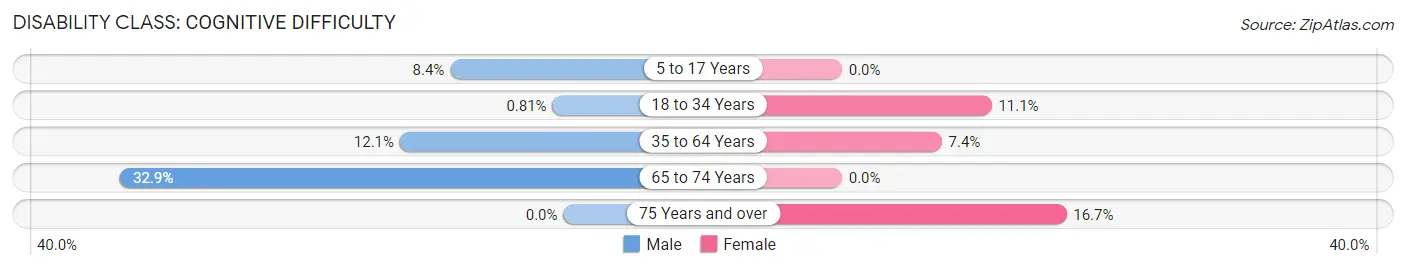
| Age Bracket | Male | Female |
| 5 to 17 Years | 22 (8.4%) | 0 (0.0%) |
| 18 to 34 Years | 3 (0.8%) | 42 (11.1%) |
| 35 to 64 Years | 72 (12.1%) | 44 (7.4%) |
| 65 to 74 Years | 52 (32.9%) | 0 (0.0%) |
| 75 Years and over | 0 (0.0%) | 19 (16.7%) |
Disability Class: Ambulatory Difficulty
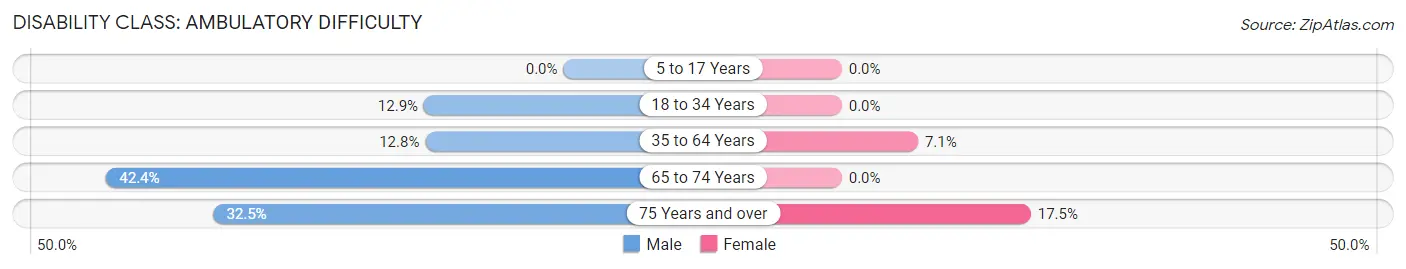
| Age Bracket | Male | Female |
| 5 to 17 Years | 0 (0.0%) | 0 (0.0%) |
| 18 to 34 Years | 48 (12.9%) | 0 (0.0%) |
| 35 to 64 Years | 76 (12.8%) | 42 (7.1%) |
| 65 to 74 Years | 67 (42.4%) | 0 (0.0%) |
| 75 Years and over | 25 (32.5%) | 20 (17.5%) |
Disability Class: Self-Care Difficulty
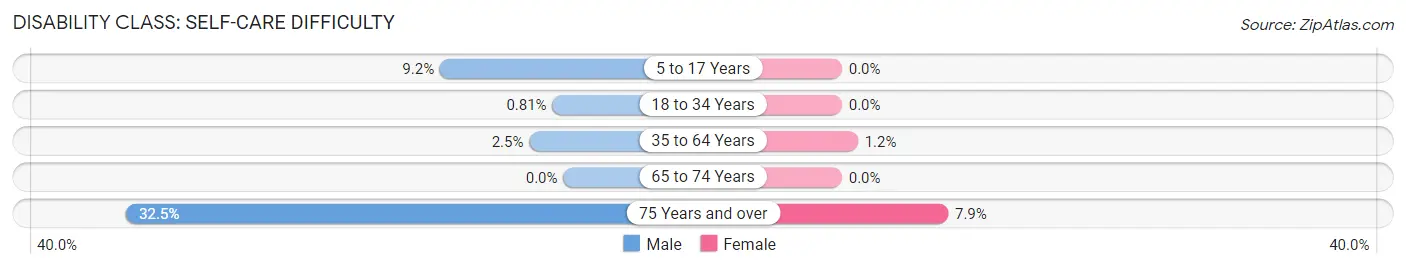
| Age Bracket | Male | Female |
| 5 to 17 Years | 24 (9.2%) | 0 (0.0%) |
| 18 to 34 Years | 3 (0.8%) | 0 (0.0%) |
| 35 to 64 Years | 15 (2.5%) | 7 (1.2%) |
| 65 to 74 Years | 0 (0.0%) | 0 (0.0%) |
| 75 Years and over | 25 (32.5%) | 9 (7.9%) |
Technology Access in Holton
Computing Device Access in Holton
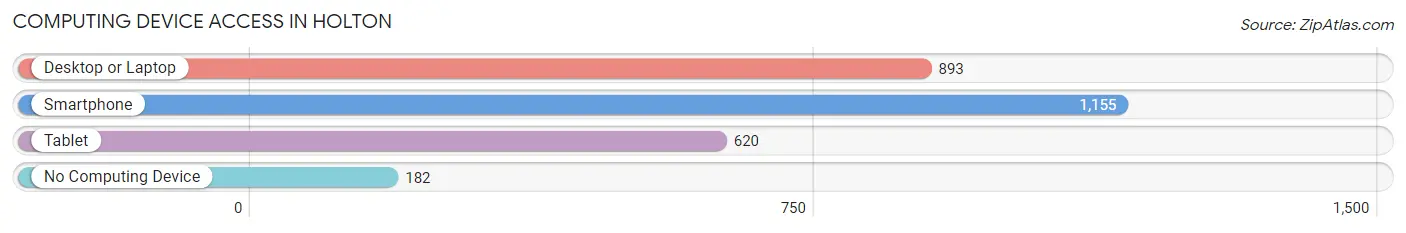
| Device Type | # Households | % Households |
| Desktop or Laptop | 893 | 65.2% |
| Smartphone | 1,155 | 84.4% |
| Tablet | 620 | 45.3% |
| No Computing Device | 182 | 13.3% |
| Total | 1,369 | 100.0% |
Internet Access in Holton
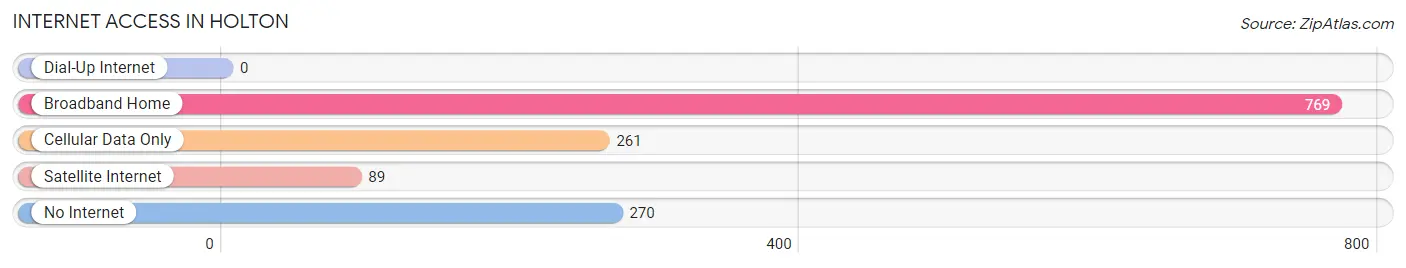
| Internet Type | # Households | % Households |
| Dial-Up Internet | 0 | 0.0% |
| Broadband Home | 769 | 56.2% |
| Cellular Data Only | 261 | 19.1% |
| Satellite Internet | 89 | 6.5% |
| No Internet | 270 | 19.7% |
| Total | 1,369 | 100.0% |
Holton Summary
Holton, Kansas is a small city located in Jackson County, in the northeastern part of the state. It is situated on the banks of the Delaware River, about 25 miles south of Topeka. The city has a population of approximately 3,000 people, and is the county seat of Jackson County.
Holton was founded in 1857 by a group of settlers from Ohio, who named the town after their leader, William Holton. The town was originally a trading post, and the first post office was established in 1858. The town grew rapidly, and by the late 19th century, it had become a major center for the lumber industry. The town was also home to several other industries, including a flour mill, a brickyard, and a canning factory.
Geographically, Holton is located in the rolling hills of the Flint Hills region of Kansas. The city is situated on the banks of the Delaware River, and is surrounded by farmland and woodlands. The climate in Holton is generally mild, with hot summers and cold winters.
The economy of Holton is largely based on agriculture and manufacturing. The city is home to several large agricultural businesses, including a feed mill, a grain elevator, and a dairy. The city also has several manufacturing businesses, including a furniture factory, a printing company, and a plastics factory.
The demographics of Holton are largely white, with a small percentage of African Americans and Hispanics. The median household income in Holton is around $40,000, and the median home value is around $90,000. The city has a low unemployment rate, and the cost of living is relatively low.
Holton is served by several public schools, including Holton High School, Holton Middle School, and Holton Elementary School. The city also has several private schools, including St. Mary's Catholic School and Holton Christian Academy. The city is home to several churches, including the First United Methodist Church, the First Presbyterian Church, and the Holton Bible Church.
Holton is a small city with a rich history and a vibrant economy. It is a great place to live, work, and raise a family. The city has a strong sense of community, and its residents are proud of their hometown.
Common Questions
What is Per Capita Income in Holton?
Per Capita income in Holton is $26,104.
What is the Median Family Income in Holton?
Median Family Income in Holton is $86,875.
What is the Median Household income in Holton?
Median Household Income in Holton is $47,188.
What is Income or Wage Gap in Holton?
Income or Wage Gap in Holton is 39.1%.
Women in Holton earn 60.9 cents for every dollar earned by a man.
What is Inequality or Gini Index in Holton?
Inequality or Gini Index in Holton is 0.41.
What is the Total Population of Holton?
Total Population of Holton is 3,386.
What is the Total Male Population of Holton?
Total Male Population of Holton is 1,643.
What is the Total Female Population of Holton?
Total Female Population of Holton is 1,743.
What is the Ratio of Males per 100 Females in Holton?
There are 94.26 Males per 100 Females in Holton.
What is the Ratio of Females per 100 Males in Holton?
There are 106.09 Females per 100 Males in Holton.
What is the Median Population Age in Holton?
Median Population Age in Holton is 37.6 Years.
What is the Average Family Size in Holton
Average Family Size in Holton is 3.4 People.
What is the Average Household Size in Holton
Average Household Size in Holton is 2.3 People.
How Large is the Labor Force in Holton?
There are 1,750 People in the Labor Forcein in Holton.
What is the Percentage of People in the Labor Force in Holton?
63.7% of People are in the Labor Force in Holton.
What is the Unemployment Rate in Holton?
Unemployment Rate in Holton is 2.8%.