Hoisington, KS Map & Demographics
Hoisington Map
Hoisington Overview
$39,458
PER CAPITA INCOME
$57,440
AVG FAMILY INCOME
$48,110
AVG HOUSEHOLD INCOME
44.4%
WAGE / INCOME GAP [ % ]
55.6¢/ $1
WAGE / INCOME GAP [ $ ]
0.51
INEQUALITY / GINI INDEX
2,675
TOTAL POPULATION
1,427
MALE POPULATION
1,248
FEMALE POPULATION
114.34
MALES / 100 FEMALES
87.46
FEMALES / 100 MALES
38.1
MEDIAN AGE
3.0
AVG FAMILY SIZE
2.3
AVG HOUSEHOLD SIZE
1,229
LABOR FORCE [ PEOPLE ]
58.9%
PERCENT IN LABOR FORCE
4.2%
UNEMPLOYMENT RATE
Hoisington Zip Codes
Hoisington Area Codes
Income in Hoisington
Income Overview in Hoisington
Per Capita Income in Hoisington is $39,458, while median incomes of families and households are $57,440 and $48,110 respectively.
| Characteristic | Number | Measure |
| Per Capita Income | 2,675 | $39,458 |
| Median Family Income | 673 | $57,440 |
| Mean Family Income | 673 | $95,503 |
| Median Household Income | 1,155 | $48,110 |
| Mean Household Income | 1,155 | $72,166 |
| Income Deficit | 673 | $0 |
| Wage / Income Gap (%) | 2,675 | 44.36% |
| Wage / Income Gap ($) | 2,675 | 55.64¢ per $1 |
| Gini / Inequality Index | 2,675 | 0.51 |
Earnings by Sex in Hoisington
Average Earnings in Hoisington are $37,621, $44,359 for men and $24,680 for women, a difference of 44.4%.
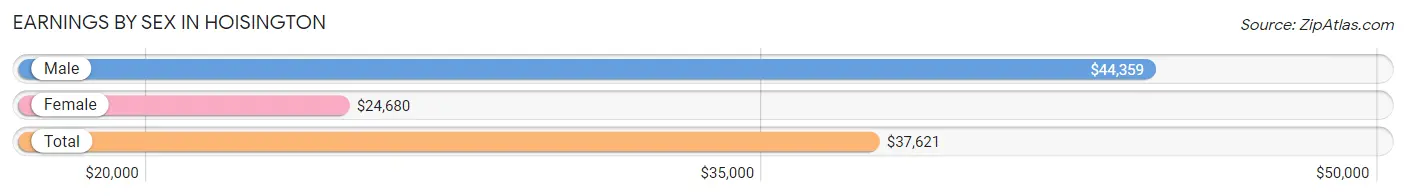
| Sex | Number | Average Earnings |
| Male | 756 (56.5%) | $44,359 |
| Female | 583 (43.5%) | $24,680 |
| Total | 1,339 (100.0%) | $37,621 |
Earnings by Sex by Income Bracket in Hoisington
The most common earnings brackets in Hoisington are $55,000 to $64,999 for men (107 | 14.1%) and $12,500 to $14,999 for women (58 | 10.0%).
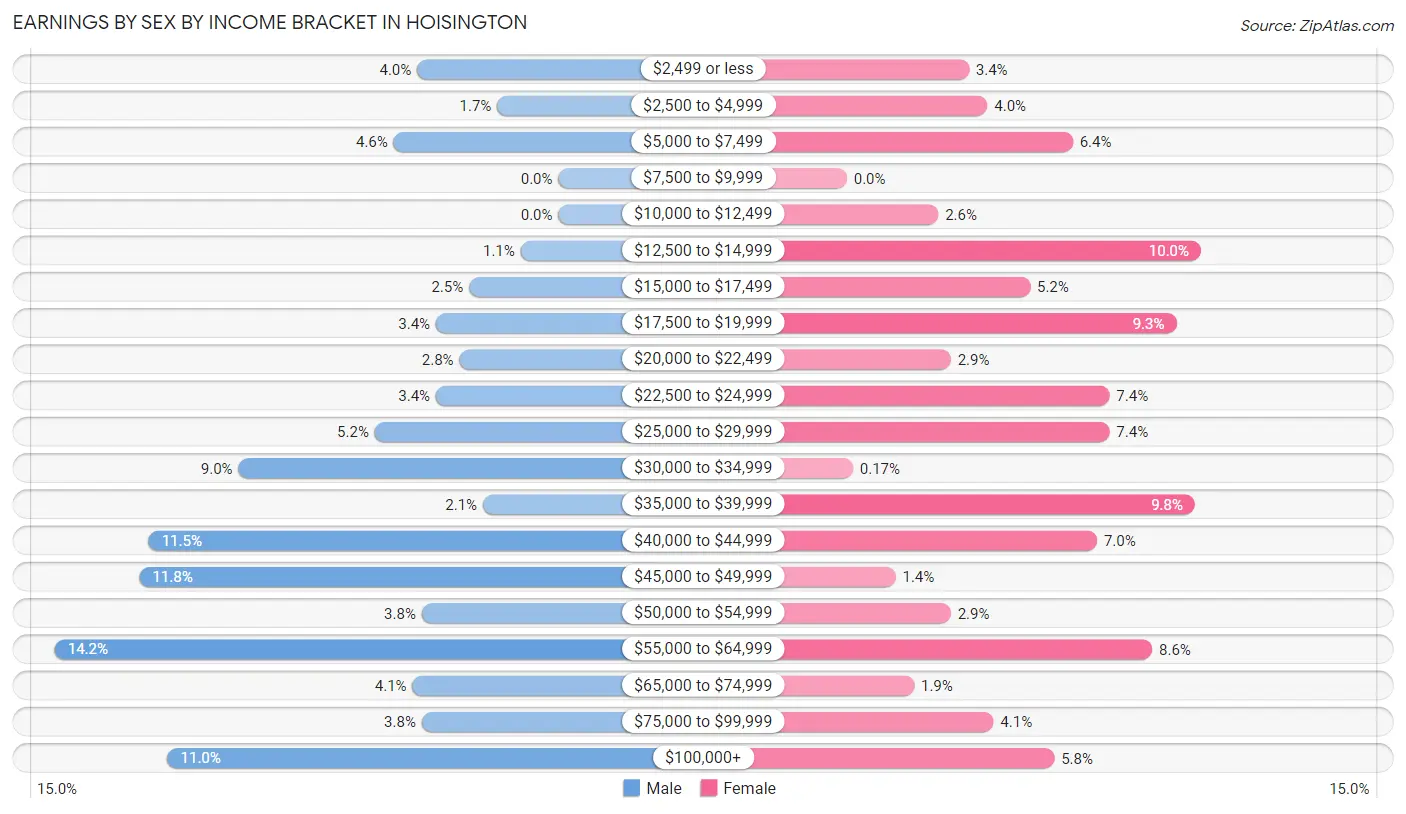
| Income | Male | Female |
| $2,499 or less | 30 (4.0%) | 20 (3.4%) |
| $2,500 to $4,999 | 13 (1.7%) | 23 (4.0%) |
| $5,000 to $7,499 | 35 (4.6%) | 37 (6.4%) |
| $7,500 to $9,999 | 0 (0.0%) | 0 (0.0%) |
| $10,000 to $12,499 | 0 (0.0%) | 15 (2.6%) |
| $12,500 to $14,999 | 8 (1.1%) | 58 (10.0%) |
| $15,000 to $17,499 | 19 (2.5%) | 30 (5.1%) |
| $17,500 to $19,999 | 26 (3.4%) | 54 (9.3%) |
| $20,000 to $22,499 | 21 (2.8%) | 17 (2.9%) |
| $22,500 to $24,999 | 26 (3.4%) | 43 (7.4%) |
| $25,000 to $29,999 | 39 (5.2%) | 43 (7.4%) |
| $30,000 to $34,999 | 68 (9.0%) | 1 (0.2%) |
| $35,000 to $39,999 | 16 (2.1%) | 57 (9.8%) |
| $40,000 to $44,999 | 87 (11.5%) | 41 (7.0%) |
| $45,000 to $49,999 | 89 (11.8%) | 8 (1.4%) |
| $50,000 to $54,999 | 29 (3.8%) | 17 (2.9%) |
| $55,000 to $64,999 | 107 (14.1%) | 50 (8.6%) |
| $65,000 to $74,999 | 31 (4.1%) | 11 (1.9%) |
| $75,000 to $99,999 | 29 (3.8%) | 24 (4.1%) |
| $100,000+ | 83 (11.0%) | 34 (5.8%) |
| Total | 756 (100.0%) | 583 (100.0%) |
Earnings by Sex by Educational Attainment in Hoisington
Average earnings in Hoisington are $45,982 for men and $35,030 for women, a difference of 23.8%. Men with an educational attainment of bachelor's degree enjoy the highest average annual earnings of $47,591, while those with high school diploma education earn the least with $40,673. Women with an educational attainment of graduate degree earn the most with the average annual earnings of $77,250, while those with high school diploma education have the smallest earnings of $21,786.
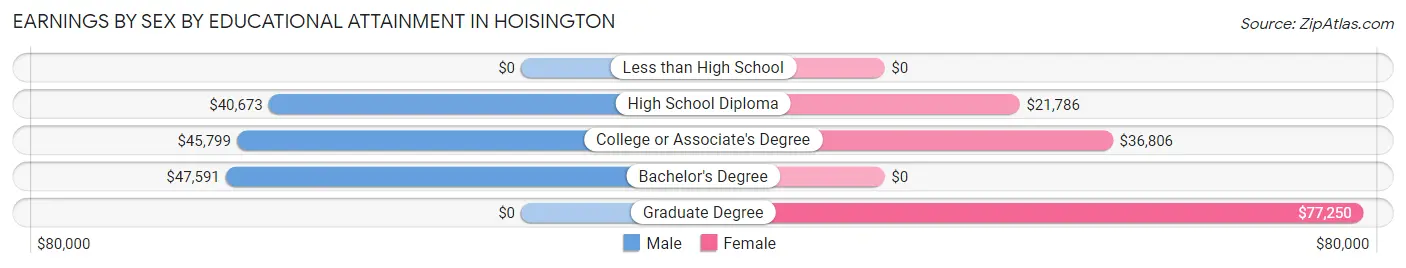
| Educational Attainment | Male Income | Female Income |
| Less than High School | - | - |
| High School Diploma | $40,673 | $21,786 |
| College or Associate's Degree | $45,799 | $36,806 |
| Bachelor's Degree | $47,591 | $0 |
| Graduate Degree | - | - |
| Total | $45,982 | $35,030 |
Family Income in Hoisington
Family Income Brackets in Hoisington
According to the Hoisington family income data, there are 121 families falling into the $50,000 to $74,999 income range, which is the most common income bracket and makes up 18.0% of all families. Conversely, the less than $10,000 income bracket is the least frequent group with only 11 families (1.6%) belonging to this category.
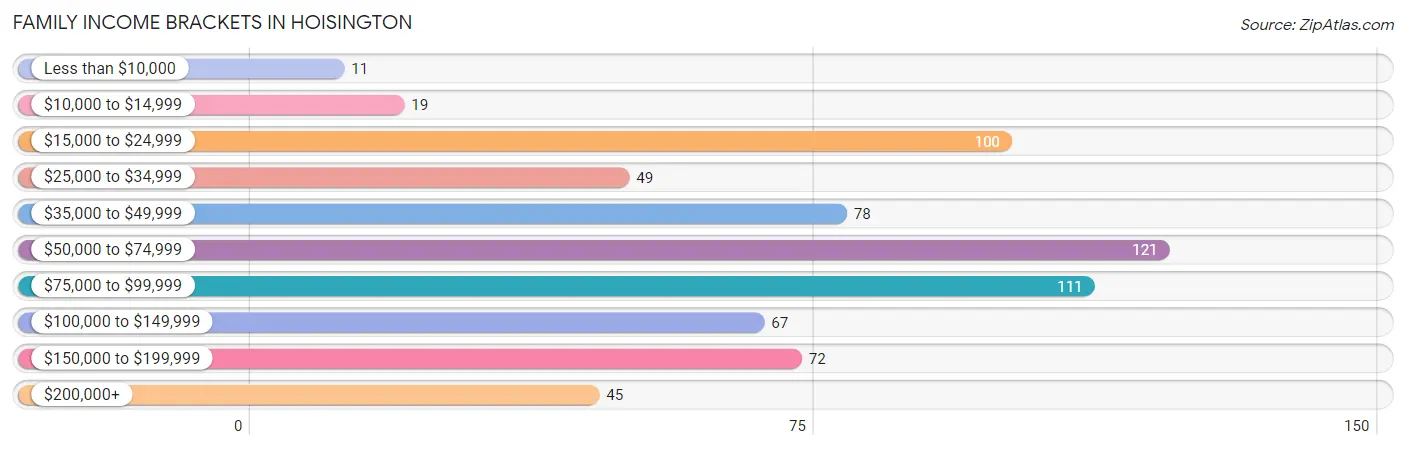
| Income Bracket | # Families | % Families |
| Less than $10,000 | 11 | 1.6% |
| $10,000 to $14,999 | 19 | 2.8% |
| $15,000 to $24,999 | 100 | 14.9% |
| $25,000 to $34,999 | 49 | 7.3% |
| $35,000 to $49,999 | 78 | 11.6% |
| $50,000 to $74,999 | 121 | 18.0% |
| $75,000 to $99,999 | 111 | 16.5% |
| $100,000 to $149,999 | 67 | 10.0% |
| $150,000 to $199,999 | 72 | 10.7% |
| $200,000+ | 45 | 6.7% |
Family Income by Famaliy Size in Hoisington
6-person families (27 | 4.0%) account for the highest median family income in Hoisington with $102,969 per family, while 3-person families (136 | 20.2%) have the highest median income of $28,750 per family member.
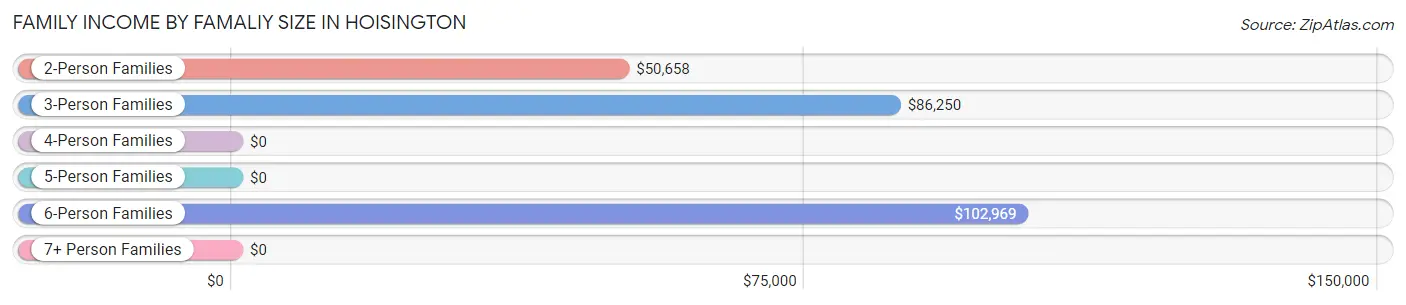
| Income Bracket | # Families | Median Income |
| 2-Person Families | 400 (59.4%) | $50,658 |
| 3-Person Families | 136 (20.2%) | $86,250 |
| 4-Person Families | 70 (10.4%) | $0 |
| 5-Person Families | 37 (5.5%) | $0 |
| 6-Person Families | 27 (4.0%) | $102,969 |
| 7+ Person Families | 3 (0.4%) | $0 |
| Total | 673 (100.0%) | $57,440 |
Family Income by Number of Earners in Hoisington
The median family income in Hoisington is $57,440, with families comprising 3+ earners (43) having the highest median family income of $105,156, while families with 1 earner (263) have the lowest median family income of $41,375, accounting for 6.4% and 39.1% of families, respectively.
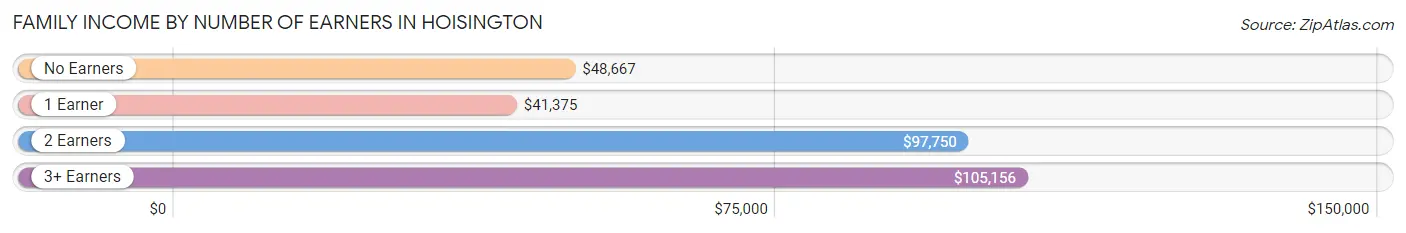
| Number of Earners | # Families | Median Income |
| No Earners | 150 (22.3%) | $48,667 |
| 1 Earner | 263 (39.1%) | $41,375 |
| 2 Earners | 217 (32.2%) | $97,750 |
| 3+ Earners | 43 (6.4%) | $105,156 |
| Total | 673 (100.0%) | $57,440 |
Household Income in Hoisington
Household Income Brackets in Hoisington
With 213 households falling in the category, the $35,000 to $49,999 income range is the most frequent in Hoisington, accounting for 18.4% of all households. In contrast, only 49 households (4.2%) fall into the $200,000+ income bracket, making it the least populous group.
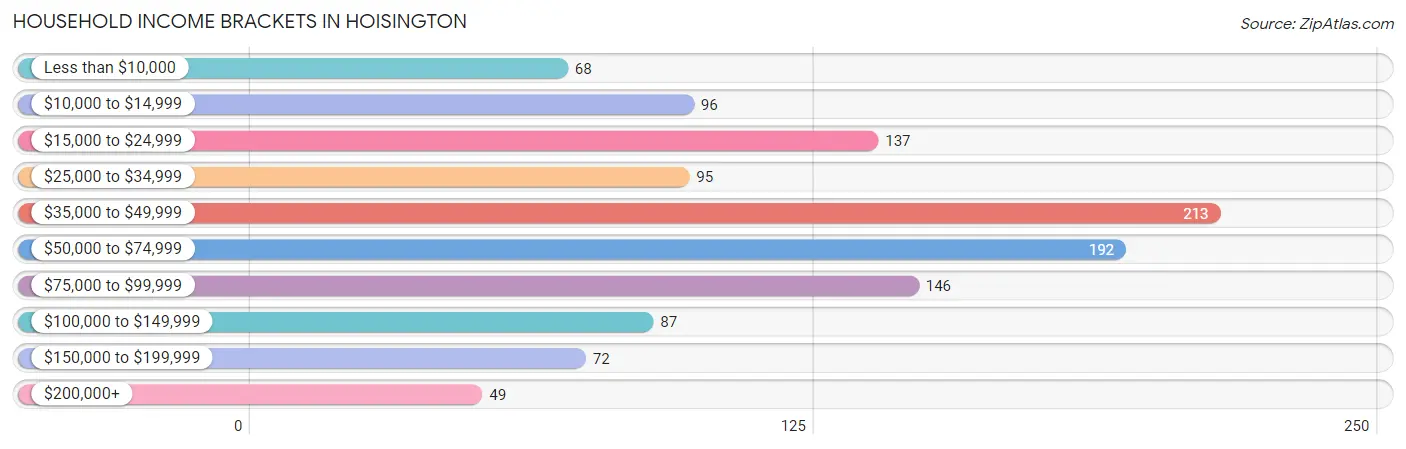
| Income Bracket | # Households | % Households |
| Less than $10,000 | 68 | 5.9% |
| $10,000 to $14,999 | 96 | 8.3% |
| $15,000 to $24,999 | 137 | 11.9% |
| $25,000 to $34,999 | 95 | 8.2% |
| $35,000 to $49,999 | 213 | 18.4% |
| $50,000 to $74,999 | 192 | 16.6% |
| $75,000 to $99,999 | 146 | 12.6% |
| $100,000 to $149,999 | 87 | 7.5% |
| $150,000 to $199,999 | 72 | 6.2% |
| $200,000+ | 49 | 4.2% |
Household Income by Householder Age in Hoisington
The median household income in Hoisington is $48,110, with the highest median household income of $57,443 found in the 45 to 64 years age bracket for the primary householder. A total of 343 households (29.7%) fall into this category. Meanwhile, the 15 to 24 years age bracket for the primary householder has the lowest median household income of $0, with 57 households (4.9%) in this group.
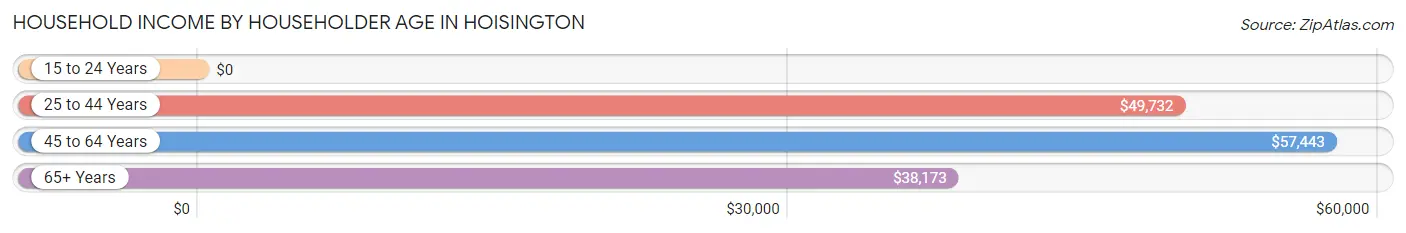
| Income Bracket | # Households | Median Income |
| 15 to 24 Years | 57 (4.9%) | $0 |
| 25 to 44 Years | 354 (30.6%) | $49,732 |
| 45 to 64 Years | 343 (29.7%) | $57,443 |
| 65+ Years | 401 (34.7%) | $38,173 |
| Total | 1,155 (100.0%) | $48,110 |
Poverty in Hoisington
Income Below Poverty by Sex and Age in Hoisington
With 11.7% poverty level for males and 20.2% for females among the residents of Hoisington, 5 year old males and 18 to 24 year old females are the most vulnerable to poverty, with 4 males (30.8%) and 32 females (34.8%) in their respective age groups living below the poverty level.
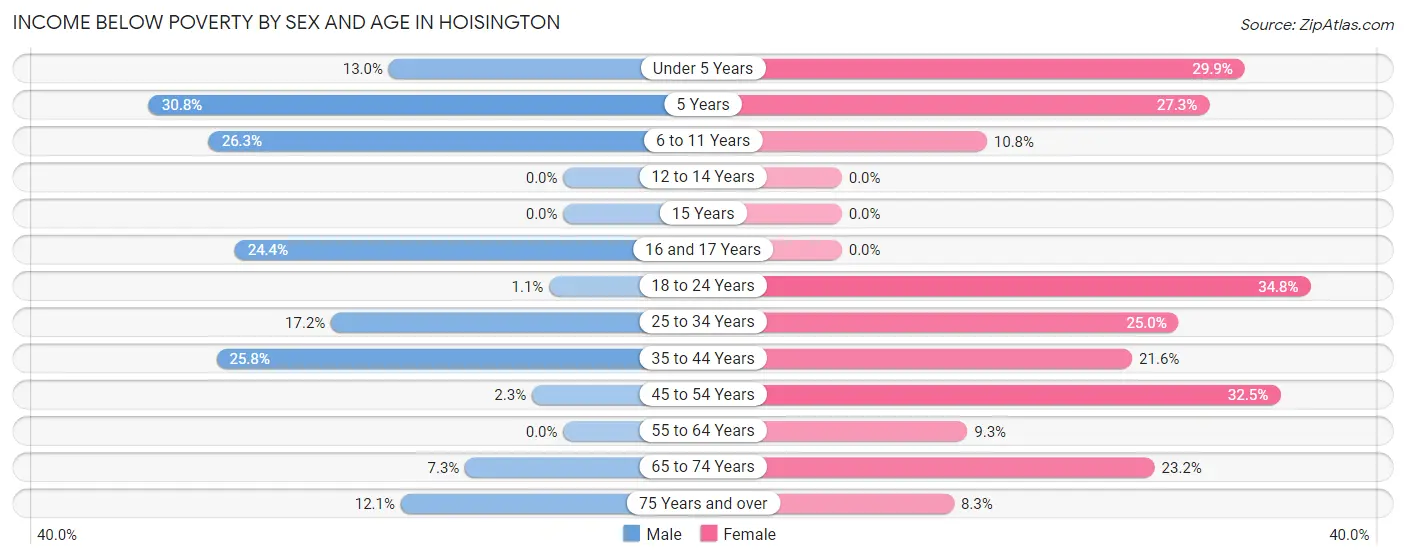
| Age Bracket | Male | Female |
| Under 5 Years | 14 (13.0%) | 32 (29.9%) |
| 5 Years | 4 (30.8%) | 6 (27.3%) |
| 6 to 11 Years | 25 (26.3%) | 7 (10.8%) |
| 12 to 14 Years | 0 (0.0%) | 0 (0.0%) |
| 15 Years | 0 (0.0%) | 0 (0.0%) |
| 16 and 17 Years | 10 (24.4%) | 0 (0.0%) |
| 18 to 24 Years | 1 (1.1%) | 32 (34.8%) |
| 25 to 34 Years | 40 (17.2%) | 34 (25.0%) |
| 35 to 44 Years | 43 (25.8%) | 36 (21.6%) |
| 45 to 54 Years | 2 (2.3%) | 41 (32.5%) |
| 55 to 64 Years | 0 (0.0%) | 15 (9.3%) |
| 65 to 74 Years | 14 (7.3%) | 36 (23.2%) |
| 75 Years and over | 14 (12.1%) | 9 (8.3%) |
| Total | 167 (11.7%) | 248 (20.2%) |
Income Above Poverty by Sex and Age in Hoisington
According to the poverty statistics in Hoisington, males aged 12 to 14 years and females aged 12 to 14 years are the age groups that are most secure financially, with 100.0% of males and 100.0% of females in these age groups living above the poverty line.
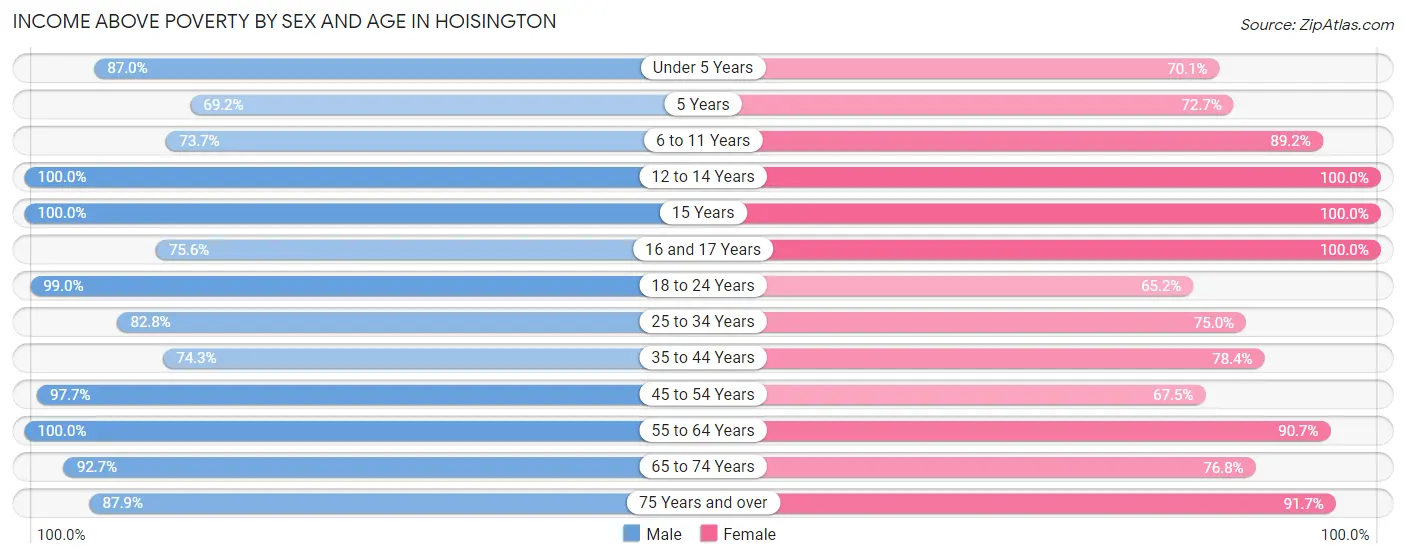
| Age Bracket | Male | Female |
| Under 5 Years | 94 (87.0%) | 75 (70.1%) |
| 5 Years | 9 (69.2%) | 16 (72.7%) |
| 6 to 11 Years | 70 (73.7%) | 58 (89.2%) |
| 12 to 14 Years | 33 (100.0%) | 49 (100.0%) |
| 15 Years | 47 (100.0%) | 27 (100.0%) |
| 16 and 17 Years | 31 (75.6%) | 10 (100.0%) |
| 18 to 24 Years | 94 (99.0%) | 60 (65.2%) |
| 25 to 34 Years | 192 (82.8%) | 102 (75.0%) |
| 35 to 44 Years | 124 (74.3%) | 131 (78.4%) |
| 45 to 54 Years | 84 (97.7%) | 85 (67.5%) |
| 55 to 64 Years | 196 (100.0%) | 146 (90.7%) |
| 65 to 74 Years | 178 (92.7%) | 119 (76.8%) |
| 75 Years and over | 102 (87.9%) | 99 (91.7%) |
| Total | 1,254 (88.2%) | 977 (79.8%) |
Income Below Poverty Among Married-Couple Families in Hoisington
The poverty statistics for married-couple families in Hoisington show that 10.4% or 54 of the total 518 families live below the poverty line. Families with 1 or 2 children have the highest poverty rate of 19.0%, comprising of 34 families. On the other hand, families with no children have the lowest poverty rate of 5.5%, which includes 16 families.
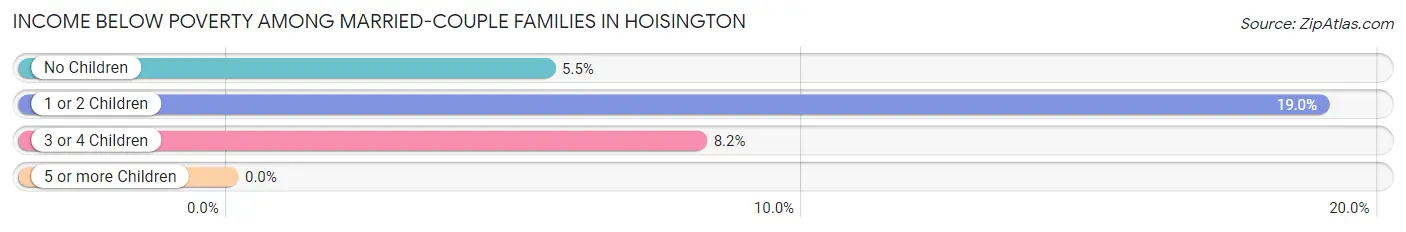
| Children | Above Poverty | Below Poverty |
| No Children | 274 (94.5%) | 16 (5.5%) |
| 1 or 2 Children | 145 (81.0%) | 34 (19.0%) |
| 3 or 4 Children | 45 (91.8%) | 4 (8.2%) |
| 5 or more Children | 0 (0.0%) | 0 (0.0%) |
| Total | 464 (89.6%) | 54 (10.4%) |
Income Below Poverty Among Single-Parent Households in Hoisington
According to the poverty data in Hoisington, 21.4% or 6 single-father households and 57.5% or 73 single-mother households are living below the poverty line. Among single-father households, those with 1 or 2 children have the highest poverty rate, with 6 households (66.7%) experiencing poverty. Likewise, among single-mother households, those with 3 or 4 children have the highest poverty rate, with 3 households (100.0%) falling below the poverty line.
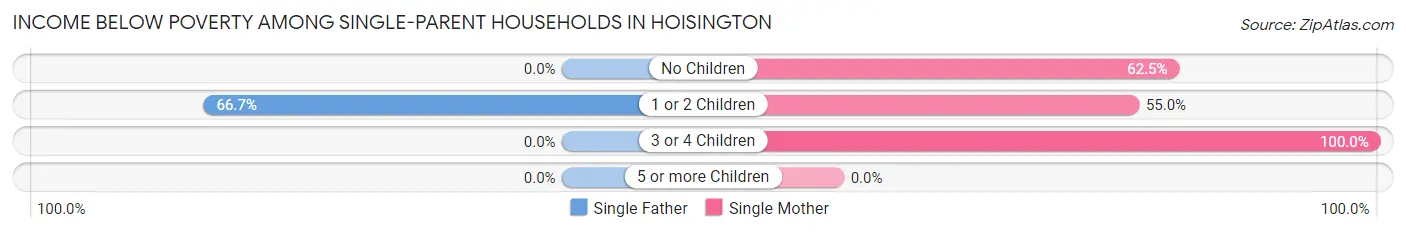
| Children | Single Father | Single Mother |
| No Children | 0 (0.0%) | 15 (62.5%) |
| 1 or 2 Children | 6 (66.7%) | 55 (55.0%) |
| 3 or 4 Children | 0 (0.0%) | 3 (100.0%) |
| 5 or more Children | 0 (0.0%) | 0 (0.0%) |
| Total | 6 (21.4%) | 73 (57.5%) |
Income Below Poverty Among Married-Couple vs Single-Parent Households in Hoisington
The poverty data for Hoisington shows that 54 of the married-couple family households (10.4%) and 79 of the single-parent households (51.0%) are living below the poverty level. Within the married-couple family households, those with 1 or 2 children have the highest poverty rate, with 34 households (19.0%) falling below the poverty line. Among the single-parent households, those with 1 or 2 children have the highest poverty rate, with 61 household (56.0%) living below poverty.
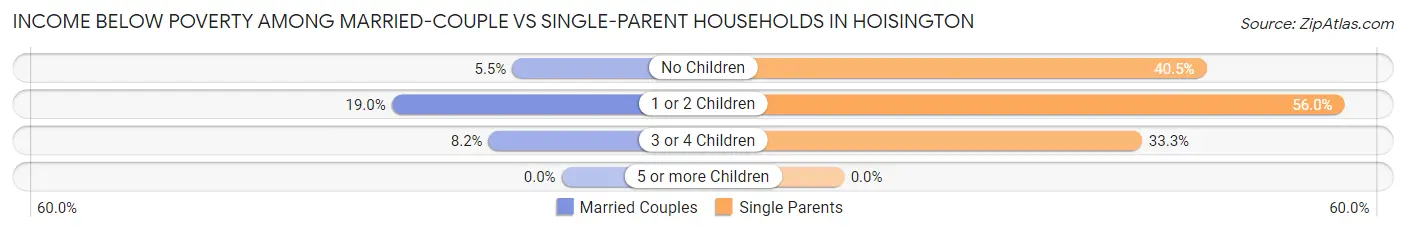
| Children | Married-Couple Families | Single-Parent Households |
| No Children | 16 (5.5%) | 15 (40.5%) |
| 1 or 2 Children | 34 (19.0%) | 61 (56.0%) |
| 3 or 4 Children | 4 (8.2%) | 3 (33.3%) |
| 5 or more Children | 0 (0.0%) | 0 (0.0%) |
| Total | 54 (10.4%) | 79 (51.0%) |
Race in Hoisington
The most populous races in Hoisington are White / Caucasian (2,485 | 92.9%), Hispanic or Latino (146 | 5.5%), and Two or more Races (91 | 3.4%).
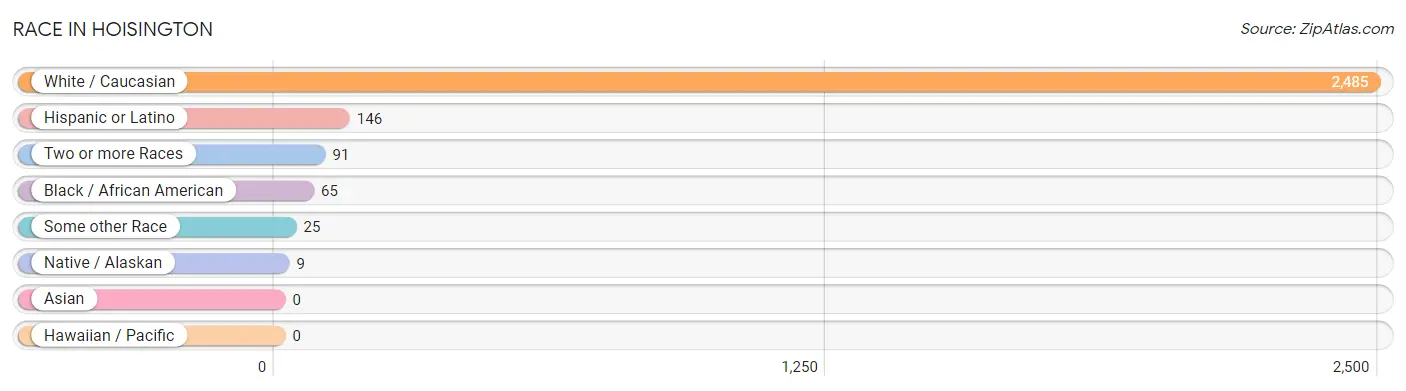
| Race | # Population | % Population |
| Asian | 0 | 0.0% |
| Black / African American | 65 | 2.4% |
| Hawaiian / Pacific | 0 | 0.0% |
| Hispanic or Latino | 146 | 5.5% |
| Native / Alaskan | 9 | 0.3% |
| White / Caucasian | 2,485 | 92.9% |
| Two or more Races | 91 | 3.4% |
| Some other Race | 25 | 0.9% |
| Total | 2,675 | 100.0% |
Ancestry in Hoisington
The most populous ancestries reported in Hoisington are German (803 | 30.0%), Irish (236 | 8.8%), Mexican (143 | 5.3%), American (121 | 4.5%), and English (120 | 4.5%), together accounting for 53.2% of all Hoisington residents.
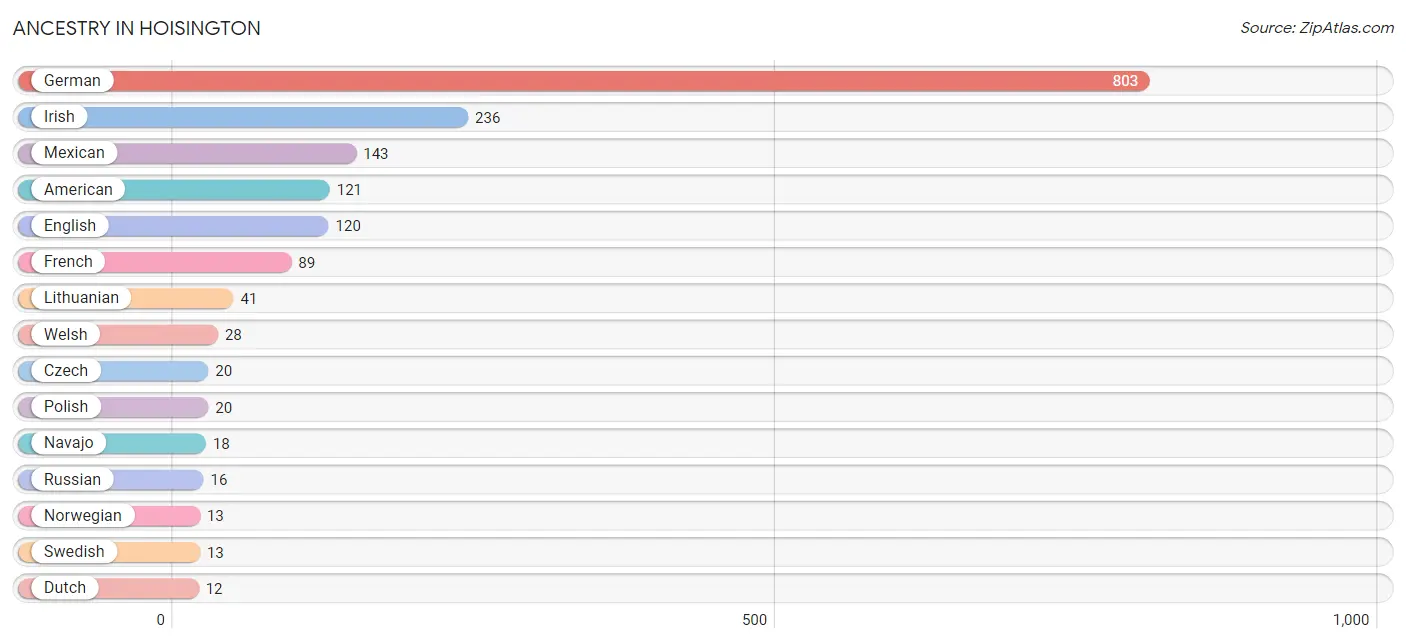
| Ancestry | # Population | % Population |
| African | 1 | 0.0% |
| American | 121 | 4.5% |
| Arab | 7 | 0.3% |
| Armenian | 1 | 0.0% |
| Austrian | 10 | 0.4% |
| Cherokee | 9 | 0.3% |
| Czech | 20 | 0.7% |
| Danish | 5 | 0.2% |
| Dutch | 12 | 0.4% |
| English | 120 | 4.5% |
| European | 7 | 0.3% |
| French | 89 | 3.3% |
| German | 803 | 30.0% |
| German Russian | 8 | 0.3% |
| Irish | 236 | 8.8% |
| Italian | 12 | 0.4% |
| Lebanese | 7 | 0.3% |
| Lithuanian | 41 | 1.5% |
| Mexican | 143 | 5.3% |
| Navajo | 18 | 0.7% |
| Nigerian | 11 | 0.4% |
| Norwegian | 13 | 0.5% |
| Polish | 20 | 0.7% |
| Russian | 16 | 0.6% |
| Scottish | 1 | 0.0% |
| Spaniard | 3 | 0.1% |
| Subsaharan African | 12 | 0.4% |
| Swedish | 13 | 0.5% |
| Swiss | 5 | 0.2% |
| Welsh | 28 | 1.1% | View All 30 Rows |
Immigrants in Hoisington
The most numerous immigrant groups reported in Hoisington came from Africa (11 | 0.4%), Nigeria (11 | 0.4%), Western Africa (11 | 0.4%), Central America (2 | 0.1%), and Latin America (2 | 0.1%), together accounting for 1.4% of all Hoisington residents.
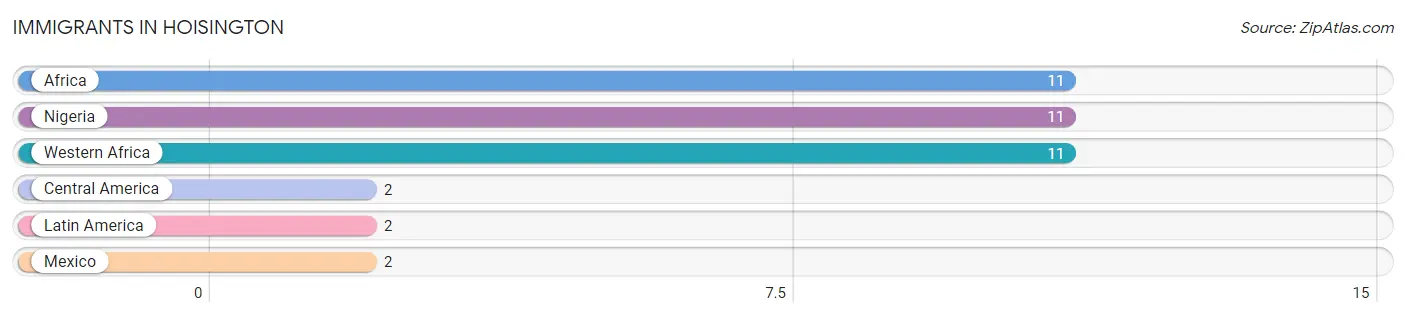
| Immigration Origin | # Population | % Population |
| Africa | 11 | 0.4% |
| Central America | 2 | 0.1% |
| Latin America | 2 | 0.1% |
| Mexico | 2 | 0.1% |
| Nigeria | 11 | 0.4% |
| Western Africa | 11 | 0.4% | View All 6 Rows |
Sex and Age in Hoisington
Sex and Age in Hoisington
The most populous age groups in Hoisington are 65 to 69 Years (154 | 10.8%) for men and 65 to 69 Years (108 | 8.6%) for women.
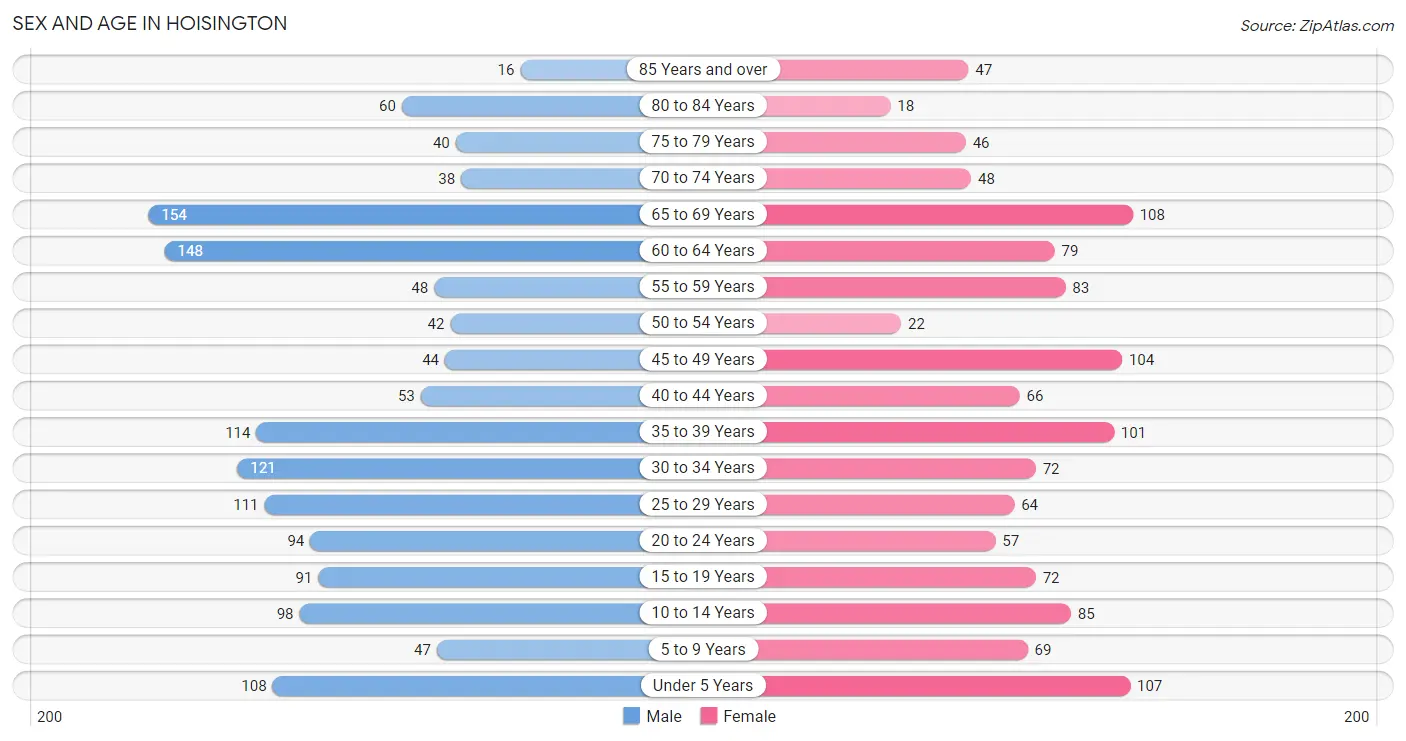
| Age Bracket | Male | Female |
| Under 5 Years | 108 (7.6%) | 107 (8.6%) |
| 5 to 9 Years | 47 (3.3%) | 69 (5.5%) |
| 10 to 14 Years | 98 (6.9%) | 85 (6.8%) |
| 15 to 19 Years | 91 (6.4%) | 72 (5.8%) |
| 20 to 24 Years | 94 (6.6%) | 57 (4.6%) |
| 25 to 29 Years | 111 (7.8%) | 64 (5.1%) |
| 30 to 34 Years | 121 (8.5%) | 72 (5.8%) |
| 35 to 39 Years | 114 (8.0%) | 101 (8.1%) |
| 40 to 44 Years | 53 (3.7%) | 66 (5.3%) |
| 45 to 49 Years | 44 (3.1%) | 104 (8.3%) |
| 50 to 54 Years | 42 (2.9%) | 22 (1.8%) |
| 55 to 59 Years | 48 (3.4%) | 83 (6.7%) |
| 60 to 64 Years | 148 (10.4%) | 79 (6.3%) |
| 65 to 69 Years | 154 (10.8%) | 108 (8.6%) |
| 70 to 74 Years | 38 (2.7%) | 48 (3.8%) |
| 75 to 79 Years | 40 (2.8%) | 46 (3.7%) |
| 80 to 84 Years | 60 (4.2%) | 18 (1.4%) |
| 85 Years and over | 16 (1.1%) | 47 (3.8%) |
| Total | 1,427 (100.0%) | 1,248 (100.0%) |
Families and Households in Hoisington
Median Family Size in Hoisington
The median family size in Hoisington is 3.00 persons per family, with single male/father families (28 | 4.2%) accounting for the largest median family size of 3.39 persons per family. On the other hand, single female/mother families (127 | 18.9%) represent the smallest median family size with 2.65 persons per family.
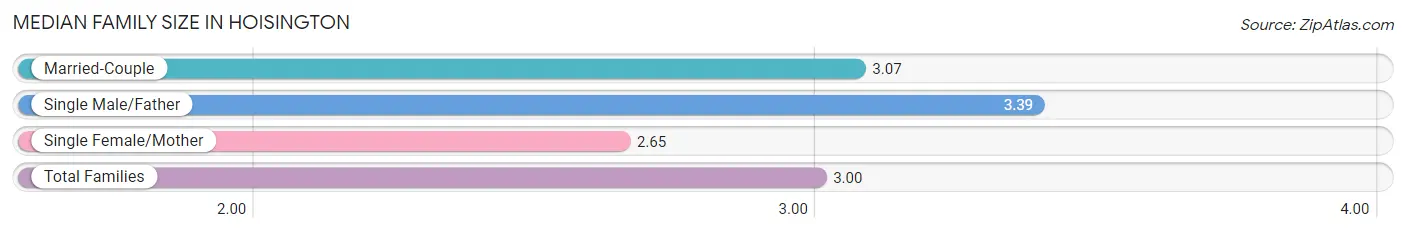
| Family Type | # Families | Family Size |
| Married-Couple | 518 (77.0%) | 3.07 |
| Single Male/Father | 28 (4.2%) | 3.39 |
| Single Female/Mother | 127 (18.9%) | 2.65 |
| Total Families | 673 (100.0%) | 3.00 |
Median Household Size in Hoisington
The median household size in Hoisington is 2.31 persons per household, with single male/father households (28 | 2.4%) accounting for the largest median household size of 3.71 persons per household. non-family households (482 | 41.7%) represent the smallest median household size with 1.12 persons per household.
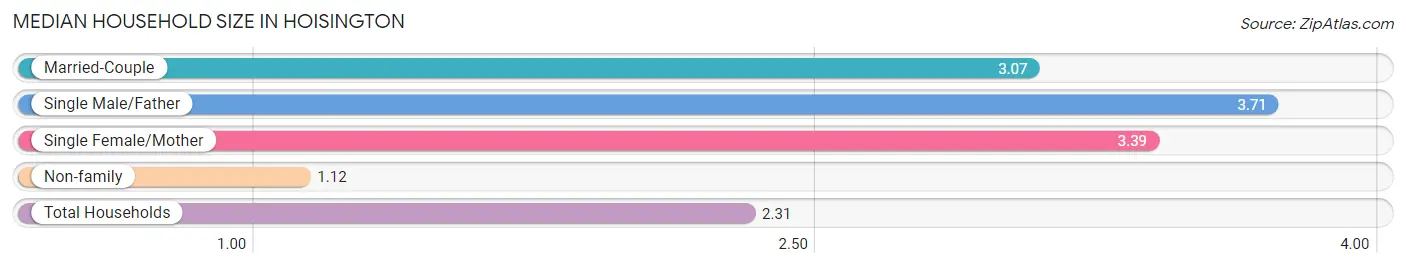
| Household Type | # Households | Household Size |
| Married-Couple | 518 (44.9%) | 3.07 |
| Single Male/Father | 28 (2.4%) | 3.71 |
| Single Female/Mother | 127 (11.0%) | 3.39 |
| Non-family | 482 (41.7%) | 1.12 |
| Total Households | 1,155 (100.0%) | 2.31 |
Household Size by Marriage Status in Hoisington
Out of a total of 1,155 households in Hoisington, 673 (58.3%) are family households, while 482 (41.7%) are nonfamily households. The most numerous type of family households are 2-person households, comprising 345, and the most common type of nonfamily households are 1-person households, comprising 456.
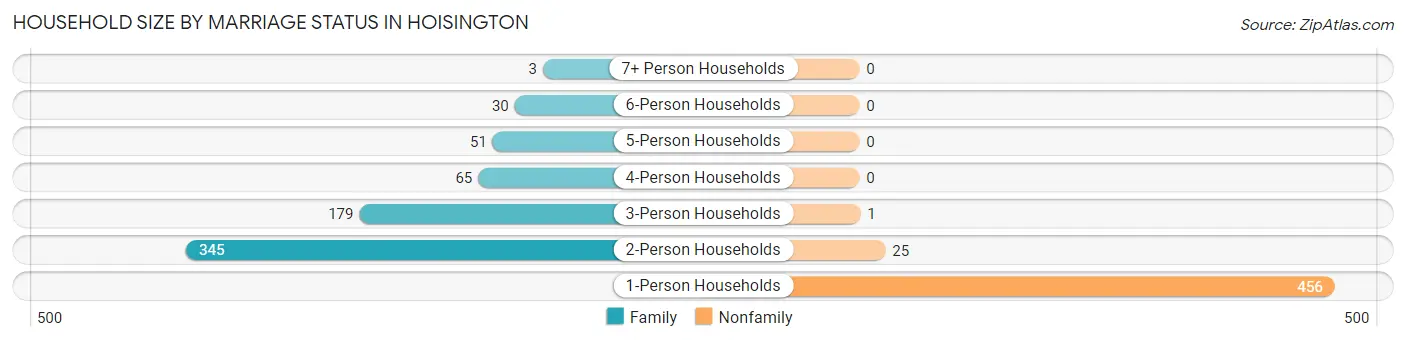
| Household Size | Family Households | Nonfamily Households |
| 1-Person Households | - | 456 (39.5%) |
| 2-Person Households | 345 (29.9%) | 25 (2.2%) |
| 3-Person Households | 179 (15.5%) | 1 (0.1%) |
| 4-Person Households | 65 (5.6%) | 0 (0.0%) |
| 5-Person Households | 51 (4.4%) | 0 (0.0%) |
| 6-Person Households | 30 (2.6%) | 0 (0.0%) |
| 7+ Person Households | 3 (0.3%) | 0 (0.0%) |
| Total | 673 (58.3%) | 482 (41.7%) |
Female Fertility in Hoisington
Fertility by Age in Hoisington
Average fertility rate in Hoisington is 108.0 births per 1,000 women. Women in the age bracket of 20 to 34 years have the highest fertility rate with 290.0 births per 1,000 women. Women in the age bracket of 20 to 34 years acount for 96.6% of all women with births.
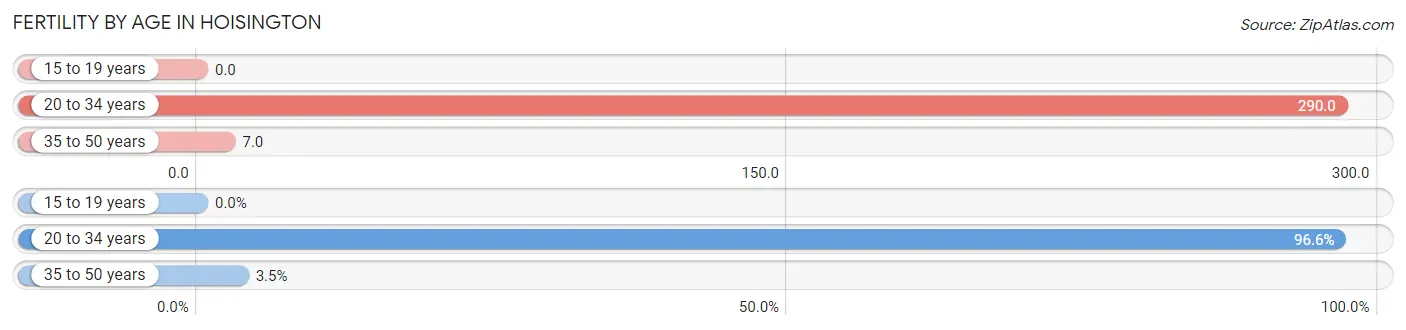
| Age Bracket | Women with Births | Births / 1,000 Women |
| 15 to 19 years | 0 (0.0%) | 0.0 |
| 20 to 34 years | 56 (96.6%) | 290.0 |
| 35 to 50 years | 2 (3.5%) | 7.0 |
| Total | 58 (100.0%) | 108.0 |
Fertility by Age by Marriage Status in Hoisington
44.8% of women with births (58) in Hoisington are married. The highest percentage of unmarried women with births falls into 20 to 34 years age bracket with 57.1% of them unmarried at the time of birth, while the lowest percentage of unmarried women with births belong to 35 to 50 years age bracket with 0.0% of them unmarried.
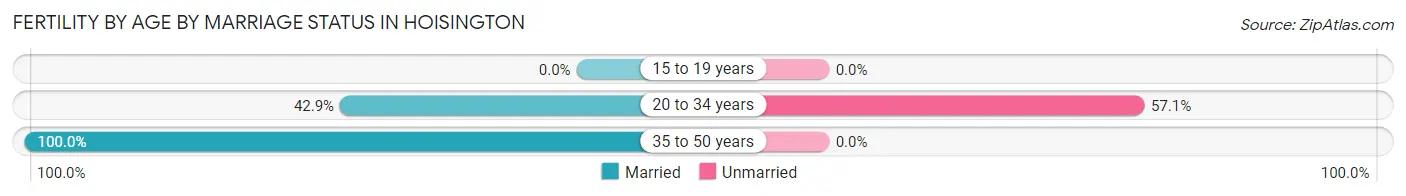
| Age Bracket | Married | Unmarried |
| 15 to 19 years | 0 (0.0%) | 0 (0.0%) |
| 20 to 34 years | 24 (42.9%) | 32 (57.1%) |
| 35 to 50 years | 2 (100.0%) | 0 (0.0%) |
| Total | 26 (44.8%) | 32 (55.2%) |
Fertility by Education in Hoisington
Average fertility rate in Hoisington is 108.0 births per 1,000 women. Women with the education attainment of college or associate's degree have the highest fertility rate of 176.0 births per 1,000 women, while women with the education attainment of high school diploma have the lowest fertility at 16.0 births per 1,000 women. Women with the education attainment of college or associate's degree represent 67.2% of all women with births.
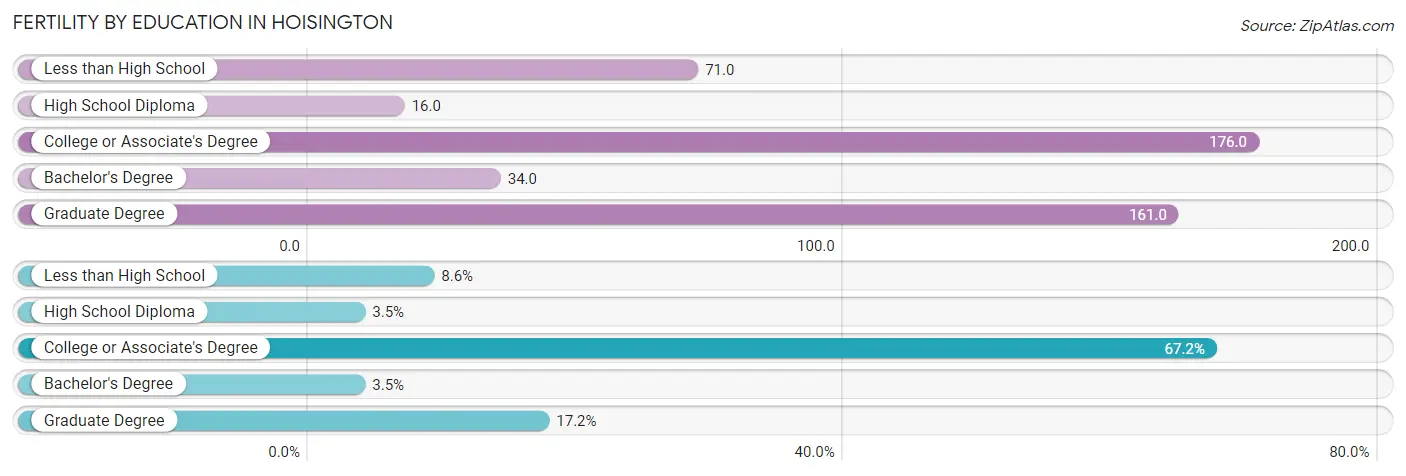
| Educational Attainment | Women with Births | Births / 1,000 Women |
| Less than High School | 5 (8.6%) | 71.0 |
| High School Diploma | 2 (3.5%) | 16.0 |
| College or Associate's Degree | 39 (67.2%) | 176.0 |
| Bachelor's Degree | 2 (3.5%) | 34.0 |
| Graduate Degree | 10 (17.2%) | 161.0 |
| Total | 58 (100.0%) | 108.0 |
Fertility by Education by Marriage Status in Hoisington
55.2% of women with births in Hoisington are unmarried. Women with the educational attainment of less than high school are most likely to be married with 100.0% of them married at childbirth, while women with the educational attainment of high school diploma are least likely to be married with 100.0% of them unmarried at childbirth.
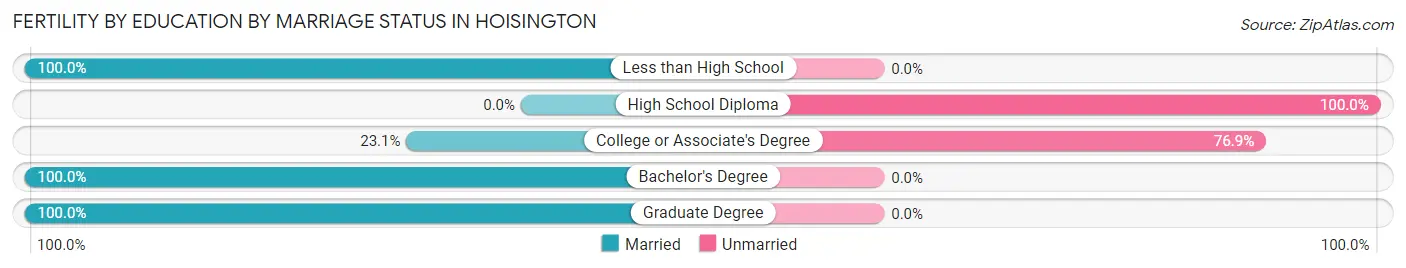
| Educational Attainment | Married | Unmarried |
| Less than High School | 5 (100.0%) | 0 (0.0%) |
| High School Diploma | 0 (0.0%) | 2 (100.0%) |
| College or Associate's Degree | 9 (23.1%) | 30 (76.9%) |
| Bachelor's Degree | 2 (100.0%) | 0 (0.0%) |
| Graduate Degree | 10 (100.0%) | 0 (0.0%) |
| Total | 26 (44.8%) | 32 (55.2%) |
Employment Characteristics in Hoisington
Employment by Class of Employer in Hoisington
Among the 1,173 employed individuals in Hoisington, private company employees (832 | 70.9%), not-for-profit organizations (137 | 11.7%), and state government employees (67 | 5.7%) make up the most common classes of employment.
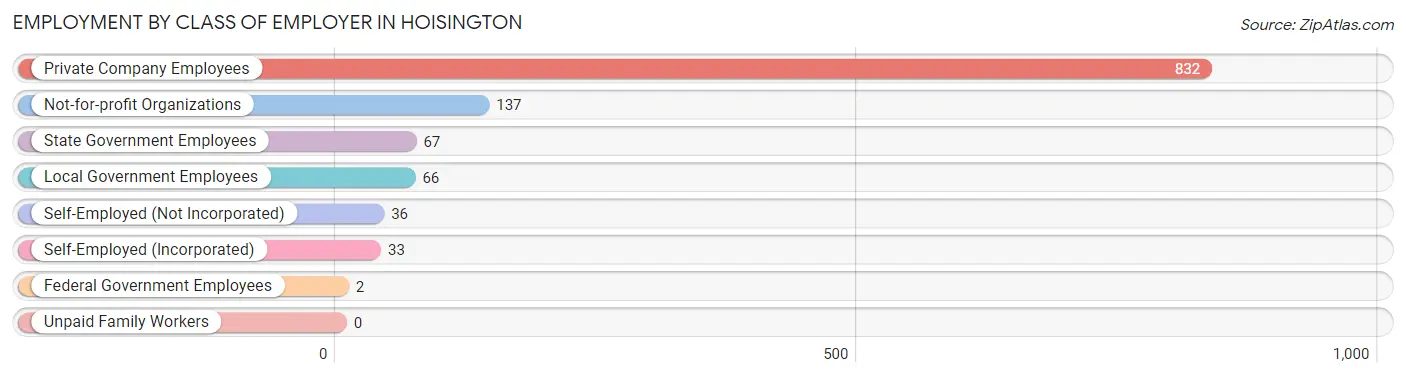
| Employer Class | # Employees | % Employees |
| Private Company Employees | 832 | 70.9% |
| Self-Employed (Incorporated) | 33 | 2.8% |
| Self-Employed (Not Incorporated) | 36 | 3.1% |
| Not-for-profit Organizations | 137 | 11.7% |
| Local Government Employees | 66 | 5.6% |
| State Government Employees | 67 | 5.7% |
| Federal Government Employees | 2 | 0.2% |
| Unpaid Family Workers | 0 | 0.0% |
| Total | 1,173 | 100.0% |
Employment Status by Age in Hoisington
According to the labor force statistics for Hoisington, out of the total population over 16 years of age (2,087), 58.9% or 1,229 individuals are in the labor force, with 4.2% or 52 of them unemployed. The age group with the highest labor force participation rate is 25 to 29 years, with 89.7% or 157 individuals in the labor force. Within the labor force, the 16 to 19 years age range has the highest percentage of unemployed individuals, with 15.6% or 7 of them being unemployed.
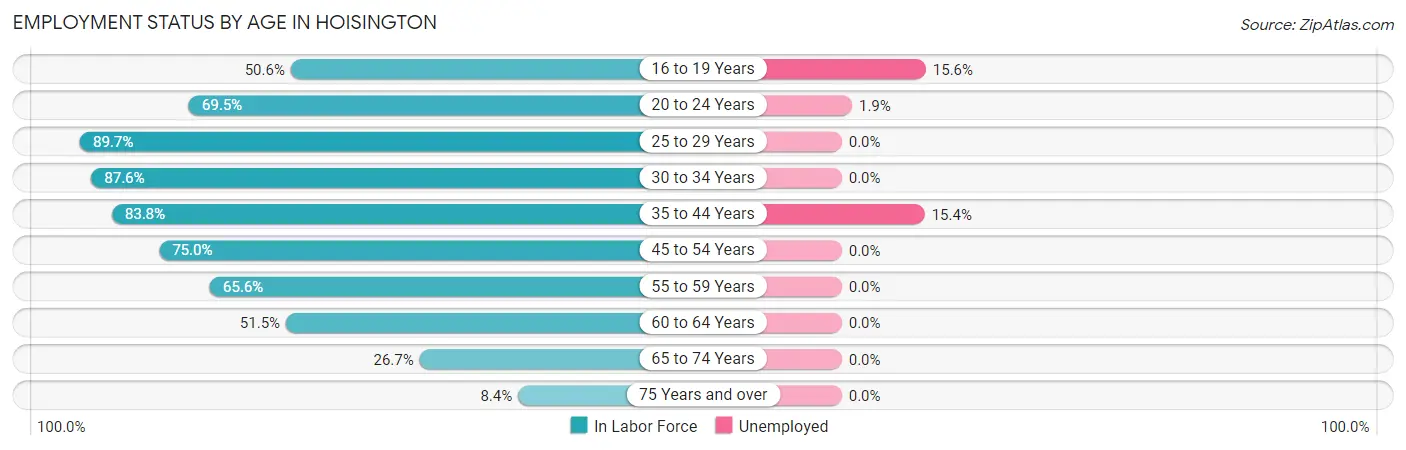
| Age Bracket | In Labor Force | Unemployed |
| 16 to 19 Years | 45 (50.6%) | 7 (15.6%) |
| 20 to 24 Years | 105 (69.5%) | 2 (1.9%) |
| 25 to 29 Years | 157 (89.7%) | 0 (0.0%) |
| 30 to 34 Years | 169 (87.6%) | 0 (0.0%) |
| 35 to 44 Years | 280 (83.8%) | 43 (15.4%) |
| 45 to 54 Years | 159 (75.0%) | 0 (0.0%) |
| 55 to 59 Years | 86 (65.6%) | 0 (0.0%) |
| 60 to 64 Years | 117 (51.5%) | 0 (0.0%) |
| 65 to 74 Years | 93 (26.7%) | 0 (0.0%) |
| 75 Years and over | 19 (8.4%) | 0 (0.0%) |
| Total | 1,229 (58.9%) | 52 (4.2%) |
Employment Status by Educational Attainment in Hoisington
According to labor force statistics for Hoisington, 76.1% of individuals (968) out of the total population between 25 and 64 years of age (1,272) are in the labor force, with 4.4% or 43 of them being unemployed. The group with the highest labor force participation rate are those with the educational attainment of bachelor's degree or higher, with 95.5% or 298 individuals in the labor force. Within the labor force, individuals with high school diploma education have the highest percentage of unemployment, with 16.8% or 32 of them being unemployed.
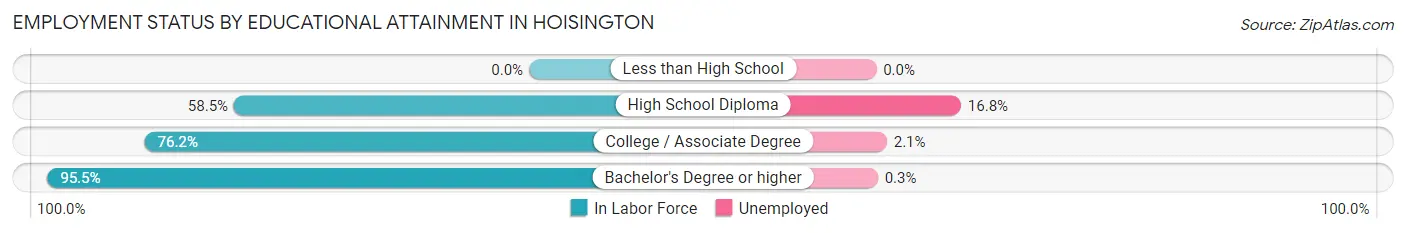
| Educational Attainment | In Labor Force | Unemployed |
| Less than High School | 0 (0.0%) | 0 (0.0%) |
| High School Diploma | 190 (58.5%) | 55 (16.8%) |
| College / Associate Degree | 480 (76.2%) | 13 (2.1%) |
| Bachelor's Degree or higher | 298 (95.5%) | 1 (0.3%) |
| Total | 968 (76.1%) | 56 (4.4%) |
Employment Occupations by Sex in Hoisington
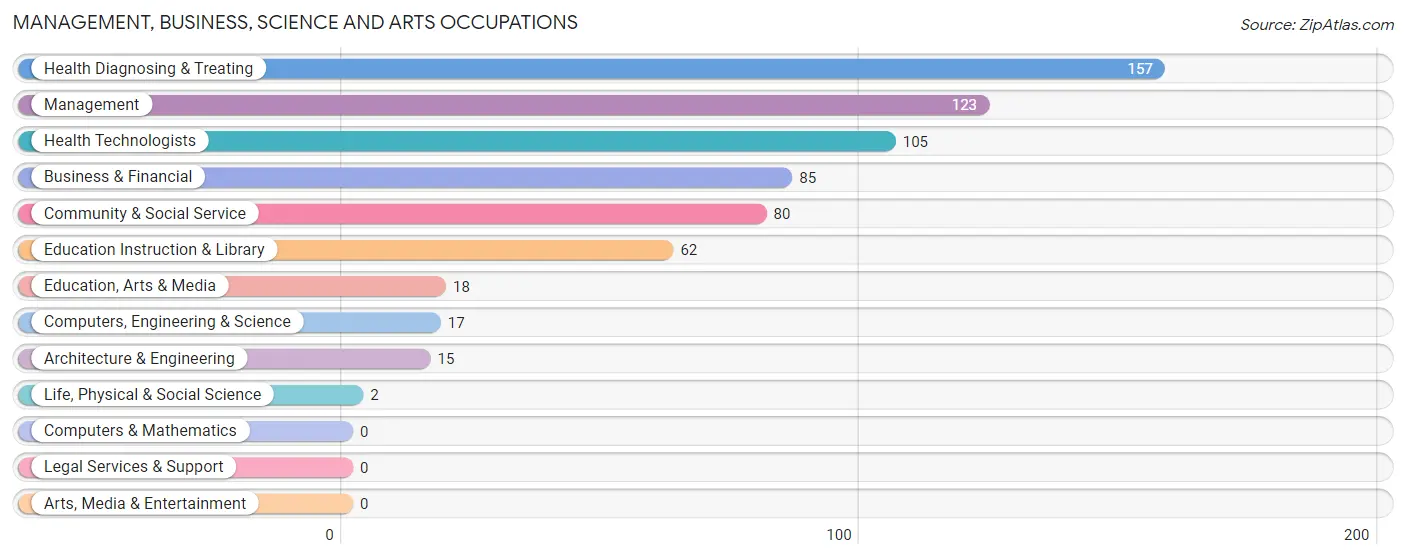
Management, Business, Science and Arts Occupations
The most common Management, Business, Science and Arts occupations in Hoisington are Health Diagnosing & Treating (157 | 13.3%), Management (123 | 10.4%), Health Technologists (105 | 8.9%), Business & Financial (85 | 7.2%), and Community & Social Service (80 | 6.8%).
Management, Business, Science and Arts Occupations by Sex
Within the Management, Business, Science and Arts occupations in Hoisington, the most male-oriented occupations are Architecture & Engineering (100.0%), Computers, Engineering & Science (88.2%), and Business & Financial (65.9%), while the most female-oriented occupations are Life, Physical & Social Science (100.0%), Health Diagnosing & Treating (70.7%), and Education Instruction & Library (61.3%).
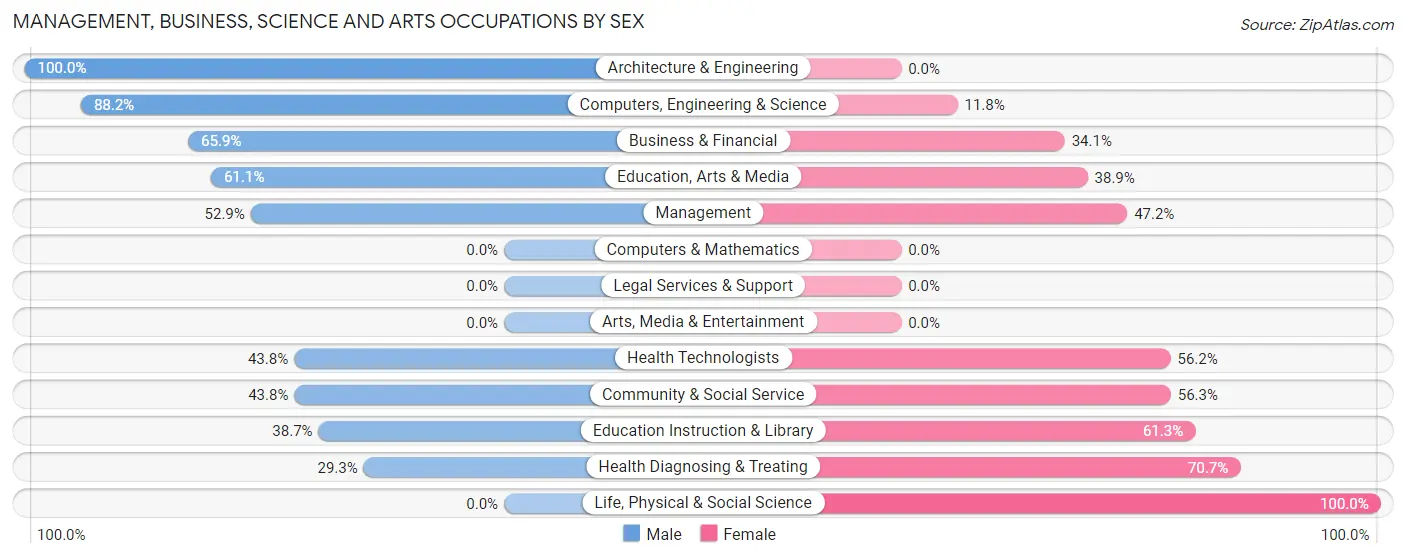
| Occupation | Male | Female |
| Management | 65 (52.8%) | 58 (47.1%) |
| Business & Financial | 56 (65.9%) | 29 (34.1%) |
| Computers, Engineering & Science | 15 (88.2%) | 2 (11.8%) |
| Computers & Mathematics | 0 (0.0%) | 0 (0.0%) |
| Architecture & Engineering | 15 (100.0%) | 0 (0.0%) |
| Life, Physical & Social Science | 0 (0.0%) | 2 (100.0%) |
| Community & Social Service | 35 (43.8%) | 45 (56.2%) |
| Education, Arts & Media | 11 (61.1%) | 7 (38.9%) |
| Legal Services & Support | 0 (0.0%) | 0 (0.0%) |
| Education Instruction & Library | 24 (38.7%) | 38 (61.3%) |
| Arts, Media & Entertainment | 0 (0.0%) | 0 (0.0%) |
| Health Diagnosing & Treating | 46 (29.3%) | 111 (70.7%) |
| Health Technologists | 46 (43.8%) | 59 (56.2%) |
| Total (Category) | 217 (47.0%) | 245 (53.0%) |
| Total (Overall) | 687 (58.3%) | 491 (41.7%) |
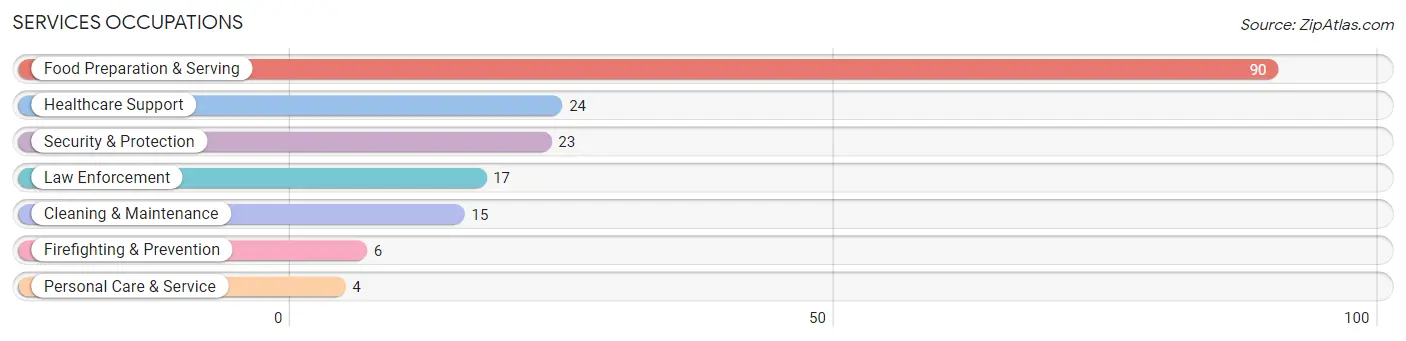
Services Occupations
The most common Services occupations in Hoisington are Food Preparation & Serving (90 | 7.6%), Healthcare Support (24 | 2.0%), Security & Protection (23 | 1.9%), Law Enforcement (17 | 1.4%), and Cleaning & Maintenance (15 | 1.3%).
Services Occupations by Sex
Within the Services occupations in Hoisington, the most male-oriented occupations are Security & Protection (100.0%), Firefighting & Prevention (100.0%), and Law Enforcement (100.0%), while the most female-oriented occupations are Healthcare Support (100.0%), and Food Preparation & Serving (74.4%).
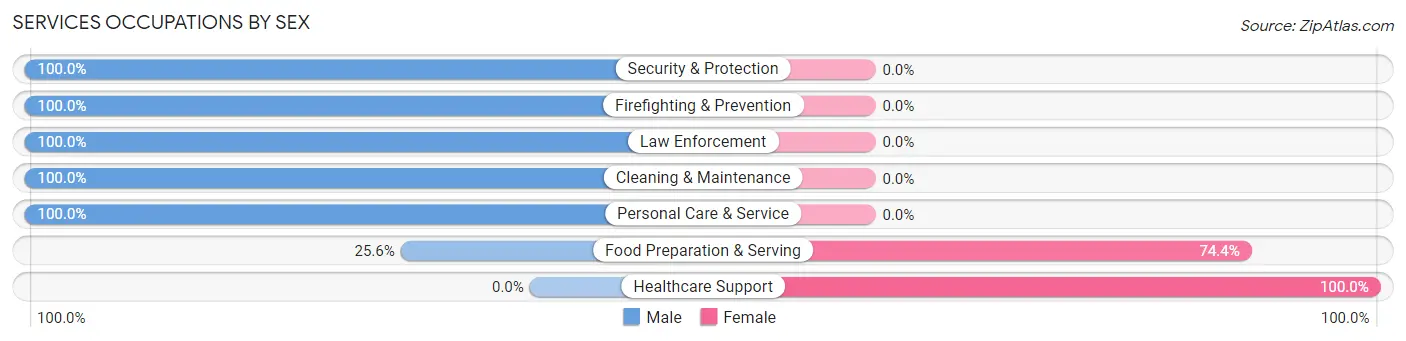
| Occupation | Male | Female |
| Healthcare Support | 0 (0.0%) | 24 (100.0%) |
| Security & Protection | 23 (100.0%) | 0 (0.0%) |
| Firefighting & Prevention | 6 (100.0%) | 0 (0.0%) |
| Law Enforcement | 17 (100.0%) | 0 (0.0%) |
| Food Preparation & Serving | 23 (25.6%) | 67 (74.4%) |
| Cleaning & Maintenance | 15 (100.0%) | 0 (0.0%) |
| Personal Care & Service | 4 (100.0%) | 0 (0.0%) |
| Total (Category) | 65 (41.7%) | 91 (58.3%) |
| Total (Overall) | 687 (58.3%) | 491 (41.7%) |
Sales and Office Occupations
The most common Sales and Office occupations in Hoisington are Office & Administration (98 | 8.3%), and Sales & Related (59 | 5.0%).
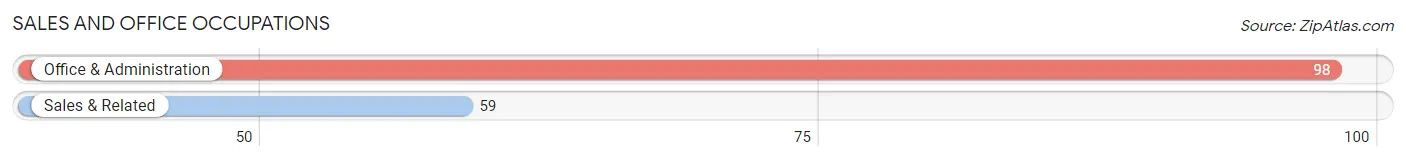
Sales and Office Occupations by Sex
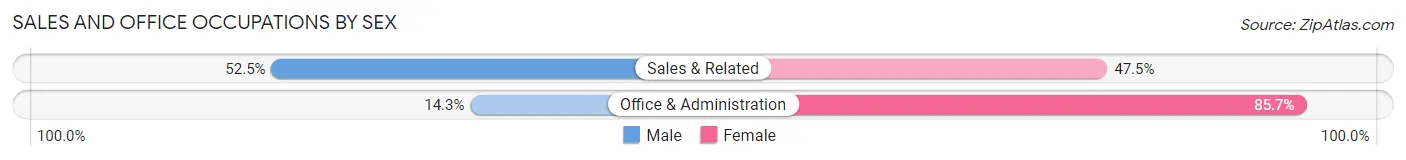
| Occupation | Male | Female |
| Sales & Related | 31 (52.5%) | 28 (47.5%) |
| Office & Administration | 14 (14.3%) | 84 (85.7%) |
| Total (Category) | 45 (28.7%) | 112 (71.3%) |
| Total (Overall) | 687 (58.3%) | 491 (41.7%) |
Natural Resources, Construction and Maintenance Occupations
The most common Natural Resources, Construction and Maintenance occupations in Hoisington are Construction & Extraction (86 | 7.3%), Installation, Maintenance & Repair (24 | 2.0%), and Farming, Fishing & Forestry (19 | 1.6%).
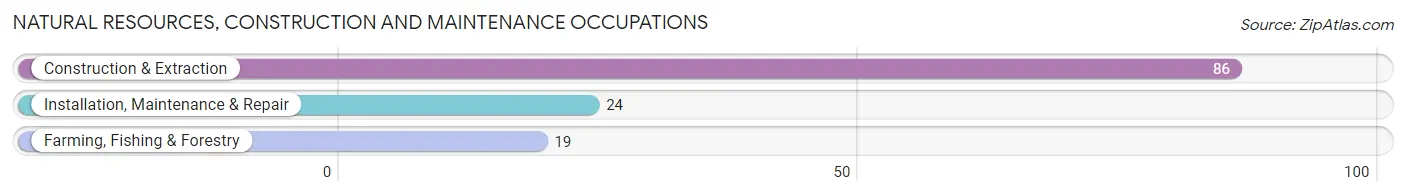
Natural Resources, Construction and Maintenance Occupations by Sex
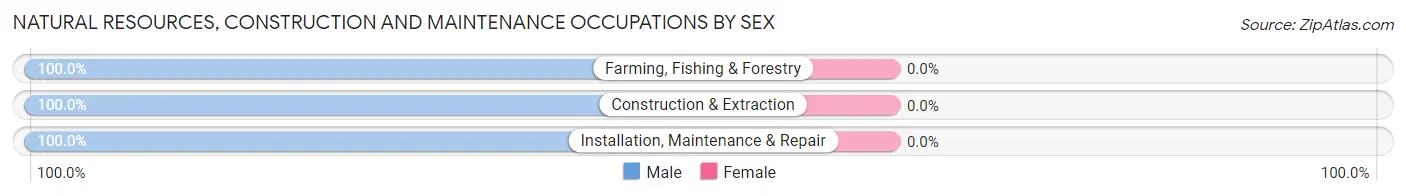
| Occupation | Male | Female |
| Farming, Fishing & Forestry | 19 (100.0%) | 0 (0.0%) |
| Construction & Extraction | 86 (100.0%) | 0 (0.0%) |
| Installation, Maintenance & Repair | 24 (100.0%) | 0 (0.0%) |
| Total (Category) | 129 (100.0%) | 0 (0.0%) |
| Total (Overall) | 687 (58.3%) | 491 (41.7%) |
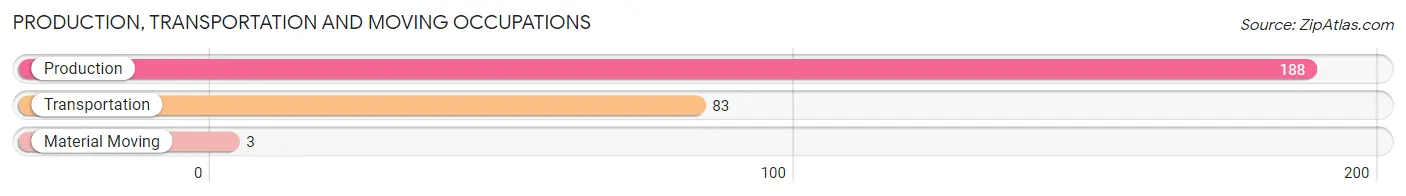
Production, Transportation and Moving Occupations
The most common Production, Transportation and Moving occupations in Hoisington are Production (188 | 16.0%), Transportation (83 | 7.0%), and Material Moving (3 | 0.3%).
Production, Transportation and Moving Occupations by Sex
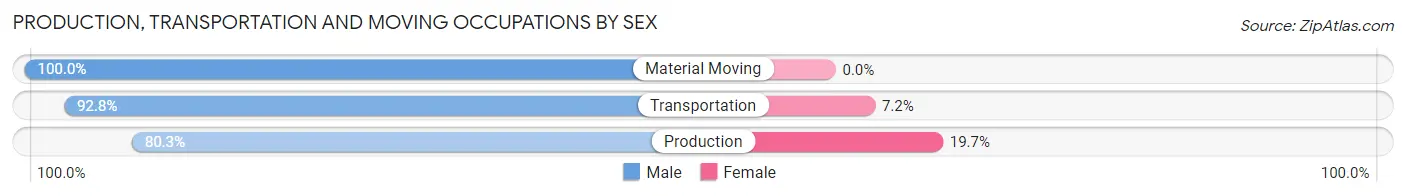
| Occupation | Male | Female |
| Production | 151 (80.3%) | 37 (19.7%) |
| Transportation | 77 (92.8%) | 6 (7.2%) |
| Material Moving | 3 (100.0%) | 0 (0.0%) |
| Total (Category) | 231 (84.3%) | 43 (15.7%) |
| Total (Overall) | 687 (58.3%) | 491 (41.7%) |
Employment Industries by Sex in Hoisington
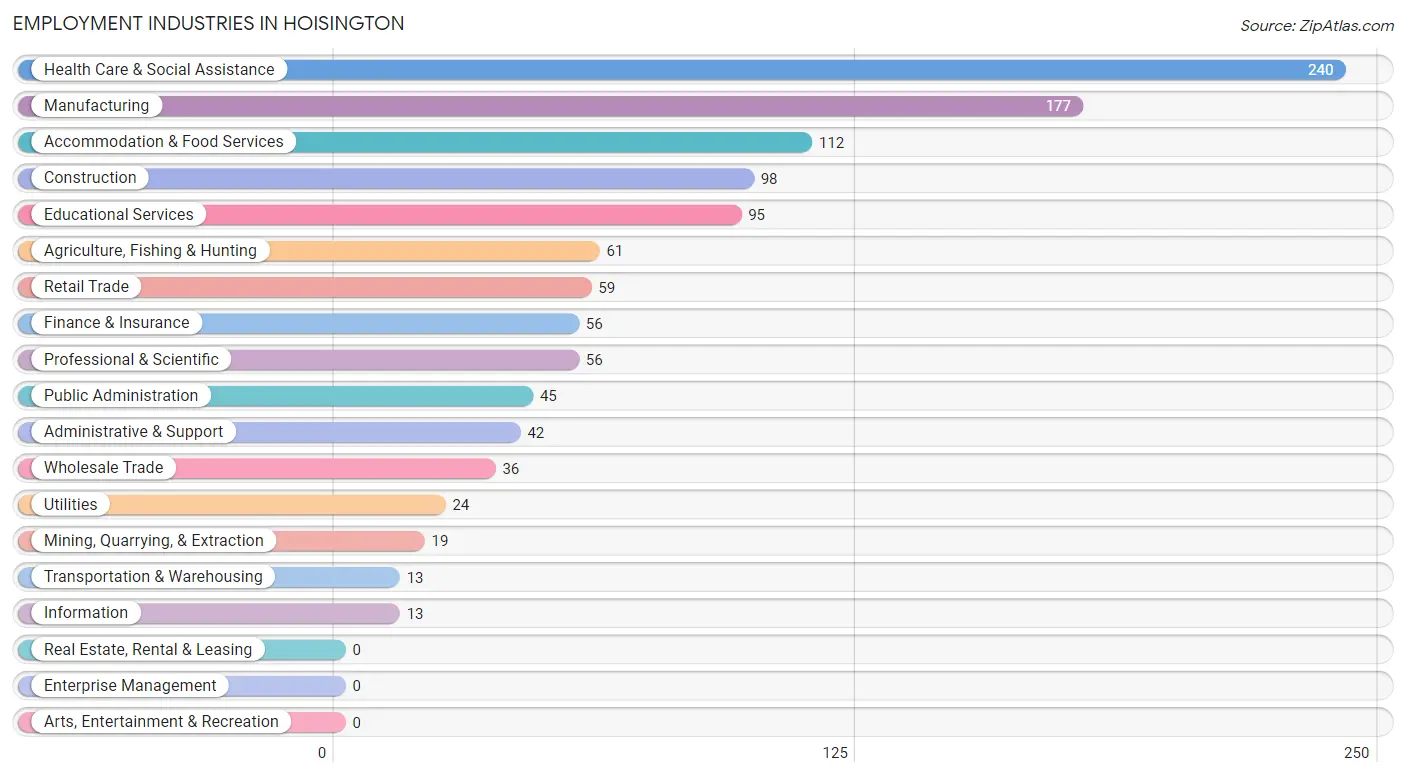
Employment Industries in Hoisington
The major employment industries in Hoisington include Health Care & Social Assistance (240 | 20.4%), Manufacturing (177 | 15.0%), Accommodation & Food Services (112 | 9.5%), Construction (98 | 8.3%), and Educational Services (95 | 8.1%).
Employment Industries by Sex in Hoisington
The Hoisington industries that see more men than women are Mining, Quarrying, & Extraction (100.0%), Retail Trade (98.3%), and Construction (95.9%), whereas the industries that tend to have a higher number of women are Professional & Scientific (92.9%), Accommodation & Food Services (79.5%), and Health Care & Social Assistance (76.7%).
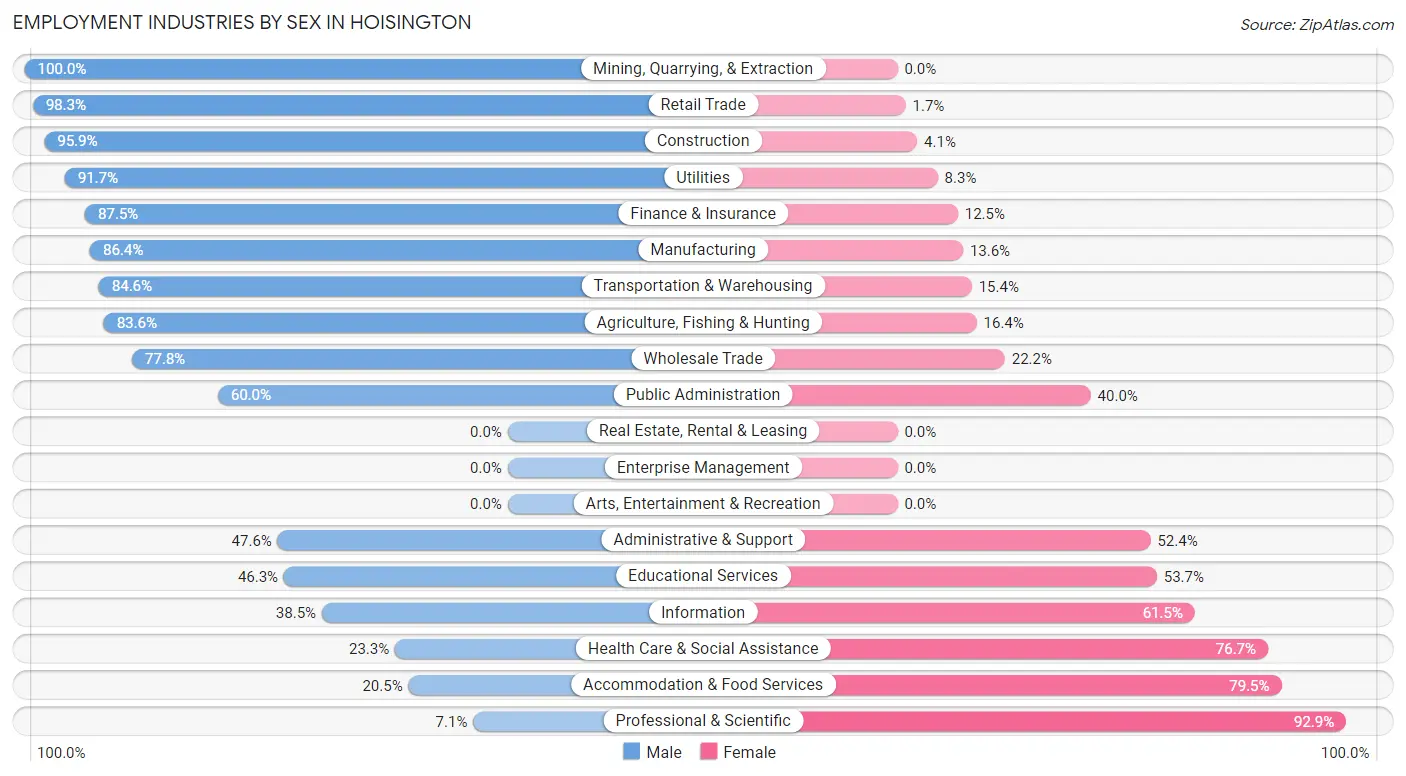
| Industry | Male | Female |
| Agriculture, Fishing & Hunting | 51 (83.6%) | 10 (16.4%) |
| Mining, Quarrying, & Extraction | 19 (100.0%) | 0 (0.0%) |
| Construction | 94 (95.9%) | 4 (4.1%) |
| Manufacturing | 153 (86.4%) | 24 (13.6%) |
| Wholesale Trade | 28 (77.8%) | 8 (22.2%) |
| Retail Trade | 58 (98.3%) | 1 (1.7%) |
| Transportation & Warehousing | 11 (84.6%) | 2 (15.4%) |
| Utilities | 22 (91.7%) | 2 (8.3%) |
| Information | 5 (38.5%) | 8 (61.5%) |
| Finance & Insurance | 49 (87.5%) | 7 (12.5%) |
| Real Estate, Rental & Leasing | 0 (0.0%) | 0 (0.0%) |
| Professional & Scientific | 4 (7.1%) | 52 (92.9%) |
| Enterprise Management | 0 (0.0%) | 0 (0.0%) |
| Administrative & Support | 20 (47.6%) | 22 (52.4%) |
| Educational Services | 44 (46.3%) | 51 (53.7%) |
| Health Care & Social Assistance | 56 (23.3%) | 184 (76.7%) |
| Arts, Entertainment & Recreation | 0 (0.0%) | 0 (0.0%) |
| Accommodation & Food Services | 23 (20.5%) | 89 (79.5%) |
| Public Administration | 27 (60.0%) | 18 (40.0%) |
| Total | 687 (58.3%) | 491 (41.7%) |
Education in Hoisington
School Enrollment in Hoisington
The most common levels of schooling among the 521 students in Hoisington are high school (138 | 26.5%), middle school (126 | 24.2%), and elementary school (111 | 21.3%).
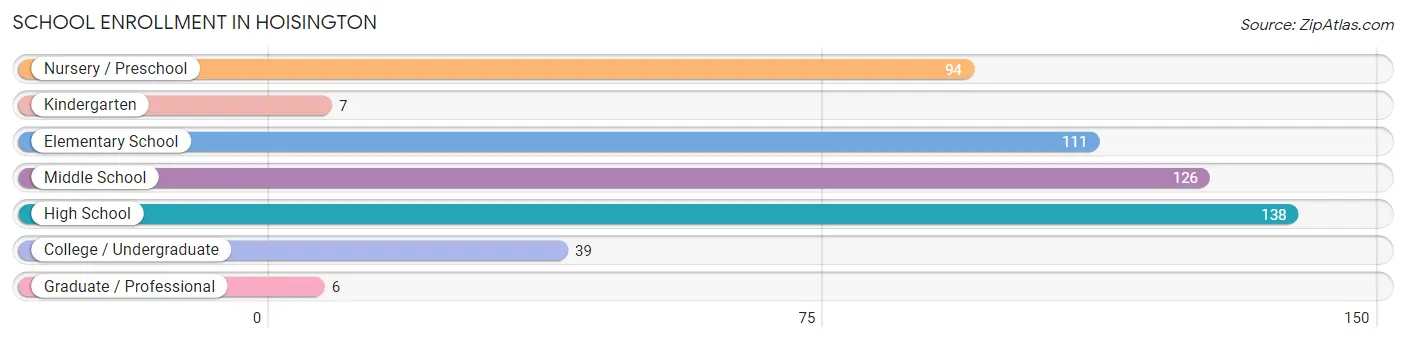
| School Level | # Students | % Students |
| Nursery / Preschool | 94 | 18.0% |
| Kindergarten | 7 | 1.3% |
| Elementary School | 111 | 21.3% |
| Middle School | 126 | 24.2% |
| High School | 138 | 26.5% |
| College / Undergraduate | 39 | 7.5% |
| Graduate / Professional | 6 | 1.1% |
| Total | 521 | 100.0% |
School Enrollment by Age by Funding Source in Hoisington
Out of a total of 521 students who are enrolled in schools in Hoisington, 4 (0.8%) attend a private institution, while the remaining 517 (99.2%) are enrolled in public schools. The age group of 10 to 14 year olds has the highest likelihood of being enrolled in private schools, with 4 (2.2% in the age bracket) enrolled. Conversely, the age group of 3 to 4 year olds has the lowest likelihood of being enrolled in a private school, with 65 (100.0% in the age bracket) attending a public institution.
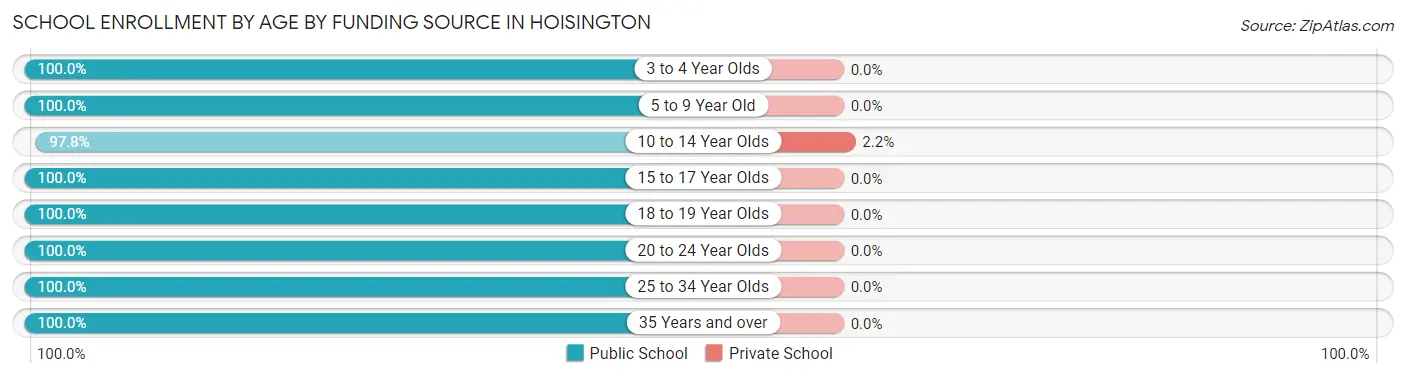
| Age Bracket | Public School | Private School |
| 3 to 4 Year Olds | 65 (100.0%) | 0 (0.0%) |
| 5 to 9 Year Old | 112 (100.0%) | 0 (0.0%) |
| 10 to 14 Year Olds | 179 (97.8%) | 4 (2.2%) |
| 15 to 17 Year Olds | 117 (100.0%) | 0 (0.0%) |
| 18 to 19 Year Olds | 8 (100.0%) | 0 (0.0%) |
| 20 to 24 Year Olds | 5 (100.0%) | 0 (0.0%) |
| 25 to 34 Year Olds | 20 (100.0%) | 0 (0.0%) |
| 35 Years and over | 11 (100.0%) | 0 (0.0%) |
| Total | 517 (99.2%) | 4 (0.8%) |
Educational Attainment by Field of Study in Hoisington
Education (127 | 32.1%), business (72 | 18.2%), science & technology (67 | 16.9%), engineering (27 | 6.8%), and social sciences (23 | 5.8%) are the most common fields of study among 396 individuals in Hoisington who have obtained a bachelor's degree or higher.
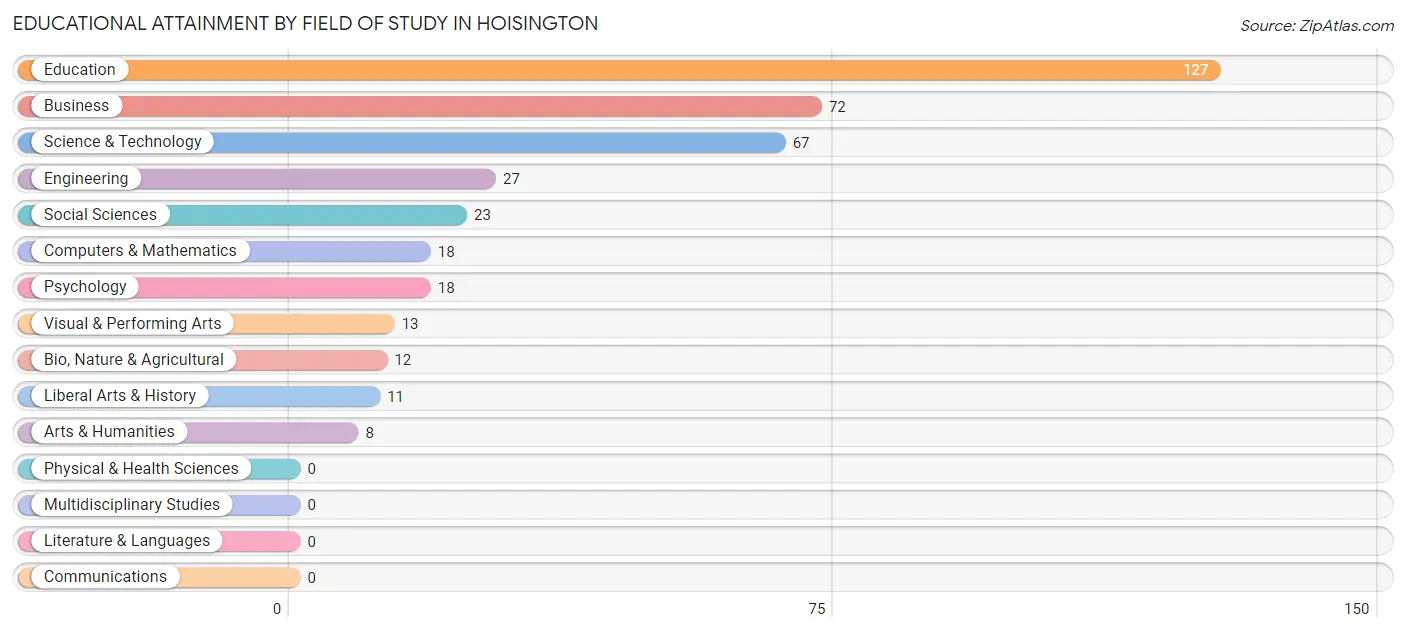
| Field of Study | # Graduates | % Graduates |
| Computers & Mathematics | 18 | 4.5% |
| Bio, Nature & Agricultural | 12 | 3.0% |
| Physical & Health Sciences | 0 | 0.0% |
| Psychology | 18 | 4.5% |
| Social Sciences | 23 | 5.8% |
| Engineering | 27 | 6.8% |
| Multidisciplinary Studies | 0 | 0.0% |
| Science & Technology | 67 | 16.9% |
| Business | 72 | 18.2% |
| Education | 127 | 32.1% |
| Literature & Languages | 0 | 0.0% |
| Liberal Arts & History | 11 | 2.8% |
| Visual & Performing Arts | 13 | 3.3% |
| Communications | 0 | 0.0% |
| Arts & Humanities | 8 | 2.0% |
| Total | 396 | 100.0% |
Transportation & Commute in Hoisington
Vehicle Availability by Sex in Hoisington
The most prevalent vehicle ownership categories in Hoisington are males with 2 vehicles (284, accounting for 41.3%) and females with 2 vehicles (232, making up 58.4%).
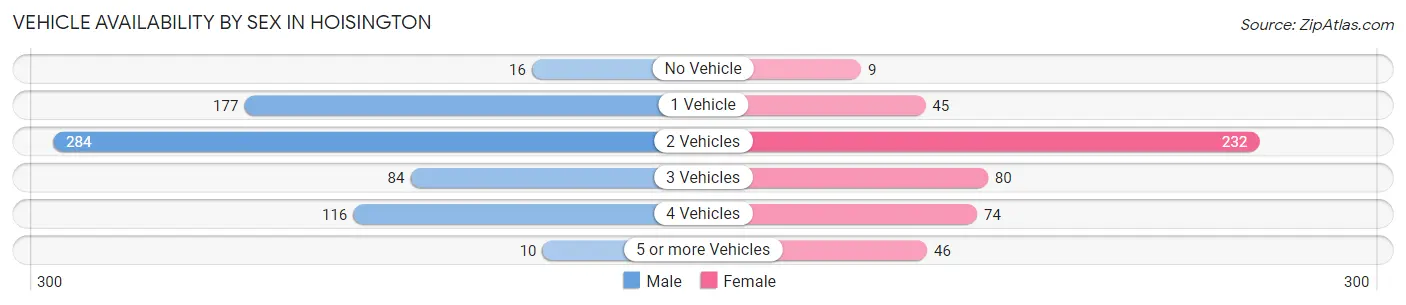
| Vehicles Available | Male | Female |
| No Vehicle | 16 (2.3%) | 9 (1.8%) |
| 1 Vehicle | 177 (25.8%) | 45 (9.3%) |
| 2 Vehicles | 284 (41.3%) | 232 (47.7%) |
| 3 Vehicles | 84 (12.2%) | 80 (16.5%) |
| 4 Vehicles | 116 (16.9%) | 74 (15.2%) |
| 5 or more Vehicles | 10 (1.5%) | 46 (9.5%) |
| Total | 687 (100.0%) | 486 (100.0%) |
Commute Time in Hoisington
The most frequently occuring commute durations in Hoisington are 5 to 9 minutes (296 commuters, 27.5%), less than 5 minutes (282 commuters, 26.2%), and 15 to 19 minutes (179 commuters, 16.6%).
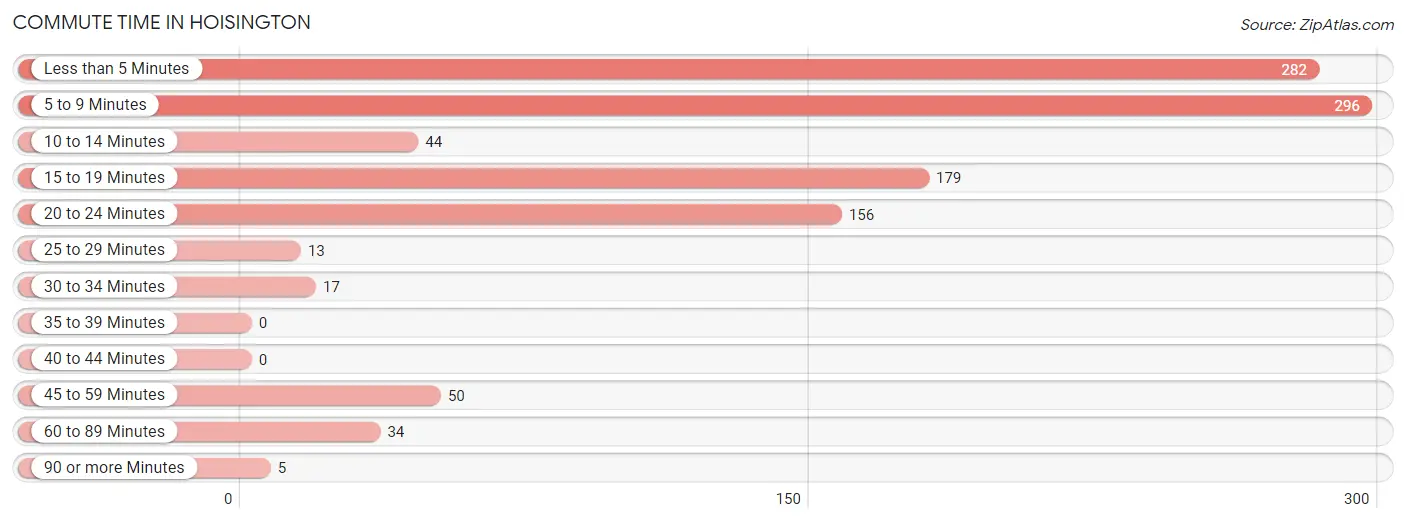
| Commute Time | # Commuters | % Commuters |
| Less than 5 Minutes | 282 | 26.2% |
| 5 to 9 Minutes | 296 | 27.5% |
| 10 to 14 Minutes | 44 | 4.1% |
| 15 to 19 Minutes | 179 | 16.6% |
| 20 to 24 Minutes | 156 | 14.5% |
| 25 to 29 Minutes | 13 | 1.2% |
| 30 to 34 Minutes | 17 | 1.6% |
| 35 to 39 Minutes | 0 | 0.0% |
| 40 to 44 Minutes | 0 | 0.0% |
| 45 to 59 Minutes | 50 | 4.6% |
| 60 to 89 Minutes | 34 | 3.2% |
| 90 or more Minutes | 5 | 0.5% |
Commute Time by Sex in Hoisington
The most common commute times in Hoisington are less than 5 minutes (178 commuters, 27.4%) for males and 5 to 9 minutes (129 commuters, 30.2%) for females.
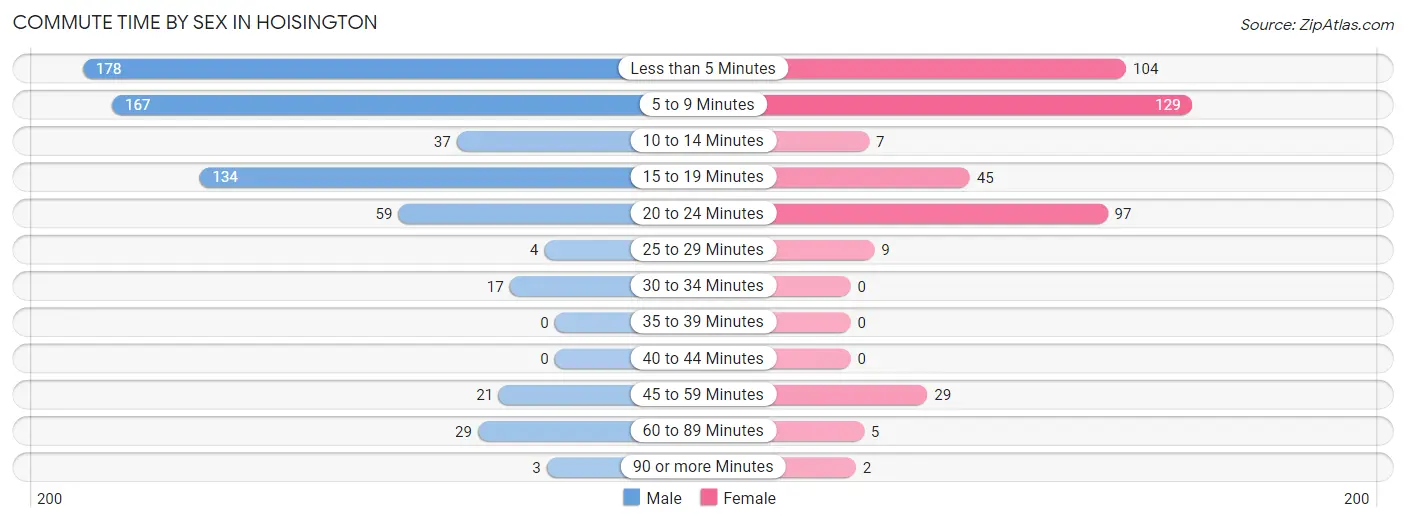
| Commute Time | Male | Female |
| Less than 5 Minutes | 178 (27.4%) | 104 (24.4%) |
| 5 to 9 Minutes | 167 (25.7%) | 129 (30.2%) |
| 10 to 14 Minutes | 37 (5.7%) | 7 (1.6%) |
| 15 to 19 Minutes | 134 (20.6%) | 45 (10.5%) |
| 20 to 24 Minutes | 59 (9.1%) | 97 (22.7%) |
| 25 to 29 Minutes | 4 (0.6%) | 9 (2.1%) |
| 30 to 34 Minutes | 17 (2.6%) | 0 (0.0%) |
| 35 to 39 Minutes | 0 (0.0%) | 0 (0.0%) |
| 40 to 44 Minutes | 0 (0.0%) | 0 (0.0%) |
| 45 to 59 Minutes | 21 (3.2%) | 29 (6.8%) |
| 60 to 89 Minutes | 29 (4.5%) | 5 (1.2%) |
| 90 or more Minutes | 3 (0.5%) | 2 (0.5%) |
Time of Departure to Work by Sex in Hoisington
The most frequent times of departure to work in Hoisington are 7:00 AM to 7:29 AM (186, 28.7%) for males and 7:30 AM to 7:59 AM (80, 18.7%) for females.
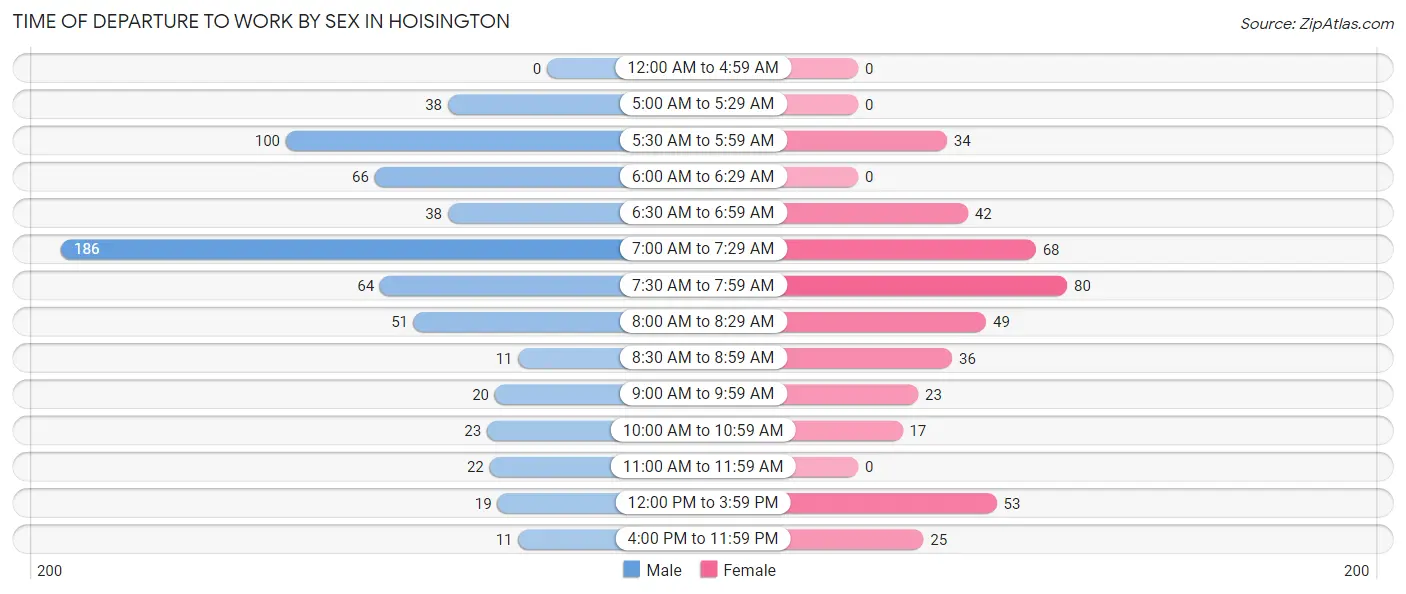
| Time of Departure | Male | Female |
| 12:00 AM to 4:59 AM | 0 (0.0%) | 0 (0.0%) |
| 5:00 AM to 5:29 AM | 38 (5.9%) | 0 (0.0%) |
| 5:30 AM to 5:59 AM | 100 (15.4%) | 34 (8.0%) |
| 6:00 AM to 6:29 AM | 66 (10.2%) | 0 (0.0%) |
| 6:30 AM to 6:59 AM | 38 (5.9%) | 42 (9.8%) |
| 7:00 AM to 7:29 AM | 186 (28.7%) | 68 (15.9%) |
| 7:30 AM to 7:59 AM | 64 (9.9%) | 80 (18.7%) |
| 8:00 AM to 8:29 AM | 51 (7.9%) | 49 (11.5%) |
| 8:30 AM to 8:59 AM | 11 (1.7%) | 36 (8.4%) |
| 9:00 AM to 9:59 AM | 20 (3.1%) | 23 (5.4%) |
| 10:00 AM to 10:59 AM | 23 (3.5%) | 17 (4.0%) |
| 11:00 AM to 11:59 AM | 22 (3.4%) | 0 (0.0%) |
| 12:00 PM to 3:59 PM | 19 (2.9%) | 53 (12.4%) |
| 4:00 PM to 11:59 PM | 11 (1.7%) | 25 (5.9%) |
| Total | 649 (100.0%) | 427 (100.0%) |
Housing Occupancy in Hoisington
Occupancy by Ownership in Hoisington
Of the total 1,155 dwellings in Hoisington, owner-occupied units account for 776 (67.2%), while renter-occupied units make up 379 (32.8%).
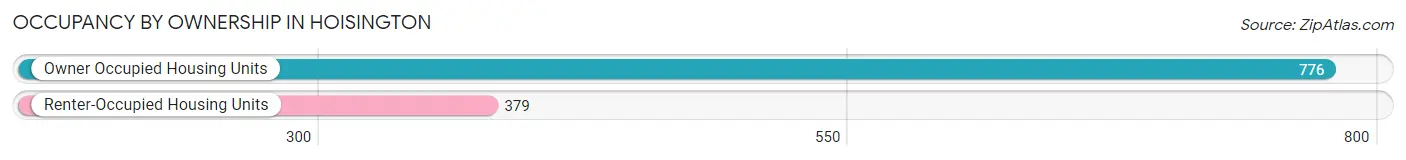
| Occupancy | # Housing Units | % Housing Units |
| Owner Occupied Housing Units | 776 | 67.2% |
| Renter-Occupied Housing Units | 379 | 32.8% |
| Total Occupied Housing Units | 1,155 | 100.0% |
Occupancy by Household Size in Hoisington
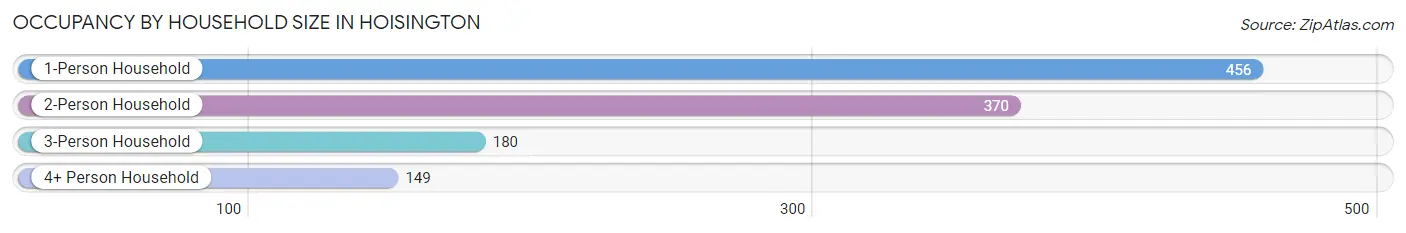
| Household Size | # Housing Units | % Housing Units |
| 1-Person Household | 456 | 39.5% |
| 2-Person Household | 370 | 32.0% |
| 3-Person Household | 180 | 15.6% |
| 4+ Person Household | 149 | 12.9% |
| Total Housing Units | 1,155 | 100.0% |
Occupancy by Ownership by Household Size in Hoisington
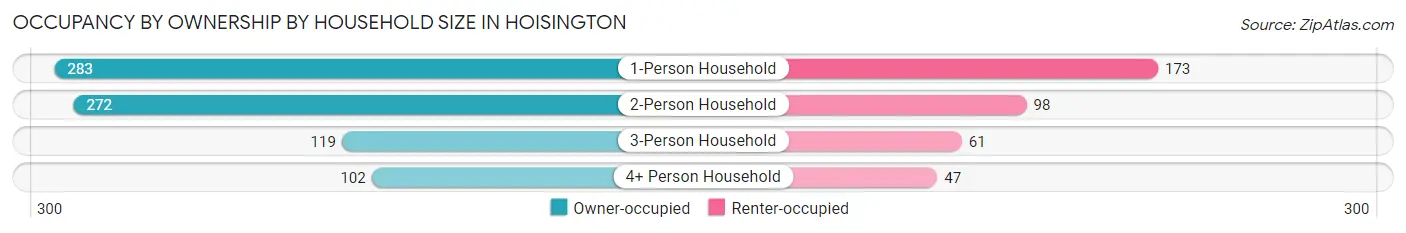
| Household Size | Owner-occupied | Renter-occupied |
| 1-Person Household | 283 (62.1%) | 173 (37.9%) |
| 2-Person Household | 272 (73.5%) | 98 (26.5%) |
| 3-Person Household | 119 (66.1%) | 61 (33.9%) |
| 4+ Person Household | 102 (68.5%) | 47 (31.5%) |
| Total Housing Units | 776 (67.2%) | 379 (32.8%) |
Occupancy by Educational Attainment in Hoisington
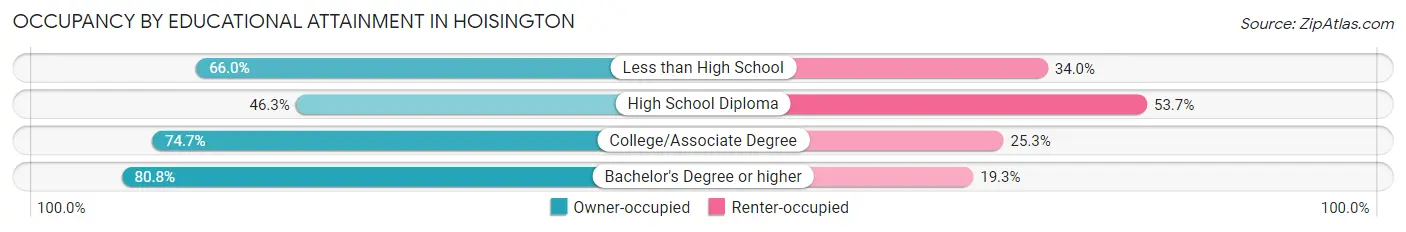
| Household Size | Owner-occupied | Renter-occupied |
| Less than High School | 31 (66.0%) | 16 (34.0%) |
| High School Diploma | 156 (46.3%) | 181 (53.7%) |
| College/Associate Degree | 417 (74.7%) | 141 (25.3%) |
| Bachelor's Degree or higher | 172 (80.7%) | 41 (19.3%) |
Occupancy by Age of Householder in Hoisington
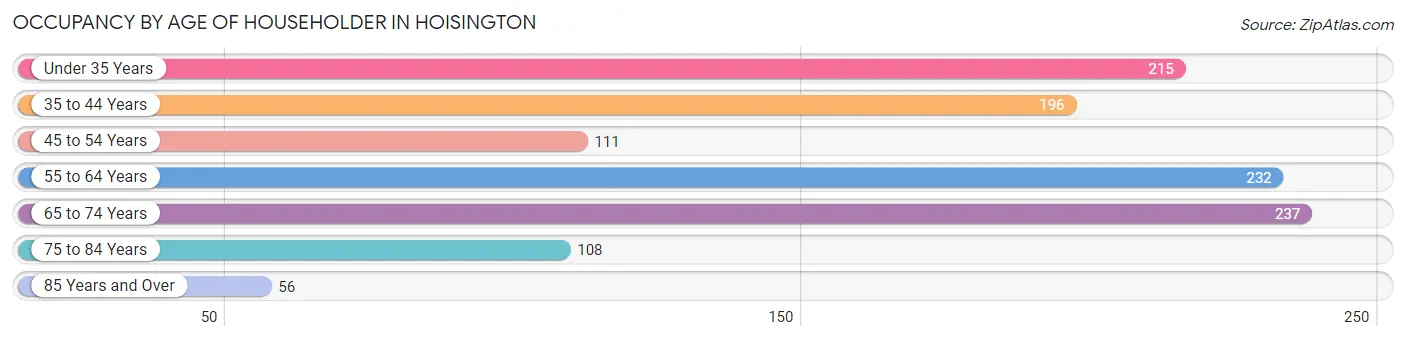
| Age Bracket | # Households | % Households |
| Under 35 Years | 215 | 18.6% |
| 35 to 44 Years | 196 | 17.0% |
| 45 to 54 Years | 111 | 9.6% |
| 55 to 64 Years | 232 | 20.1% |
| 65 to 74 Years | 237 | 20.5% |
| 75 to 84 Years | 108 | 9.3% |
| 85 Years and Over | 56 | 4.9% |
| Total | 1,155 | 100.0% |
Housing Finances in Hoisington
Median Income by Occupancy in Hoisington
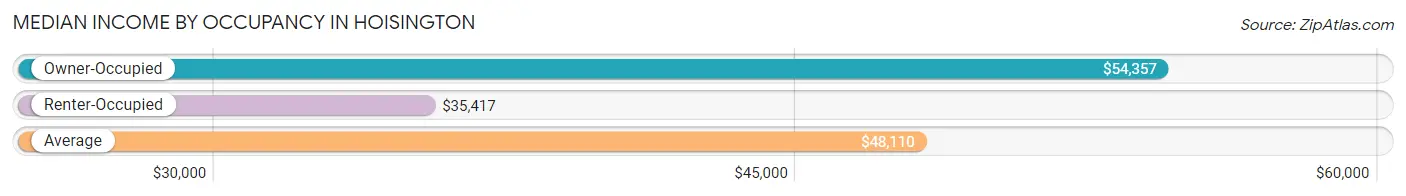
| Occupancy Type | # Households | Median Income |
| Owner-Occupied | 776 (67.2%) | $54,357 |
| Renter-Occupied | 379 (32.8%) | $35,417 |
| Average | 1,155 (100.0%) | $48,110 |
Occupancy by Householder Income Bracket in Hoisington
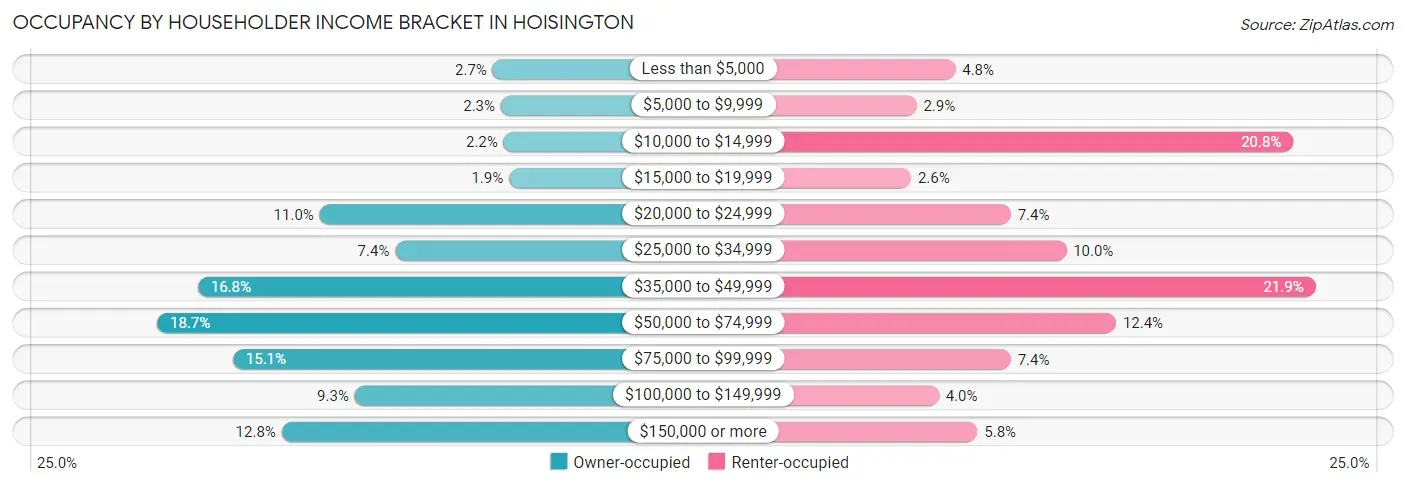
| Income Bracket | Owner-occupied | Renter-occupied |
| Less than $5,000 | 21 (2.7%) | 18 (4.8%) |
| $5,000 to $9,999 | 18 (2.3%) | 11 (2.9%) |
| $10,000 to $14,999 | 17 (2.2%) | 79 (20.8%) |
| $15,000 to $19,999 | 15 (1.9%) | 10 (2.6%) |
| $20,000 to $24,999 | 85 (11.0%) | 28 (7.4%) |
| $25,000 to $34,999 | 57 (7.3%) | 38 (10.0%) |
| $35,000 to $49,999 | 130 (16.8%) | 83 (21.9%) |
| $50,000 to $74,999 | 145 (18.7%) | 47 (12.4%) |
| $75,000 to $99,999 | 117 (15.1%) | 28 (7.4%) |
| $100,000 to $149,999 | 72 (9.3%) | 15 (4.0%) |
| $150,000 or more | 99 (12.8%) | 22 (5.8%) |
| Total | 776 (100.0%) | 379 (100.0%) |
Monthly Housing Cost Tiers in Hoisington
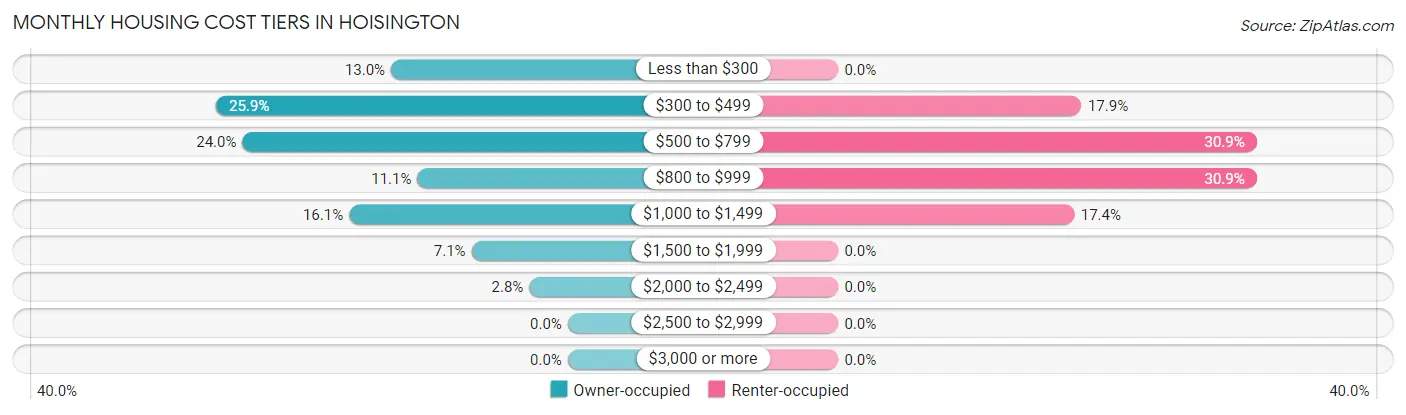
| Monthly Cost | Owner-occupied | Renter-occupied |
| Less than $300 | 101 (13.0%) | 0 (0.0%) |
| $300 to $499 | 201 (25.9%) | 68 (17.9%) |
| $500 to $799 | 186 (24.0%) | 117 (30.9%) |
| $800 to $999 | 86 (11.1%) | 117 (30.9%) |
| $1,000 to $1,499 | 125 (16.1%) | 66 (17.4%) |
| $1,500 to $1,999 | 55 (7.1%) | 0 (0.0%) |
| $2,000 to $2,499 | 22 (2.8%) | 0 (0.0%) |
| $2,500 to $2,999 | 0 (0.0%) | 0 (0.0%) |
| $3,000 or more | 0 (0.0%) | 0 (0.0%) |
| Total | 776 (100.0%) | 379 (100.0%) |
Physical Housing Characteristics in Hoisington
Housing Structures in Hoisington
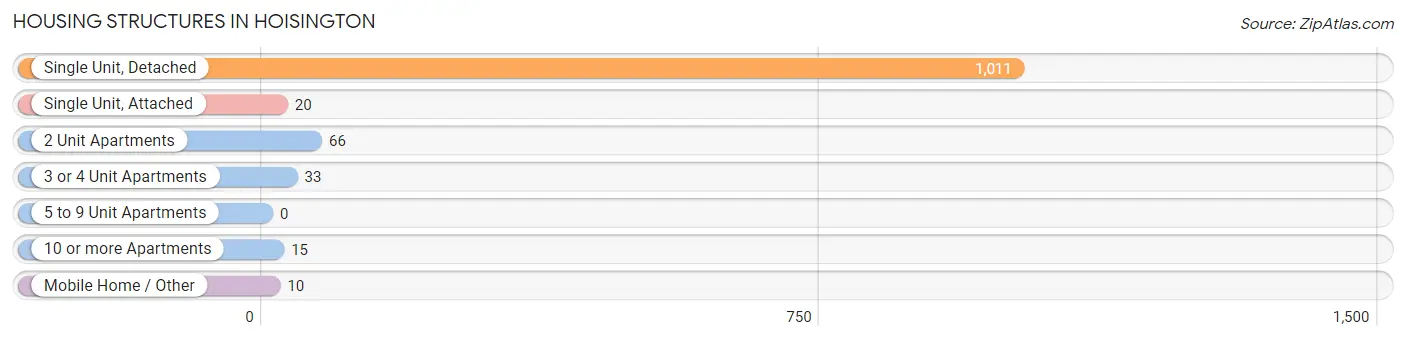
| Structure Type | # Housing Units | % Housing Units |
| Single Unit, Detached | 1,011 | 87.5% |
| Single Unit, Attached | 20 | 1.7% |
| 2 Unit Apartments | 66 | 5.7% |
| 3 or 4 Unit Apartments | 33 | 2.9% |
| 5 to 9 Unit Apartments | 0 | 0.0% |
| 10 or more Apartments | 15 | 1.3% |
| Mobile Home / Other | 10 | 0.9% |
| Total | 1,155 | 100.0% |
Housing Structures by Occupancy in Hoisington
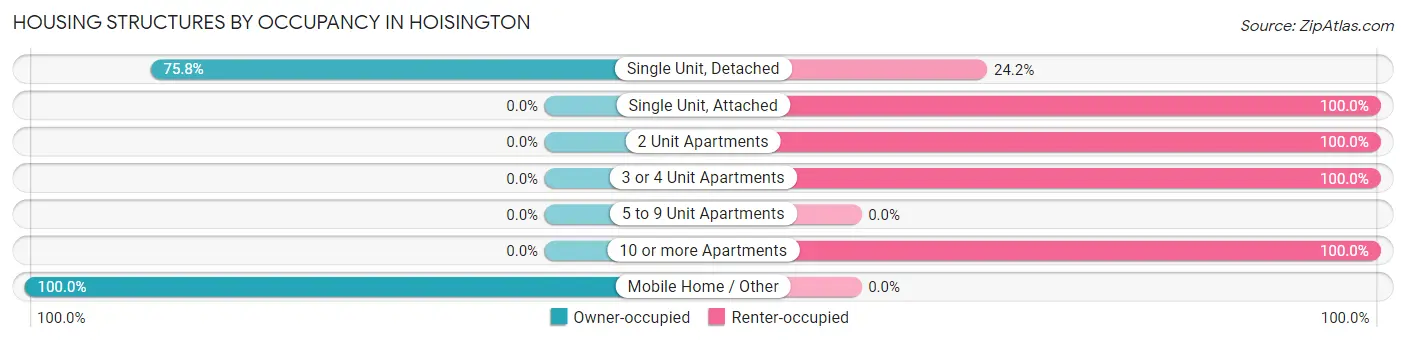
| Structure Type | Owner-occupied | Renter-occupied |
| Single Unit, Detached | 766 (75.8%) | 245 (24.2%) |
| Single Unit, Attached | 0 (0.0%) | 20 (100.0%) |
| 2 Unit Apartments | 0 (0.0%) | 66 (100.0%) |
| 3 or 4 Unit Apartments | 0 (0.0%) | 33 (100.0%) |
| 5 to 9 Unit Apartments | 0 (0.0%) | 0 (0.0%) |
| 10 or more Apartments | 0 (0.0%) | 15 (100.0%) |
| Mobile Home / Other | 10 (100.0%) | 0 (0.0%) |
| Total | 776 (67.2%) | 379 (32.8%) |
Housing Structures by Number of Rooms in Hoisington
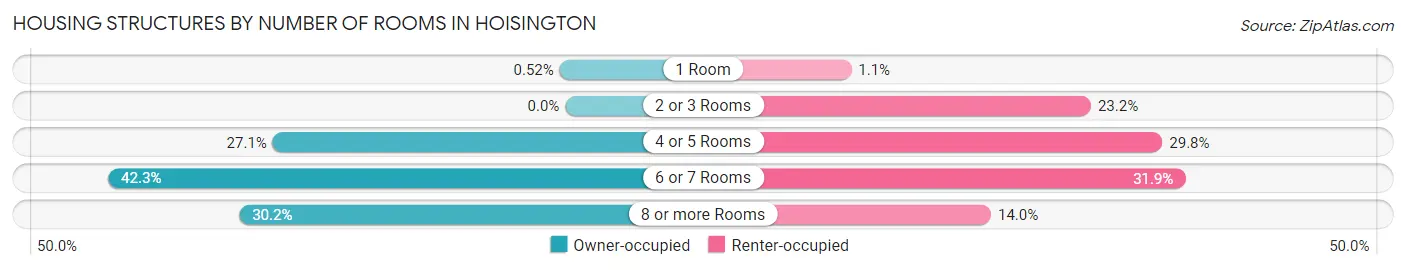
| Number of Rooms | Owner-occupied | Renter-occupied |
| 1 Room | 4 (0.5%) | 4 (1.1%) |
| 2 or 3 Rooms | 0 (0.0%) | 88 (23.2%) |
| 4 or 5 Rooms | 210 (27.1%) | 113 (29.8%) |
| 6 or 7 Rooms | 328 (42.3%) | 121 (31.9%) |
| 8 or more Rooms | 234 (30.1%) | 53 (14.0%) |
| Total | 776 (100.0%) | 379 (100.0%) |
Housing Structure by Heating Type in Hoisington
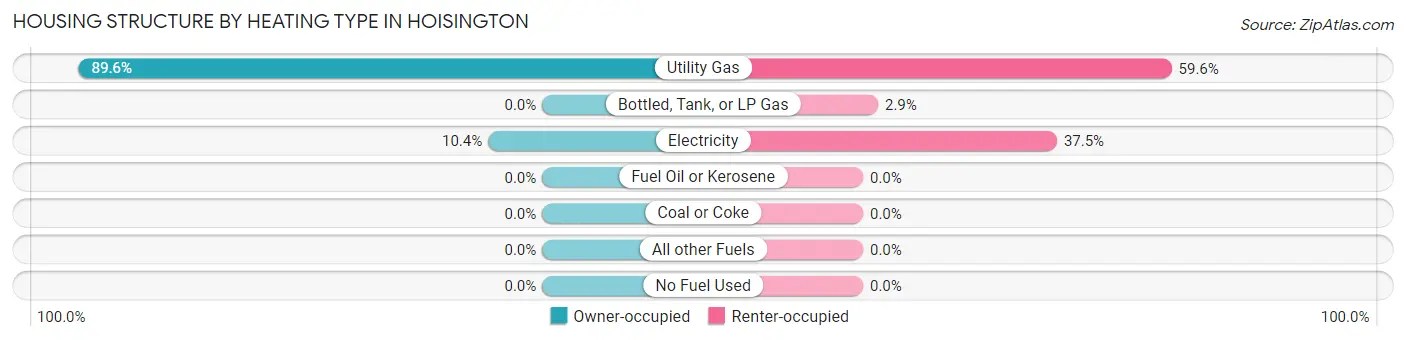
| Heating Type | Owner-occupied | Renter-occupied |
| Utility Gas | 695 (89.6%) | 226 (59.6%) |
| Bottled, Tank, or LP Gas | 0 (0.0%) | 11 (2.9%) |
| Electricity | 81 (10.4%) | 142 (37.5%) |
| Fuel Oil or Kerosene | 0 (0.0%) | 0 (0.0%) |
| Coal or Coke | 0 (0.0%) | 0 (0.0%) |
| All other Fuels | 0 (0.0%) | 0 (0.0%) |
| No Fuel Used | 0 (0.0%) | 0 (0.0%) |
| Total | 776 (100.0%) | 379 (100.0%) |
Household Vehicle Usage in Hoisington
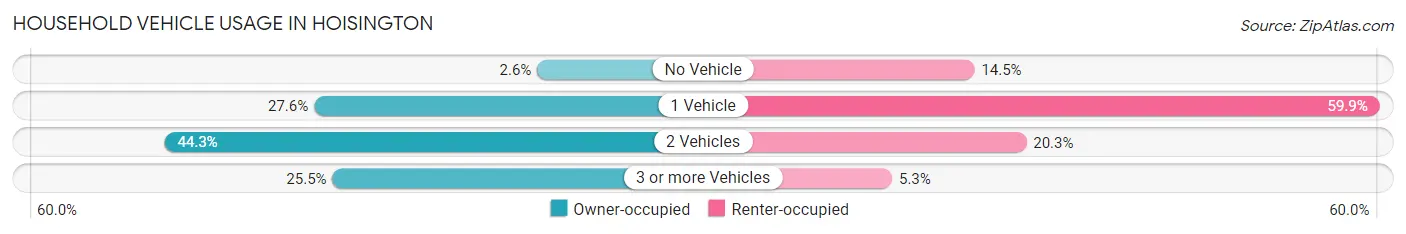
| Vehicles per Household | Owner-occupied | Renter-occupied |
| No Vehicle | 20 (2.6%) | 55 (14.5%) |
| 1 Vehicle | 214 (27.6%) | 227 (59.9%) |
| 2 Vehicles | 344 (44.3%) | 77 (20.3%) |
| 3 or more Vehicles | 198 (25.5%) | 20 (5.3%) |
| Total | 776 (100.0%) | 379 (100.0%) |
Real Estate & Mortgages in Hoisington
Real Estate and Mortgage Overview in Hoisington
| Characteristic | Without Mortgage | With Mortgage |
| Housing Units | 481 | 295 |
| Median Property Value | $64,700 | $96,400 |
| Median Household Income | $38,224 | $55 |
| Monthly Housing Costs | $470 | $0 |
| Real Estate Taxes | $1,536 | $0 |
Property Value by Mortgage Status in Hoisington
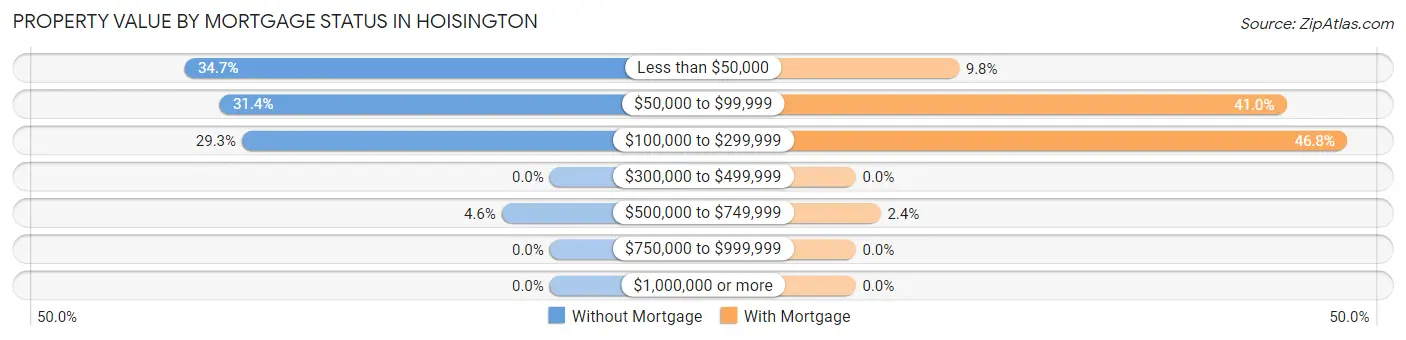
| Property Value | Without Mortgage | With Mortgage |
| Less than $50,000 | 167 (34.7%) | 29 (9.8%) |
| $50,000 to $99,999 | 151 (31.4%) | 121 (41.0%) |
| $100,000 to $299,999 | 141 (29.3%) | 138 (46.8%) |
| $300,000 to $499,999 | 0 (0.0%) | 0 (0.0%) |
| $500,000 to $749,999 | 22 (4.6%) | 7 (2.4%) |
| $750,000 to $999,999 | 0 (0.0%) | 0 (0.0%) |
| $1,000,000 or more | 0 (0.0%) | 0 (0.0%) |
| Total | 481 (100.0%) | 295 (100.0%) |
Household Income by Mortgage Status in Hoisington
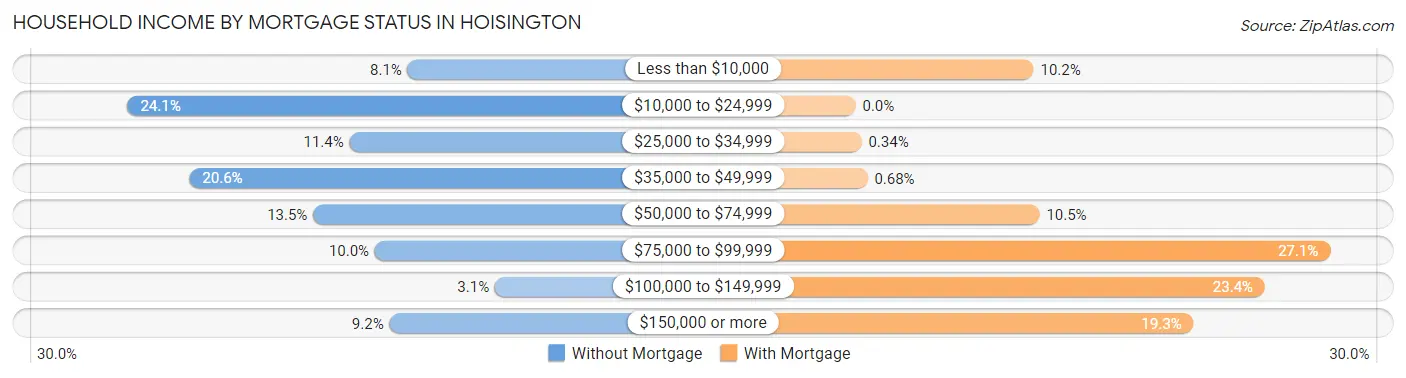
| Household Income | Without Mortgage | With Mortgage |
| Less than $10,000 | 39 (8.1%) | 30 (10.2%) |
| $10,000 to $24,999 | 116 (24.1%) | 0 (0.0%) |
| $25,000 to $34,999 | 55 (11.4%) | 1 (0.3%) |
| $35,000 to $49,999 | 99 (20.6%) | 2 (0.7%) |
| $50,000 to $74,999 | 65 (13.5%) | 31 (10.5%) |
| $75,000 to $99,999 | 48 (10.0%) | 80 (27.1%) |
| $100,000 to $149,999 | 15 (3.1%) | 69 (23.4%) |
| $150,000 or more | 44 (9.1%) | 57 (19.3%) |
| Total | 481 (100.0%) | 295 (100.0%) |
Property Value to Household Income Ratio in Hoisington
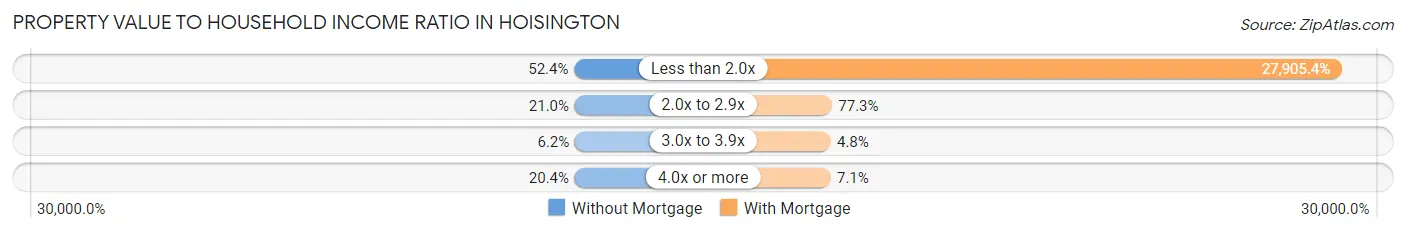
| Value-to-Income Ratio | Without Mortgage | With Mortgage |
| Less than 2.0x | 252 (52.4%) | 82,321 (27,905.4%) |
| 2.0x to 2.9x | 101 (21.0%) | 228 (77.3%) |
| 3.0x to 3.9x | 30 (6.2%) | 14 (4.8%) |
| 4.0x or more | 98 (20.4%) | 21 (7.1%) |
| Total | 481 (100.0%) | 295 (100.0%) |
Real Estate Taxes by Mortgage Status in Hoisington
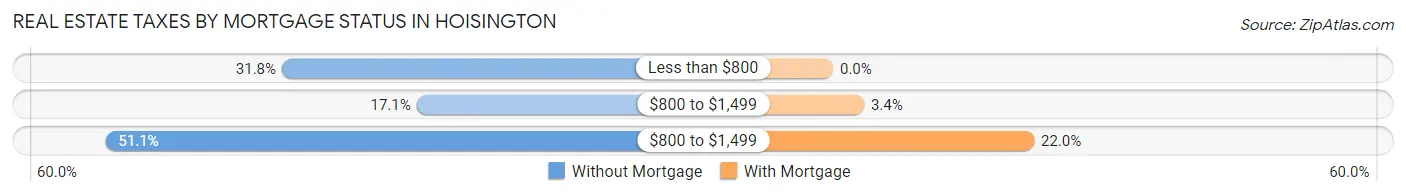
| Property Taxes | Without Mortgage | With Mortgage |
| Less than $800 | 153 (31.8%) | 0 (0.0%) |
| $800 to $1,499 | 82 (17.1%) | 10 (3.4%) |
| $800 to $1,499 | 246 (51.1%) | 65 (22.0%) |
| Total | 481 (100.0%) | 295 (100.0%) |
Health & Disability in Hoisington
Health Insurance Coverage by Age in Hoisington
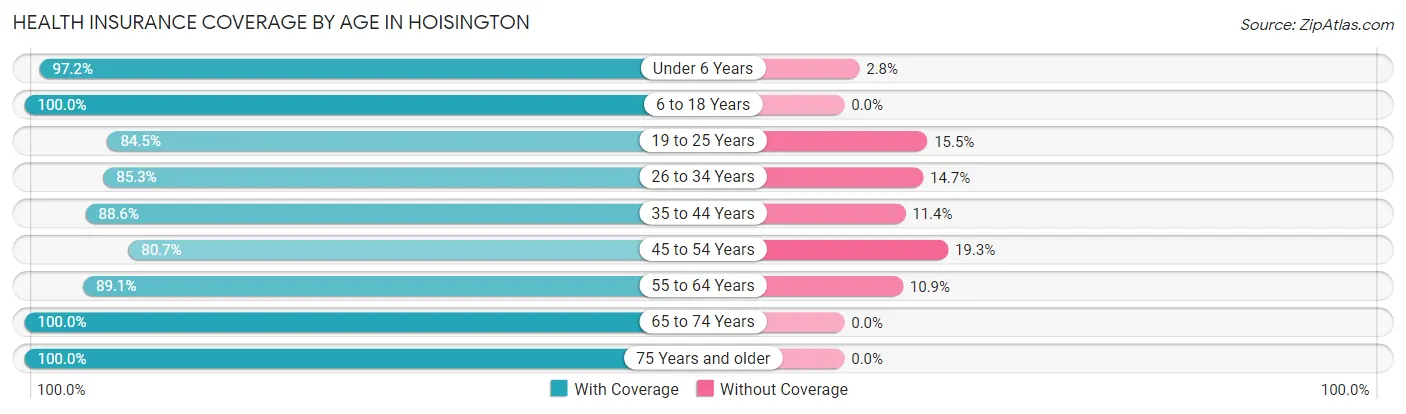
| Age Bracket | With Coverage | Without Coverage |
| Under 6 Years | 243 (97.2%) | 7 (2.8%) |
| 6 to 18 Years | 394 (100.0%) | 0 (0.0%) |
| 19 to 25 Years | 164 (84.5%) | 30 (15.5%) |
| 26 to 34 Years | 302 (85.3%) | 52 (14.7%) |
| 35 to 44 Years | 296 (88.6%) | 38 (11.4%) |
| 45 to 54 Years | 171 (80.7%) | 41 (19.3%) |
| 55 to 64 Years | 318 (89.1%) | 39 (10.9%) |
| 65 to 74 Years | 347 (100.0%) | 0 (0.0%) |
| 75 Years and older | 224 (100.0%) | 0 (0.0%) |
| Total | 2,459 (92.2%) | 207 (7.8%) |
Health Insurance Coverage by Citizenship Status in Hoisington
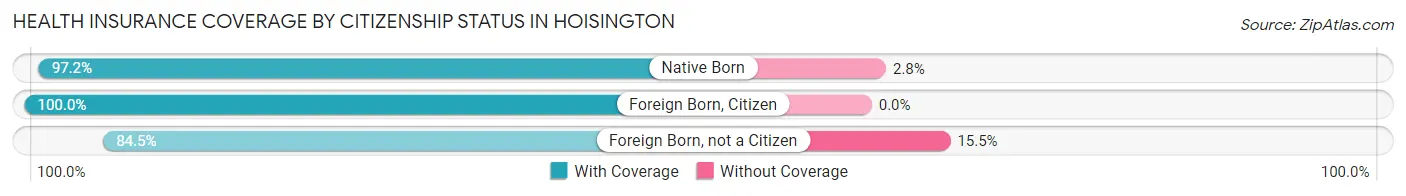
| Citizenship Status | With Coverage | Without Coverage |
| Native Born | 243 (97.2%) | 7 (2.8%) |
| Foreign Born, Citizen | 394 (100.0%) | 0 (0.0%) |
| Foreign Born, not a Citizen | 164 (84.5%) | 30 (15.5%) |
Health Insurance Coverage by Household Income in Hoisington
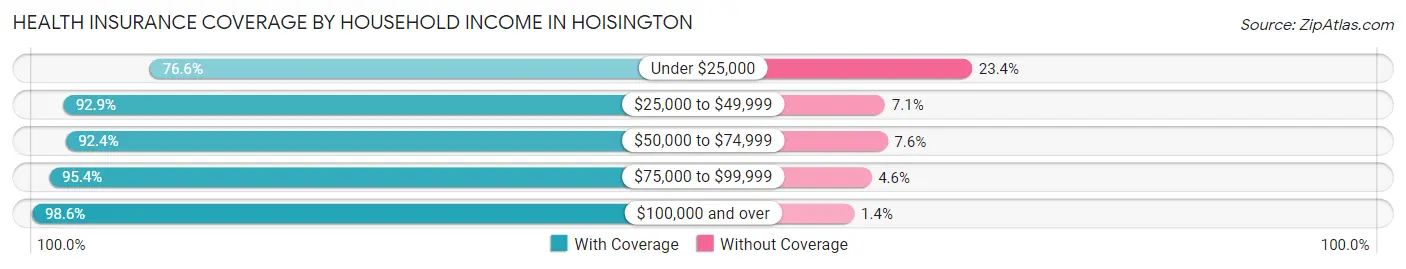
| Household Income | With Coverage | Without Coverage |
| Under $25,000 | 330 (76.6%) | 101 (23.4%) |
| $25,000 to $49,999 | 494 (92.9%) | 38 (7.1%) |
| $50,000 to $74,999 | 400 (92.4%) | 33 (7.6%) |
| $75,000 to $99,999 | 522 (95.4%) | 25 (4.6%) |
| $100,000 and over | 713 (98.6%) | 10 (1.4%) |
Public vs Private Health Insurance Coverage by Age in Hoisington
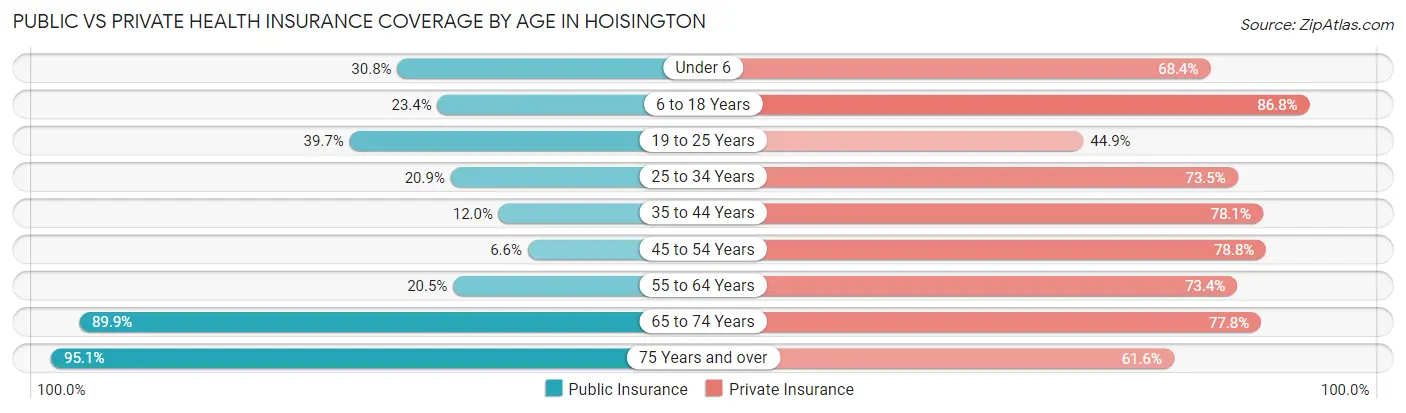
| Age Bracket | Public Insurance | Private Insurance |
| Under 6 | 77 (30.8%) | 171 (68.4%) |
| 6 to 18 Years | 92 (23.4%) | 342 (86.8%) |
| 19 to 25 Years | 77 (39.7%) | 87 (44.9%) |
| 25 to 34 Years | 74 (20.9%) | 260 (73.5%) |
| 35 to 44 Years | 40 (12.0%) | 261 (78.1%) |
| 45 to 54 Years | 14 (6.6%) | 167 (78.8%) |
| 55 to 64 Years | 73 (20.4%) | 262 (73.4%) |
| 65 to 74 Years | 312 (89.9%) | 270 (77.8%) |
| 75 Years and over | 213 (95.1%) | 138 (61.6%) |
| Total | 972 (36.5%) | 1,958 (73.4%) |
Disability Status by Sex by Age in Hoisington
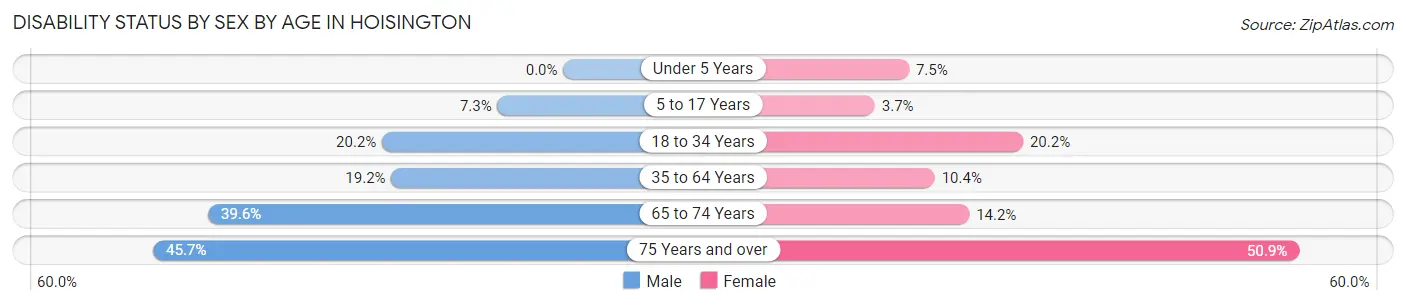
| Age Bracket | Male | Female |
| Under 5 Years | 0 (0.0%) | 8 (7.5%) |
| 5 to 17 Years | 17 (7.3%) | 7 (3.7%) |
| 18 to 34 Years | 66 (20.2%) | 46 (20.2%) |
| 35 to 64 Years | 86 (19.2%) | 47 (10.3%) |
| 65 to 74 Years | 76 (39.6%) | 22 (14.2%) |
| 75 Years and over | 53 (45.7%) | 55 (50.9%) |
Disability Class by Sex by Age in Hoisington
Disability Class: Hearing Difficulty
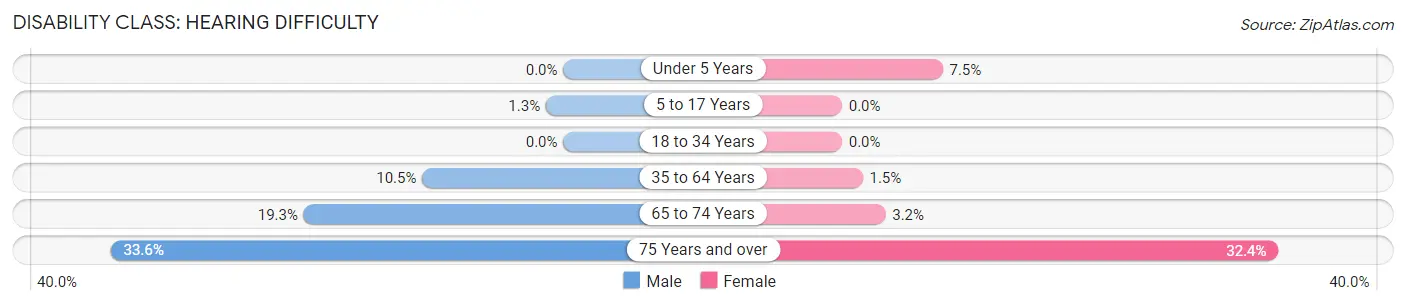
| Age Bracket | Male | Female |
| Under 5 Years | 0 (0.0%) | 8 (7.5%) |
| 5 to 17 Years | 3 (1.3%) | 0 (0.0%) |
| 18 to 34 Years | 0 (0.0%) | 0 (0.0%) |
| 35 to 64 Years | 47 (10.5%) | 7 (1.5%) |
| 65 to 74 Years | 37 (19.3%) | 5 (3.2%) |
| 75 Years and over | 39 (33.6%) | 35 (32.4%) |
Disability Class: Vision Difficulty
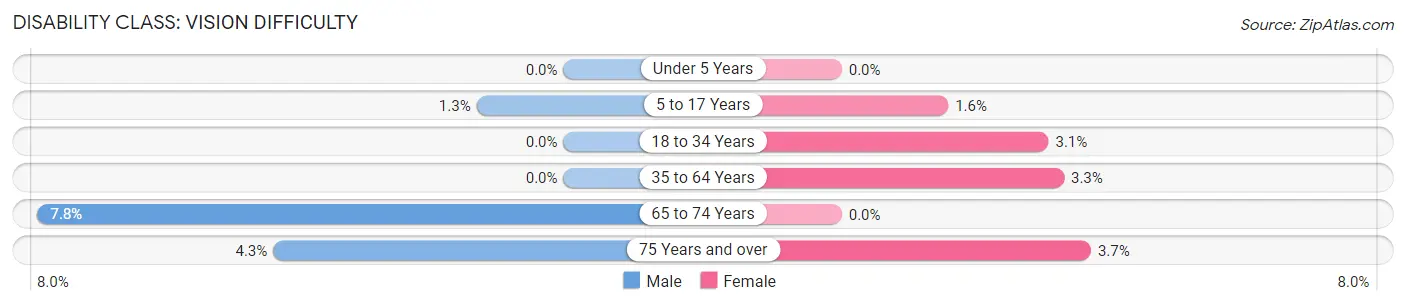
| Age Bracket | Male | Female |
| Under 5 Years | 0 (0.0%) | 0 (0.0%) |
| 5 to 17 Years | 3 (1.3%) | 3 (1.6%) |
| 18 to 34 Years | 0 (0.0%) | 7 (3.1%) |
| 35 to 64 Years | 0 (0.0%) | 15 (3.3%) |
| 65 to 74 Years | 15 (7.8%) | 0 (0.0%) |
| 75 Years and over | 5 (4.3%) | 4 (3.7%) |
Disability Class: Cognitive Difficulty
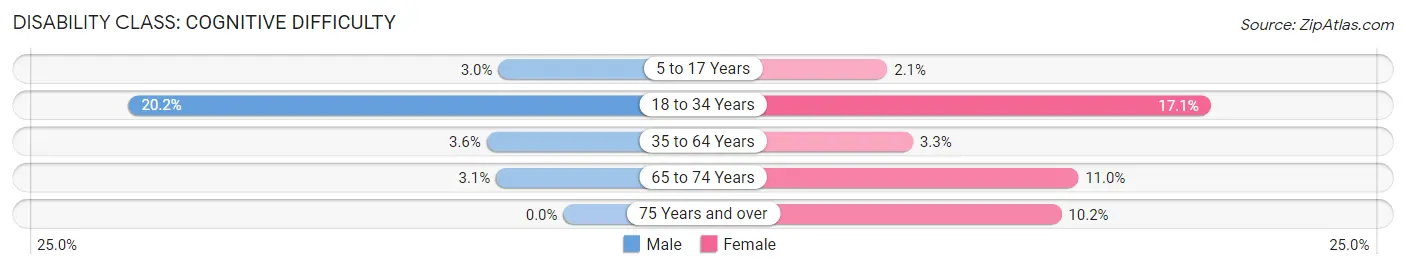
| Age Bracket | Male | Female |
| 5 to 17 Years | 7 (3.0%) | 4 (2.1%) |
| 18 to 34 Years | 66 (20.2%) | 39 (17.1%) |
| 35 to 64 Years | 16 (3.6%) | 15 (3.3%) |
| 65 to 74 Years | 6 (3.1%) | 17 (11.0%) |
| 75 Years and over | 0 (0.0%) | 11 (10.2%) |
Disability Class: Ambulatory Difficulty
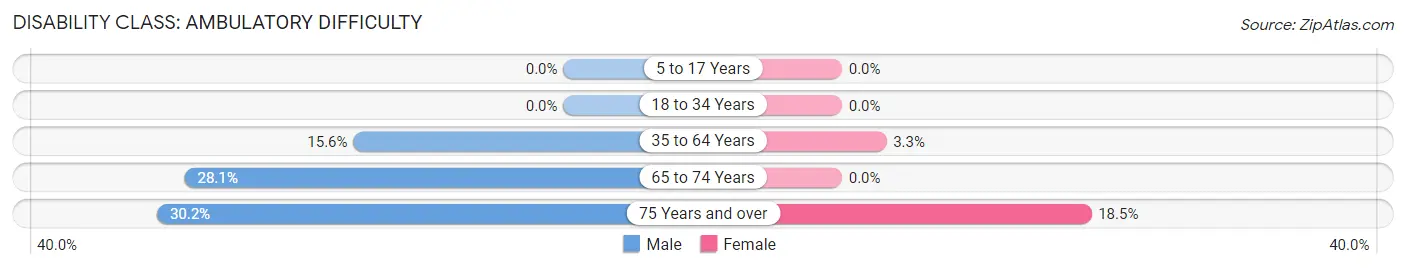
| Age Bracket | Male | Female |
| 5 to 17 Years | 0 (0.0%) | 0 (0.0%) |
| 18 to 34 Years | 0 (0.0%) | 0 (0.0%) |
| 35 to 64 Years | 70 (15.6%) | 15 (3.3%) |
| 65 to 74 Years | 54 (28.1%) | 0 (0.0%) |
| 75 Years and over | 35 (30.2%) | 20 (18.5%) |
Disability Class: Self-Care Difficulty
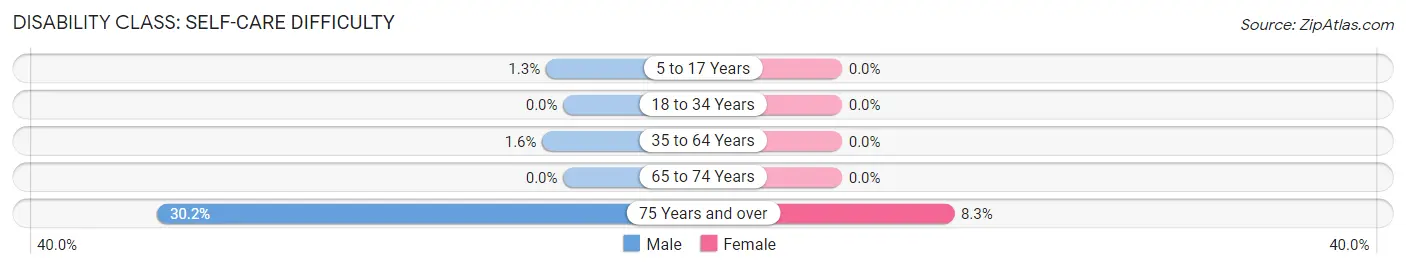
| Age Bracket | Male | Female |
| 5 to 17 Years | 3 (1.3%) | 0 (0.0%) |
| 18 to 34 Years | 0 (0.0%) | 0 (0.0%) |
| 35 to 64 Years | 7 (1.6%) | 0 (0.0%) |
| 65 to 74 Years | 0 (0.0%) | 0 (0.0%) |
| 75 Years and over | 35 (30.2%) | 9 (8.3%) |
Technology Access in Hoisington
Computing Device Access in Hoisington
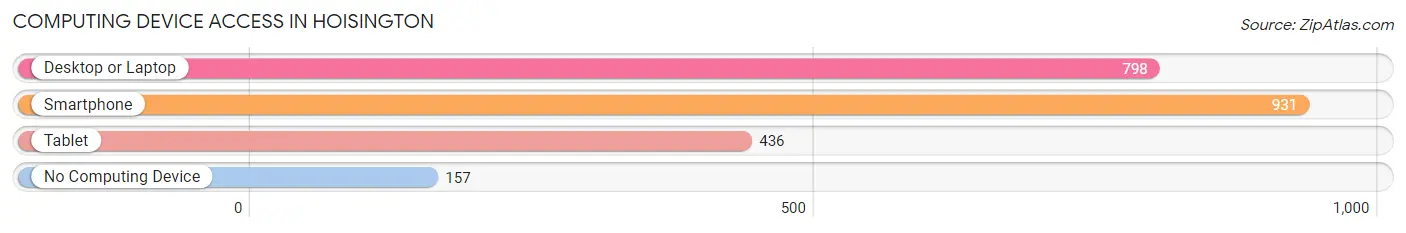
| Device Type | # Households | % Households |
| Desktop or Laptop | 798 | 69.1% |
| Smartphone | 931 | 80.6% |
| Tablet | 436 | 37.8% |
| No Computing Device | 157 | 13.6% |
| Total | 1,155 | 100.0% |
Internet Access in Hoisington
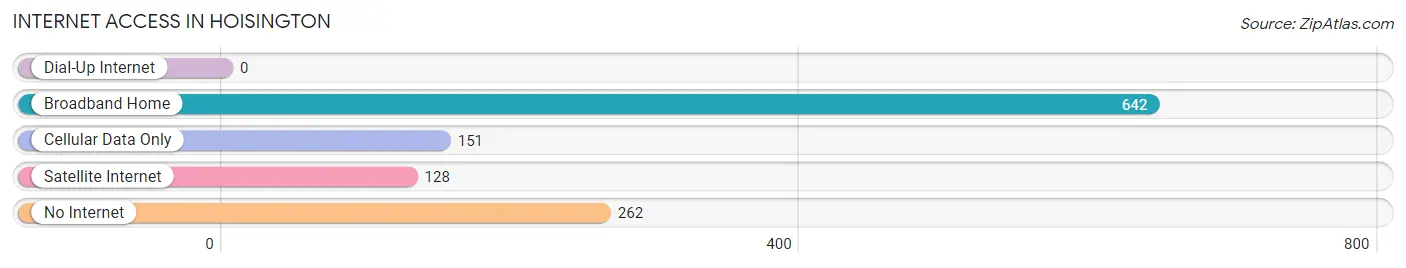
| Internet Type | # Households | % Households |
| Dial-Up Internet | 0 | 0.0% |
| Broadband Home | 642 | 55.6% |
| Cellular Data Only | 151 | 13.1% |
| Satellite Internet | 128 | 11.1% |
| No Internet | 262 | 22.7% |
| Total | 1,155 | 100.0% |
Hoisington Summary
Hoisington, Kansas is a small city located in Barton County in the central part of the state. It is situated along the Arkansas River and is part of the Great Bend, Kansas Metropolitan Statistical Area. The city has a population of 2,711 people as of the 2010 census, making it the largest city in Barton County.
History
Hoisington was founded in 1885 by the Santa Fe Railroad. The city was named after William Hoisington, a railroad official. The city was incorporated in 1887 and has remained a small, rural community ever since.
Geography
Hoisington is located in central Kansas at the intersection of U.S. Route 56 and Kansas Highway 4. It is situated along the Arkansas River and is part of the Great Bend, Kansas Metropolitan Statistical Area. The city has a total area of 1.7 square miles, all of which is land.
Economy
Hoisington’s economy is largely based on agriculture and manufacturing. The city is home to several large agricultural businesses, including a feed mill, a grain elevator, and a fertilizer plant. The city also has several manufacturing businesses, including a plastics plant and a metal fabrication plant.
Demographics
As of the 2010 census, Hoisington had a population of 2,711 people. The racial makeup of the city was 95.2% White, 0.7% African American, 0.3% Native American, 0.3% Asian, 0.1% Pacific Islander, 1.7% from other races, and 1.9% from two or more races. Hispanic or Latino of any race were 4.2% of the population.
The median income for a household in Hoisington was $37,917, and the median income for a family was $45,938. The per capita income for the city was $18,945. About 8.2% of families and 10.2% of the population were below the poverty line, including 13.2% of those under age 18 and 8.2% of those age 65 or over.
Hoisington is served by the Hoisington Unified School District. The district has one elementary school, one middle school, and one high school. The city also has a public library and a community center.
Hoisington is home to several churches, including the First United Methodist Church, the First Presbyterian Church, and the First Baptist Church. The city also has a number of parks and recreational facilities, including a swimming pool, a golf course, and a skate park.
Hoisington is a small, rural community with a rich history and a strong sense of community. The city is home to a variety of businesses and industries, and its residents enjoy a variety of recreational activities. Hoisington is a great place to live, work, and play.
Common Questions
What is Per Capita Income in Hoisington?
Per Capita income in Hoisington is $39,458.
What is the Median Family Income in Hoisington?
Median Family Income in Hoisington is $57,440.
What is the Median Household income in Hoisington?
Median Household Income in Hoisington is $48,110.
What is Income or Wage Gap in Hoisington?
Income or Wage Gap in Hoisington is 44.4%.
Women in Hoisington earn 55.6 cents for every dollar earned by a man.
What is Inequality or Gini Index in Hoisington?
Inequality or Gini Index in Hoisington is 0.51.
What is the Total Population of Hoisington?
Total Population of Hoisington is 2,675.
What is the Total Male Population of Hoisington?
Total Male Population of Hoisington is 1,427.
What is the Total Female Population of Hoisington?
Total Female Population of Hoisington is 1,248.
What is the Ratio of Males per 100 Females in Hoisington?
There are 114.34 Males per 100 Females in Hoisington.
What is the Ratio of Females per 100 Males in Hoisington?
There are 87.46 Females per 100 Males in Hoisington.
What is the Median Population Age in Hoisington?
Median Population Age in Hoisington is 38.1 Years.
What is the Average Family Size in Hoisington
Average Family Size in Hoisington is 3.0 People.
What is the Average Household Size in Hoisington
Average Household Size in Hoisington is 2.3 People.
How Large is the Labor Force in Hoisington?
There are 1,229 People in the Labor Forcein in Hoisington.
What is the Percentage of People in the Labor Force in Hoisington?
58.9% of People are in the Labor Force in Hoisington.
What is the Unemployment Rate in Hoisington?
Unemployment Rate in Hoisington is 4.2%.