Hiawatha, KS Map & Demographics
Hiawatha Map
Hiawatha Overview
$30,671
PER CAPITA INCOME
$84,850
AVG FAMILY INCOME
$56,050
AVG HOUSEHOLD INCOME
40.1%
WAGE / INCOME GAP [ % ]
59.9¢/ $1
WAGE / INCOME GAP [ $ ]
0.41
INEQUALITY / GINI INDEX
3,246
TOTAL POPULATION
1,517
MALE POPULATION
1,729
FEMALE POPULATION
87.74
MALES / 100 FEMALES
113.97
FEMALES / 100 MALES
41.6
MEDIAN AGE
3.4
AVG FAMILY SIZE
2.5
AVG HOUSEHOLD SIZE
1,773
LABOR FORCE [ PEOPLE ]
70.8%
PERCENT IN LABOR FORCE
4.5%
UNEMPLOYMENT RATE
Hiawatha Zip Codes
Hiawatha Area Codes
Income in Hiawatha
Income Overview in Hiawatha
Per Capita Income in Hiawatha is $30,671, while median incomes of families and households are $84,850 and $56,050 respectively.
| Characteristic | Number | Measure |
| Per Capita Income | 3,246 | $30,671 |
| Median Family Income | 709 | $84,850 |
| Mean Family Income | 709 | $93,386 |
| Median Household Income | 1,251 | $56,050 |
| Mean Household Income | 1,251 | $74,263 |
| Income Deficit | 709 | $0 |
| Wage / Income Gap (%) | 3,246 | 40.06% |
| Wage / Income Gap ($) | 3,246 | 59.94¢ per $1 |
| Gini / Inequality Index | 3,246 | 0.41 |
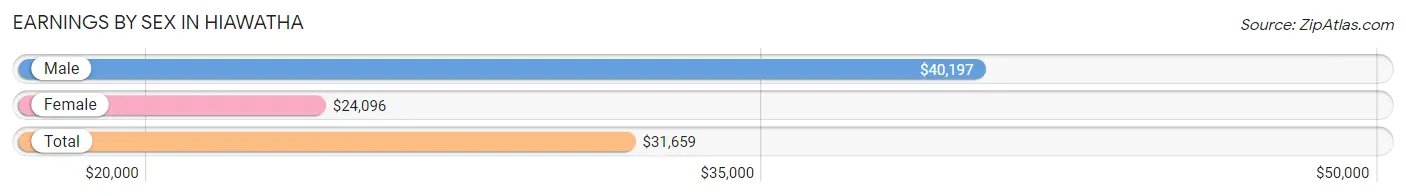
Earnings by Sex in Hiawatha
Average Earnings in Hiawatha are $31,659, $40,197 for men and $24,096 for women, a difference of 40.1%.
| Sex | Number | Average Earnings |
| Male | 950 (50.2%) | $40,197 |
| Female | 943 (49.8%) | $24,096 |
| Total | 1,893 (100.0%) | $31,659 |
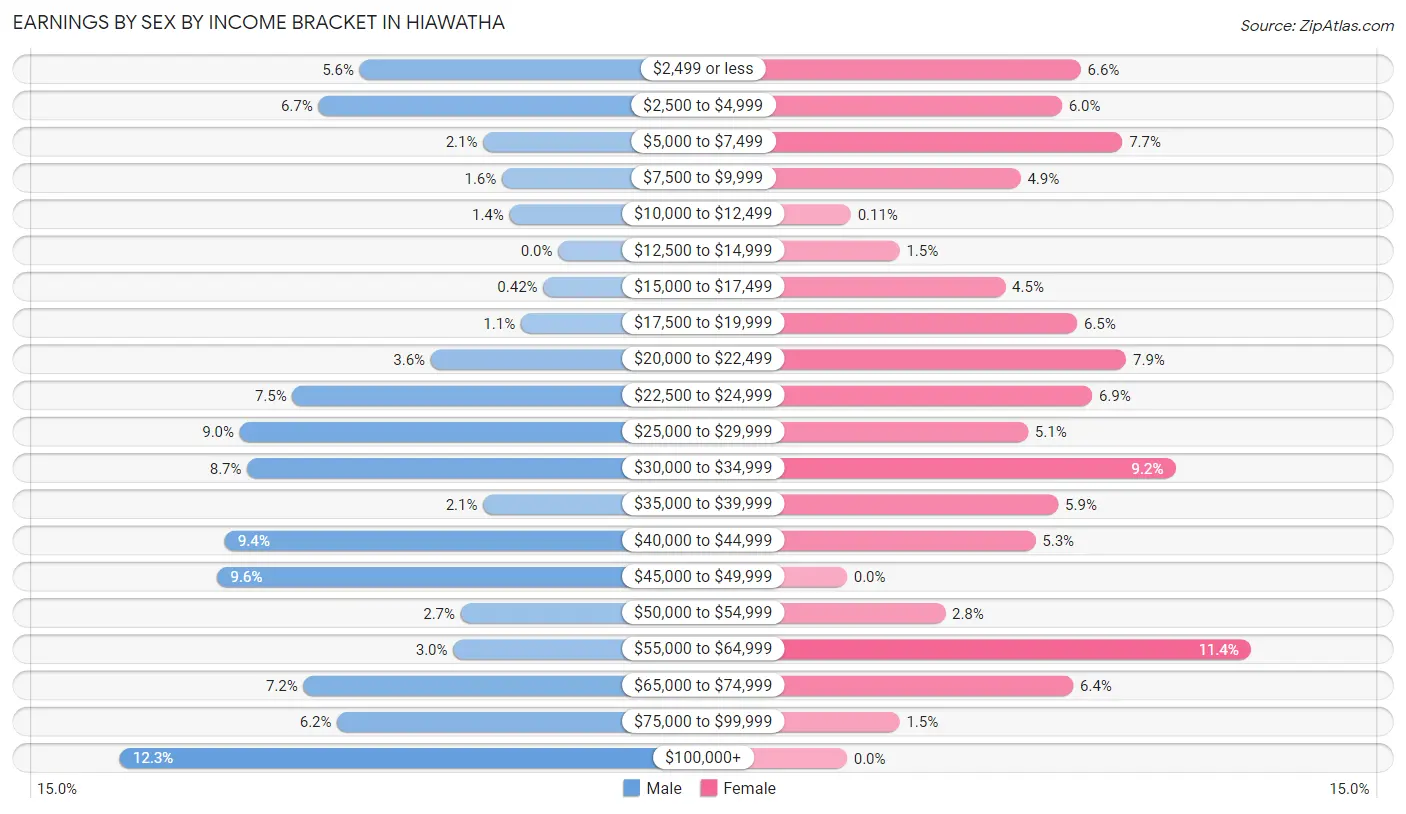
Earnings by Sex by Income Bracket in Hiawatha
The most common earnings brackets in Hiawatha are $100,000+ for men (117 | 12.3%) and $55,000 to $64,999 for women (107 | 11.4%).
| Income | Male | Female |
| $2,499 or less | 53 (5.6%) | 62 (6.6%) |
| $2,500 to $4,999 | 64 (6.7%) | 57 (6.0%) |
| $5,000 to $7,499 | 20 (2.1%) | 73 (7.7%) |
| $7,500 to $9,999 | 15 (1.6%) | 46 (4.9%) |
| $10,000 to $12,499 | 13 (1.4%) | 1 (0.1%) |
| $12,500 to $14,999 | 0 (0.0%) | 14 (1.5%) |
| $15,000 to $17,499 | 4 (0.4%) | 42 (4.4%) |
| $17,500 to $19,999 | 10 (1.1%) | 61 (6.5%) |
| $20,000 to $22,499 | 34 (3.6%) | 74 (7.9%) |
| $22,500 to $24,999 | 71 (7.5%) | 65 (6.9%) |
| $25,000 to $29,999 | 85 (8.9%) | 48 (5.1%) |
| $30,000 to $34,999 | 83 (8.7%) | 87 (9.2%) |
| $35,000 to $39,999 | 20 (2.1%) | 56 (5.9%) |
| $40,000 to $44,999 | 89 (9.4%) | 50 (5.3%) |
| $45,000 to $49,999 | 91 (9.6%) | 0 (0.0%) |
| $50,000 to $54,999 | 26 (2.7%) | 26 (2.8%) |
| $55,000 to $64,999 | 28 (2.9%) | 107 (11.4%) |
| $65,000 to $74,999 | 68 (7.2%) | 60 (6.4%) |
| $75,000 to $99,999 | 59 (6.2%) | 14 (1.5%) |
| $100,000+ | 117 (12.3%) | 0 (0.0%) |
| Total | 950 (100.0%) | 943 (100.0%) |
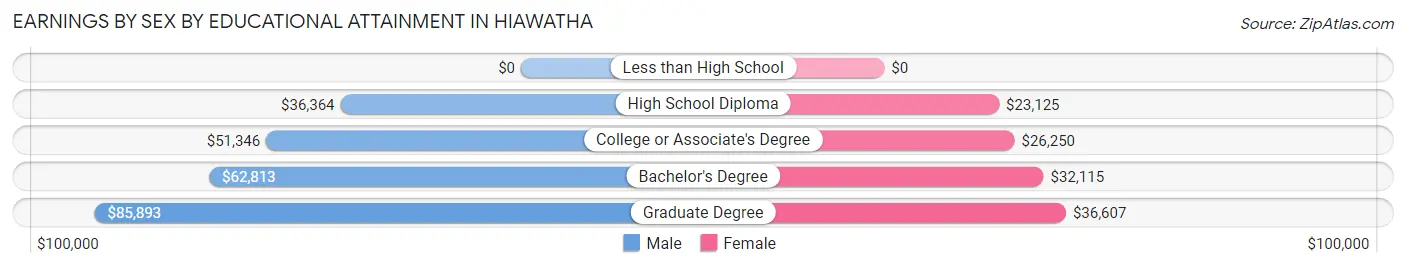
Earnings by Sex by Educational Attainment in Hiawatha
Average earnings in Hiawatha are $44,020 for men and $27,417 for women, a difference of 37.7%. Men with an educational attainment of graduate degree enjoy the highest average annual earnings of $85,893, while those with high school diploma education earn the least with $36,364. Women with an educational attainment of graduate degree earn the most with the average annual earnings of $36,607, while those with high school diploma education have the smallest earnings of $23,125.
| Educational Attainment | Male Income | Female Income |
| Less than High School | - | - |
| High School Diploma | $36,364 | $23,125 |
| College or Associate's Degree | $51,346 | $26,250 |
| Bachelor's Degree | $62,813 | $32,115 |
| Graduate Degree | $85,893 | $36,607 |
| Total | $44,020 | $27,417 |
Family Income in Hiawatha
Family Income Brackets in Hiawatha
According to the Hiawatha family income data, there are 176 families falling into the $100,000 to $149,999 income range, which is the most common income bracket and makes up 24.8% of all families. Conversely, the $10,000 to $14,999 income bracket is the least frequent group with only 12 families (1.7%) belonging to this category.
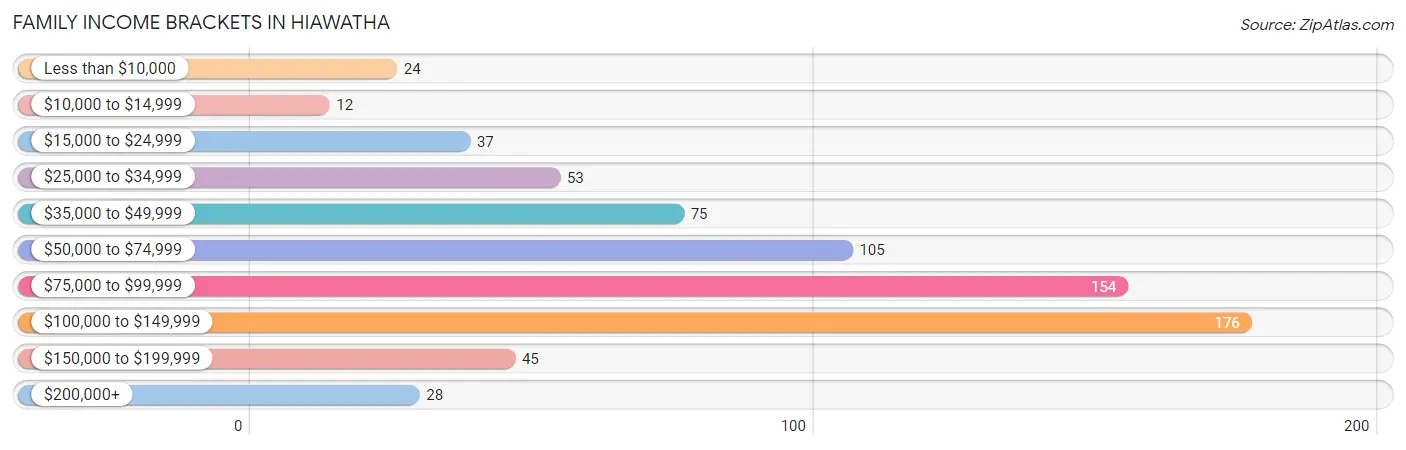
| Income Bracket | # Families | % Families |
| Less than $10,000 | 24 | 3.4% |
| $10,000 to $14,999 | 12 | 1.7% |
| $15,000 to $24,999 | 37 | 5.2% |
| $25,000 to $34,999 | 53 | 7.5% |
| $35,000 to $49,999 | 75 | 10.6% |
| $50,000 to $74,999 | 105 | 14.8% |
| $75,000 to $99,999 | 154 | 21.7% |
| $100,000 to $149,999 | 176 | 24.8% |
| $150,000 to $199,999 | 45 | 6.3% |
| $200,000+ | 28 | 3.9% |
Family Income by Famaliy Size in Hiawatha
4-person families (125 | 17.6%) account for the highest median family income in Hiawatha with $86,875 per family, while 3-person families (114 | 16.1%) have the highest median income of $28,819 per family member.
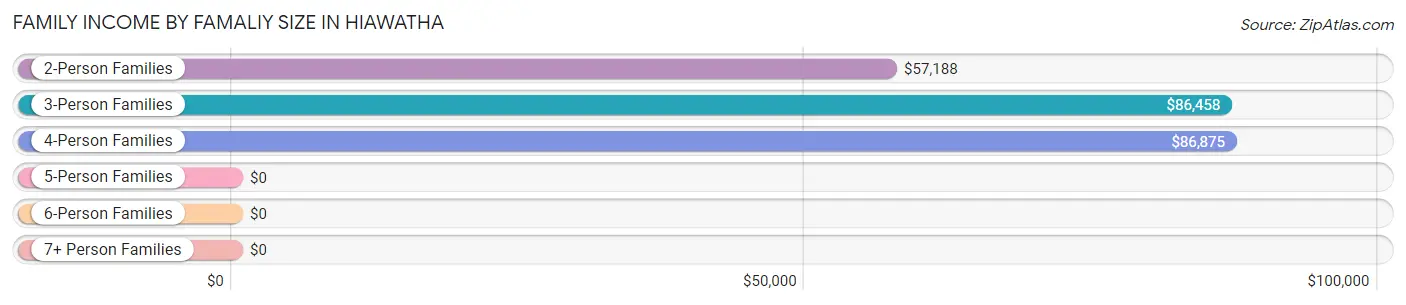
| Income Bracket | # Families | Median Income |
| 2-Person Families | 352 (49.6%) | $57,188 |
| 3-Person Families | 114 (16.1%) | $86,458 |
| 4-Person Families | 125 (17.6%) | $86,875 |
| 5-Person Families | 88 (12.4%) | $0 |
| 6-Person Families | 24 (3.4%) | $0 |
| 7+ Person Families | 6 (0.9%) | $0 |
| Total | 709 (100.0%) | $84,850 |
Family Income by Number of Earners in Hiawatha
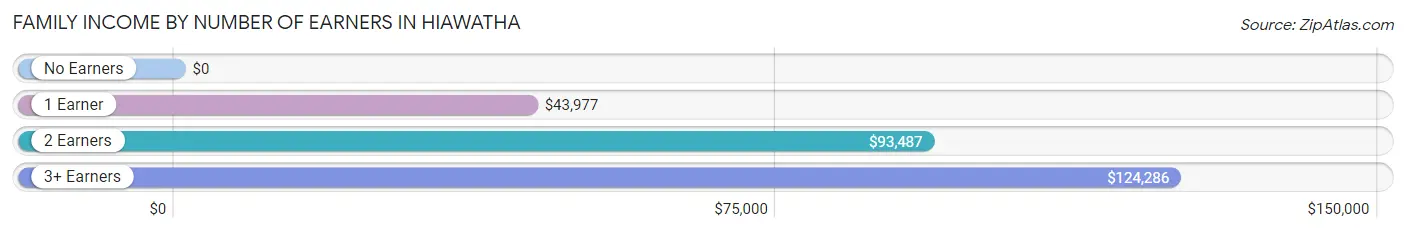
| Number of Earners | # Families | Median Income |
| No Earners | 75 (10.6%) | $0 |
| 1 Earner | 150 (21.2%) | $43,977 |
| 2 Earners | 390 (55.0%) | $93,487 |
| 3+ Earners | 94 (13.3%) | $124,286 |
| Total | 709 (100.0%) | $84,850 |
Household Income in Hiawatha
Household Income Brackets in Hiawatha
With 241 households falling in the category, the $75,000 to $99,999 income range is the most frequent in Hiawatha, accounting for 19.3% of all households. In contrast, only 41 households (3.3%) fall into the $200,000+ income bracket, making it the least populous group.
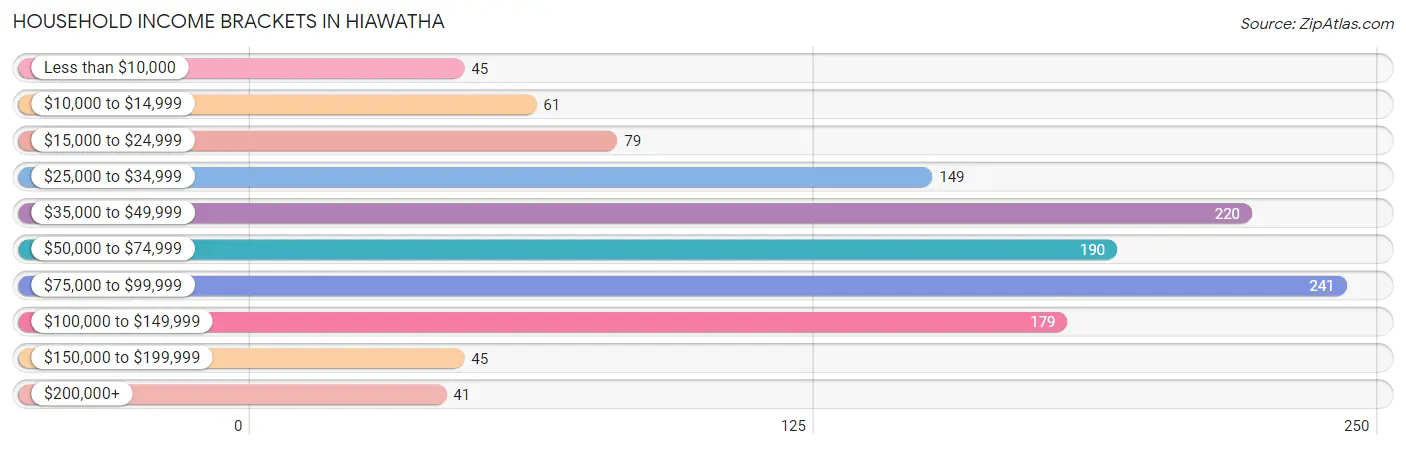
| Income Bracket | # Households | % Households |
| Less than $10,000 | 45 | 3.6% |
| $10,000 to $14,999 | 61 | 4.9% |
| $15,000 to $24,999 | 79 | 6.3% |
| $25,000 to $34,999 | 149 | 11.9% |
| $35,000 to $49,999 | 220 | 17.6% |
| $50,000 to $74,999 | 190 | 15.2% |
| $75,000 to $99,999 | 241 | 19.3% |
| $100,000 to $149,999 | 179 | 14.3% |
| $150,000 to $199,999 | 45 | 3.6% |
| $200,000+ | 41 | 3.3% |
Household Income by Householder Age in Hiawatha
The median household income in Hiawatha is $56,050, with the highest median household income of $87,396 found in the 45 to 64 years age bracket for the primary householder. A total of 509 households (40.7%) fall into this category. Meanwhile, the 65+ years age bracket for the primary householder has the lowest median household income of $34,612, with 357 households (28.5%) in this group.
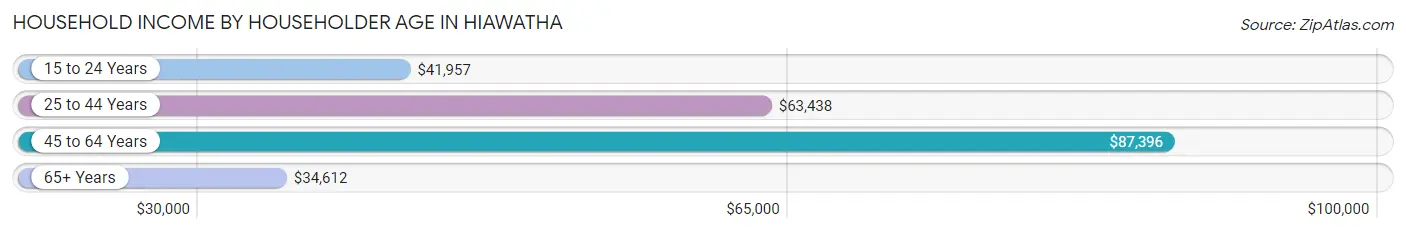
| Income Bracket | # Households | Median Income |
| 15 to 24 Years | 36 (2.9%) | $41,957 |
| 25 to 44 Years | 349 (27.9%) | $63,438 |
| 45 to 64 Years | 509 (40.7%) | $87,396 |
| 65+ Years | 357 (28.5%) | $34,612 |
| Total | 1,251 (100.0%) | $56,050 |
Poverty in Hiawatha
Income Below Poverty by Sex and Age in Hiawatha
With 5.5% poverty level for males and 12.6% for females among the residents of Hiawatha, 12 to 14 year old males and 18 to 24 year old females are the most vulnerable to poverty, with 19 males (23.5%) and 33 females (28.2%) in their respective age groups living below the poverty level.
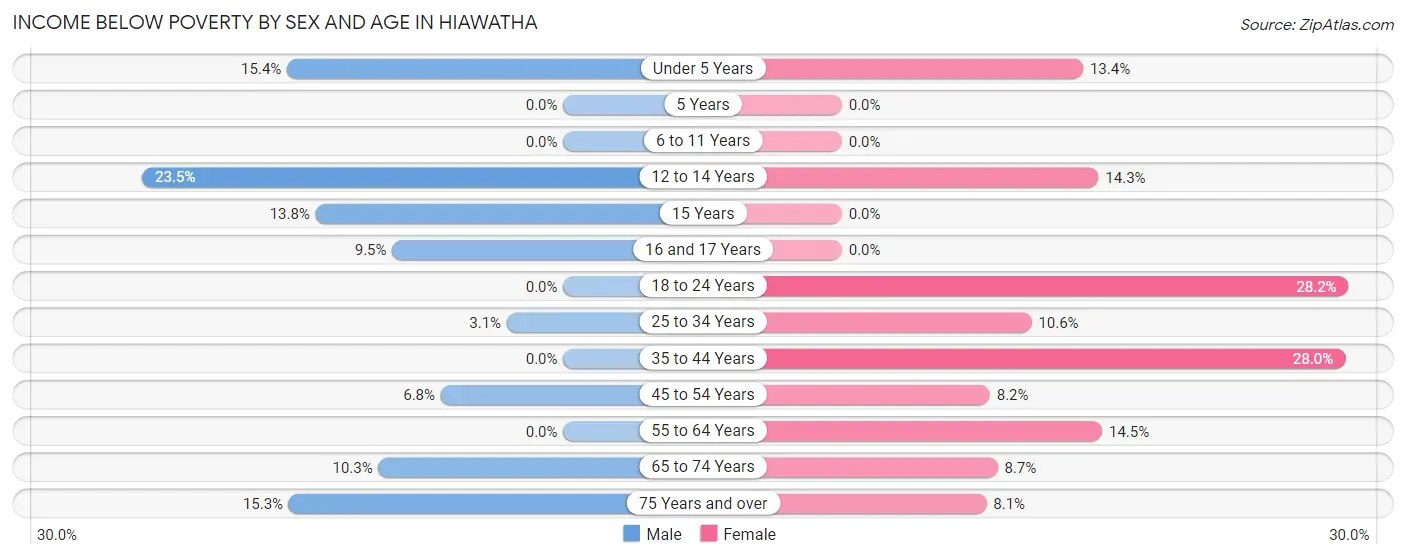
| Age Bracket | Male | Female |
| Under 5 Years | 8 (15.4%) | 9 (13.4%) |
| 5 Years | 0 (0.0%) | 0 (0.0%) |
| 6 to 11 Years | 0 (0.0%) | 0 (0.0%) |
| 12 to 14 Years | 19 (23.5%) | 10 (14.3%) |
| 15 Years | 4 (13.8%) | 0 (0.0%) |
| 16 and 17 Years | 4 (9.5%) | 0 (0.0%) |
| 18 to 24 Years | 0 (0.0%) | 33 (28.2%) |
| 25 to 34 Years | 6 (3.1%) | 15 (10.6%) |
| 35 to 44 Years | 0 (0.0%) | 72 (28.0%) |
| 45 to 54 Years | 15 (6.8%) | 14 (8.2%) |
| 55 to 64 Years | 0 (0.0%) | 31 (14.5%) |
| 65 to 74 Years | 14 (10.3%) | 17 (8.7%) |
| 75 Years and over | 11 (15.3%) | 12 (8.1%) |
| Total | 81 (5.5%) | 213 (12.6%) |
Income Above Poverty by Sex and Age in Hiawatha
According to the poverty statistics in Hiawatha, males aged 5 years and females aged 5 years are the age groups that are most secure financially, with 100.0% of males and 100.0% of females in these age groups living above the poverty line.
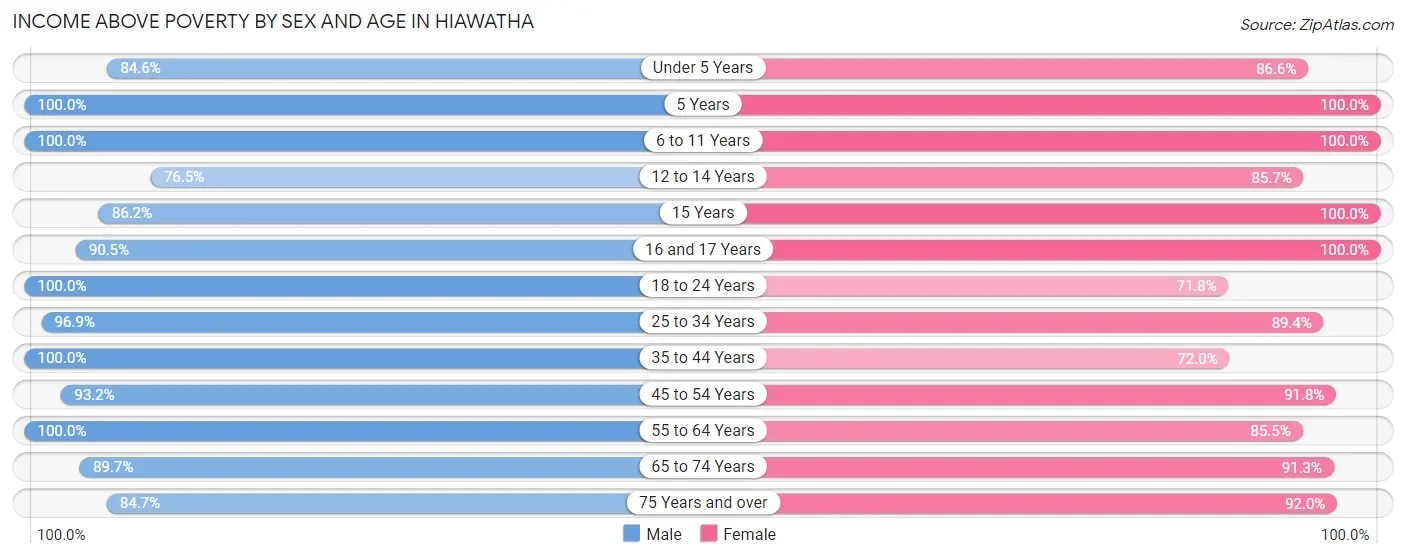
| Age Bracket | Male | Female |
| Under 5 Years | 44 (84.6%) | 58 (86.6%) |
| 5 Years | 15 (100.0%) | 12 (100.0%) |
| 6 to 11 Years | 168 (100.0%) | 222 (100.0%) |
| 12 to 14 Years | 62 (76.5%) | 60 (85.7%) |
| 15 Years | 25 (86.2%) | 17 (100.0%) |
| 16 and 17 Years | 38 (90.5%) | 57 (100.0%) |
| 18 to 24 Years | 90 (100.0%) | 84 (71.8%) |
| 25 to 34 Years | 185 (96.9%) | 127 (89.4%) |
| 35 to 44 Years | 167 (100.0%) | 185 (72.0%) |
| 45 to 54 Years | 205 (93.2%) | 156 (91.8%) |
| 55 to 64 Years | 210 (100.0%) | 183 (85.5%) |
| 65 to 74 Years | 122 (89.7%) | 179 (91.3%) |
| 75 Years and over | 61 (84.7%) | 137 (91.9%) |
| Total | 1,392 (94.5%) | 1,477 (87.4%) |
Income Below Poverty Among Married-Couple Families in Hiawatha
The poverty statistics for married-couple families in Hiawatha show that 7.1% or 41 of the total 580 families live below the poverty line. Families with no children have the highest poverty rate of 8.8%, comprising of 26 families. On the other hand, families with 3 or 4 children have the lowest poverty rate of 0.0%, which includes 0 families.
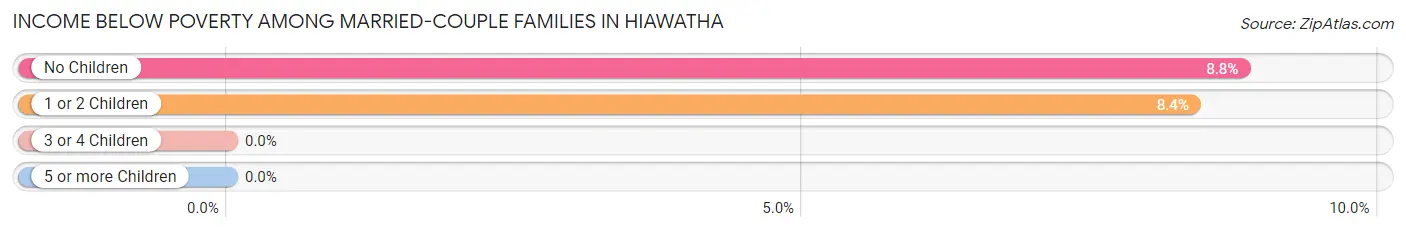
| Children | Above Poverty | Below Poverty |
| No Children | 269 (91.2%) | 26 (8.8%) |
| 1 or 2 Children | 164 (91.6%) | 15 (8.4%) |
| 3 or 4 Children | 106 (100.0%) | 0 (0.0%) |
| 5 or more Children | 0 (0.0%) | 0 (0.0%) |
| Total | 539 (92.9%) | 41 (7.1%) |
Income Below Poverty Among Single-Parent Households in Hiawatha
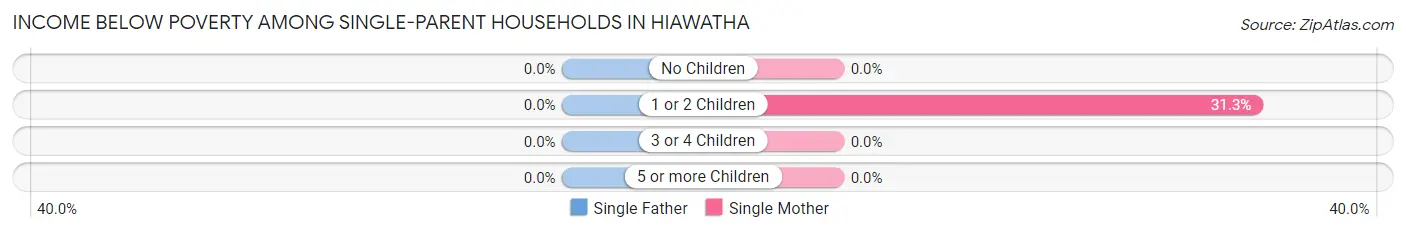
| Children | Single Father | Single Mother |
| No Children | 0 (0.0%) | 0 (0.0%) |
| 1 or 2 Children | 0 (0.0%) | 10 (31.2%) |
| 3 or 4 Children | 0 (0.0%) | 0 (0.0%) |
| 5 or more Children | 0 (0.0%) | 0 (0.0%) |
| Total | 0 (0.0%) | 10 (12.7%) |
Income Below Poverty Among Married-Couple vs Single-Parent Households in Hiawatha
The poverty data for Hiawatha shows that 41 of the married-couple family households (7.1%) and 10 of the single-parent households (7.7%) are living below the poverty level. Within the married-couple family households, those with no children have the highest poverty rate, with 26 households (8.8%) falling below the poverty line. Among the single-parent households, those with 1 or 2 children have the highest poverty rate, with 10 household (19.6%) living below poverty.
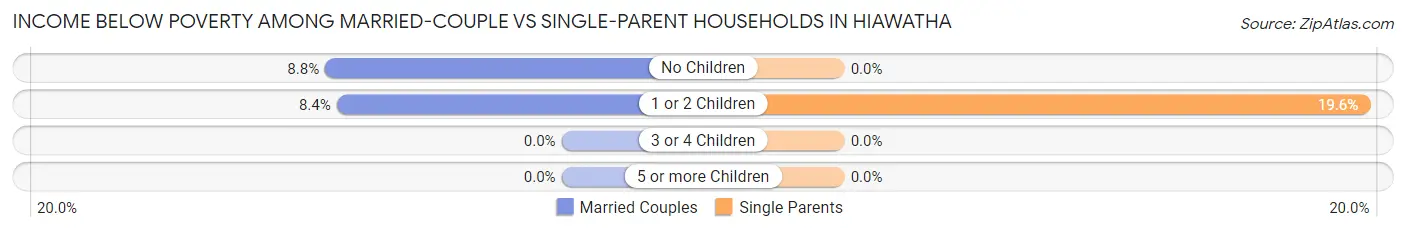
| Children | Married-Couple Families | Single-Parent Households |
| No Children | 26 (8.8%) | 0 (0.0%) |
| 1 or 2 Children | 15 (8.4%) | 10 (19.6%) |
| 3 or 4 Children | 0 (0.0%) | 0 (0.0%) |
| 5 or more Children | 0 (0.0%) | 0 (0.0%) |
| Total | 41 (7.1%) | 10 (7.7%) |
Race in Hiawatha
The most populous races in Hiawatha are White / Caucasian (2,894 | 89.2%), Two or more Races (198 | 6.1%), and Some other Race (61 | 1.9%).
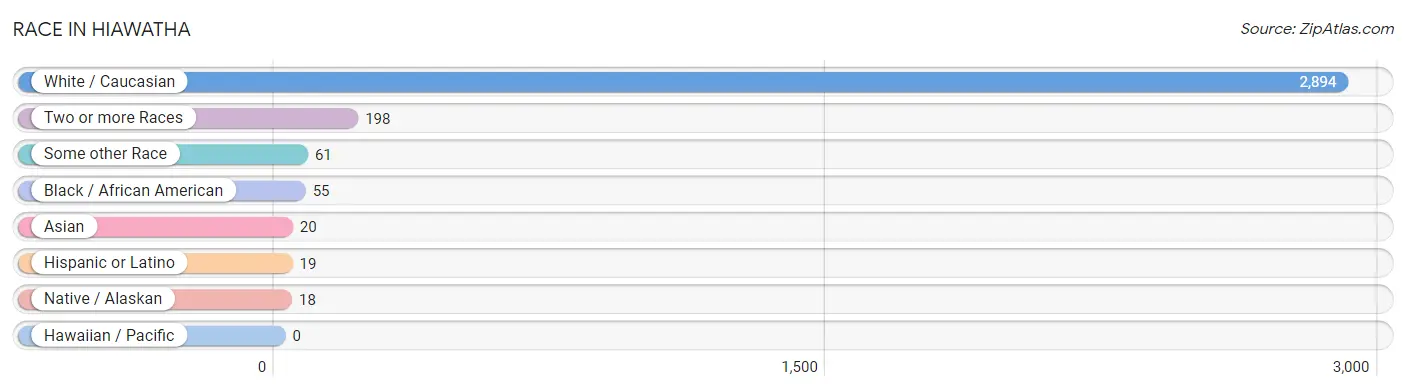
| Race | # Population | % Population |
| Asian | 20 | 0.6% |
| Black / African American | 55 | 1.7% |
| Hawaiian / Pacific | 0 | 0.0% |
| Hispanic or Latino | 19 | 0.6% |
| Native / Alaskan | 18 | 0.5% |
| White / Caucasian | 2,894 | 89.2% |
| Two or more Races | 198 | 6.1% |
| Some other Race | 61 | 1.9% |
| Total | 3,246 | 100.0% |
Ancestry in Hiawatha
The most populous ancestries reported in Hiawatha are German (988 | 30.4%), English (364 | 11.2%), Irish (291 | 9.0%), American (156 | 4.8%), and Polish (120 | 3.7%), together accounting for 59.1% of all Hiawatha residents.
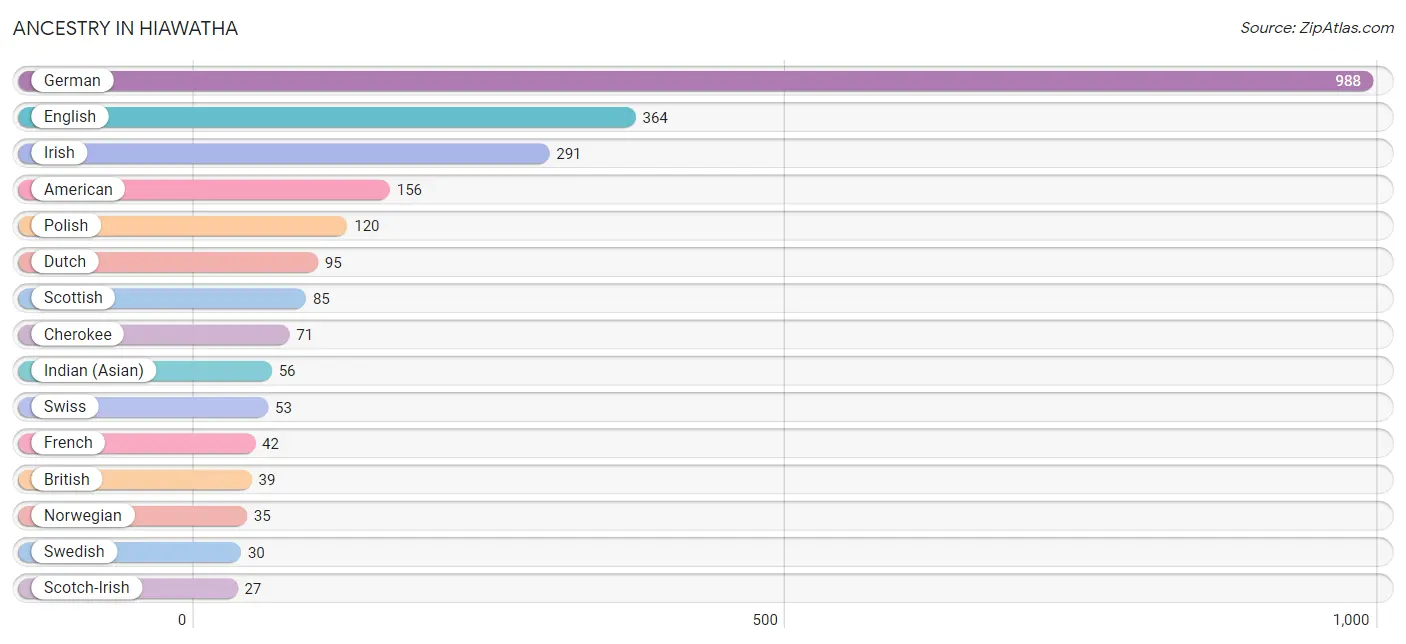
| Ancestry | # Population | % Population |
| African | 9 | 0.3% |
| American | 156 | 4.8% |
| British | 39 | 1.2% |
| Cherokee | 71 | 2.2% |
| Cuban | 5 | 0.2% |
| Dutch | 95 | 2.9% |
| English | 364 | 11.2% |
| European | 9 | 0.3% |
| French | 42 | 1.3% |
| French Canadian | 10 | 0.3% |
| German | 988 | 30.4% |
| Icelander | 9 | 0.3% |
| Indian (Asian) | 56 | 1.7% |
| Irish | 291 | 9.0% |
| Italian | 23 | 0.7% |
| Mexican | 14 | 0.4% |
| Norwegian | 35 | 1.1% |
| Polish | 120 | 3.7% |
| Potawatomi | 8 | 0.3% |
| Scotch-Irish | 27 | 0.8% |
| Scottish | 85 | 2.6% |
| Sioux | 8 | 0.3% |
| Subsaharan African | 9 | 0.3% |
| Swedish | 30 | 0.9% |
| Swiss | 53 | 1.6% | View All 25 Rows |
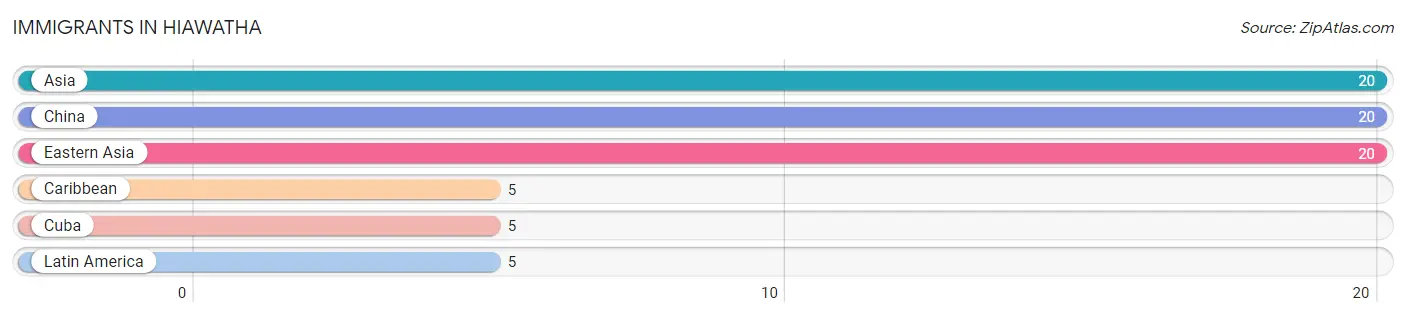
Immigrants in Hiawatha
The most numerous immigrant groups reported in Hiawatha came from Asia (20 | 0.6%), China (20 | 0.6%), Eastern Asia (20 | 0.6%), Caribbean (5 | 0.2%), and Cuba (5 | 0.2%), together accounting for 2.2% of all Hiawatha residents.
| Immigration Origin | # Population | % Population |
| Asia | 20 | 0.6% |
| Caribbean | 5 | 0.2% |
| China | 20 | 0.6% |
| Cuba | 5 | 0.2% |
| Eastern Asia | 20 | 0.6% |
| Latin America | 5 | 0.2% | View All 6 Rows |
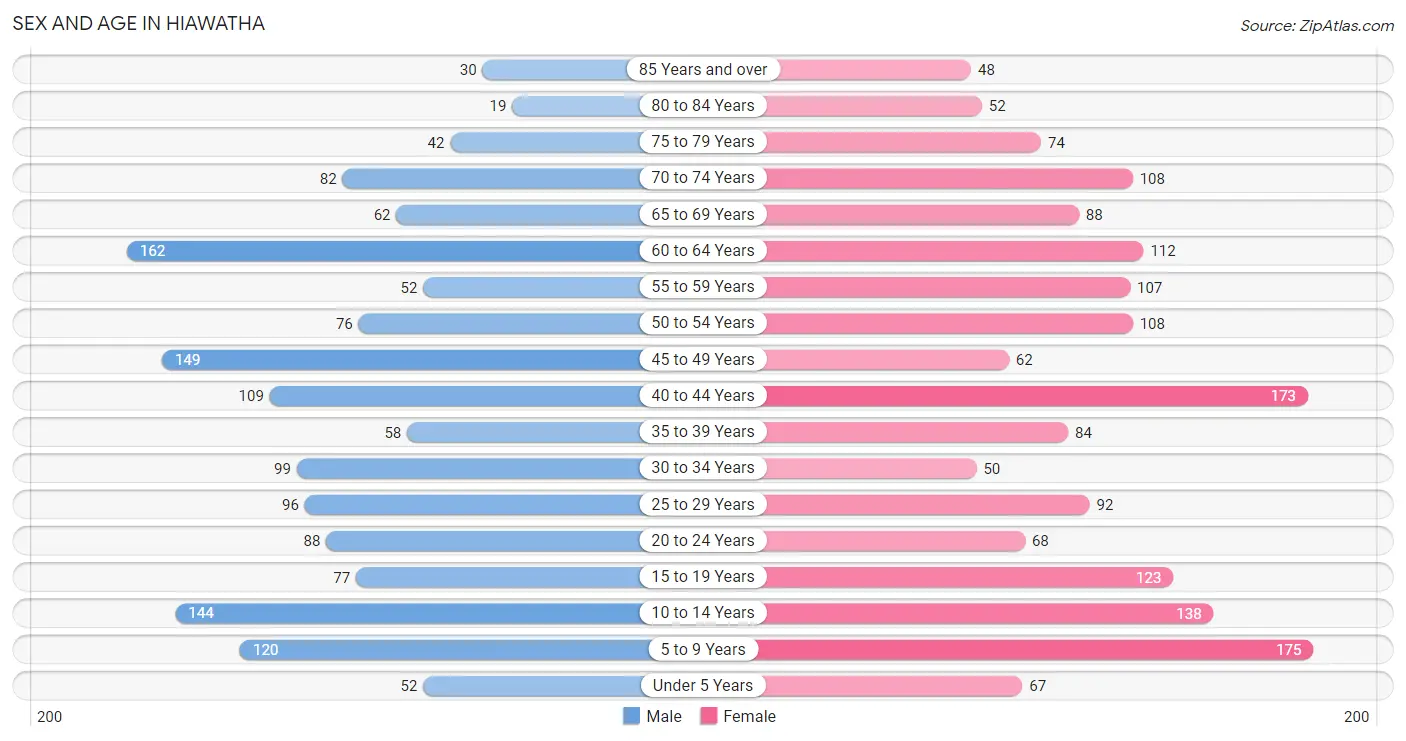
Sex and Age in Hiawatha
Sex and Age in Hiawatha
The most populous age groups in Hiawatha are 60 to 64 Years (162 | 10.7%) for men and 5 to 9 Years (175 | 10.1%) for women.
| Age Bracket | Male | Female |
| Under 5 Years | 52 (3.4%) | 67 (3.9%) |
| 5 to 9 Years | 120 (7.9%) | 175 (10.1%) |
| 10 to 14 Years | 144 (9.5%) | 138 (8.0%) |
| 15 to 19 Years | 77 (5.1%) | 123 (7.1%) |
| 20 to 24 Years | 88 (5.8%) | 68 (3.9%) |
| 25 to 29 Years | 96 (6.3%) | 92 (5.3%) |
| 30 to 34 Years | 99 (6.5%) | 50 (2.9%) |
| 35 to 39 Years | 58 (3.8%) | 84 (4.9%) |
| 40 to 44 Years | 109 (7.2%) | 173 (10.0%) |
| 45 to 49 Years | 149 (9.8%) | 62 (3.6%) |
| 50 to 54 Years | 76 (5.0%) | 108 (6.2%) |
| 55 to 59 Years | 52 (3.4%) | 107 (6.2%) |
| 60 to 64 Years | 162 (10.7%) | 112 (6.5%) |
| 65 to 69 Years | 62 (4.1%) | 88 (5.1%) |
| 70 to 74 Years | 82 (5.4%) | 108 (6.2%) |
| 75 to 79 Years | 42 (2.8%) | 74 (4.3%) |
| 80 to 84 Years | 19 (1.3%) | 52 (3.0%) |
| 85 Years and over | 30 (2.0%) | 48 (2.8%) |
| Total | 1,517 (100.0%) | 1,729 (100.0%) |
Families and Households in Hiawatha
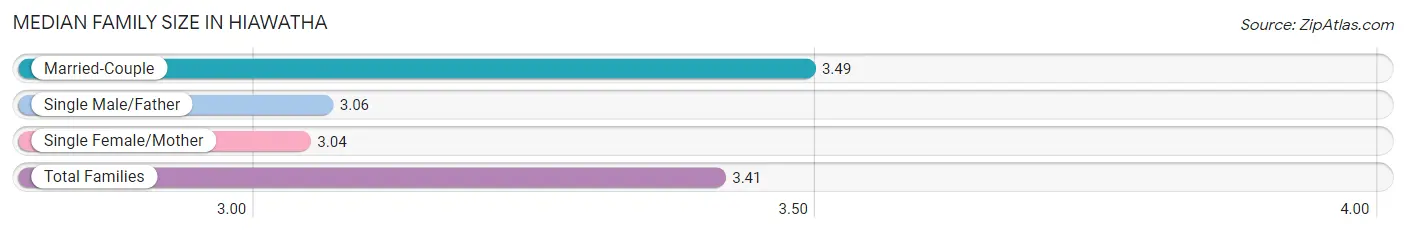
Median Family Size in Hiawatha
The median family size in Hiawatha is 3.41 persons per family, with married-couple families (580 | 81.8%) accounting for the largest median family size of 3.49 persons per family. On the other hand, single female/mother families (79 | 11.1%) represent the smallest median family size with 3.04 persons per family.
| Family Type | # Families | Family Size |
| Married-Couple | 580 (81.8%) | 3.49 |
| Single Male/Father | 50 (7.0%) | 3.06 |
| Single Female/Mother | 79 (11.1%) | 3.04 |
| Total Families | 709 (100.0%) | 3.41 |
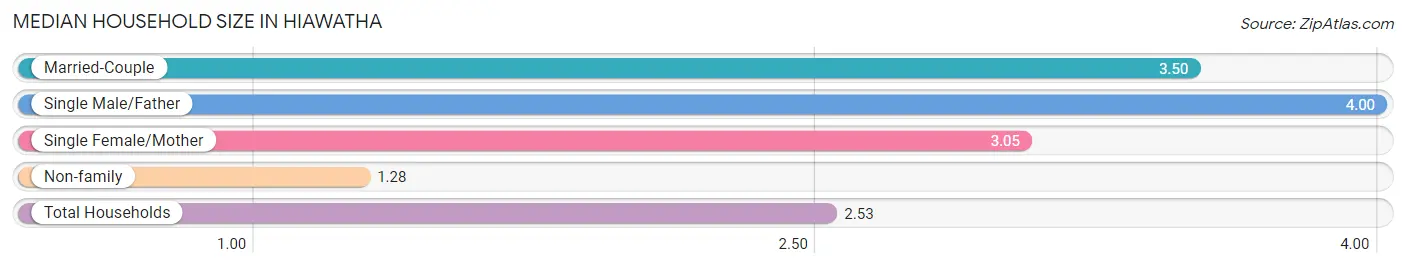
Median Household Size in Hiawatha
The median household size in Hiawatha is 2.53 persons per household, with single male/father households (50 | 4.0%) accounting for the largest median household size of 4 persons per household. non-family households (542 | 43.3%) represent the smallest median household size with 1.28 persons per household.
| Household Type | # Households | Household Size |
| Married-Couple | 580 (46.4%) | 3.50 |
| Single Male/Father | 50 (4.0%) | 4.00 |
| Single Female/Mother | 79 (6.3%) | 3.05 |
| Non-family | 542 (43.3%) | 1.28 |
| Total Households | 1,251 (100.0%) | 2.53 |
Household Size by Marriage Status in Hiawatha
Out of a total of 1,251 households in Hiawatha, 709 (56.7%) are family households, while 542 (43.3%) are nonfamily households. The most numerous type of family households are 2-person households, comprising 308, and the most common type of nonfamily households are 1-person households, comprising 440.
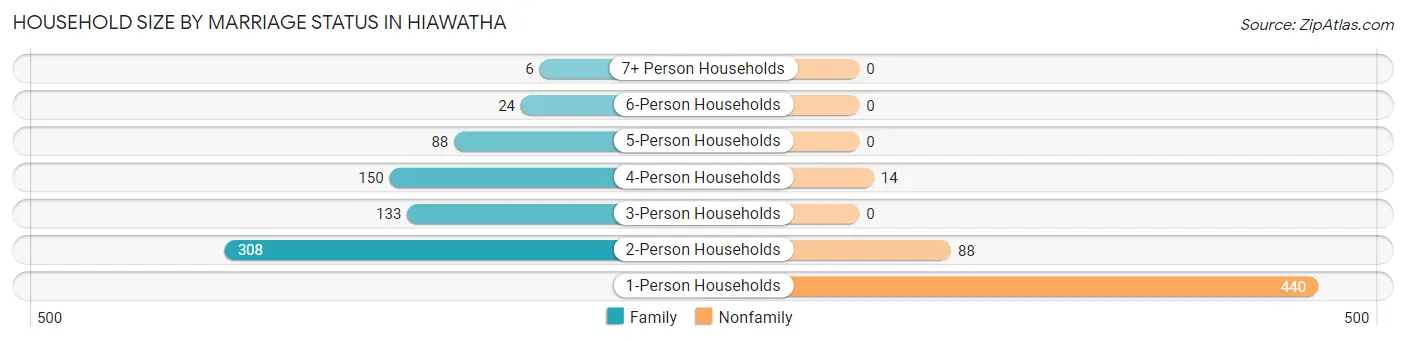
| Household Size | Family Households | Nonfamily Households |
| 1-Person Households | - | 440 (35.2%) |
| 2-Person Households | 308 (24.6%) | 88 (7.0%) |
| 3-Person Households | 133 (10.6%) | 0 (0.0%) |
| 4-Person Households | 150 (12.0%) | 14 (1.1%) |
| 5-Person Households | 88 (7.0%) | 0 (0.0%) |
| 6-Person Households | 24 (1.9%) | 0 (0.0%) |
| 7+ Person Households | 6 (0.5%) | 0 (0.0%) |
| Total | 709 (56.7%) | 542 (43.3%) |
Female Fertility in Hiawatha
Fertility by Age in Hiawatha
Average fertility rate in Hiawatha is 60.0 births per 1,000 women. Women in the age bracket of 20 to 34 years have the highest fertility rate with 190.0 births per 1,000 women. Women in the age bracket of 20 to 34 years acount for 100.0% of all women with births.
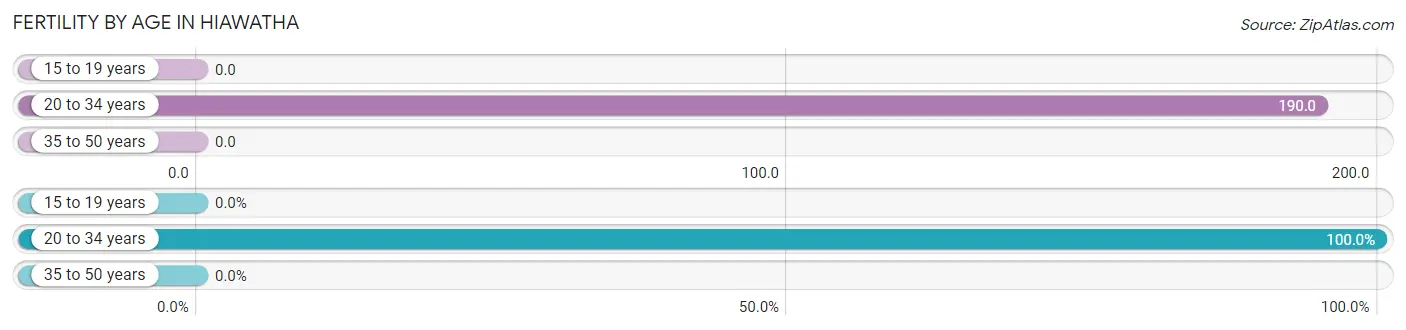
| Age Bracket | Women with Births | Births / 1,000 Women |
| 15 to 19 years | 0 (0.0%) | 0.0 |
| 20 to 34 years | 40 (100.0%) | 190.0 |
| 35 to 50 years | 0 (0.0%) | 0.0 |
| Total | 40 (100.0%) | 60.0 |
Fertility by Age by Marriage Status in Hiawatha
22.5% of women with births (40) in Hiawatha are married. The highest percentage of unmarried women with births falls into 20 to 34 years age bracket with 77.5% of them unmarried at the time of birth, while the lowest percentage of unmarried women with births belong to 20 to 34 years age bracket with 77.5% of them unmarried.
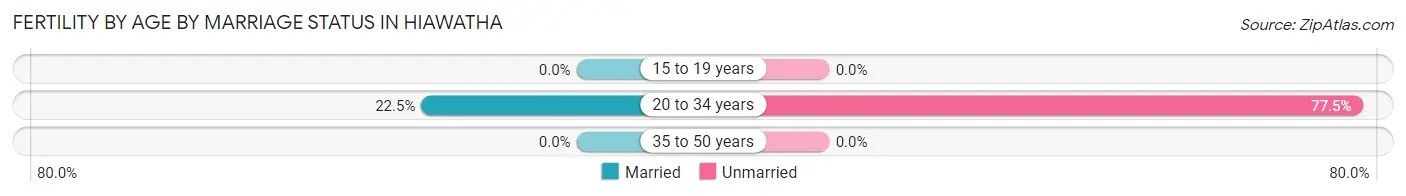
| Age Bracket | Married | Unmarried |
| 15 to 19 years | 0 (0.0%) | 0 (0.0%) |
| 20 to 34 years | 9 (22.5%) | 31 (77.5%) |
| 35 to 50 years | 0 (0.0%) | 0 (0.0%) |
| Total | 9 (22.5%) | 31 (77.5%) |
Fertility by Education in Hiawatha
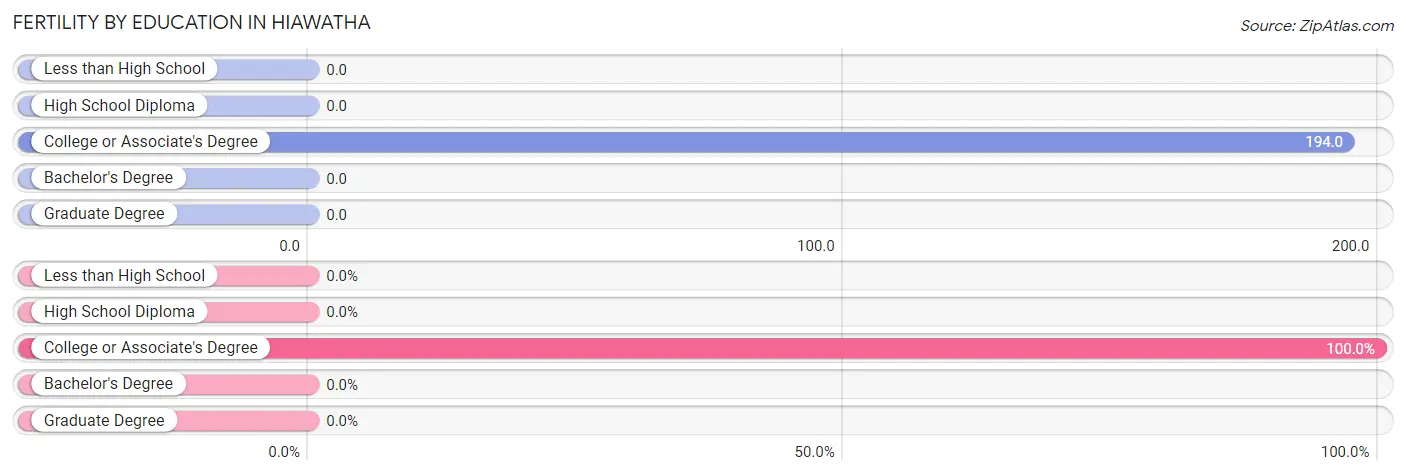
| Educational Attainment | Women with Births | Births / 1,000 Women |
| Less than High School | 0 (0.0%) | 0.0 |
| High School Diploma | 0 (0.0%) | 0.0 |
| College or Associate's Degree | 40 (100.0%) | 194.0 |
| Bachelor's Degree | 0 (0.0%) | 0.0 |
| Graduate Degree | 0 (0.0%) | 0.0 |
| Total | 40 (100.0%) | 60.0 |
Fertility by Education by Marriage Status in Hiawatha
77.5% of women with births in Hiawatha are unmarried. Women with the educational attainment of college or associate's degree are most likely to be married with 22.5% of them married at childbirth, while women with the educational attainment of college or associate's degree are least likely to be married with 77.5% of them unmarried at childbirth.
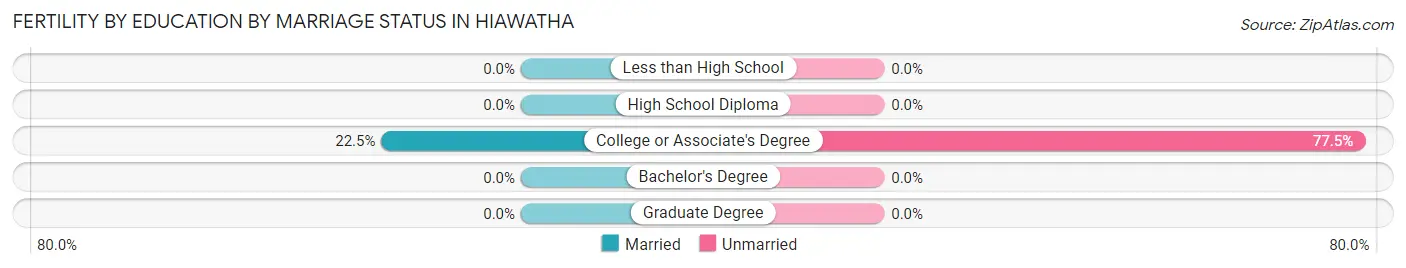
| Educational Attainment | Married | Unmarried |
| Less than High School | 0 (0.0%) | 0 (0.0%) |
| High School Diploma | 0 (0.0%) | 0 (0.0%) |
| College or Associate's Degree | 9 (22.5%) | 31 (77.5%) |
| Bachelor's Degree | 0 (0.0%) | 0 (0.0%) |
| Graduate Degree | 0 (0.0%) | 0 (0.0%) |
| Total | 9 (22.5%) | 31 (77.5%) |
Employment Characteristics in Hiawatha
Employment by Class of Employer in Hiawatha
Among the 1,675 employed individuals in Hiawatha, private company employees (1,053 | 62.9%), local government employees (243 | 14.5%), and not-for-profit organizations (239 | 14.3%) make up the most common classes of employment.
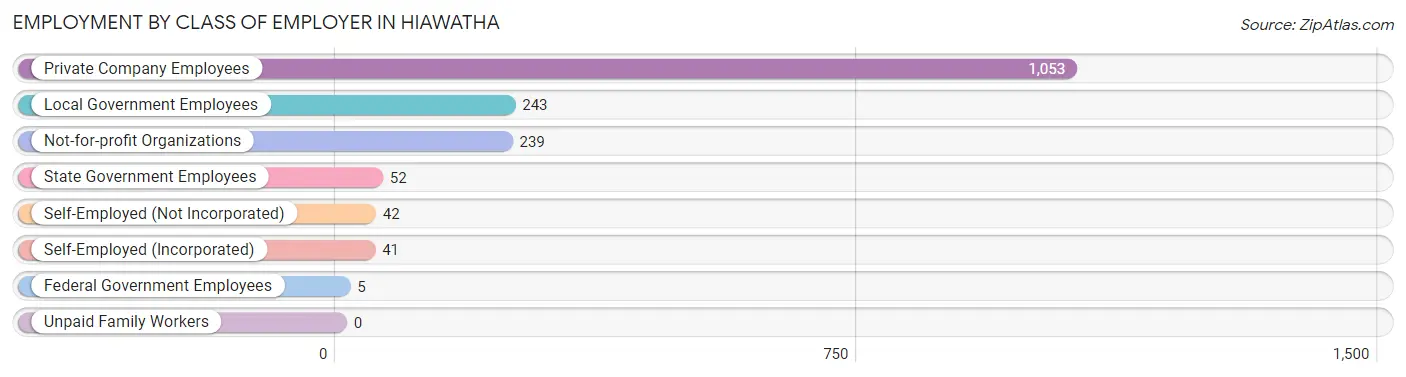
| Employer Class | # Employees | % Employees |
| Private Company Employees | 1,053 | 62.9% |
| Self-Employed (Incorporated) | 41 | 2.5% |
| Self-Employed (Not Incorporated) | 42 | 2.5% |
| Not-for-profit Organizations | 239 | 14.3% |
| Local Government Employees | 243 | 14.5% |
| State Government Employees | 52 | 3.1% |
| Federal Government Employees | 5 | 0.3% |
| Unpaid Family Workers | 0 | 0.0% |
| Total | 1,675 | 100.0% |
Employment Status by Age in Hiawatha
According to the labor force statistics for Hiawatha, out of the total population over 16 years of age (2,504), 70.8% or 1,773 individuals are in the labor force, with 4.5% or 80 of them unemployed. The age group with the highest labor force participation rate is 25 to 29 years, with 92.0% or 173 individuals in the labor force. Within the labor force, the 16 to 19 years age range has the highest percentage of unemployed individuals, with 37.3% or 19 of them being unemployed.
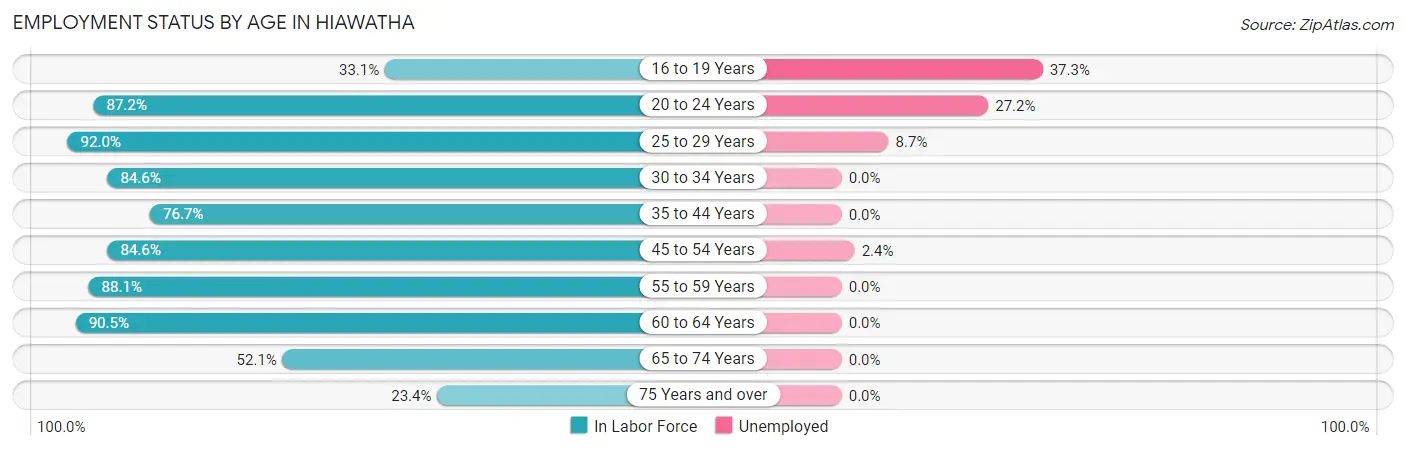
| Age Bracket | In Labor Force | Unemployed |
| 16 to 19 Years | 51 (33.1%) | 19 (37.3%) |
| 20 to 24 Years | 136 (87.2%) | 37 (27.2%) |
| 25 to 29 Years | 173 (92.0%) | 15 (8.7%) |
| 30 to 34 Years | 126 (84.6%) | 0 (0.0%) |
| 35 to 44 Years | 325 (76.7%) | 0 (0.0%) |
| 45 to 54 Years | 334 (84.6%) | 8 (2.4%) |
| 55 to 59 Years | 140 (88.1%) | 0 (0.0%) |
| 60 to 64 Years | 248 (90.5%) | 0 (0.0%) |
| 65 to 74 Years | 177 (52.1%) | 0 (0.0%) |
| 75 Years and over | 62 (23.4%) | 0 (0.0%) |
| Total | 1,773 (70.8%) | 80 (4.5%) |
Employment Status by Educational Attainment in Hiawatha
According to labor force statistics for Hiawatha, 84.7% of individuals (1,346) out of the total population between 25 and 64 years of age (1,589) are in the labor force, with 1.7% or 23 of them being unemployed. The group with the highest labor force participation rate are those with the educational attainment of bachelor's degree or higher, with 89.5% or 334 individuals in the labor force. Within the labor force, individuals with less than high school education have the highest percentage of unemployment, with 15.2% or 15 of them being unemployed.
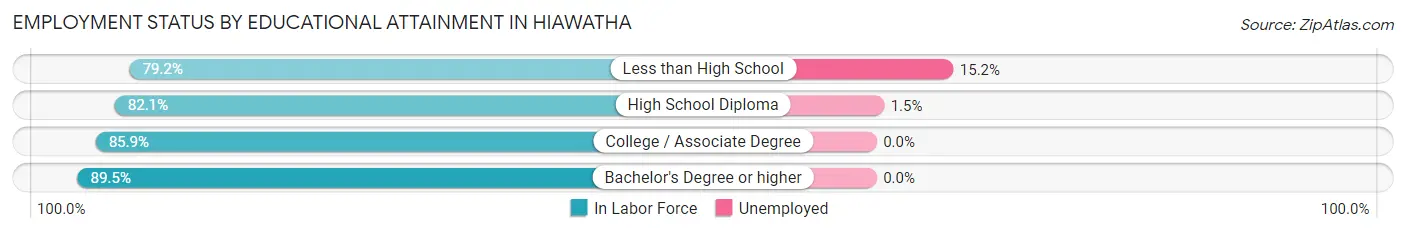
| Educational Attainment | In Labor Force | Unemployed |
| Less than High School | 99 (79.2%) | 19 (15.2%) |
| High School Diploma | 524 (82.1%) | 10 (1.5%) |
| College / Associate Degree | 389 (85.9%) | 0 (0.0%) |
| Bachelor's Degree or higher | 334 (89.5%) | 0 (0.0%) |
| Total | 1,346 (84.7%) | 27 (1.7%) |
Employment Occupations by Sex in Hiawatha
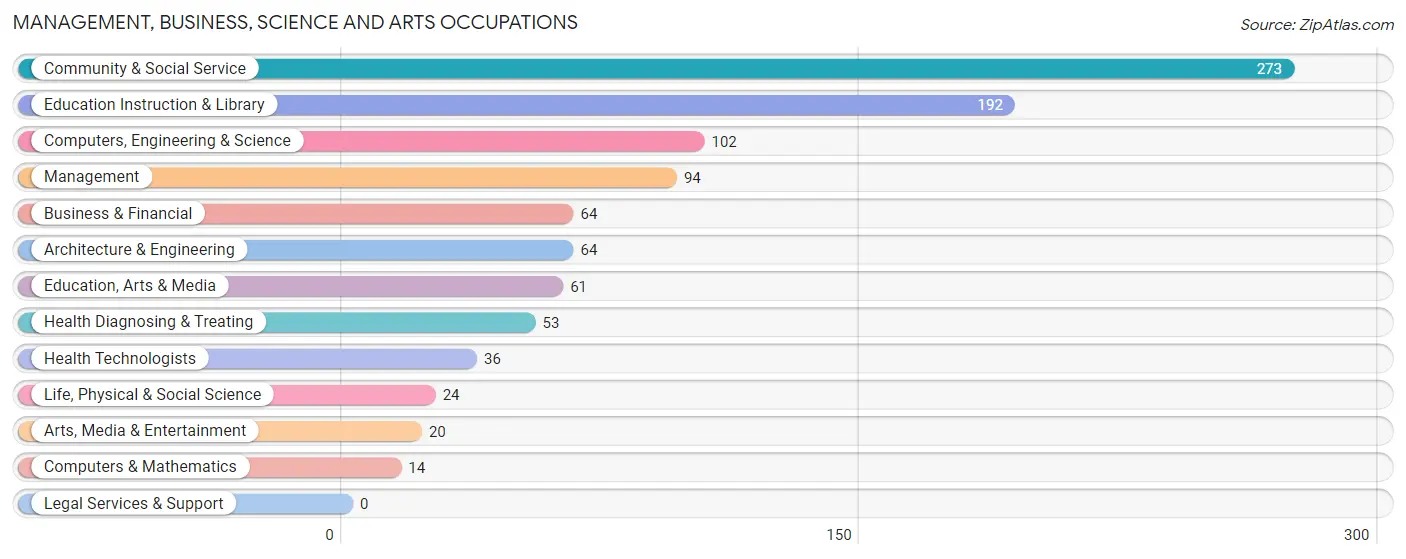
Management, Business, Science and Arts Occupations
The most common Management, Business, Science and Arts occupations in Hiawatha are Community & Social Service (273 | 16.1%), Education Instruction & Library (192 | 11.3%), Computers, Engineering & Science (102 | 6.0%), Management (94 | 5.6%), and Business & Financial (64 | 3.8%).
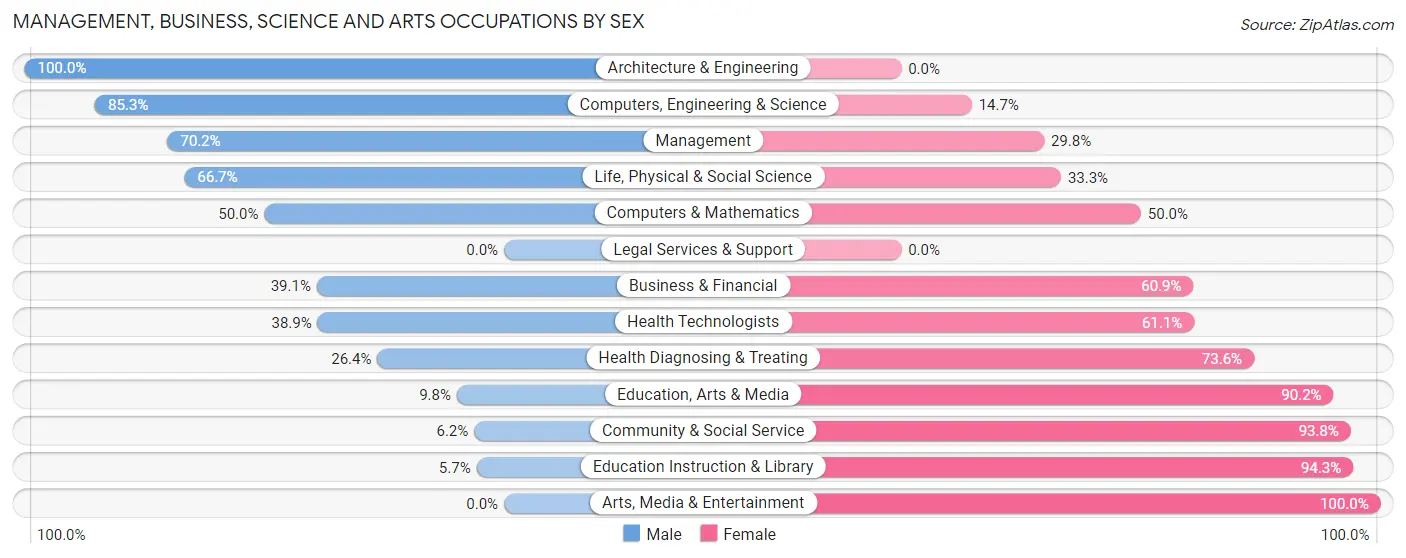
Management, Business, Science and Arts Occupations by Sex
Within the Management, Business, Science and Arts occupations in Hiawatha, the most male-oriented occupations are Architecture & Engineering (100.0%), Computers, Engineering & Science (85.3%), and Management (70.2%), while the most female-oriented occupations are Arts, Media & Entertainment (100.0%), Education Instruction & Library (94.3%), and Community & Social Service (93.8%).
| Occupation | Male | Female |
| Management | 66 (70.2%) | 28 (29.8%) |
| Business & Financial | 25 (39.1%) | 39 (60.9%) |
| Computers, Engineering & Science | 87 (85.3%) | 15 (14.7%) |
| Computers & Mathematics | 7 (50.0%) | 7 (50.0%) |
| Architecture & Engineering | 64 (100.0%) | 0 (0.0%) |
| Life, Physical & Social Science | 16 (66.7%) | 8 (33.3%) |
| Community & Social Service | 17 (6.2%) | 256 (93.8%) |
| Education, Arts & Media | 6 (9.8%) | 55 (90.2%) |
| Legal Services & Support | 0 (0.0%) | 0 (0.0%) |
| Education Instruction & Library | 11 (5.7%) | 181 (94.3%) |
| Arts, Media & Entertainment | 0 (0.0%) | 20 (100.0%) |
| Health Diagnosing & Treating | 14 (26.4%) | 39 (73.6%) |
| Health Technologists | 14 (38.9%) | 22 (61.1%) |
| Total (Category) | 209 (35.7%) | 377 (64.3%) |
| Total (Overall) | 814 (48.1%) | 879 (51.9%) |
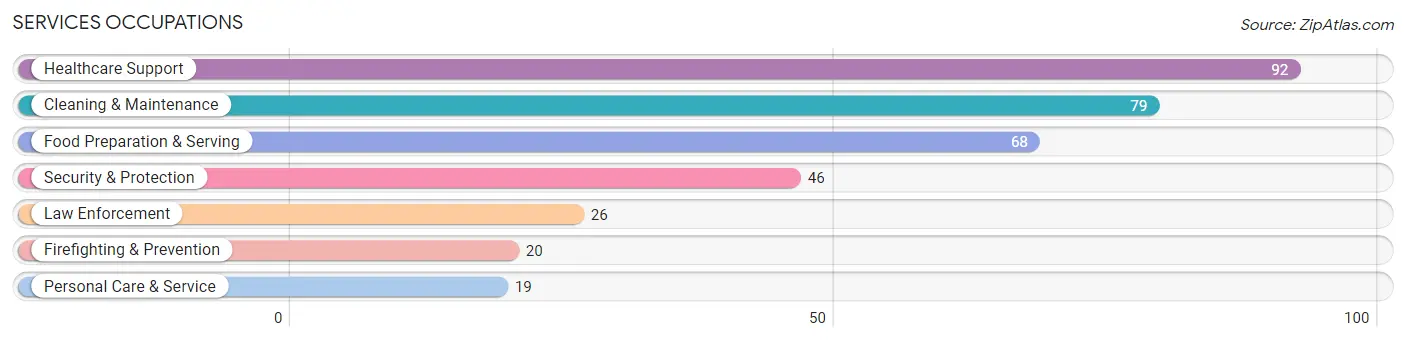
Services Occupations
The most common Services occupations in Hiawatha are Healthcare Support (92 | 5.4%), Cleaning & Maintenance (79 | 4.7%), Food Preparation & Serving (68 | 4.0%), Security & Protection (46 | 2.7%), and Law Enforcement (26 | 1.5%).
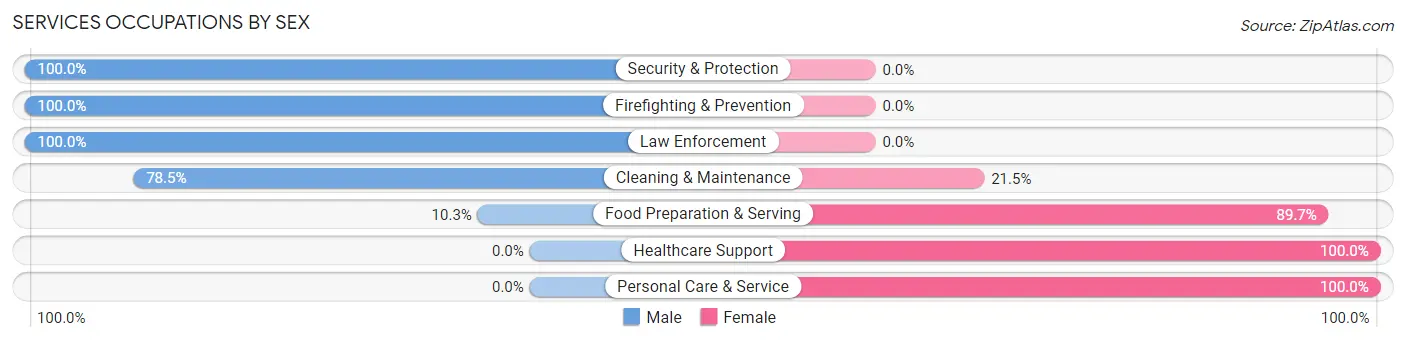
Services Occupations by Sex
Within the Services occupations in Hiawatha, the most male-oriented occupations are Security & Protection (100.0%), Firefighting & Prevention (100.0%), and Law Enforcement (100.0%), while the most female-oriented occupations are Healthcare Support (100.0%), Personal Care & Service (100.0%), and Food Preparation & Serving (89.7%).
| Occupation | Male | Female |
| Healthcare Support | 0 (0.0%) | 92 (100.0%) |
| Security & Protection | 46 (100.0%) | 0 (0.0%) |
| Firefighting & Prevention | 20 (100.0%) | 0 (0.0%) |
| Law Enforcement | 26 (100.0%) | 0 (0.0%) |
| Food Preparation & Serving | 7 (10.3%) | 61 (89.7%) |
| Cleaning & Maintenance | 62 (78.5%) | 17 (21.5%) |
| Personal Care & Service | 0 (0.0%) | 19 (100.0%) |
| Total (Category) | 115 (37.8%) | 189 (62.2%) |
| Total (Overall) | 814 (48.1%) | 879 (51.9%) |
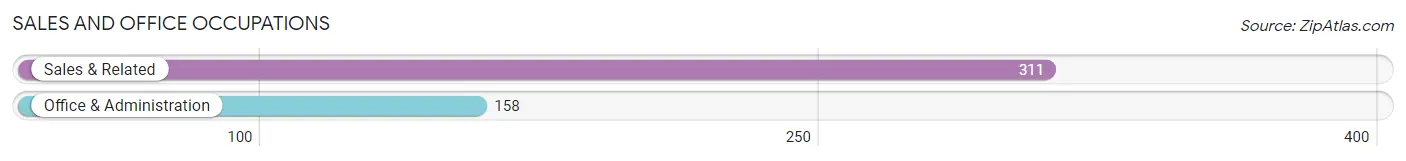
Sales and Office Occupations
The most common Sales and Office occupations in Hiawatha are Sales & Related (311 | 18.4%), and Office & Administration (158 | 9.3%).
Sales and Office Occupations by Sex
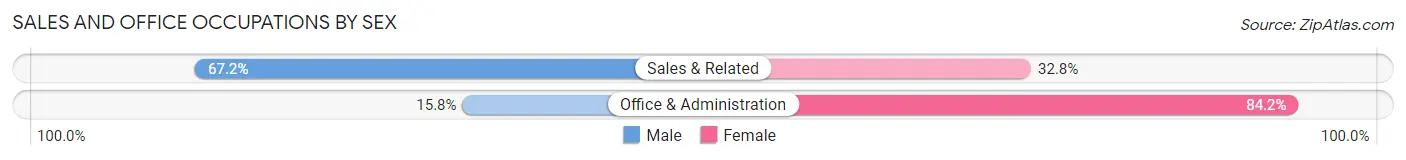
| Occupation | Male | Female |
| Sales & Related | 209 (67.2%) | 102 (32.8%) |
| Office & Administration | 25 (15.8%) | 133 (84.2%) |
| Total (Category) | 234 (49.9%) | 235 (50.1%) |
| Total (Overall) | 814 (48.1%) | 879 (51.9%) |
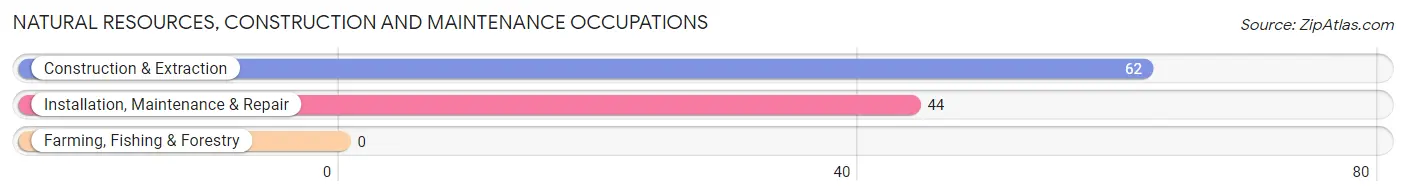
Natural Resources, Construction and Maintenance Occupations
The most common Natural Resources, Construction and Maintenance occupations in Hiawatha are Construction & Extraction (62 | 3.7%), and Installation, Maintenance & Repair (44 | 2.6%).
Natural Resources, Construction and Maintenance Occupations by Sex
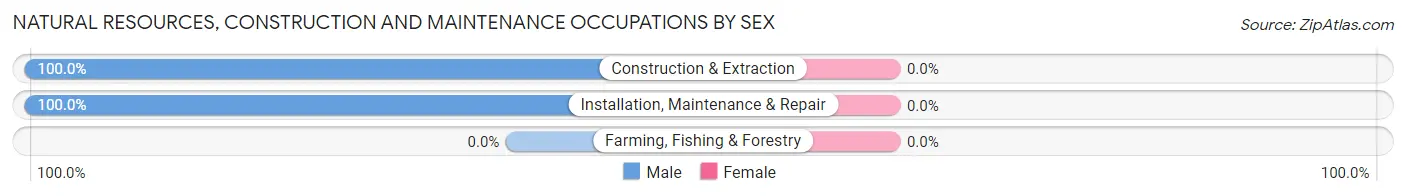
| Occupation | Male | Female |
| Farming, Fishing & Forestry | 0 (0.0%) | 0 (0.0%) |
| Construction & Extraction | 62 (100.0%) | 0 (0.0%) |
| Installation, Maintenance & Repair | 44 (100.0%) | 0 (0.0%) |
| Total (Category) | 106 (100.0%) | 0 (0.0%) |
| Total (Overall) | 814 (48.1%) | 879 (51.9%) |
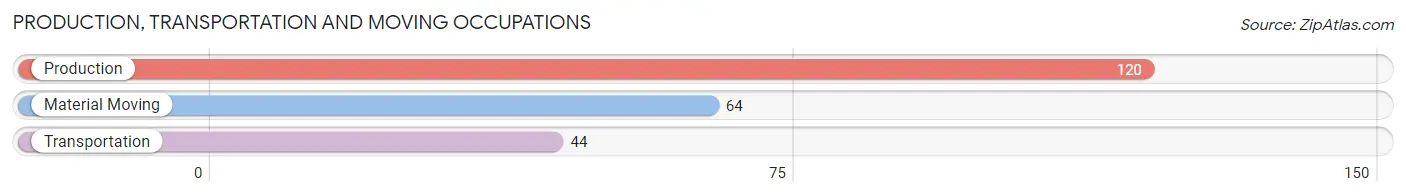
Production, Transportation and Moving Occupations
The most common Production, Transportation and Moving occupations in Hiawatha are Production (120 | 7.1%), Material Moving (64 | 3.8%), and Transportation (44 | 2.6%).
Production, Transportation and Moving Occupations by Sex
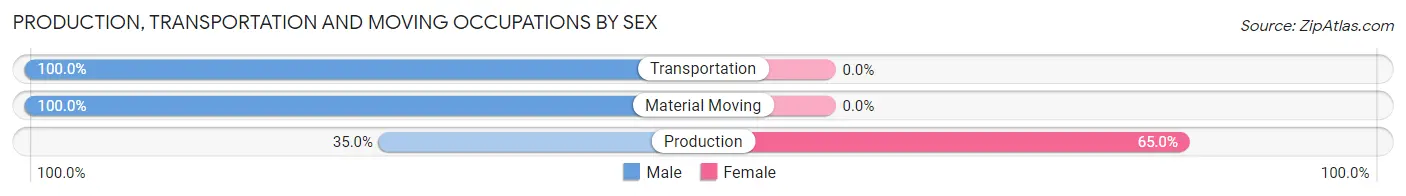
| Occupation | Male | Female |
| Production | 42 (35.0%) | 78 (65.0%) |
| Transportation | 44 (100.0%) | 0 (0.0%) |
| Material Moving | 64 (100.0%) | 0 (0.0%) |
| Total (Category) | 150 (65.8%) | 78 (34.2%) |
| Total (Overall) | 814 (48.1%) | 879 (51.9%) |
Employment Industries by Sex in Hiawatha
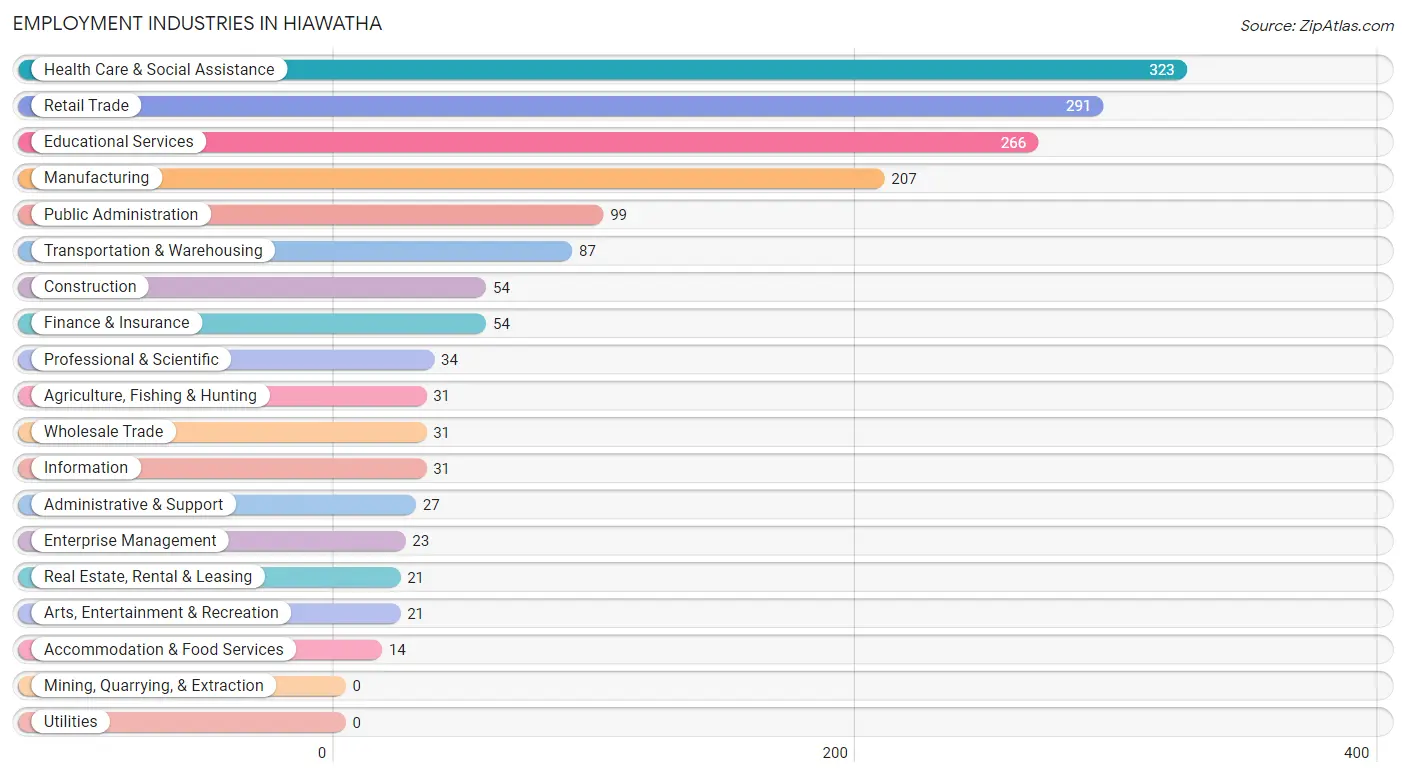
Employment Industries in Hiawatha
The major employment industries in Hiawatha include Health Care & Social Assistance (323 | 19.1%), Retail Trade (291 | 17.2%), Educational Services (266 | 15.7%), Manufacturing (207 | 12.2%), and Public Administration (99 | 5.9%).
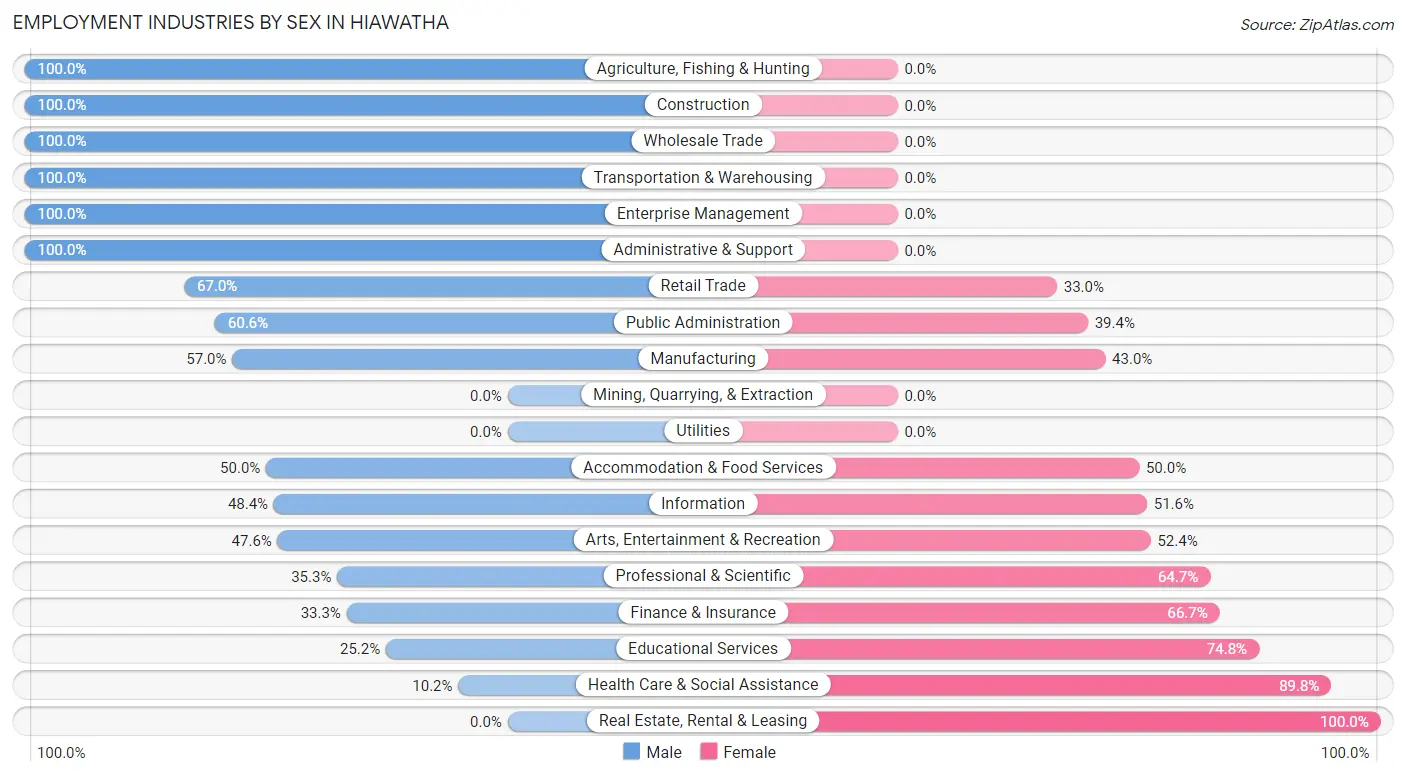
Employment Industries by Sex in Hiawatha
The Hiawatha industries that see more men than women are Agriculture, Fishing & Hunting (100.0%), Construction (100.0%), and Wholesale Trade (100.0%), whereas the industries that tend to have a higher number of women are Real Estate, Rental & Leasing (100.0%), Health Care & Social Assistance (89.8%), and Educational Services (74.8%).
| Industry | Male | Female |
| Agriculture, Fishing & Hunting | 31 (100.0%) | 0 (0.0%) |
| Mining, Quarrying, & Extraction | 0 (0.0%) | 0 (0.0%) |
| Construction | 54 (100.0%) | 0 (0.0%) |
| Manufacturing | 118 (57.0%) | 89 (43.0%) |
| Wholesale Trade | 31 (100.0%) | 0 (0.0%) |
| Retail Trade | 195 (67.0%) | 96 (33.0%) |
| Transportation & Warehousing | 87 (100.0%) | 0 (0.0%) |
| Utilities | 0 (0.0%) | 0 (0.0%) |
| Information | 15 (48.4%) | 16 (51.6%) |
| Finance & Insurance | 18 (33.3%) | 36 (66.7%) |
| Real Estate, Rental & Leasing | 0 (0.0%) | 21 (100.0%) |
| Professional & Scientific | 12 (35.3%) | 22 (64.7%) |
| Enterprise Management | 23 (100.0%) | 0 (0.0%) |
| Administrative & Support | 27 (100.0%) | 0 (0.0%) |
| Educational Services | 67 (25.2%) | 199 (74.8%) |
| Health Care & Social Assistance | 33 (10.2%) | 290 (89.8%) |
| Arts, Entertainment & Recreation | 10 (47.6%) | 11 (52.4%) |
| Accommodation & Food Services | 7 (50.0%) | 7 (50.0%) |
| Public Administration | 60 (60.6%) | 39 (39.4%) |
| Total | 814 (48.1%) | 879 (51.9%) |
Education in Hiawatha
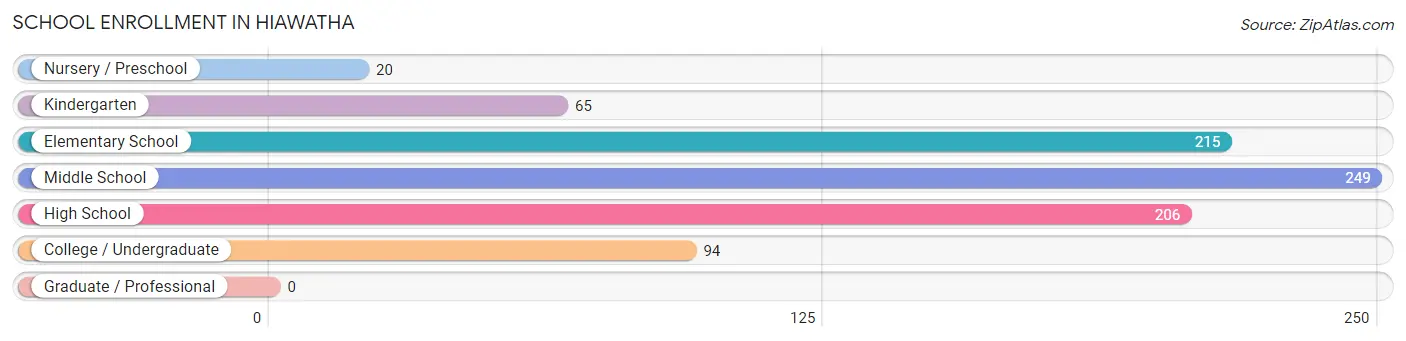
School Enrollment in Hiawatha
The most common levels of schooling among the 849 students in Hiawatha are middle school (249 | 29.3%), elementary school (215 | 25.3%), and high school (206 | 24.3%).
| School Level | # Students | % Students |
| Nursery / Preschool | 20 | 2.4% |
| Kindergarten | 65 | 7.7% |
| Elementary School | 215 | 25.3% |
| Middle School | 249 | 29.3% |
| High School | 206 | 24.3% |
| College / Undergraduate | 94 | 11.1% |
| Graduate / Professional | 0 | 0.0% |
| Total | 849 | 100.0% |
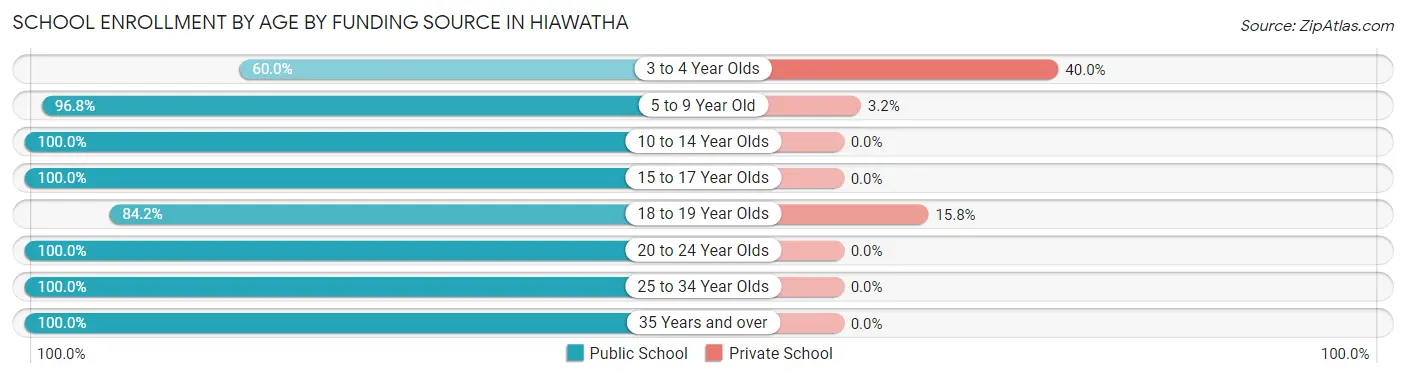
School Enrollment by Age by Funding Source in Hiawatha
Out of a total of 849 students who are enrolled in schools in Hiawatha, 23 (2.7%) attend a private institution, while the remaining 826 (97.3%) are enrolled in public schools. The age group of 3 to 4 year olds has the highest likelihood of being enrolled in private schools, with 8 (40.0% in the age bracket) enrolled. Conversely, the age group of 10 to 14 year olds has the lowest likelihood of being enrolled in a private school, with 282 (100.0% in the age bracket) attending a public institution.
| Age Bracket | Public School | Private School |
| 3 to 4 Year Olds | 12 (60.0%) | 8 (40.0%) |
| 5 to 9 Year Old | 271 (96.8%) | 9 (3.2%) |
| 10 to 14 Year Olds | 282 (100.0%) | 0 (0.0%) |
| 15 to 17 Year Olds | 145 (100.0%) | 0 (0.0%) |
| 18 to 19 Year Olds | 32 (84.2%) | 6 (15.8%) |
| 20 to 24 Year Olds | 43 (100.0%) | 0 (0.0%) |
| 25 to 34 Year Olds | 9 (100.0%) | 0 (0.0%) |
| 35 Years and over | 32 (100.0%) | 0 (0.0%) |
| Total | 826 (97.3%) | 23 (2.7%) |
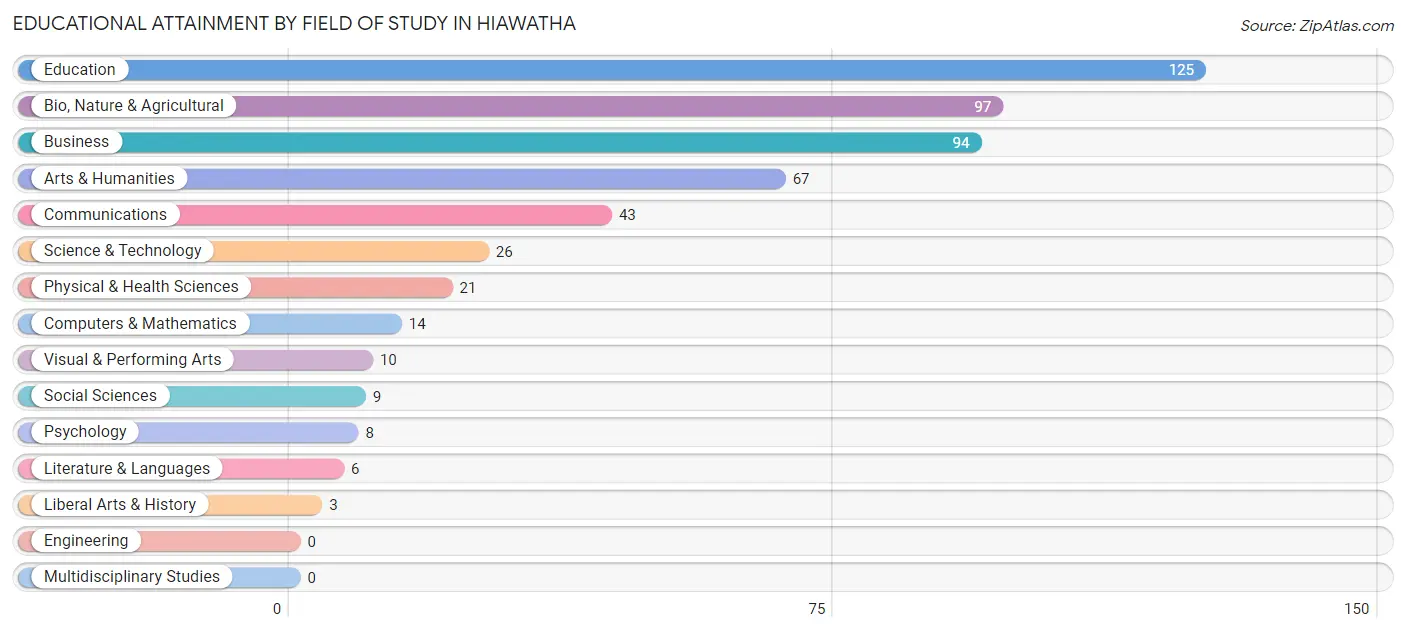
Educational Attainment by Field of Study in Hiawatha
Education (125 | 23.9%), bio, nature & agricultural (97 | 18.5%), business (94 | 18.0%), arts & humanities (67 | 12.8%), and communications (43 | 8.2%) are the most common fields of study among 523 individuals in Hiawatha who have obtained a bachelor's degree or higher.
| Field of Study | # Graduates | % Graduates |
| Computers & Mathematics | 14 | 2.7% |
| Bio, Nature & Agricultural | 97 | 18.5% |
| Physical & Health Sciences | 21 | 4.0% |
| Psychology | 8 | 1.5% |
| Social Sciences | 9 | 1.7% |
| Engineering | 0 | 0.0% |
| Multidisciplinary Studies | 0 | 0.0% |
| Science & Technology | 26 | 5.0% |
| Business | 94 | 18.0% |
| Education | 125 | 23.9% |
| Literature & Languages | 6 | 1.1% |
| Liberal Arts & History | 3 | 0.6% |
| Visual & Performing Arts | 10 | 1.9% |
| Communications | 43 | 8.2% |
| Arts & Humanities | 67 | 12.8% |
| Total | 523 | 100.0% |
Transportation & Commute in Hiawatha
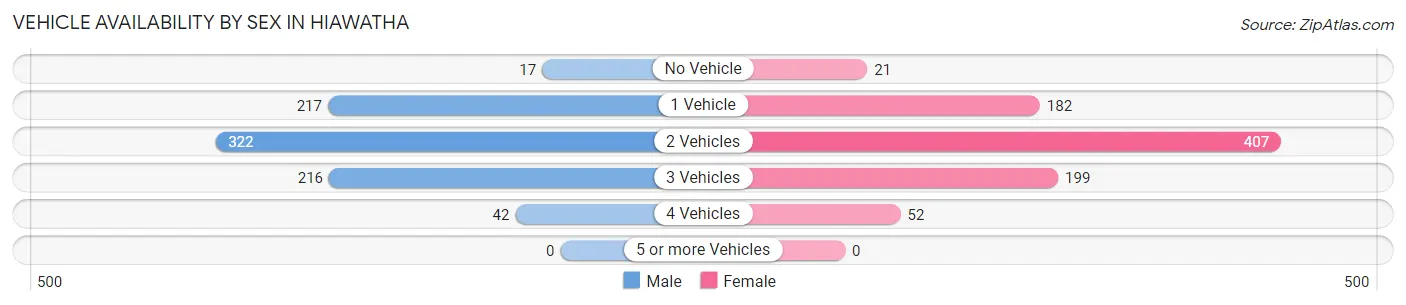
Vehicle Availability by Sex in Hiawatha
The most prevalent vehicle ownership categories in Hiawatha are males with 2 vehicles (322, accounting for 39.6%) and females with 2 vehicles (407, making up 37.4%).
| Vehicles Available | Male | Female |
| No Vehicle | 17 (2.1%) | 21 (2.4%) |
| 1 Vehicle | 217 (26.7%) | 182 (21.1%) |
| 2 Vehicles | 322 (39.6%) | 407 (47.3%) |
| 3 Vehicles | 216 (26.5%) | 199 (23.1%) |
| 4 Vehicles | 42 (5.2%) | 52 (6.0%) |
| 5 or more Vehicles | 0 (0.0%) | 0 (0.0%) |
| Total | 814 (100.0%) | 861 (100.0%) |
Commute Time in Hiawatha
The most frequently occuring commute durations in Hiawatha are 5 to 9 minutes (609 commuters, 37.4%), 10 to 14 minutes (311 commuters, 19.1%), and less than 5 minutes (218 commuters, 13.4%).
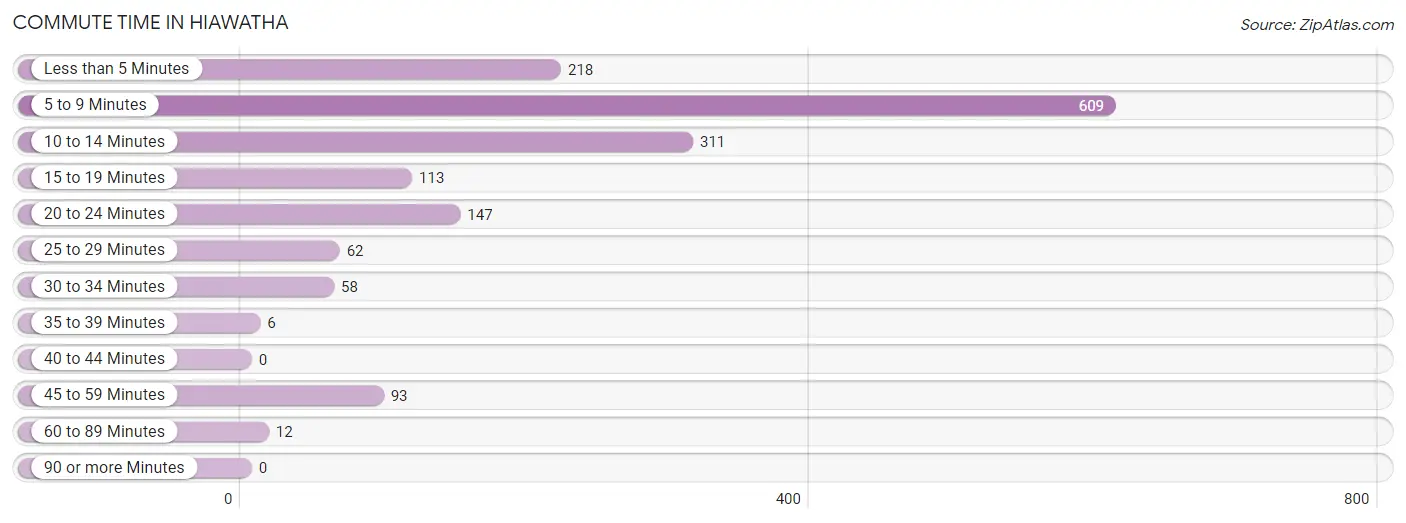
| Commute Time | # Commuters | % Commuters |
| Less than 5 Minutes | 218 | 13.4% |
| 5 to 9 Minutes | 609 | 37.4% |
| 10 to 14 Minutes | 311 | 19.1% |
| 15 to 19 Minutes | 113 | 6.9% |
| 20 to 24 Minutes | 147 | 9.0% |
| 25 to 29 Minutes | 62 | 3.8% |
| 30 to 34 Minutes | 58 | 3.6% |
| 35 to 39 Minutes | 6 | 0.4% |
| 40 to 44 Minutes | 0 | 0.0% |
| 45 to 59 Minutes | 93 | 5.7% |
| 60 to 89 Minutes | 12 | 0.7% |
| 90 or more Minutes | 0 | 0.0% |
Commute Time by Sex in Hiawatha
The most common commute times in Hiawatha are 5 to 9 minutes (201 commuters, 25.3%) for males and 5 to 9 minutes (408 commuters, 49.0%) for females.
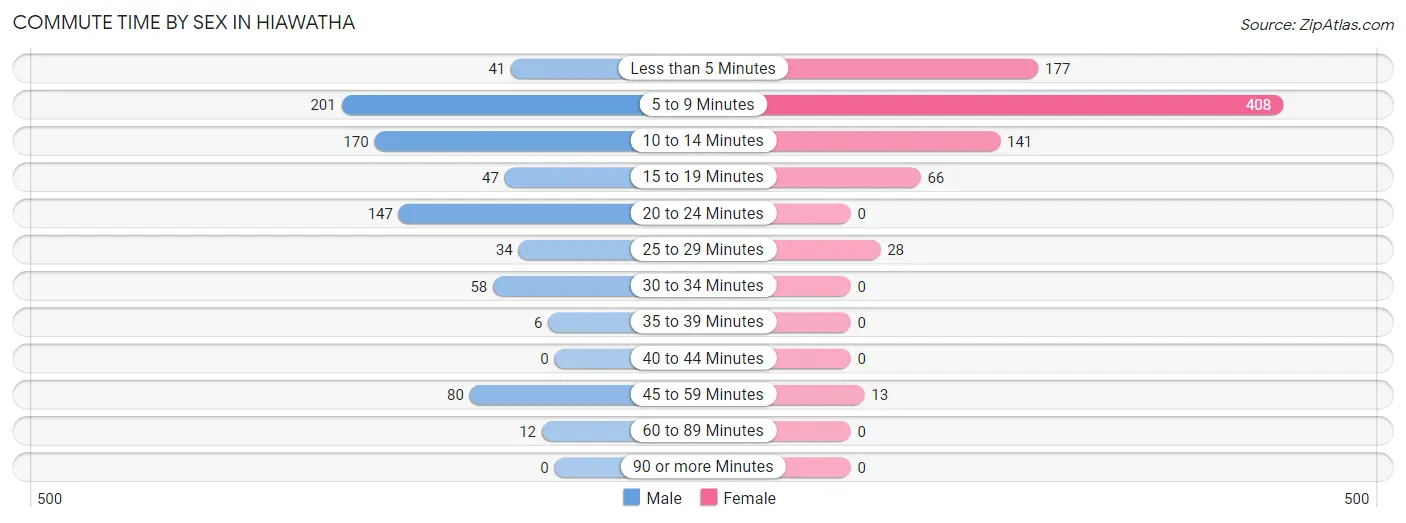
| Commute Time | Male | Female |
| Less than 5 Minutes | 41 (5.1%) | 177 (21.2%) |
| 5 to 9 Minutes | 201 (25.3%) | 408 (49.0%) |
| 10 to 14 Minutes | 170 (21.4%) | 141 (16.9%) |
| 15 to 19 Minutes | 47 (5.9%) | 66 (7.9%) |
| 20 to 24 Minutes | 147 (18.5%) | 0 (0.0%) |
| 25 to 29 Minutes | 34 (4.3%) | 28 (3.4%) |
| 30 to 34 Minutes | 58 (7.3%) | 0 (0.0%) |
| 35 to 39 Minutes | 6 (0.7%) | 0 (0.0%) |
| 40 to 44 Minutes | 0 (0.0%) | 0 (0.0%) |
| 45 to 59 Minutes | 80 (10.1%) | 13 (1.6%) |
| 60 to 89 Minutes | 12 (1.5%) | 0 (0.0%) |
| 90 or more Minutes | 0 (0.0%) | 0 (0.0%) |
Time of Departure to Work by Sex in Hiawatha
The most frequent times of departure to work in Hiawatha are 7:30 AM to 7:59 AM (162, 20.3%) for males and 7:30 AM to 7:59 AM (341, 40.9%) for females.
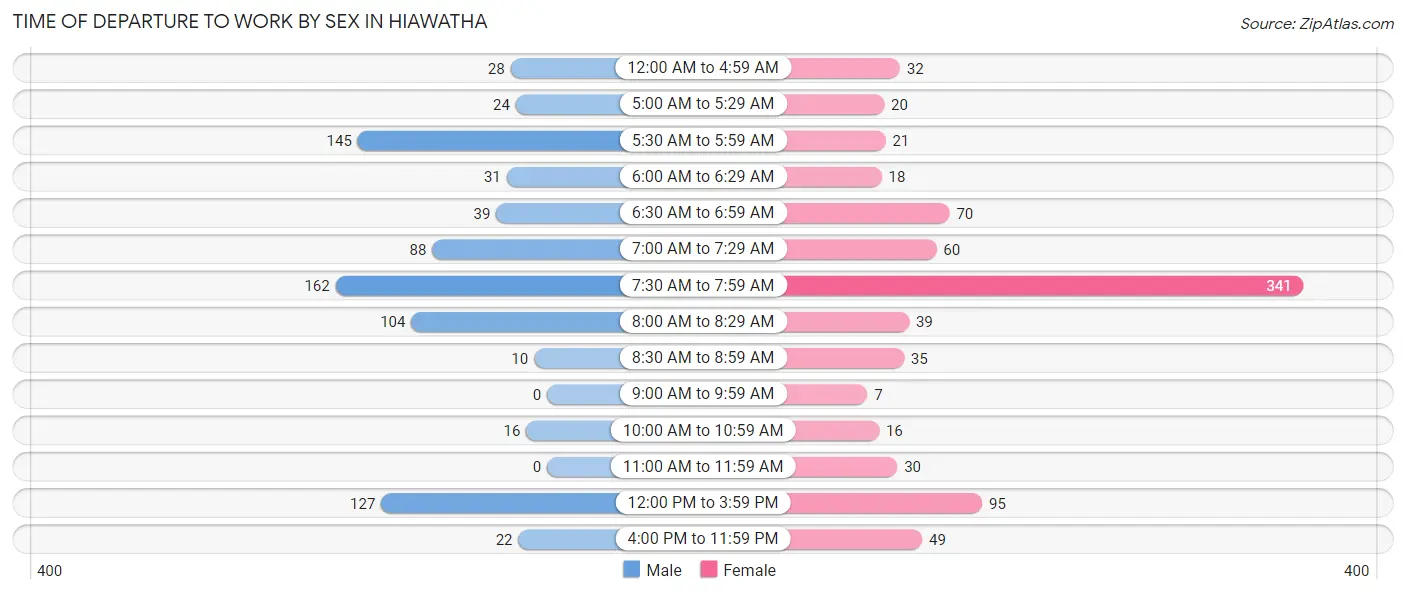
| Time of Departure | Male | Female |
| 12:00 AM to 4:59 AM | 28 (3.5%) | 32 (3.8%) |
| 5:00 AM to 5:29 AM | 24 (3.0%) | 20 (2.4%) |
| 5:30 AM to 5:59 AM | 145 (18.2%) | 21 (2.5%) |
| 6:00 AM to 6:29 AM | 31 (3.9%) | 18 (2.2%) |
| 6:30 AM to 6:59 AM | 39 (4.9%) | 70 (8.4%) |
| 7:00 AM to 7:29 AM | 88 (11.1%) | 60 (7.2%) |
| 7:30 AM to 7:59 AM | 162 (20.3%) | 341 (40.9%) |
| 8:00 AM to 8:29 AM | 104 (13.1%) | 39 (4.7%) |
| 8:30 AM to 8:59 AM | 10 (1.3%) | 35 (4.2%) |
| 9:00 AM to 9:59 AM | 0 (0.0%) | 7 (0.8%) |
| 10:00 AM to 10:59 AM | 16 (2.0%) | 16 (1.9%) |
| 11:00 AM to 11:59 AM | 0 (0.0%) | 30 (3.6%) |
| 12:00 PM to 3:59 PM | 127 (16.0%) | 95 (11.4%) |
| 4:00 PM to 11:59 PM | 22 (2.8%) | 49 (5.9%) |
| Total | 796 (100.0%) | 833 (100.0%) |
Housing Occupancy in Hiawatha
Occupancy by Ownership in Hiawatha
Of the total 1,251 dwellings in Hiawatha, owner-occupied units account for 840 (67.1%), while renter-occupied units make up 411 (32.9%).
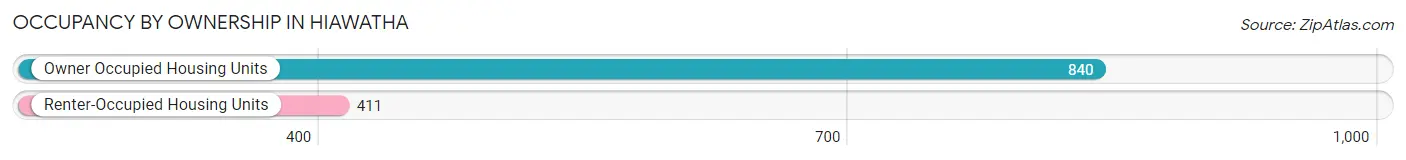
| Occupancy | # Housing Units | % Housing Units |
| Owner Occupied Housing Units | 840 | 67.1% |
| Renter-Occupied Housing Units | 411 | 32.9% |
| Total Occupied Housing Units | 1,251 | 100.0% |
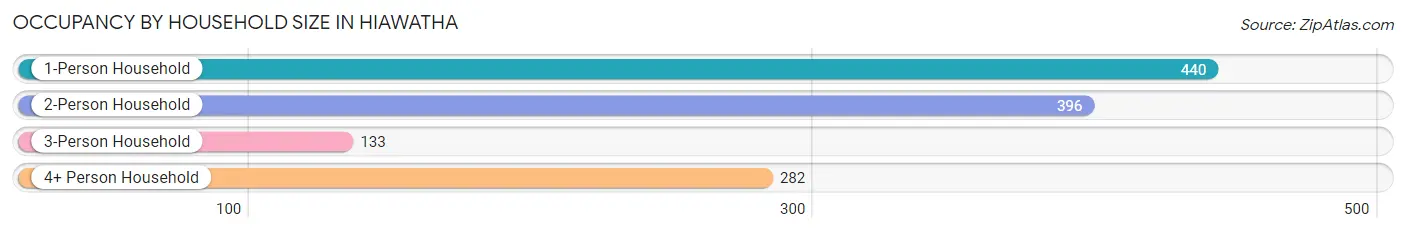
Occupancy by Household Size in Hiawatha
| Household Size | # Housing Units | % Housing Units |
| 1-Person Household | 440 | 35.2% |
| 2-Person Household | 396 | 31.7% |
| 3-Person Household | 133 | 10.6% |
| 4+ Person Household | 282 | 22.5% |
| Total Housing Units | 1,251 | 100.0% |
Occupancy by Ownership by Household Size in Hiawatha
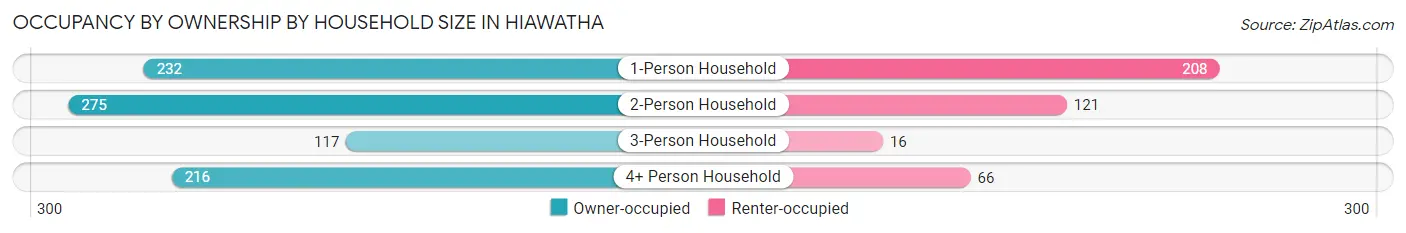
| Household Size | Owner-occupied | Renter-occupied |
| 1-Person Household | 232 (52.7%) | 208 (47.3%) |
| 2-Person Household | 275 (69.4%) | 121 (30.6%) |
| 3-Person Household | 117 (88.0%) | 16 (12.0%) |
| 4+ Person Household | 216 (76.6%) | 66 (23.4%) |
| Total Housing Units | 840 (67.1%) | 411 (32.9%) |
Occupancy by Educational Attainment in Hiawatha
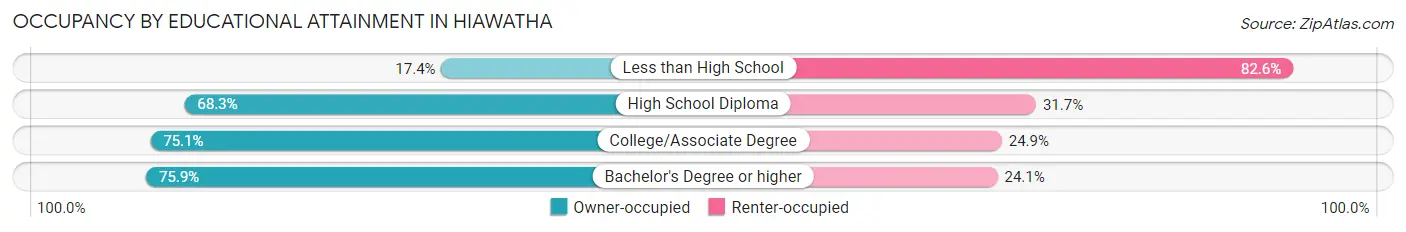
| Household Size | Owner-occupied | Renter-occupied |
| Less than High School | 21 (17.4%) | 100 (82.6%) |
| High School Diploma | 330 (68.3%) | 153 (31.7%) |
| College/Associate Degree | 202 (75.1%) | 67 (24.9%) |
| Bachelor's Degree or higher | 287 (75.9%) | 91 (24.1%) |
Occupancy by Age of Householder in Hiawatha
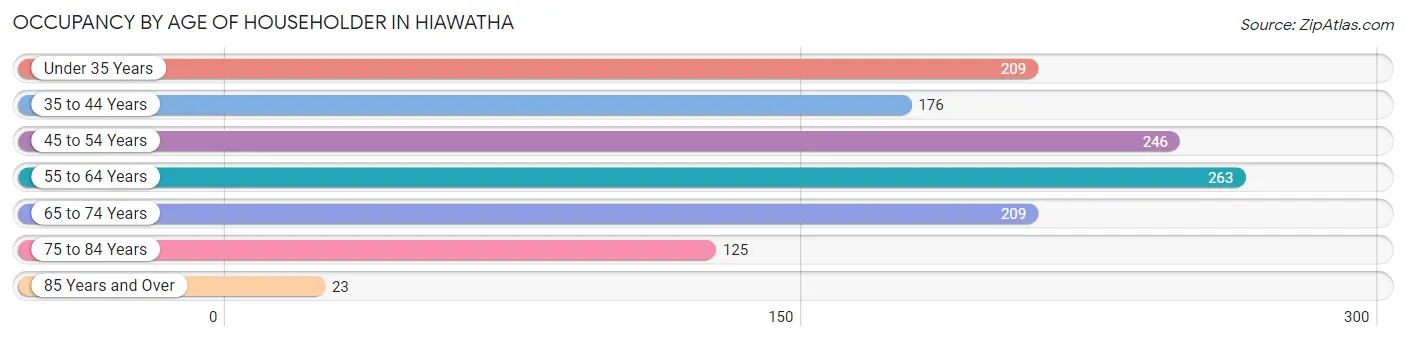
| Age Bracket | # Households | % Households |
| Under 35 Years | 209 | 16.7% |
| 35 to 44 Years | 176 | 14.1% |
| 45 to 54 Years | 246 | 19.7% |
| 55 to 64 Years | 263 | 21.0% |
| 65 to 74 Years | 209 | 16.7% |
| 75 to 84 Years | 125 | 10.0% |
| 85 Years and Over | 23 | 1.8% |
| Total | 1,251 | 100.0% |
Housing Finances in Hiawatha
Median Income by Occupancy in Hiawatha
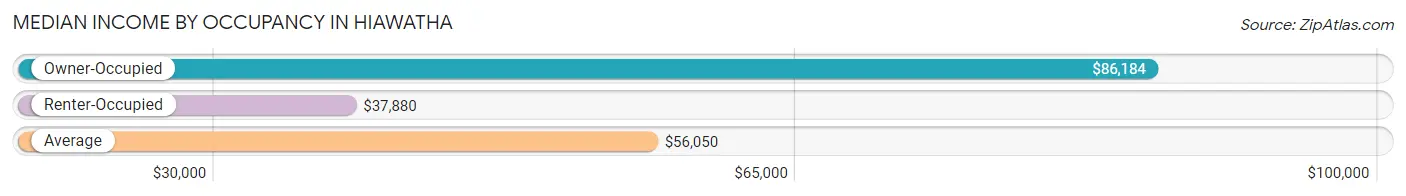
| Occupancy Type | # Households | Median Income |
| Owner-Occupied | 840 (67.1%) | $86,184 |
| Renter-Occupied | 411 (32.9%) | $37,880 |
| Average | 1,251 (100.0%) | $56,050 |
Occupancy by Householder Income Bracket in Hiawatha
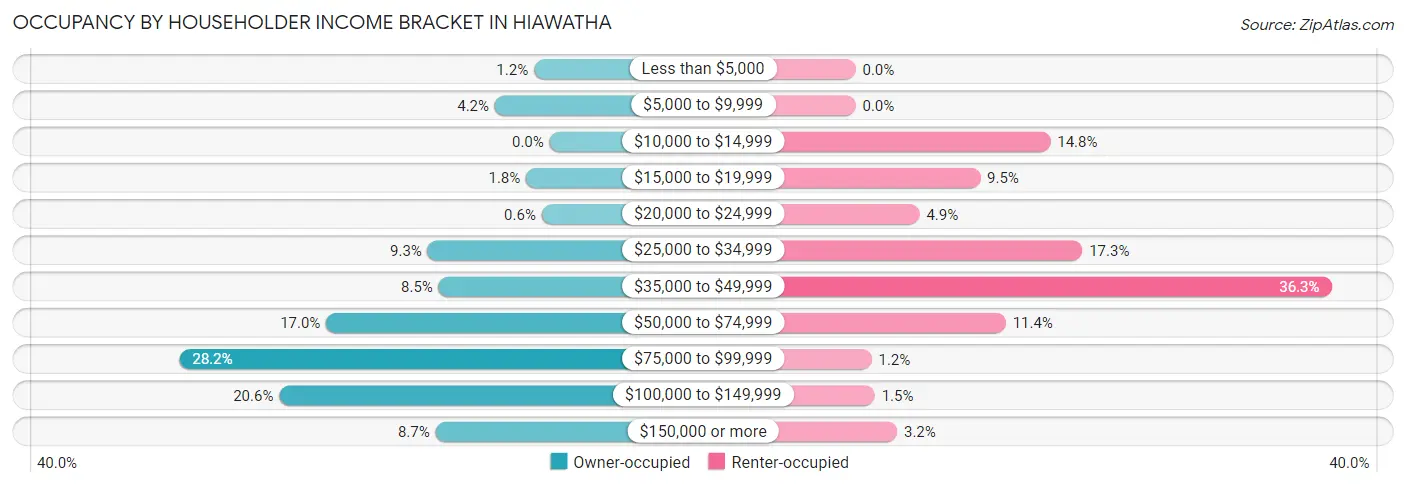
| Income Bracket | Owner-occupied | Renter-occupied |
| Less than $5,000 | 10 (1.2%) | 0 (0.0%) |
| $5,000 to $9,999 | 35 (4.2%) | 0 (0.0%) |
| $10,000 to $14,999 | 0 (0.0%) | 61 (14.8%) |
| $15,000 to $19,999 | 15 (1.8%) | 39 (9.5%) |
| $20,000 to $24,999 | 5 (0.6%) | 20 (4.9%) |
| $25,000 to $34,999 | 78 (9.3%) | 71 (17.3%) |
| $35,000 to $49,999 | 71 (8.5%) | 149 (36.2%) |
| $50,000 to $74,999 | 143 (17.0%) | 47 (11.4%) |
| $75,000 to $99,999 | 237 (28.2%) | 5 (1.2%) |
| $100,000 to $149,999 | 173 (20.6%) | 6 (1.5%) |
| $150,000 or more | 73 (8.7%) | 13 (3.2%) |
| Total | 840 (100.0%) | 411 (100.0%) |
Monthly Housing Cost Tiers in Hiawatha
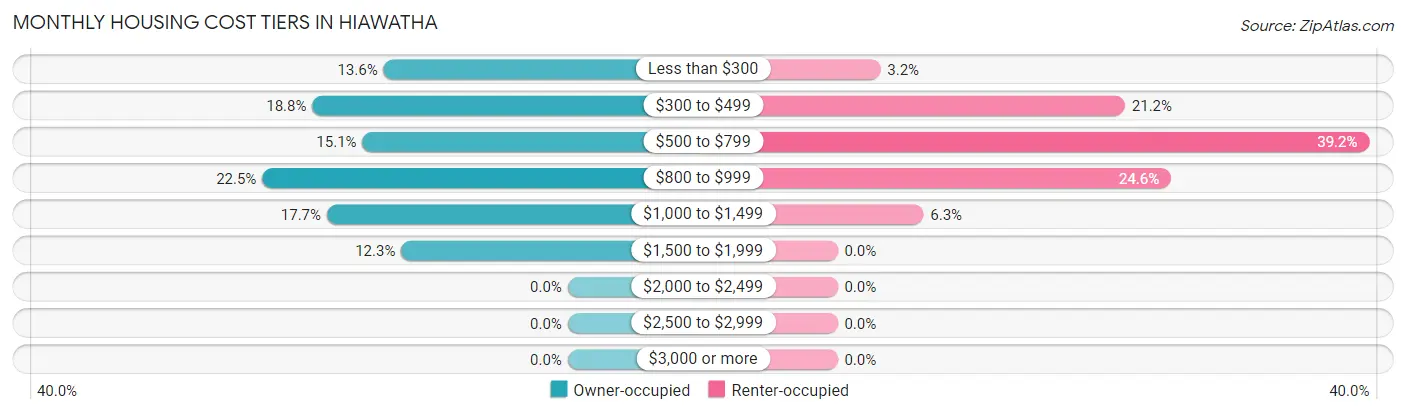
| Monthly Cost | Owner-occupied | Renter-occupied |
| Less than $300 | 114 (13.6%) | 13 (3.2%) |
| $300 to $499 | 158 (18.8%) | 87 (21.2%) |
| $500 to $799 | 127 (15.1%) | 161 (39.2%) |
| $800 to $999 | 189 (22.5%) | 101 (24.6%) |
| $1,000 to $1,499 | 149 (17.7%) | 26 (6.3%) |
| $1,500 to $1,999 | 103 (12.3%) | 0 (0.0%) |
| $2,000 to $2,499 | 0 (0.0%) | 0 (0.0%) |
| $2,500 to $2,999 | 0 (0.0%) | 0 (0.0%) |
| $3,000 or more | 0 (0.0%) | 0 (0.0%) |
| Total | 840 (100.0%) | 411 (100.0%) |
Physical Housing Characteristics in Hiawatha
Housing Structures in Hiawatha
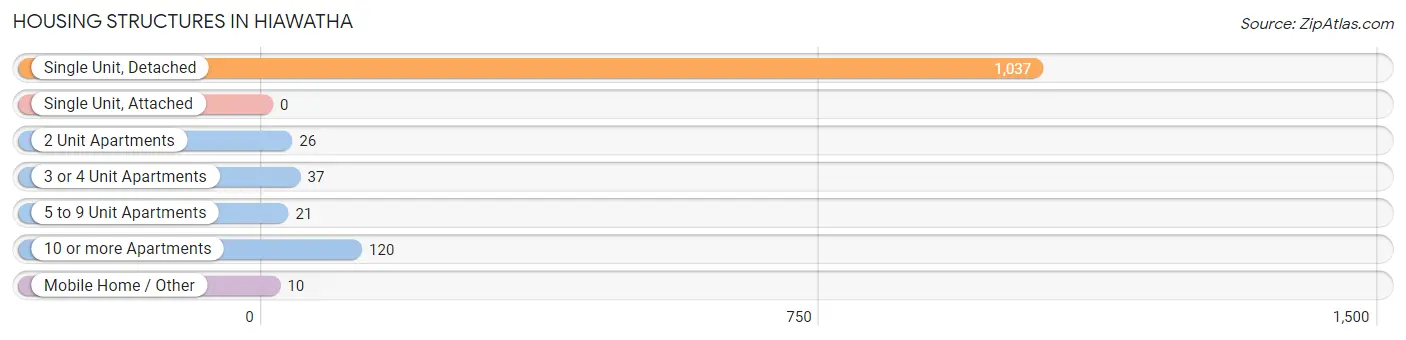
| Structure Type | # Housing Units | % Housing Units |
| Single Unit, Detached | 1,037 | 82.9% |
| Single Unit, Attached | 0 | 0.0% |
| 2 Unit Apartments | 26 | 2.1% |
| 3 or 4 Unit Apartments | 37 | 3.0% |
| 5 to 9 Unit Apartments | 21 | 1.7% |
| 10 or more Apartments | 120 | 9.6% |
| Mobile Home / Other | 10 | 0.8% |
| Total | 1,251 | 100.0% |
Housing Structures by Occupancy in Hiawatha
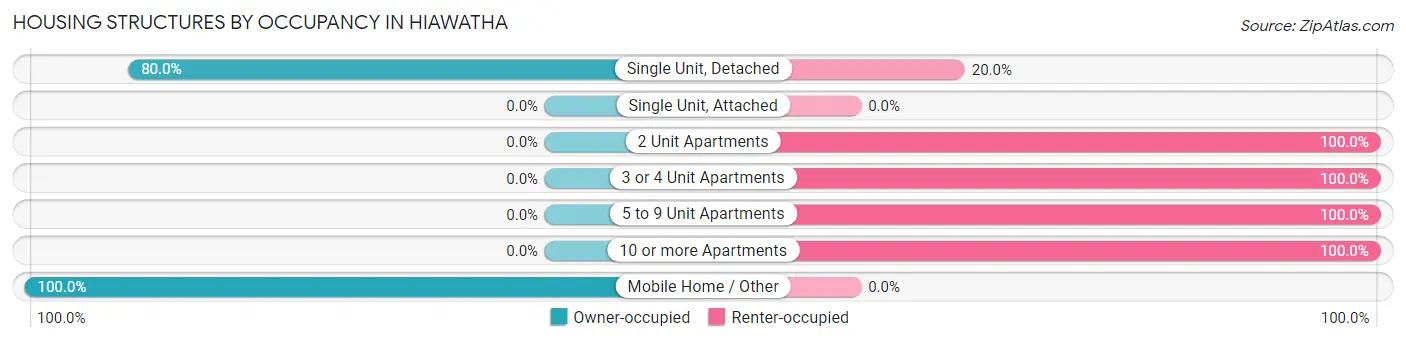
| Structure Type | Owner-occupied | Renter-occupied |
| Single Unit, Detached | 830 (80.0%) | 207 (20.0%) |
| Single Unit, Attached | 0 (0.0%) | 0 (0.0%) |
| 2 Unit Apartments | 0 (0.0%) | 26 (100.0%) |
| 3 or 4 Unit Apartments | 0 (0.0%) | 37 (100.0%) |
| 5 to 9 Unit Apartments | 0 (0.0%) | 21 (100.0%) |
| 10 or more Apartments | 0 (0.0%) | 120 (100.0%) |
| Mobile Home / Other | 10 (100.0%) | 0 (0.0%) |
| Total | 840 (67.1%) | 411 (32.9%) |
Housing Structures by Number of Rooms in Hiawatha
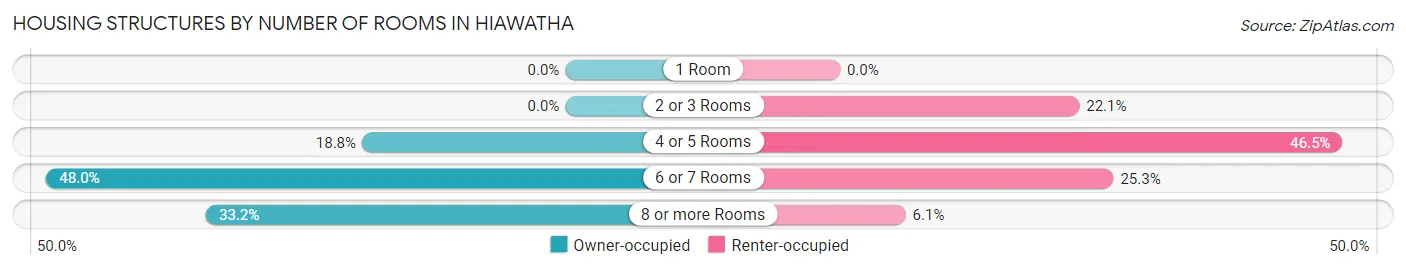
| Number of Rooms | Owner-occupied | Renter-occupied |
| 1 Room | 0 (0.0%) | 0 (0.0%) |
| 2 or 3 Rooms | 0 (0.0%) | 91 (22.1%) |
| 4 or 5 Rooms | 158 (18.8%) | 191 (46.5%) |
| 6 or 7 Rooms | 403 (48.0%) | 104 (25.3%) |
| 8 or more Rooms | 279 (33.2%) | 25 (6.1%) |
| Total | 840 (100.0%) | 411 (100.0%) |
Housing Structure by Heating Type in Hiawatha
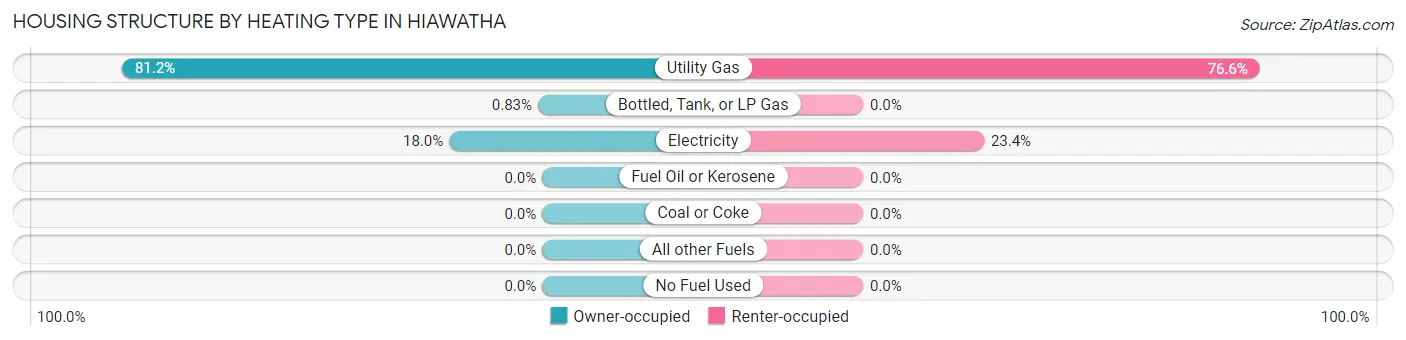
| Heating Type | Owner-occupied | Renter-occupied |
| Utility Gas | 682 (81.2%) | 315 (76.6%) |
| Bottled, Tank, or LP Gas | 7 (0.8%) | 0 (0.0%) |
| Electricity | 151 (18.0%) | 96 (23.4%) |
| Fuel Oil or Kerosene | 0 (0.0%) | 0 (0.0%) |
| Coal or Coke | 0 (0.0%) | 0 (0.0%) |
| All other Fuels | 0 (0.0%) | 0 (0.0%) |
| No Fuel Used | 0 (0.0%) | 0 (0.0%) |
| Total | 840 (100.0%) | 411 (100.0%) |
Household Vehicle Usage in Hiawatha
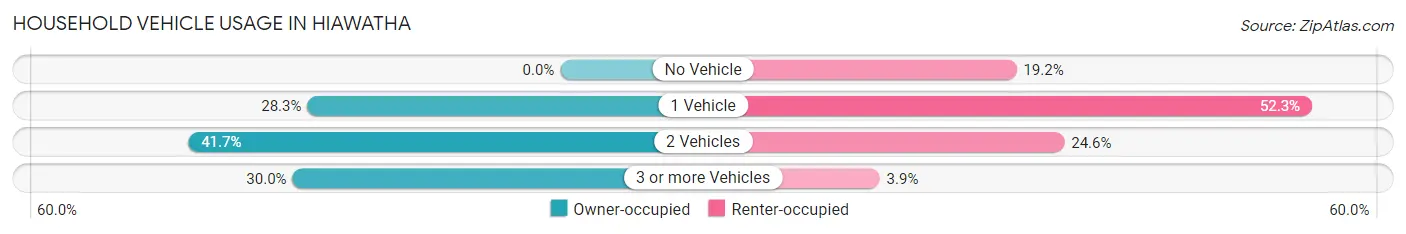
| Vehicles per Household | Owner-occupied | Renter-occupied |
| No Vehicle | 0 (0.0%) | 79 (19.2%) |
| 1 Vehicle | 238 (28.3%) | 215 (52.3%) |
| 2 Vehicles | 350 (41.7%) | 101 (24.6%) |
| 3 or more Vehicles | 252 (30.0%) | 16 (3.9%) |
| Total | 840 (100.0%) | 411 (100.0%) |
Real Estate & Mortgages in Hiawatha
Real Estate and Mortgage Overview in Hiawatha
| Characteristic | Without Mortgage | With Mortgage |
| Housing Units | 412 | 428 |
| Median Property Value | $94,700 | $141,000 |
| Median Household Income | $86,667 | $45 |
| Monthly Housing Costs | $433 | $0 |
| Real Estate Taxes | $1,314 | $3 |
Property Value by Mortgage Status in Hiawatha
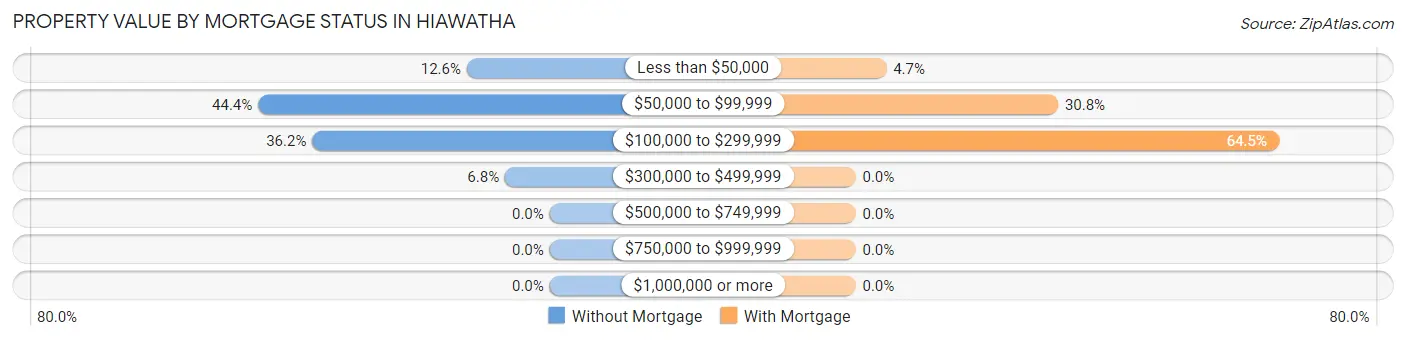
| Property Value | Without Mortgage | With Mortgage |
| Less than $50,000 | 52 (12.6%) | 20 (4.7%) |
| $50,000 to $99,999 | 183 (44.4%) | 132 (30.8%) |
| $100,000 to $299,999 | 149 (36.2%) | 276 (64.5%) |
| $300,000 to $499,999 | 28 (6.8%) | 0 (0.0%) |
| $500,000 to $749,999 | 0 (0.0%) | 0 (0.0%) |
| $750,000 to $999,999 | 0 (0.0%) | 0 (0.0%) |
| $1,000,000 or more | 0 (0.0%) | 0 (0.0%) |
| Total | 412 (100.0%) | 428 (100.0%) |
Household Income by Mortgage Status in Hiawatha
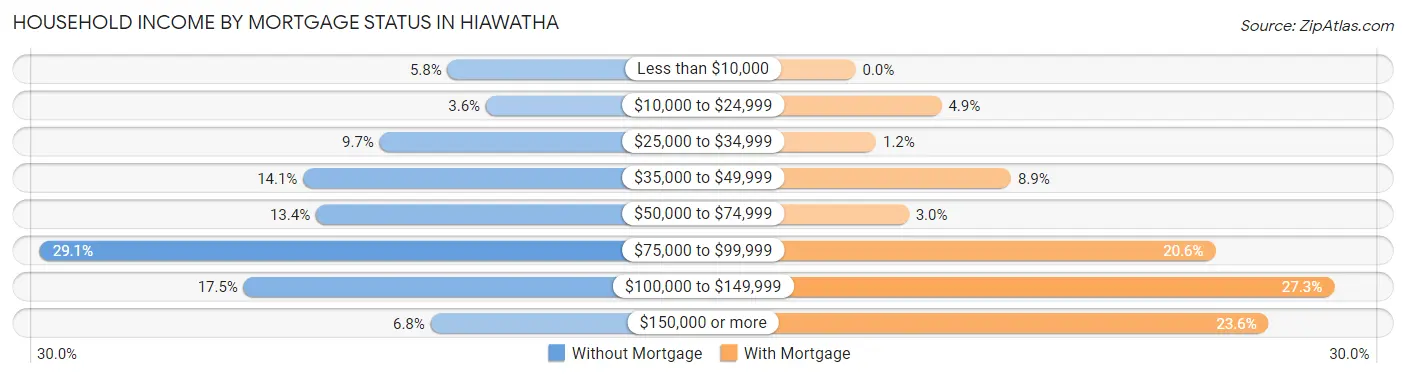
| Household Income | Without Mortgage | With Mortgage |
| Less than $10,000 | 24 (5.8%) | 0 (0.0%) |
| $10,000 to $24,999 | 15 (3.6%) | 21 (4.9%) |
| $25,000 to $34,999 | 40 (9.7%) | 5 (1.2%) |
| $35,000 to $49,999 | 58 (14.1%) | 38 (8.9%) |
| $50,000 to $74,999 | 55 (13.4%) | 13 (3.0%) |
| $75,000 to $99,999 | 120 (29.1%) | 88 (20.6%) |
| $100,000 to $149,999 | 72 (17.5%) | 117 (27.3%) |
| $150,000 or more | 28 (6.8%) | 101 (23.6%) |
| Total | 412 (100.0%) | 428 (100.0%) |
Property Value to Household Income Ratio in Hiawatha
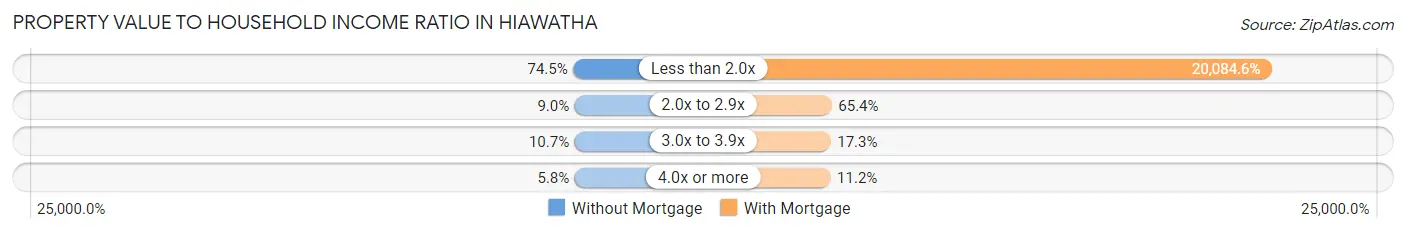
| Value-to-Income Ratio | Without Mortgage | With Mortgage |
| Less than 2.0x | 307 (74.5%) | 85,962 (20,084.6%) |
| 2.0x to 2.9x | 37 (9.0%) | 280 (65.4%) |
| 3.0x to 3.9x | 44 (10.7%) | 74 (17.3%) |
| 4.0x or more | 24 (5.8%) | 48 (11.2%) |
| Total | 412 (100.0%) | 428 (100.0%) |
Real Estate Taxes by Mortgage Status in Hiawatha
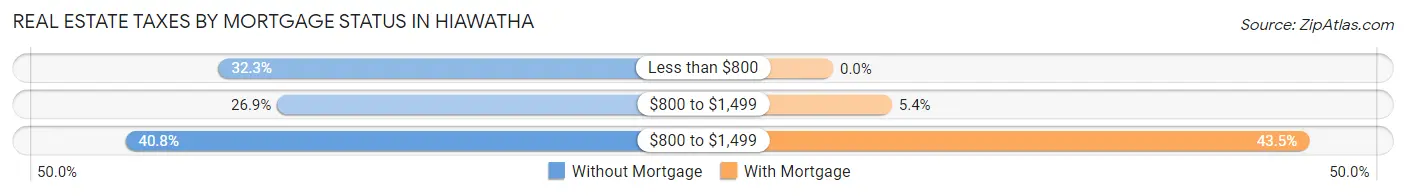
| Property Taxes | Without Mortgage | With Mortgage |
| Less than $800 | 133 (32.3%) | 0 (0.0%) |
| $800 to $1,499 | 111 (26.9%) | 23 (5.4%) |
| $800 to $1,499 | 168 (40.8%) | 186 (43.5%) |
| Total | 412 (100.0%) | 428 (100.0%) |
Health & Disability in Hiawatha
Health Insurance Coverage by Age in Hiawatha
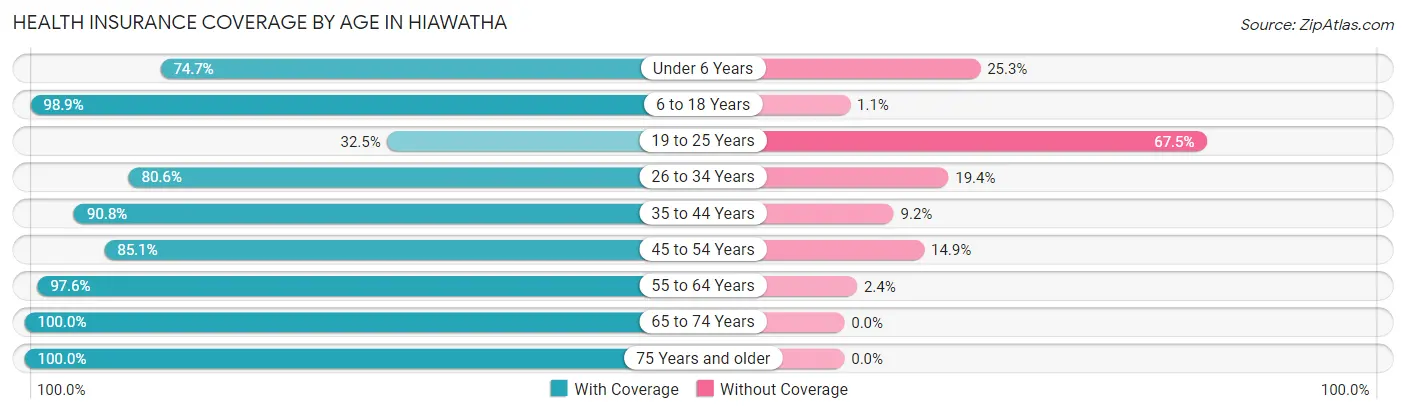
| Age Bracket | With Coverage | Without Coverage |
| Under 6 Years | 109 (74.7%) | 37 (25.3%) |
| 6 to 18 Years | 733 (98.9%) | 8 (1.1%) |
| 19 to 25 Years | 65 (32.5%) | 135 (67.5%) |
| 26 to 34 Years | 237 (80.6%) | 57 (19.4%) |
| 35 to 44 Years | 385 (90.8%) | 39 (9.2%) |
| 45 to 54 Years | 332 (85.1%) | 58 (14.9%) |
| 55 to 64 Years | 414 (97.6%) | 10 (2.4%) |
| 65 to 74 Years | 332 (100.0%) | 0 (0.0%) |
| 75 Years and older | 221 (100.0%) | 0 (0.0%) |
| Total | 2,828 (89.2%) | 344 (10.8%) |
Health Insurance Coverage by Citizenship Status in Hiawatha
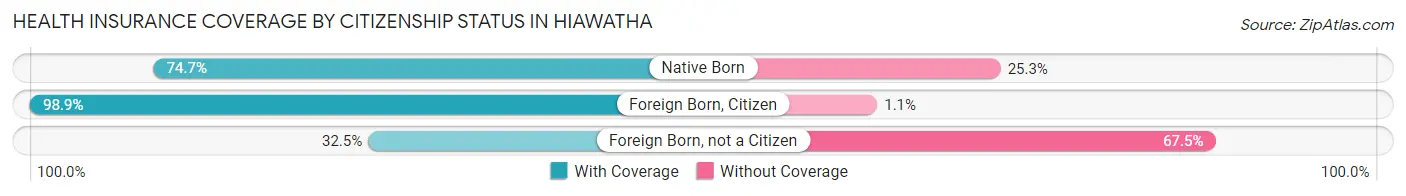
| Citizenship Status | With Coverage | Without Coverage |
| Native Born | 109 (74.7%) | 37 (25.3%) |
| Foreign Born, Citizen | 733 (98.9%) | 8 (1.1%) |
| Foreign Born, not a Citizen | 65 (32.5%) | 135 (67.5%) |
Health Insurance Coverage by Household Income in Hiawatha
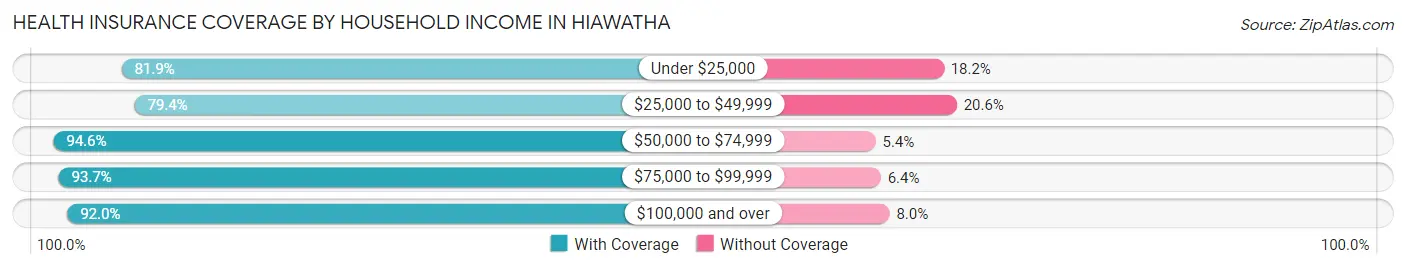
| Household Income | With Coverage | Without Coverage |
| Under $25,000 | 248 (81.9%) | 55 (18.1%) |
| $25,000 to $49,999 | 536 (79.4%) | 139 (20.6%) |
| $50,000 to $74,999 | 492 (94.6%) | 28 (5.4%) |
| $75,000 to $99,999 | 634 (93.6%) | 43 (6.4%) |
| $100,000 and over | 910 (92.0%) | 79 (8.0%) |
Public vs Private Health Insurance Coverage by Age in Hiawatha
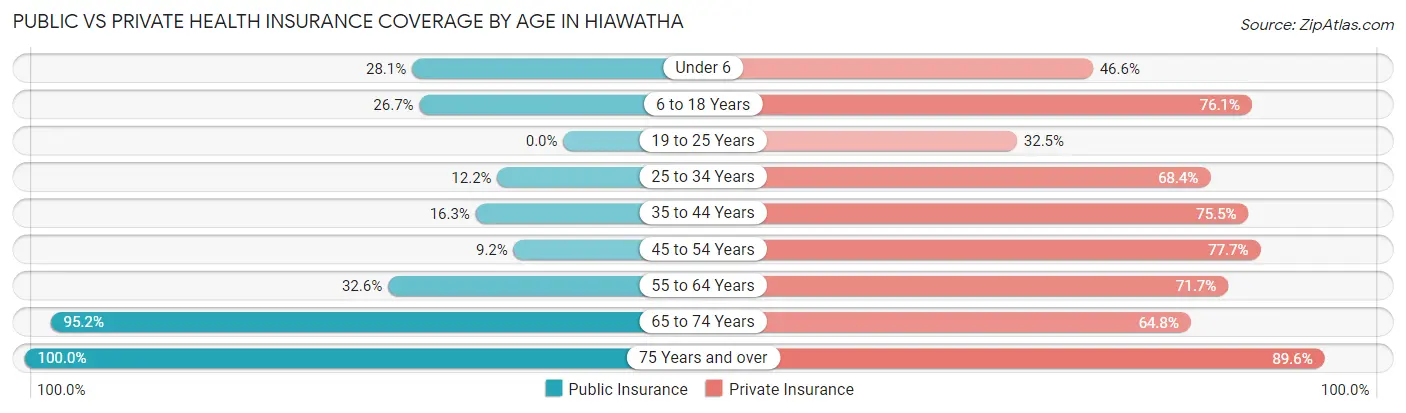
| Age Bracket | Public Insurance | Private Insurance |
| Under 6 | 41 (28.1%) | 68 (46.6%) |
| 6 to 18 Years | 198 (26.7%) | 564 (76.1%) |
| 19 to 25 Years | 0 (0.0%) | 65 (32.5%) |
| 25 to 34 Years | 36 (12.2%) | 201 (68.4%) |
| 35 to 44 Years | 69 (16.3%) | 320 (75.5%) |
| 45 to 54 Years | 36 (9.2%) | 303 (77.7%) |
| 55 to 64 Years | 138 (32.6%) | 304 (71.7%) |
| 65 to 74 Years | 316 (95.2%) | 215 (64.8%) |
| 75 Years and over | 221 (100.0%) | 198 (89.6%) |
| Total | 1,055 (33.3%) | 2,238 (70.6%) |
Disability Status by Sex by Age in Hiawatha
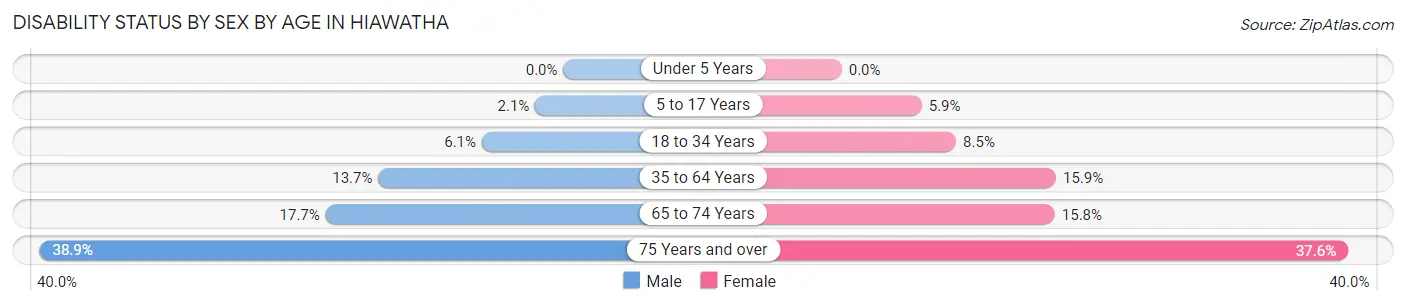
| Age Bracket | Male | Female |
| Under 5 Years | 0 (0.0%) | 0 (0.0%) |
| 5 to 17 Years | 7 (2.1%) | 23 (5.9%) |
| 18 to 34 Years | 17 (6.0%) | 22 (8.5%) |
| 35 to 64 Years | 82 (13.7%) | 102 (15.9%) |
| 65 to 74 Years | 24 (17.6%) | 31 (15.8%) |
| 75 Years and over | 28 (38.9%) | 56 (37.6%) |
Disability Class by Sex by Age in Hiawatha
Disability Class: Hearing Difficulty
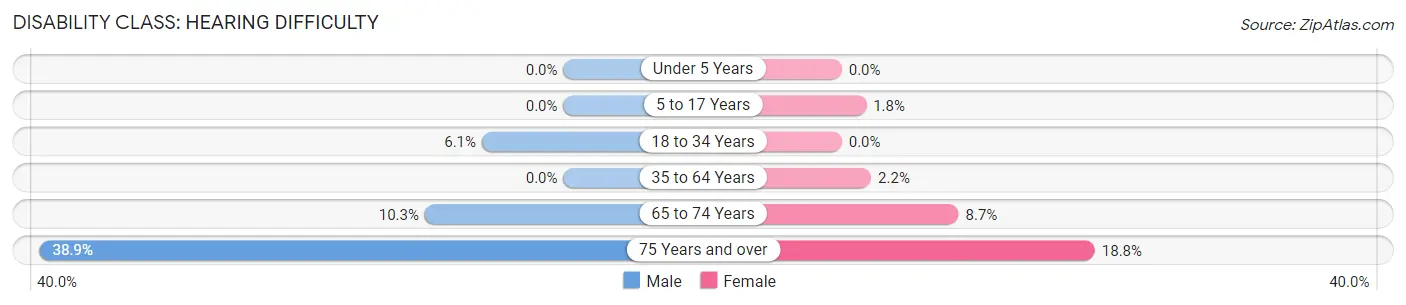
| Age Bracket | Male | Female |
| Under 5 Years | 0 (0.0%) | 0 (0.0%) |
| 5 to 17 Years | 0 (0.0%) | 7 (1.8%) |
| 18 to 34 Years | 17 (6.0%) | 0 (0.0%) |
| 35 to 64 Years | 0 (0.0%) | 14 (2.2%) |
| 65 to 74 Years | 14 (10.3%) | 17 (8.7%) |
| 75 Years and over | 28 (38.9%) | 28 (18.8%) |
Disability Class: Vision Difficulty
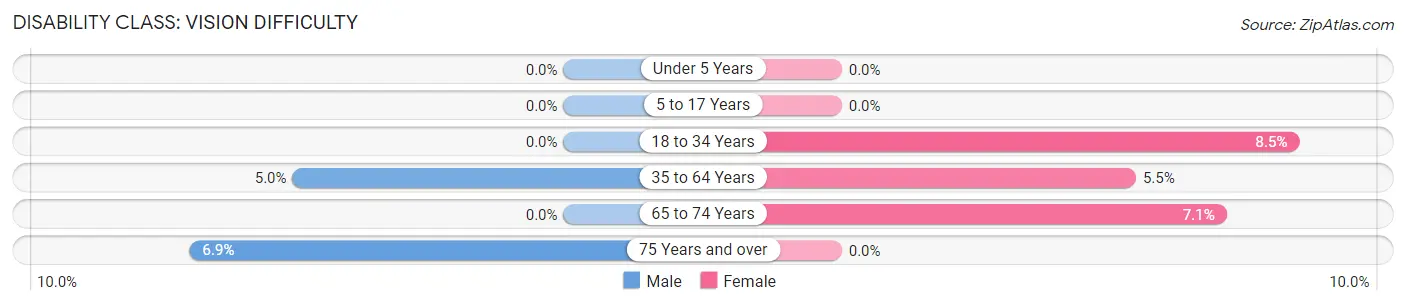
| Age Bracket | Male | Female |
| Under 5 Years | 0 (0.0%) | 0 (0.0%) |
| 5 to 17 Years | 0 (0.0%) | 0 (0.0%) |
| 18 to 34 Years | 0 (0.0%) | 22 (8.5%) |
| 35 to 64 Years | 30 (5.0%) | 35 (5.5%) |
| 65 to 74 Years | 0 (0.0%) | 14 (7.1%) |
| 75 Years and over | 5 (6.9%) | 0 (0.0%) |
Disability Class: Cognitive Difficulty
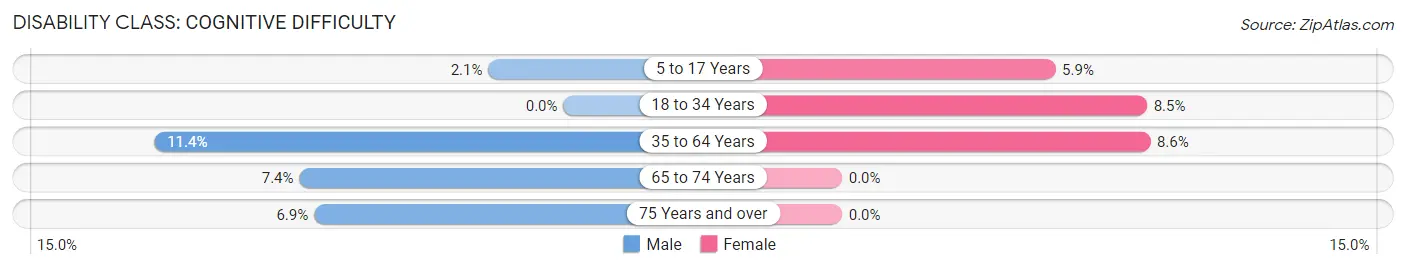
| Age Bracket | Male | Female |
| 5 to 17 Years | 7 (2.1%) | 23 (5.9%) |
| 18 to 34 Years | 0 (0.0%) | 22 (8.5%) |
| 35 to 64 Years | 68 (11.4%) | 55 (8.6%) |
| 65 to 74 Years | 10 (7.3%) | 0 (0.0%) |
| 75 Years and over | 5 (6.9%) | 0 (0.0%) |
Disability Class: Ambulatory Difficulty
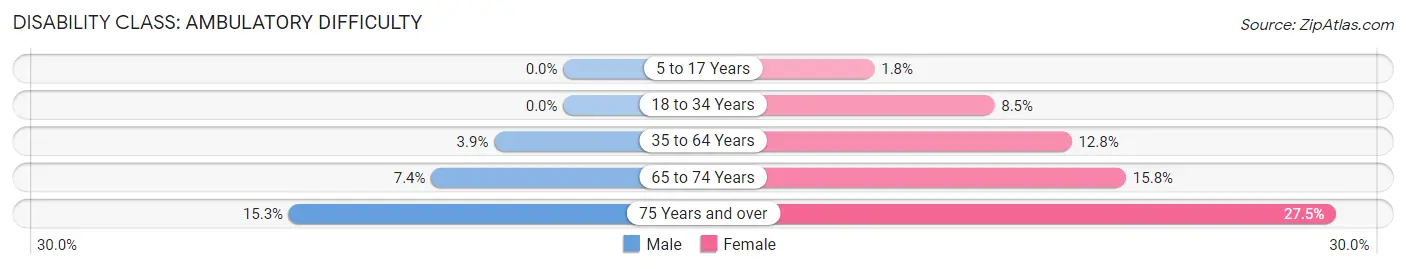
| Age Bracket | Male | Female |
| 5 to 17 Years | 0 (0.0%) | 7 (1.8%) |
| 18 to 34 Years | 0 (0.0%) | 22 (8.5%) |
| 35 to 64 Years | 23 (3.8%) | 82 (12.8%) |
| 65 to 74 Years | 10 (7.3%) | 31 (15.8%) |
| 75 Years and over | 11 (15.3%) | 41 (27.5%) |
Disability Class: Self-Care Difficulty
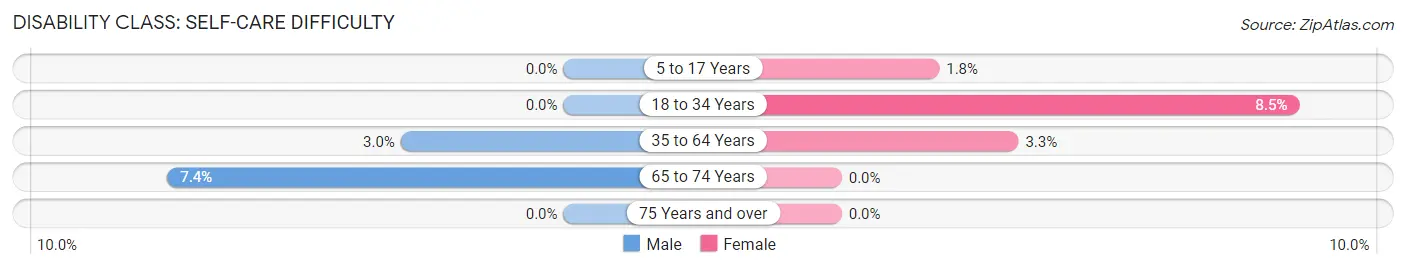
| Age Bracket | Male | Female |
| 5 to 17 Years | 0 (0.0%) | 7 (1.8%) |
| 18 to 34 Years | 0 (0.0%) | 22 (8.5%) |
| 35 to 64 Years | 18 (3.0%) | 21 (3.3%) |
| 65 to 74 Years | 10 (7.3%) | 0 (0.0%) |
| 75 Years and over | 0 (0.0%) | 0 (0.0%) |
Technology Access in Hiawatha
Computing Device Access in Hiawatha
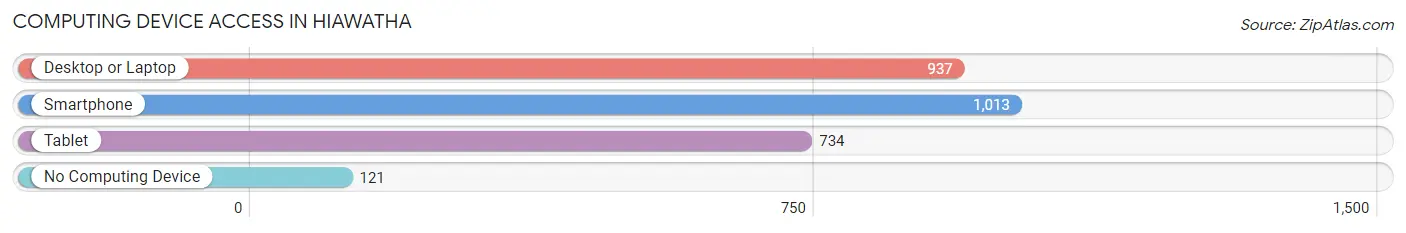
| Device Type | # Households | % Households |
| Desktop or Laptop | 937 | 74.9% |
| Smartphone | 1,013 | 81.0% |
| Tablet | 734 | 58.7% |
| No Computing Device | 121 | 9.7% |
| Total | 1,251 | 100.0% |
Internet Access in Hiawatha
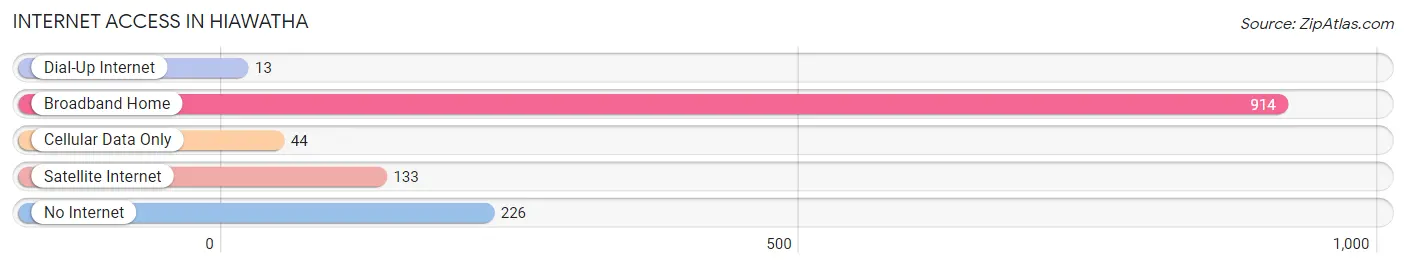
| Internet Type | # Households | % Households |
| Dial-Up Internet | 13 | 1.0% |
| Broadband Home | 914 | 73.1% |
| Cellular Data Only | 44 | 3.5% |
| Satellite Internet | 133 | 10.6% |
| No Internet | 226 | 18.1% |
| Total | 1,251 | 100.0% |
Hiawatha Summary
Hiawatha, Kansas is a small city located in the northeastern corner of the state, in Brown County. It is situated on the banks of the Missouri River, and is the county seat of Brown County. The city has a population of approximately 3,500 people, and is part of the St. Joseph, Missouri metropolitan area.
History
Hiawatha was founded in 1857 by a group of settlers from Ohio, led by William H. Hiawatha. The city was named after the famous Native American leader, Hiawatha. The city was incorporated in 1872, and was the first city in Brown County.
In the late 19th century, Hiawatha was a thriving river port, and was the largest city in Brown County. The city was home to several businesses, including a flour mill, a sawmill, a brickyard, and a brewery. The city also had a large number of saloons and gambling halls.
In the early 20th century, the city began to decline, as the river port industry declined and the railroad bypassed the city. The city was also hit hard by the Great Depression, and many of the businesses closed.
Geography
Hiawatha is located in the northeastern corner of Kansas, in Brown County. The city is situated on the banks of the Missouri River, and is part of the St. Joseph, Missouri metropolitan area. The city has a total area of 2.3 square miles, all of which is land.
The city has a humid continental climate, with hot, humid summers and cold, dry winters. The average annual temperature is 54 degrees Fahrenheit, and the average annual precipitation is 36 inches.
Economy
The economy of Hiawatha is largely based on agriculture and manufacturing. The city is home to several manufacturing companies, including a plastics manufacturer, a metal fabricator, and a food processing plant. The city also has a large number of farms, and is a major producer of corn, soybeans, and wheat.
The city also has a growing tourism industry, with several attractions, including the Hiawatha Historical Museum, the Brown County Fairgrounds, and the Hiawatha National Wildlife Refuge.
Demographics
As of the 2010 census, the population of Hiawatha was 3,521. The racial makeup of the city was 95.3% White, 0.7% African American, 0.3% Native American, 0.3% Asian, 0.1% Pacific Islander, 1.2% from other races, and 2.3% from two or more races. Hispanic or Latino of any race were 3.2% of the population.
The median household income in Hiawatha was $37,917, and the median family income was $45,938. The per capita income was $19,945. About 11.3% of the population was below the poverty line.
Conclusion
Hiawatha, Kansas is a small city located in the northeastern corner of the state, in Brown County. It is situated on the banks of the Missouri River, and is the county seat of Brown County. The city has a population of approximately 3,500 people, and is part of the St. Joseph, Missouri metropolitan area. The economy of Hiawatha is largely based on agriculture and manufacturing, and the city also has a growing tourism industry. The racial makeup of the city is predominantly White, with a small percentage of African American, Native American, Asian, and Pacific Islander residents. The median household income in Hiawatha is $37,917, and the median family income is $45,938.
Common Questions
What is Per Capita Income in Hiawatha?
Per Capita income in Hiawatha is $30,671.
What is the Median Family Income in Hiawatha?
Median Family Income in Hiawatha is $84,850.
What is the Median Household income in Hiawatha?
Median Household Income in Hiawatha is $56,050.
What is Income or Wage Gap in Hiawatha?
Income or Wage Gap in Hiawatha is 40.1%.
Women in Hiawatha earn 59.9 cents for every dollar earned by a man.
What is Inequality or Gini Index in Hiawatha?
Inequality or Gini Index in Hiawatha is 0.41.
What is the Total Population of Hiawatha?
Total Population of Hiawatha is 3,246.
What is the Total Male Population of Hiawatha?
Total Male Population of Hiawatha is 1,517.
What is the Total Female Population of Hiawatha?
Total Female Population of Hiawatha is 1,729.
What is the Ratio of Males per 100 Females in Hiawatha?
There are 87.74 Males per 100 Females in Hiawatha.
What is the Ratio of Females per 100 Males in Hiawatha?
There are 113.97 Females per 100 Males in Hiawatha.
What is the Median Population Age in Hiawatha?
Median Population Age in Hiawatha is 41.6 Years.
What is the Average Family Size in Hiawatha
Average Family Size in Hiawatha is 3.4 People.
What is the Average Household Size in Hiawatha
Average Household Size in Hiawatha is 2.5 People.
How Large is the Labor Force in Hiawatha?
There are 1,773 People in the Labor Forcein in Hiawatha.
What is the Percentage of People in the Labor Force in Hiawatha?
70.8% of People are in the Labor Force in Hiawatha.
What is the Unemployment Rate in Hiawatha?
Unemployment Rate in Hiawatha is 4.5%.