Herington, KS Map & Demographics
Herington Map
Herington Overview
$40,769
PER CAPITA INCOME
$72,227
AVG FAMILY INCOME
$63,591
AVG HOUSEHOLD INCOME
36.5%
WAGE / INCOME GAP [ % ]
63.5¢/ $1
WAGE / INCOME GAP [ $ ]
0.46
INEQUALITY / GINI INDEX
2,074
TOTAL POPULATION
1,107
MALE POPULATION
967
FEMALE POPULATION
114.48
MALES / 100 FEMALES
87.35
FEMALES / 100 MALES
43.4
MEDIAN AGE
2.5
AVG FAMILY SIZE
1.9
AVG HOUSEHOLD SIZE
1,027
LABOR FORCE [ PEOPLE ]
57.2%
PERCENT IN LABOR FORCE
0.6%
UNEMPLOYMENT RATE
Herington Zip Codes
Herington Area Codes
Income in Herington
Income Overview in Herington
Per Capita Income in Herington is $40,769, while median incomes of families and households are $72,227 and $63,591 respectively.
| Characteristic | Number | Measure |
| Per Capita Income | 2,074 | $40,769 |
| Median Family Income | 579 | $72,227 |
| Mean Family Income | 579 | $75,201 |
| Median Household Income | 1,086 | $63,591 |
| Mean Household Income | 1,086 | $74,482 |
| Income Deficit | 579 | $0 |
| Wage / Income Gap (%) | 2,074 | 36.53% |
| Wage / Income Gap ($) | 2,074 | 63.47¢ per $1 |
| Gini / Inequality Index | 2,074 | 0.46 |
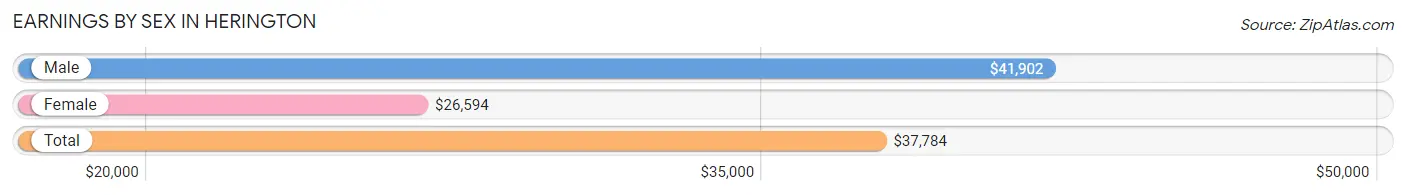
Earnings by Sex in Herington
Average Earnings in Herington are $37,784, $41,902 for men and $26,594 for women, a difference of 36.5%.
| Sex | Number | Average Earnings |
| Male | 664 (58.4%) | $41,902 |
| Female | 474 (41.6%) | $26,594 |
| Total | 1,138 (100.0%) | $37,784 |
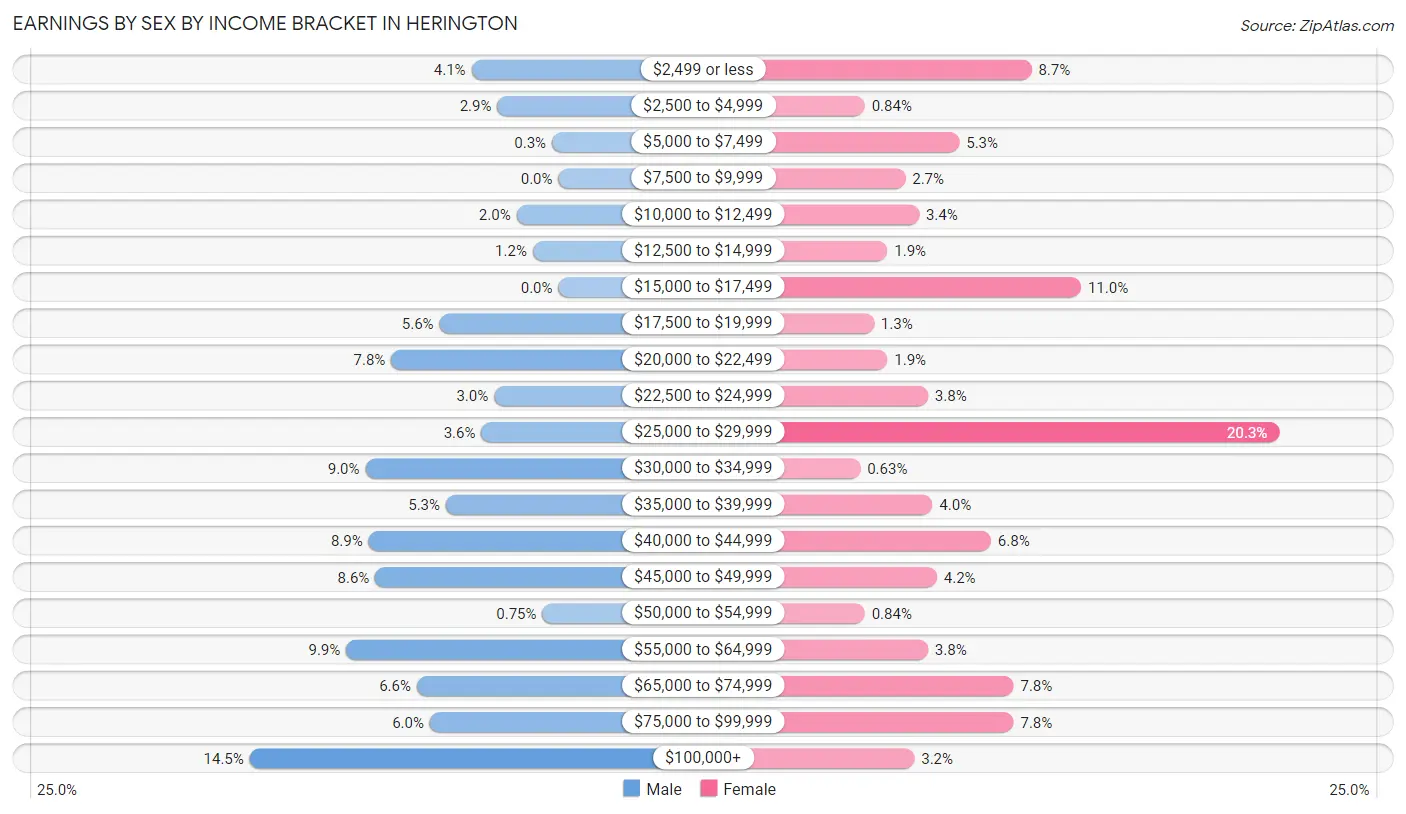
Earnings by Sex by Income Bracket in Herington
The most common earnings brackets in Herington are $100,000+ for men (96 | 14.5%) and $25,000 to $29,999 for women (96 | 20.3%).
| Income | Male | Female |
| $2,499 or less | 27 (4.1%) | 41 (8.6%) |
| $2,500 to $4,999 | 19 (2.9%) | 4 (0.8%) |
| $5,000 to $7,499 | 2 (0.3%) | 25 (5.3%) |
| $7,500 to $9,999 | 0 (0.0%) | 13 (2.7%) |
| $10,000 to $12,499 | 13 (2.0%) | 16 (3.4%) |
| $12,500 to $14,999 | 8 (1.2%) | 9 (1.9%) |
| $15,000 to $17,499 | 0 (0.0%) | 52 (11.0%) |
| $17,500 to $19,999 | 37 (5.6%) | 6 (1.3%) |
| $20,000 to $22,499 | 52 (7.8%) | 9 (1.9%) |
| $22,500 to $24,999 | 20 (3.0%) | 18 (3.8%) |
| $25,000 to $29,999 | 24 (3.6%) | 96 (20.3%) |
| $30,000 to $34,999 | 60 (9.0%) | 3 (0.6%) |
| $35,000 to $39,999 | 35 (5.3%) | 19 (4.0%) |
| $40,000 to $44,999 | 59 (8.9%) | 32 (6.8%) |
| $45,000 to $49,999 | 57 (8.6%) | 20 (4.2%) |
| $50,000 to $54,999 | 5 (0.7%) | 4 (0.8%) |
| $55,000 to $64,999 | 66 (9.9%) | 18 (3.8%) |
| $65,000 to $74,999 | 44 (6.6%) | 37 (7.8%) |
| $75,000 to $99,999 | 40 (6.0%) | 37 (7.8%) |
| $100,000+ | 96 (14.5%) | 15 (3.2%) |
| Total | 664 (100.0%) | 474 (100.0%) |
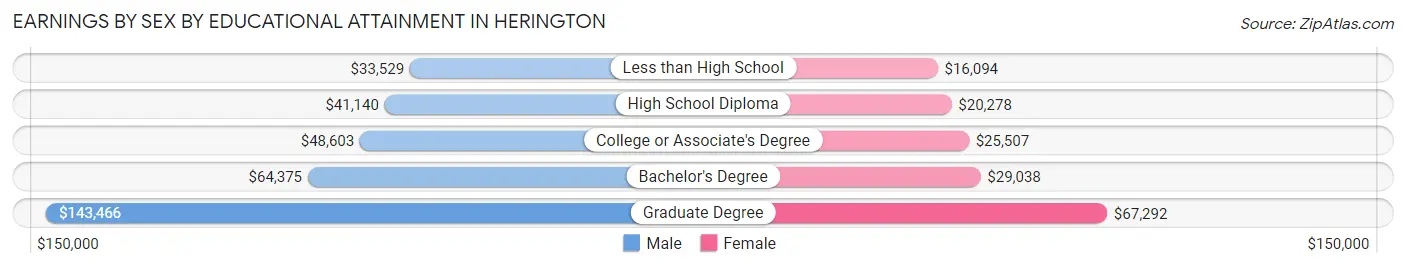
Earnings by Sex by Educational Attainment in Herington
Average earnings in Herington are $47,417 for men and $26,766 for women, a difference of 43.5%. Men with an educational attainment of graduate degree enjoy the highest average annual earnings of $143,466, while those with less than high school education earn the least with $33,529. Women with an educational attainment of graduate degree earn the most with the average annual earnings of $67,292, while those with less than high school education have the smallest earnings of $16,094.
| Educational Attainment | Male Income | Female Income |
| Less than High School | $33,529 | $16,094 |
| High School Diploma | $41,140 | $20,278 |
| College or Associate's Degree | $48,603 | $25,507 |
| Bachelor's Degree | $64,375 | $29,038 |
| Graduate Degree | $143,466 | $67,292 |
| Total | $47,417 | $26,766 |
Family Income in Herington
Family Income Brackets in Herington
According to the Herington family income data, there are 165 families falling into the $75,000 to $99,999 income range, which is the most common income bracket and makes up 28.5% of all families. Conversely, the less than $10,000 income bracket is the least frequent group with only 5 families (0.9%) belonging to this category.
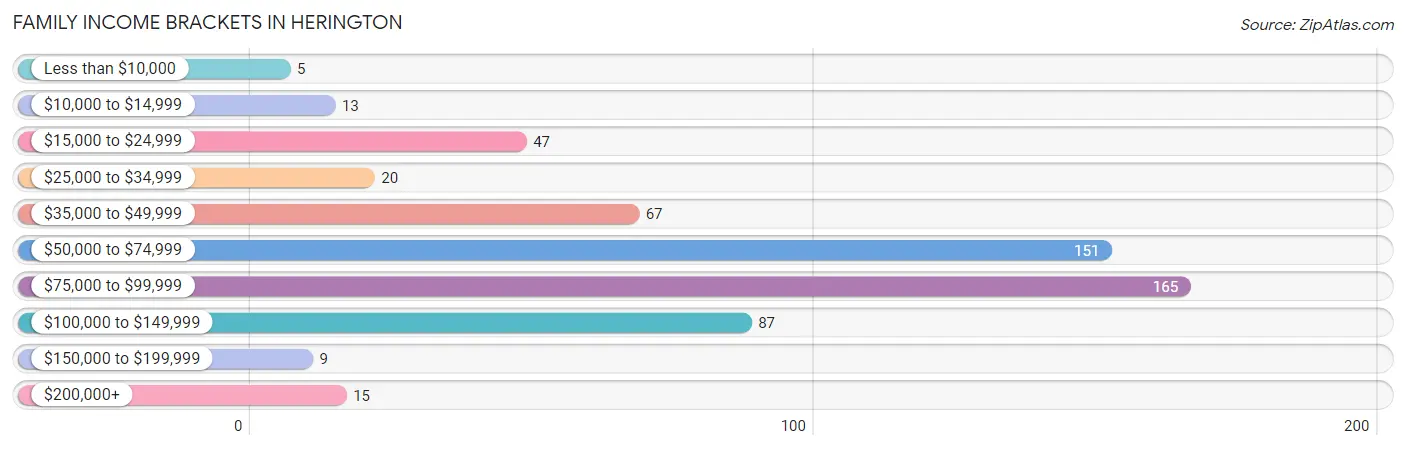
| Income Bracket | # Families | % Families |
| Less than $10,000 | 5 | 0.9% |
| $10,000 to $14,999 | 13 | 2.2% |
| $15,000 to $24,999 | 47 | 8.1% |
| $25,000 to $34,999 | 20 | 3.5% |
| $35,000 to $49,999 | 67 | 11.6% |
| $50,000 to $74,999 | 151 | 26.1% |
| $75,000 to $99,999 | 165 | 28.5% |
| $100,000 to $149,999 | 87 | 15.0% |
| $150,000 to $199,999 | 9 | 1.6% |
| $200,000+ | 15 | 2.6% |
Family Income by Famaliy Size in Herington
4-person families (42 | 7.2%) account for the highest median family income in Herington with $132,813 per family, while 2-person families (382 | 66.0%) have the highest median income of $36,054 per family member.
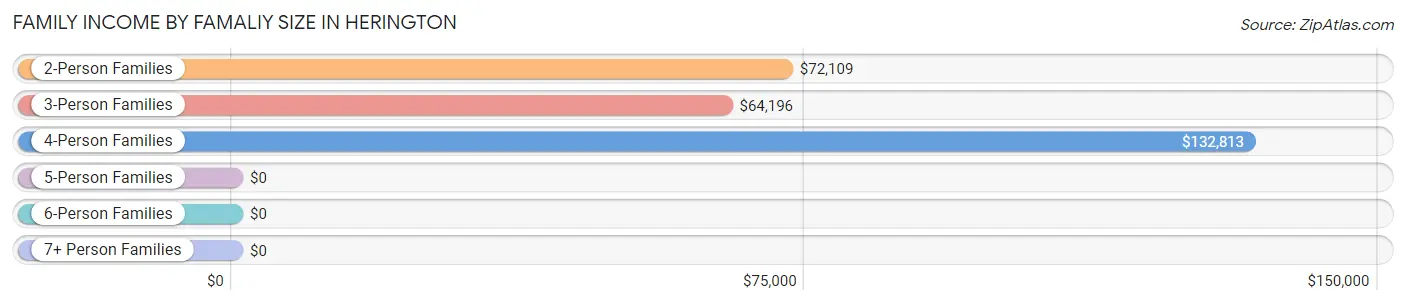
| Income Bracket | # Families | Median Income |
| 2-Person Families | 382 (66.0%) | $72,109 |
| 3-Person Families | 114 (19.7%) | $64,196 |
| 4-Person Families | 42 (7.2%) | $132,813 |
| 5-Person Families | 21 (3.6%) | $0 |
| 6-Person Families | 20 (3.5%) | $0 |
| 7+ Person Families | 0 (0.0%) | $0 |
| Total | 579 (100.0%) | $72,227 |
Family Income by Number of Earners in Herington
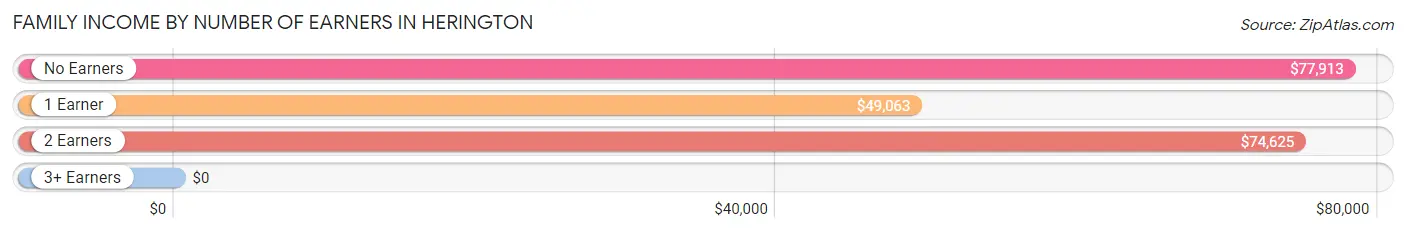
| Number of Earners | # Families | Median Income |
| No Earners | 183 (31.6%) | $77,913 |
| 1 Earner | 146 (25.2%) | $49,063 |
| 2 Earners | 239 (41.3%) | $74,625 |
| 3+ Earners | 11 (1.9%) | $0 |
| Total | 579 (100.0%) | $72,227 |
Household Income in Herington
Household Income Brackets in Herington
With 270 households falling in the category, the $75,000 to $99,999 income range is the most frequent in Herington, accounting for 24.9% of all households. In contrast, only 9 households (0.8%) fall into the $150,000 to $199,999 income bracket, making it the least populous group.
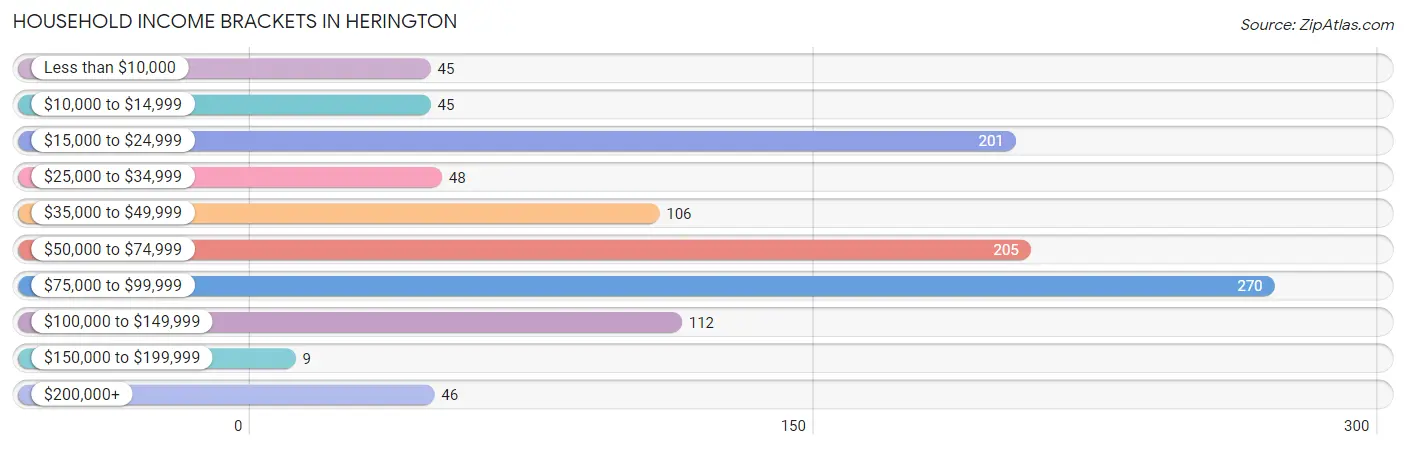
| Income Bracket | # Households | % Households |
| Less than $10,000 | 45 | 4.1% |
| $10,000 to $14,999 | 45 | 4.1% |
| $15,000 to $24,999 | 201 | 18.5% |
| $25,000 to $34,999 | 48 | 4.4% |
| $35,000 to $49,999 | 106 | 9.8% |
| $50,000 to $74,999 | 205 | 18.9% |
| $75,000 to $99,999 | 270 | 24.9% |
| $100,000 to $149,999 | 112 | 10.3% |
| $150,000 to $199,999 | 9 | 0.8% |
| $200,000+ | 46 | 4.2% |
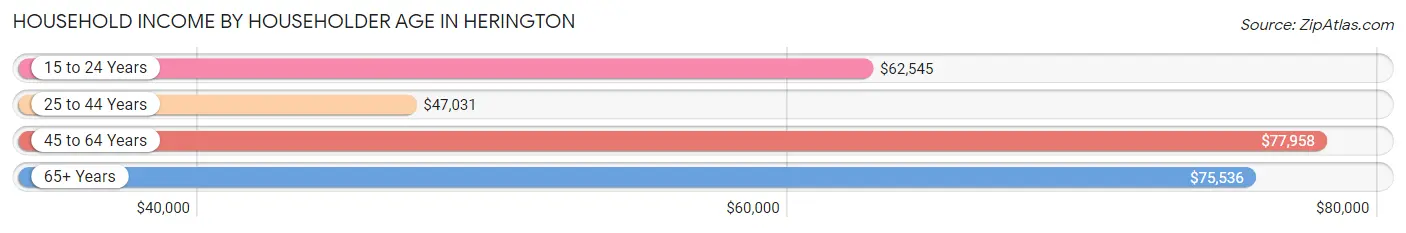
Household Income by Householder Age in Herington
The median household income in Herington is $63,591, with the highest median household income of $77,958 found in the 45 to 64 years age bracket for the primary householder. A total of 313 households (28.8%) fall into this category. Meanwhile, the 25 to 44 years age bracket for the primary householder has the lowest median household income of $47,031, with 363 households (33.4%) in this group.
| Income Bracket | # Households | Median Income |
| 15 to 24 Years | 61 (5.6%) | $62,545 |
| 25 to 44 Years | 363 (33.4%) | $47,031 |
| 45 to 64 Years | 313 (28.8%) | $77,958 |
| 65+ Years | 349 (32.1%) | $75,536 |
| Total | 1,086 (100.0%) | $63,591 |
Poverty in Herington
Income Below Poverty by Sex and Age in Herington
With 16.7% poverty level for males and 13.7% for females among the residents of Herington, 16 and 17 year old males and 35 to 44 year old females are the most vulnerable to poverty, with 11 males (100.0%) and 53 females (37.6%) in their respective age groups living below the poverty level.
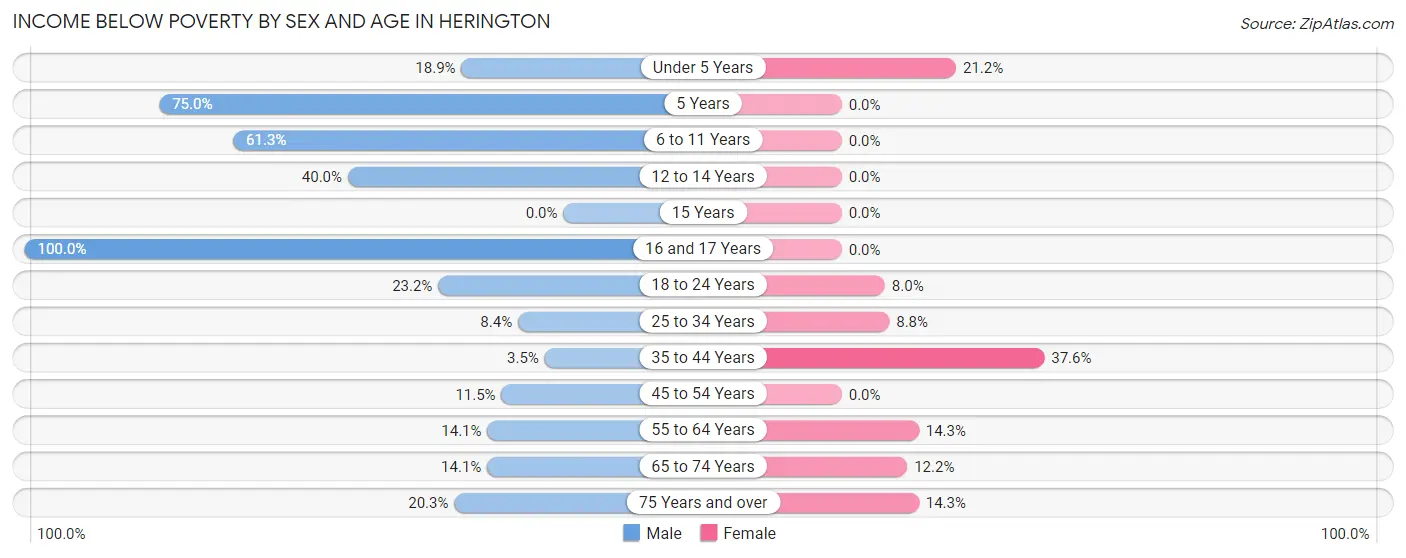
| Age Bracket | Male | Female |
| Under 5 Years | 7 (18.9%) | 14 (21.2%) |
| 5 Years | 15 (75.0%) | 0 (0.0%) |
| 6 to 11 Years | 19 (61.3%) | 0 (0.0%) |
| 12 to 14 Years | 16 (40.0%) | 0 (0.0%) |
| 15 Years | 0 (0.0%) | 0 (0.0%) |
| 16 and 17 Years | 11 (100.0%) | 0 (0.0%) |
| 18 to 24 Years | 23 (23.2%) | 4 (8.0%) |
| 25 to 34 Years | 8 (8.4%) | 12 (8.8%) |
| 35 to 44 Years | 8 (3.5%) | 53 (37.6%) |
| 45 to 54 Years | 10 (11.5%) | 0 (0.0%) |
| 55 to 64 Years | 22 (14.1%) | 18 (14.3%) |
| 65 to 74 Years | 27 (14.1%) | 22 (12.1%) |
| 75 Years and over | 16 (20.3%) | 6 (14.3%) |
| Total | 182 (16.7%) | 129 (13.7%) |
Income Above Poverty by Sex and Age in Herington
According to the poverty statistics in Herington, males aged 15 years and females aged 5 years are the age groups that are most secure financially, with 100.0% of males and 100.0% of females in these age groups living above the poverty line.
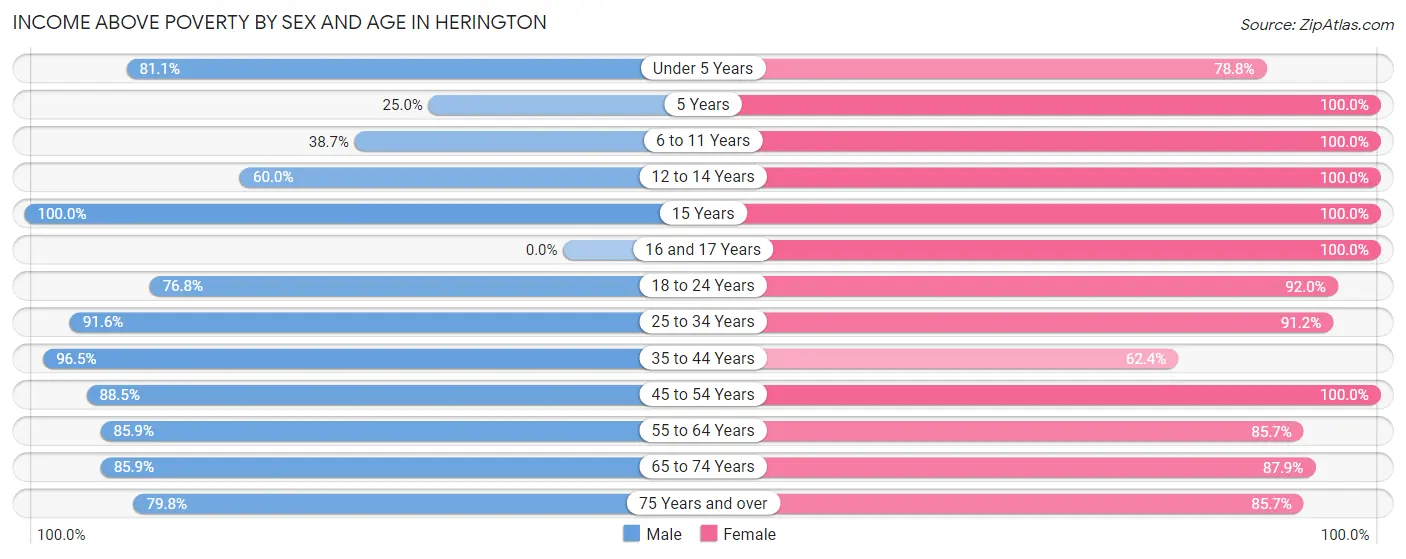
| Age Bracket | Male | Female |
| Under 5 Years | 30 (81.1%) | 52 (78.8%) |
| 5 Years | 5 (25.0%) | 12 (100.0%) |
| 6 to 11 Years | 12 (38.7%) | 10 (100.0%) |
| 12 to 14 Years | 24 (60.0%) | 46 (100.0%) |
| 15 Years | 13 (100.0%) | 3 (100.0%) |
| 16 and 17 Years | 0 (0.0%) | 24 (100.0%) |
| 18 to 24 Years | 76 (76.8%) | 46 (92.0%) |
| 25 to 34 Years | 87 (91.6%) | 124 (91.2%) |
| 35 to 44 Years | 223 (96.5%) | 88 (62.4%) |
| 45 to 54 Years | 77 (88.5%) | 107 (100.0%) |
| 55 to 64 Years | 134 (85.9%) | 108 (85.7%) |
| 65 to 74 Years | 164 (85.9%) | 159 (87.8%) |
| 75 Years and over | 63 (79.7%) | 36 (85.7%) |
| Total | 908 (83.3%) | 815 (86.3%) |
Income Below Poverty Among Married-Couple Families in Herington
The poverty statistics for married-couple families in Herington show that 8.7% or 42 of the total 481 families live below the poverty line. Families with 3 or 4 children have the highest poverty rate of 21.4%, comprising of 6 families. On the other hand, families with no children have the lowest poverty rate of 2.5%, which includes 8 families.
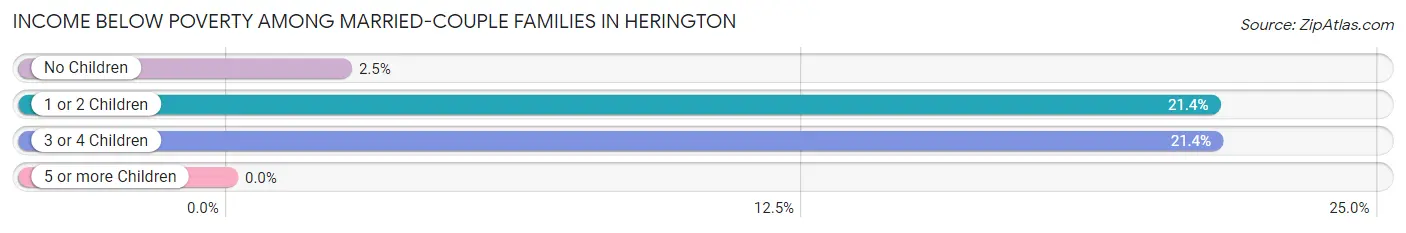
| Children | Above Poverty | Below Poverty |
| No Children | 314 (97.5%) | 8 (2.5%) |
| 1 or 2 Children | 103 (78.6%) | 28 (21.4%) |
| 3 or 4 Children | 22 (78.6%) | 6 (21.4%) |
| 5 or more Children | 0 (0.0%) | 0 (0.0%) |
| Total | 439 (91.3%) | 42 (8.7%) |
Income Below Poverty Among Single-Parent Households in Herington
According to the poverty data in Herington, 28.6% or 8 single-father households and 17.1% or 12 single-mother households are living below the poverty line. Among single-father households, those with 1 or 2 children have the highest poverty rate, with 8 households (36.4%) experiencing poverty. Likewise, among single-mother households, those with 1 or 2 children have the highest poverty rate, with 7 households (33.3%) falling below the poverty line.
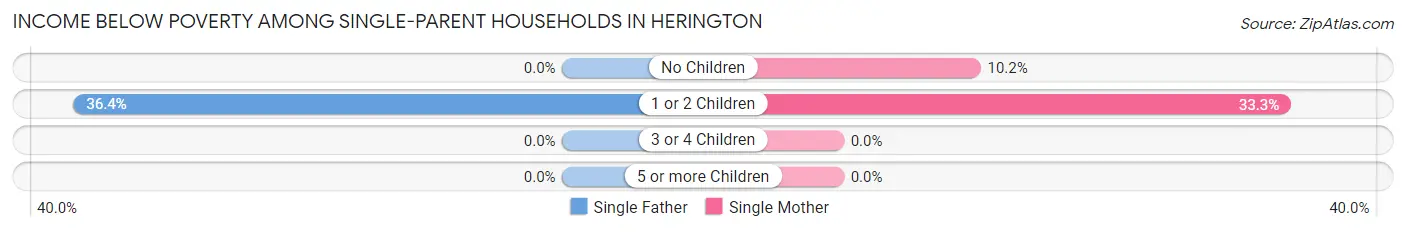
| Children | Single Father | Single Mother |
| No Children | 0 (0.0%) | 5 (10.2%) |
| 1 or 2 Children | 8 (36.4%) | 7 (33.3%) |
| 3 or 4 Children | 0 (0.0%) | 0 (0.0%) |
| 5 or more Children | 0 (0.0%) | 0 (0.0%) |
| Total | 8 (28.6%) | 12 (17.1%) |
Income Below Poverty Among Married-Couple vs Single-Parent Households in Herington
The poverty data for Herington shows that 42 of the married-couple family households (8.7%) and 20 of the single-parent households (20.4%) are living below the poverty level. Within the married-couple family households, those with 3 or 4 children have the highest poverty rate, with 6 households (21.4%) falling below the poverty line. Among the single-parent households, those with 1 or 2 children have the highest poverty rate, with 15 household (34.9%) living below poverty.
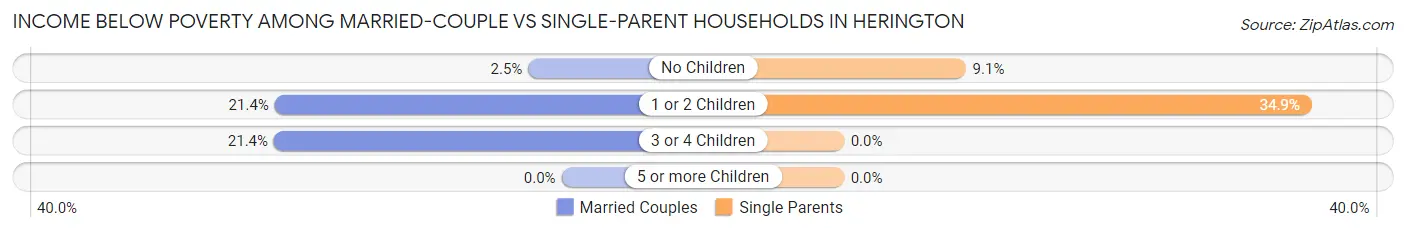
| Children | Married-Couple Families | Single-Parent Households |
| No Children | 8 (2.5%) | 5 (9.1%) |
| 1 or 2 Children | 28 (21.4%) | 15 (34.9%) |
| 3 or 4 Children | 6 (21.4%) | 0 (0.0%) |
| 5 or more Children | 0 (0.0%) | 0 (0.0%) |
| Total | 42 (8.7%) | 20 (20.4%) |
Race in Herington
The most populous races in Herington are White / Caucasian (1,638 | 79.0%), Two or more Races (242 | 11.7%), and Hispanic or Latino (122 | 5.9%).
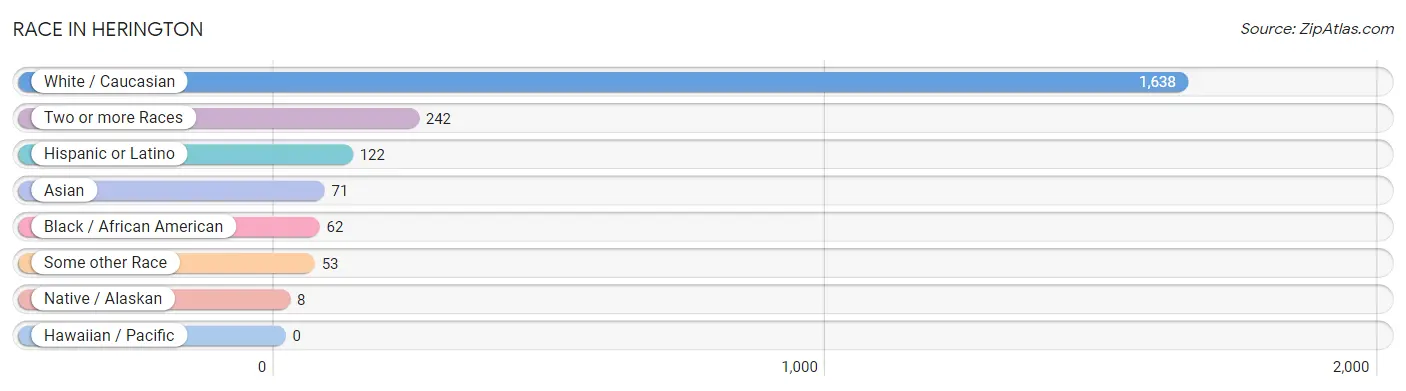
| Race | # Population | % Population |
| Asian | 71 | 3.4% |
| Black / African American | 62 | 3.0% |
| Hawaiian / Pacific | 0 | 0.0% |
| Hispanic or Latino | 122 | 5.9% |
| Native / Alaskan | 8 | 0.4% |
| White / Caucasian | 1,638 | 79.0% |
| Two or more Races | 242 | 11.7% |
| Some other Race | 53 | 2.6% |
| Total | 2,074 | 100.0% |
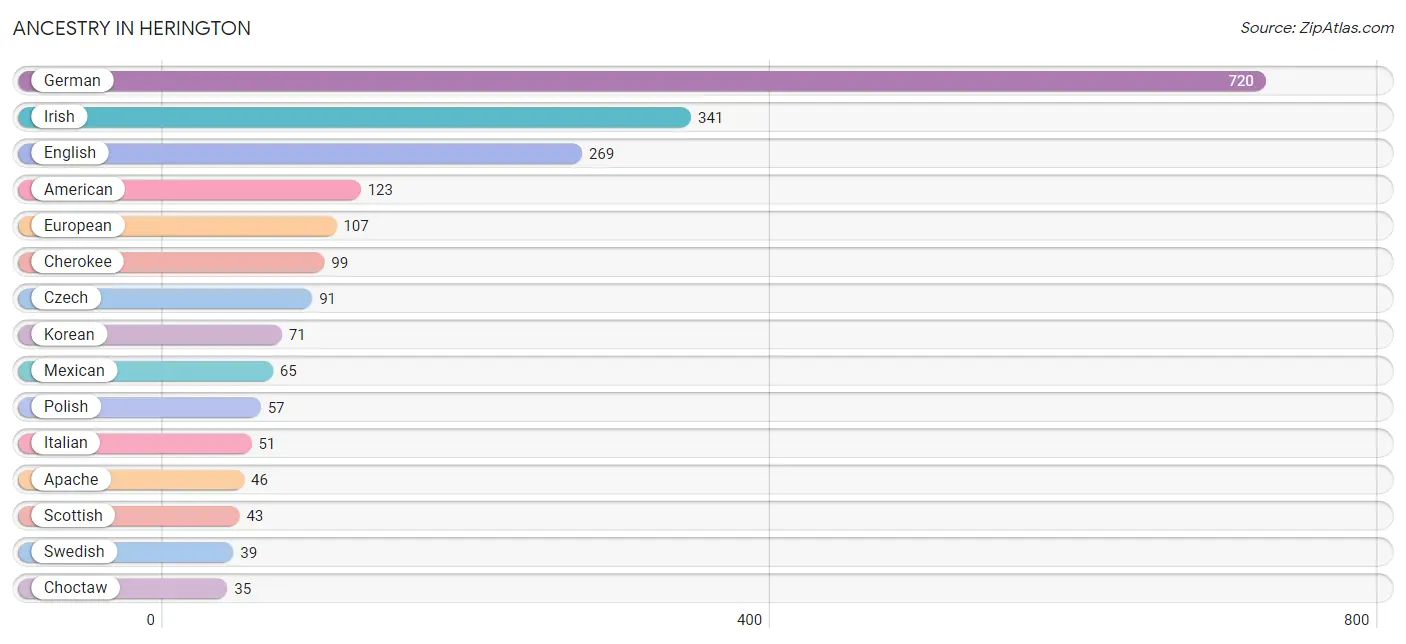
Ancestry in Herington
The most populous ancestries reported in Herington are German (720 | 34.7%), Irish (341 | 16.4%), English (269 | 13.0%), American (123 | 5.9%), and European (107 | 5.2%), together accounting for 75.2% of all Herington residents.
| Ancestry | # Population | % Population |
| Alsatian | 4 | 0.2% |
| American | 123 | 5.9% |
| Apache | 46 | 2.2% |
| Arab | 25 | 1.2% |
| Central American | 7 | 0.3% |
| Cherokee | 99 | 4.8% |
| Choctaw | 35 | 1.7% |
| Czech | 91 | 4.4% |
| English | 269 | 13.0% |
| European | 107 | 5.2% |
| French | 19 | 0.9% |
| German | 720 | 34.7% |
| Hungarian | 4 | 0.2% |
| Irish | 341 | 16.4% |
| Italian | 51 | 2.5% |
| Korean | 71 | 3.4% |
| Lebanese | 25 | 1.2% |
| Mexican | 65 | 3.1% |
| Norwegian | 3 | 0.1% |
| Panamanian | 7 | 0.3% |
| Polish | 57 | 2.8% |
| Puerto Rican | 9 | 0.4% |
| Russian | 6 | 0.3% |
| Scotch-Irish | 13 | 0.6% |
| Scottish | 43 | 2.1% |
| Spaniard | 33 | 1.6% |
| Swedish | 39 | 1.9% |
| Ukrainian | 17 | 0.8% | View All 28 Rows |
Immigrants in Herington
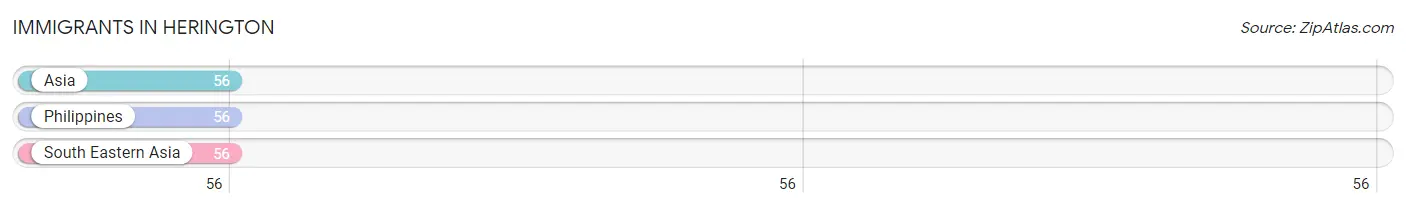
The most numerous immigrant groups reported in Herington came from Asia (56 | 2.7%), Philippines (56 | 2.7%), and South Eastern Asia (56 | 2.7%), together accounting for 8.1% of all Herington residents.
| Immigration Origin | # Population | % Population |
| Asia | 56 | 2.7% |
| Philippines | 56 | 2.7% |
| South Eastern Asia | 56 | 2.7% | View All 3 Rows |
Sex and Age in Herington
Sex and Age in Herington
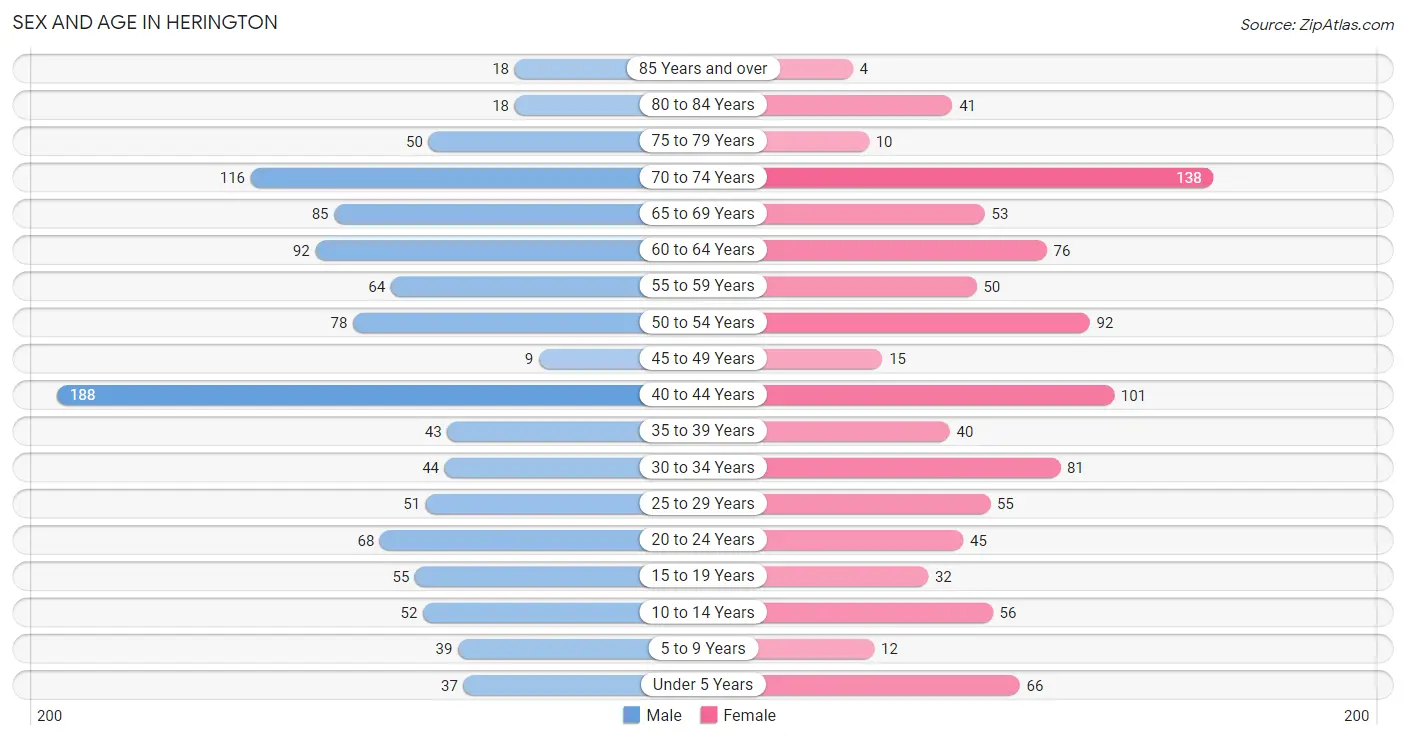
The most populous age groups in Herington are 40 to 44 Years (188 | 17.0%) for men and 70 to 74 Years (138 | 14.3%) for women.
| Age Bracket | Male | Female |
| Under 5 Years | 37 (3.3%) | 66 (6.8%) |
| 5 to 9 Years | 39 (3.5%) | 12 (1.2%) |
| 10 to 14 Years | 52 (4.7%) | 56 (5.8%) |
| 15 to 19 Years | 55 (5.0%) | 32 (3.3%) |
| 20 to 24 Years | 68 (6.1%) | 45 (4.6%) |
| 25 to 29 Years | 51 (4.6%) | 55 (5.7%) |
| 30 to 34 Years | 44 (4.0%) | 81 (8.4%) |
| 35 to 39 Years | 43 (3.9%) | 40 (4.1%) |
| 40 to 44 Years | 188 (17.0%) | 101 (10.4%) |
| 45 to 49 Years | 9 (0.8%) | 15 (1.5%) |
| 50 to 54 Years | 78 (7.0%) | 92 (9.5%) |
| 55 to 59 Years | 64 (5.8%) | 50 (5.2%) |
| 60 to 64 Years | 92 (8.3%) | 76 (7.9%) |
| 65 to 69 Years | 85 (7.7%) | 53 (5.5%) |
| 70 to 74 Years | 116 (10.5%) | 138 (14.3%) |
| 75 to 79 Years | 50 (4.5%) | 10 (1.0%) |
| 80 to 84 Years | 18 (1.6%) | 41 (4.2%) |
| 85 Years and over | 18 (1.6%) | 4 (0.4%) |
| Total | 1,107 (100.0%) | 967 (100.0%) |
Families and Households in Herington
Median Family Size in Herington
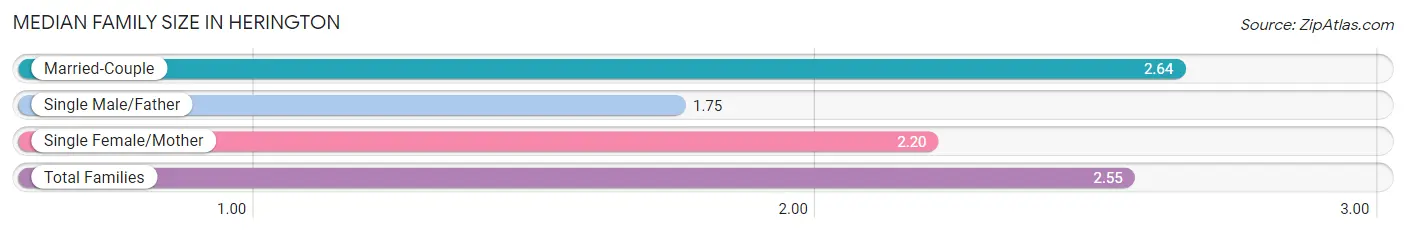
The median family size in Herington is 2.55 persons per family, with married-couple families (481 | 83.1%) accounting for the largest median family size of 2.64 persons per family. On the other hand, single male/father families (28 | 4.8%) represent the smallest median family size with 1.75 persons per family.
| Family Type | # Families | Family Size |
| Married-Couple | 481 (83.1%) | 2.64 |
| Single Male/Father | 28 (4.8%) | 1.75 |
| Single Female/Mother | 70 (12.1%) | 2.20 |
| Total Families | 579 (100.0%) | 2.55 |
Median Household Size in Herington
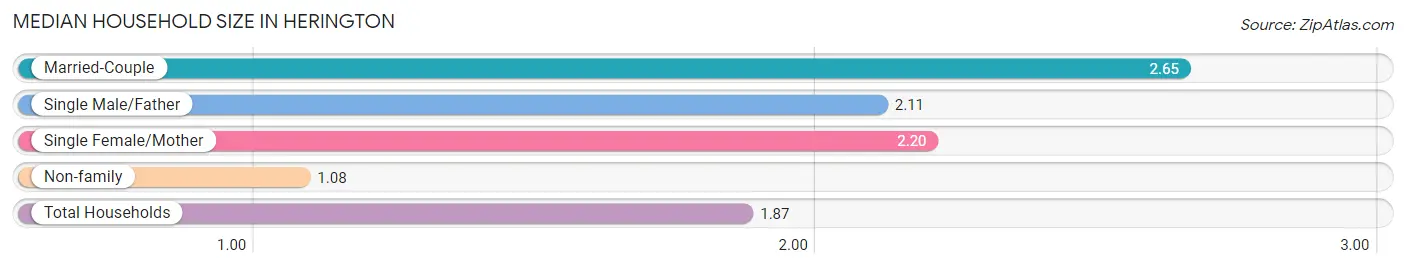
The median household size in Herington is 1.87 persons per household, with married-couple households (481 | 44.3%) accounting for the largest median household size of 2.65 persons per household. non-family households (507 | 46.7%) represent the smallest median household size with 1.08 persons per household.
| Household Type | # Households | Household Size |
| Married-Couple | 481 (44.3%) | 2.65 |
| Single Male/Father | 28 (2.6%) | 2.11 |
| Single Female/Mother | 70 (6.5%) | 2.20 |
| Non-family | 507 (46.7%) | 1.08 |
| Total Households | 1,086 (100.0%) | 1.87 |
Household Size by Marriage Status in Herington
Out of a total of 1,086 households in Herington, 579 (53.3%) are family households, while 507 (46.7%) are nonfamily households. The most numerous type of family households are 2-person households, comprising 363, and the most common type of nonfamily households are 1-person households, comprising 468.
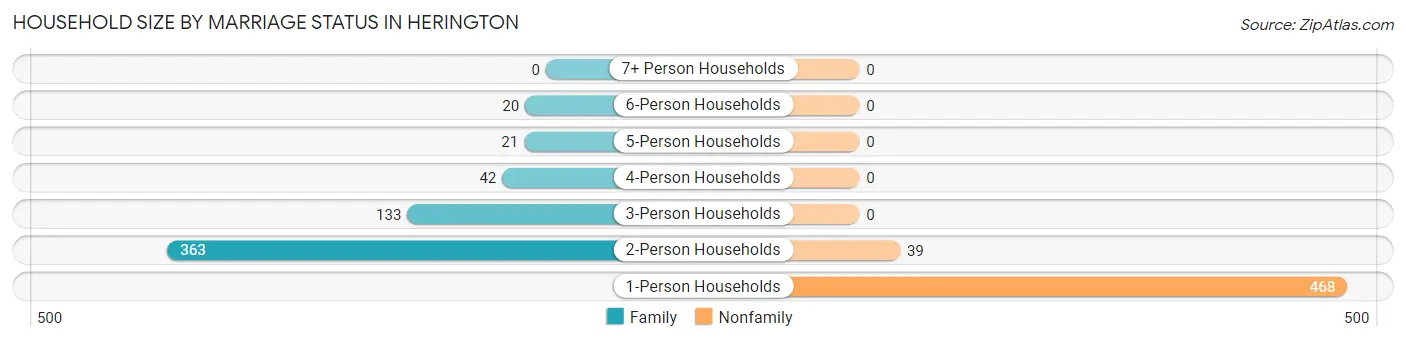
| Household Size | Family Households | Nonfamily Households |
| 1-Person Households | - | 468 (43.1%) |
| 2-Person Households | 363 (33.4%) | 39 (3.6%) |
| 3-Person Households | 133 (12.2%) | 0 (0.0%) |
| 4-Person Households | 42 (3.9%) | 0 (0.0%) |
| 5-Person Households | 21 (1.9%) | 0 (0.0%) |
| 6-Person Households | 20 (1.8%) | 0 (0.0%) |
| 7+ Person Households | 0 (0.0%) | 0 (0.0%) |
| Total | 579 (53.3%) | 507 (46.7%) |
Female Fertility in Herington
Fertility by Age in Herington
Average fertility rate in Herington is 81.0 births per 1,000 women. Women in the age bracket of 20 to 34 years have the highest fertility rate with 105.0 births per 1,000 women. Women in the age bracket of 20 to 34 years acount for 59.4% of all women with births.
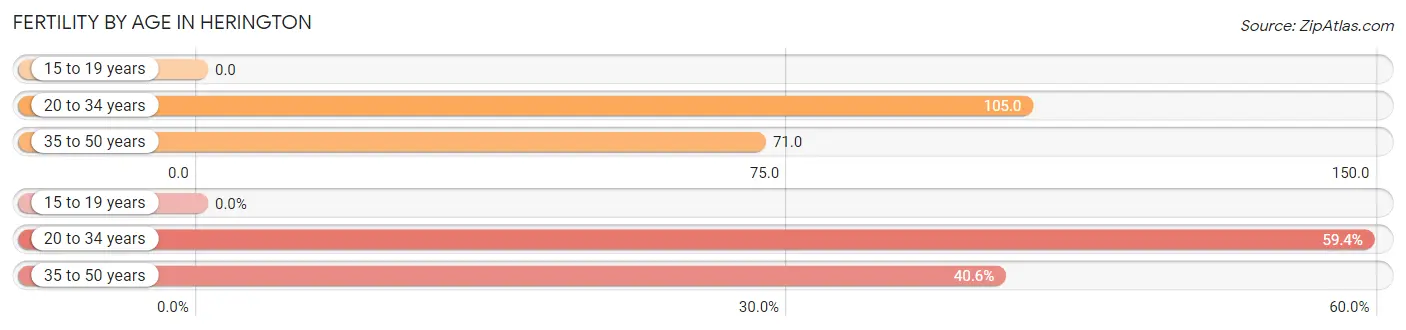
| Age Bracket | Women with Births | Births / 1,000 Women |
| 15 to 19 years | 0 (0.0%) | 0.0 |
| 20 to 34 years | 19 (59.4%) | 105.0 |
| 35 to 50 years | 13 (40.6%) | 71.0 |
| Total | 32 (100.0%) | 81.0 |
Fertility by Age by Marriage Status in Herington
59.4% of women with births (32) in Herington are married. The highest percentage of unmarried women with births falls into 35 to 50 years age bracket with 53.8% of them unmarried at the time of birth, while the lowest percentage of unmarried women with births belong to 20 to 34 years age bracket with 31.6% of them unmarried.
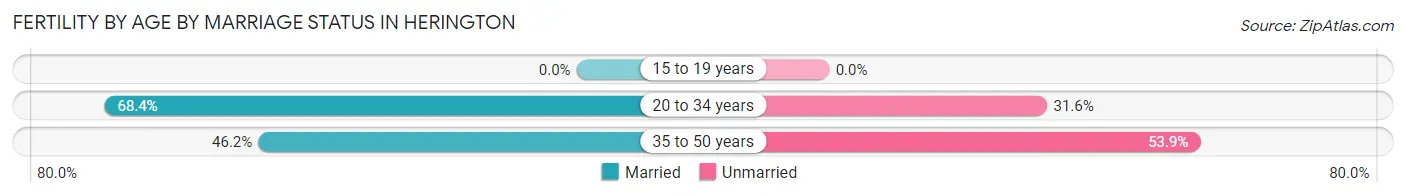
| Age Bracket | Married | Unmarried |
| 15 to 19 years | 0 (0.0%) | 0 (0.0%) |
| 20 to 34 years | 13 (68.4%) | 6 (31.6%) |
| 35 to 50 years | 6 (46.2%) | 7 (53.8%) |
| Total | 19 (59.4%) | 13 (40.6%) |
Fertility by Education in Herington
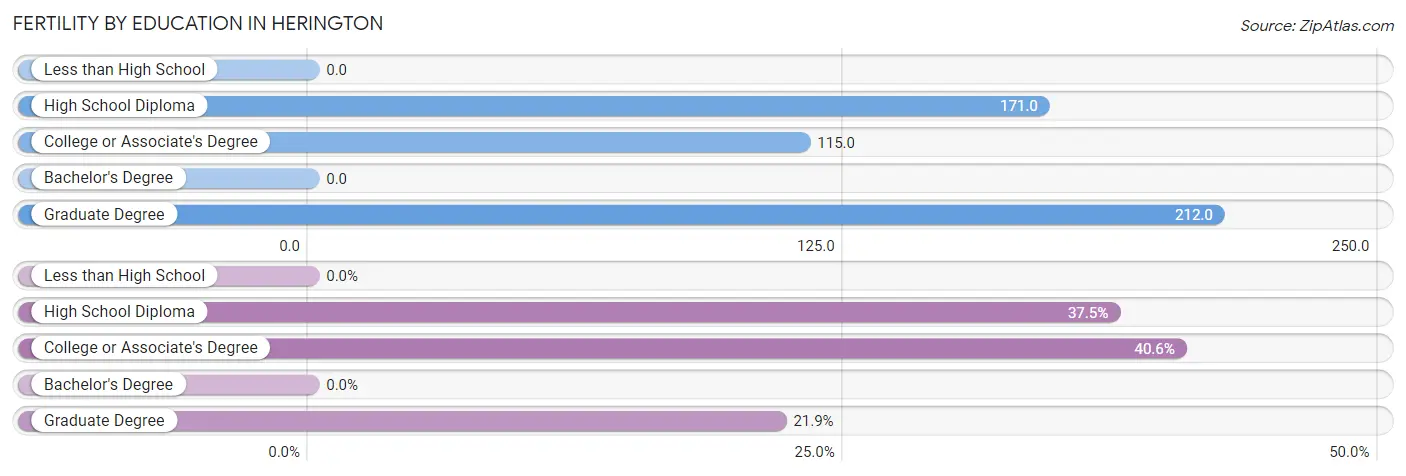
| Educational Attainment | Women with Births | Births / 1,000 Women |
| Less than High School | 0 (0.0%) | 0.0 |
| High School Diploma | 12 (37.5%) | 171.0 |
| College or Associate's Degree | 13 (40.6%) | 115.0 |
| Bachelor's Degree | 0 (0.0%) | 0.0 |
| Graduate Degree | 7 (21.9%) | 212.0 |
| Total | 32 (100.0%) | 81.0 |
Fertility by Education by Marriage Status in Herington
40.6% of women with births in Herington are unmarried. Women with the educational attainment of graduate degree are most likely to be married with 100.0% of them married at childbirth, while women with the educational attainment of college or associate's degree are least likely to be married with 53.8% of them unmarried at childbirth.
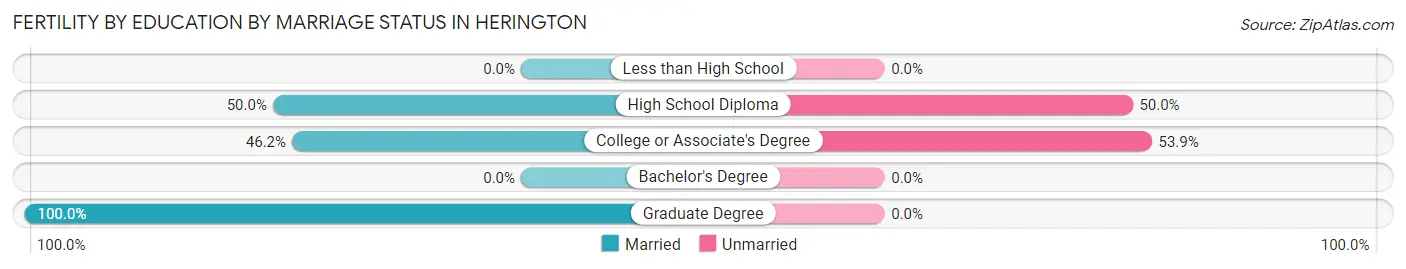
| Educational Attainment | Married | Unmarried |
| Less than High School | 0 (0.0%) | 0 (0.0%) |
| High School Diploma | 6 (50.0%) | 6 (50.0%) |
| College or Associate's Degree | 6 (46.2%) | 7 (53.8%) |
| Bachelor's Degree | 0 (0.0%) | 0 (0.0%) |
| Graduate Degree | 7 (100.0%) | 0 (0.0%) |
| Total | 19 (59.4%) | 13 (40.6%) |
Employment Characteristics in Herington
Employment by Class of Employer in Herington
Among the 987 employed individuals in Herington, private company employees (578 | 58.6%), local government employees (149 | 15.1%), and federal government employees (88 | 8.9%) make up the most common classes of employment.
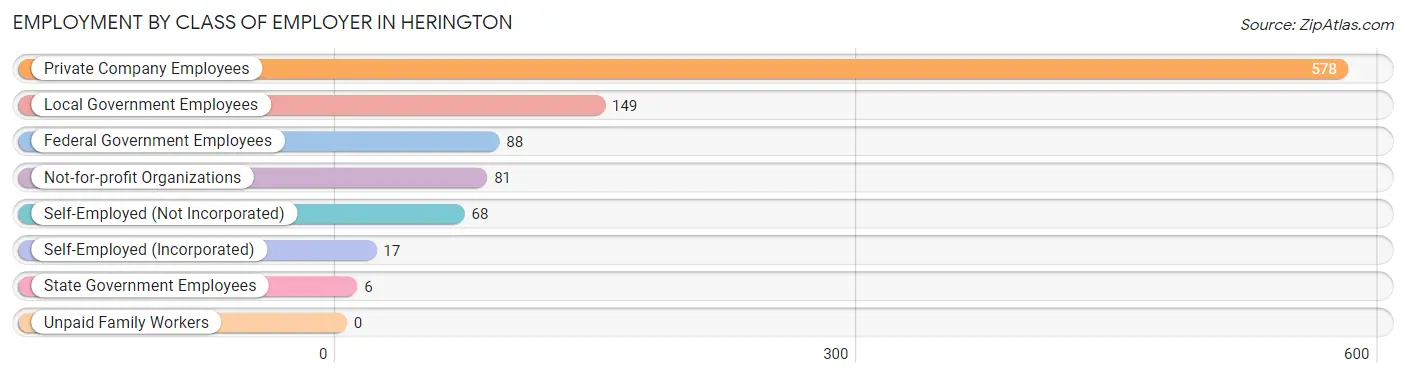
| Employer Class | # Employees | % Employees |
| Private Company Employees | 578 | 58.6% |
| Self-Employed (Incorporated) | 17 | 1.7% |
| Self-Employed (Not Incorporated) | 68 | 6.9% |
| Not-for-profit Organizations | 81 | 8.2% |
| Local Government Employees | 149 | 15.1% |
| State Government Employees | 6 | 0.6% |
| Federal Government Employees | 88 | 8.9% |
| Unpaid Family Workers | 0 | 0.0% |
| Total | 987 | 100.0% |
Employment Status by Age in Herington
According to the labor force statistics for Herington, out of the total population over 16 years of age (1,796), 57.2% or 1,027 individuals are in the labor force, with 0.6% or 6 of them unemployed. The age group with the highest labor force participation rate is 20 to 24 years, with 94.7% or 107 individuals in the labor force. Within the labor force, the 25 to 29 years age range has the highest percentage of unemployed individuals, with 8.0% or 8 of them being unemployed.
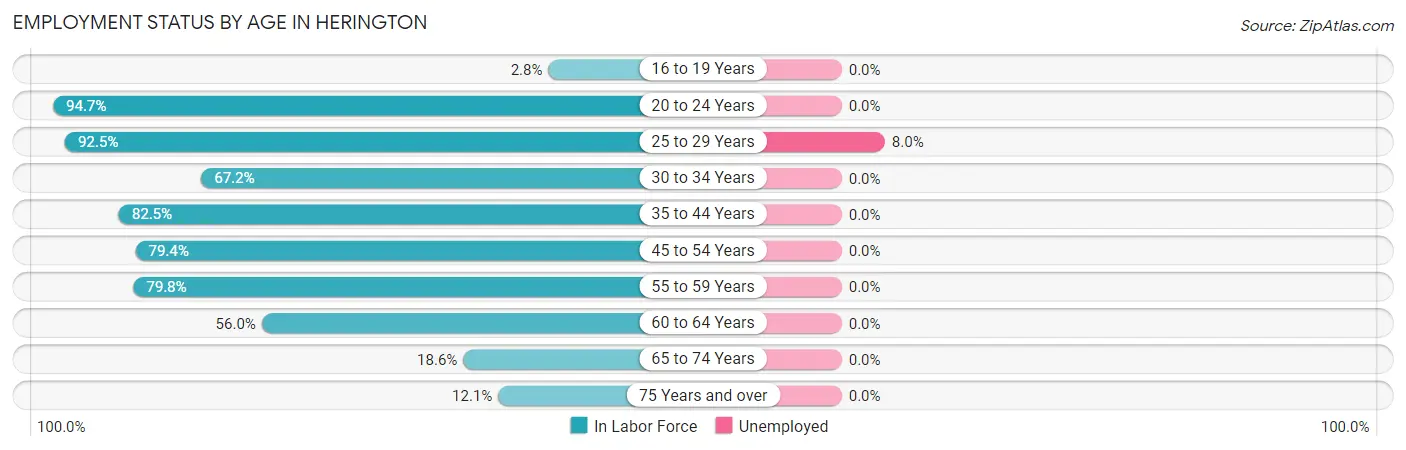
| Age Bracket | In Labor Force | Unemployed |
| 16 to 19 Years | 2 (2.8%) | 0 (0.0%) |
| 20 to 24 Years | 107 (94.7%) | 0 (0.0%) |
| 25 to 29 Years | 98 (92.5%) | 8 (8.0%) |
| 30 to 34 Years | 84 (67.2%) | 0 (0.0%) |
| 35 to 44 Years | 307 (82.5%) | 0 (0.0%) |
| 45 to 54 Years | 154 (79.4%) | 0 (0.0%) |
| 55 to 59 Years | 91 (79.8%) | 0 (0.0%) |
| 60 to 64 Years | 94 (56.0%) | 0 (0.0%) |
| 65 to 74 Years | 73 (18.6%) | 0 (0.0%) |
| 75 Years and over | 17 (12.1%) | 0 (0.0%) |
| Total | 1,027 (57.2%) | 6 (0.6%) |
Employment Status by Educational Attainment in Herington
According to labor force statistics for Herington, 76.7% of individuals (828) out of the total population between 25 and 64 years of age (1,079) are in the labor force, with 0.8% or 7 of them being unemployed. The group with the highest labor force participation rate are those with the educational attainment of bachelor's degree or higher, with 87.8% or 215 individuals in the labor force. Within the labor force, individuals with high school diploma education have the highest percentage of unemployment, with 2.9% or 6 of them being unemployed.
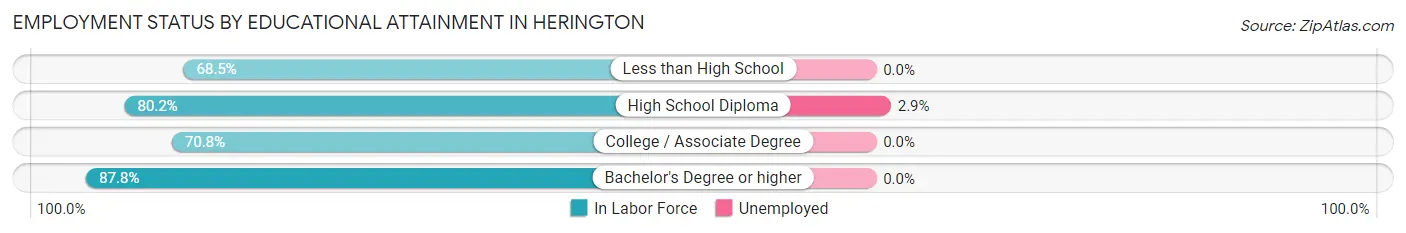
| Educational Attainment | In Labor Force | Unemployed |
| Less than High School | 50 (68.5%) | 0 (0.0%) |
| High School Diploma | 207 (80.2%) | 7 (2.9%) |
| College / Associate Degree | 356 (70.8%) | 0 (0.0%) |
| Bachelor's Degree or higher | 215 (87.8%) | 0 (0.0%) |
| Total | 828 (76.7%) | 9 (0.8%) |
Employment Occupations by Sex in Herington
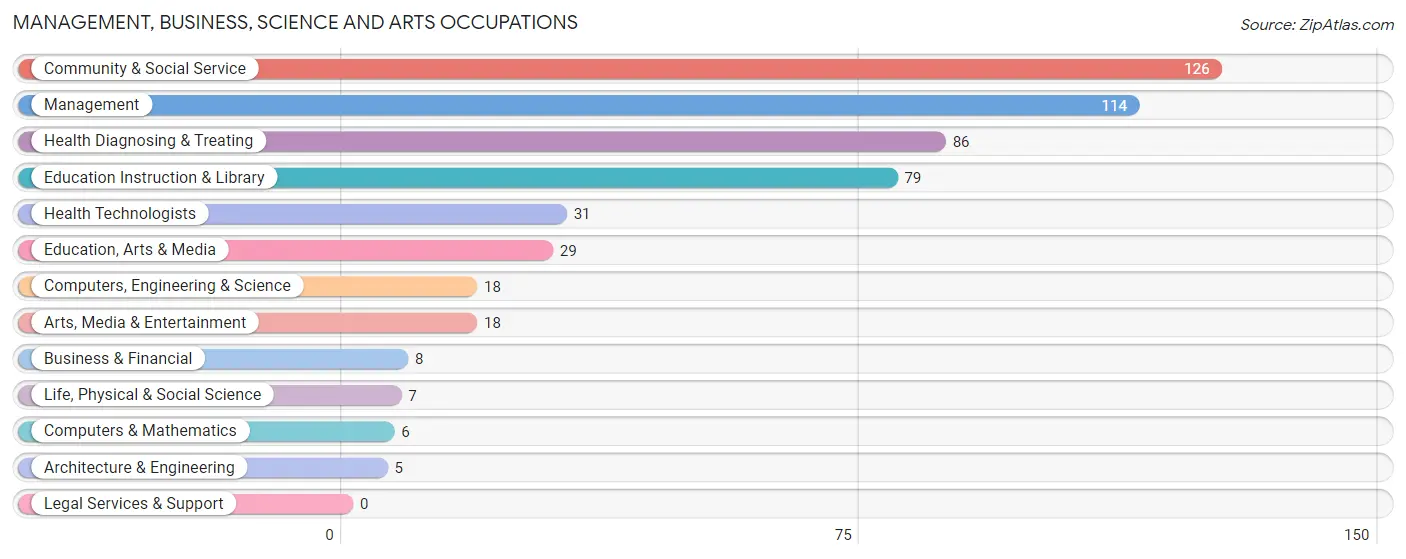
Management, Business, Science and Arts Occupations
The most common Management, Business, Science and Arts occupations in Herington are Community & Social Service (126 | 12.7%), Management (114 | 11.5%), Health Diagnosing & Treating (86 | 8.7%), Education Instruction & Library (79 | 8.0%), and Health Technologists (31 | 3.1%).
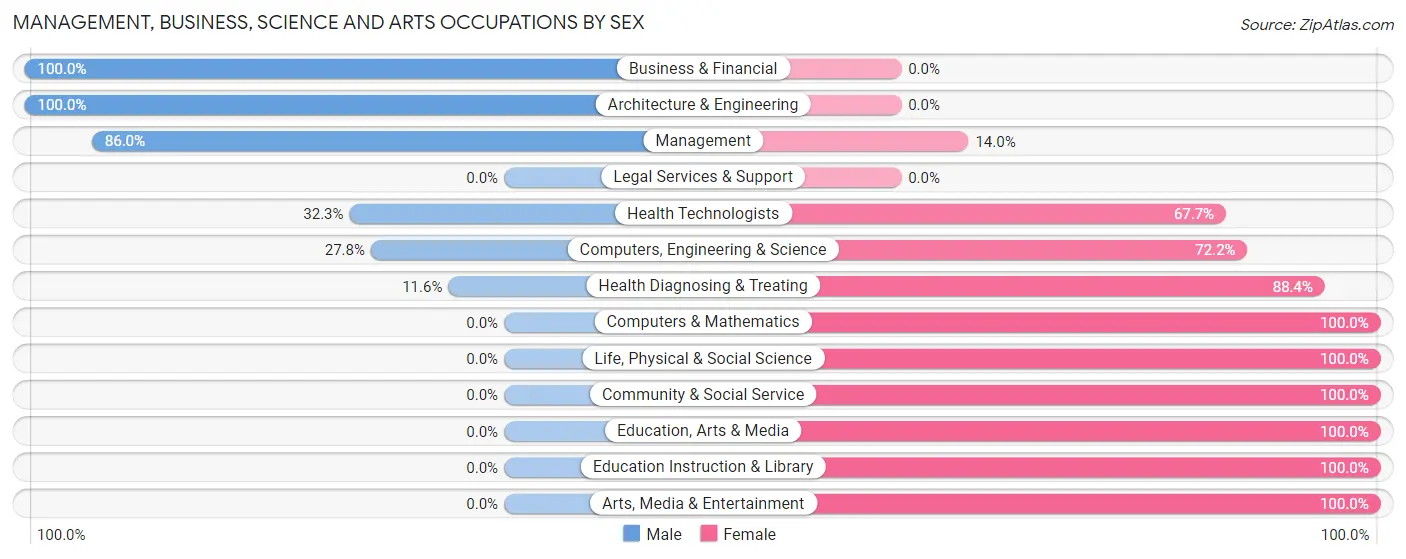
Management, Business, Science and Arts Occupations by Sex
Within the Management, Business, Science and Arts occupations in Herington, the most male-oriented occupations are Business & Financial (100.0%), Architecture & Engineering (100.0%), and Management (86.0%), while the most female-oriented occupations are Computers & Mathematics (100.0%), Life, Physical & Social Science (100.0%), and Community & Social Service (100.0%).
| Occupation | Male | Female |
| Management | 98 (86.0%) | 16 (14.0%) |
| Business & Financial | 8 (100.0%) | 0 (0.0%) |
| Computers, Engineering & Science | 5 (27.8%) | 13 (72.2%) |
| Computers & Mathematics | 0 (0.0%) | 6 (100.0%) |
| Architecture & Engineering | 5 (100.0%) | 0 (0.0%) |
| Life, Physical & Social Science | 0 (0.0%) | 7 (100.0%) |
| Community & Social Service | 0 (0.0%) | 126 (100.0%) |
| Education, Arts & Media | 0 (0.0%) | 29 (100.0%) |
| Legal Services & Support | 0 (0.0%) | 0 (0.0%) |
| Education Instruction & Library | 0 (0.0%) | 79 (100.0%) |
| Arts, Media & Entertainment | 0 (0.0%) | 18 (100.0%) |
| Health Diagnosing & Treating | 10 (11.6%) | 76 (88.4%) |
| Health Technologists | 10 (32.3%) | 21 (67.7%) |
| Total (Category) | 121 (34.4%) | 231 (65.6%) |
| Total (Overall) | 586 (59.2%) | 404 (40.8%) |
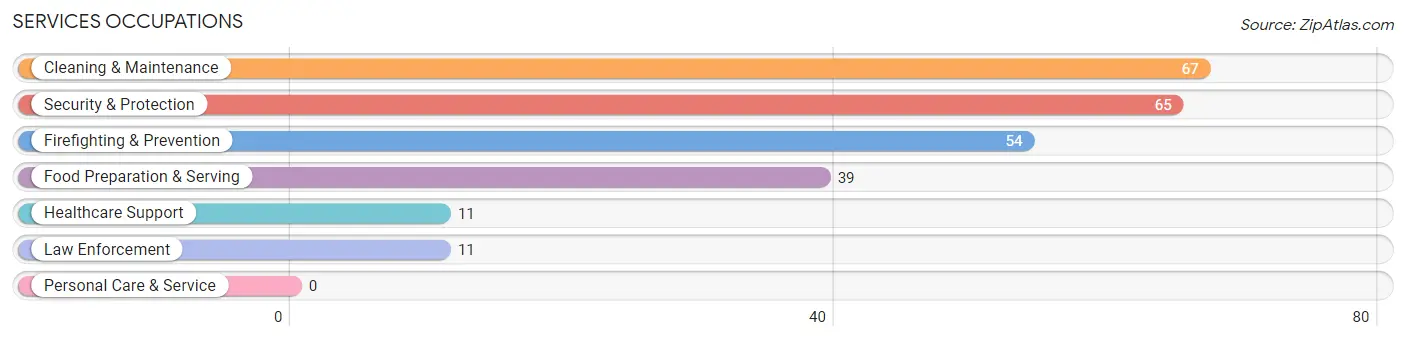
Services Occupations
The most common Services occupations in Herington are Cleaning & Maintenance (67 | 6.8%), Security & Protection (65 | 6.6%), Firefighting & Prevention (54 | 5.4%), Food Preparation & Serving (39 | 3.9%), and Healthcare Support (11 | 1.1%).
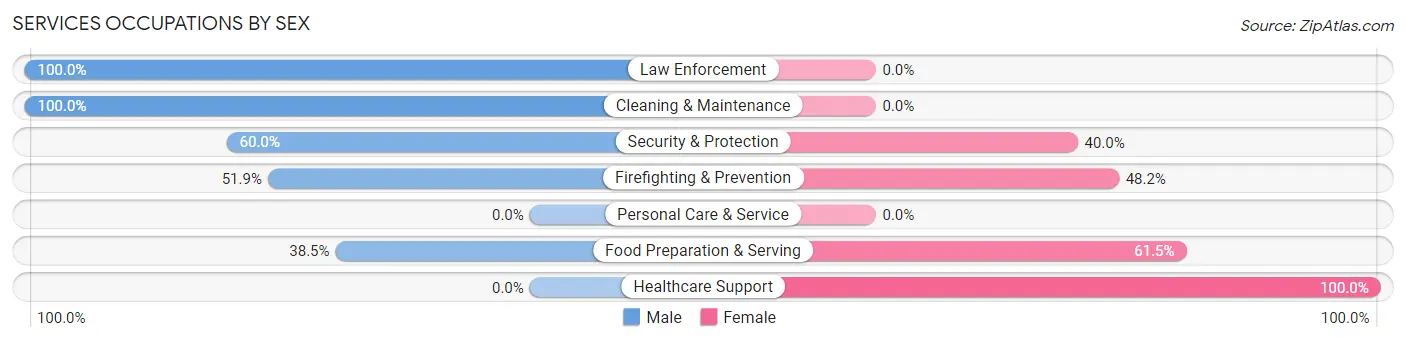
Services Occupations by Sex
Within the Services occupations in Herington, the most male-oriented occupations are Law Enforcement (100.0%), Cleaning & Maintenance (100.0%), and Security & Protection (60.0%), while the most female-oriented occupations are Healthcare Support (100.0%), Food Preparation & Serving (61.5%), and Firefighting & Prevention (48.1%).
| Occupation | Male | Female |
| Healthcare Support | 0 (0.0%) | 11 (100.0%) |
| Security & Protection | 39 (60.0%) | 26 (40.0%) |
| Firefighting & Prevention | 28 (51.8%) | 26 (48.1%) |
| Law Enforcement | 11 (100.0%) | 0 (0.0%) |
| Food Preparation & Serving | 15 (38.5%) | 24 (61.5%) |
| Cleaning & Maintenance | 67 (100.0%) | 0 (0.0%) |
| Personal Care & Service | 0 (0.0%) | 0 (0.0%) |
| Total (Category) | 121 (66.5%) | 61 (33.5%) |
| Total (Overall) | 586 (59.2%) | 404 (40.8%) |
Sales and Office Occupations
The most common Sales and Office occupations in Herington are Office & Administration (132 | 13.3%), and Sales & Related (57 | 5.8%).
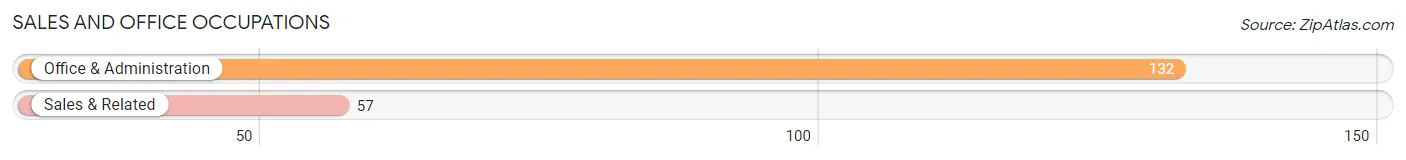
Sales and Office Occupations by Sex
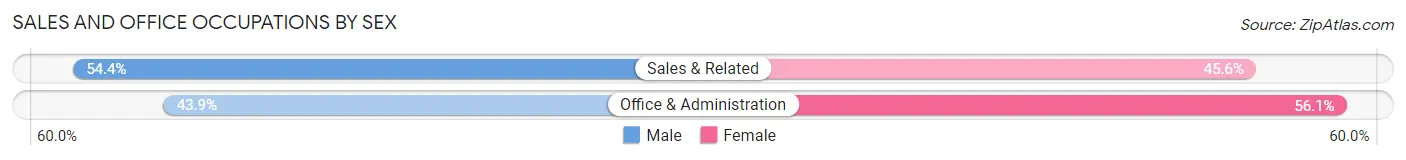
| Occupation | Male | Female |
| Sales & Related | 31 (54.4%) | 26 (45.6%) |
| Office & Administration | 58 (43.9%) | 74 (56.1%) |
| Total (Category) | 89 (47.1%) | 100 (52.9%) |
| Total (Overall) | 586 (59.2%) | 404 (40.8%) |
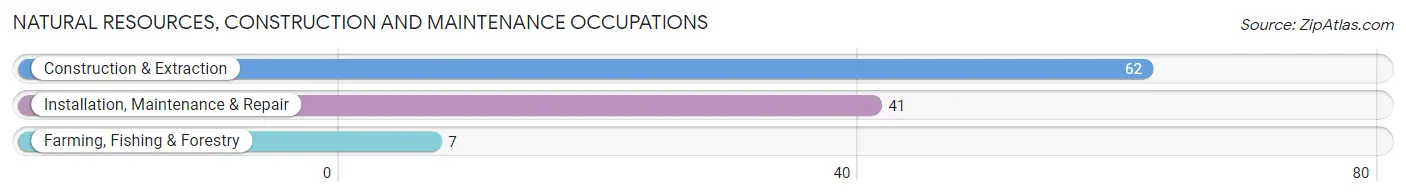
Natural Resources, Construction and Maintenance Occupations
The most common Natural Resources, Construction and Maintenance occupations in Herington are Construction & Extraction (62 | 6.3%), Installation, Maintenance & Repair (41 | 4.1%), and Farming, Fishing & Forestry (7 | 0.7%).
Natural Resources, Construction and Maintenance Occupations by Sex
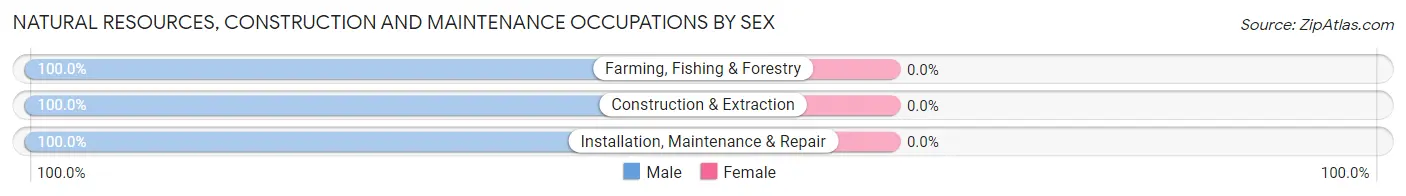
| Occupation | Male | Female |
| Farming, Fishing & Forestry | 7 (100.0%) | 0 (0.0%) |
| Construction & Extraction | 62 (100.0%) | 0 (0.0%) |
| Installation, Maintenance & Repair | 41 (100.0%) | 0 (0.0%) |
| Total (Category) | 110 (100.0%) | 0 (0.0%) |
| Total (Overall) | 586 (59.2%) | 404 (40.8%) |
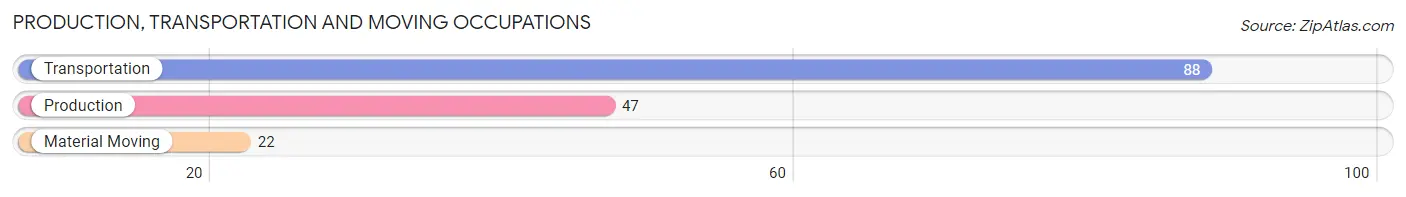
Production, Transportation and Moving Occupations
The most common Production, Transportation and Moving occupations in Herington are Transportation (88 | 8.9%), Production (47 | 4.8%), and Material Moving (22 | 2.2%).
Production, Transportation and Moving Occupations by Sex
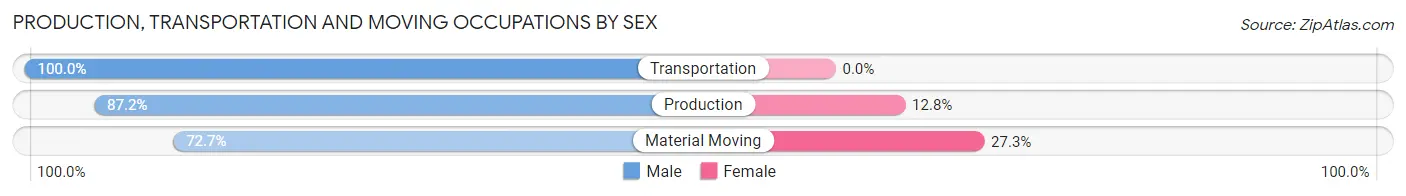
| Occupation | Male | Female |
| Production | 41 (87.2%) | 6 (12.8%) |
| Transportation | 88 (100.0%) | 0 (0.0%) |
| Material Moving | 16 (72.7%) | 6 (27.3%) |
| Total (Category) | 145 (92.4%) | 12 (7.6%) |
| Total (Overall) | 586 (59.2%) | 404 (40.8%) |
Employment Industries by Sex in Herington
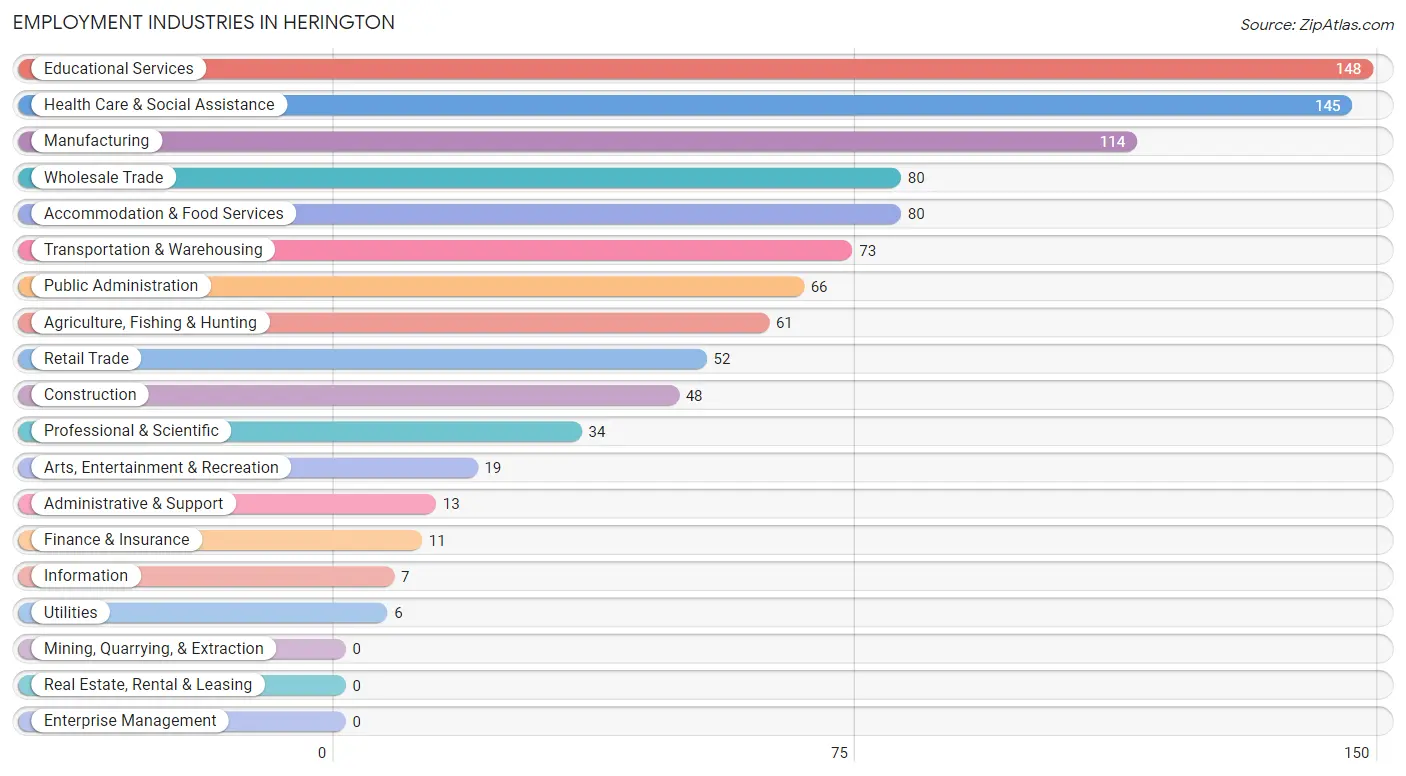
Employment Industries in Herington
The major employment industries in Herington include Educational Services (148 | 14.9%), Health Care & Social Assistance (145 | 14.6%), Manufacturing (114 | 11.5%), Wholesale Trade (80 | 8.1%), and Accommodation & Food Services (80 | 8.1%).
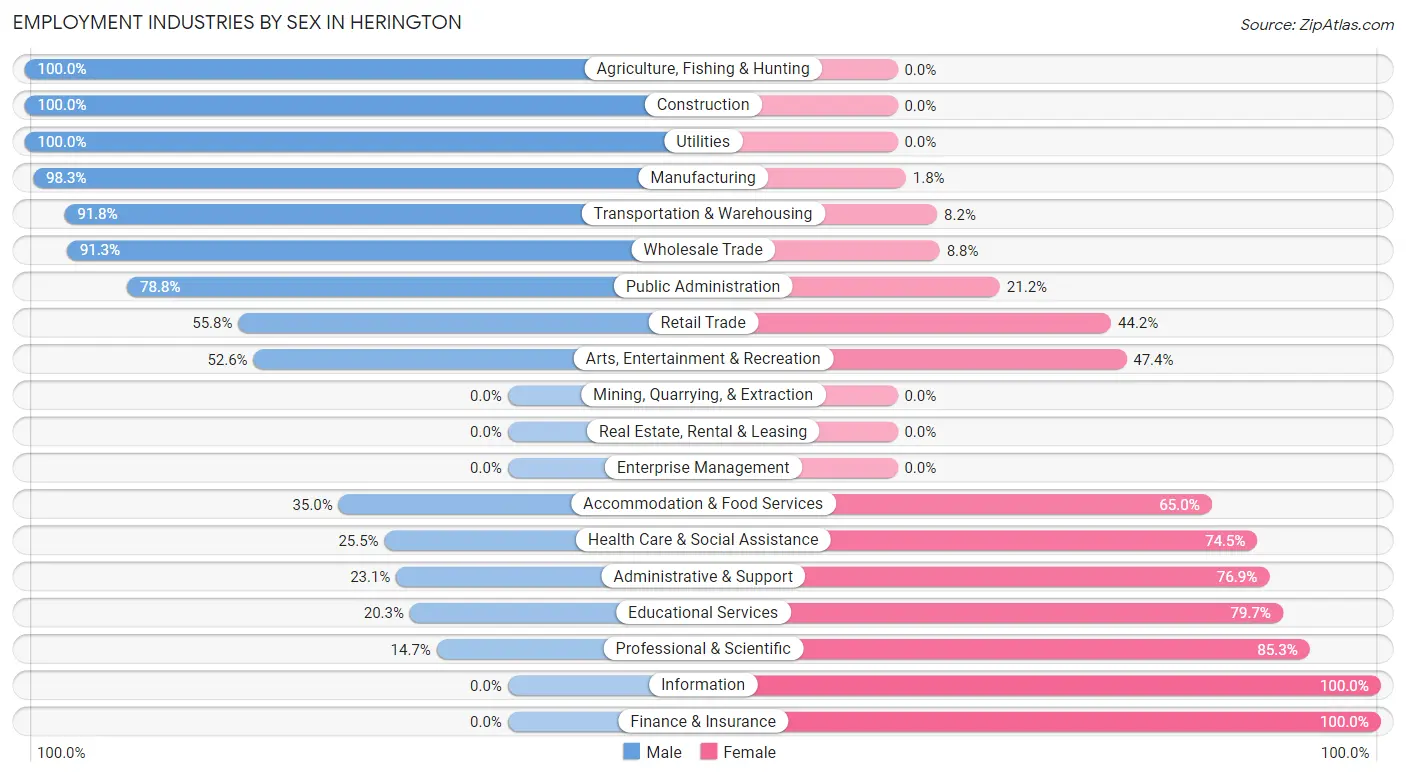
Employment Industries by Sex in Herington
The Herington industries that see more men than women are Agriculture, Fishing & Hunting (100.0%), Construction (100.0%), and Utilities (100.0%), whereas the industries that tend to have a higher number of women are Information (100.0%), Finance & Insurance (100.0%), and Professional & Scientific (85.3%).
| Industry | Male | Female |
| Agriculture, Fishing & Hunting | 61 (100.0%) | 0 (0.0%) |
| Mining, Quarrying, & Extraction | 0 (0.0%) | 0 (0.0%) |
| Construction | 48 (100.0%) | 0 (0.0%) |
| Manufacturing | 112 (98.3%) | 2 (1.8%) |
| Wholesale Trade | 73 (91.2%) | 7 (8.7%) |
| Retail Trade | 29 (55.8%) | 23 (44.2%) |
| Transportation & Warehousing | 67 (91.8%) | 6 (8.2%) |
| Utilities | 6 (100.0%) | 0 (0.0%) |
| Information | 0 (0.0%) | 7 (100.0%) |
| Finance & Insurance | 0 (0.0%) | 11 (100.0%) |
| Real Estate, Rental & Leasing | 0 (0.0%) | 0 (0.0%) |
| Professional & Scientific | 5 (14.7%) | 29 (85.3%) |
| Enterprise Management | 0 (0.0%) | 0 (0.0%) |
| Administrative & Support | 3 (23.1%) | 10 (76.9%) |
| Educational Services | 30 (20.3%) | 118 (79.7%) |
| Health Care & Social Assistance | 37 (25.5%) | 108 (74.5%) |
| Arts, Entertainment & Recreation | 10 (52.6%) | 9 (47.4%) |
| Accommodation & Food Services | 28 (35.0%) | 52 (65.0%) |
| Public Administration | 52 (78.8%) | 14 (21.2%) |
| Total | 586 (59.2%) | 404 (40.8%) |
Education in Herington
School Enrollment in Herington
The most common levels of schooling among the 297 students in Herington are high school (121 | 40.7%), nursery / preschool (40 | 13.5%), and middle school (38 | 12.8%).
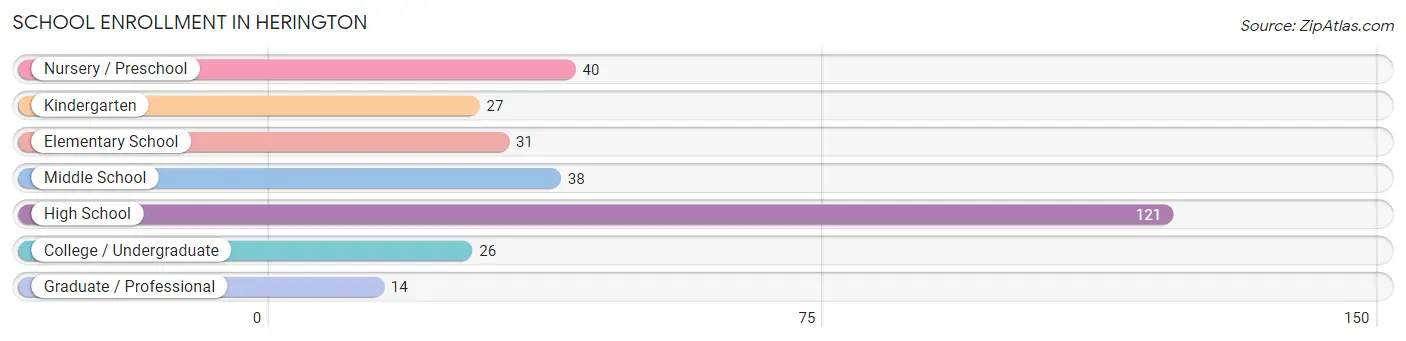
| School Level | # Students | % Students |
| Nursery / Preschool | 40 | 13.5% |
| Kindergarten | 27 | 9.1% |
| Elementary School | 31 | 10.4% |
| Middle School | 38 | 12.8% |
| High School | 121 | 40.7% |
| College / Undergraduate | 26 | 8.7% |
| Graduate / Professional | 14 | 4.7% |
| Total | 297 | 100.0% |
School Enrollment by Age by Funding Source in Herington
Out of a total of 297 students who are enrolled in schools in Herington, 29 (9.8%) attend a private institution, while the remaining 268 (90.2%) are enrolled in public schools. The age group of 35 years and over has the highest likelihood of being enrolled in private schools, with 11 (61.1% in the age bracket) enrolled. Conversely, the age group of 5 to 9 year old has the lowest likelihood of being enrolled in a private school, with 51 (100.0% in the age bracket) attending a public institution.
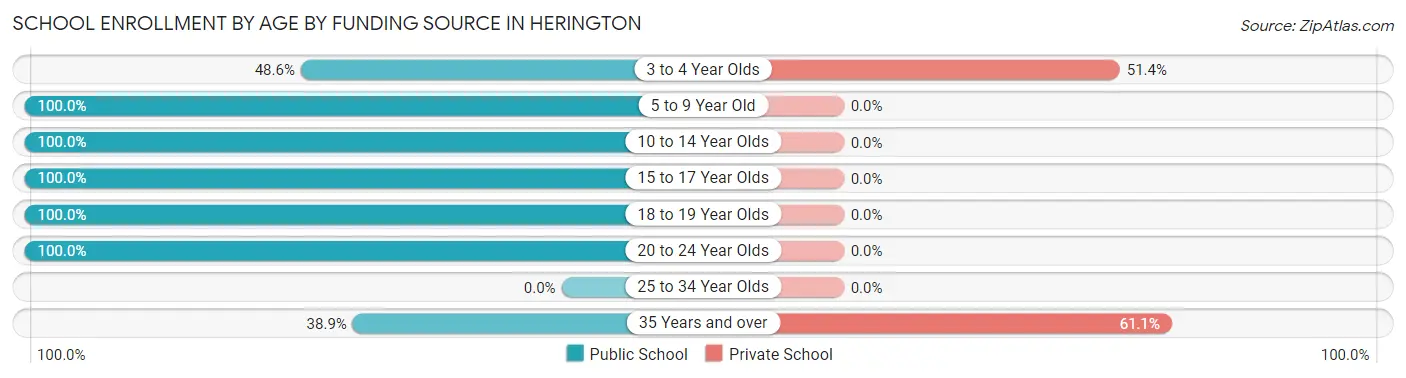
| Age Bracket | Public School | Private School |
| 3 to 4 Year Olds | 17 (48.6%) | 18 (51.4%) |
| 5 to 9 Year Old | 51 (100.0%) | 0 (0.0%) |
| 10 to 14 Year Olds | 108 (100.0%) | 0 (0.0%) |
| 15 to 17 Year Olds | 42 (100.0%) | 0 (0.0%) |
| 18 to 19 Year Olds | 36 (100.0%) | 0 (0.0%) |
| 20 to 24 Year Olds | 7 (100.0%) | 0 (0.0%) |
| 25 to 34 Year Olds | 0 (0.0%) | 0 (0.0%) |
| 35 Years and over | 7 (38.9%) | 11 (61.1%) |
| Total | 268 (90.2%) | 29 (9.8%) |
Educational Attainment by Field of Study in Herington
Education (91 | 23.9%), arts & humanities (83 | 21.8%), business (67 | 17.6%), psychology (39 | 10.2%), and multidisciplinary studies (27 | 7.1%) are the most common fields of study among 381 individuals in Herington who have obtained a bachelor's degree or higher.
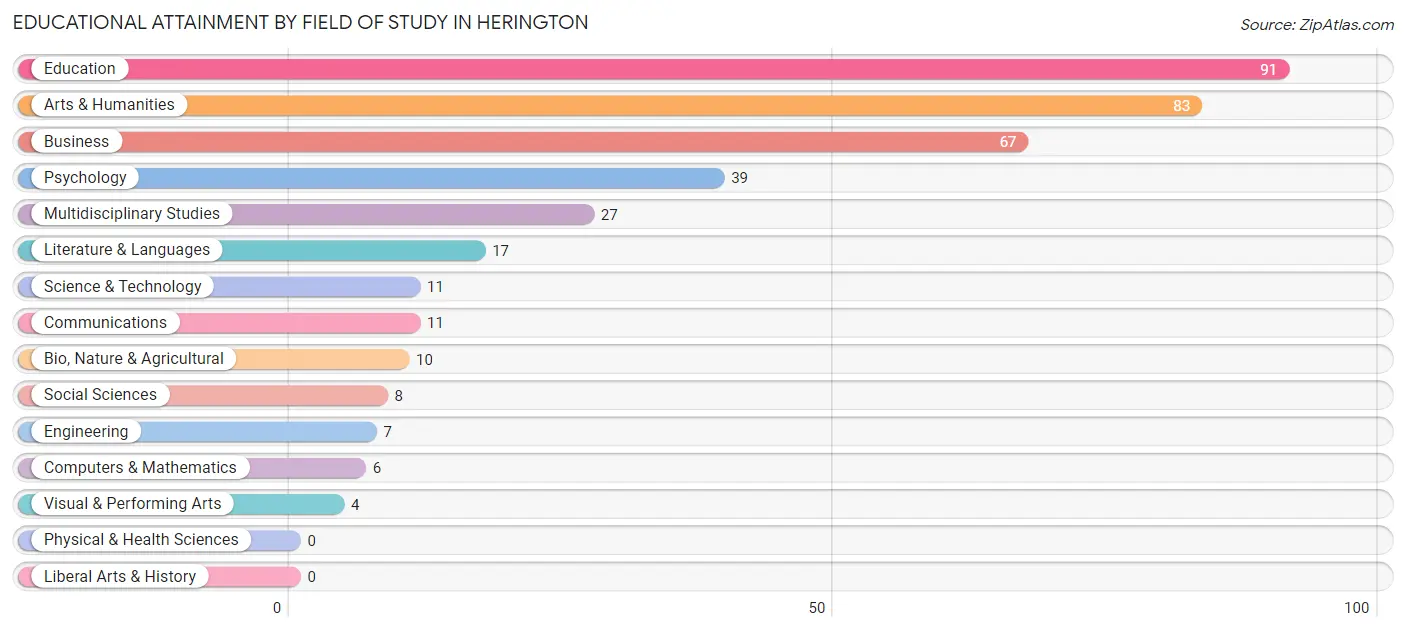
| Field of Study | # Graduates | % Graduates |
| Computers & Mathematics | 6 | 1.6% |
| Bio, Nature & Agricultural | 10 | 2.6% |
| Physical & Health Sciences | 0 | 0.0% |
| Psychology | 39 | 10.2% |
| Social Sciences | 8 | 2.1% |
| Engineering | 7 | 1.8% |
| Multidisciplinary Studies | 27 | 7.1% |
| Science & Technology | 11 | 2.9% |
| Business | 67 | 17.6% |
| Education | 91 | 23.9% |
| Literature & Languages | 17 | 4.5% |
| Liberal Arts & History | 0 | 0.0% |
| Visual & Performing Arts | 4 | 1.1% |
| Communications | 11 | 2.9% |
| Arts & Humanities | 83 | 21.8% |
| Total | 381 | 100.0% |
Transportation & Commute in Herington
Vehicle Availability by Sex in Herington
The most prevalent vehicle ownership categories in Herington are males with 2 vehicles (212, accounting for 36.4%) and females with 2 vehicles (136, making up 52.5%).
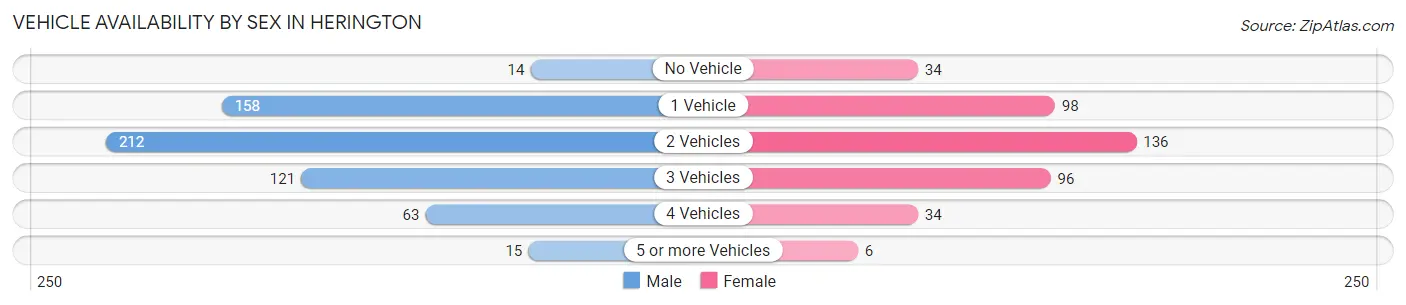
| Vehicles Available | Male | Female |
| No Vehicle | 14 (2.4%) | 34 (8.4%) |
| 1 Vehicle | 158 (27.1%) | 98 (24.3%) |
| 2 Vehicles | 212 (36.4%) | 136 (33.7%) |
| 3 Vehicles | 121 (20.7%) | 96 (23.8%) |
| 4 Vehicles | 63 (10.8%) | 34 (8.4%) |
| 5 or more Vehicles | 15 (2.6%) | 6 (1.5%) |
| Total | 583 (100.0%) | 404 (100.0%) |
Commute Time in Herington
The most frequently occuring commute durations in Herington are 30 to 34 minutes (173 commuters, 17.9%), less than 5 minutes (141 commuters, 14.6%), and 5 to 9 minutes (129 commuters, 13.4%).
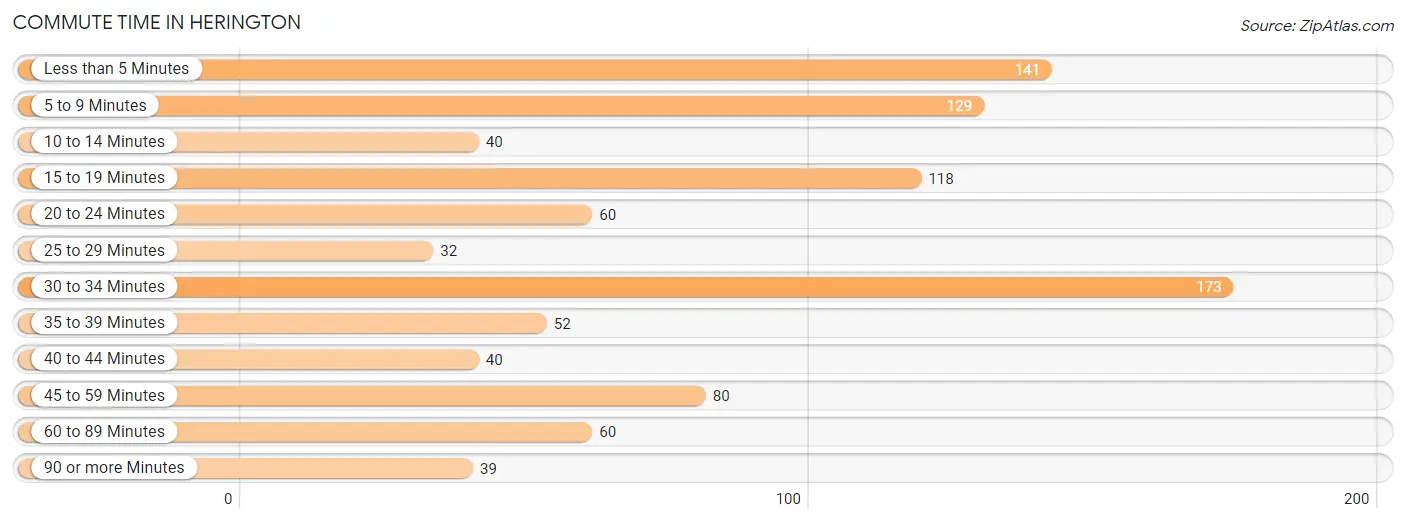
| Commute Time | # Commuters | % Commuters |
| Less than 5 Minutes | 141 | 14.6% |
| 5 to 9 Minutes | 129 | 13.4% |
| 10 to 14 Minutes | 40 | 4.2% |
| 15 to 19 Minutes | 118 | 12.2% |
| 20 to 24 Minutes | 60 | 6.2% |
| 25 to 29 Minutes | 32 | 3.3% |
| 30 to 34 Minutes | 173 | 17.9% |
| 35 to 39 Minutes | 52 | 5.4% |
| 40 to 44 Minutes | 40 | 4.2% |
| 45 to 59 Minutes | 80 | 8.3% |
| 60 to 89 Minutes | 60 | 6.2% |
| 90 or more Minutes | 39 | 4.1% |
Commute Time by Sex in Herington
The most common commute times in Herington are less than 5 minutes (93 commuters, 16.0%) for males and 30 to 34 minutes (124 commuters, 32.6%) for females.
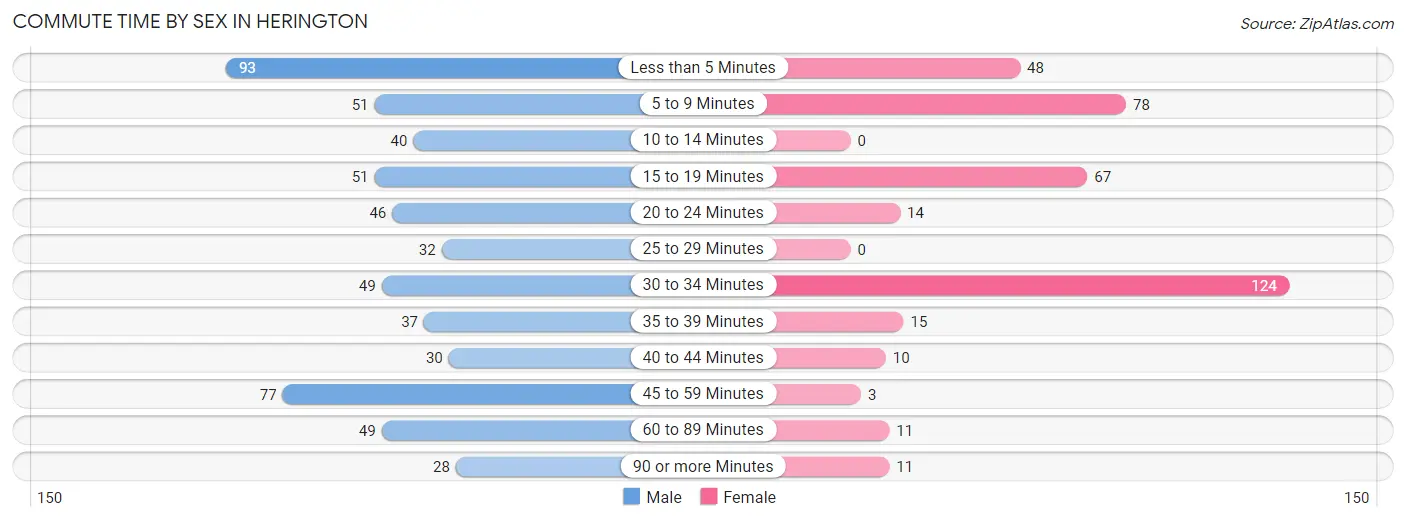
| Commute Time | Male | Female |
| Less than 5 Minutes | 93 (16.0%) | 48 (12.6%) |
| 5 to 9 Minutes | 51 (8.7%) | 78 (20.5%) |
| 10 to 14 Minutes | 40 (6.9%) | 0 (0.0%) |
| 15 to 19 Minutes | 51 (8.7%) | 67 (17.6%) |
| 20 to 24 Minutes | 46 (7.9%) | 14 (3.7%) |
| 25 to 29 Minutes | 32 (5.5%) | 0 (0.0%) |
| 30 to 34 Minutes | 49 (8.4%) | 124 (32.6%) |
| 35 to 39 Minutes | 37 (6.4%) | 15 (3.9%) |
| 40 to 44 Minutes | 30 (5.1%) | 10 (2.6%) |
| 45 to 59 Minutes | 77 (13.2%) | 3 (0.8%) |
| 60 to 89 Minutes | 49 (8.4%) | 11 (2.9%) |
| 90 or more Minutes | 28 (4.8%) | 11 (2.9%) |
Time of Departure to Work by Sex in Herington
The most frequent times of departure to work in Herington are 12:00 AM to 4:59 AM (168, 28.8%) for males and 7:00 AM to 7:29 AM (89, 23.4%) for females.
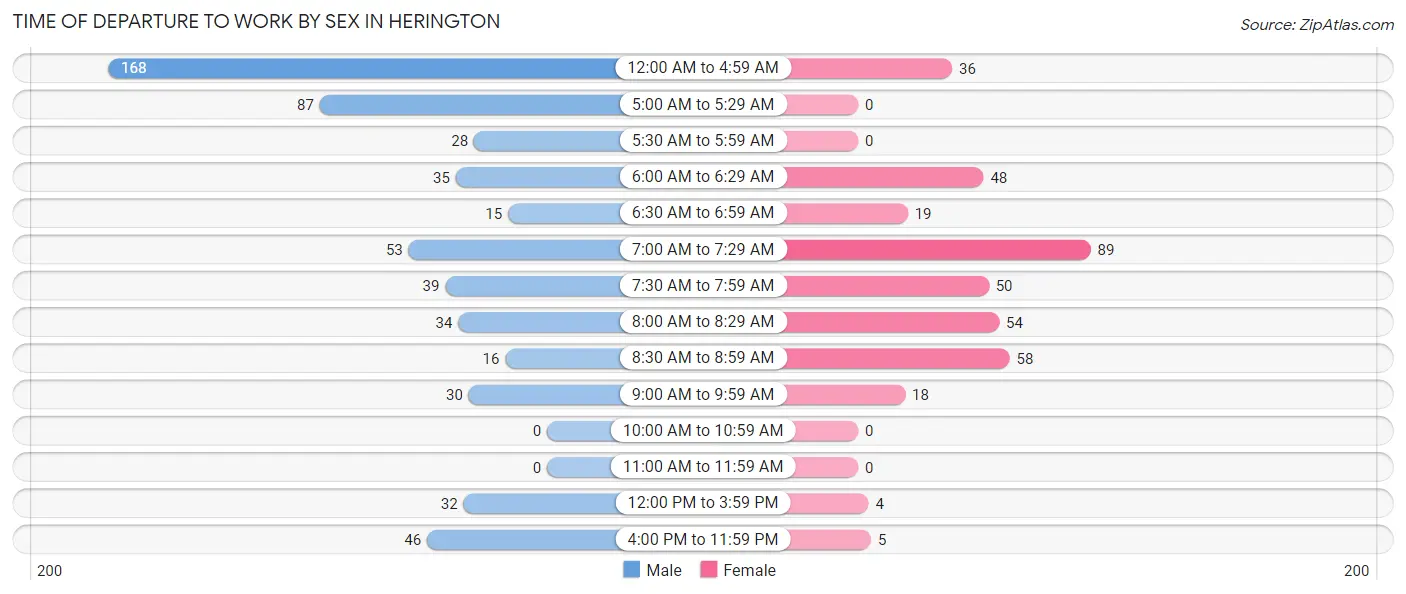
| Time of Departure | Male | Female |
| 12:00 AM to 4:59 AM | 168 (28.8%) | 36 (9.5%) |
| 5:00 AM to 5:29 AM | 87 (14.9%) | 0 (0.0%) |
| 5:30 AM to 5:59 AM | 28 (4.8%) | 0 (0.0%) |
| 6:00 AM to 6:29 AM | 35 (6.0%) | 48 (12.6%) |
| 6:30 AM to 6:59 AM | 15 (2.6%) | 19 (5.0%) |
| 7:00 AM to 7:29 AM | 53 (9.1%) | 89 (23.4%) |
| 7:30 AM to 7:59 AM | 39 (6.7%) | 50 (13.1%) |
| 8:00 AM to 8:29 AM | 34 (5.8%) | 54 (14.2%) |
| 8:30 AM to 8:59 AM | 16 (2.7%) | 58 (15.2%) |
| 9:00 AM to 9:59 AM | 30 (5.1%) | 18 (4.7%) |
| 10:00 AM to 10:59 AM | 0 (0.0%) | 0 (0.0%) |
| 11:00 AM to 11:59 AM | 0 (0.0%) | 0 (0.0%) |
| 12:00 PM to 3:59 PM | 32 (5.5%) | 4 (1.1%) |
| 4:00 PM to 11:59 PM | 46 (7.9%) | 5 (1.3%) |
| Total | 583 (100.0%) | 381 (100.0%) |
Housing Occupancy in Herington
Occupancy by Ownership in Herington
Of the total 1,086 dwellings in Herington, owner-occupied units account for 723 (66.6%), while renter-occupied units make up 363 (33.4%).
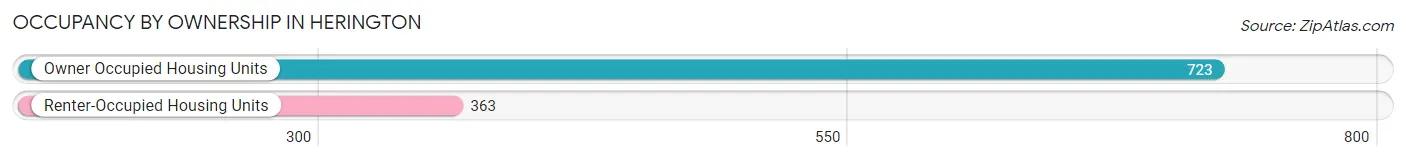
| Occupancy | # Housing Units | % Housing Units |
| Owner Occupied Housing Units | 723 | 66.6% |
| Renter-Occupied Housing Units | 363 | 33.4% |
| Total Occupied Housing Units | 1,086 | 100.0% |
Occupancy by Household Size in Herington
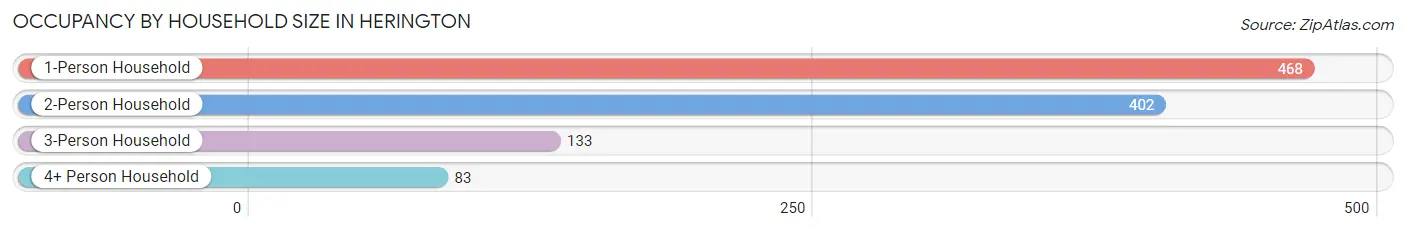
| Household Size | # Housing Units | % Housing Units |
| 1-Person Household | 468 | 43.1% |
| 2-Person Household | 402 | 37.0% |
| 3-Person Household | 133 | 12.2% |
| 4+ Person Household | 83 | 7.6% |
| Total Housing Units | 1,086 | 100.0% |
Occupancy by Ownership by Household Size in Herington
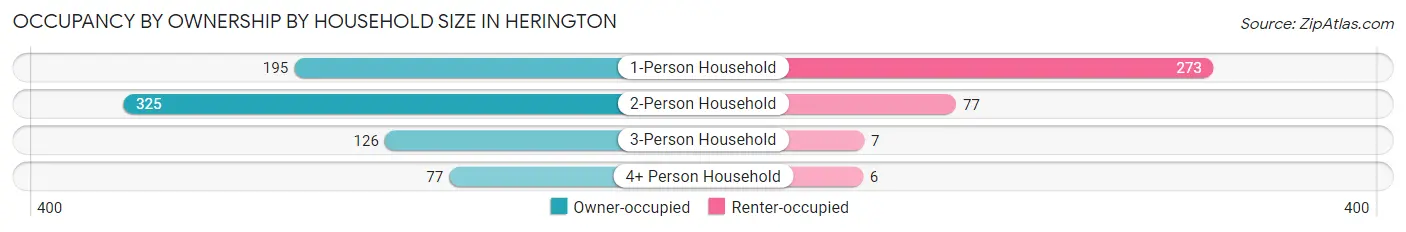
| Household Size | Owner-occupied | Renter-occupied |
| 1-Person Household | 195 (41.7%) | 273 (58.3%) |
| 2-Person Household | 325 (80.8%) | 77 (19.2%) |
| 3-Person Household | 126 (94.7%) | 7 (5.3%) |
| 4+ Person Household | 77 (92.8%) | 6 (7.2%) |
| Total Housing Units | 723 (66.6%) | 363 (33.4%) |
Occupancy by Educational Attainment in Herington
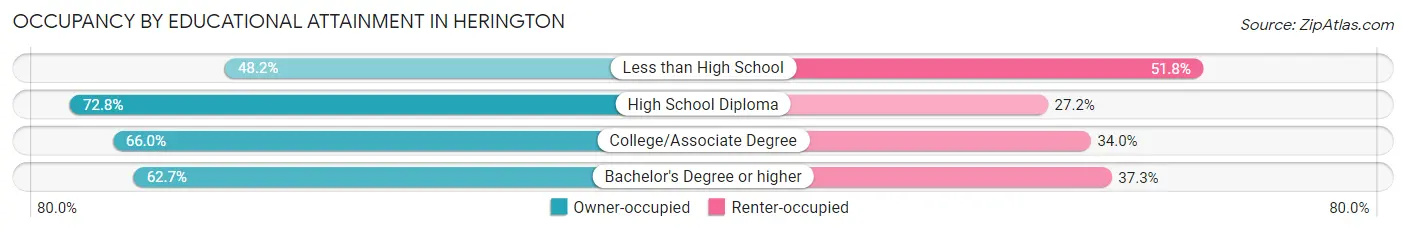
| Household Size | Owner-occupied | Renter-occupied |
| Less than High School | 27 (48.2%) | 29 (51.8%) |
| High School Diploma | 265 (72.8%) | 99 (27.2%) |
| College/Associate Degree | 268 (66.0%) | 138 (34.0%) |
| Bachelor's Degree or higher | 163 (62.7%) | 97 (37.3%) |
Occupancy by Age of Householder in Herington
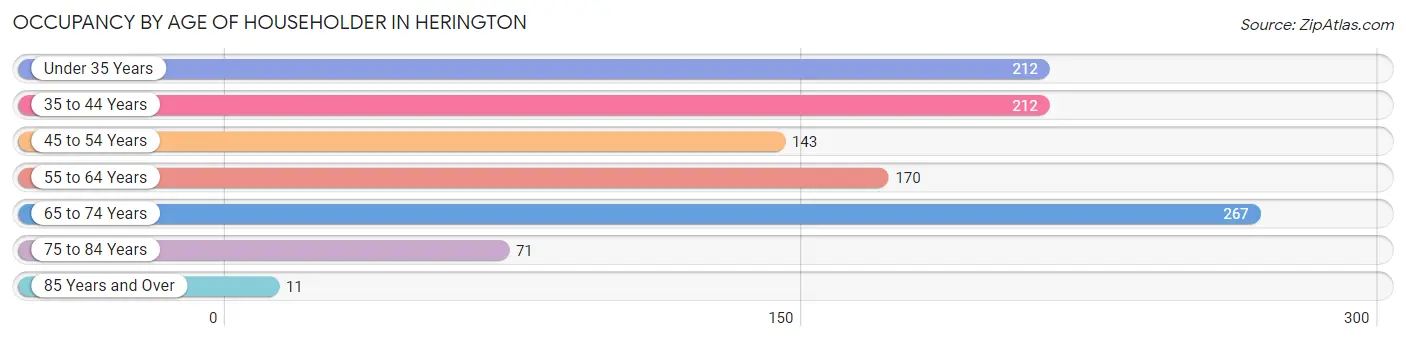
| Age Bracket | # Households | % Households |
| Under 35 Years | 212 | 19.5% |
| 35 to 44 Years | 212 | 19.5% |
| 45 to 54 Years | 143 | 13.2% |
| 55 to 64 Years | 170 | 15.7% |
| 65 to 74 Years | 267 | 24.6% |
| 75 to 84 Years | 71 | 6.5% |
| 85 Years and Over | 11 | 1.0% |
| Total | 1,086 | 100.0% |
Housing Finances in Herington
Median Income by Occupancy in Herington
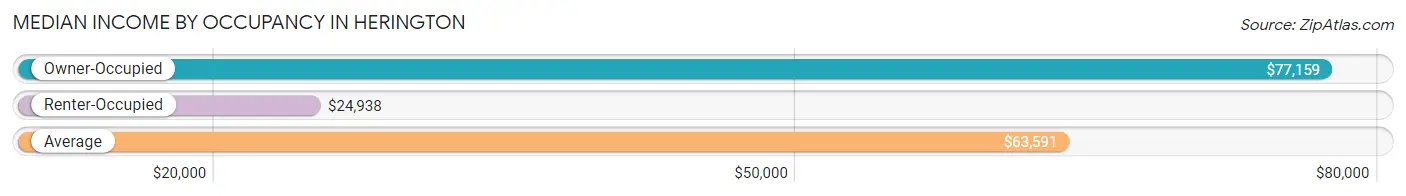
| Occupancy Type | # Households | Median Income |
| Owner-Occupied | 723 (66.6%) | $77,159 |
| Renter-Occupied | 363 (33.4%) | $24,938 |
| Average | 1,086 (100.0%) | $63,591 |
Occupancy by Householder Income Bracket in Herington
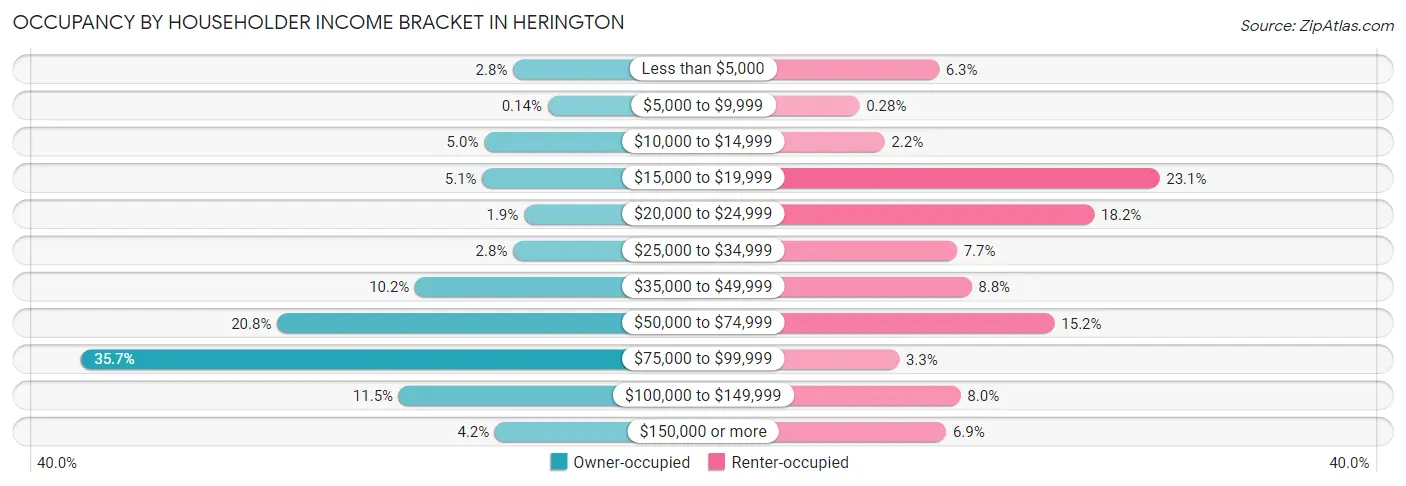
| Income Bracket | Owner-occupied | Renter-occupied |
| Less than $5,000 | 20 (2.8%) | 23 (6.3%) |
| $5,000 to $9,999 | 1 (0.1%) | 1 (0.3%) |
| $10,000 to $14,999 | 36 (5.0%) | 8 (2.2%) |
| $15,000 to $19,999 | 37 (5.1%) | 84 (23.1%) |
| $20,000 to $24,999 | 14 (1.9%) | 66 (18.2%) |
| $25,000 to $34,999 | 20 (2.8%) | 28 (7.7%) |
| $35,000 to $49,999 | 74 (10.2%) | 32 (8.8%) |
| $50,000 to $74,999 | 150 (20.7%) | 55 (15.1%) |
| $75,000 to $99,999 | 258 (35.7%) | 12 (3.3%) |
| $100,000 to $149,999 | 83 (11.5%) | 29 (8.0%) |
| $150,000 or more | 30 (4.2%) | 25 (6.9%) |
| Total | 723 (100.0%) | 363 (100.0%) |
Monthly Housing Cost Tiers in Herington
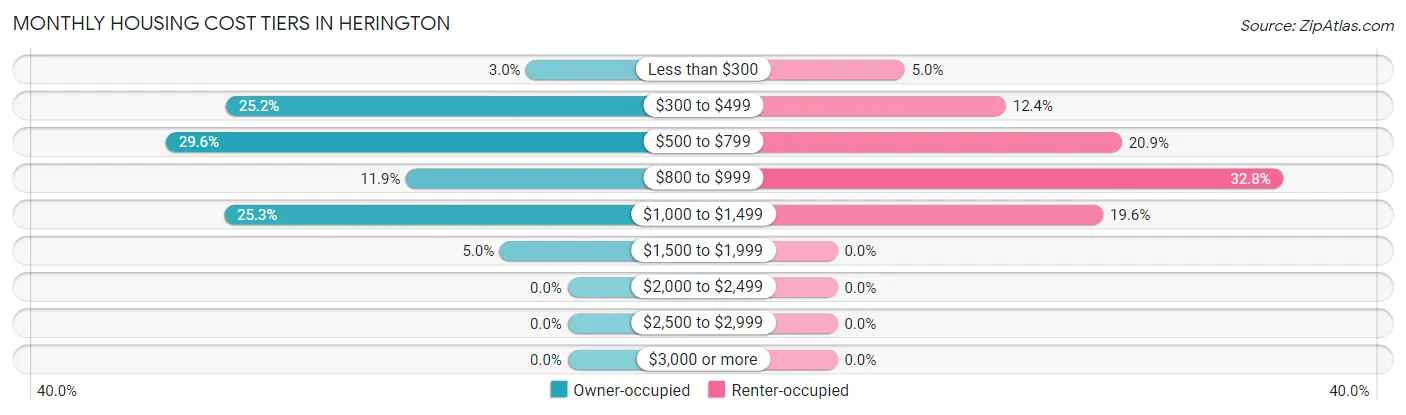
| Monthly Cost | Owner-occupied | Renter-occupied |
| Less than $300 | 22 (3.0%) | 18 (5.0%) |
| $300 to $499 | 182 (25.2%) | 45 (12.4%) |
| $500 to $799 | 214 (29.6%) | 76 (20.9%) |
| $800 to $999 | 86 (11.9%) | 119 (32.8%) |
| $1,000 to $1,499 | 183 (25.3%) | 71 (19.6%) |
| $1,500 to $1,999 | 36 (5.0%) | 0 (0.0%) |
| $2,000 to $2,499 | 0 (0.0%) | 0 (0.0%) |
| $2,500 to $2,999 | 0 (0.0%) | 0 (0.0%) |
| $3,000 or more | 0 (0.0%) | 0 (0.0%) |
| Total | 723 (100.0%) | 363 (100.0%) |
Physical Housing Characteristics in Herington
Housing Structures in Herington
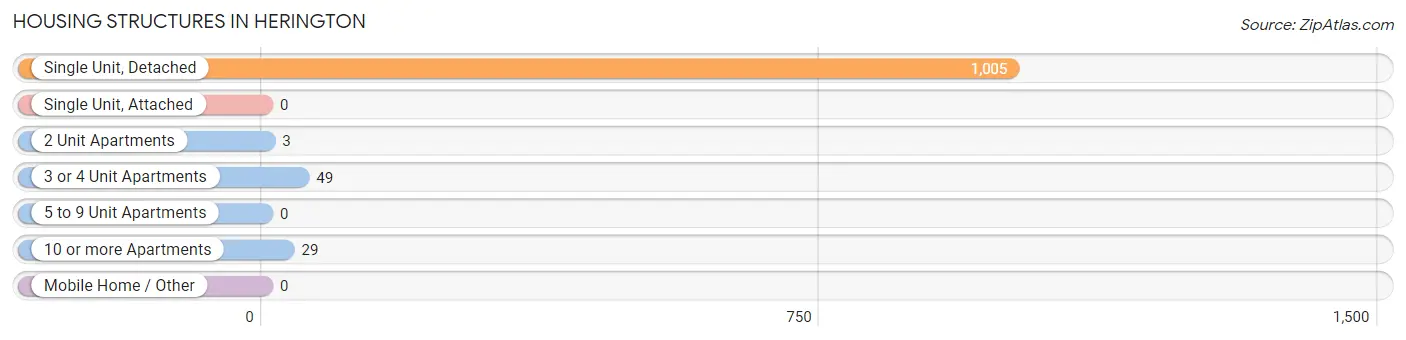
| Structure Type | # Housing Units | % Housing Units |
| Single Unit, Detached | 1,005 | 92.5% |
| Single Unit, Attached | 0 | 0.0% |
| 2 Unit Apartments | 3 | 0.3% |
| 3 or 4 Unit Apartments | 49 | 4.5% |
| 5 to 9 Unit Apartments | 0 | 0.0% |
| 10 or more Apartments | 29 | 2.7% |
| Mobile Home / Other | 0 | 0.0% |
| Total | 1,086 | 100.0% |
Housing Structures by Occupancy in Herington
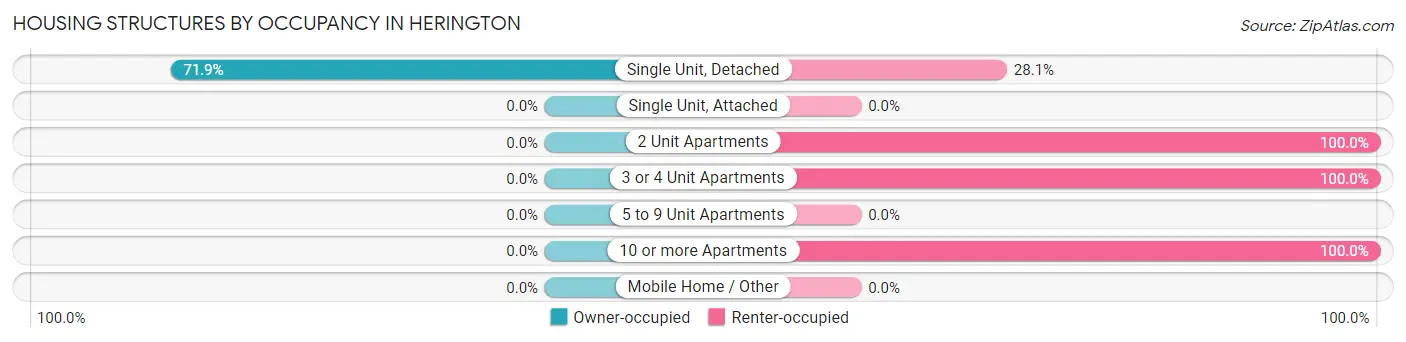
| Structure Type | Owner-occupied | Renter-occupied |
| Single Unit, Detached | 723 (71.9%) | 282 (28.1%) |
| Single Unit, Attached | 0 (0.0%) | 0 (0.0%) |
| 2 Unit Apartments | 0 (0.0%) | 3 (100.0%) |
| 3 or 4 Unit Apartments | 0 (0.0%) | 49 (100.0%) |
| 5 to 9 Unit Apartments | 0 (0.0%) | 0 (0.0%) |
| 10 or more Apartments | 0 (0.0%) | 29 (100.0%) |
| Mobile Home / Other | 0 (0.0%) | 0 (0.0%) |
| Total | 723 (66.6%) | 363 (33.4%) |
Housing Structures by Number of Rooms in Herington
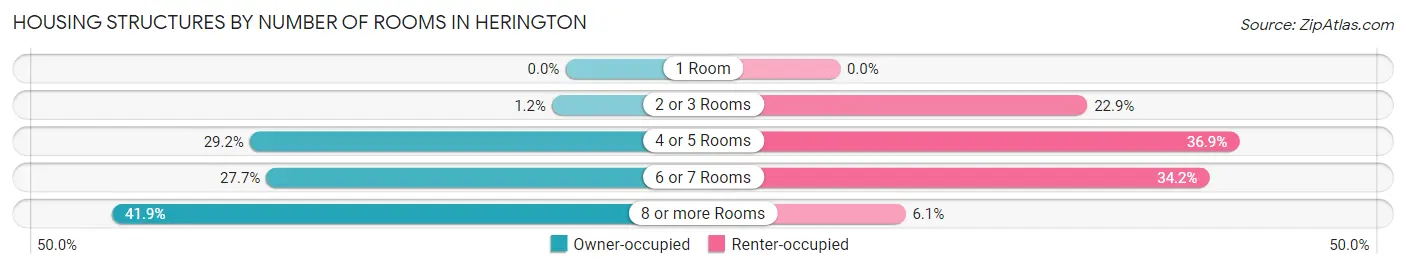
| Number of Rooms | Owner-occupied | Renter-occupied |
| 1 Room | 0 (0.0%) | 0 (0.0%) |
| 2 or 3 Rooms | 9 (1.2%) | 83 (22.9%) |
| 4 or 5 Rooms | 211 (29.2%) | 134 (36.9%) |
| 6 or 7 Rooms | 200 (27.7%) | 124 (34.2%) |
| 8 or more Rooms | 303 (41.9%) | 22 (6.1%) |
| Total | 723 (100.0%) | 363 (100.0%) |
Housing Structure by Heating Type in Herington
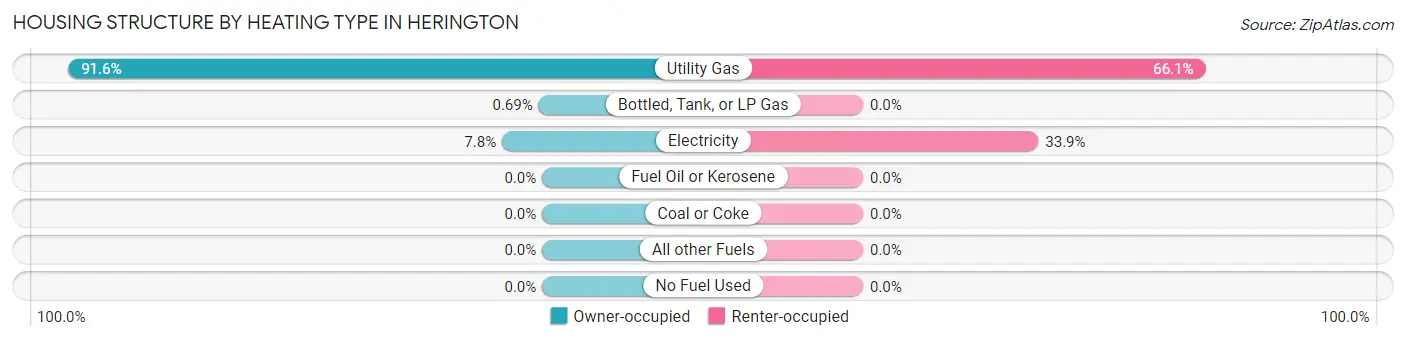
| Heating Type | Owner-occupied | Renter-occupied |
| Utility Gas | 662 (91.6%) | 240 (66.1%) |
| Bottled, Tank, or LP Gas | 5 (0.7%) | 0 (0.0%) |
| Electricity | 56 (7.7%) | 123 (33.9%) |
| Fuel Oil or Kerosene | 0 (0.0%) | 0 (0.0%) |
| Coal or Coke | 0 (0.0%) | 0 (0.0%) |
| All other Fuels | 0 (0.0%) | 0 (0.0%) |
| No Fuel Used | 0 (0.0%) | 0 (0.0%) |
| Total | 723 (100.0%) | 363 (100.0%) |
Household Vehicle Usage in Herington
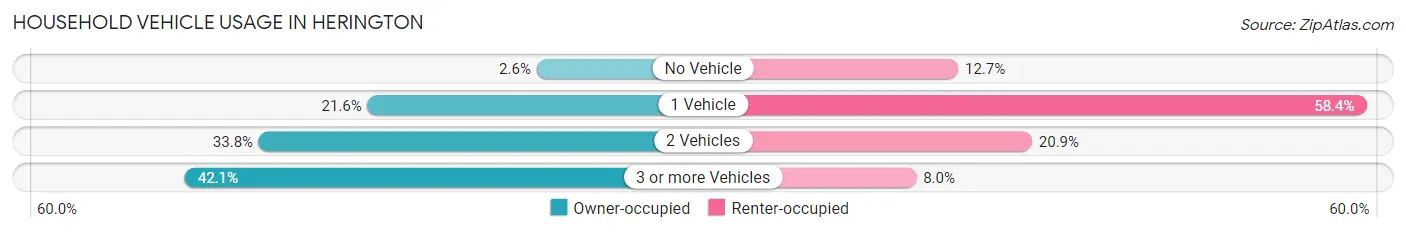
| Vehicles per Household | Owner-occupied | Renter-occupied |
| No Vehicle | 19 (2.6%) | 46 (12.7%) |
| 1 Vehicle | 156 (21.6%) | 212 (58.4%) |
| 2 Vehicles | 244 (33.8%) | 76 (20.9%) |
| 3 or more Vehicles | 304 (42.0%) | 29 (8.0%) |
| Total | 723 (100.0%) | 363 (100.0%) |
Real Estate & Mortgages in Herington
Real Estate and Mortgage Overview in Herington
| Characteristic | Without Mortgage | With Mortgage |
| Housing Units | 423 | 300 |
| Median Property Value | $64,900 | $100,000 |
| Median Household Income | $75,536 | $11 |
| Monthly Housing Costs | $509 | $0 |
| Real Estate Taxes | $1,620 | $0 |
Property Value by Mortgage Status in Herington
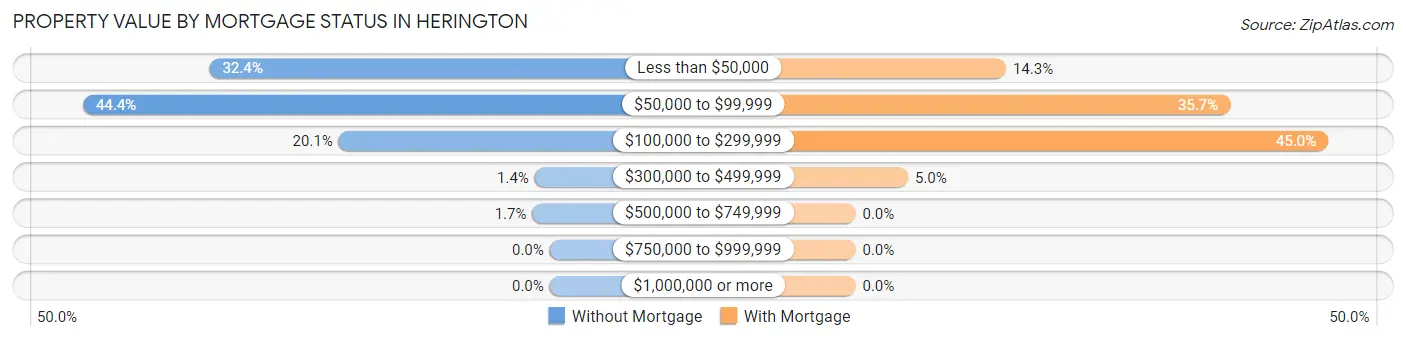
| Property Value | Without Mortgage | With Mortgage |
| Less than $50,000 | 137 (32.4%) | 43 (14.3%) |
| $50,000 to $99,999 | 188 (44.4%) | 107 (35.7%) |
| $100,000 to $299,999 | 85 (20.1%) | 135 (45.0%) |
| $300,000 to $499,999 | 6 (1.4%) | 15 (5.0%) |
| $500,000 to $749,999 | 7 (1.7%) | 0 (0.0%) |
| $750,000 to $999,999 | 0 (0.0%) | 0 (0.0%) |
| $1,000,000 or more | 0 (0.0%) | 0 (0.0%) |
| Total | 423 (100.0%) | 300 (100.0%) |
Household Income by Mortgage Status in Herington
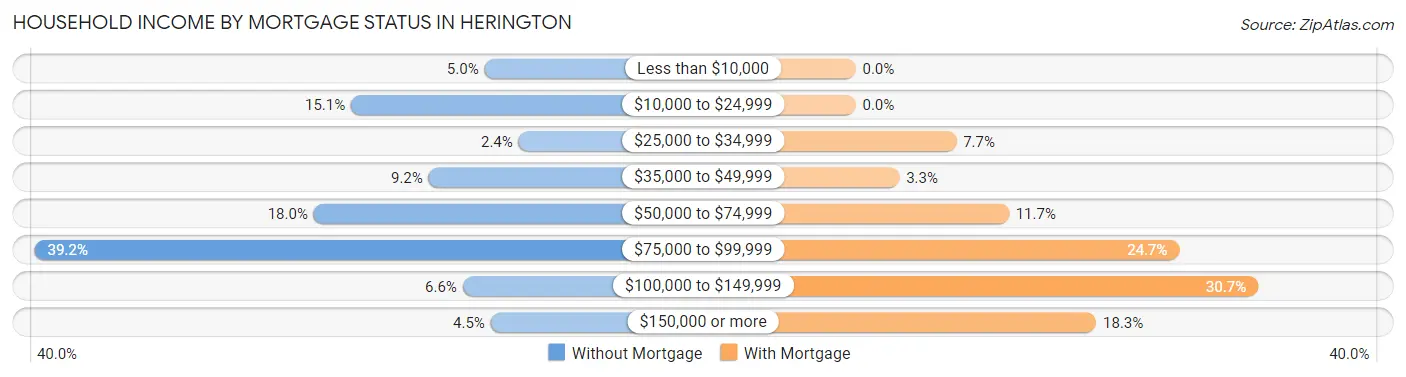
| Household Income | Without Mortgage | With Mortgage |
| Less than $10,000 | 21 (5.0%) | 0 (0.0%) |
| $10,000 to $24,999 | 64 (15.1%) | 0 (0.0%) |
| $25,000 to $34,999 | 10 (2.4%) | 23 (7.7%) |
| $35,000 to $49,999 | 39 (9.2%) | 10 (3.3%) |
| $50,000 to $74,999 | 76 (18.0%) | 35 (11.7%) |
| $75,000 to $99,999 | 166 (39.2%) | 74 (24.7%) |
| $100,000 to $149,999 | 28 (6.6%) | 92 (30.7%) |
| $150,000 or more | 19 (4.5%) | 55 (18.3%) |
| Total | 423 (100.0%) | 300 (100.0%) |
Property Value to Household Income Ratio in Herington
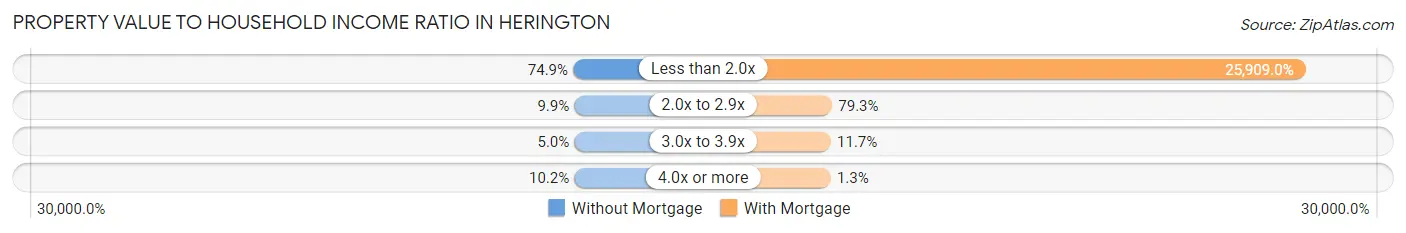
| Value-to-Income Ratio | Without Mortgage | With Mortgage |
| Less than 2.0x | 317 (74.9%) | 77,727 (25,909.0%) |
| 2.0x to 2.9x | 42 (9.9%) | 238 (79.3%) |
| 3.0x to 3.9x | 21 (5.0%) | 35 (11.7%) |
| 4.0x or more | 43 (10.2%) | 4 (1.3%) |
| Total | 423 (100.0%) | 300 (100.0%) |
Real Estate Taxes by Mortgage Status in Herington
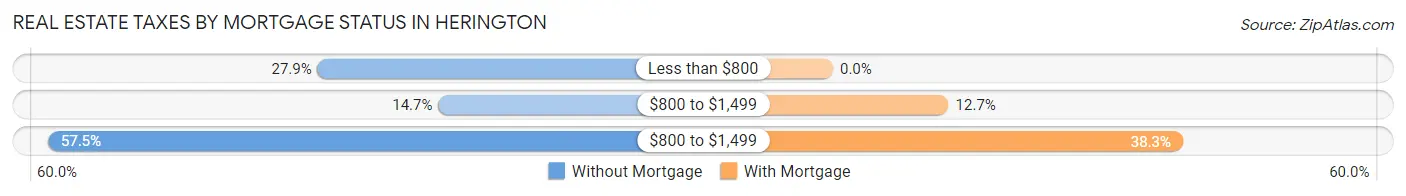
| Property Taxes | Without Mortgage | With Mortgage |
| Less than $800 | 118 (27.9%) | 0 (0.0%) |
| $800 to $1,499 | 62 (14.7%) | 38 (12.7%) |
| $800 to $1,499 | 243 (57.5%) | 115 (38.3%) |
| Total | 423 (100.0%) | 300 (100.0%) |
Health & Disability in Herington
Health Insurance Coverage by Age in Herington
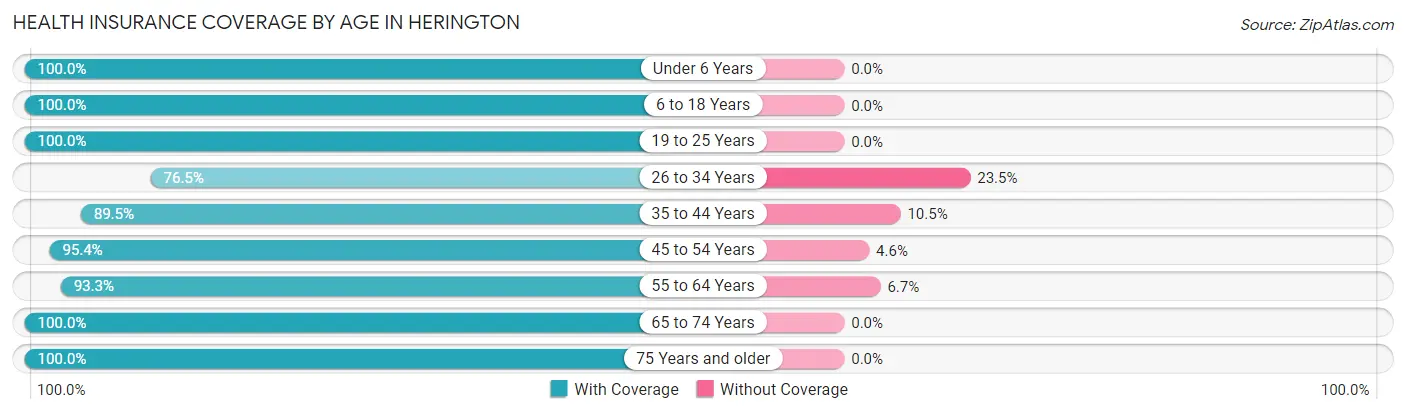
| Age Bracket | With Coverage | Without Coverage |
| Under 6 Years | 135 (100.0%) | 0 (0.0%) |
| 6 to 18 Years | 199 (100.0%) | 0 (0.0%) |
| 19 to 25 Years | 128 (100.0%) | 0 (0.0%) |
| 26 to 34 Years | 153 (76.5%) | 47 (23.5%) |
| 35 to 44 Years | 333 (89.5%) | 39 (10.5%) |
| 45 to 54 Years | 185 (95.4%) | 9 (4.6%) |
| 55 to 64 Years | 263 (93.3%) | 19 (6.7%) |
| 65 to 74 Years | 372 (100.0%) | 0 (0.0%) |
| 75 Years and older | 121 (100.0%) | 0 (0.0%) |
| Total | 1,889 (94.3%) | 114 (5.7%) |
Health Insurance Coverage by Citizenship Status in Herington
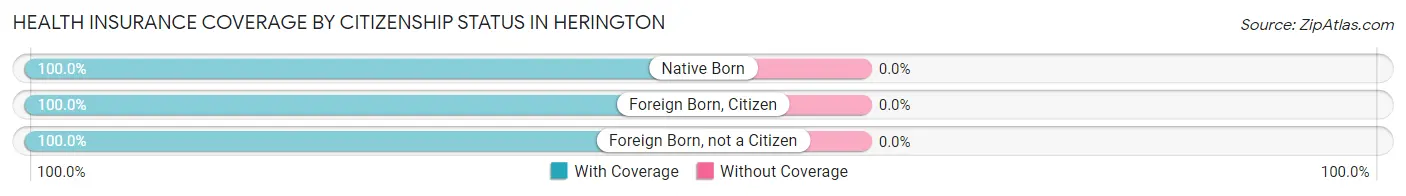
| Citizenship Status | With Coverage | Without Coverage |
| Native Born | 135 (100.0%) | 0 (0.0%) |
| Foreign Born, Citizen | 199 (100.0%) | 0 (0.0%) |
| Foreign Born, not a Citizen | 128 (100.0%) | 0 (0.0%) |
Health Insurance Coverage by Household Income in Herington
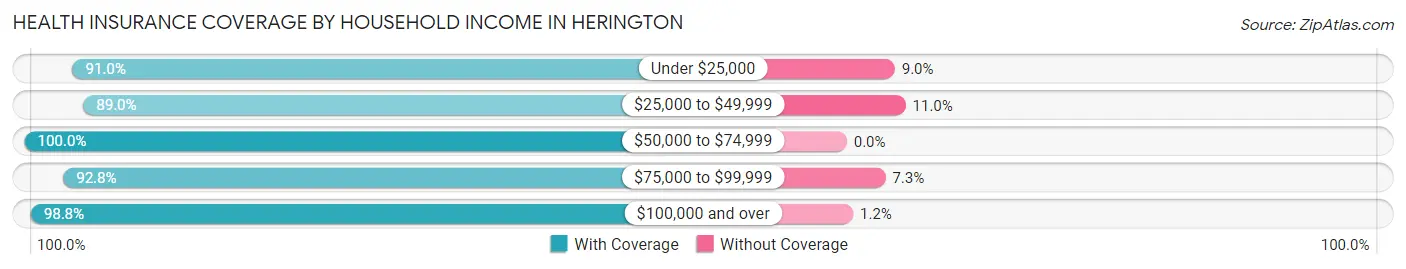
| Household Income | With Coverage | Without Coverage |
| Under $25,000 | 334 (91.0%) | 33 (9.0%) |
| $25,000 to $49,999 | 331 (89.0%) | 41 (11.0%) |
| $50,000 to $74,999 | 359 (100.0%) | 0 (0.0%) |
| $75,000 to $99,999 | 448 (92.7%) | 35 (7.2%) |
| $100,000 and over | 417 (98.8%) | 5 (1.2%) |
Public vs Private Health Insurance Coverage by Age in Herington
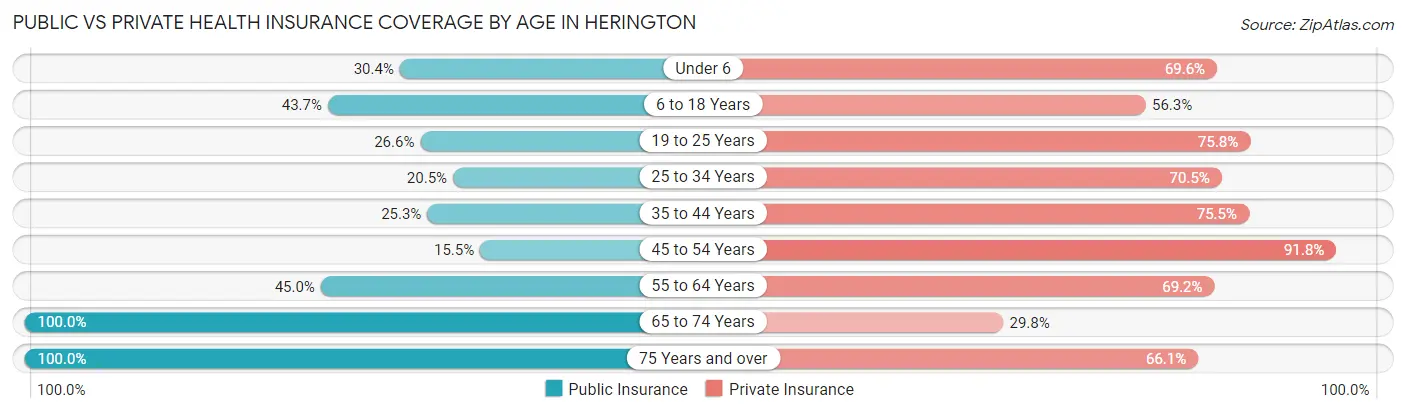
| Age Bracket | Public Insurance | Private Insurance |
| Under 6 | 41 (30.4%) | 94 (69.6%) |
| 6 to 18 Years | 87 (43.7%) | 112 (56.3%) |
| 19 to 25 Years | 34 (26.6%) | 97 (75.8%) |
| 25 to 34 Years | 41 (20.5%) | 141 (70.5%) |
| 35 to 44 Years | 94 (25.3%) | 281 (75.5%) |
| 45 to 54 Years | 30 (15.5%) | 178 (91.7%) |
| 55 to 64 Years | 127 (45.0%) | 195 (69.2%) |
| 65 to 74 Years | 372 (100.0%) | 111 (29.8%) |
| 75 Years and over | 121 (100.0%) | 80 (66.1%) |
| Total | 947 (47.3%) | 1,289 (64.3%) |
Disability Status by Sex by Age in Herington
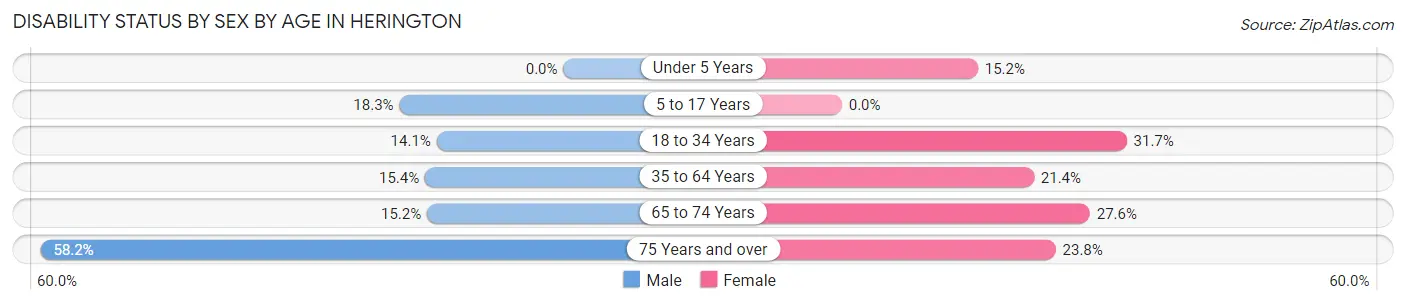
| Age Bracket | Male | Female |
| Under 5 Years | 0 (0.0%) | 10 (15.1%) |
| 5 to 17 Years | 21 (18.3%) | 0 (0.0%) |
| 18 to 34 Years | 23 (14.1%) | 59 (31.7%) |
| 35 to 64 Years | 73 (15.4%) | 80 (21.4%) |
| 65 to 74 Years | 29 (15.2%) | 50 (27.6%) |
| 75 Years and over | 46 (58.2%) | 10 (23.8%) |
Disability Class by Sex by Age in Herington
Disability Class: Hearing Difficulty
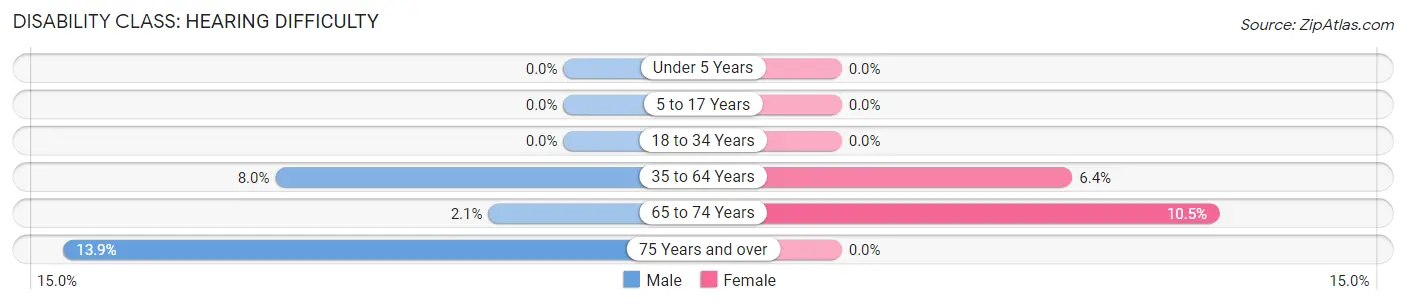
| Age Bracket | Male | Female |
| Under 5 Years | 0 (0.0%) | 0 (0.0%) |
| 5 to 17 Years | 0 (0.0%) | 0 (0.0%) |
| 18 to 34 Years | 0 (0.0%) | 0 (0.0%) |
| 35 to 64 Years | 38 (8.0%) | 24 (6.4%) |
| 65 to 74 Years | 4 (2.1%) | 19 (10.5%) |
| 75 Years and over | 11 (13.9%) | 0 (0.0%) |
Disability Class: Vision Difficulty
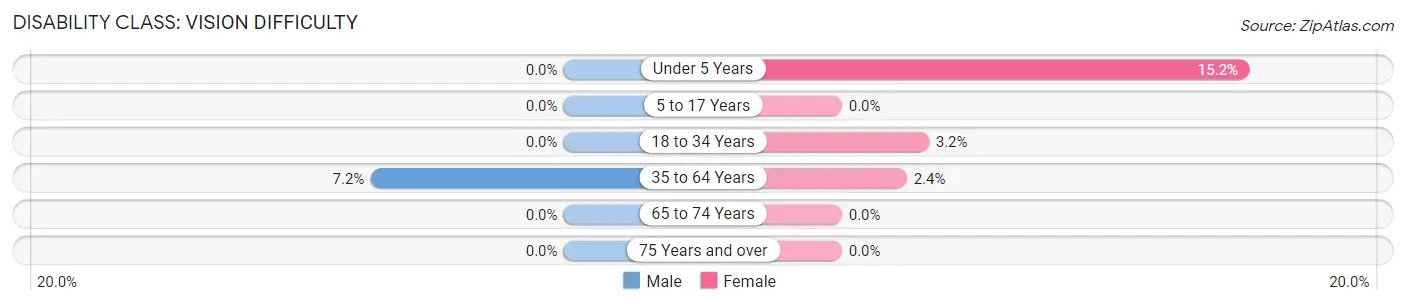
| Age Bracket | Male | Female |
| Under 5 Years | 0 (0.0%) | 10 (15.1%) |
| 5 to 17 Years | 0 (0.0%) | 0 (0.0%) |
| 18 to 34 Years | 0 (0.0%) | 6 (3.2%) |
| 35 to 64 Years | 34 (7.2%) | 9 (2.4%) |
| 65 to 74 Years | 0 (0.0%) | 0 (0.0%) |
| 75 Years and over | 0 (0.0%) | 0 (0.0%) |
Disability Class: Cognitive Difficulty
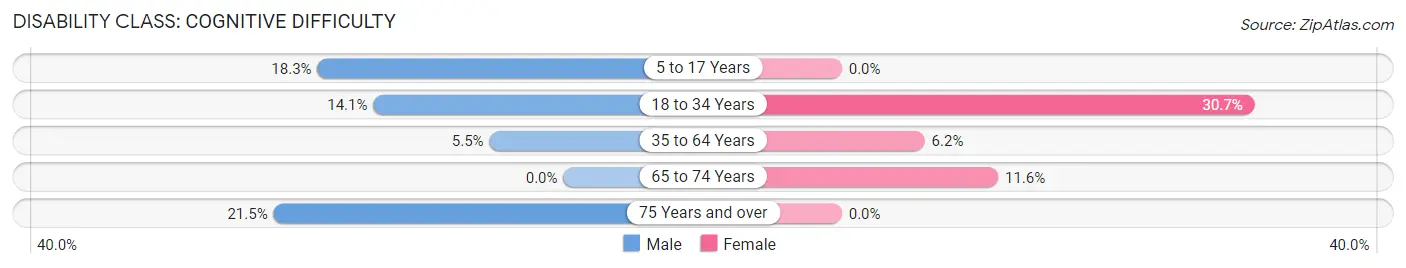
| Age Bracket | Male | Female |
| 5 to 17 Years | 21 (18.3%) | 0 (0.0%) |
| 18 to 34 Years | 23 (14.1%) | 57 (30.6%) |
| 35 to 64 Years | 26 (5.5%) | 23 (6.1%) |
| 65 to 74 Years | 0 (0.0%) | 21 (11.6%) |
| 75 Years and over | 17 (21.5%) | 0 (0.0%) |
Disability Class: Ambulatory Difficulty
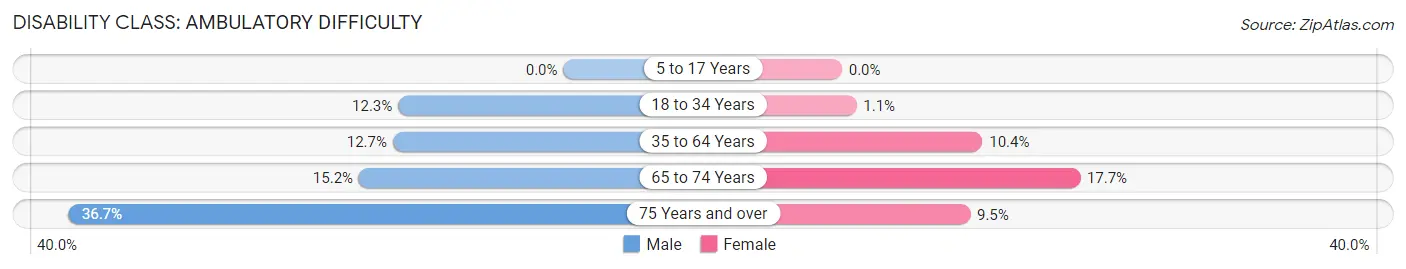
| Age Bracket | Male | Female |
| 5 to 17 Years | 0 (0.0%) | 0 (0.0%) |
| 18 to 34 Years | 20 (12.3%) | 2 (1.1%) |
| 35 to 64 Years | 60 (12.7%) | 39 (10.4%) |
| 65 to 74 Years | 29 (15.2%) | 32 (17.7%) |
| 75 Years and over | 29 (36.7%) | 4 (9.5%) |
Disability Class: Self-Care Difficulty
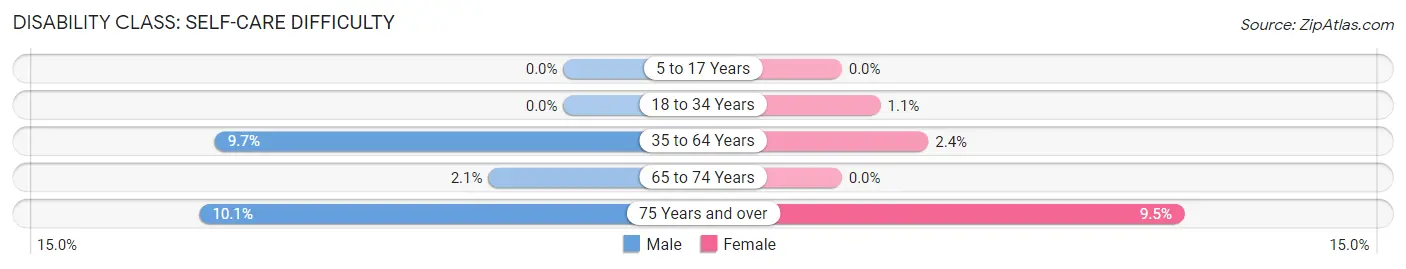
| Age Bracket | Male | Female |
| 5 to 17 Years | 0 (0.0%) | 0 (0.0%) |
| 18 to 34 Years | 0 (0.0%) | 2 (1.1%) |
| 35 to 64 Years | 46 (9.7%) | 9 (2.4%) |
| 65 to 74 Years | 4 (2.1%) | 0 (0.0%) |
| 75 Years and over | 8 (10.1%) | 4 (9.5%) |
Technology Access in Herington
Computing Device Access in Herington
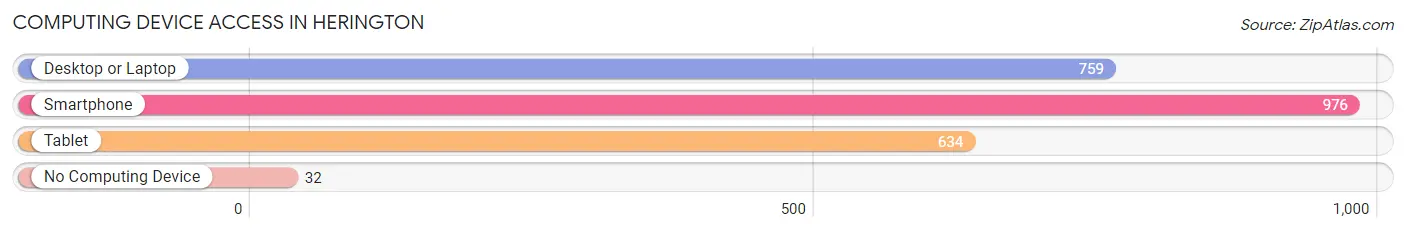
| Device Type | # Households | % Households |
| Desktop or Laptop | 759 | 69.9% |
| Smartphone | 976 | 89.9% |
| Tablet | 634 | 58.4% |
| No Computing Device | 32 | 2.9% |
| Total | 1,086 | 100.0% |
Internet Access in Herington
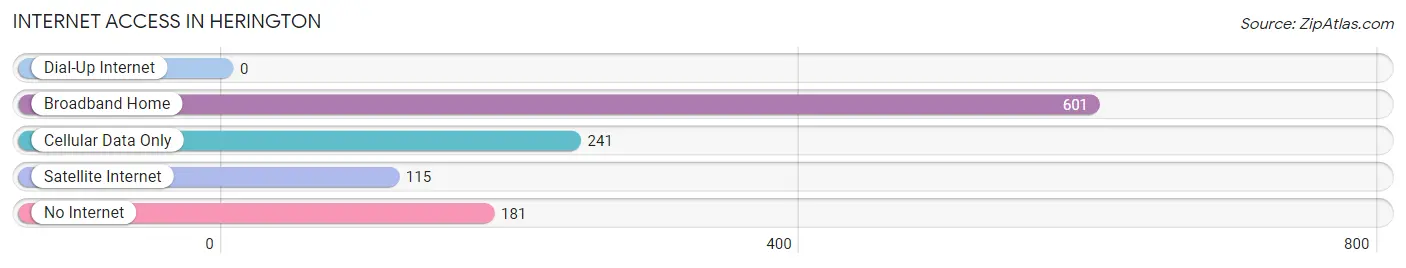
| Internet Type | # Households | % Households |
| Dial-Up Internet | 0 | 0.0% |
| Broadband Home | 601 | 55.3% |
| Cellular Data Only | 241 | 22.2% |
| Satellite Internet | 115 | 10.6% |
| No Internet | 181 | 16.7% |
| Total | 1,086 | 100.0% |
Herington Summary
Herington, Kansas is a small city located in Dickinson County in the north-central part of the state. It is situated along the banks of the Smoky Hill River, and is the county seat of Dickinson County. The city has a population of 2,521 as of the 2010 census, and is part of the Junction City, Kansas Metropolitan Statistical Area.
History
Herington was founded in 1887 by the Santa Fe Railroad. The city was named after William Herington, a railroad official. The city was incorporated in 1891, and the first post office was established in 1892.
In the early 1900s, Herington was a bustling railroad town, with a population of over 1,000. The city was home to several businesses, including a hotel, a bank, a lumberyard, a newspaper, and a variety of other stores.
In the 1920s, the city experienced a period of growth, with the construction of a new school, a new hospital, and a new library. The city also saw the construction of a new railroad depot, which was completed in 1925.
In the 1950s, the city experienced a period of decline, as the railroad industry began to decline. The city's population decreased from 1,000 to just over 500 by the end of the decade.
Geography
Herington is located at 38°59'25"N, 96°50'45"W (38.990278, -96.845556). The city is situated along the banks of the Smoky Hill River, and is located in the north-central part of the state.
The city has a total area of 1.3 square miles, all of which is land. The city is located in the Flint Hills region of Kansas, and is surrounded by rolling hills and prairies.
Economy
The economy of Herington is largely based on agriculture and manufacturing. The city is home to several manufacturing companies, including a plastics manufacturer, a metal fabrication company, and a food processing plant.
The city is also home to several agricultural businesses, including a dairy farm, a feed mill, and a grain elevator.
Demographics
As of the 2010 census, there were 2,521 people, 1,039 households, and 645 families residing in the city. The population density was 1,945.3 people per square mile. The racial makeup of the city was 95.2% White, 0.7% African American, 0.3% Native American, 0.3% Asian, 0.1% Pacific Islander, 1.2% from other races, and 2.3% from two or more races. Hispanic or Latino of any race were 3.2% of the population.
The median income for a household in the city was $37,917, and the median income for a family was $45,938. The per capita income for the city was $18,945. About 11.2% of families and 14.2% of the population were below the poverty line, including 19.2% of those under age 18 and 8.2% of those age 65 or over.
Common Questions
What is Per Capita Income in Herington?
Per Capita income in Herington is $40,769.
What is the Median Family Income in Herington?
Median Family Income in Herington is $72,227.
What is the Median Household income in Herington?
Median Household Income in Herington is $63,591.
What is Income or Wage Gap in Herington?
Income or Wage Gap in Herington is 36.5%.
Women in Herington earn 63.5 cents for every dollar earned by a man.
What is Inequality or Gini Index in Herington?
Inequality or Gini Index in Herington is 0.46.
What is the Total Population of Herington?
Total Population of Herington is 2,074.
What is the Total Male Population of Herington?
Total Male Population of Herington is 1,107.
What is the Total Female Population of Herington?
Total Female Population of Herington is 967.
What is the Ratio of Males per 100 Females in Herington?
There are 114.48 Males per 100 Females in Herington.
What is the Ratio of Females per 100 Males in Herington?
There are 87.35 Females per 100 Males in Herington.
What is the Median Population Age in Herington?
Median Population Age in Herington is 43.4 Years.
What is the Average Family Size in Herington
Average Family Size in Herington is 2.5 People.
What is the Average Household Size in Herington
Average Household Size in Herington is 1.9 People.
How Large is the Labor Force in Herington?
There are 1,027 People in the Labor Forcein in Herington.
What is the Percentage of People in the Labor Force in Herington?
57.2% of People are in the Labor Force in Herington.
What is the Unemployment Rate in Herington?
Unemployment Rate in Herington is 0.6%.