Haysville, KS Map & Demographics
Haysville Map
Haysville Overview
$28,670
PER CAPITA INCOME
$83,164
AVG FAMILY INCOME
$66,382
AVG HOUSEHOLD INCOME
31.0%
WAGE / INCOME GAP [ % ]
69.0¢/ $1
WAGE / INCOME GAP [ $ ]
$6,294
FAMILY INCOME DEFICIT
0.34
INEQUALITY / GINI INDEX
10,891
TOTAL POPULATION
5,550
MALE POPULATION
5,341
FEMALE POPULATION
103.91
MALES / 100 FEMALES
96.23
FEMALES / 100 MALES
35.1
MEDIAN AGE
3.1
AVG FAMILY SIZE
2.7
AVG HOUSEHOLD SIZE
5,295
LABOR FORCE [ PEOPLE ]
63.2%
PERCENT IN LABOR FORCE
5.2%
UNEMPLOYMENT RATE
Haysville Zip Codes
Haysville Area Codes
Income in Haysville
Income Overview in Haysville
Per Capita Income in Haysville is $28,670, while median incomes of families and households are $83,164 and $66,382 respectively.
| Characteristic | Number | Measure |
| Per Capita Income | 10,891 | $28,670 |
| Median Family Income | 2,841 | $83,164 |
| Mean Family Income | 2,841 | $88,828 |
| Median Household Income | 3,988 | $66,382 |
| Mean Household Income | 3,988 | $77,116 |
| Income Deficit | 2,841 | $6,294 |
| Wage / Income Gap (%) | 10,891 | 31.01% |
| Wage / Income Gap ($) | 10,891 | 68.99¢ per $1 |
| Gini / Inequality Index | 10,891 | 0.34 |
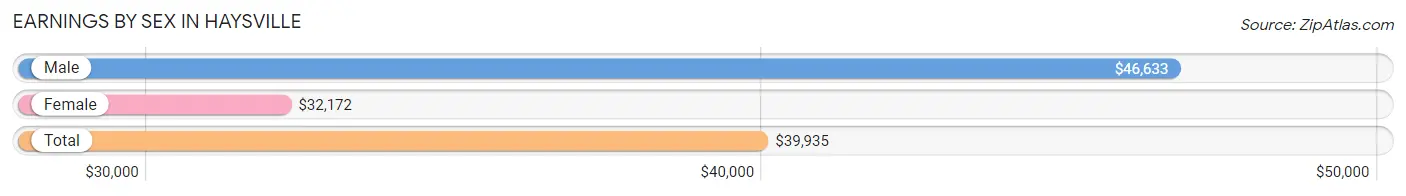
Earnings by Sex in Haysville
Average Earnings in Haysville are $39,935, $46,633 for men and $32,172 for women, a difference of 31.0%.
| Sex | Number | Average Earnings |
| Male | 3,141 (55.9%) | $46,633 |
| Female | 2,477 (44.1%) | $32,172 |
| Total | 5,618 (100.0%) | $39,935 |
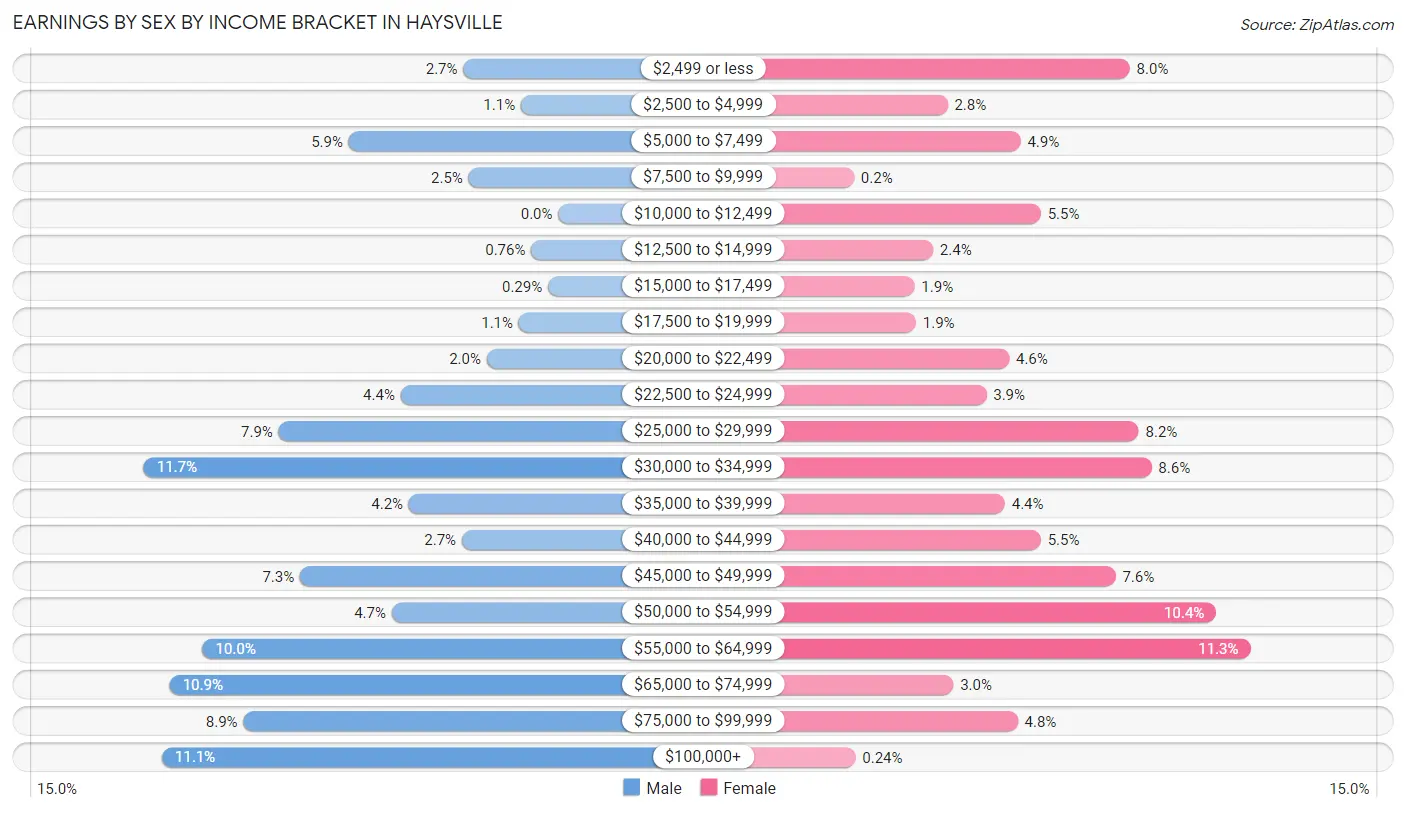
Earnings by Sex by Income Bracket in Haysville
The most common earnings brackets in Haysville are $30,000 to $34,999 for men (366 | 11.7%) and $55,000 to $64,999 for women (281 | 11.3%).
| Income | Male | Female |
| $2,499 or less | 84 (2.7%) | 197 (8.0%) |
| $2,500 to $4,999 | 33 (1.1%) | 70 (2.8%) |
| $5,000 to $7,499 | 185 (5.9%) | 121 (4.9%) |
| $7,500 to $9,999 | 79 (2.5%) | 5 (0.2%) |
| $10,000 to $12,499 | 0 (0.0%) | 135 (5.4%) |
| $12,500 to $14,999 | 24 (0.8%) | 60 (2.4%) |
| $15,000 to $17,499 | 9 (0.3%) | 47 (1.9%) |
| $17,500 to $19,999 | 35 (1.1%) | 48 (1.9%) |
| $20,000 to $22,499 | 63 (2.0%) | 113 (4.6%) |
| $22,500 to $24,999 | 139 (4.4%) | 97 (3.9%) |
| $25,000 to $29,999 | 247 (7.9%) | 203 (8.2%) |
| $30,000 to $34,999 | 366 (11.7%) | 212 (8.6%) |
| $35,000 to $39,999 | 132 (4.2%) | 110 (4.4%) |
| $40,000 to $44,999 | 85 (2.7%) | 135 (5.4%) |
| $45,000 to $49,999 | 228 (7.3%) | 187 (7.5%) |
| $50,000 to $54,999 | 147 (4.7%) | 257 (10.4%) |
| $55,000 to $64,999 | 314 (10.0%) | 281 (11.3%) |
| $65,000 to $74,999 | 343 (10.9%) | 74 (3.0%) |
| $75,000 to $99,999 | 278 (8.8%) | 119 (4.8%) |
| $100,000+ | 350 (11.1%) | 6 (0.2%) |
| Total | 3,141 (100.0%) | 2,477 (100.0%) |
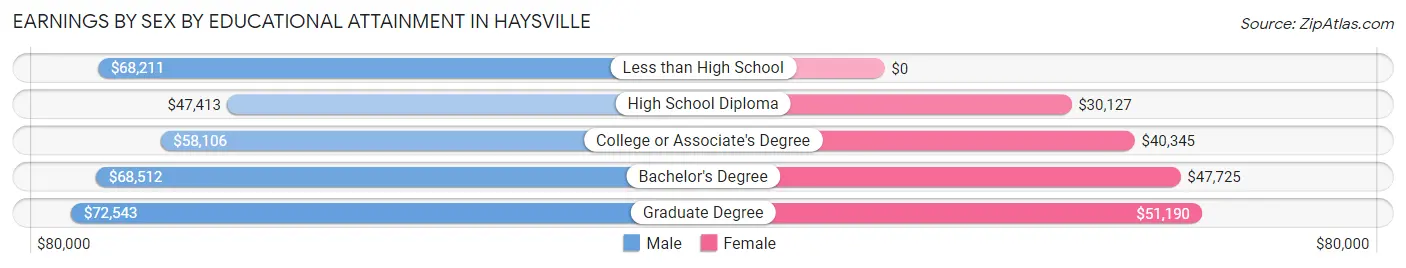
Earnings by Sex by Educational Attainment in Haysville
Average earnings in Haysville are $57,854 for men and $39,927 for women, a difference of 31.0%. Men with an educational attainment of graduate degree enjoy the highest average annual earnings of $72,543, while those with high school diploma education earn the least with $47,413. Women with an educational attainment of graduate degree earn the most with the average annual earnings of $51,190, while those with high school diploma education have the smallest earnings of $30,127.
| Educational Attainment | Male Income | Female Income |
| Less than High School | $68,211 | $0 |
| High School Diploma | $47,413 | $30,127 |
| College or Associate's Degree | $58,106 | $40,345 |
| Bachelor's Degree | $68,512 | $47,725 |
| Graduate Degree | $72,543 | $51,190 |
| Total | $57,854 | $39,927 |
Family Income in Haysville
Family Income Brackets in Haysville
According to the Haysville family income data, there are 690 families falling into the $100,000 to $149,999 income range, which is the most common income bracket and makes up 24.3% of all families. Conversely, the less than $10,000 income bracket is the least frequent group with only 9 families (0.3%) belonging to this category.
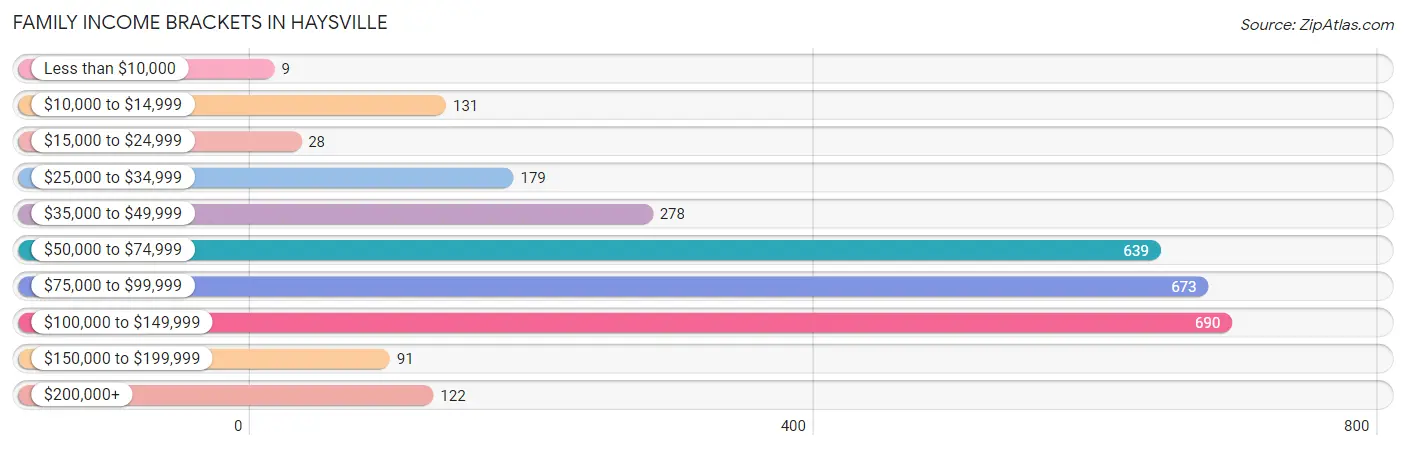
| Income Bracket | # Families | % Families |
| Less than $10,000 | 9 | 0.3% |
| $10,000 to $14,999 | 131 | 4.6% |
| $15,000 to $24,999 | 28 | 1.0% |
| $25,000 to $34,999 | 179 | 6.3% |
| $35,000 to $49,999 | 278 | 9.8% |
| $50,000 to $74,999 | 639 | 22.5% |
| $75,000 to $99,999 | 673 | 23.7% |
| $100,000 to $149,999 | 690 | 24.3% |
| $150,000 to $199,999 | 91 | 3.2% |
| $200,000+ | 122 | 4.3% |
Family Income by Famaliy Size in Haysville
7+ person families (31 | 1.1%) account for the highest median family income in Haysville with $122,417 per family, while 2-person families (1,551 | 54.6%) have the highest median income of $33,843 per family member.
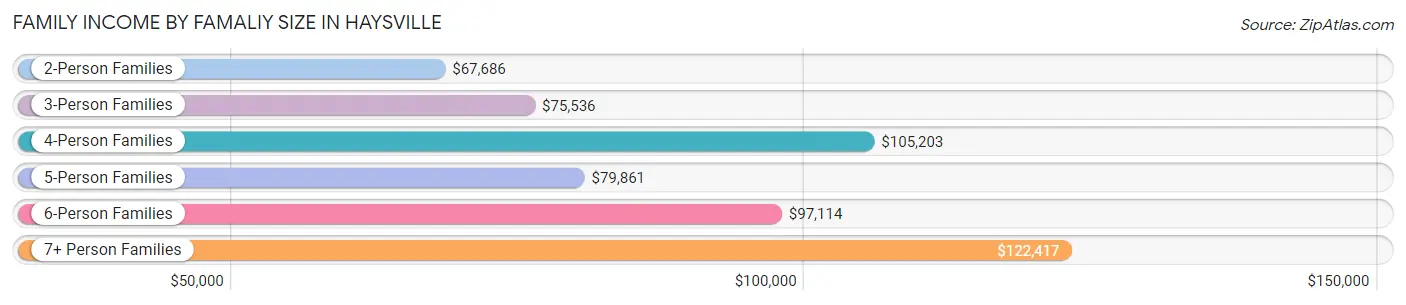
| Income Bracket | # Families | Median Income |
| 2-Person Families | 1,551 (54.6%) | $67,686 |
| 3-Person Families | 476 (16.8%) | $75,536 |
| 4-Person Families | 220 (7.7%) | $105,203 |
| 5-Person Families | 236 (8.3%) | $79,861 |
| 6-Person Families | 327 (11.5%) | $97,114 |
| 7+ Person Families | 31 (1.1%) | $122,417 |
| Total | 2,841 (100.0%) | $83,164 |
Family Income by Number of Earners in Haysville
The median family income in Haysville is $83,164, with families comprising 3+ earners (279) having the highest median family income of $123,882, while families with no earners (504) have the lowest median family income of $49,318, accounting for 9.8% and 17.7% of families, respectively.
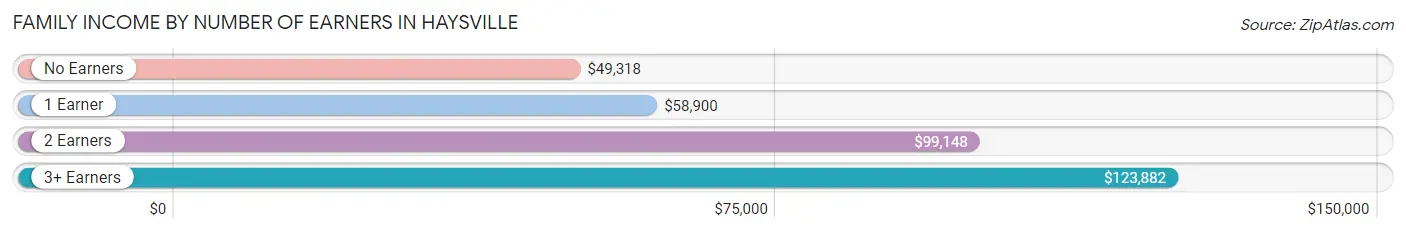
| Number of Earners | # Families | Median Income |
| No Earners | 504 (17.7%) | $49,318 |
| 1 Earner | 691 (24.3%) | $58,900 |
| 2 Earners | 1,367 (48.1%) | $99,148 |
| 3+ Earners | 279 (9.8%) | $123,882 |
| Total | 2,841 (100.0%) | $83,164 |
Household Income in Haysville
Household Income Brackets in Haysville
With 957 households falling in the category, the $50,000 to $74,999 income range is the most frequent in Haysville, accounting for 24.0% of all households. In contrast, only 40 households (1.0%) fall into the less than $10,000 income bracket, making it the least populous group.
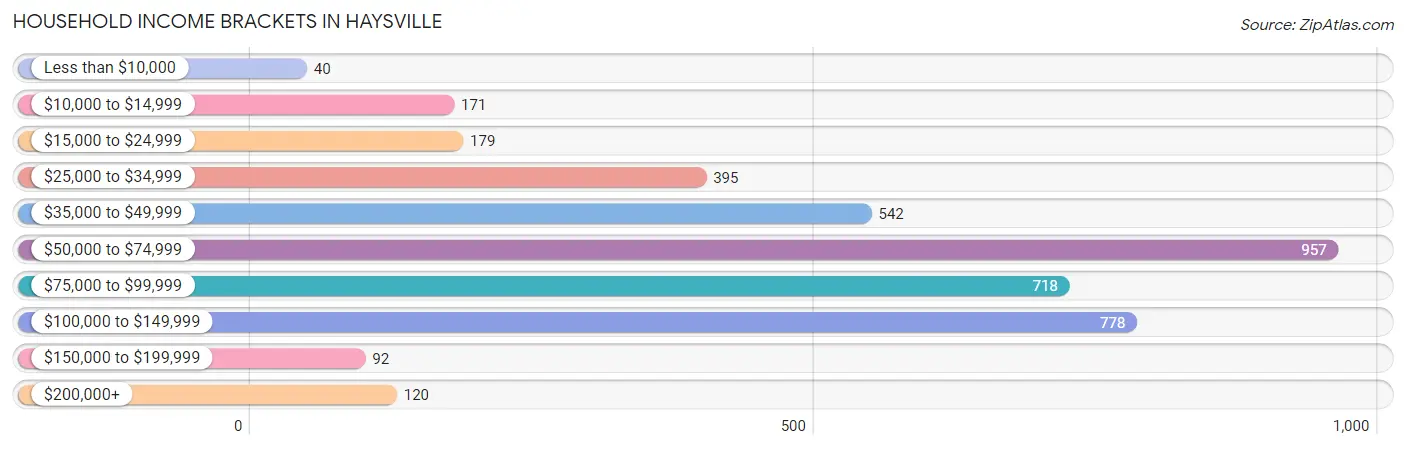
| Income Bracket | # Households | % Households |
| Less than $10,000 | 40 | 1.0% |
| $10,000 to $14,999 | 171 | 4.3% |
| $15,000 to $24,999 | 179 | 4.5% |
| $25,000 to $34,999 | 395 | 9.9% |
| $35,000 to $49,999 | 542 | 13.6% |
| $50,000 to $74,999 | 957 | 24.0% |
| $75,000 to $99,999 | 718 | 18.0% |
| $100,000 to $149,999 | 778 | 19.5% |
| $150,000 to $199,999 | 92 | 2.3% |
| $200,000+ | 120 | 3.0% |
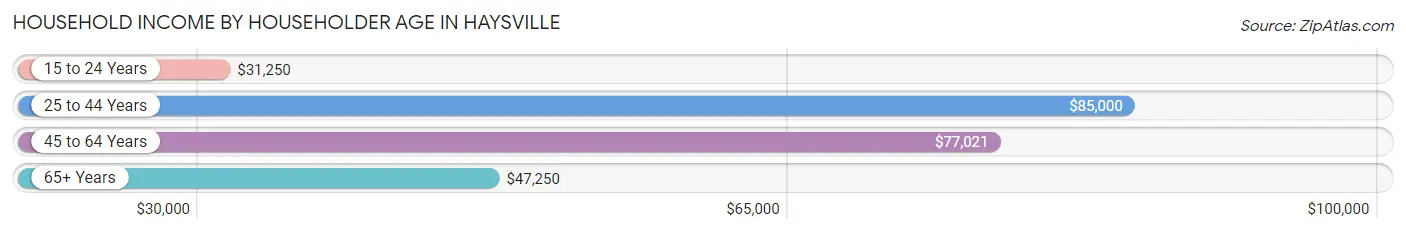
Household Income by Householder Age in Haysville
The median household income in Haysville is $66,382, with the highest median household income of $85,000 found in the 25 to 44 years age bracket for the primary householder. A total of 1,126 households (28.2%) fall into this category. Meanwhile, the 15 to 24 years age bracket for the primary householder has the lowest median household income of $31,250, with 250 households (6.3%) in this group.
| Income Bracket | # Households | Median Income |
| 15 to 24 Years | 250 (6.3%) | $31,250 |
| 25 to 44 Years | 1,126 (28.2%) | $85,000 |
| 45 to 64 Years | 1,676 (42.0%) | $77,021 |
| 65+ Years | 936 (23.5%) | $47,250 |
| Total | 3,988 (100.0%) | $66,382 |
Poverty in Haysville
Income Below Poverty by Sex and Age in Haysville
With 9.8% poverty level for males and 14.9% for females among the residents of Haysville, 15 year old males and 18 to 24 year old females are the most vulnerable to poverty, with 37 males (44.1%) and 261 females (53.5%) in their respective age groups living below the poverty level.
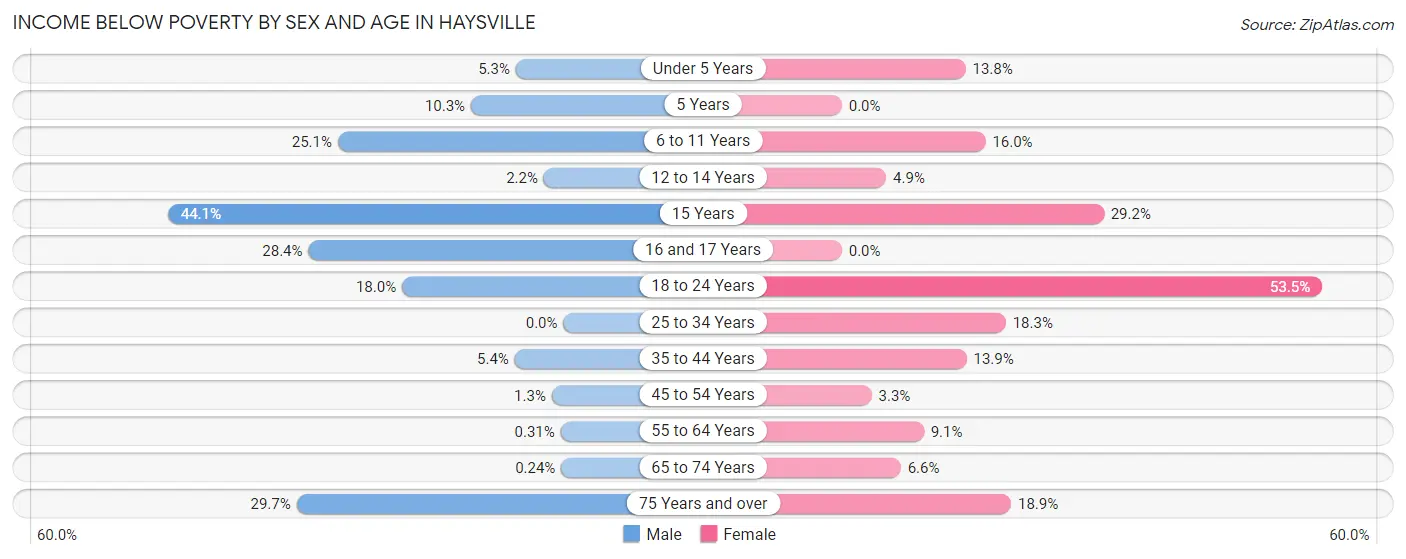
| Age Bracket | Male | Female |
| Under 5 Years | 16 (5.3%) | 31 (13.8%) |
| 5 Years | 7 (10.3%) | 0 (0.0%) |
| 6 to 11 Years | 101 (25.1%) | 68 (16.0%) |
| 12 to 14 Years | 7 (2.2%) | 25 (4.9%) |
| 15 Years | 37 (44.1%) | 7 (29.2%) |
| 16 and 17 Years | 46 (28.4%) | 0 (0.0%) |
| 18 to 24 Years | 170 (18.0%) | 261 (53.5%) |
| 25 to 34 Years | 0 (0.0%) | 111 (18.3%) |
| 35 to 44 Years | 35 (5.4%) | 101 (13.9%) |
| 45 to 54 Years | 7 (1.3%) | 19 (3.3%) |
| 55 to 64 Years | 2 (0.3%) | 74 (9.1%) |
| 65 to 74 Years | 1 (0.2%) | 20 (6.6%) |
| 75 Years and over | 101 (29.7%) | 69 (18.9%) |
| Total | 530 (9.8%) | 786 (14.9%) |
Income Above Poverty by Sex and Age in Haysville
According to the poverty statistics in Haysville, males aged 25 to 34 years and females aged 5 years are the age groups that are most secure financially, with 100.0% of males and 100.0% of females in these age groups living above the poverty line.
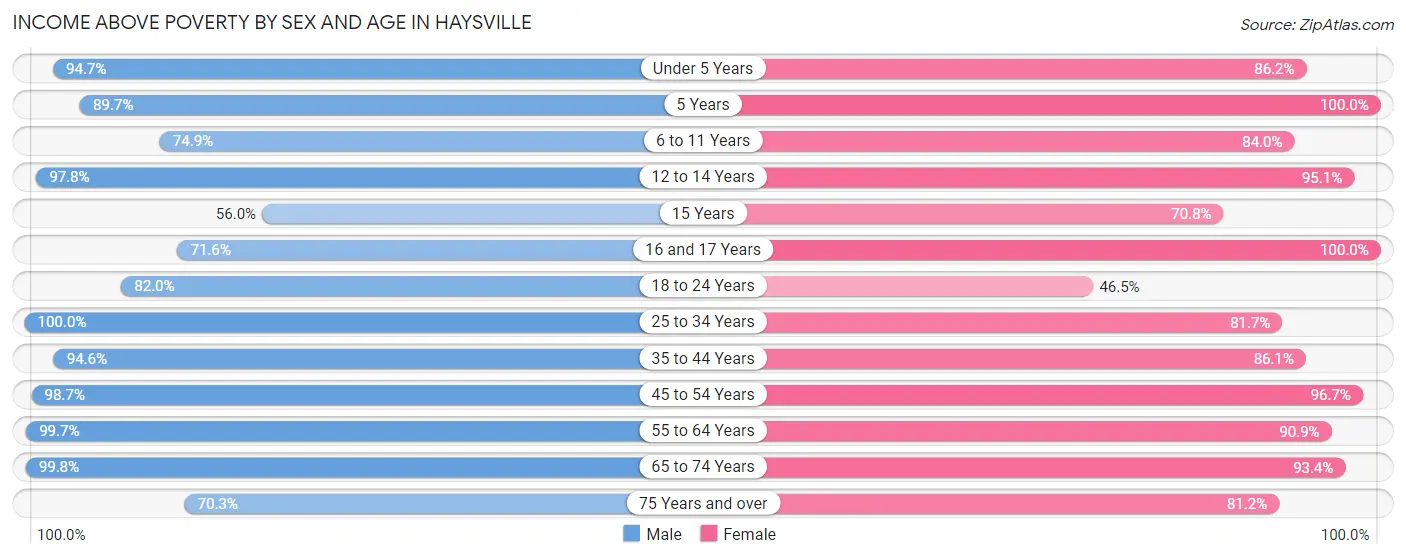
| Age Bracket | Male | Female |
| Under 5 Years | 286 (94.7%) | 194 (86.2%) |
| 5 Years | 61 (89.7%) | 49 (100.0%) |
| 6 to 11 Years | 301 (74.9%) | 357 (84.0%) |
| 12 to 14 Years | 314 (97.8%) | 481 (95.1%) |
| 15 Years | 47 (55.9%) | 17 (70.8%) |
| 16 and 17 Years | 116 (71.6%) | 179 (100.0%) |
| 18 to 24 Years | 776 (82.0%) | 227 (46.5%) |
| 25 to 34 Years | 529 (100.0%) | 497 (81.7%) |
| 35 to 44 Years | 611 (94.6%) | 626 (86.1%) |
| 45 to 54 Years | 534 (98.7%) | 554 (96.7%) |
| 55 to 64 Years | 645 (99.7%) | 737 (90.9%) |
| 65 to 74 Years | 420 (99.8%) | 285 (93.4%) |
| 75 Years and over | 239 (70.3%) | 297 (81.1%) |
| Total | 4,879 (90.2%) | 4,500 (85.1%) |
Income Below Poverty Among Married-Couple Families in Haysville
The poverty statistics for married-couple families in Haysville show that 6.7% or 138 of the total 2,057 families live below the poverty line. Families with 1 or 2 children have the highest poverty rate of 12.5%, comprising of 47 families. On the other hand, families with 5 or more children have the lowest poverty rate of 0.0%, which includes 0 families.
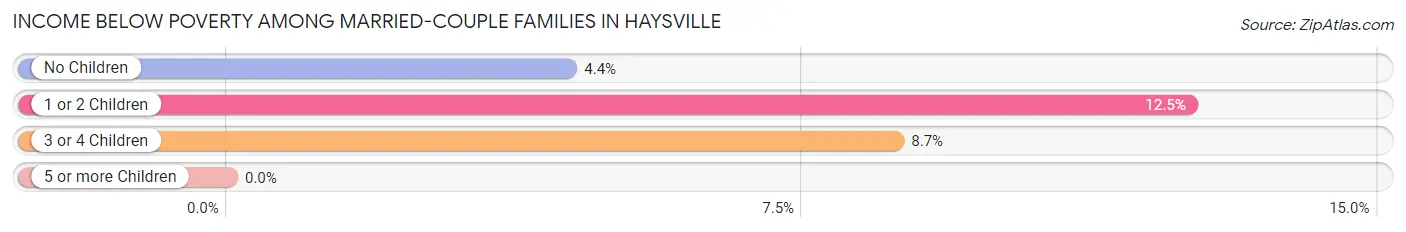
| Children | Above Poverty | Below Poverty |
| No Children | 1,187 (95.6%) | 55 (4.4%) |
| 1 or 2 Children | 328 (87.5%) | 47 (12.5%) |
| 3 or 4 Children | 378 (91.3%) | 36 (8.7%) |
| 5 or more Children | 26 (100.0%) | 0 (0.0%) |
| Total | 1,919 (93.3%) | 138 (6.7%) |
Income Below Poverty Among Single-Parent Households in Haysville
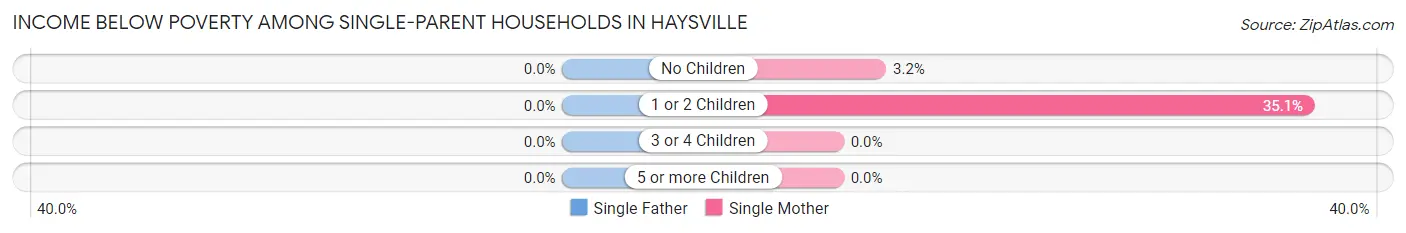
| Children | Single Father | Single Mother |
| No Children | 0 (0.0%) | 10 (3.2%) |
| 1 or 2 Children | 0 (0.0%) | 92 (35.1%) |
| 3 or 4 Children | 0 (0.0%) | 0 (0.0%) |
| 5 or more Children | 0 (0.0%) | 0 (0.0%) |
| Total | 0 (0.0%) | 102 (17.3%) |
Income Below Poverty Among Married-Couple vs Single-Parent Households in Haysville
The poverty data for Haysville shows that 138 of the married-couple family households (6.7%) and 102 of the single-parent households (13.0%) are living below the poverty level. Within the married-couple family households, those with 1 or 2 children have the highest poverty rate, with 47 households (12.5%) falling below the poverty line. Among the single-parent households, those with 1 or 2 children have the highest poverty rate, with 92 household (21.7%) living below poverty.
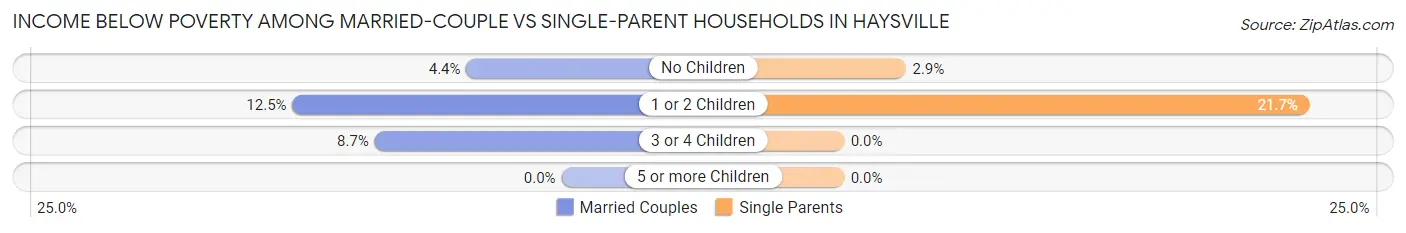
| Children | Married-Couple Families | Single-Parent Households |
| No Children | 55 (4.4%) | 10 (2.9%) |
| 1 or 2 Children | 47 (12.5%) | 92 (21.7%) |
| 3 or 4 Children | 36 (8.7%) | 0 (0.0%) |
| 5 or more Children | 0 (0.0%) | 0 (0.0%) |
| Total | 138 (6.7%) | 102 (13.0%) |
Race in Haysville
The most populous races in Haysville are White / Caucasian (9,631 | 88.4%), Hispanic or Latino (778 | 7.1%), and Two or more Races (685 | 6.3%).
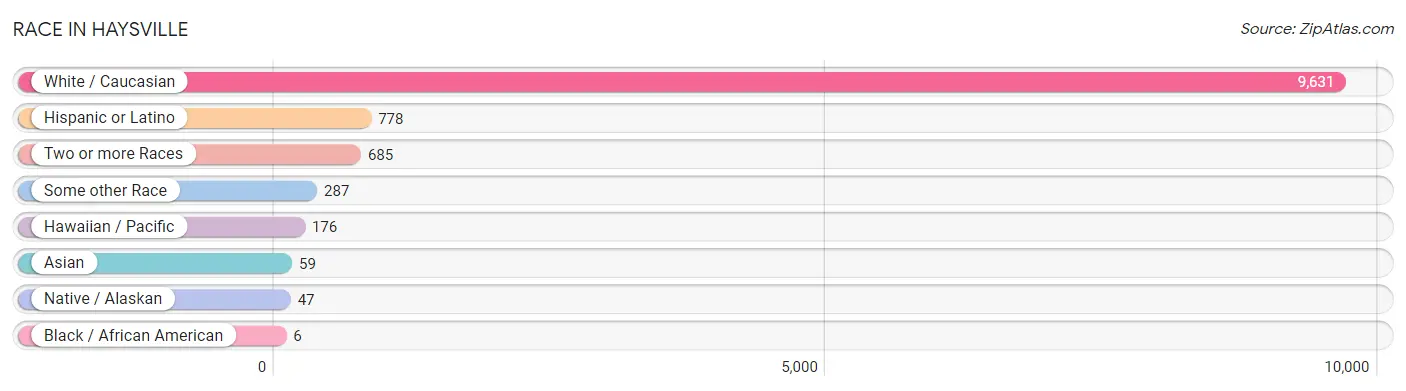
| Race | # Population | % Population |
| Asian | 59 | 0.5% |
| Black / African American | 6 | 0.1% |
| Hawaiian / Pacific | 176 | 1.6% |
| Hispanic or Latino | 778 | 7.1% |
| Native / Alaskan | 47 | 0.4% |
| White / Caucasian | 9,631 | 88.4% |
| Two or more Races | 685 | 6.3% |
| Some other Race | 287 | 2.6% |
| Total | 10,891 | 100.0% |
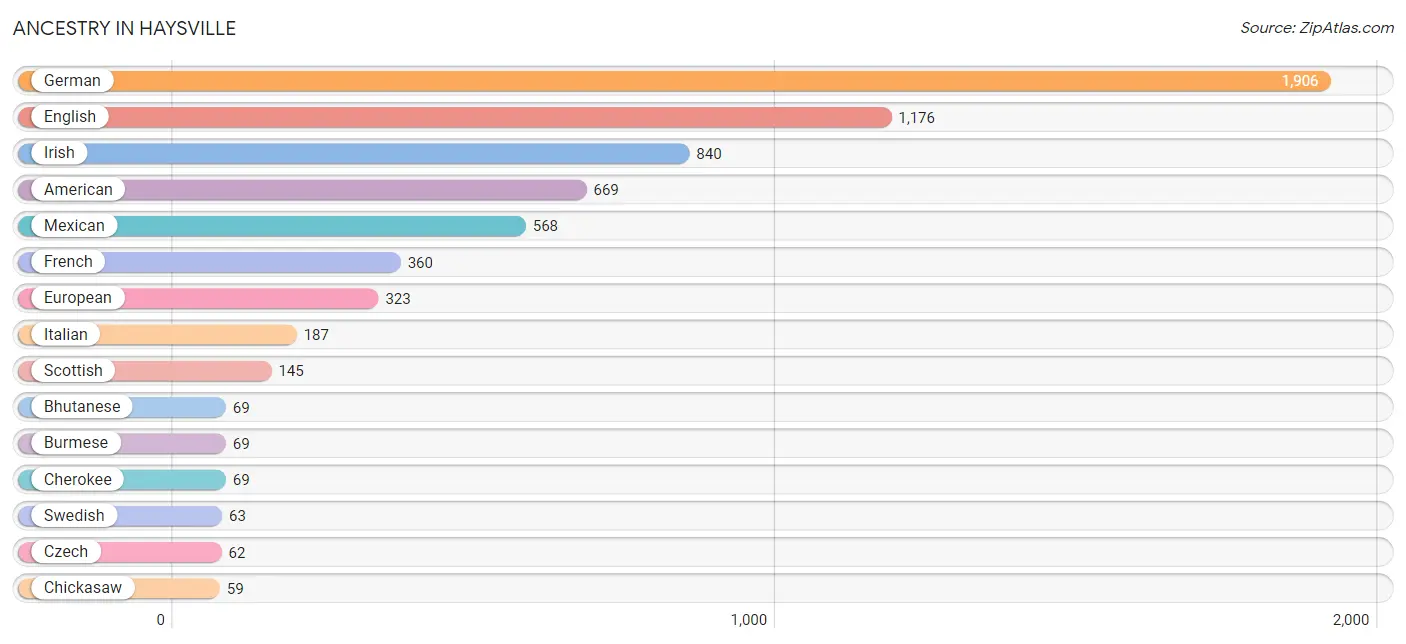
Ancestry in Haysville
The most populous ancestries reported in Haysville are German (1,906 | 17.5%), English (1,176 | 10.8%), Irish (840 | 7.7%), American (669 | 6.1%), and Mexican (568 | 5.2%), together accounting for 47.4% of all Haysville residents.
| Ancestry | # Population | % Population |
| American | 669 | 6.1% |
| Apache | 26 | 0.2% |
| Arab | 22 | 0.2% |
| Austrian | 9 | 0.1% |
| Bangladeshi | 13 | 0.1% |
| Bhutanese | 69 | 0.6% |
| Blackfeet | 2 | 0.0% |
| British | 22 | 0.2% |
| Burmese | 69 | 0.6% |
| Central American | 20 | 0.2% |
| Cherokee | 69 | 0.6% |
| Chickasaw | 59 | 0.5% |
| Choctaw | 4 | 0.0% |
| Cuban | 23 | 0.2% |
| Czech | 62 | 0.6% |
| Czechoslovakian | 20 | 0.2% |
| Delaware | 1 | 0.0% |
| Dutch | 30 | 0.3% |
| English | 1,176 | 10.8% |
| European | 323 | 3.0% |
| French | 360 | 3.3% |
| French Canadian | 37 | 0.3% |
| German | 1,906 | 17.5% |
| Hungarian | 9 | 0.1% |
| Indian (Asian) | 23 | 0.2% |
| Irish | 840 | 7.7% |
| Iroquois | 19 | 0.2% |
| Italian | 187 | 1.7% |
| Japanese | 35 | 0.3% |
| Korean | 38 | 0.4% |
| Lebanese | 22 | 0.2% |
| Malaysian | 6 | 0.1% |
| Mexican | 568 | 5.2% |
| Northern European | 19 | 0.2% |
| Norwegian | 48 | 0.4% |
| Panamanian | 20 | 0.2% |
| Polish | 48 | 0.4% |
| Potawatomi | 37 | 0.3% |
| Pueblo | 6 | 0.1% |
| Scandinavian | 4 | 0.0% |
| Scotch-Irish | 21 | 0.2% |
| Scottish | 145 | 1.3% |
| Seminole | 14 | 0.1% |
| Spaniard | 59 | 0.5% |
| Spanish | 7 | 0.1% |
| Sri Lankan | 30 | 0.3% |
| Swedish | 63 | 0.6% |
| Swiss | 29 | 0.3% |
| Welsh | 19 | 0.2% |
| Yugoslavian | 22 | 0.2% | View All 50 Rows |
Immigrants in Haysville
The most numerous immigrant groups reported in Haysville came from Micronesia (104 | 0.9%), Oceania (104 | 0.9%), Central America (56 | 0.5%), Latin America (56 | 0.5%), and Mexico (56 | 0.5%), together accounting for 3.4% of all Haysville residents.
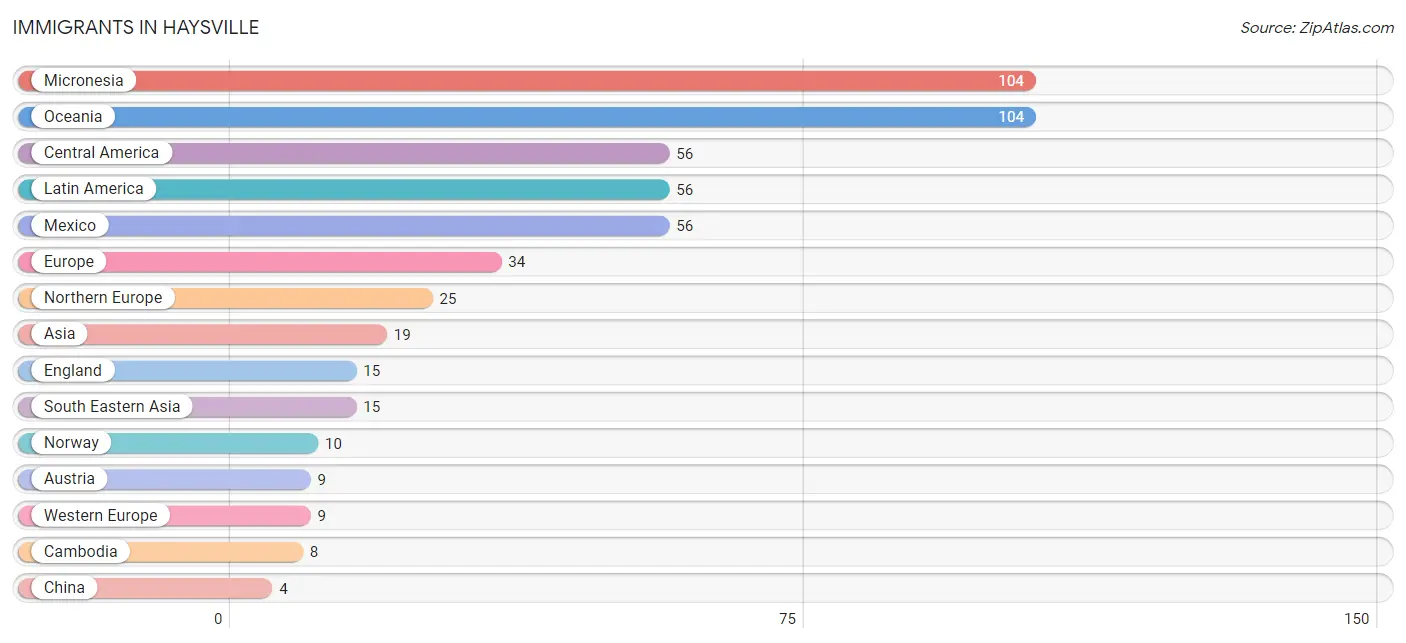
| Immigration Origin | # Population | % Population |
| Asia | 19 | 0.2% |
| Austria | 9 | 0.1% |
| Cambodia | 8 | 0.1% |
| Central America | 56 | 0.5% |
| China | 4 | 0.0% |
| Eastern Asia | 4 | 0.0% |
| England | 15 | 0.1% |
| Europe | 34 | 0.3% |
| Latin America | 56 | 0.5% |
| Mexico | 56 | 0.5% |
| Micronesia | 104 | 0.9% |
| Northern Europe | 25 | 0.2% |
| Norway | 10 | 0.1% |
| Oceania | 104 | 0.9% |
| Philippines | 4 | 0.0% |
| South Eastern Asia | 15 | 0.1% |
| Vietnam | 3 | 0.0% |
| Western Europe | 9 | 0.1% | View All 18 Rows |
Sex and Age in Haysville
Sex and Age in Haysville
The most populous age groups in Haysville are 15 to 19 Years (650 | 11.7%) for men and 10 to 14 Years (632 | 11.8%) for women.
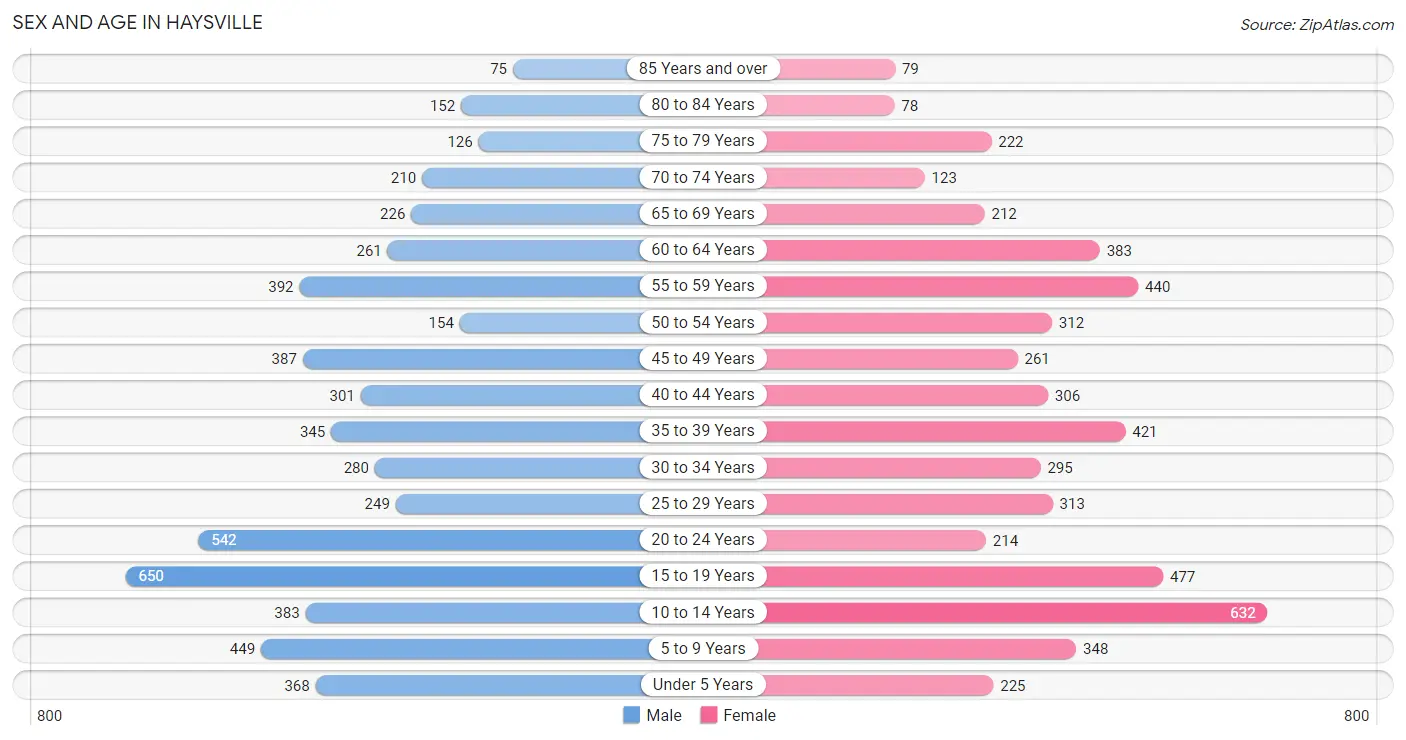
| Age Bracket | Male | Female |
| Under 5 Years | 368 (6.6%) | 225 (4.2%) |
| 5 to 9 Years | 449 (8.1%) | 348 (6.5%) |
| 10 to 14 Years | 383 (6.9%) | 632 (11.8%) |
| 15 to 19 Years | 650 (11.7%) | 477 (8.9%) |
| 20 to 24 Years | 542 (9.8%) | 214 (4.0%) |
| 25 to 29 Years | 249 (4.5%) | 313 (5.9%) |
| 30 to 34 Years | 280 (5.1%) | 295 (5.5%) |
| 35 to 39 Years | 345 (6.2%) | 421 (7.9%) |
| 40 to 44 Years | 301 (5.4%) | 306 (5.7%) |
| 45 to 49 Years | 387 (7.0%) | 261 (4.9%) |
| 50 to 54 Years | 154 (2.8%) | 312 (5.8%) |
| 55 to 59 Years | 392 (7.1%) | 440 (8.2%) |
| 60 to 64 Years | 261 (4.7%) | 383 (7.2%) |
| 65 to 69 Years | 226 (4.1%) | 212 (4.0%) |
| 70 to 74 Years | 210 (3.8%) | 123 (2.3%) |
| 75 to 79 Years | 126 (2.3%) | 222 (4.2%) |
| 80 to 84 Years | 152 (2.7%) | 78 (1.5%) |
| 85 Years and over | 75 (1.3%) | 79 (1.5%) |
| Total | 5,550 (100.0%) | 5,341 (100.0%) |
Families and Households in Haysville
Median Family Size in Haysville
The median family size in Haysville is 3.15 persons per family, with married-couple families (2,057 | 72.4%) accounting for the largest median family size of 3.34 persons per family. On the other hand, single female/mother families (588 | 20.7%) represent the smallest median family size with 2.51 persons per family.
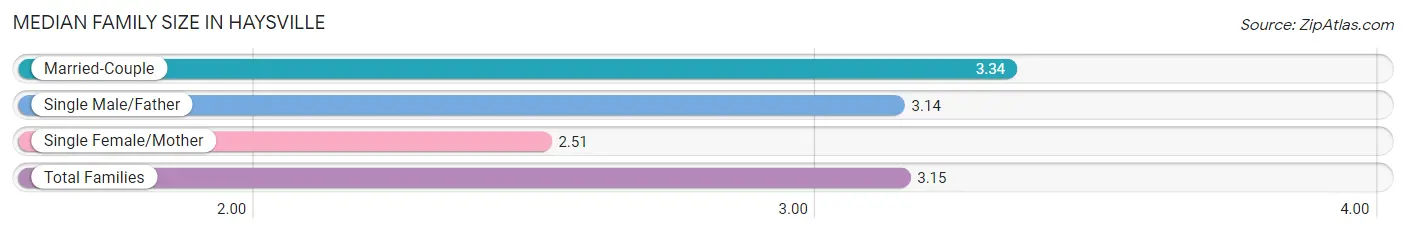
| Family Type | # Families | Family Size |
| Married-Couple | 2,057 (72.4%) | 3.34 |
| Single Male/Father | 196 (6.9%) | 3.14 |
| Single Female/Mother | 588 (20.7%) | 2.51 |
| Total Families | 2,841 (100.0%) | 3.15 |
Median Household Size in Haysville
The median household size in Haysville is 2.71 persons per household, with single male/father households (196 | 4.9%) accounting for the largest median household size of 3.5 persons per household. non-family households (1,147 | 28.8%) represent the smallest median household size with 1.15 persons per household.
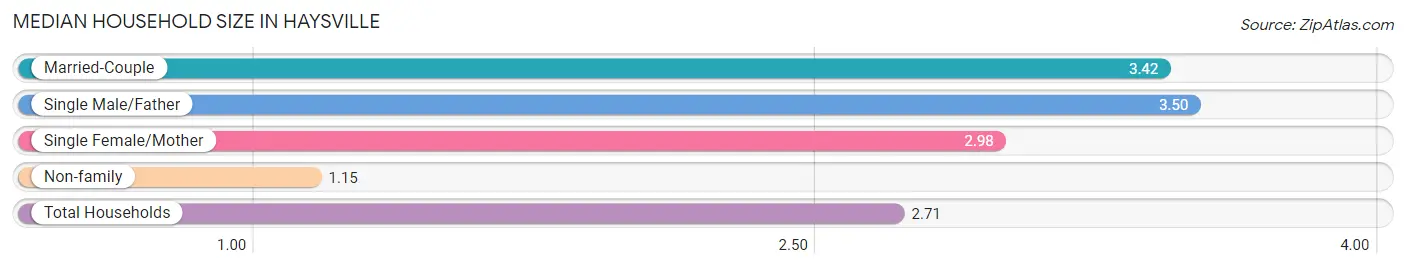
| Household Type | # Households | Household Size |
| Married-Couple | 2,057 (51.6%) | 3.42 |
| Single Male/Father | 196 (4.9%) | 3.50 |
| Single Female/Mother | 588 (14.7%) | 2.98 |
| Non-family | 1,147 (28.8%) | 1.15 |
| Total Households | 3,988 (100.0%) | 2.71 |
Household Size by Marriage Status in Haysville
Out of a total of 3,988 households in Haysville, 2,841 (71.2%) are family households, while 1,147 (28.8%) are nonfamily households. The most numerous type of family households are 2-person households, comprising 1,337, and the most common type of nonfamily households are 1-person households, comprising 1,005.
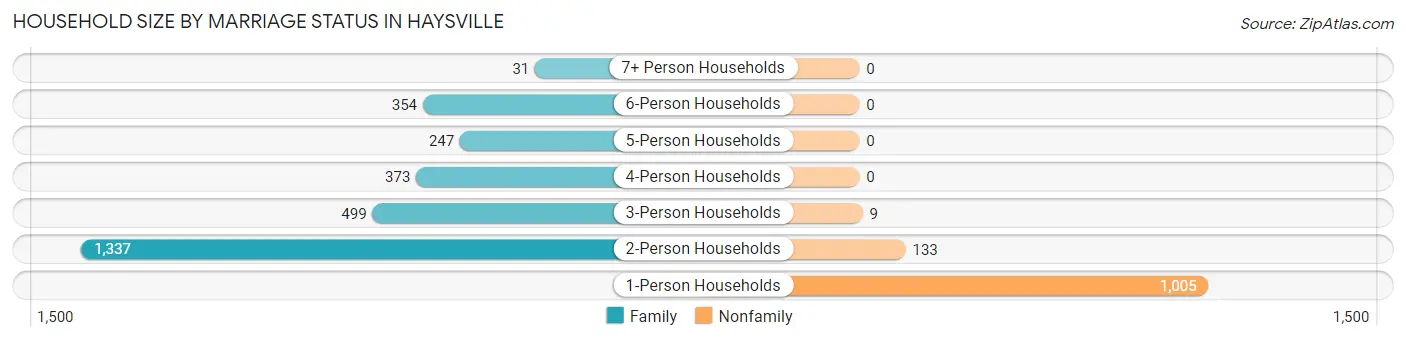
| Household Size | Family Households | Nonfamily Households |
| 1-Person Households | - | 1,005 (25.2%) |
| 2-Person Households | 1,337 (33.5%) | 133 (3.3%) |
| 3-Person Households | 499 (12.5%) | 9 (0.2%) |
| 4-Person Households | 373 (9.3%) | 0 (0.0%) |
| 5-Person Households | 247 (6.2%) | 0 (0.0%) |
| 6-Person Households | 354 (8.9%) | 0 (0.0%) |
| 7+ Person Households | 31 (0.8%) | 0 (0.0%) |
| Total | 2,841 (71.2%) | 1,147 (28.8%) |
Female Fertility in Haysville
Fertility by Age in Haysville
Average fertility rate in Haysville is 50.0 births per 1,000 women. Women in the age bracket of 20 to 34 years have the highest fertility rate with 111.0 births per 1,000 women. Women in the age bracket of 20 to 34 years acount for 77.8% of all women with births.
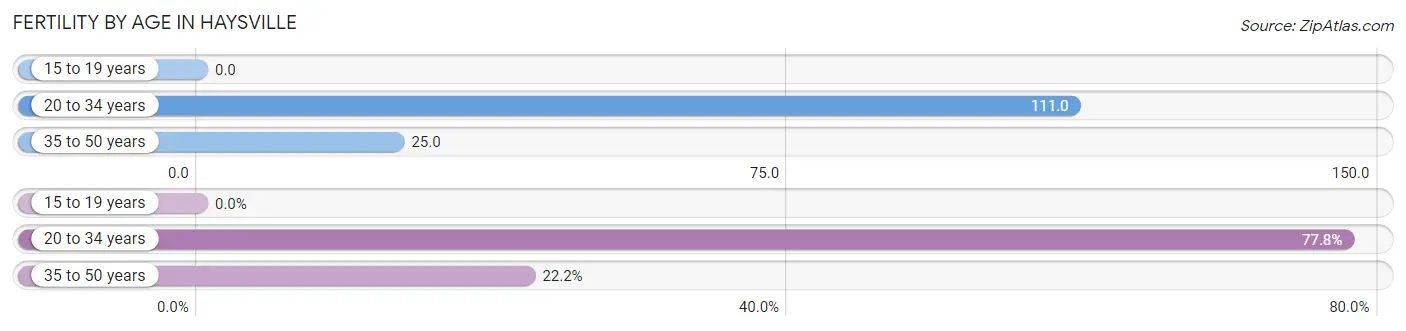
| Age Bracket | Women with Births | Births / 1,000 Women |
| 15 to 19 years | 0 (0.0%) | 0.0 |
| 20 to 34 years | 91 (77.8%) | 111.0 |
| 35 to 50 years | 26 (22.2%) | 25.0 |
| Total | 117 (100.0%) | 50.0 |
Fertility by Age by Marriage Status in Haysville
81.2% of women with births (117) in Haysville are married. The highest percentage of unmarried women with births falls into 20 to 34 years age bracket with 24.2% of them unmarried at the time of birth, while the lowest percentage of unmarried women with births belong to 35 to 50 years age bracket with 0.0% of them unmarried.
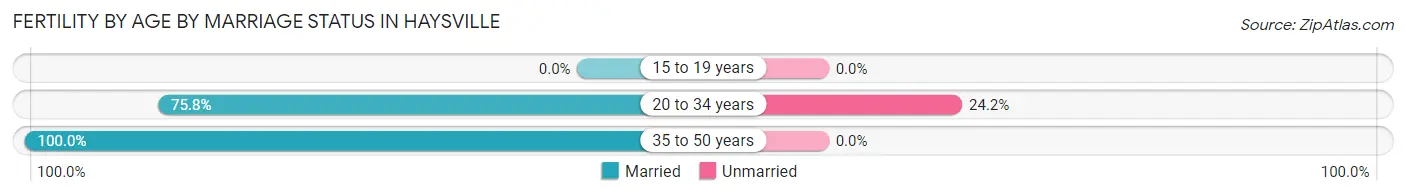
| Age Bracket | Married | Unmarried |
| 15 to 19 years | 0 (0.0%) | 0 (0.0%) |
| 20 to 34 years | 69 (75.8%) | 22 (24.2%) |
| 35 to 50 years | 26 (100.0%) | 0 (0.0%) |
| Total | 95 (81.2%) | 22 (18.8%) |
Fertility by Education in Haysville
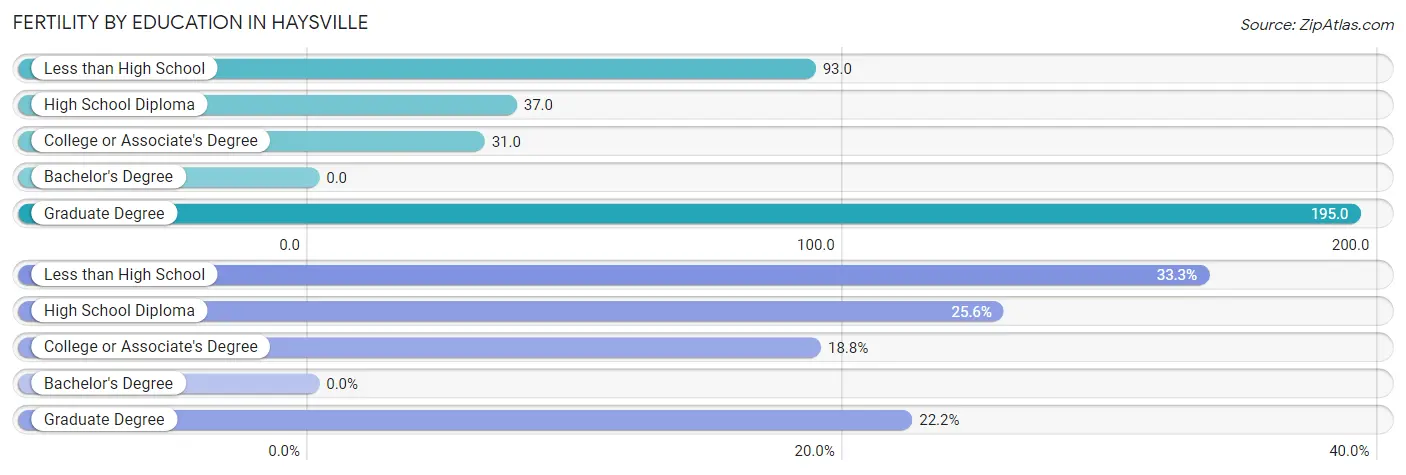
| Educational Attainment | Women with Births | Births / 1,000 Women |
| Less than High School | 39 (33.3%) | 93.0 |
| High School Diploma | 30 (25.6%) | 37.0 |
| College or Associate's Degree | 22 (18.8%) | 31.0 |
| Bachelor's Degree | 0 (0.0%) | 0.0 |
| Graduate Degree | 26 (22.2%) | 195.0 |
| Total | 117 (100.0%) | 50.0 |
Fertility by Education by Marriage Status in Haysville
18.8% of women with births in Haysville are unmarried. Women with the educational attainment of less than high school are most likely to be married with 100.0% of them married at childbirth, while women with the educational attainment of college or associate's degree are least likely to be married with 100.0% of them unmarried at childbirth.
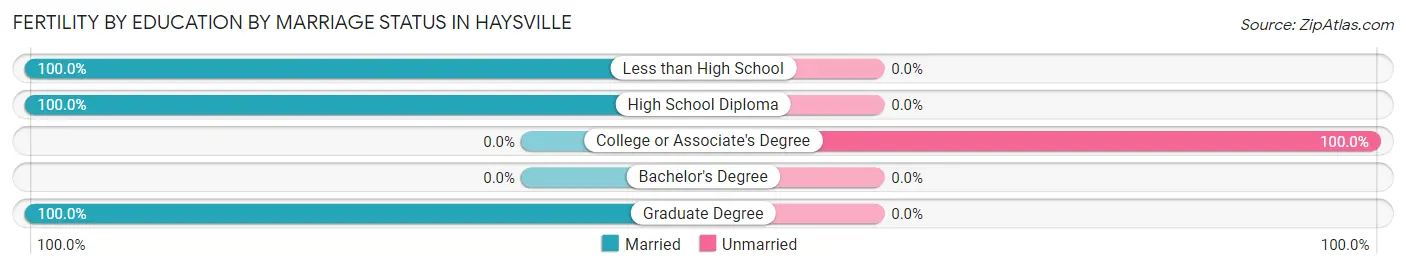
| Educational Attainment | Married | Unmarried |
| Less than High School | 39 (100.0%) | 0 (0.0%) |
| High School Diploma | 30 (100.0%) | 0 (0.0%) |
| College or Associate's Degree | 0 (0.0%) | 22 (100.0%) |
| Bachelor's Degree | 0 (0.0%) | 0 (0.0%) |
| Graduate Degree | 26 (100.0%) | 0 (0.0%) |
| Total | 95 (81.2%) | 22 (18.8%) |
Employment Characteristics in Haysville
Employment by Class of Employer in Haysville
Among the 4,927 employed individuals in Haysville, private company employees (3,784 | 76.8%), local government employees (573 | 11.6%), and not-for-profit organizations (149 | 3.0%) make up the most common classes of employment.
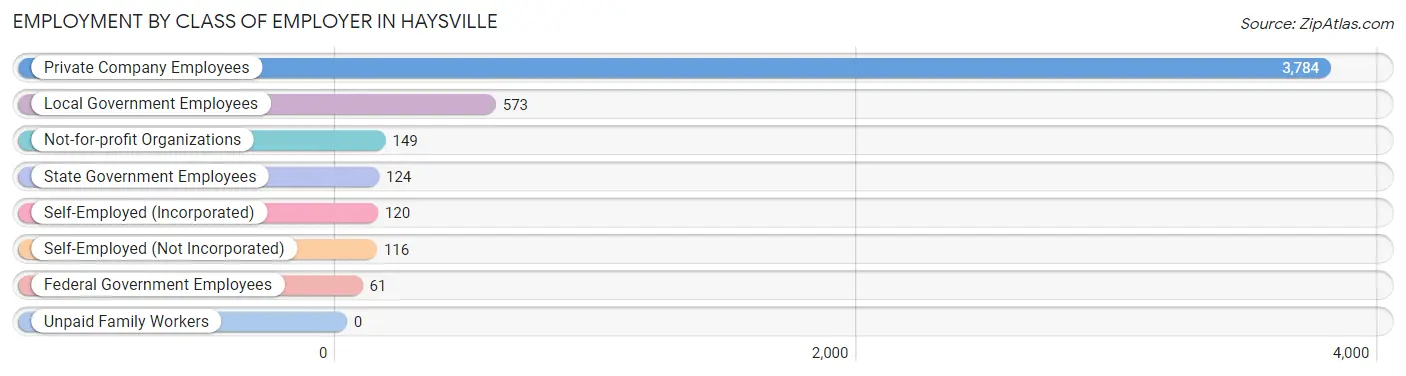
| Employer Class | # Employees | % Employees |
| Private Company Employees | 3,784 | 76.8% |
| Self-Employed (Incorporated) | 120 | 2.4% |
| Self-Employed (Not Incorporated) | 116 | 2.4% |
| Not-for-profit Organizations | 149 | 3.0% |
| Local Government Employees | 573 | 11.6% |
| State Government Employees | 124 | 2.5% |
| Federal Government Employees | 61 | 1.2% |
| Unpaid Family Workers | 0 | 0.0% |
| Total | 4,927 | 100.0% |
Employment Status by Age in Haysville
According to the labor force statistics for Haysville, out of the total population over 16 years of age (8,378), 63.2% or 5,295 individuals are in the labor force, with 5.2% or 275 of them unemployed. The age group with the highest labor force participation rate is 25 to 29 years, with 91.6% or 515 individuals in the labor force. Within the labor force, the 16 to 19 years age range has the highest percentage of unemployed individuals, with 13.3% or 50 of them being unemployed.
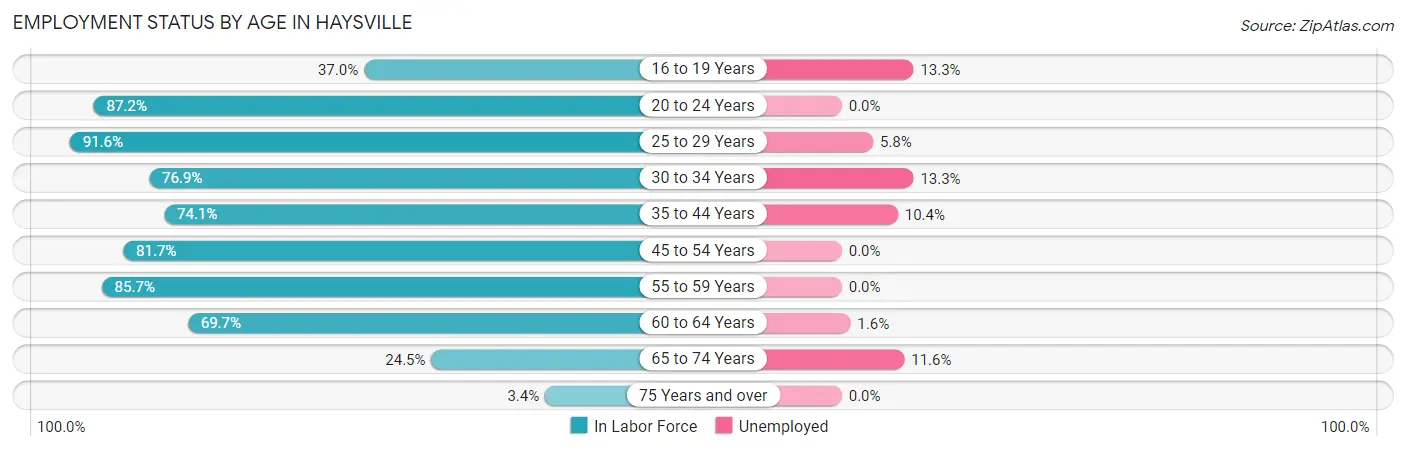
| Age Bracket | In Labor Force | Unemployed |
| 16 to 19 Years | 377 (37.0%) | 50 (13.3%) |
| 20 to 24 Years | 659 (87.2%) | 0 (0.0%) |
| 25 to 29 Years | 515 (91.6%) | 30 (5.8%) |
| 30 to 34 Years | 442 (76.9%) | 59 (13.3%) |
| 35 to 44 Years | 1,017 (74.1%) | 106 (10.4%) |
| 45 to 54 Years | 910 (81.7%) | 0 (0.0%) |
| 55 to 59 Years | 713 (85.7%) | 0 (0.0%) |
| 60 to 64 Years | 449 (69.7%) | 7 (1.6%) |
| 65 to 74 Years | 189 (24.5%) | 22 (11.6%) |
| 75 Years and over | 25 (3.4%) | 0 (0.0%) |
| Total | 5,295 (63.2%) | 275 (5.2%) |
Employment Status by Educational Attainment in Haysville
According to labor force statistics for Haysville, 79.4% of individuals (4,049) out of the total population between 25 and 64 years of age (5,100) are in the labor force, with 5.0% or 202 of them being unemployed. The group with the highest labor force participation rate are those with the educational attainment of bachelor's degree or higher, with 92.2% or 803 individuals in the labor force. Within the labor force, individuals with less than high school education have the highest percentage of unemployment, with 30.6% or 95 of them being unemployed.
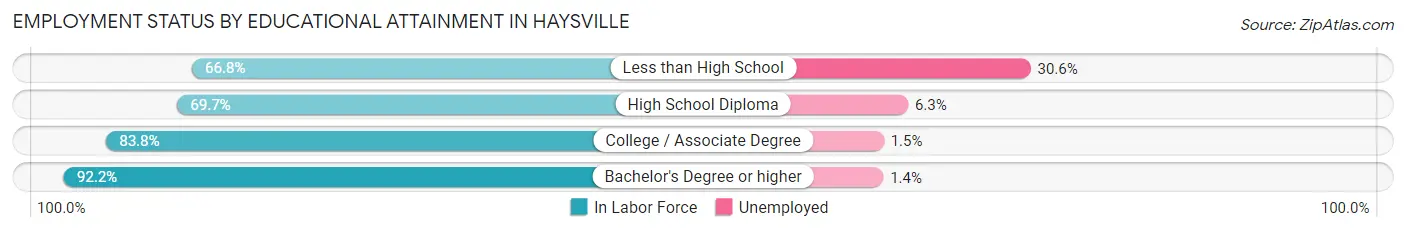
| Educational Attainment | In Labor Force | Unemployed |
| Less than High School | 310 (66.8%) | 142 (30.6%) |
| High School Diploma | 1,093 (69.7%) | 99 (6.3%) |
| College / Associate Degree | 1,841 (83.8%) | 33 (1.5%) |
| Bachelor's Degree or higher | 803 (92.2%) | 12 (1.4%) |
| Total | 4,049 (79.4%) | 255 (5.0%) |
Employment Occupations by Sex in Haysville
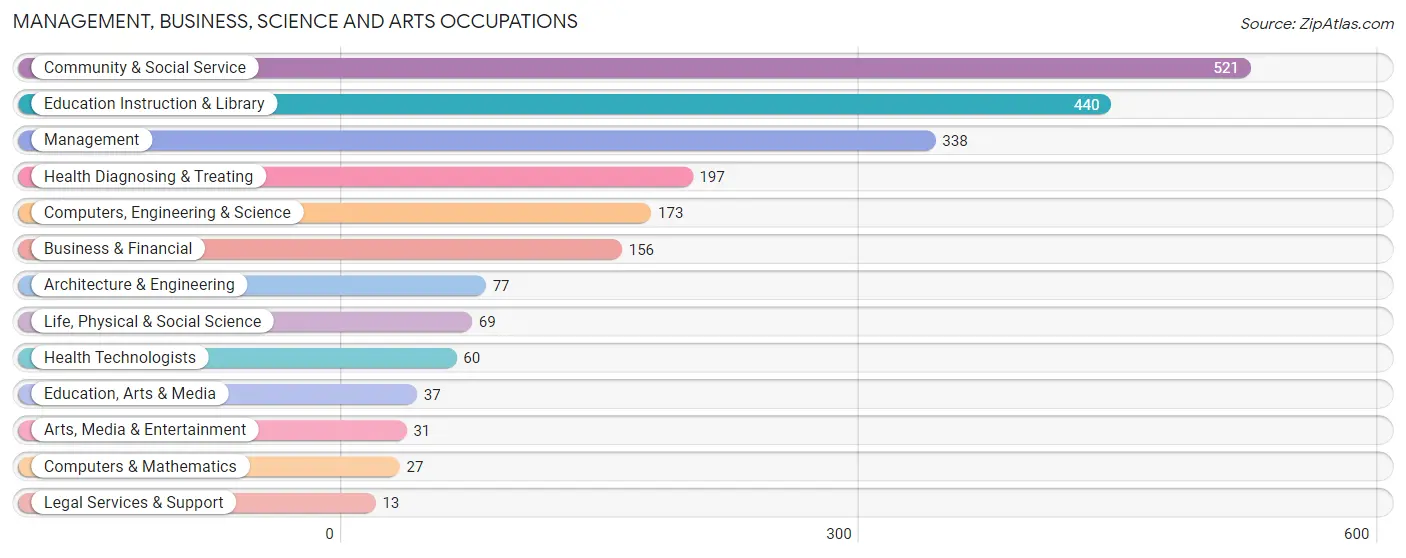
Management, Business, Science and Arts Occupations
The most common Management, Business, Science and Arts occupations in Haysville are Community & Social Service (521 | 10.4%), Education Instruction & Library (440 | 8.8%), Management (338 | 6.7%), Health Diagnosing & Treating (197 | 3.9%), and Computers, Engineering & Science (173 | 3.5%).
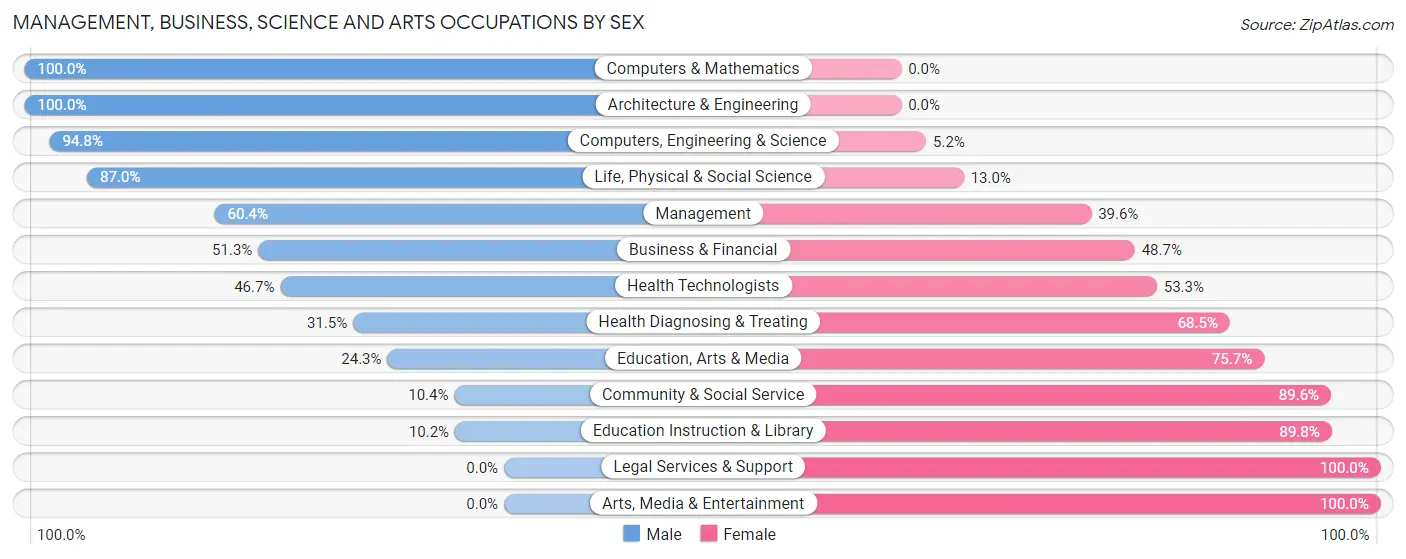
Management, Business, Science and Arts Occupations by Sex
Within the Management, Business, Science and Arts occupations in Haysville, the most male-oriented occupations are Computers & Mathematics (100.0%), Architecture & Engineering (100.0%), and Computers, Engineering & Science (94.8%), while the most female-oriented occupations are Legal Services & Support (100.0%), Arts, Media & Entertainment (100.0%), and Education Instruction & Library (89.8%).
| Occupation | Male | Female |
| Management | 204 (60.4%) | 134 (39.6%) |
| Business & Financial | 80 (51.3%) | 76 (48.7%) |
| Computers, Engineering & Science | 164 (94.8%) | 9 (5.2%) |
| Computers & Mathematics | 27 (100.0%) | 0 (0.0%) |
| Architecture & Engineering | 77 (100.0%) | 0 (0.0%) |
| Life, Physical & Social Science | 60 (87.0%) | 9 (13.0%) |
| Community & Social Service | 54 (10.4%) | 467 (89.6%) |
| Education, Arts & Media | 9 (24.3%) | 28 (75.7%) |
| Legal Services & Support | 0 (0.0%) | 13 (100.0%) |
| Education Instruction & Library | 45 (10.2%) | 395 (89.8%) |
| Arts, Media & Entertainment | 0 (0.0%) | 31 (100.0%) |
| Health Diagnosing & Treating | 62 (31.5%) | 135 (68.5%) |
| Health Technologists | 28 (46.7%) | 32 (53.3%) |
| Total (Category) | 564 (40.7%) | 821 (59.3%) |
| Total (Overall) | 2,887 (57.5%) | 2,130 (42.5%) |
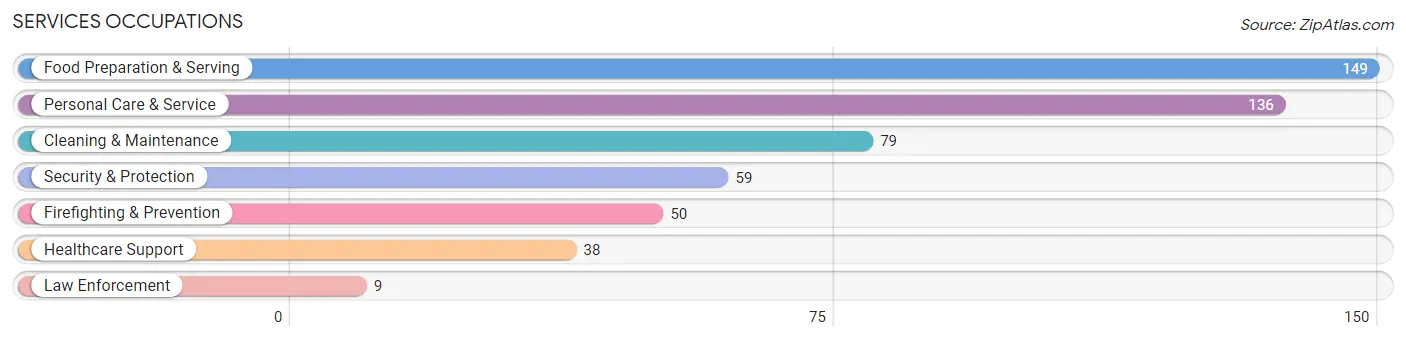
Services Occupations
The most common Services occupations in Haysville are Food Preparation & Serving (149 | 3.0%), Personal Care & Service (136 | 2.7%), Cleaning & Maintenance (79 | 1.6%), Security & Protection (59 | 1.2%), and Firefighting & Prevention (50 | 1.0%).
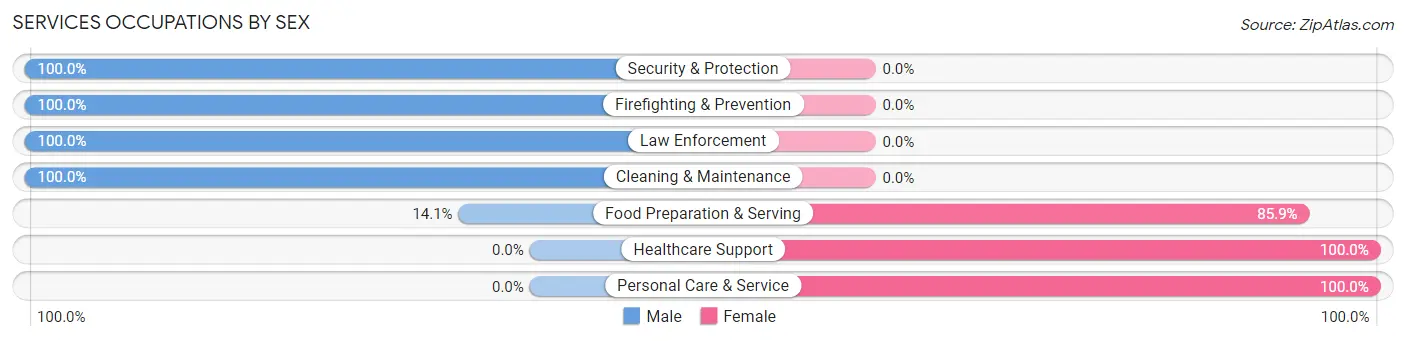
Services Occupations by Sex
Within the Services occupations in Haysville, the most male-oriented occupations are Security & Protection (100.0%), Firefighting & Prevention (100.0%), and Law Enforcement (100.0%), while the most female-oriented occupations are Healthcare Support (100.0%), Personal Care & Service (100.0%), and Food Preparation & Serving (85.9%).
| Occupation | Male | Female |
| Healthcare Support | 0 (0.0%) | 38 (100.0%) |
| Security & Protection | 59 (100.0%) | 0 (0.0%) |
| Firefighting & Prevention | 50 (100.0%) | 0 (0.0%) |
| Law Enforcement | 9 (100.0%) | 0 (0.0%) |
| Food Preparation & Serving | 21 (14.1%) | 128 (85.9%) |
| Cleaning & Maintenance | 79 (100.0%) | 0 (0.0%) |
| Personal Care & Service | 0 (0.0%) | 136 (100.0%) |
| Total (Category) | 159 (34.5%) | 302 (65.5%) |
| Total (Overall) | 2,887 (57.5%) | 2,130 (42.5%) |
Sales and Office Occupations
The most common Sales and Office occupations in Haysville are Sales & Related (488 | 9.7%), and Office & Administration (420 | 8.4%).

Sales and Office Occupations by Sex
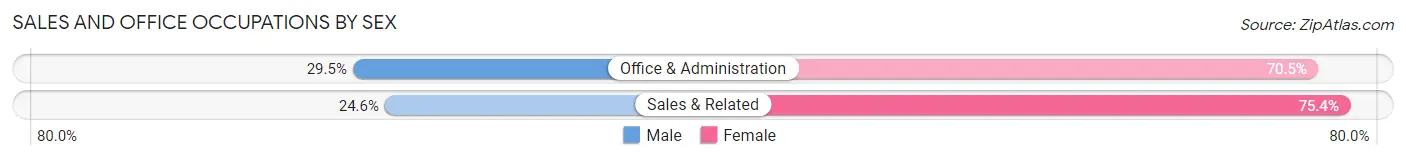
| Occupation | Male | Female |
| Sales & Related | 120 (24.6%) | 368 (75.4%) |
| Office & Administration | 124 (29.5%) | 296 (70.5%) |
| Total (Category) | 244 (26.9%) | 664 (73.1%) |
| Total (Overall) | 2,887 (57.5%) | 2,130 (42.5%) |
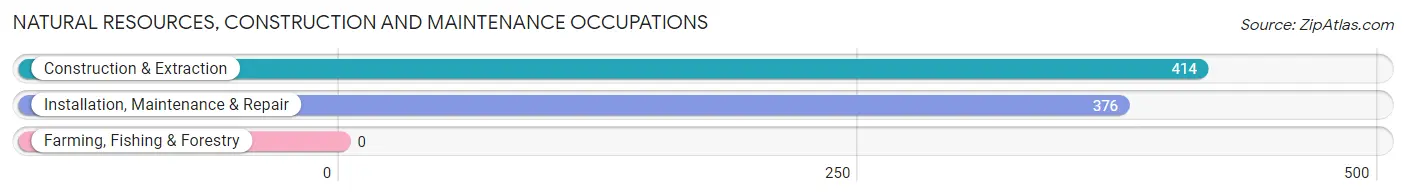
Natural Resources, Construction and Maintenance Occupations
The most common Natural Resources, Construction and Maintenance occupations in Haysville are Construction & Extraction (414 | 8.3%), and Installation, Maintenance & Repair (376 | 7.5%).
Natural Resources, Construction and Maintenance Occupations by Sex
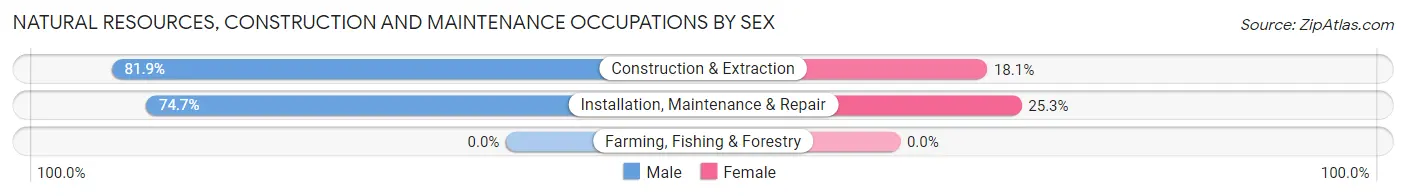
| Occupation | Male | Female |
| Farming, Fishing & Forestry | 0 (0.0%) | 0 (0.0%) |
| Construction & Extraction | 339 (81.9%) | 75 (18.1%) |
| Installation, Maintenance & Repair | 281 (74.7%) | 95 (25.3%) |
| Total (Category) | 620 (78.5%) | 170 (21.5%) |
| Total (Overall) | 2,887 (57.5%) | 2,130 (42.5%) |
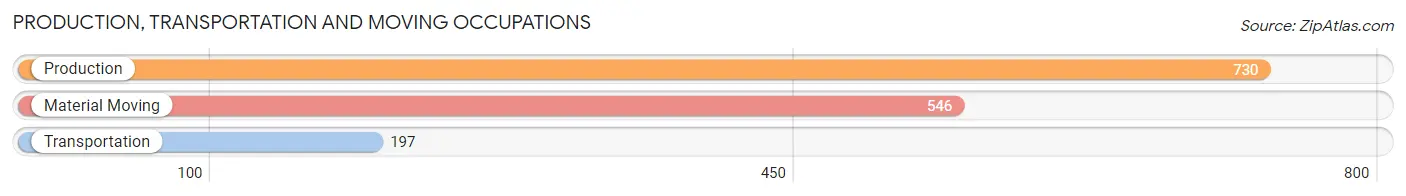
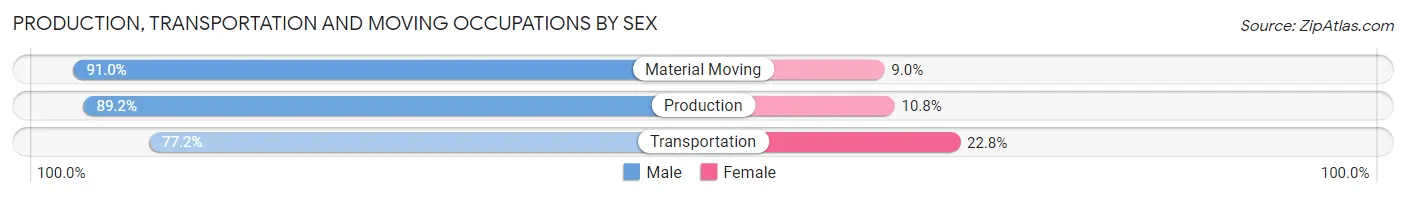
Production, Transportation and Moving Occupations
The most common Production, Transportation and Moving occupations in Haysville are Production (730 | 14.5%), Material Moving (546 | 10.9%), and Transportation (197 | 3.9%).
Production, Transportation and Moving Occupations by Sex
| Occupation | Male | Female |
| Production | 651 (89.2%) | 79 (10.8%) |
| Transportation | 152 (77.2%) | 45 (22.8%) |
| Material Moving | 497 (91.0%) | 49 (9.0%) |
| Total (Category) | 1,300 (88.3%) | 173 (11.7%) |
| Total (Overall) | 2,887 (57.5%) | 2,130 (42.5%) |
Employment Industries by Sex in Haysville
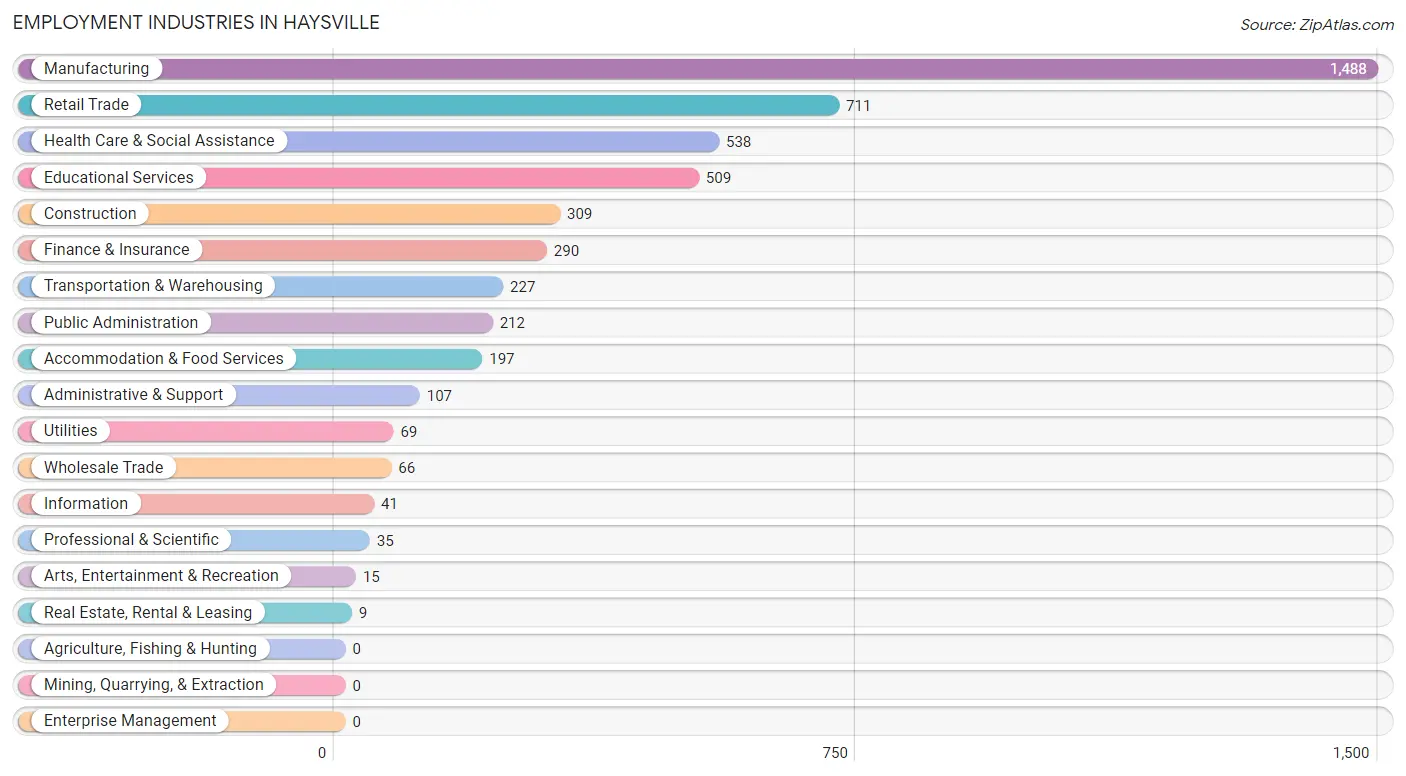
Employment Industries in Haysville
The major employment industries in Haysville include Manufacturing (1,488 | 29.7%), Retail Trade (711 | 14.2%), Health Care & Social Assistance (538 | 10.7%), Educational Services (509 | 10.2%), and Construction (309 | 6.2%).
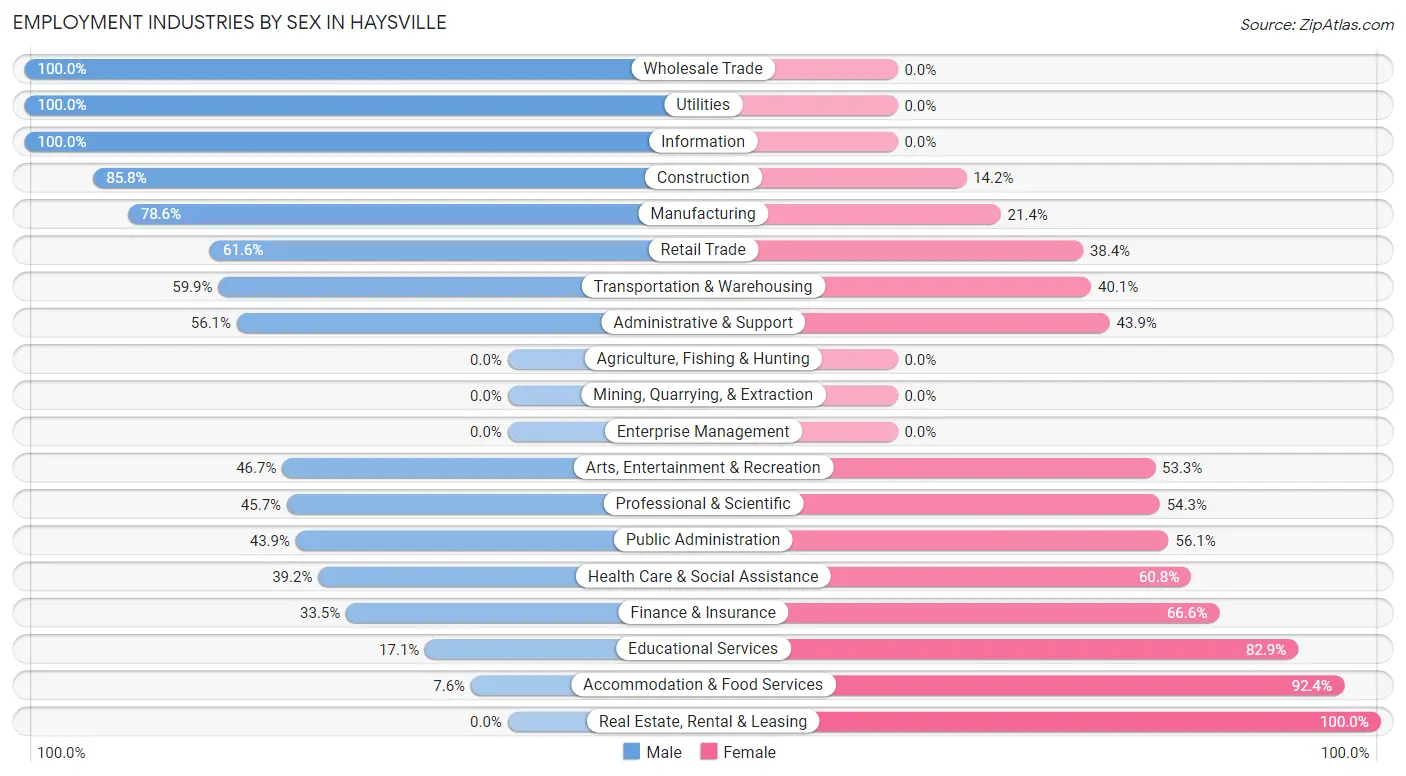
Employment Industries by Sex in Haysville
The Haysville industries that see more men than women are Wholesale Trade (100.0%), Utilities (100.0%), and Information (100.0%), whereas the industries that tend to have a higher number of women are Real Estate, Rental & Leasing (100.0%), Accommodation & Food Services (92.4%), and Educational Services (82.9%).
| Industry | Male | Female |
| Agriculture, Fishing & Hunting | 0 (0.0%) | 0 (0.0%) |
| Mining, Quarrying, & Extraction | 0 (0.0%) | 0 (0.0%) |
| Construction | 265 (85.8%) | 44 (14.2%) |
| Manufacturing | 1,170 (78.6%) | 318 (21.4%) |
| Wholesale Trade | 66 (100.0%) | 0 (0.0%) |
| Retail Trade | 438 (61.6%) | 273 (38.4%) |
| Transportation & Warehousing | 136 (59.9%) | 91 (40.1%) |
| Utilities | 69 (100.0%) | 0 (0.0%) |
| Information | 41 (100.0%) | 0 (0.0%) |
| Finance & Insurance | 97 (33.5%) | 193 (66.5%) |
| Real Estate, Rental & Leasing | 0 (0.0%) | 9 (100.0%) |
| Professional & Scientific | 16 (45.7%) | 19 (54.3%) |
| Enterprise Management | 0 (0.0%) | 0 (0.0%) |
| Administrative & Support | 60 (56.1%) | 47 (43.9%) |
| Educational Services | 87 (17.1%) | 422 (82.9%) |
| Health Care & Social Assistance | 211 (39.2%) | 327 (60.8%) |
| Arts, Entertainment & Recreation | 7 (46.7%) | 8 (53.3%) |
| Accommodation & Food Services | 15 (7.6%) | 182 (92.4%) |
| Public Administration | 93 (43.9%) | 119 (56.1%) |
| Total | 2,887 (57.5%) | 2,130 (42.5%) |
Education in Haysville
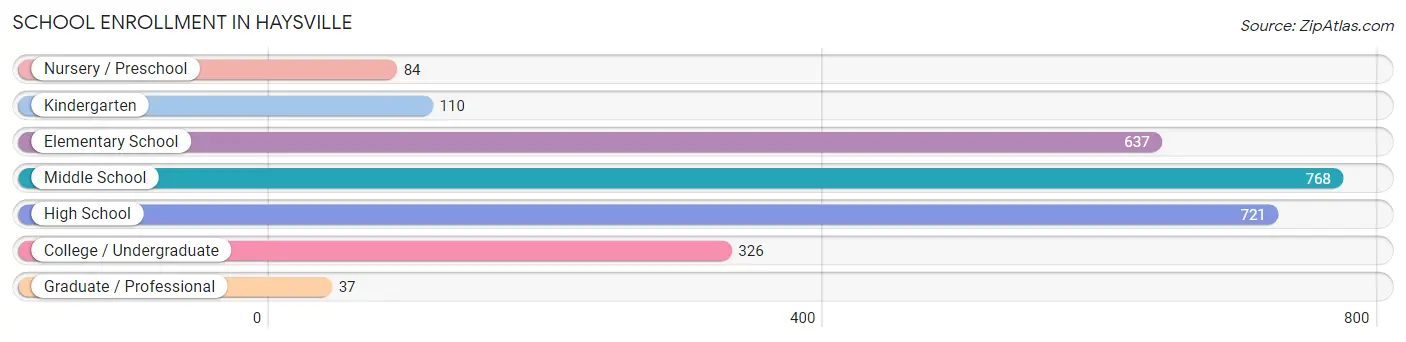
School Enrollment in Haysville
The most common levels of schooling among the 2,683 students in Haysville are middle school (768 | 28.6%), high school (721 | 26.9%), and elementary school (637 | 23.7%).
| School Level | # Students | % Students |
| Nursery / Preschool | 84 | 3.1% |
| Kindergarten | 110 | 4.1% |
| Elementary School | 637 | 23.7% |
| Middle School | 768 | 28.6% |
| High School | 721 | 26.9% |
| College / Undergraduate | 326 | 12.1% |
| Graduate / Professional | 37 | 1.4% |
| Total | 2,683 | 100.0% |
School Enrollment by Age by Funding Source in Haysville
Out of a total of 2,683 students who are enrolled in schools in Haysville, 142 (5.3%) attend a private institution, while the remaining 2,541 (94.7%) are enrolled in public schools. The age group of 25 to 34 year olds has the highest likelihood of being enrolled in private schools, with 23 (24.0% in the age bracket) enrolled. Conversely, the age group of 3 to 4 year olds has the lowest likelihood of being enrolled in a private school, with 31 (100.0% in the age bracket) attending a public institution.
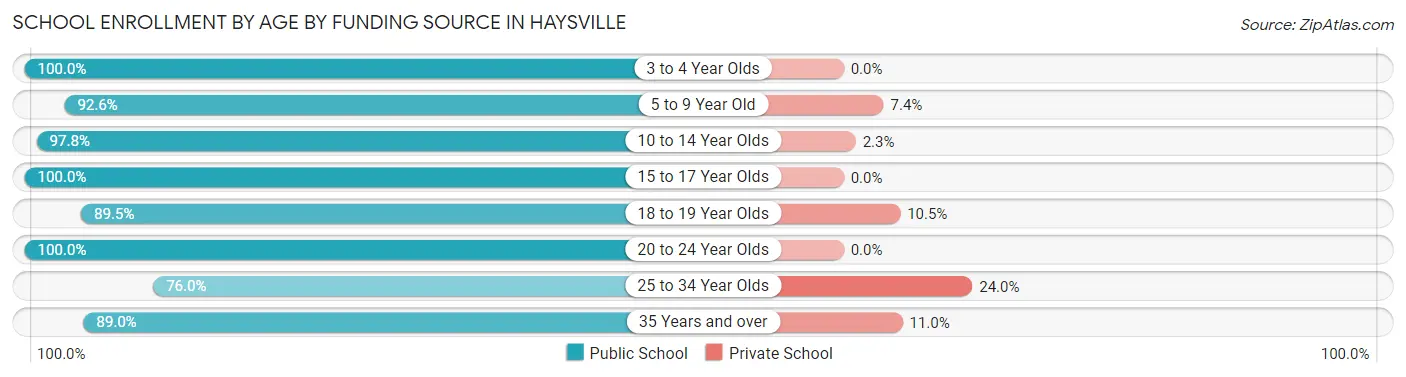
| Age Bracket | Public School | Private School |
| 3 to 4 Year Olds | 31 (100.0%) | 0 (0.0%) |
| 5 to 9 Year Old | 673 (92.6%) | 54 (7.4%) |
| 10 to 14 Year Olds | 956 (97.8%) | 22 (2.2%) |
| 15 to 17 Year Olds | 386 (100.0%) | 0 (0.0%) |
| 18 to 19 Year Olds | 238 (89.5%) | 28 (10.5%) |
| 20 to 24 Year Olds | 53 (100.0%) | 0 (0.0%) |
| 25 to 34 Year Olds | 73 (76.0%) | 23 (24.0%) |
| 35 Years and over | 130 (89.0%) | 16 (11.0%) |
| Total | 2,541 (94.7%) | 142 (5.3%) |
Educational Attainment by Field of Study in Haysville
Education (405 | 31.9%), business (237 | 18.7%), liberal arts & history (158 | 12.4%), psychology (155 | 12.2%), and science & technology (60 | 4.7%) are the most common fields of study among 1,270 individuals in Haysville who have obtained a bachelor's degree or higher.
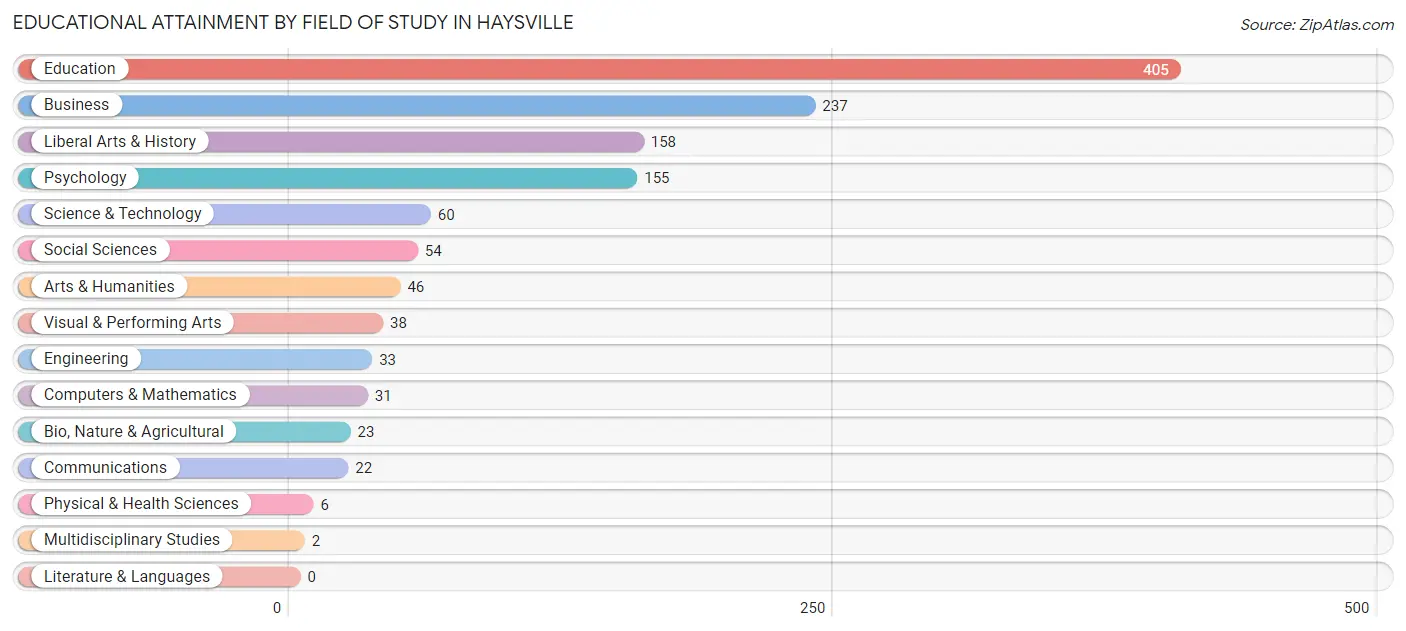
| Field of Study | # Graduates | % Graduates |
| Computers & Mathematics | 31 | 2.4% |
| Bio, Nature & Agricultural | 23 | 1.8% |
| Physical & Health Sciences | 6 | 0.5% |
| Psychology | 155 | 12.2% |
| Social Sciences | 54 | 4.3% |
| Engineering | 33 | 2.6% |
| Multidisciplinary Studies | 2 | 0.2% |
| Science & Technology | 60 | 4.7% |
| Business | 237 | 18.7% |
| Education | 405 | 31.9% |
| Literature & Languages | 0 | 0.0% |
| Liberal Arts & History | 158 | 12.4% |
| Visual & Performing Arts | 38 | 3.0% |
| Communications | 22 | 1.7% |
| Arts & Humanities | 46 | 3.6% |
| Total | 1,270 | 100.0% |
Transportation & Commute in Haysville
Vehicle Availability by Sex in Haysville
The most prevalent vehicle ownership categories in Haysville are males with 2 vehicles (1,103, accounting for 38.2%) and females with 2 vehicles (755, making up 54.2%).
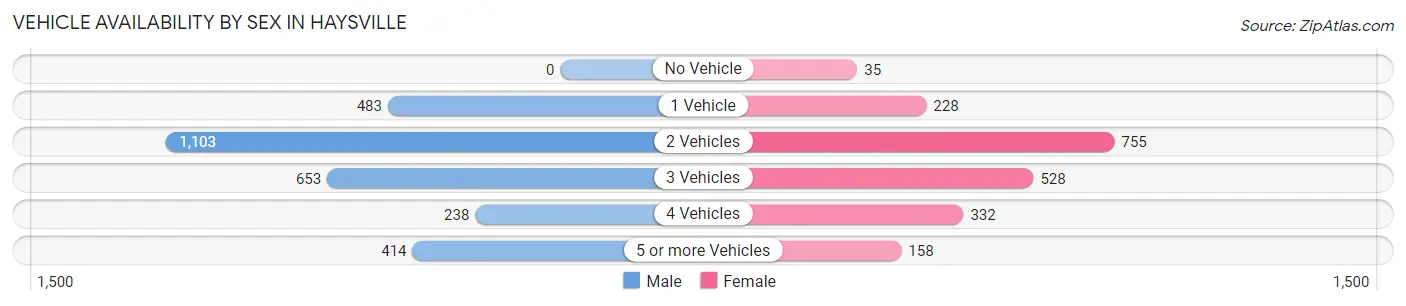
| Vehicles Available | Male | Female |
| No Vehicle | 0 (0.0%) | 35 (1.7%) |
| 1 Vehicle | 483 (16.7%) | 228 (11.2%) |
| 2 Vehicles | 1,103 (38.2%) | 755 (37.1%) |
| 3 Vehicles | 653 (22.6%) | 528 (25.9%) |
| 4 Vehicles | 238 (8.2%) | 332 (16.3%) |
| 5 or more Vehicles | 414 (14.3%) | 158 (7.8%) |
| Total | 2,891 (100.0%) | 2,036 (100.0%) |
Commute Time in Haysville
The most frequently occuring commute durations in Haysville are 20 to 24 minutes (1,191 commuters, 24.7%), 15 to 19 minutes (849 commuters, 17.6%), and 25 to 29 minutes (817 commuters, 16.9%).
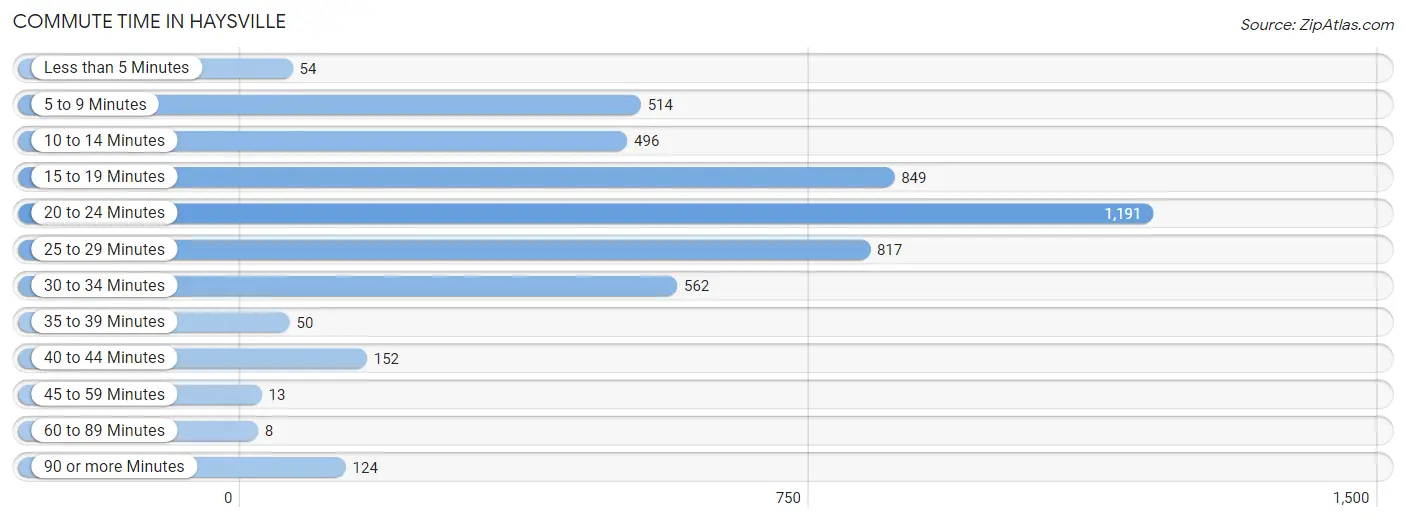
| Commute Time | # Commuters | % Commuters |
| Less than 5 Minutes | 54 | 1.1% |
| 5 to 9 Minutes | 514 | 10.6% |
| 10 to 14 Minutes | 496 | 10.3% |
| 15 to 19 Minutes | 849 | 17.6% |
| 20 to 24 Minutes | 1,191 | 24.7% |
| 25 to 29 Minutes | 817 | 16.9% |
| 30 to 34 Minutes | 562 | 11.6% |
| 35 to 39 Minutes | 50 | 1.0% |
| 40 to 44 Minutes | 152 | 3.2% |
| 45 to 59 Minutes | 13 | 0.3% |
| 60 to 89 Minutes | 8 | 0.2% |
| 90 or more Minutes | 124 | 2.6% |
Commute Time by Sex in Haysville
The most common commute times in Haysville are 20 to 24 minutes (873 commuters, 30.2%) for males and 15 to 19 minutes (426 commuters, 22.0%) for females.
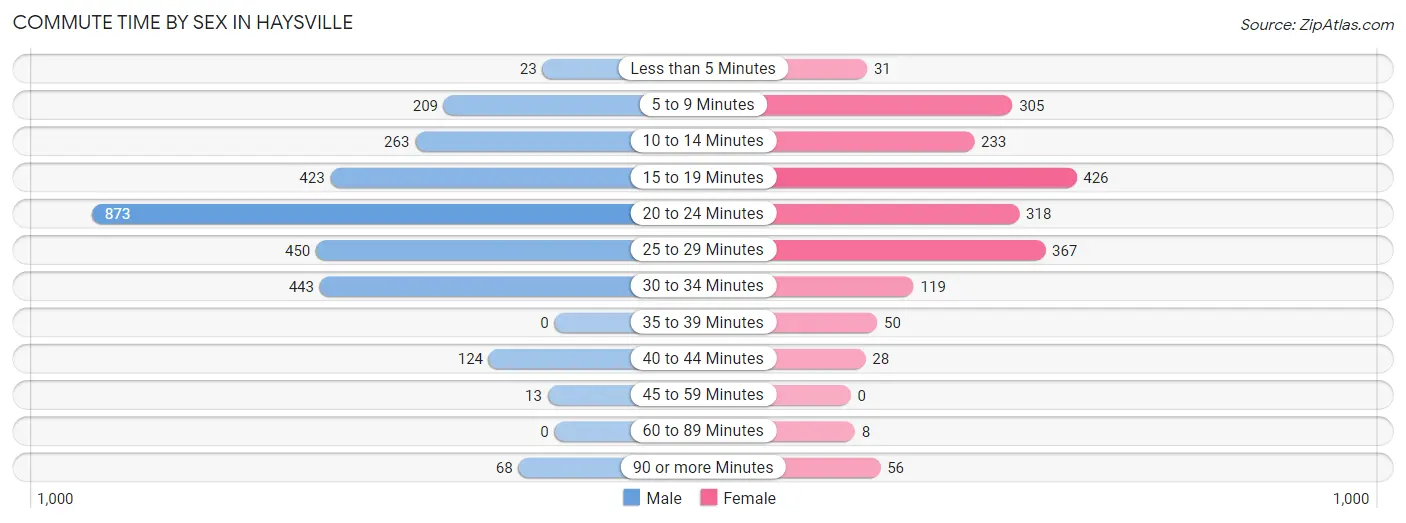
| Commute Time | Male | Female |
| Less than 5 Minutes | 23 (0.8%) | 31 (1.6%) |
| 5 to 9 Minutes | 209 (7.2%) | 305 (15.7%) |
| 10 to 14 Minutes | 263 (9.1%) | 233 (12.0%) |
| 15 to 19 Minutes | 423 (14.6%) | 426 (22.0%) |
| 20 to 24 Minutes | 873 (30.2%) | 318 (16.4%) |
| 25 to 29 Minutes | 450 (15.6%) | 367 (18.9%) |
| 30 to 34 Minutes | 443 (15.3%) | 119 (6.1%) |
| 35 to 39 Minutes | 0 (0.0%) | 50 (2.6%) |
| 40 to 44 Minutes | 124 (4.3%) | 28 (1.4%) |
| 45 to 59 Minutes | 13 (0.4%) | 0 (0.0%) |
| 60 to 89 Minutes | 0 (0.0%) | 8 (0.4%) |
| 90 or more Minutes | 68 (2.4%) | 56 (2.9%) |
Time of Departure to Work by Sex in Haysville
The most frequent times of departure to work in Haysville are 4:00 PM to 11:59 PM (458, 15.9%) for males and 7:00 AM to 7:29 AM (352, 18.1%) for females.
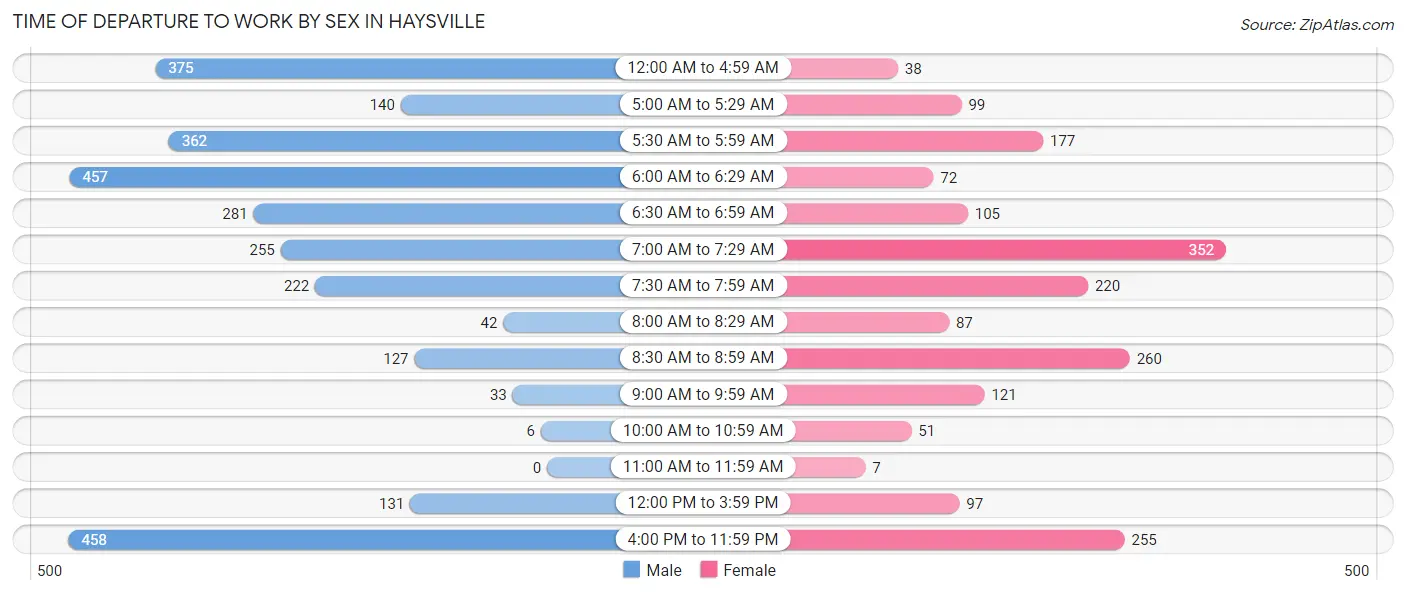
| Time of Departure | Male | Female |
| 12:00 AM to 4:59 AM | 375 (13.0%) | 38 (2.0%) |
| 5:00 AM to 5:29 AM | 140 (4.9%) | 99 (5.1%) |
| 5:30 AM to 5:59 AM | 362 (12.5%) | 177 (9.1%) |
| 6:00 AM to 6:29 AM | 457 (15.8%) | 72 (3.7%) |
| 6:30 AM to 6:59 AM | 281 (9.7%) | 105 (5.4%) |
| 7:00 AM to 7:29 AM | 255 (8.8%) | 352 (18.1%) |
| 7:30 AM to 7:59 AM | 222 (7.7%) | 220 (11.3%) |
| 8:00 AM to 8:29 AM | 42 (1.5%) | 87 (4.5%) |
| 8:30 AM to 8:59 AM | 127 (4.4%) | 260 (13.4%) |
| 9:00 AM to 9:59 AM | 33 (1.1%) | 121 (6.2%) |
| 10:00 AM to 10:59 AM | 6 (0.2%) | 51 (2.6%) |
| 11:00 AM to 11:59 AM | 0 (0.0%) | 7 (0.4%) |
| 12:00 PM to 3:59 PM | 131 (4.5%) | 97 (5.0%) |
| 4:00 PM to 11:59 PM | 458 (15.9%) | 255 (13.1%) |
| Total | 2,889 (100.0%) | 1,941 (100.0%) |
Housing Occupancy in Haysville
Occupancy by Ownership in Haysville
Of the total 3,988 dwellings in Haysville, owner-occupied units account for 3,069 (77.0%), while renter-occupied units make up 919 (23.0%).
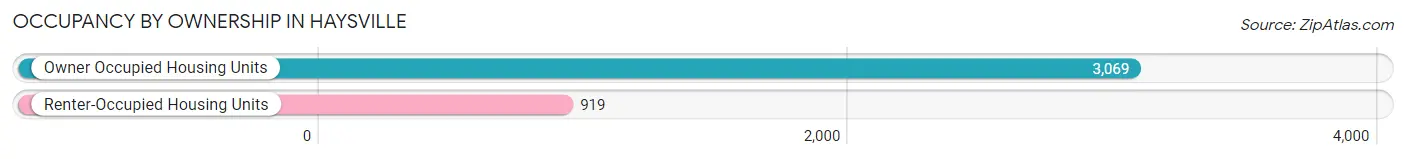
| Occupancy | # Housing Units | % Housing Units |
| Owner Occupied Housing Units | 3,069 | 77.0% |
| Renter-Occupied Housing Units | 919 | 23.0% |
| Total Occupied Housing Units | 3,988 | 100.0% |
Occupancy by Household Size in Haysville
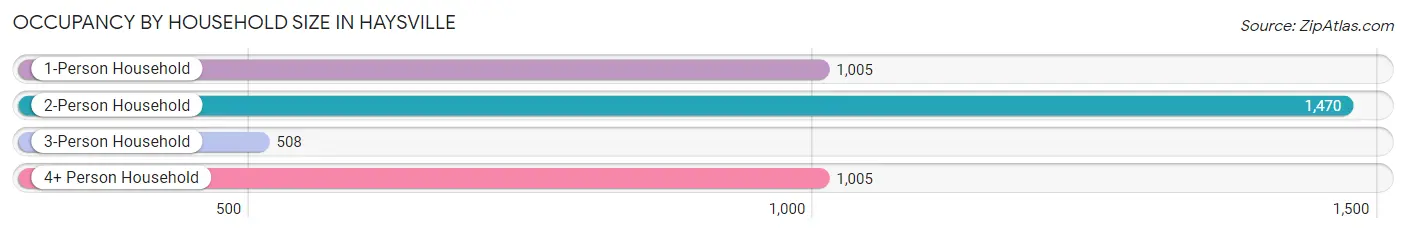
| Household Size | # Housing Units | % Housing Units |
| 1-Person Household | 1,005 | 25.2% |
| 2-Person Household | 1,470 | 36.9% |
| 3-Person Household | 508 | 12.7% |
| 4+ Person Household | 1,005 | 25.2% |
| Total Housing Units | 3,988 | 100.0% |
Occupancy by Ownership by Household Size in Haysville
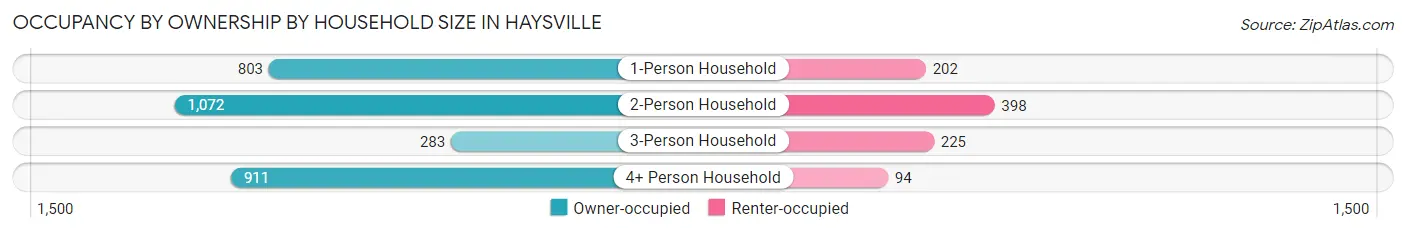
| Household Size | Owner-occupied | Renter-occupied |
| 1-Person Household | 803 (79.9%) | 202 (20.1%) |
| 2-Person Household | 1,072 (72.9%) | 398 (27.1%) |
| 3-Person Household | 283 (55.7%) | 225 (44.3%) |
| 4+ Person Household | 911 (90.6%) | 94 (9.3%) |
| Total Housing Units | 3,069 (77.0%) | 919 (23.0%) |
Occupancy by Educational Attainment in Haysville
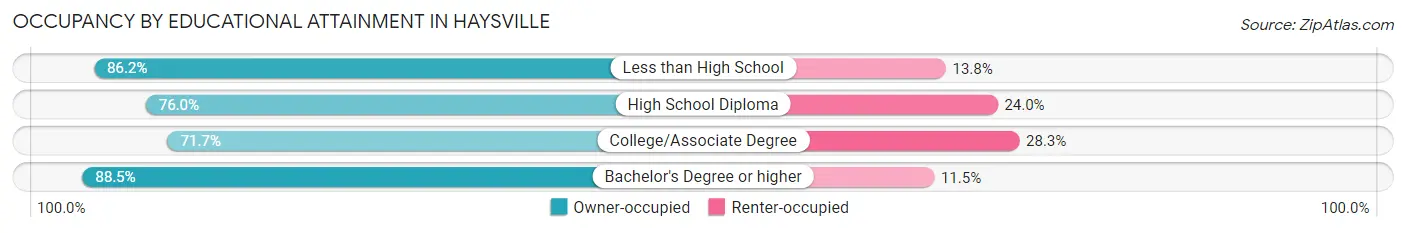
| Household Size | Owner-occupied | Renter-occupied |
| Less than High School | 282 (86.2%) | 45 (13.8%) |
| High School Diploma | 989 (76.0%) | 313 (24.0%) |
| College/Associate Degree | 1,234 (71.7%) | 488 (28.3%) |
| Bachelor's Degree or higher | 564 (88.5%) | 73 (11.5%) |
Occupancy by Age of Householder in Haysville
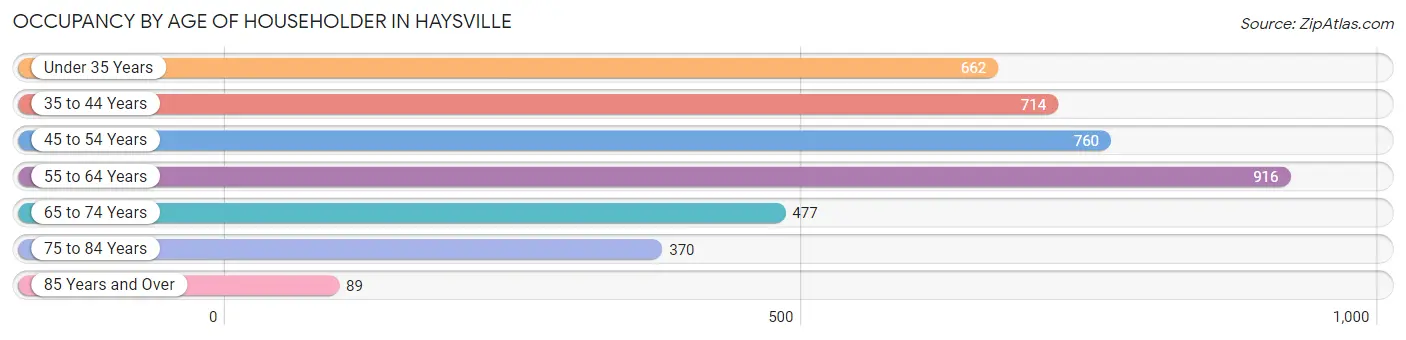
| Age Bracket | # Households | % Households |
| Under 35 Years | 662 | 16.6% |
| 35 to 44 Years | 714 | 17.9% |
| 45 to 54 Years | 760 | 19.1% |
| 55 to 64 Years | 916 | 23.0% |
| 65 to 74 Years | 477 | 12.0% |
| 75 to 84 Years | 370 | 9.3% |
| 85 Years and Over | 89 | 2.2% |
| Total | 3,988 | 100.0% |
Housing Finances in Haysville
Median Income by Occupancy in Haysville
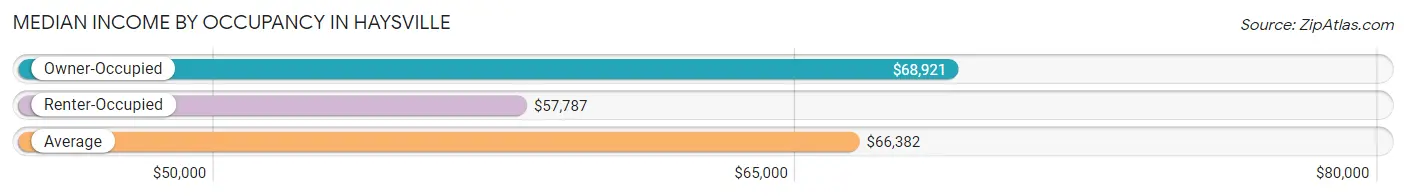
| Occupancy Type | # Households | Median Income |
| Owner-Occupied | 3,069 (77.0%) | $68,921 |
| Renter-Occupied | 919 (23.0%) | $57,787 |
| Average | 3,988 (100.0%) | $66,382 |
Occupancy by Householder Income Bracket in Haysville
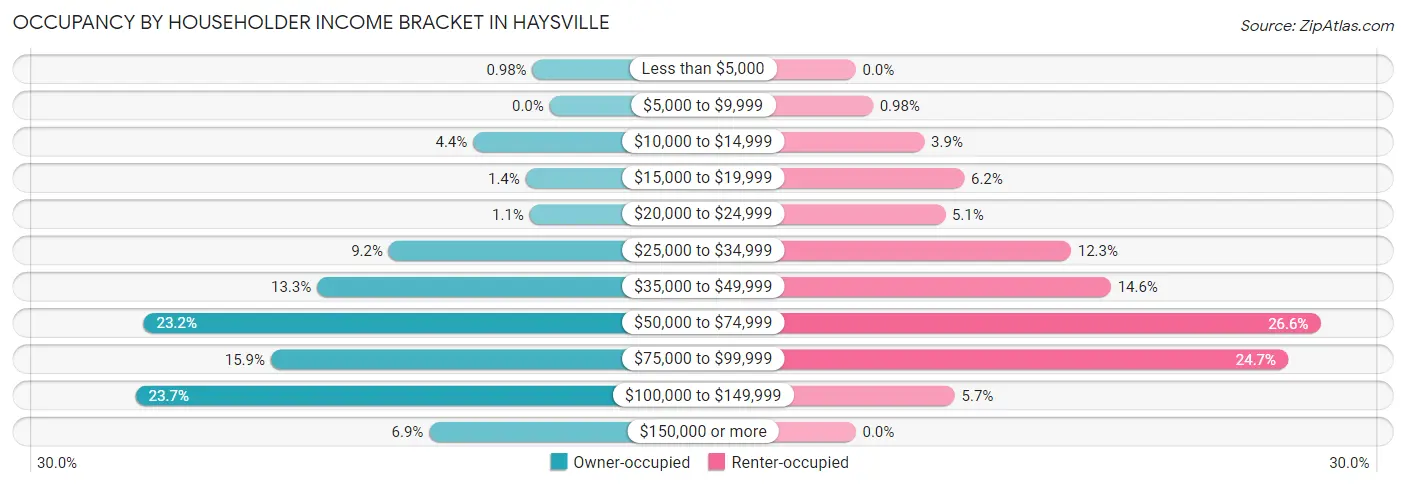
| Income Bracket | Owner-occupied | Renter-occupied |
| Less than $5,000 | 30 (1.0%) | 0 (0.0%) |
| $5,000 to $9,999 | 0 (0.0%) | 9 (1.0%) |
| $10,000 to $14,999 | 134 (4.4%) | 36 (3.9%) |
| $15,000 to $19,999 | 42 (1.4%) | 57 (6.2%) |
| $20,000 to $24,999 | 35 (1.1%) | 47 (5.1%) |
| $25,000 to $34,999 | 282 (9.2%) | 113 (12.3%) |
| $35,000 to $49,999 | 408 (13.3%) | 134 (14.6%) |
| $50,000 to $74,999 | 712 (23.2%) | 244 (26.6%) |
| $75,000 to $99,999 | 489 (15.9%) | 227 (24.7%) |
| $100,000 to $149,999 | 726 (23.7%) | 52 (5.7%) |
| $150,000 or more | 211 (6.9%) | 0 (0.0%) |
| Total | 3,069 (100.0%) | 919 (100.0%) |
Monthly Housing Cost Tiers in Haysville
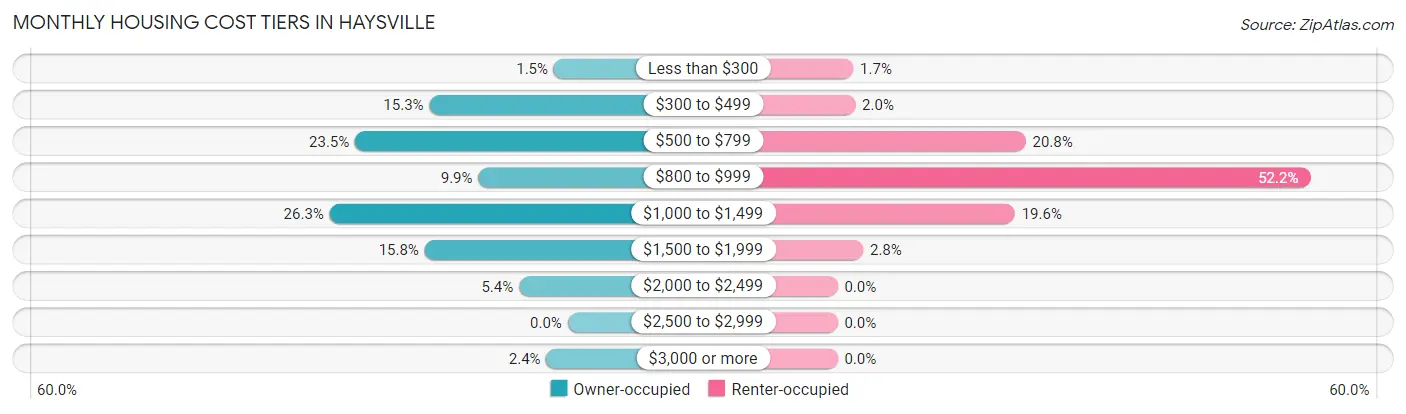
| Monthly Cost | Owner-occupied | Renter-occupied |
| Less than $300 | 47 (1.5%) | 16 (1.7%) |
| $300 to $499 | 469 (15.3%) | 18 (2.0%) |
| $500 to $799 | 721 (23.5%) | 191 (20.8%) |
| $800 to $999 | 303 (9.9%) | 480 (52.2%) |
| $1,000 to $1,499 | 807 (26.3%) | 180 (19.6%) |
| $1,500 to $1,999 | 485 (15.8%) | 26 (2.8%) |
| $2,000 to $2,499 | 165 (5.4%) | 0 (0.0%) |
| $2,500 to $2,999 | 0 (0.0%) | 0 (0.0%) |
| $3,000 or more | 72 (2.4%) | 0 (0.0%) |
| Total | 3,069 (100.0%) | 919 (100.0%) |
Physical Housing Characteristics in Haysville
Housing Structures in Haysville
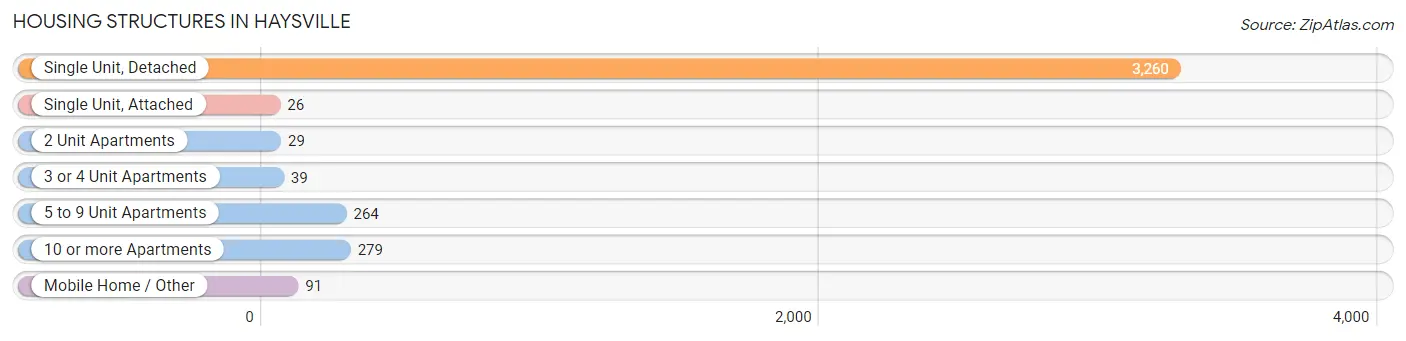
| Structure Type | # Housing Units | % Housing Units |
| Single Unit, Detached | 3,260 | 81.8% |
| Single Unit, Attached | 26 | 0.6% |
| 2 Unit Apartments | 29 | 0.7% |
| 3 or 4 Unit Apartments | 39 | 1.0% |
| 5 to 9 Unit Apartments | 264 | 6.6% |
| 10 or more Apartments | 279 | 7.0% |
| Mobile Home / Other | 91 | 2.3% |
| Total | 3,988 | 100.0% |
Housing Structures by Occupancy in Haysville
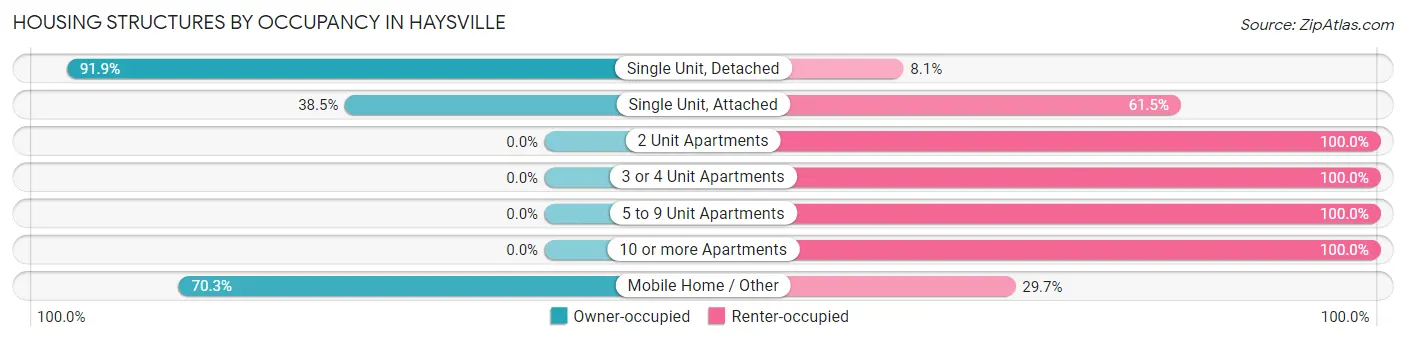
| Structure Type | Owner-occupied | Renter-occupied |
| Single Unit, Detached | 2,995 (91.9%) | 265 (8.1%) |
| Single Unit, Attached | 10 (38.5%) | 16 (61.5%) |
| 2 Unit Apartments | 0 (0.0%) | 29 (100.0%) |
| 3 or 4 Unit Apartments | 0 (0.0%) | 39 (100.0%) |
| 5 to 9 Unit Apartments | 0 (0.0%) | 264 (100.0%) |
| 10 or more Apartments | 0 (0.0%) | 279 (100.0%) |
| Mobile Home / Other | 64 (70.3%) | 27 (29.7%) |
| Total | 3,069 (77.0%) | 919 (23.0%) |
Housing Structures by Number of Rooms in Haysville
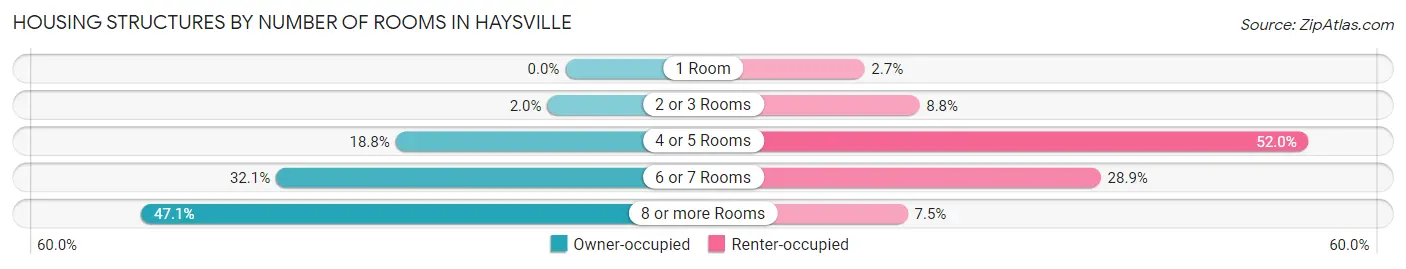
| Number of Rooms | Owner-occupied | Renter-occupied |
| 1 Room | 0 (0.0%) | 25 (2.7%) |
| 2 or 3 Rooms | 61 (2.0%) | 81 (8.8%) |
| 4 or 5 Rooms | 578 (18.8%) | 478 (52.0%) |
| 6 or 7 Rooms | 985 (32.1%) | 266 (28.9%) |
| 8 or more Rooms | 1,445 (47.1%) | 69 (7.5%) |
| Total | 3,069 (100.0%) | 919 (100.0%) |
Housing Structure by Heating Type in Haysville
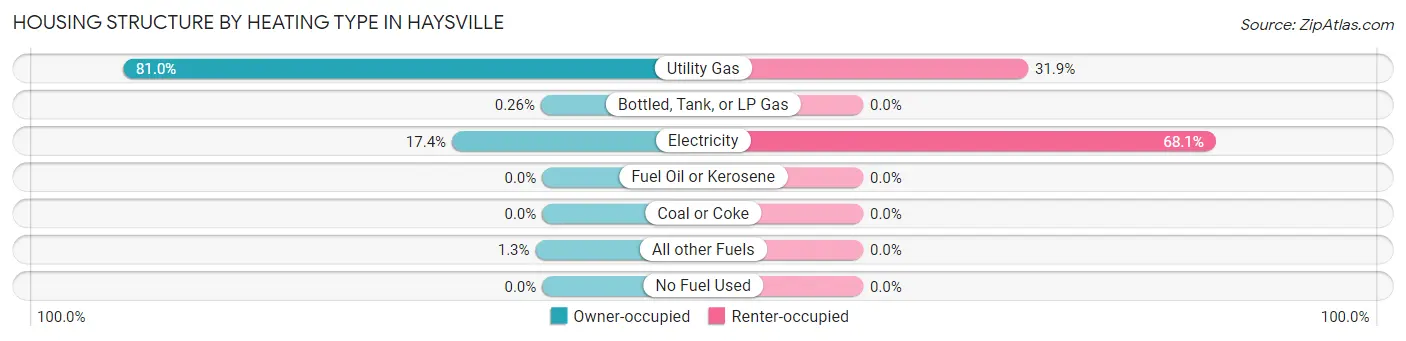
| Heating Type | Owner-occupied | Renter-occupied |
| Utility Gas | 2,486 (81.0%) | 293 (31.9%) |
| Bottled, Tank, or LP Gas | 8 (0.3%) | 0 (0.0%) |
| Electricity | 535 (17.4%) | 626 (68.1%) |
| Fuel Oil or Kerosene | 0 (0.0%) | 0 (0.0%) |
| Coal or Coke | 0 (0.0%) | 0 (0.0%) |
| All other Fuels | 40 (1.3%) | 0 (0.0%) |
| No Fuel Used | 0 (0.0%) | 0 (0.0%) |
| Total | 3,069 (100.0%) | 919 (100.0%) |
Household Vehicle Usage in Haysville
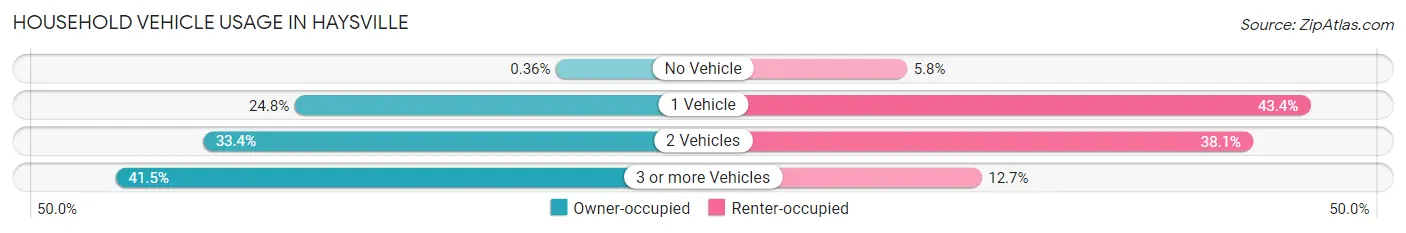
| Vehicles per Household | Owner-occupied | Renter-occupied |
| No Vehicle | 11 (0.4%) | 53 (5.8%) |
| 1 Vehicle | 760 (24.8%) | 399 (43.4%) |
| 2 Vehicles | 1,024 (33.4%) | 350 (38.1%) |
| 3 or more Vehicles | 1,274 (41.5%) | 117 (12.7%) |
| Total | 3,069 (100.0%) | 919 (100.0%) |
Real Estate & Mortgages in Haysville
Real Estate and Mortgage Overview in Haysville
| Characteristic | Without Mortgage | With Mortgage |
| Housing Units | 1,284 | 1,785 |
| Median Property Value | $131,600 | $175,200 |
| Median Household Income | $49,286 | $176 |
| Monthly Housing Costs | $540 | $72 |
| Real Estate Taxes | $2,033 | $0 |
Property Value by Mortgage Status in Haysville
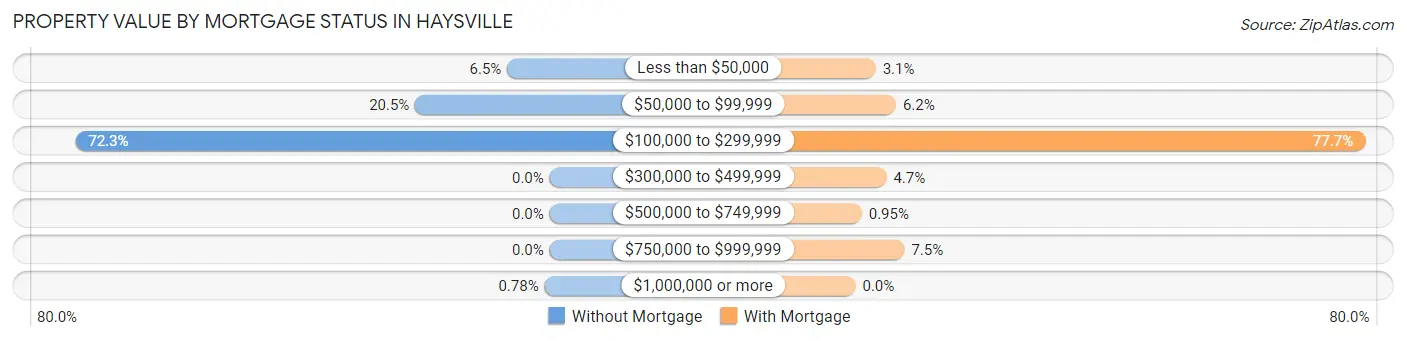
| Property Value | Without Mortgage | With Mortgage |
| Less than $50,000 | 83 (6.5%) | 55 (3.1%) |
| $50,000 to $99,999 | 263 (20.5%) | 110 (6.2%) |
| $100,000 to $299,999 | 928 (72.3%) | 1,386 (77.6%) |
| $300,000 to $499,999 | 0 (0.0%) | 84 (4.7%) |
| $500,000 to $749,999 | 0 (0.0%) | 17 (0.9%) |
| $750,000 to $999,999 | 0 (0.0%) | 133 (7.4%) |
| $1,000,000 or more | 10 (0.8%) | 0 (0.0%) |
| Total | 1,284 (100.0%) | 1,785 (100.0%) |
Household Income by Mortgage Status in Haysville
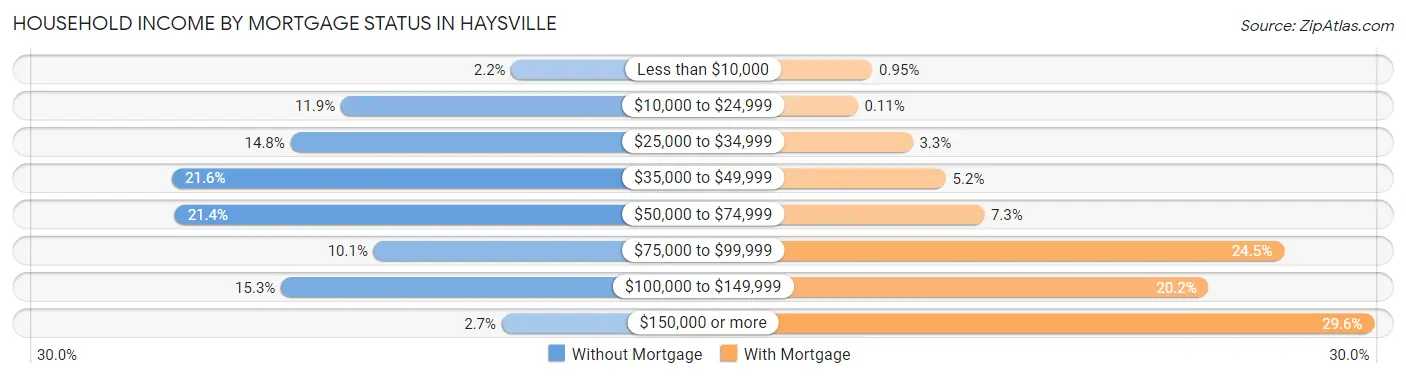
| Household Income | Without Mortgage | With Mortgage |
| Less than $10,000 | 28 (2.2%) | 17 (0.9%) |
| $10,000 to $24,999 | 153 (11.9%) | 2 (0.1%) |
| $25,000 to $34,999 | 190 (14.8%) | 58 (3.3%) |
| $35,000 to $49,999 | 277 (21.6%) | 92 (5.1%) |
| $50,000 to $74,999 | 275 (21.4%) | 131 (7.3%) |
| $75,000 to $99,999 | 129 (10.1%) | 437 (24.5%) |
| $100,000 to $149,999 | 197 (15.3%) | 360 (20.2%) |
| $150,000 or more | 35 (2.7%) | 529 (29.6%) |
| Total | 1,284 (100.0%) | 1,785 (100.0%) |
Property Value to Household Income Ratio in Haysville
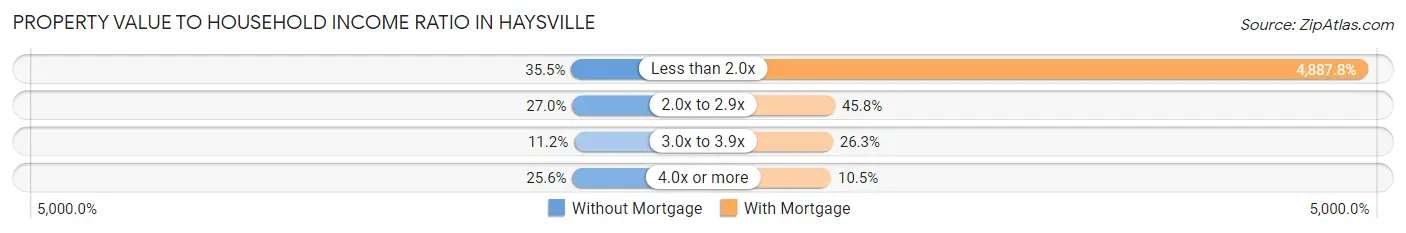
| Value-to-Income Ratio | Without Mortgage | With Mortgage |
| Less than 2.0x | 456 (35.5%) | 87,247 (4,887.8%) |
| 2.0x to 2.9x | 346 (27.0%) | 817 (45.8%) |
| 3.0x to 3.9x | 144 (11.2%) | 470 (26.3%) |
| 4.0x or more | 328 (25.6%) | 187 (10.5%) |
| Total | 1,284 (100.0%) | 1,785 (100.0%) |
Real Estate Taxes by Mortgage Status in Haysville
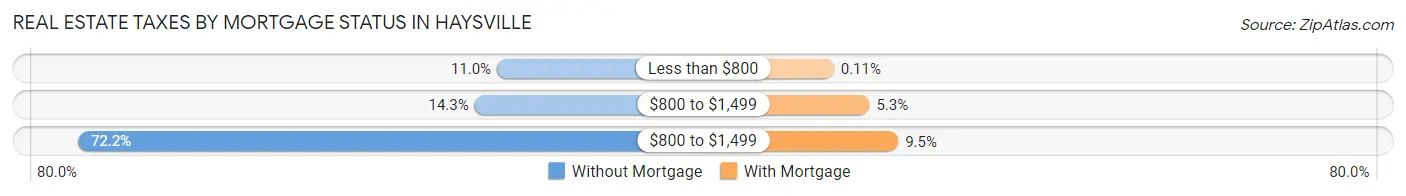
| Property Taxes | Without Mortgage | With Mortgage |
| Less than $800 | 141 (11.0%) | 2 (0.1%) |
| $800 to $1,499 | 183 (14.2%) | 95 (5.3%) |
| $800 to $1,499 | 927 (72.2%) | 170 (9.5%) |
| Total | 1,284 (100.0%) | 1,785 (100.0%) |
Health & Disability in Haysville
Health Insurance Coverage by Age in Haysville
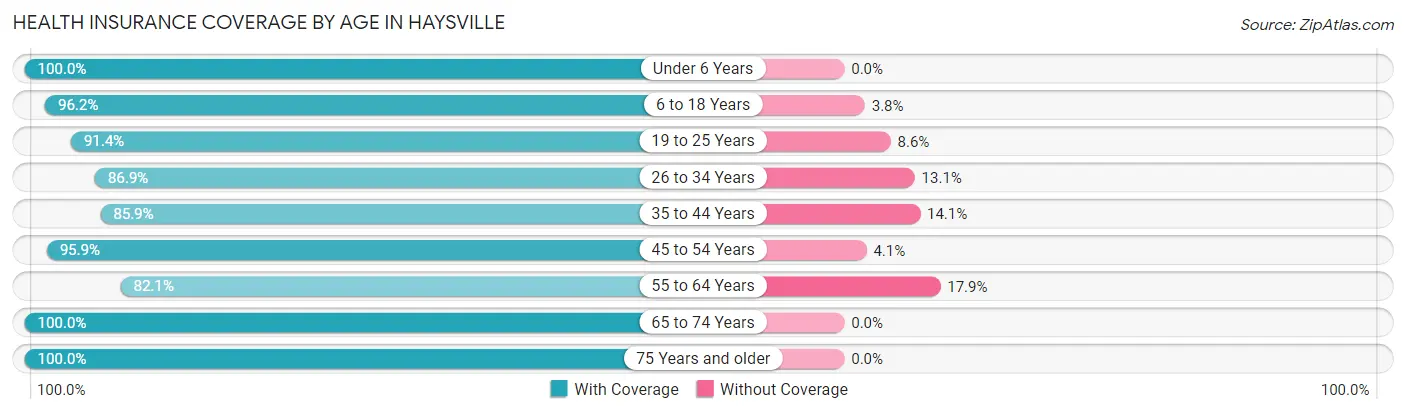
| Age Bracket | With Coverage | Without Coverage |
| Under 6 Years | 710 (100.0%) | 0 (0.0%) |
| 6 to 18 Years | 2,515 (96.2%) | 100 (3.8%) |
| 19 to 25 Years | 952 (91.4%) | 90 (8.6%) |
| 26 to 34 Years | 914 (86.9%) | 138 (13.1%) |
| 35 to 44 Years | 1,179 (85.9%) | 194 (14.1%) |
| 45 to 54 Years | 1,068 (95.9%) | 46 (4.1%) |
| 55 to 64 Years | 1,197 (82.1%) | 261 (17.9%) |
| 65 to 74 Years | 726 (100.0%) | 0 (0.0%) |
| 75 Years and older | 706 (100.0%) | 0 (0.0%) |
| Total | 9,967 (92.3%) | 829 (7.7%) |
Health Insurance Coverage by Citizenship Status in Haysville

| Citizenship Status | With Coverage | Without Coverage |
| Native Born | 710 (100.0%) | 0 (0.0%) |
| Foreign Born, Citizen | 2,515 (96.2%) | 100 (3.8%) |
| Foreign Born, not a Citizen | 952 (91.4%) | 90 (8.6%) |
Health Insurance Coverage by Household Income in Haysville
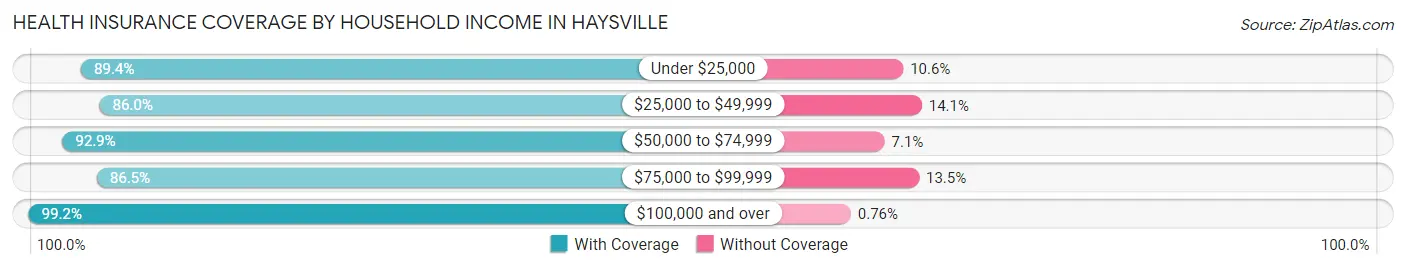
| Household Income | With Coverage | Without Coverage |
| Under $25,000 | 601 (89.4%) | 71 (10.6%) |
| $25,000 to $49,999 | 1,597 (86.0%) | 261 (14.1%) |
| $50,000 to $74,999 | 1,915 (92.9%) | 146 (7.1%) |
| $75,000 to $99,999 | 2,056 (86.5%) | 322 (13.5%) |
| $100,000 and over | 3,798 (99.2%) | 29 (0.8%) |
Public vs Private Health Insurance Coverage by Age in Haysville
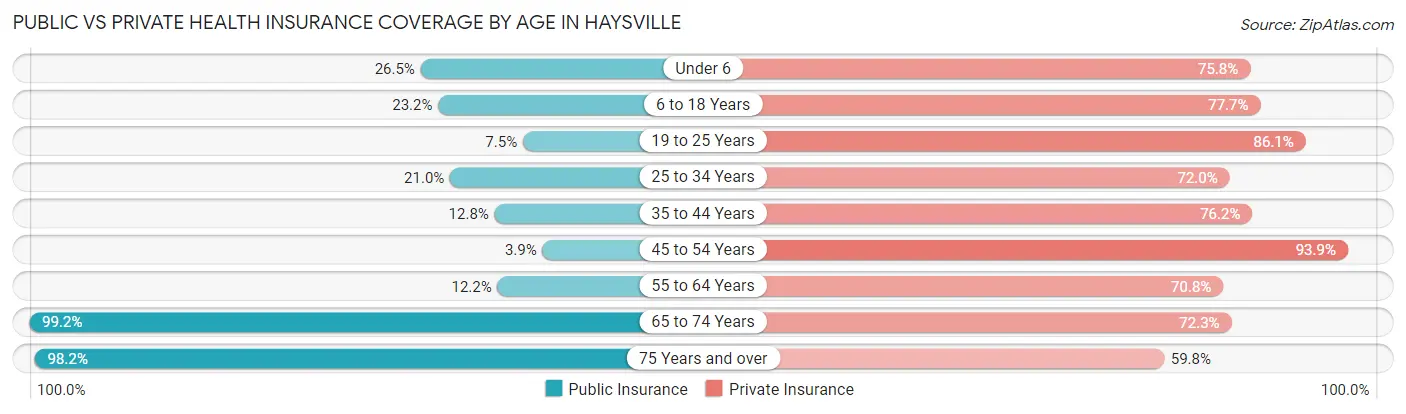
| Age Bracket | Public Insurance | Private Insurance |
| Under 6 | 188 (26.5%) | 538 (75.8%) |
| 6 to 18 Years | 607 (23.2%) | 2,031 (77.7%) |
| 19 to 25 Years | 78 (7.5%) | 897 (86.1%) |
| 25 to 34 Years | 221 (21.0%) | 757 (72.0%) |
| 35 to 44 Years | 175 (12.8%) | 1,046 (76.2%) |
| 45 to 54 Years | 43 (3.9%) | 1,046 (93.9%) |
| 55 to 64 Years | 178 (12.2%) | 1,032 (70.8%) |
| 65 to 74 Years | 720 (99.2%) | 525 (72.3%) |
| 75 Years and over | 693 (98.2%) | 422 (59.8%) |
| Total | 2,903 (26.9%) | 8,294 (76.8%) |
Disability Status by Sex by Age in Haysville
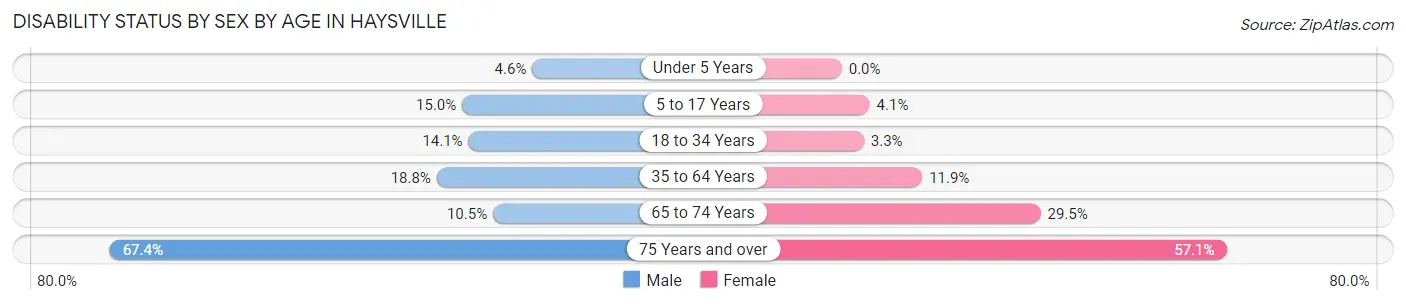
| Age Bracket | Male | Female |
| Under 5 Years | 17 (4.6%) | 0 (0.0%) |
| 5 to 17 Years | 162 (15.0%) | 49 (4.1%) |
| 18 to 34 Years | 207 (14.1%) | 36 (3.3%) |
| 35 to 64 Years | 345 (18.8%) | 252 (11.9%) |
| 65 to 74 Years | 44 (10.4%) | 90 (29.5%) |
| 75 Years and over | 229 (67.3%) | 209 (57.1%) |
Disability Class by Sex by Age in Haysville
Disability Class: Hearing Difficulty
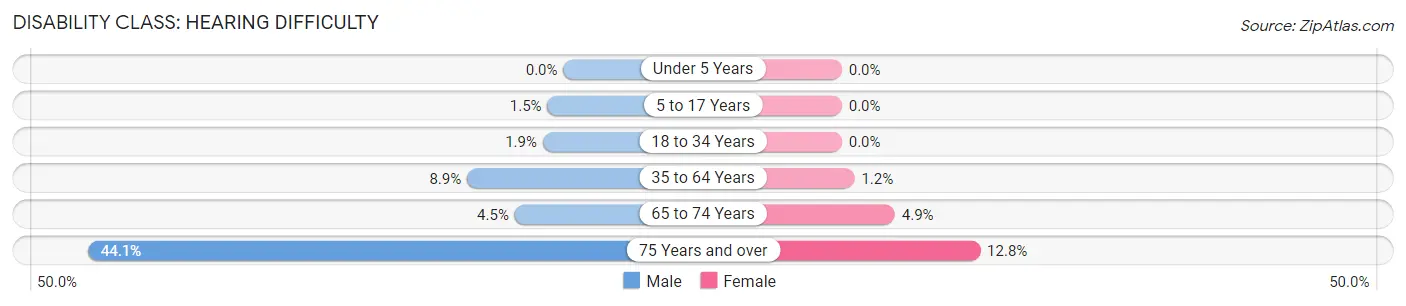
| Age Bracket | Male | Female |
| Under 5 Years | 0 (0.0%) | 0 (0.0%) |
| 5 to 17 Years | 16 (1.5%) | 0 (0.0%) |
| 18 to 34 Years | 28 (1.9%) | 0 (0.0%) |
| 35 to 64 Years | 164 (8.9%) | 25 (1.2%) |
| 65 to 74 Years | 19 (4.5%) | 15 (4.9%) |
| 75 Years and over | 150 (44.1%) | 47 (12.8%) |
Disability Class: Vision Difficulty
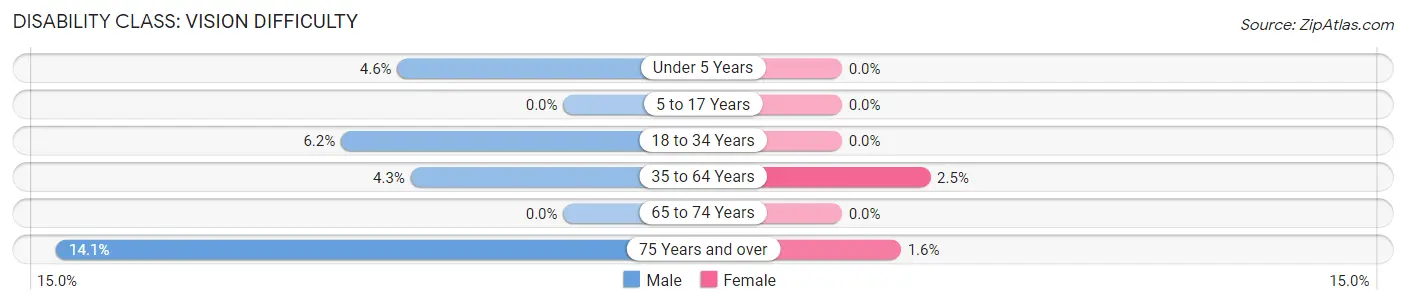
| Age Bracket | Male | Female |
| Under 5 Years | 17 (4.6%) | 0 (0.0%) |
| 5 to 17 Years | 0 (0.0%) | 0 (0.0%) |
| 18 to 34 Years | 91 (6.2%) | 0 (0.0%) |
| 35 to 64 Years | 78 (4.3%) | 52 (2.5%) |
| 65 to 74 Years | 0 (0.0%) | 0 (0.0%) |
| 75 Years and over | 48 (14.1%) | 6 (1.6%) |
Disability Class: Cognitive Difficulty
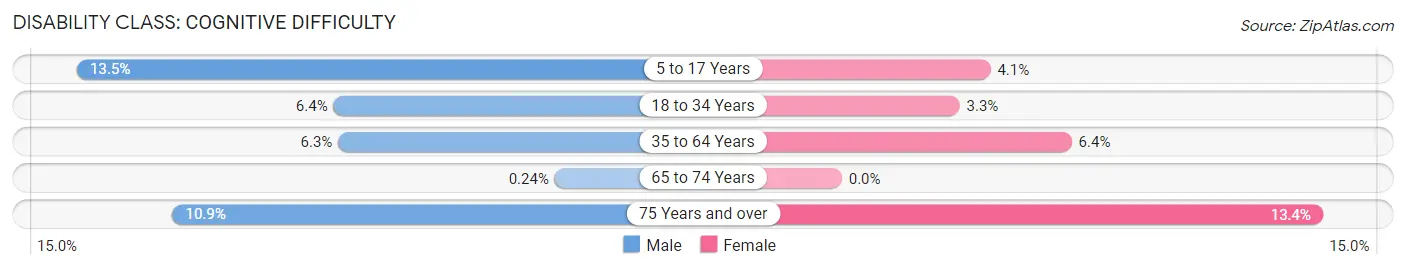
| Age Bracket | Male | Female |
| 5 to 17 Years | 146 (13.5%) | 49 (4.1%) |
| 18 to 34 Years | 94 (6.4%) | 36 (3.3%) |
| 35 to 64 Years | 115 (6.3%) | 135 (6.4%) |
| 65 to 74 Years | 1 (0.2%) | 0 (0.0%) |
| 75 Years and over | 37 (10.9%) | 49 (13.4%) |
Disability Class: Ambulatory Difficulty
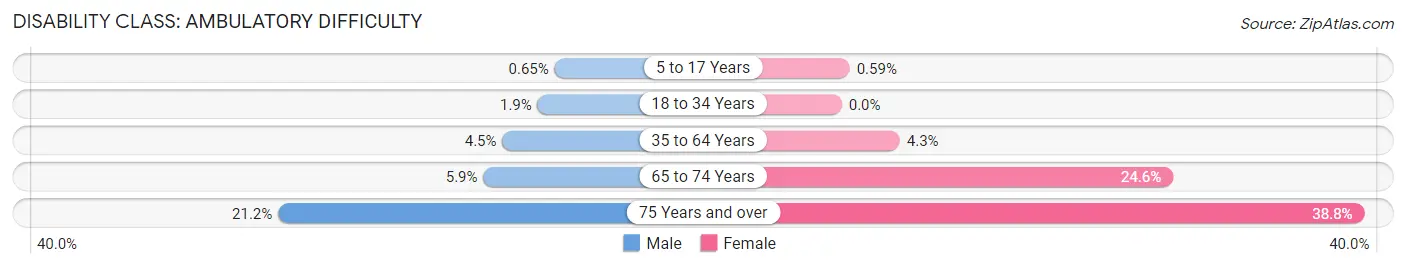
| Age Bracket | Male | Female |
| 5 to 17 Years | 7 (0.6%) | 7 (0.6%) |
| 18 to 34 Years | 28 (1.9%) | 0 (0.0%) |
| 35 to 64 Years | 83 (4.5%) | 91 (4.3%) |
| 65 to 74 Years | 25 (5.9%) | 75 (24.6%) |
| 75 Years and over | 72 (21.2%) | 142 (38.8%) |
Disability Class: Self-Care Difficulty
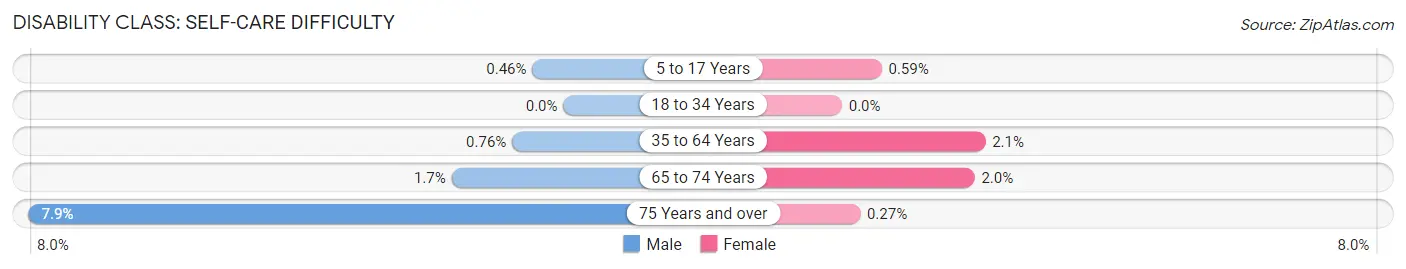
| Age Bracket | Male | Female |
| 5 to 17 Years | 5 (0.5%) | 7 (0.6%) |
| 18 to 34 Years | 0 (0.0%) | 0 (0.0%) |
| 35 to 64 Years | 14 (0.8%) | 45 (2.1%) |
| 65 to 74 Years | 7 (1.7%) | 6 (2.0%) |
| 75 Years and over | 27 (7.9%) | 1 (0.3%) |
Technology Access in Haysville
Computing Device Access in Haysville
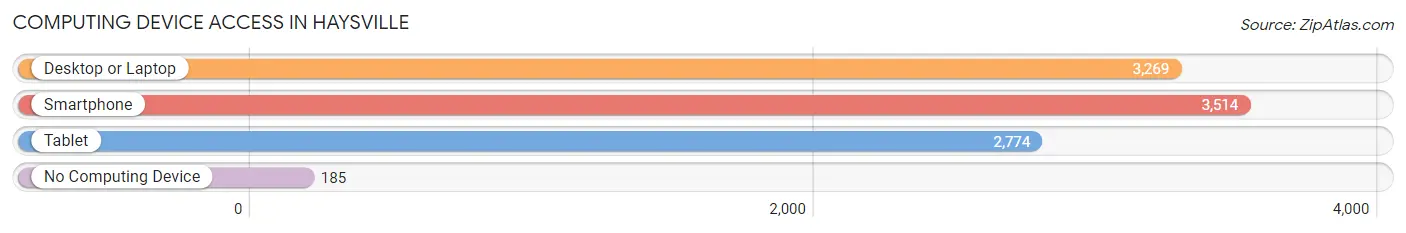
| Device Type | # Households | % Households |
| Desktop or Laptop | 3,269 | 82.0% |
| Smartphone | 3,514 | 88.1% |
| Tablet | 2,774 | 69.6% |
| No Computing Device | 185 | 4.6% |
| Total | 3,988 | 100.0% |
Internet Access in Haysville
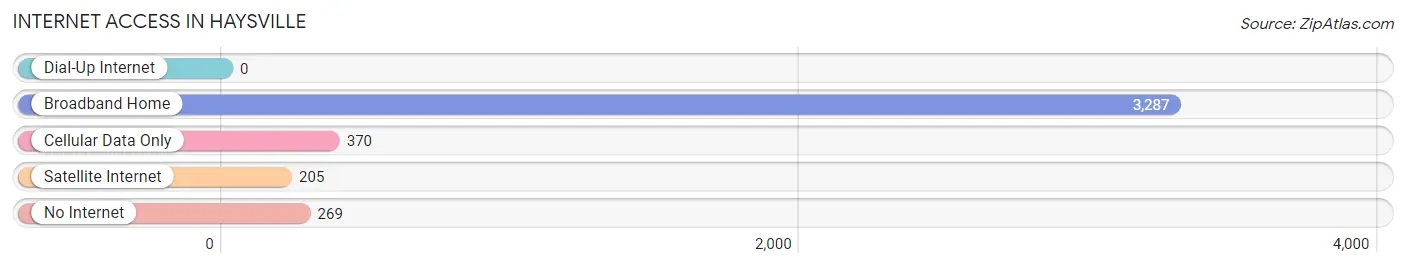
| Internet Type | # Households | % Households |
| Dial-Up Internet | 0 | 0.0% |
| Broadband Home | 3,287 | 82.4% |
| Cellular Data Only | 370 | 9.3% |
| Satellite Internet | 205 | 5.1% |
| No Internet | 269 | 6.8% |
| Total | 3,988 | 100.0% |
Haysville Summary
Haysville, Kansas is a small city located in Sedgwick County, Kansas. It is situated in the south-central part of the state, about 10 miles south of Wichita. The city has a population of about 10,000 people and is part of the Wichita metropolitan area.
History
Haysville was founded in 1887 by William Hays, a local farmer. He named the town after himself and it was incorporated in 1891. The city was originally a farming community, but it soon developed into a small industrial center. The city was home to several factories, including a flour mill, a brickyard, and a canning factory.
In the early 1900s, the city experienced a period of growth and development. The population increased from about 500 in 1900 to over 1,000 by 1910. The city also saw the construction of several new buildings, including a school, a library, and a post office.
In the 1950s, the city experienced a period of decline. Many of the factories closed and the population decreased. However, in the late 1970s, the city began to experience a period of revitalization. The population began to increase and new businesses opened.
Geography
Haysville is located in south-central Kansas, about 10 miles south of Wichita. The city is situated in the Arkansas River Valley, which is part of the Great Plains region. The city is surrounded by rolling hills and grasslands.
The climate in Haysville is generally mild, with hot summers and cold winters. The average annual temperature is about 54 degrees Fahrenheit. The average annual precipitation is about 33 inches.
Economy
Haysville’s economy is largely based on agriculture and manufacturing. The city is home to several factories, including a flour mill, a brickyard, and a canning factory. The city is also home to several small businesses, including restaurants, retail stores, and service providers.
The city is also home to several large employers, including Spirit AeroSystems, a major aerospace manufacturer, and Koch Industries, a large energy and chemical company.
Demographics
As of the 2010 census, the population of Haysville was 10,014. The racial makeup of the city was 87.3% White, 5.2% African American, 0.7% Native American, 1.2% Asian, 0.1% Pacific Islander, and 4.5% from other races. Hispanic or Latino of any race were 8.2% of the population.
The median household income in Haysville was $45,945, and the median family income was $54,945. About 11.2% of the population was below the poverty line.
Haysville is a small city with a rich history and a diverse population. The city has experienced periods of growth and decline, but it is currently experiencing a period of revitalization. The city is home to several large employers and is a great place to live and work.
Common Questions
What is Per Capita Income in Haysville?
Per Capita income in Haysville is $28,670.
What is the Median Family Income in Haysville?
Median Family Income in Haysville is $83,164.
What is the Median Household income in Haysville?
Median Household Income in Haysville is $66,382.
What is Income or Wage Gap in Haysville?
Income or Wage Gap in Haysville is 31.0%.
Women in Haysville earn 69.0 cents for every dollar earned by a man.
What is Family Income Deficit in Haysville?
Family Income Deficit in Haysville is $6,294.
Families that are below poverty line in Haysville earn $6,294 less on average than the poverty threshold level.
What is Inequality or Gini Index in Haysville?
Inequality or Gini Index in Haysville is 0.34.
What is the Total Population of Haysville?
Total Population of Haysville is 10,891.
What is the Total Male Population of Haysville?
Total Male Population of Haysville is 5,550.
What is the Total Female Population of Haysville?
Total Female Population of Haysville is 5,341.
What is the Ratio of Males per 100 Females in Haysville?
There are 103.91 Males per 100 Females in Haysville.
What is the Ratio of Females per 100 Males in Haysville?
There are 96.23 Females per 100 Males in Haysville.
What is the Median Population Age in Haysville?
Median Population Age in Haysville is 35.1 Years.
What is the Average Family Size in Haysville
Average Family Size in Haysville is 3.1 People.
What is the Average Household Size in Haysville
Average Household Size in Haysville is 2.7 People.
How Large is the Labor Force in Haysville?
There are 5,295 People in the Labor Forcein in Haysville.
What is the Percentage of People in the Labor Force in Haysville?
63.2% of People are in the Labor Force in Haysville.
What is the Unemployment Rate in Haysville?
Unemployment Rate in Haysville is 5.2%.