Haven, KS Map & Demographics
Haven Map
Haven Overview
$31,930
PER CAPITA INCOME
$72,454
AVG FAMILY INCOME
$56,953
AVG HOUSEHOLD INCOME
12.6%
WAGE / INCOME GAP [ % ]
87.4¢/ $1
WAGE / INCOME GAP [ $ ]
0.33
INEQUALITY / GINI INDEX
1,421
TOTAL POPULATION
570
MALE POPULATION
851
FEMALE POPULATION
66.98
MALES / 100 FEMALES
149.30
FEMALES / 100 MALES
42.0
MEDIAN AGE
3.4
AVG FAMILY SIZE
2.3
AVG HOUSEHOLD SIZE
823
LABOR FORCE [ PEOPLE ]
71.9%
PERCENT IN LABOR FORCE
2.4%
UNEMPLOYMENT RATE
Haven Zip Codes
Haven Area Codes
Income in Haven
Income Overview in Haven
Per Capita Income in Haven is $31,930, while median incomes of families and households are $72,454 and $56,953 respectively.
| Characteristic | Number | Measure |
| Per Capita Income | 1,421 | $31,930 |
| Median Family Income | 301 | $72,454 |
| Mean Family Income | 301 | $88,842 |
| Median Household Income | 607 | $56,953 |
| Mean Household Income | 607 | $70,857 |
| Income Deficit | 301 | $0 |
| Wage / Income Gap (%) | 1,421 | 12.63% |
| Wage / Income Gap ($) | 1,421 | 87.37¢ per $1 |
| Gini / Inequality Index | 1,421 | 0.33 |
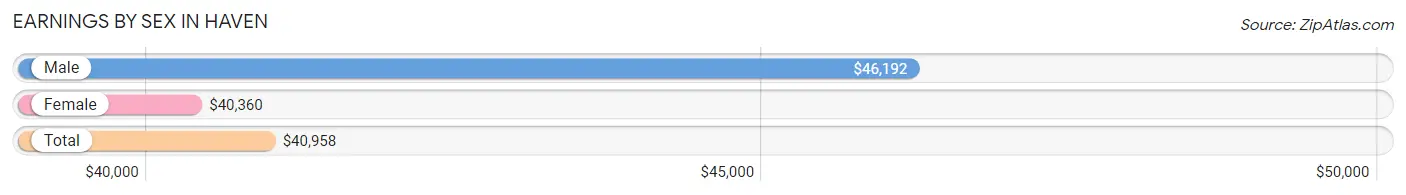
Earnings by Sex in Haven
Average Earnings in Haven are $40,958, $46,192 for men and $40,360 for women, a difference of 12.6%.
| Sex | Number | Average Earnings |
| Male | 321 (38.5%) | $46,192 |
| Female | 513 (61.5%) | $40,360 |
| Total | 834 (100.0%) | $40,958 |
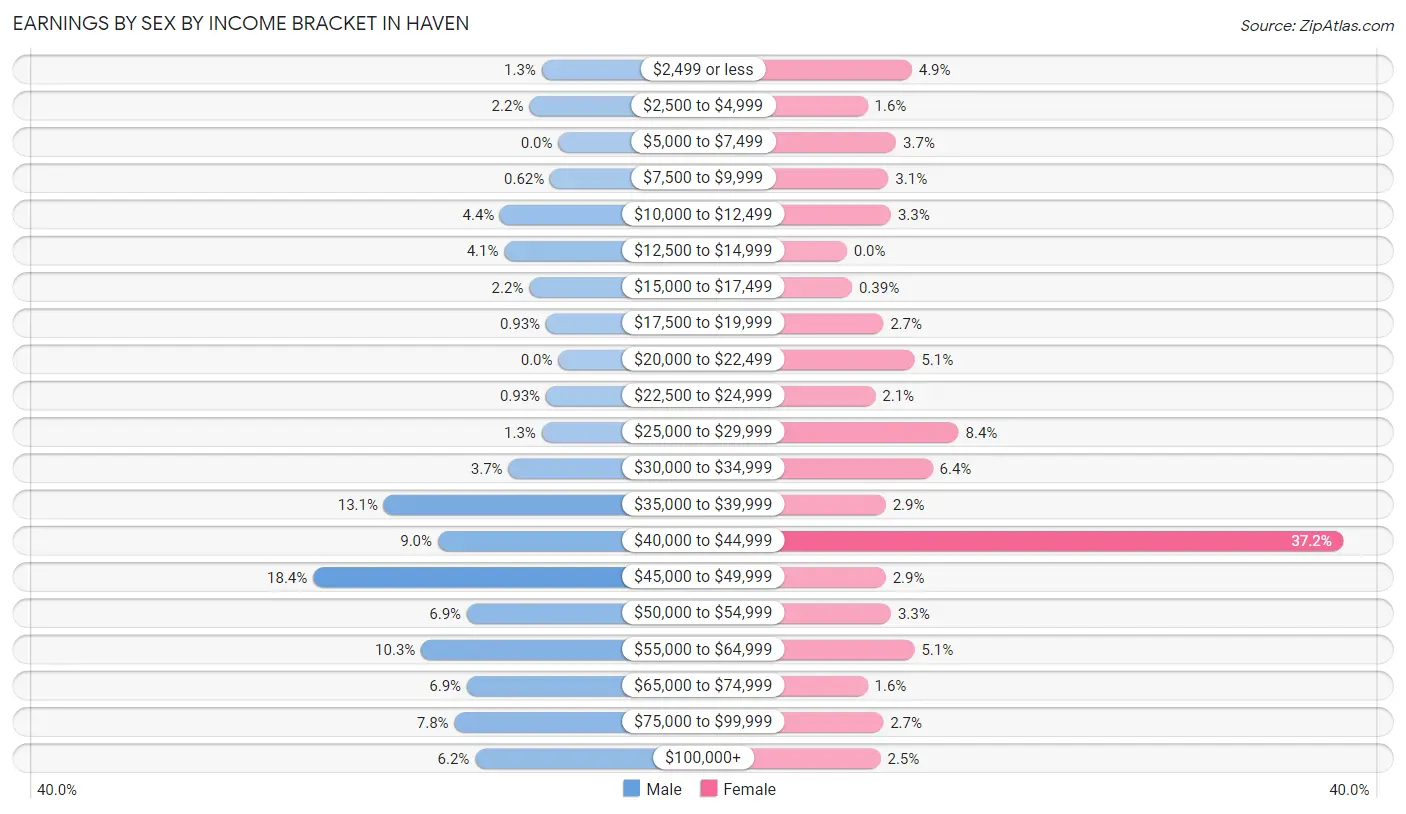
Earnings by Sex by Income Bracket in Haven
The most common earnings brackets in Haven are $45,000 to $49,999 for men (59 | 18.4%) and $40,000 to $44,999 for women (191 | 37.2%).
| Income | Male | Female |
| $2,499 or less | 4 (1.3%) | 25 (4.9%) |
| $2,500 to $4,999 | 7 (2.2%) | 8 (1.6%) |
| $5,000 to $7,499 | 0 (0.0%) | 19 (3.7%) |
| $7,500 to $9,999 | 2 (0.6%) | 16 (3.1%) |
| $10,000 to $12,499 | 14 (4.4%) | 17 (3.3%) |
| $12,500 to $14,999 | 13 (4.1%) | 0 (0.0%) |
| $15,000 to $17,499 | 7 (2.2%) | 2 (0.4%) |
| $17,500 to $19,999 | 3 (0.9%) | 14 (2.7%) |
| $20,000 to $22,499 | 0 (0.0%) | 26 (5.1%) |
| $22,500 to $24,999 | 3 (0.9%) | 11 (2.1%) |
| $25,000 to $29,999 | 4 (1.3%) | 43 (8.4%) |
| $30,000 to $34,999 | 12 (3.7%) | 33 (6.4%) |
| $35,000 to $39,999 | 42 (13.1%) | 15 (2.9%) |
| $40,000 to $44,999 | 29 (9.0%) | 191 (37.2%) |
| $45,000 to $49,999 | 59 (18.4%) | 15 (2.9%) |
| $50,000 to $54,999 | 22 (6.9%) | 17 (3.3%) |
| $55,000 to $64,999 | 33 (10.3%) | 26 (5.1%) |
| $65,000 to $74,999 | 22 (6.9%) | 8 (1.6%) |
| $75,000 to $99,999 | 25 (7.8%) | 14 (2.7%) |
| $100,000+ | 20 (6.2%) | 13 (2.5%) |
| Total | 321 (100.0%) | 513 (100.0%) |
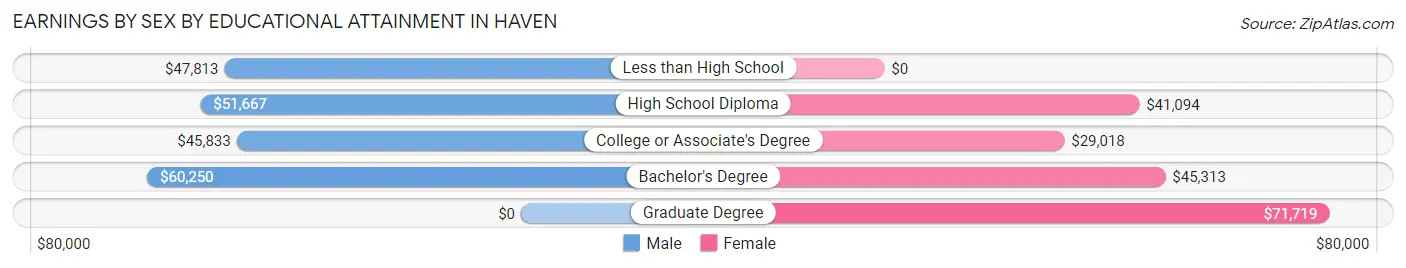
Earnings by Sex by Educational Attainment in Haven
Average earnings in Haven are $46,773 for men and $40,838 for women, a difference of 12.7%. Men with an educational attainment of bachelor's degree enjoy the highest average annual earnings of $60,250, while those with college or associate's degree education earn the least with $45,833. Women with an educational attainment of graduate degree earn the most with the average annual earnings of $71,719, while those with college or associate's degree education have the smallest earnings of $29,018.
| Educational Attainment | Male Income | Female Income |
| Less than High School | $47,813 | $0 |
| High School Diploma | $51,667 | $41,094 |
| College or Associate's Degree | $45,833 | $29,018 |
| Bachelor's Degree | $60,250 | $45,313 |
| Graduate Degree | - | - |
| Total | $46,773 | $40,838 |
Family Income in Haven
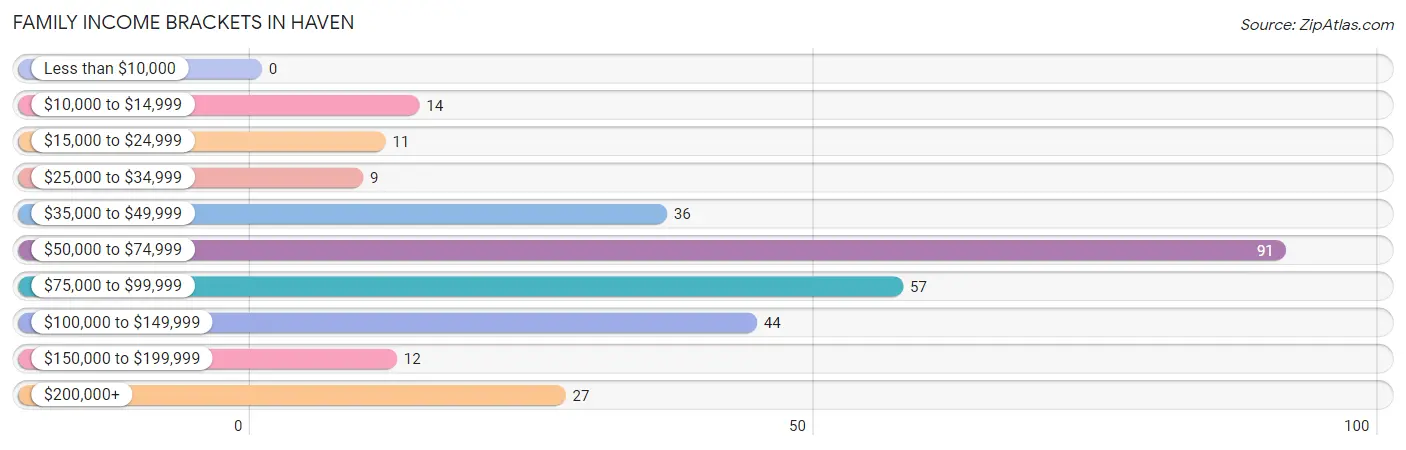
Family Income Brackets in Haven
According to the Haven family income data, there are 91 families falling into the $50,000 to $74,999 income range, which is the most common income bracket and makes up 30.2% of all families.
| Income Bracket | # Families | % Families |
| Less than $10,000 | 0 | 0.0% |
| $10,000 to $14,999 | 14 | 4.7% |
| $15,000 to $24,999 | 11 | 3.7% |
| $25,000 to $34,999 | 9 | 3.0% |
| $35,000 to $49,999 | 36 | 12.0% |
| $50,000 to $74,999 | 91 | 30.2% |
| $75,000 to $99,999 | 57 | 18.9% |
| $100,000 to $149,999 | 44 | 14.6% |
| $150,000 to $199,999 | 12 | 4.0% |
| $200,000+ | 27 | 9.0% |
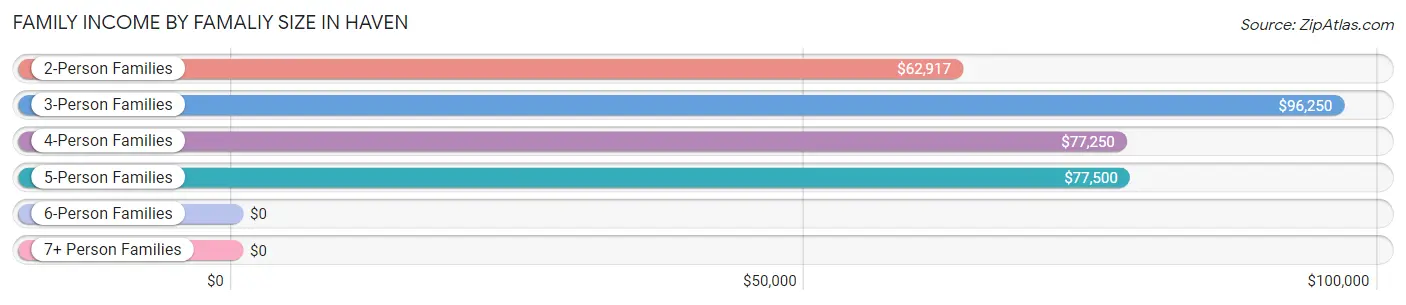
Family Income by Famaliy Size in Haven
3-person families (72 | 23.9%) account for the highest median family income in Haven with $96,250 per family, while 3-person families (72 | 23.9%) have the highest median income of $32,083 per family member.
| Income Bracket | # Families | Median Income |
| 2-Person Families | 132 (43.9%) | $62,917 |
| 3-Person Families | 72 (23.9%) | $96,250 |
| 4-Person Families | 37 (12.3%) | $77,250 |
| 5-Person Families | 48 (16.0%) | $77,500 |
| 6-Person Families | 12 (4.0%) | $0 |
| 7+ Person Families | 0 (0.0%) | $0 |
| Total | 301 (100.0%) | $72,454 |
Family Income by Number of Earners in Haven
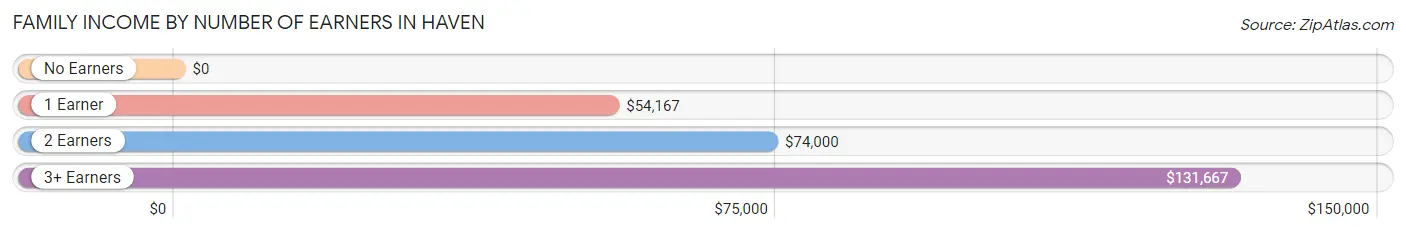
| Number of Earners | # Families | Median Income |
| No Earners | 49 (16.3%) | $0 |
| 1 Earner | 52 (17.3%) | $54,167 |
| 2 Earners | 140 (46.5%) | $74,000 |
| 3+ Earners | 60 (19.9%) | $131,667 |
| Total | 301 (100.0%) | $72,454 |
Household Income in Haven
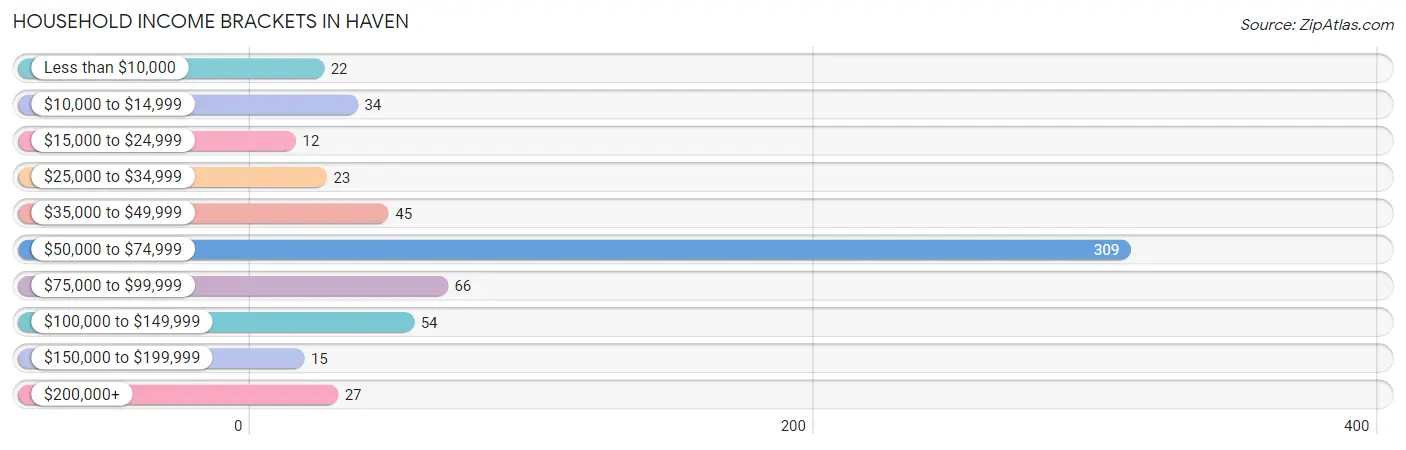
Household Income Brackets in Haven
With 309 households falling in the category, the $50,000 to $74,999 income range is the most frequent in Haven, accounting for 50.9% of all households. In contrast, only 12 households (2.0%) fall into the $15,000 to $24,999 income bracket, making it the least populous group.
| Income Bracket | # Households | % Households |
| Less than $10,000 | 22 | 3.6% |
| $10,000 to $14,999 | 34 | 5.6% |
| $15,000 to $24,999 | 12 | 2.0% |
| $25,000 to $34,999 | 23 | 3.8% |
| $35,000 to $49,999 | 45 | 7.4% |
| $50,000 to $74,999 | 309 | 50.9% |
| $75,000 to $99,999 | 66 | 10.9% |
| $100,000 to $149,999 | 54 | 8.9% |
| $150,000 to $199,999 | 15 | 2.5% |
| $200,000+ | 27 | 4.4% |
Household Income by Householder Age in Haven
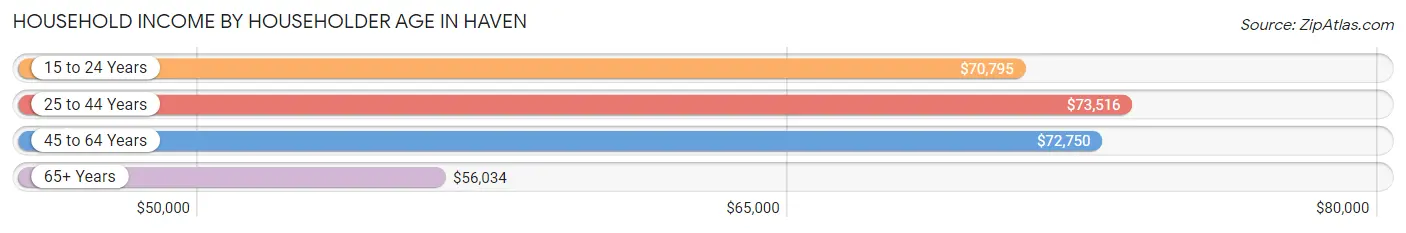
The median household income in Haven is $56,953, with the highest median household income of $73,516 found in the 25 to 44 years age bracket for the primary householder. A total of 141 households (23.2%) fall into this category. Meanwhile, the 65+ years age bracket for the primary householder has the lowest median household income of $56,034, with 311 households (51.2%) in this group.
| Income Bracket | # Households | Median Income |
| 15 to 24 Years | 21 (3.5%) | $70,795 |
| 25 to 44 Years | 141 (23.2%) | $73,516 |
| 45 to 64 Years | 134 (22.1%) | $72,750 |
| 65+ Years | 311 (51.2%) | $56,034 |
| Total | 607 (100.0%) | $56,953 |
Poverty in Haven
Income Below Poverty by Sex and Age in Haven
With 5.3% poverty level for males and 10.3% for females among the residents of Haven, 6 to 11 year old males and 75 year old and over females are the most vulnerable to poverty, with 5 males (45.5%) and 42 females (51.8%) in their respective age groups living below the poverty level.
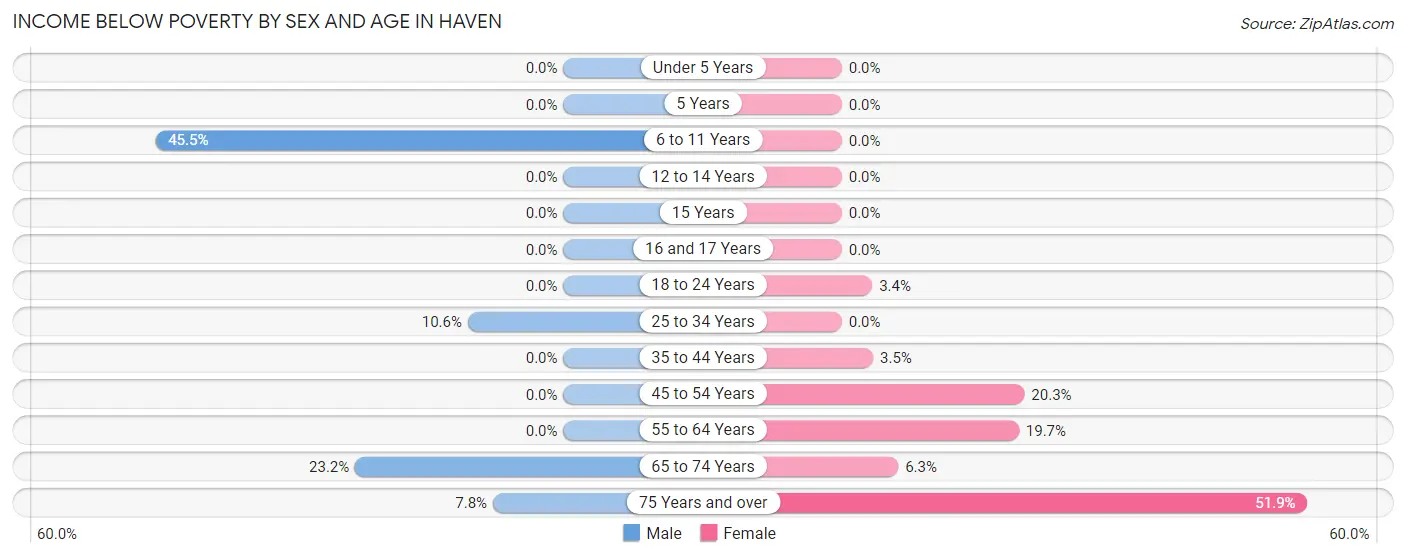
| Age Bracket | Male | Female |
| Under 5 Years | 0 (0.0%) | 0 (0.0%) |
| 5 Years | 0 (0.0%) | 0 (0.0%) |
| 6 to 11 Years | 5 (45.5%) | 0 (0.0%) |
| 12 to 14 Years | 0 (0.0%) | 0 (0.0%) |
| 15 Years | 0 (0.0%) | 0 (0.0%) |
| 16 and 17 Years | 0 (0.0%) | 0 (0.0%) |
| 18 to 24 Years | 0 (0.0%) | 2 (3.4%) |
| 25 to 34 Years | 5 (10.6%) | 0 (0.0%) |
| 35 to 44 Years | 0 (0.0%) | 3 (3.5%) |
| 45 to 54 Years | 0 (0.0%) | 12 (20.3%) |
| 55 to 64 Years | 0 (0.0%) | 14 (19.7%) |
| 65 to 74 Years | 16 (23.2%) | 14 (6.3%) |
| 75 Years and over | 4 (7.8%) | 42 (51.8%) |
| Total | 30 (5.3%) | 87 (10.3%) |
Income Above Poverty by Sex and Age in Haven
According to the poverty statistics in Haven, males aged under 5 years and females aged under 5 years are the age groups that are most secure financially, with 100.0% of males and 100.0% of females in these age groups living above the poverty line.
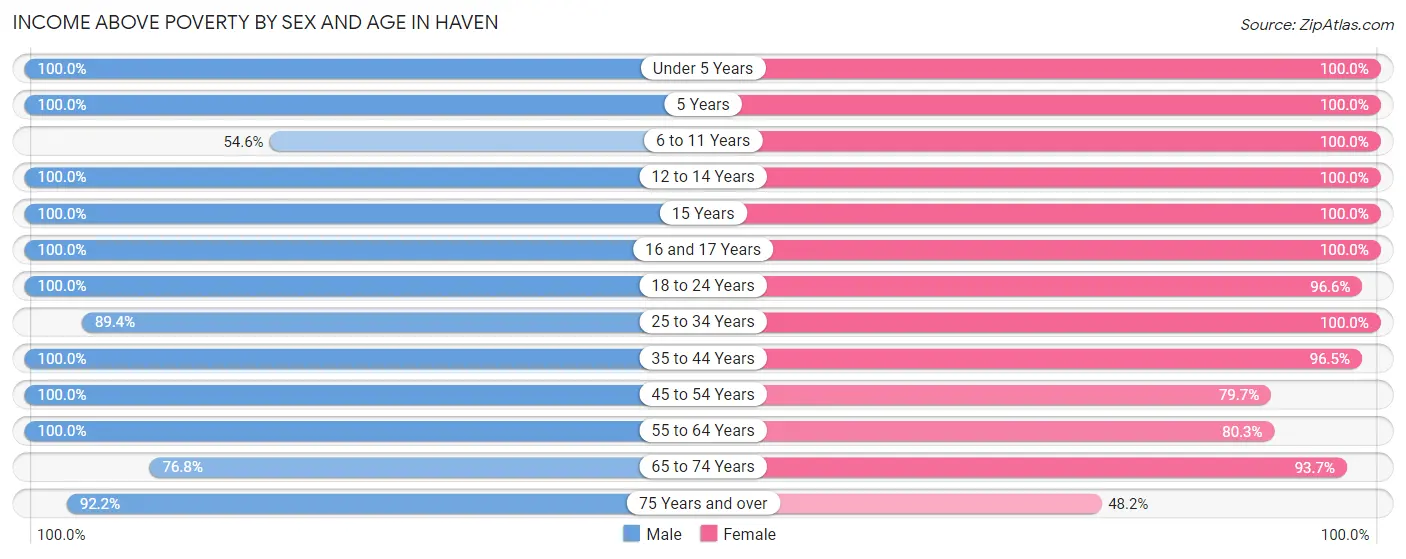
| Age Bracket | Male | Female |
| Under 5 Years | 29 (100.0%) | 31 (100.0%) |
| 5 Years | 19 (100.0%) | 15 (100.0%) |
| 6 to 11 Years | 6 (54.5%) | 77 (100.0%) |
| 12 to 14 Years | 48 (100.0%) | 29 (100.0%) |
| 15 Years | 2 (100.0%) | 12 (100.0%) |
| 16 and 17 Years | 17 (100.0%) | 26 (100.0%) |
| 18 to 24 Years | 55 (100.0%) | 57 (96.6%) |
| 25 to 34 Years | 42 (89.4%) | 76 (100.0%) |
| 35 to 44 Years | 104 (100.0%) | 83 (96.5%) |
| 45 to 54 Years | 68 (100.0%) | 47 (79.7%) |
| 55 to 64 Years | 50 (100.0%) | 57 (80.3%) |
| 65 to 74 Years | 53 (76.8%) | 209 (93.7%) |
| 75 Years and over | 47 (92.2%) | 39 (48.1%) |
| Total | 540 (94.7%) | 758 (89.7%) |
Income Below Poverty Among Married-Couple Families in Haven
The poverty statistics for married-couple families in Haven show that 6.9% or 17 of the total 247 families live below the poverty line. Families with no children have the highest poverty rate of 10.8%, comprising of 17 families. On the other hand, families with 1 or 2 children have the lowest poverty rate of 0.0%, which includes 0 families.
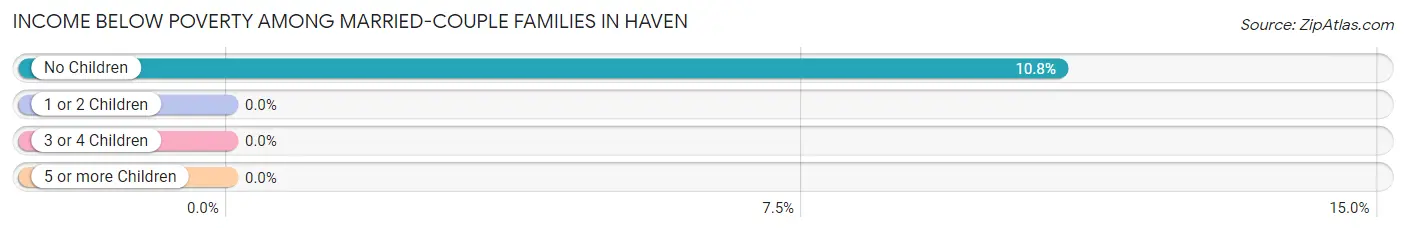
| Children | Above Poverty | Below Poverty |
| No Children | 140 (89.2%) | 17 (10.8%) |
| 1 or 2 Children | 57 (100.0%) | 0 (0.0%) |
| 3 or 4 Children | 33 (100.0%) | 0 (0.0%) |
| 5 or more Children | 0 (0.0%) | 0 (0.0%) |
| Total | 230 (93.1%) | 17 (6.9%) |
Income Below Poverty Among Single-Parent Households in Haven
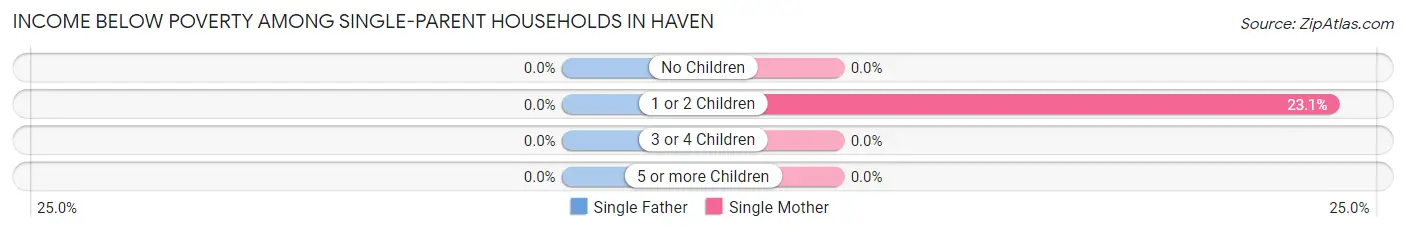
| Children | Single Father | Single Mother |
| No Children | 0 (0.0%) | 0 (0.0%) |
| 1 or 2 Children | 0 (0.0%) | 3 (23.1%) |
| 3 or 4 Children | 0 (0.0%) | 0 (0.0%) |
| 5 or more Children | 0 (0.0%) | 0 (0.0%) |
| Total | 0 (0.0%) | 3 (8.1%) |
Income Below Poverty Among Married-Couple vs Single-Parent Households in Haven
The poverty data for Haven shows that 17 of the married-couple family households (6.9%) and 3 of the single-parent households (5.6%) are living below the poverty level. Within the married-couple family households, those with no children have the highest poverty rate, with 17 households (10.8%) falling below the poverty line. Among the single-parent households, those with 1 or 2 children have the highest poverty rate, with 3 household (17.6%) living below poverty.
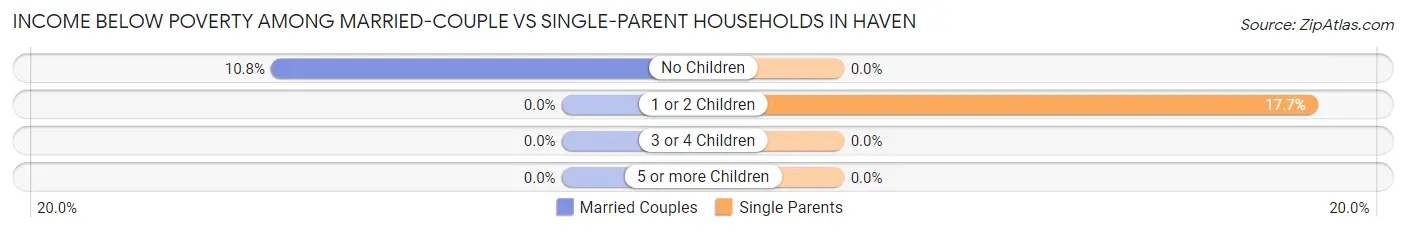
| Children | Married-Couple Families | Single-Parent Households |
| No Children | 17 (10.8%) | 0 (0.0%) |
| 1 or 2 Children | 0 (0.0%) | 3 (17.6%) |
| 3 or 4 Children | 0 (0.0%) | 0 (0.0%) |
| 5 or more Children | 0 (0.0%) | 0 (0.0%) |
| Total | 17 (6.9%) | 3 (5.6%) |
Race in Haven
The most populous races in Haven are White / Caucasian (1,343 | 94.5%), Hispanic or Latino (43 | 3.0%), and Native / Alaskan (40 | 2.8%).
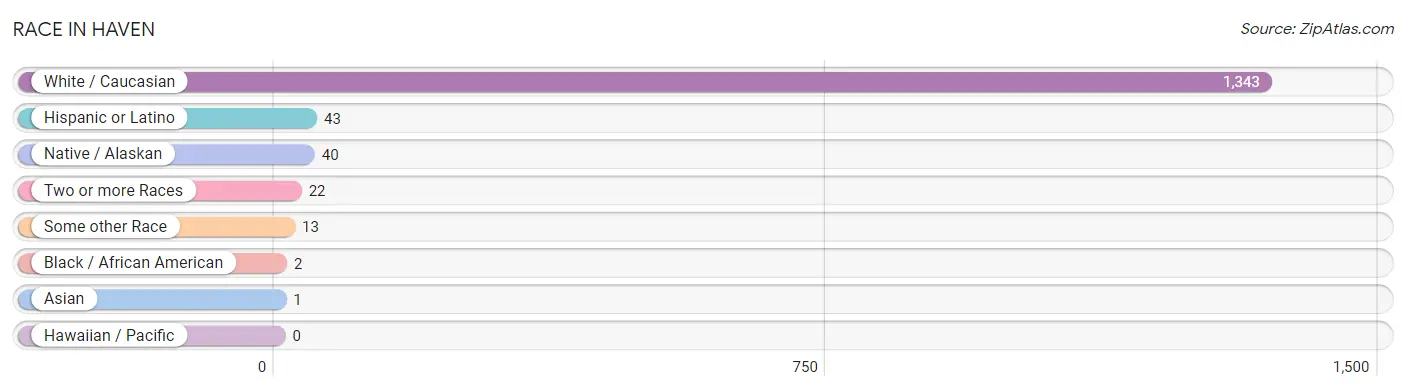
| Race | # Population | % Population |
| Asian | 1 | 0.1% |
| Black / African American | 2 | 0.1% |
| Hawaiian / Pacific | 0 | 0.0% |
| Hispanic or Latino | 43 | 3.0% |
| Native / Alaskan | 40 | 2.8% |
| White / Caucasian | 1,343 | 94.5% |
| Two or more Races | 22 | 1.5% |
| Some other Race | 13 | 0.9% |
| Total | 1,421 | 100.0% |
Ancestry in Haven
The most populous ancestries reported in Haven are German (561 | 39.5%), English (146 | 10.3%), Irish (145 | 10.2%), Swiss (47 | 3.3%), and Mexican (43 | 3.0%), together accounting for 66.3% of all Haven residents.
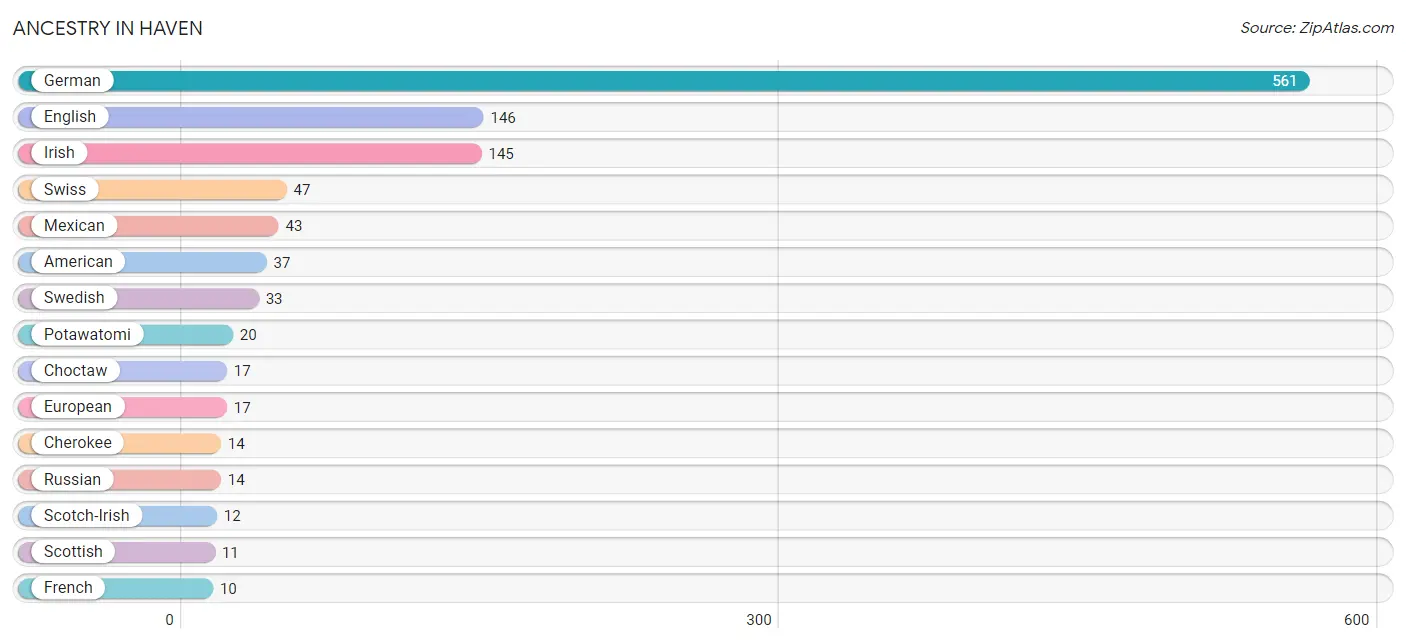
| Ancestry | # Population | % Population |
| American | 37 | 2.6% |
| British | 4 | 0.3% |
| Burmese | 1 | 0.1% |
| Cherokee | 14 | 1.0% |
| Cheyenne | 4 | 0.3% |
| Choctaw | 17 | 1.2% |
| Czechoslovakian | 4 | 0.3% |
| Dutch | 8 | 0.6% |
| English | 146 | 10.3% |
| European | 17 | 1.2% |
| French | 10 | 0.7% |
| German | 561 | 39.5% |
| Greek | 5 | 0.4% |
| Irish | 145 | 10.2% |
| Lithuanian | 4 | 0.3% |
| Mexican | 43 | 3.0% |
| Norwegian | 4 | 0.3% |
| Pennsylvania German | 3 | 0.2% |
| Polish | 8 | 0.6% |
| Potawatomi | 20 | 1.4% |
| Russian | 14 | 1.0% |
| Scotch-Irish | 12 | 0.8% |
| Scottish | 11 | 0.8% |
| Swedish | 33 | 2.3% |
| Swiss | 47 | 3.3% |
| Welsh | 3 | 0.2% | View All 26 Rows |
Immigrants in Haven
The most numerous immigrant groups reported in Haven came from Asia (1 | 0.1%), Eastern Asia (1 | 0.1%), and Korea (1 | 0.1%), together accounting for 0.2% of all Haven residents.
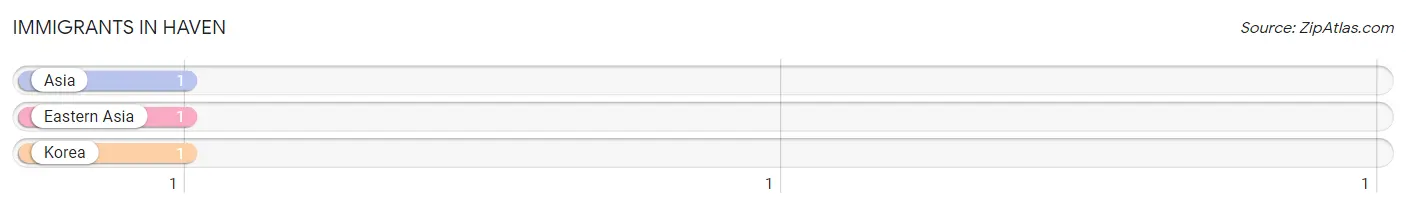
| Immigration Origin | # Population | % Population |
| Asia | 1 | 0.1% |
| Eastern Asia | 1 | 0.1% |
| Korea | 1 | 0.1% | View All 3 Rows |
Sex and Age in Haven
Sex and Age in Haven
The most populous age groups in Haven are 35 to 39 Years (62 | 10.9%) for men and 65 to 69 Years (207 | 24.3%) for women.
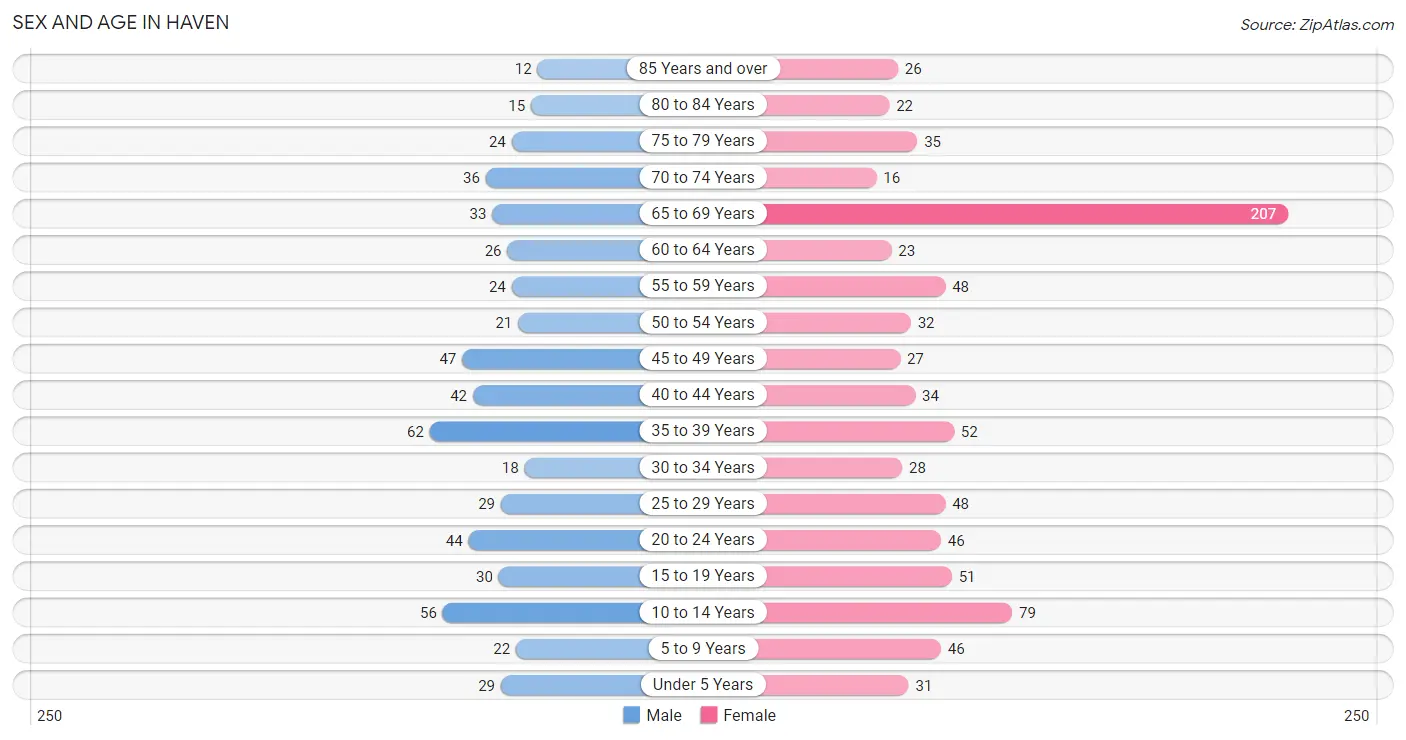
| Age Bracket | Male | Female |
| Under 5 Years | 29 (5.1%) | 31 (3.6%) |
| 5 to 9 Years | 22 (3.9%) | 46 (5.4%) |
| 10 to 14 Years | 56 (9.8%) | 79 (9.3%) |
| 15 to 19 Years | 30 (5.3%) | 51 (6.0%) |
| 20 to 24 Years | 44 (7.7%) | 46 (5.4%) |
| 25 to 29 Years | 29 (5.1%) | 48 (5.6%) |
| 30 to 34 Years | 18 (3.2%) | 28 (3.3%) |
| 35 to 39 Years | 62 (10.9%) | 52 (6.1%) |
| 40 to 44 Years | 42 (7.4%) | 34 (4.0%) |
| 45 to 49 Years | 47 (8.3%) | 27 (3.2%) |
| 50 to 54 Years | 21 (3.7%) | 32 (3.8%) |
| 55 to 59 Years | 24 (4.2%) | 48 (5.6%) |
| 60 to 64 Years | 26 (4.6%) | 23 (2.7%) |
| 65 to 69 Years | 33 (5.8%) | 207 (24.3%) |
| 70 to 74 Years | 36 (6.3%) | 16 (1.9%) |
| 75 to 79 Years | 24 (4.2%) | 35 (4.1%) |
| 80 to 84 Years | 15 (2.6%) | 22 (2.6%) |
| 85 Years and over | 12 (2.1%) | 26 (3.1%) |
| Total | 570 (100.0%) | 851 (100.0%) |
Families and Households in Haven
Median Family Size in Haven
The median family size in Haven is 3.40 persons per family, with single male/father families (17 | 5.7%) accounting for the largest median family size of 4.24 persons per family. On the other hand, married-couple families (247 | 82.1%) represent the smallest median family size with 3.31 persons per family.
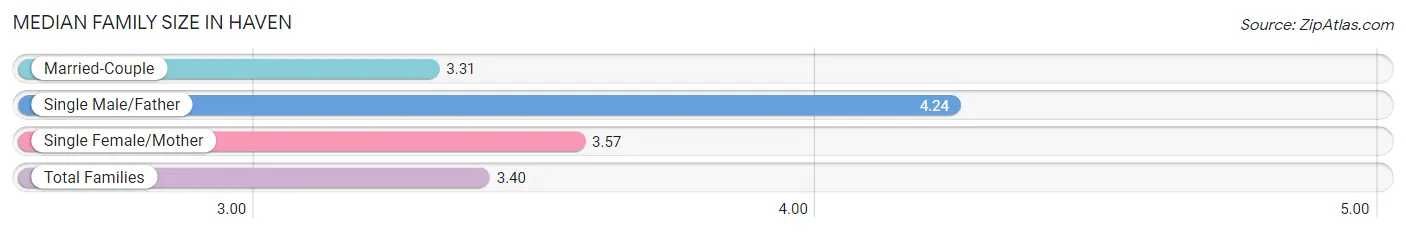
| Family Type | # Families | Family Size |
| Married-Couple | 247 (82.1%) | 3.31 |
| Single Male/Father | 17 (5.7%) | 4.24 |
| Single Female/Mother | 37 (12.3%) | 3.57 |
| Total Families | 301 (100.0%) | 3.40 |
Median Household Size in Haven
The median household size in Haven is 2.34 persons per household, with single male/father households (17 | 2.8%) accounting for the largest median household size of 5.35 persons per household. non-family households (306 | 50.4%) represent the smallest median household size with 1.17 persons per household.
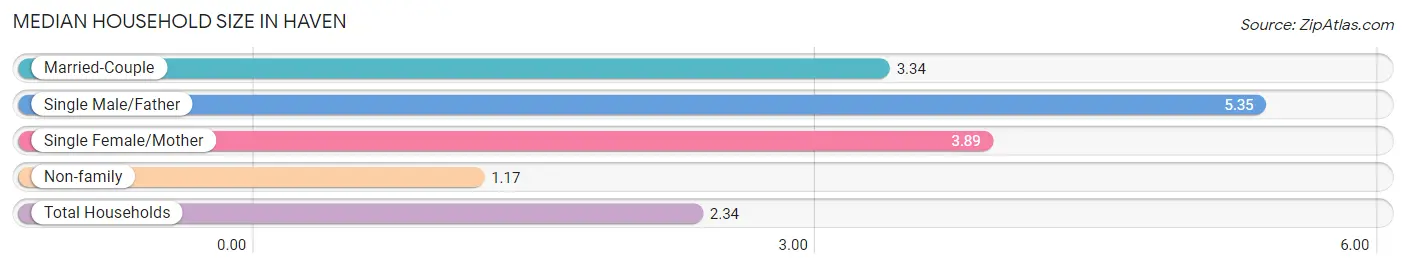
| Household Type | # Households | Household Size |
| Married-Couple | 247 (40.7%) | 3.34 |
| Single Male/Father | 17 (2.8%) | 5.35 |
| Single Female/Mother | 37 (6.1%) | 3.89 |
| Non-family | 306 (50.4%) | 1.17 |
| Total Households | 607 (100.0%) | 2.34 |
Household Size by Marriage Status in Haven
Out of a total of 607 households in Haven, 301 (49.6%) are family households, while 306 (50.4%) are nonfamily households. The most numerous type of family households are 2-person households, comprising 125, and the most common type of nonfamily households are 1-person households, comprising 282.
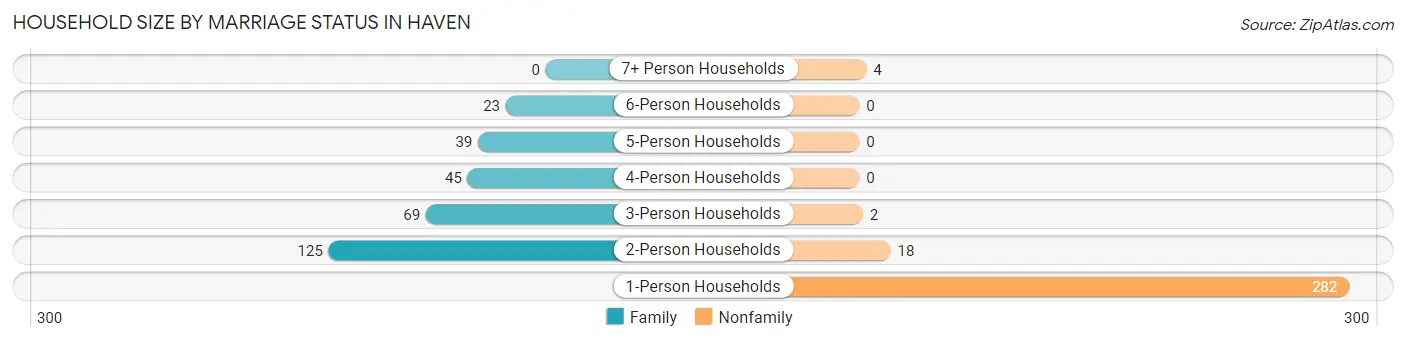
| Household Size | Family Households | Nonfamily Households |
| 1-Person Households | - | 282 (46.5%) |
| 2-Person Households | 125 (20.6%) | 18 (3.0%) |
| 3-Person Households | 69 (11.4%) | 2 (0.3%) |
| 4-Person Households | 45 (7.4%) | 0 (0.0%) |
| 5-Person Households | 39 (6.4%) | 0 (0.0%) |
| 6-Person Households | 23 (3.8%) | 0 (0.0%) |
| 7+ Person Households | 0 (0.0%) | 4 (0.7%) |
| Total | 301 (49.6%) | 306 (50.4%) |
Female Fertility in Haven
Fertility by Age in Haven
Average fertility rate in Haven is 10.0 births per 1,000 women. Women in the age bracket of 35 to 50 years have the highest fertility rate with 27.0 births per 1,000 women. Women in the age bracket of 35 to 50 years acount for 100.0% of all women with births.
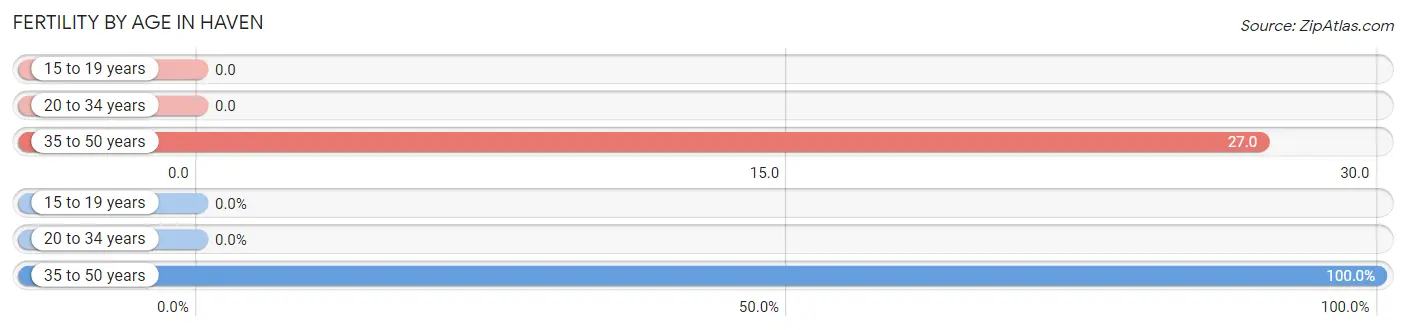
| Age Bracket | Women with Births | Births / 1,000 Women |
| 15 to 19 years | 0 (0.0%) | 0.0 |
| 20 to 34 years | 0 (0.0%) | 0.0 |
| 35 to 50 years | 3 (100.0%) | 27.0 |
| Total | 3 (100.0%) | 10.0 |
Fertility by Age by Marriage Status in Haven
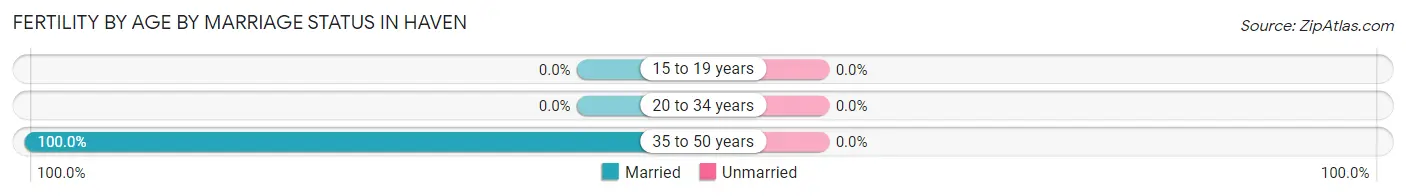
| Age Bracket | Married | Unmarried |
| 15 to 19 years | 0 (0.0%) | 0 (0.0%) |
| 20 to 34 years | 0 (0.0%) | 0 (0.0%) |
| 35 to 50 years | 3 (100.0%) | 0 (0.0%) |
| Total | 3 (100.0%) | 0 (0.0%) |
Fertility by Education in Haven
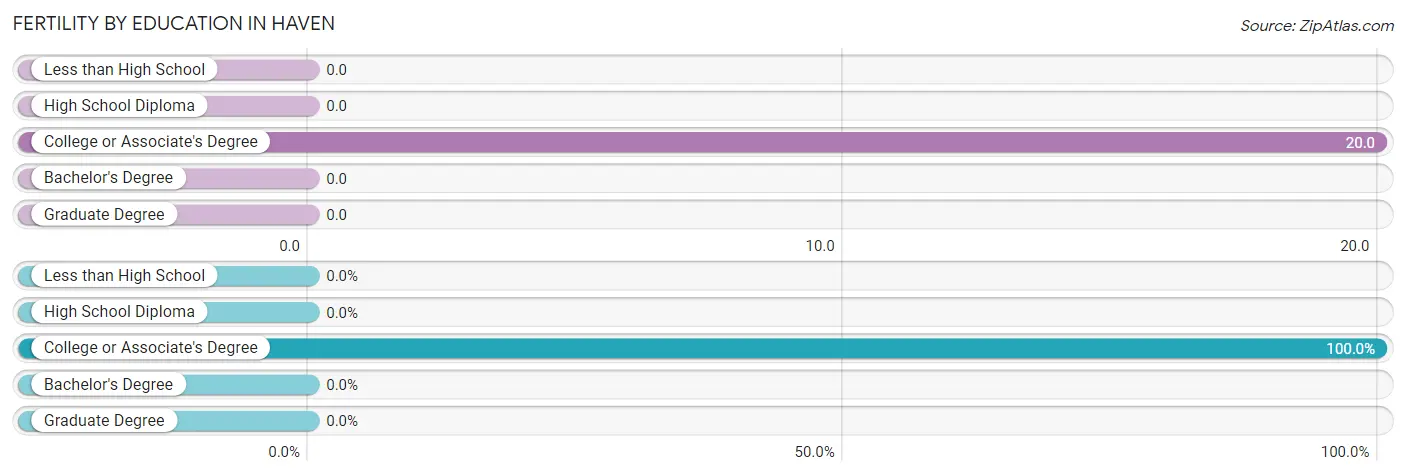
| Educational Attainment | Women with Births | Births / 1,000 Women |
| Less than High School | 0 (0.0%) | 0.0 |
| High School Diploma | 0 (0.0%) | 0.0 |
| College or Associate's Degree | 3 (100.0%) | 20.0 |
| Bachelor's Degree | 0 (0.0%) | 0.0 |
| Graduate Degree | 0 (0.0%) | 0.0 |
| Total | 3 (100.0%) | 10.0 |
Fertility by Education by Marriage Status in Haven
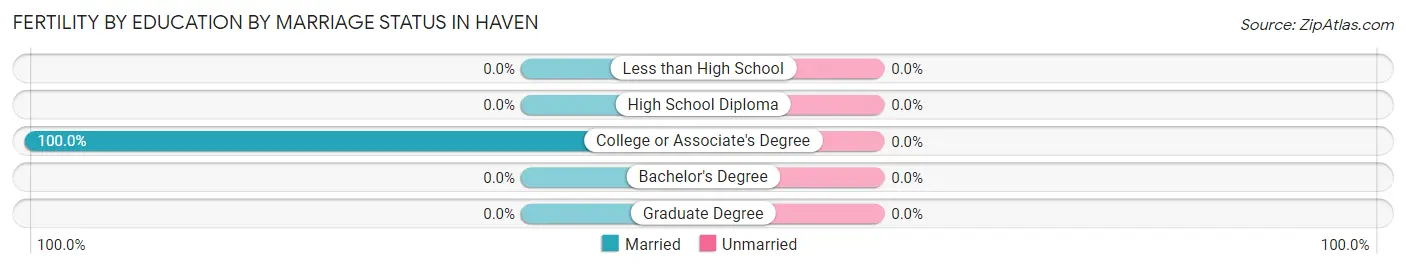
| Educational Attainment | Married | Unmarried |
| Less than High School | 0 (0.0%) | 0 (0.0%) |
| High School Diploma | 0 (0.0%) | 0 (0.0%) |
| College or Associate's Degree | 3 (100.0%) | 0 (0.0%) |
| Bachelor's Degree | 0 (0.0%) | 0 (0.0%) |
| Graduate Degree | 0 (0.0%) | 0 (0.0%) |
| Total | 3 (100.0%) | 0 (0.0%) |
Employment Characteristics in Haven
Employment by Class of Employer in Haven
Among the 798 employed individuals in Haven, private company employees (564 | 70.7%), local government employees (65 | 8.2%), and not-for-profit organizations (58 | 7.3%) make up the most common classes of employment.
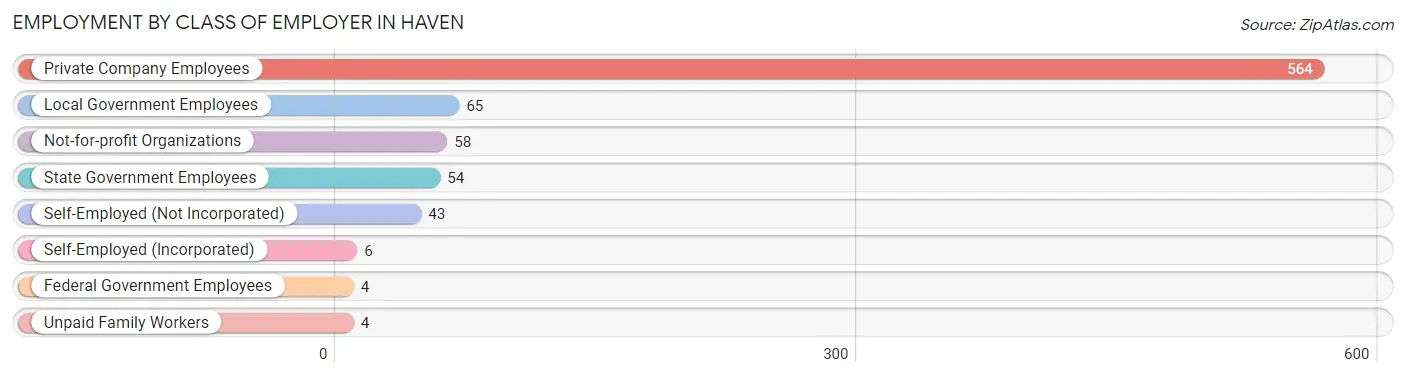
| Employer Class | # Employees | % Employees |
| Private Company Employees | 564 | 70.7% |
| Self-Employed (Incorporated) | 6 | 0.7% |
| Self-Employed (Not Incorporated) | 43 | 5.4% |
| Not-for-profit Organizations | 58 | 7.3% |
| Local Government Employees | 65 | 8.2% |
| State Government Employees | 54 | 6.8% |
| Federal Government Employees | 4 | 0.5% |
| Unpaid Family Workers | 4 | 0.5% |
| Total | 798 | 100.0% |
Employment Status by Age in Haven
According to the labor force statistics for Haven, out of the total population over 16 years of age (1,144), 71.9% or 823 individuals are in the labor force, with 2.4% or 20 of them unemployed. The age group with the highest labor force participation rate is 25 to 29 years, with 100.0% or 77 individuals in the labor force. Within the labor force, the 16 to 19 years age range has the highest percentage of unemployed individuals, with 47.2% or 17 of them being unemployed.
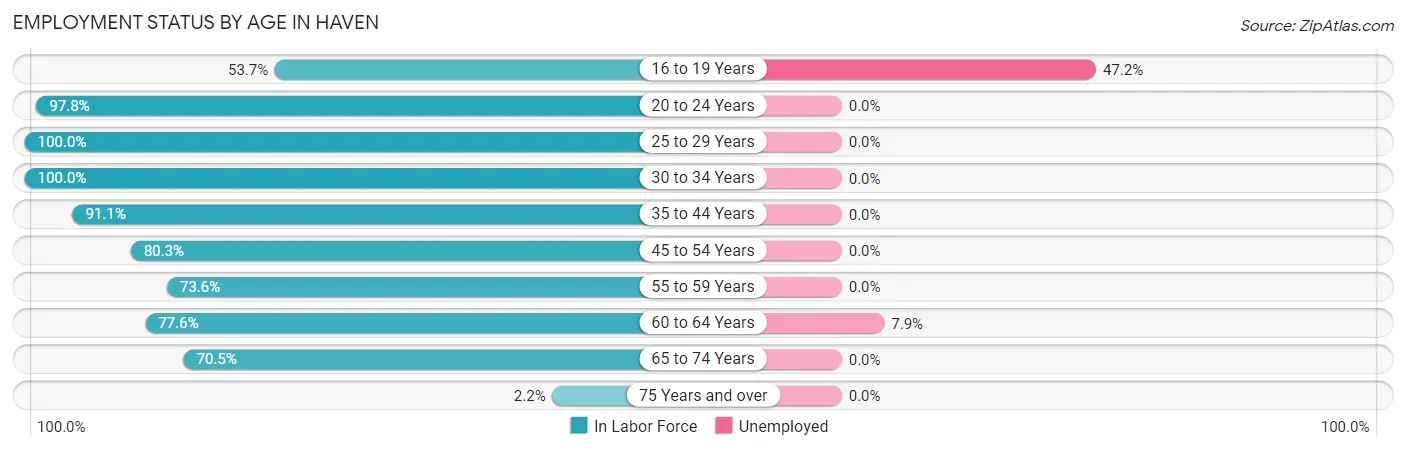
| Age Bracket | In Labor Force | Unemployed |
| 16 to 19 Years | 36 (53.7%) | 17 (47.2%) |
| 20 to 24 Years | 88 (97.8%) | 0 (0.0%) |
| 25 to 29 Years | 77 (100.0%) | 0 (0.0%) |
| 30 to 34 Years | 46 (100.0%) | 0 (0.0%) |
| 35 to 44 Years | 173 (91.1%) | 0 (0.0%) |
| 45 to 54 Years | 102 (80.3%) | 0 (0.0%) |
| 55 to 59 Years | 53 (73.6%) | 0 (0.0%) |
| 60 to 64 Years | 38 (77.6%) | 3 (7.9%) |
| 65 to 74 Years | 206 (70.5%) | 0 (0.0%) |
| 75 Years and over | 3 (2.2%) | 0 (0.0%) |
| Total | 823 (71.9%) | 20 (2.4%) |
Employment Status by Educational Attainment in Haven
According to labor force statistics for Haven, 87.2% of individuals (489) out of the total population between 25 and 64 years of age (561) are in the labor force, with 0.6% or 3 of them being unemployed. The group with the highest labor force participation rate are those with the educational attainment of bachelor's degree or higher, with 95.5% or 107 individuals in the labor force. Within the labor force, individuals with less than high school education have the highest percentage of unemployment, with 16.7% or 3 of them being unemployed.
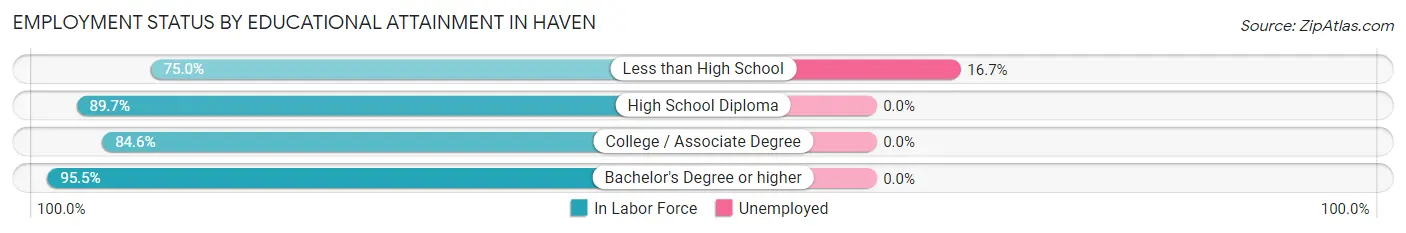
| Educational Attainment | In Labor Force | Unemployed |
| Less than High School | 18 (75.0%) | 4 (16.7%) |
| High School Diploma | 78 (89.7%) | 0 (0.0%) |
| College / Associate Degree | 286 (84.6%) | 0 (0.0%) |
| Bachelor's Degree or higher | 107 (95.5%) | 0 (0.0%) |
| Total | 489 (87.2%) | 3 (0.6%) |
Employment Occupations by Sex in Haven
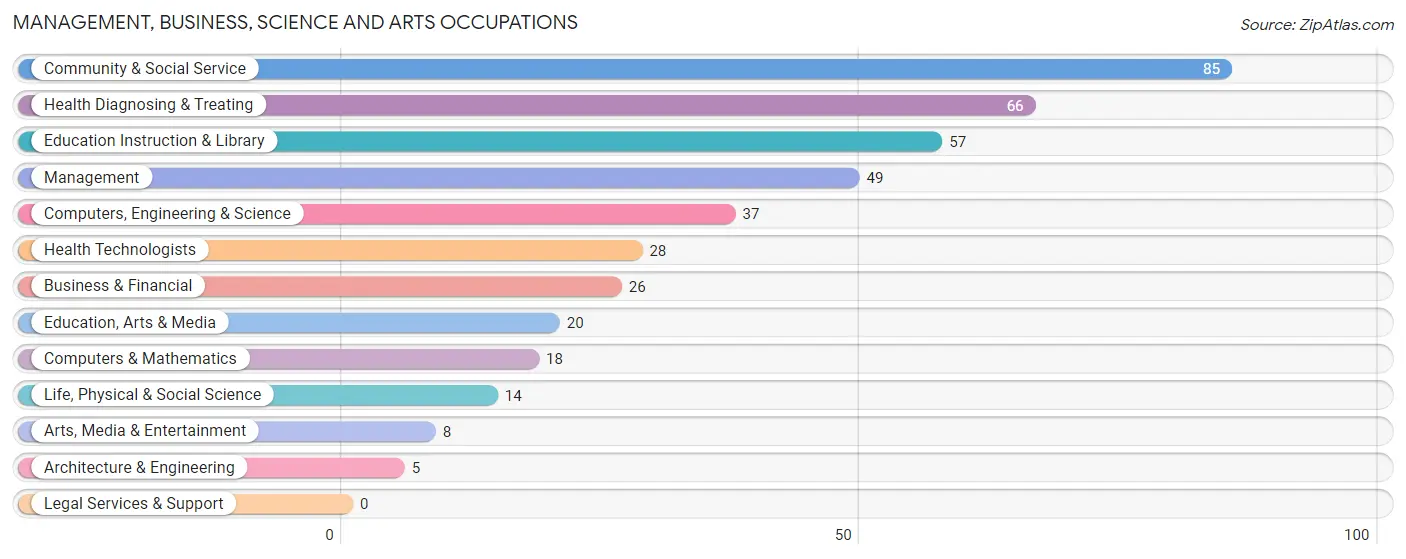
Management, Business, Science and Arts Occupations
The most common Management, Business, Science and Arts occupations in Haven are Community & Social Service (85 | 10.6%), Health Diagnosing & Treating (66 | 8.2%), Education Instruction & Library (57 | 7.1%), Management (49 | 6.1%), and Computers, Engineering & Science (37 | 4.6%).
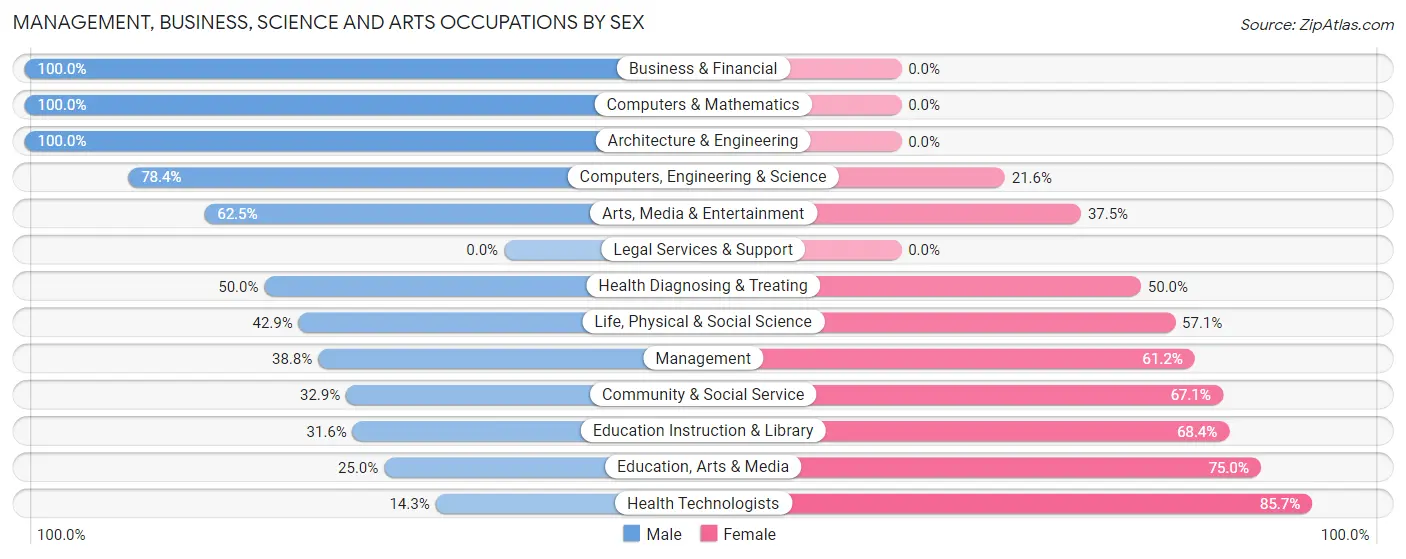
Management, Business, Science and Arts Occupations by Sex
Within the Management, Business, Science and Arts occupations in Haven, the most male-oriented occupations are Business & Financial (100.0%), Computers & Mathematics (100.0%), and Architecture & Engineering (100.0%), while the most female-oriented occupations are Health Technologists (85.7%), Education, Arts & Media (75.0%), and Education Instruction & Library (68.4%).
| Occupation | Male | Female |
| Management | 19 (38.8%) | 30 (61.2%) |
| Business & Financial | 26 (100.0%) | 0 (0.0%) |
| Computers, Engineering & Science | 29 (78.4%) | 8 (21.6%) |
| Computers & Mathematics | 18 (100.0%) | 0 (0.0%) |
| Architecture & Engineering | 5 (100.0%) | 0 (0.0%) |
| Life, Physical & Social Science | 6 (42.9%) | 8 (57.1%) |
| Community & Social Service | 28 (32.9%) | 57 (67.1%) |
| Education, Arts & Media | 5 (25.0%) | 15 (75.0%) |
| Legal Services & Support | 0 (0.0%) | 0 (0.0%) |
| Education Instruction & Library | 18 (31.6%) | 39 (68.4%) |
| Arts, Media & Entertainment | 5 (62.5%) | 3 (37.5%) |
| Health Diagnosing & Treating | 33 (50.0%) | 33 (50.0%) |
| Health Technologists | 4 (14.3%) | 24 (85.7%) |
| Total (Category) | 135 (51.3%) | 128 (48.7%) |
| Total (Overall) | 317 (39.5%) | 485 (60.5%) |
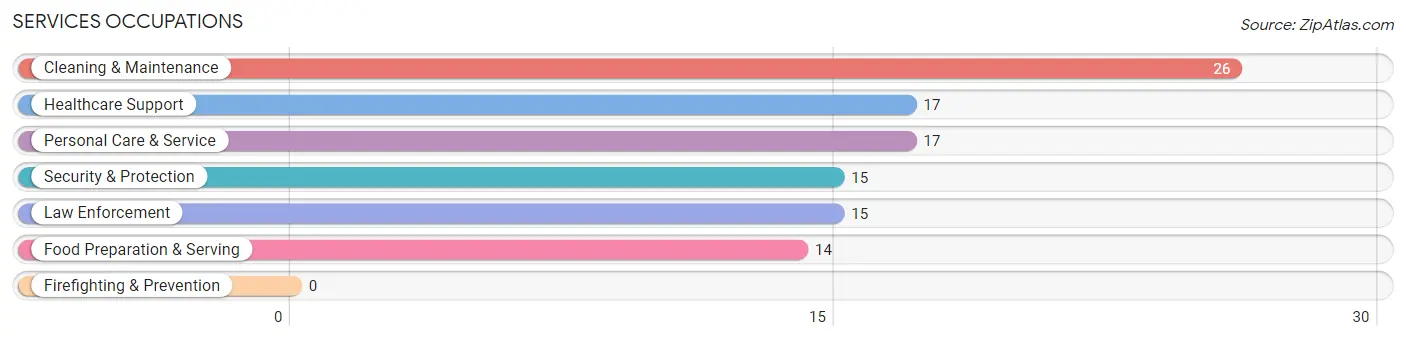
Services Occupations
The most common Services occupations in Haven are Cleaning & Maintenance (26 | 3.2%), Healthcare Support (17 | 2.1%), Personal Care & Service (17 | 2.1%), Security & Protection (15 | 1.9%), and Law Enforcement (15 | 1.9%).
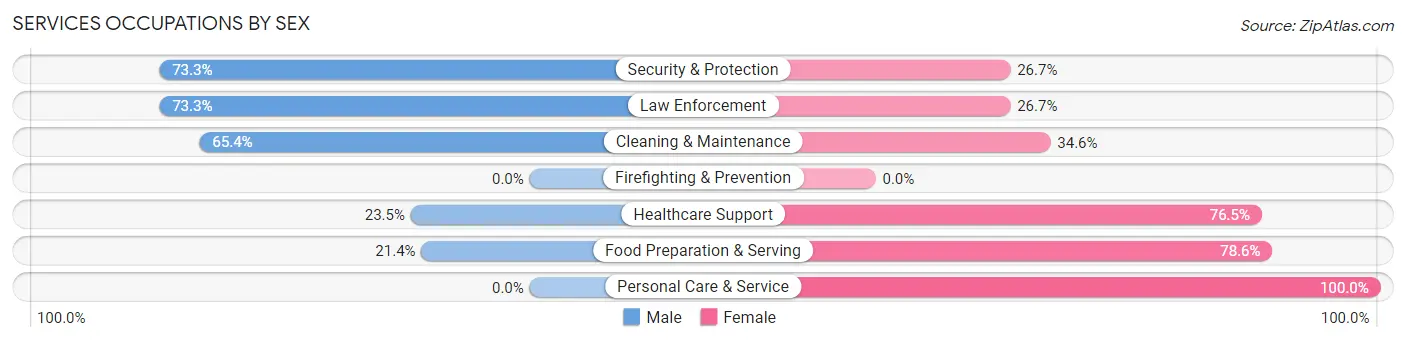
Services Occupations by Sex
Within the Services occupations in Haven, the most male-oriented occupations are Security & Protection (73.3%), Law Enforcement (73.3%), and Cleaning & Maintenance (65.4%), while the most female-oriented occupations are Personal Care & Service (100.0%), Food Preparation & Serving (78.6%), and Healthcare Support (76.5%).
| Occupation | Male | Female |
| Healthcare Support | 4 (23.5%) | 13 (76.5%) |
| Security & Protection | 11 (73.3%) | 4 (26.7%) |
| Firefighting & Prevention | 0 (0.0%) | 0 (0.0%) |
| Law Enforcement | 11 (73.3%) | 4 (26.7%) |
| Food Preparation & Serving | 3 (21.4%) | 11 (78.6%) |
| Cleaning & Maintenance | 17 (65.4%) | 9 (34.6%) |
| Personal Care & Service | 0 (0.0%) | 17 (100.0%) |
| Total (Category) | 35 (39.3%) | 54 (60.7%) |
| Total (Overall) | 317 (39.5%) | 485 (60.5%) |
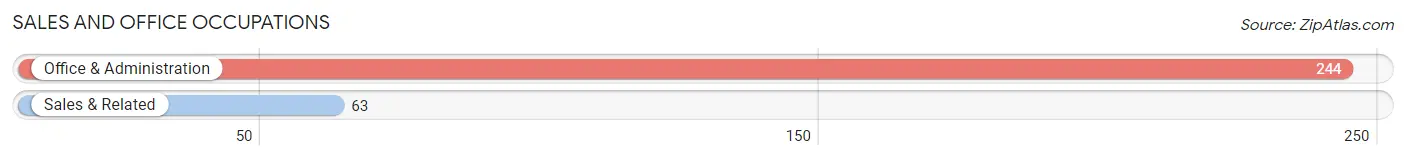
Sales and Office Occupations
The most common Sales and Office occupations in Haven are Office & Administration (244 | 30.4%), and Sales & Related (63 | 7.9%).
Sales and Office Occupations by Sex
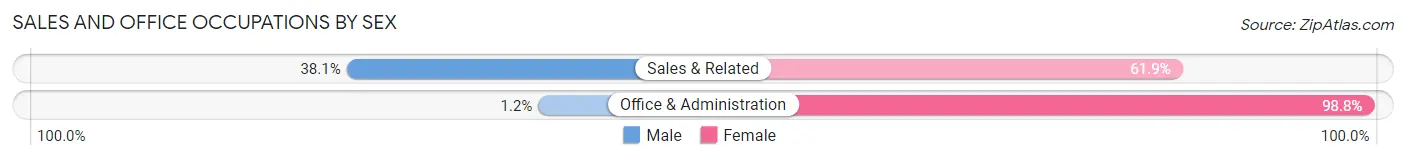
| Occupation | Male | Female |
| Sales & Related | 24 (38.1%) | 39 (61.9%) |
| Office & Administration | 3 (1.2%) | 241 (98.8%) |
| Total (Category) | 27 (8.8%) | 280 (91.2%) |
| Total (Overall) | 317 (39.5%) | 485 (60.5%) |
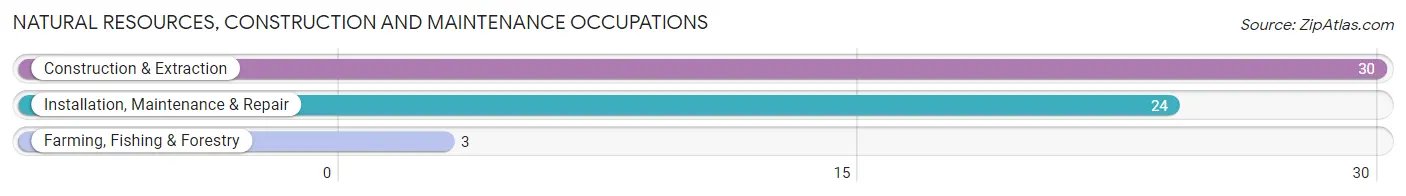
Natural Resources, Construction and Maintenance Occupations
The most common Natural Resources, Construction and Maintenance occupations in Haven are Construction & Extraction (30 | 3.7%), Installation, Maintenance & Repair (24 | 3.0%), and Farming, Fishing & Forestry (3 | 0.4%).
Natural Resources, Construction and Maintenance Occupations by Sex
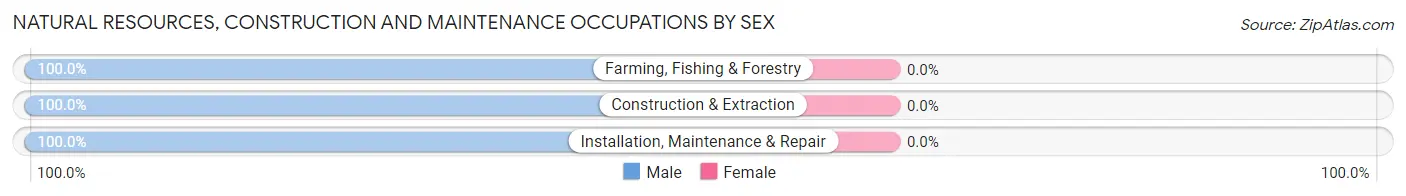
| Occupation | Male | Female |
| Farming, Fishing & Forestry | 3 (100.0%) | 0 (0.0%) |
| Construction & Extraction | 30 (100.0%) | 0 (0.0%) |
| Installation, Maintenance & Repair | 24 (100.0%) | 0 (0.0%) |
| Total (Category) | 57 (100.0%) | 0 (0.0%) |
| Total (Overall) | 317 (39.5%) | 485 (60.5%) |
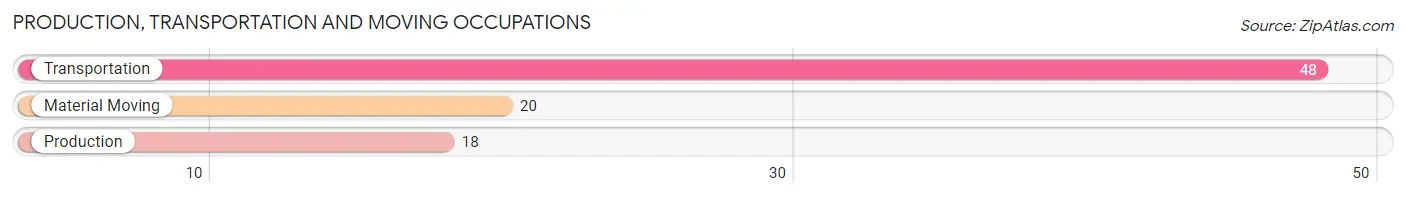
Production, Transportation and Moving Occupations
The most common Production, Transportation and Moving occupations in Haven are Transportation (48 | 6.0%), Material Moving (20 | 2.5%), and Production (18 | 2.2%).
Production, Transportation and Moving Occupations by Sex
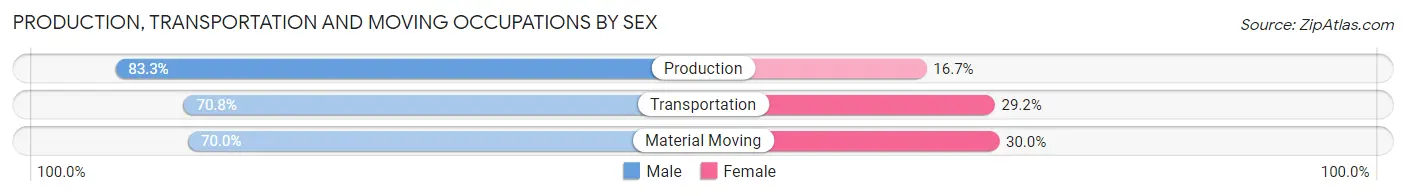
| Occupation | Male | Female |
| Production | 15 (83.3%) | 3 (16.7%) |
| Transportation | 34 (70.8%) | 14 (29.2%) |
| Material Moving | 14 (70.0%) | 6 (30.0%) |
| Total (Category) | 63 (73.3%) | 23 (26.7%) |
| Total (Overall) | 317 (39.5%) | 485 (60.5%) |
Employment Industries by Sex in Haven
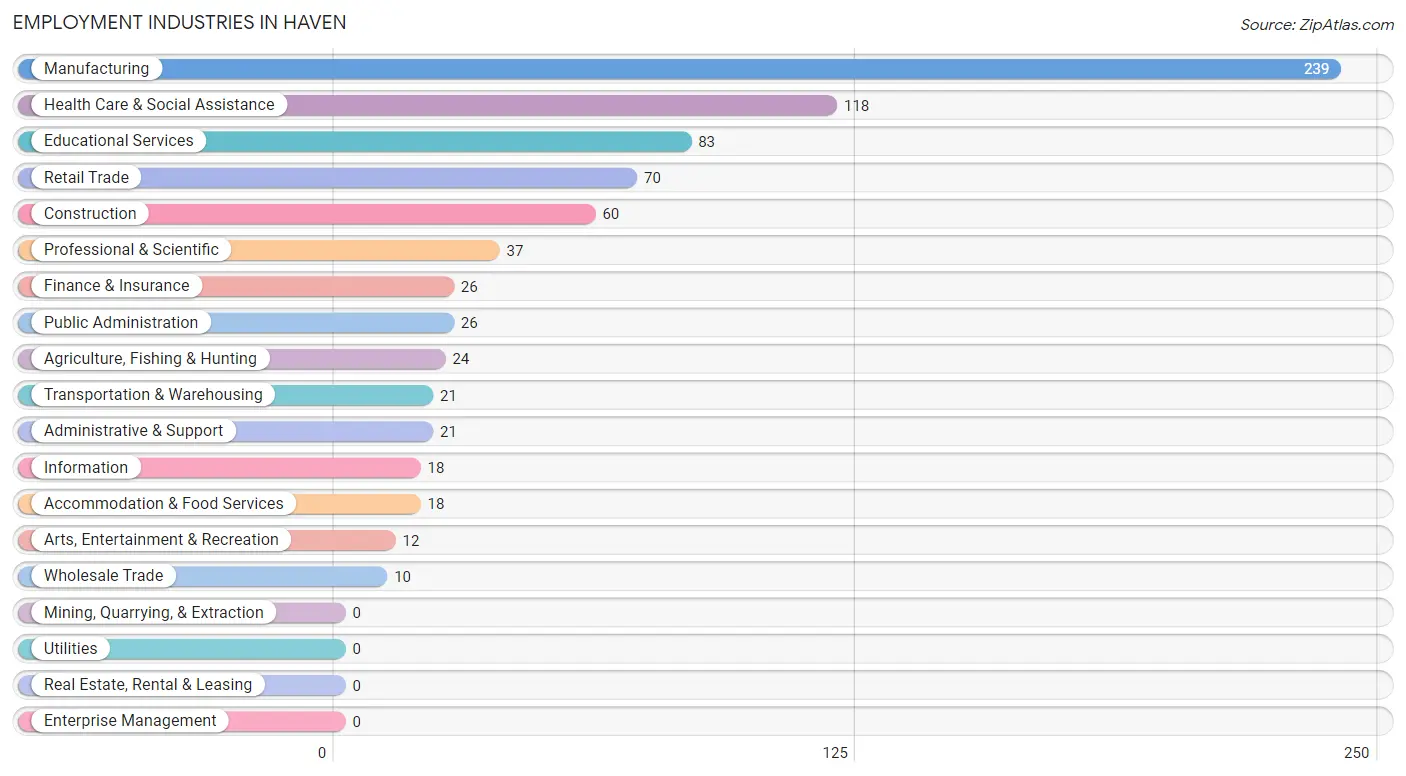
Employment Industries in Haven
The major employment industries in Haven include Manufacturing (239 | 29.8%), Health Care & Social Assistance (118 | 14.7%), Educational Services (83 | 10.3%), Retail Trade (70 | 8.7%), and Construction (60 | 7.5%).
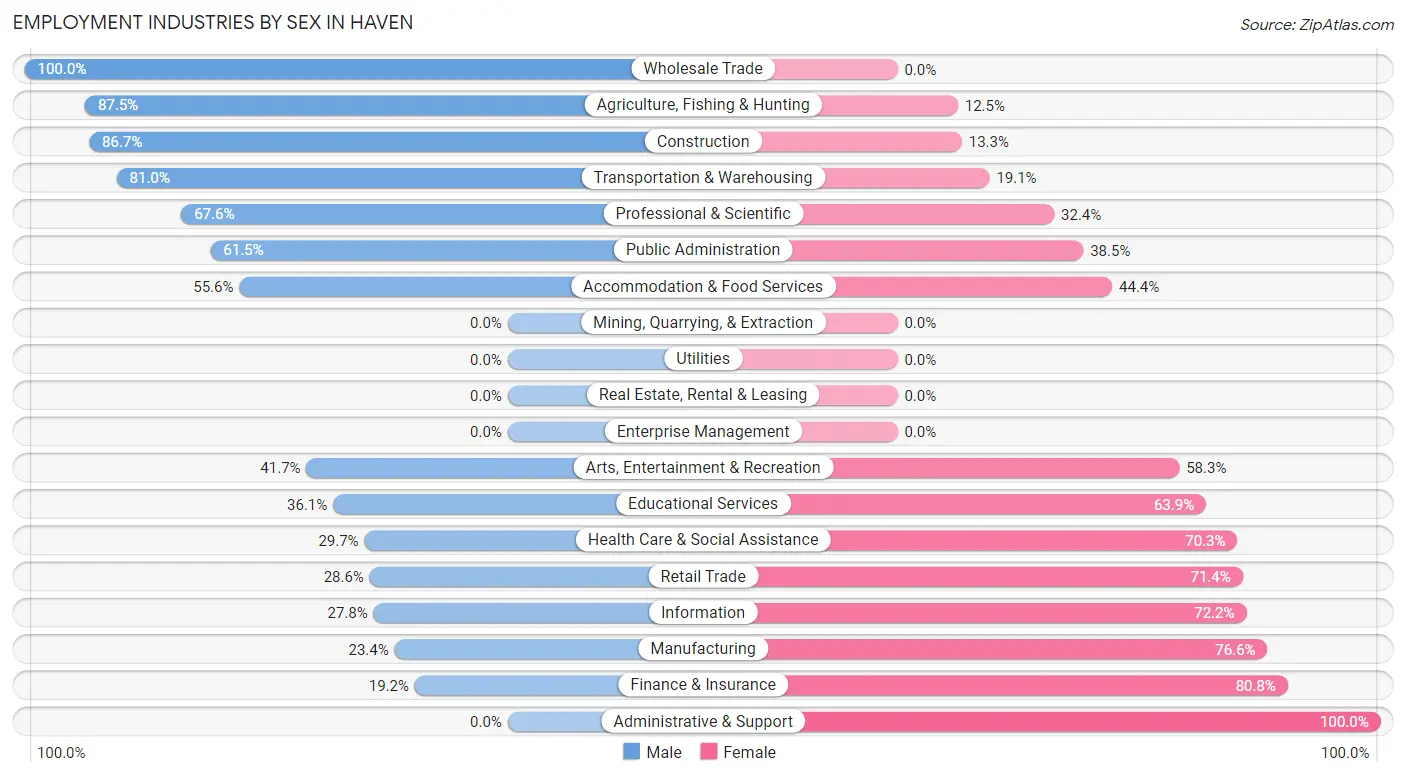
Employment Industries by Sex in Haven
The Haven industries that see more men than women are Wholesale Trade (100.0%), Agriculture, Fishing & Hunting (87.5%), and Construction (86.7%), whereas the industries that tend to have a higher number of women are Administrative & Support (100.0%), Finance & Insurance (80.8%), and Manufacturing (76.6%).
| Industry | Male | Female |
| Agriculture, Fishing & Hunting | 21 (87.5%) | 3 (12.5%) |
| Mining, Quarrying, & Extraction | 0 (0.0%) | 0 (0.0%) |
| Construction | 52 (86.7%) | 8 (13.3%) |
| Manufacturing | 56 (23.4%) | 183 (76.6%) |
| Wholesale Trade | 10 (100.0%) | 0 (0.0%) |
| Retail Trade | 20 (28.6%) | 50 (71.4%) |
| Transportation & Warehousing | 17 (80.9%) | 4 (19.1%) |
| Utilities | 0 (0.0%) | 0 (0.0%) |
| Information | 5 (27.8%) | 13 (72.2%) |
| Finance & Insurance | 5 (19.2%) | 21 (80.8%) |
| Real Estate, Rental & Leasing | 0 (0.0%) | 0 (0.0%) |
| Professional & Scientific | 25 (67.6%) | 12 (32.4%) |
| Enterprise Management | 0 (0.0%) | 0 (0.0%) |
| Administrative & Support | 0 (0.0%) | 21 (100.0%) |
| Educational Services | 30 (36.1%) | 53 (63.9%) |
| Health Care & Social Assistance | 35 (29.7%) | 83 (70.3%) |
| Arts, Entertainment & Recreation | 5 (41.7%) | 7 (58.3%) |
| Accommodation & Food Services | 10 (55.6%) | 8 (44.4%) |
| Public Administration | 16 (61.5%) | 10 (38.5%) |
| Total | 317 (39.5%) | 485 (60.5%) |
Education in Haven
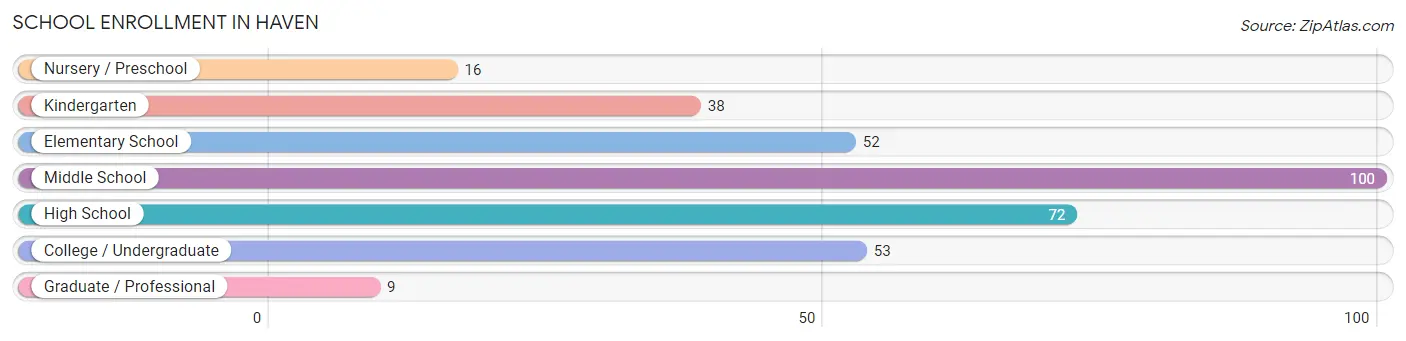
School Enrollment in Haven
The most common levels of schooling among the 340 students in Haven are middle school (100 | 29.4%), high school (72 | 21.2%), and college / undergraduate (53 | 15.6%).
| School Level | # Students | % Students |
| Nursery / Preschool | 16 | 4.7% |
| Kindergarten | 38 | 11.2% |
| Elementary School | 52 | 15.3% |
| Middle School | 100 | 29.4% |
| High School | 72 | 21.2% |
| College / Undergraduate | 53 | 15.6% |
| Graduate / Professional | 9 | 2.6% |
| Total | 340 | 100.0% |
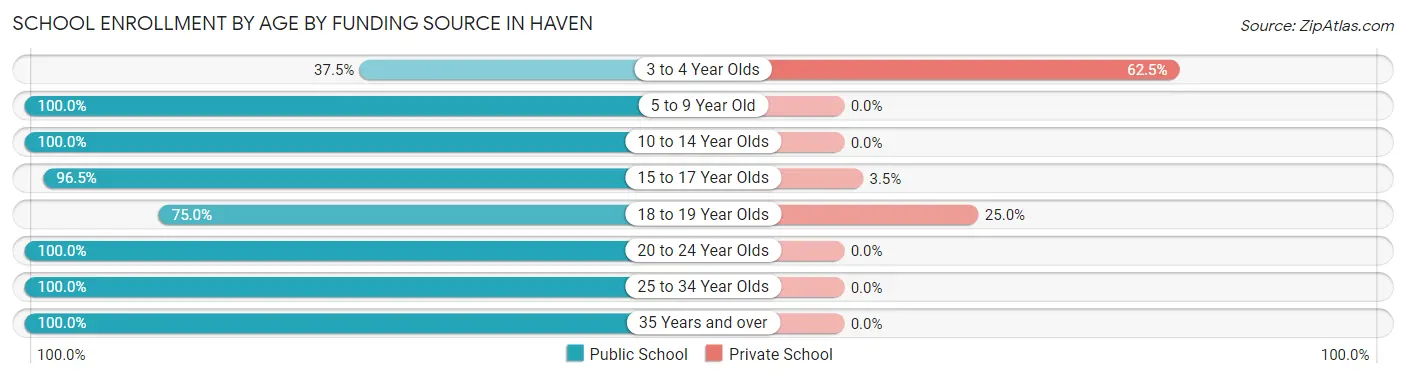
School Enrollment by Age by Funding Source in Haven
Out of a total of 340 students who are enrolled in schools in Haven, 16 (4.7%) attend a private institution, while the remaining 324 (95.3%) are enrolled in public schools. The age group of 3 to 4 year olds has the highest likelihood of being enrolled in private schools, with 10 (62.5% in the age bracket) enrolled. Conversely, the age group of 5 to 9 year old has the lowest likelihood of being enrolled in a private school, with 68 (100.0% in the age bracket) attending a public institution.
| Age Bracket | Public School | Private School |
| 3 to 4 Year Olds | 6 (37.5%) | 10 (62.5%) |
| 5 to 9 Year Old | 68 (100.0%) | 0 (0.0%) |
| 10 to 14 Year Olds | 135 (100.0%) | 0 (0.0%) |
| 15 to 17 Year Olds | 55 (96.5%) | 2 (3.5%) |
| 18 to 19 Year Olds | 12 (75.0%) | 4 (25.0%) |
| 20 to 24 Year Olds | 26 (100.0%) | 0 (0.0%) |
| 25 to 34 Year Olds | 10 (100.0%) | 0 (0.0%) |
| 35 Years and over | 12 (100.0%) | 0 (0.0%) |
| Total | 324 (95.3%) | 16 (4.7%) |
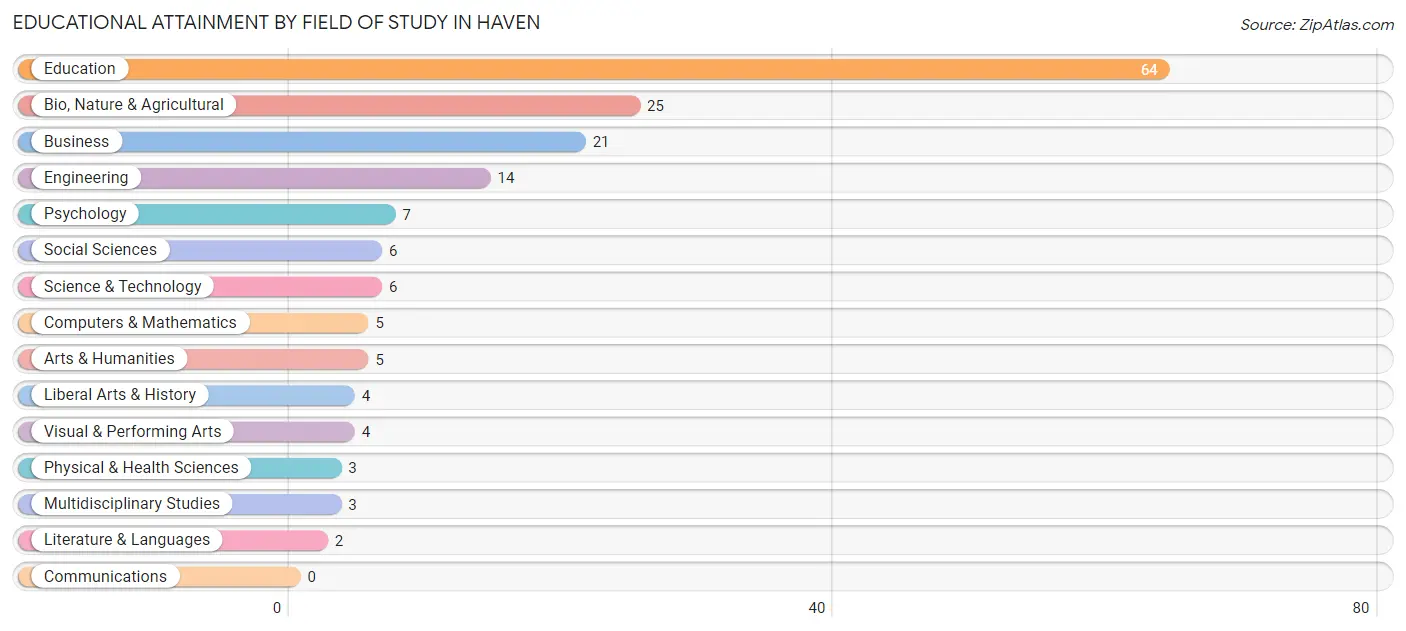
Educational Attainment by Field of Study in Haven
Education (64 | 37.9%), bio, nature & agricultural (25 | 14.8%), business (21 | 12.4%), engineering (14 | 8.3%), and psychology (7 | 4.1%) are the most common fields of study among 169 individuals in Haven who have obtained a bachelor's degree or higher.
| Field of Study | # Graduates | % Graduates |
| Computers & Mathematics | 5 | 3.0% |
| Bio, Nature & Agricultural | 25 | 14.8% |
| Physical & Health Sciences | 3 | 1.8% |
| Psychology | 7 | 4.1% |
| Social Sciences | 6 | 3.5% |
| Engineering | 14 | 8.3% |
| Multidisciplinary Studies | 3 | 1.8% |
| Science & Technology | 6 | 3.5% |
| Business | 21 | 12.4% |
| Education | 64 | 37.9% |
| Literature & Languages | 2 | 1.2% |
| Liberal Arts & History | 4 | 2.4% |
| Visual & Performing Arts | 4 | 2.4% |
| Communications | 0 | 0.0% |
| Arts & Humanities | 5 | 3.0% |
| Total | 169 | 100.0% |
Transportation & Commute in Haven
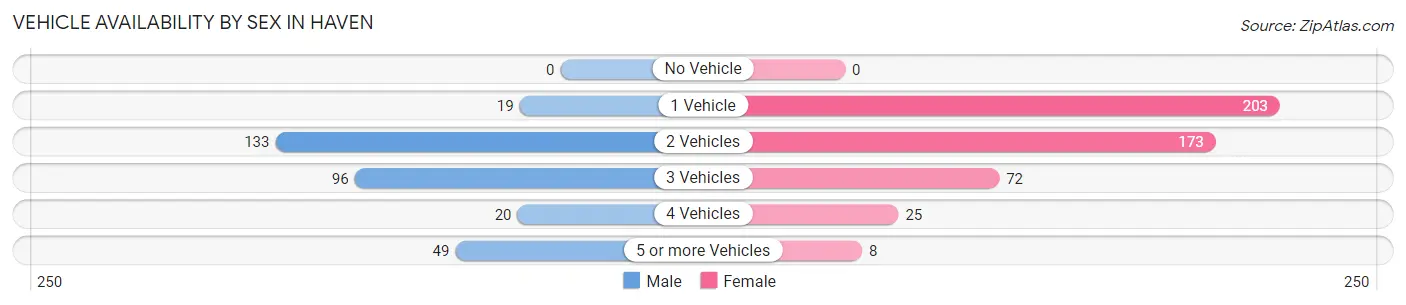
Vehicle Availability by Sex in Haven
The most prevalent vehicle ownership categories in Haven are males with 2 vehicles (133, accounting for 42.0%) and females with 2 vehicles (173, making up 27.7%).
| Vehicles Available | Male | Female |
| No Vehicle | 0 (0.0%) | 0 (0.0%) |
| 1 Vehicle | 19 (6.0%) | 203 (42.2%) |
| 2 Vehicles | 133 (42.0%) | 173 (36.0%) |
| 3 Vehicles | 96 (30.3%) | 72 (15.0%) |
| 4 Vehicles | 20 (6.3%) | 25 (5.2%) |
| 5 or more Vehicles | 49 (15.5%) | 8 (1.7%) |
| Total | 317 (100.0%) | 481 (100.0%) |
Commute Time in Haven
The most frequently occuring commute durations in Haven are 30 to 34 minutes (215 commuters, 28.1%), 20 to 24 minutes (118 commuters, 15.4%), and 5 to 9 minutes (69 commuters, 9.0%).
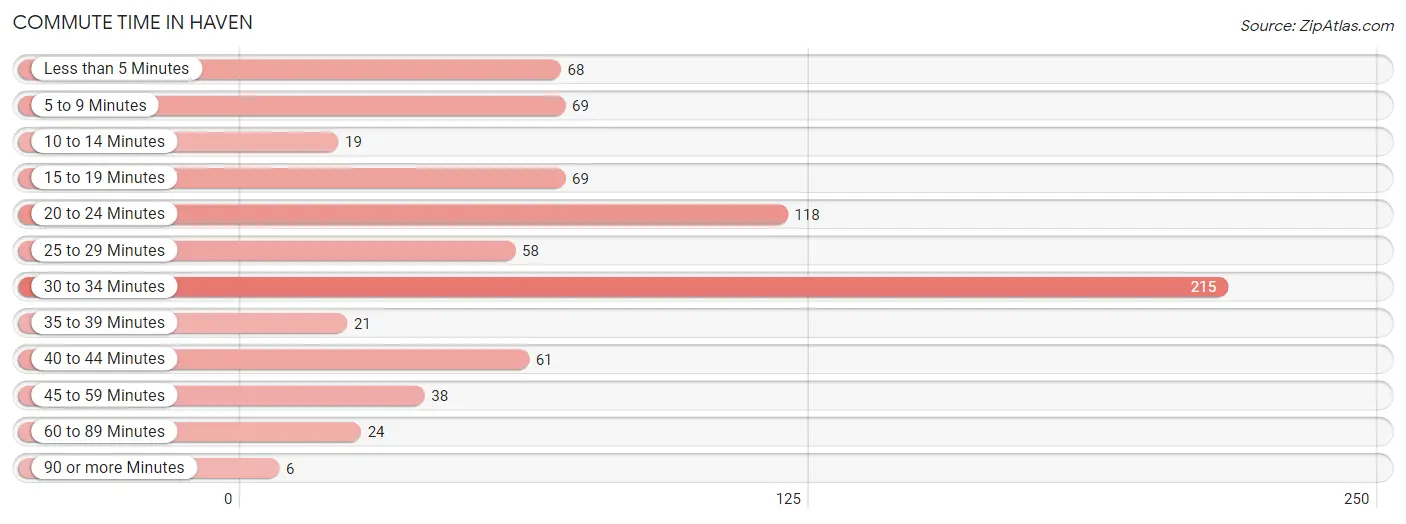
| Commute Time | # Commuters | % Commuters |
| Less than 5 Minutes | 68 | 8.9% |
| 5 to 9 Minutes | 69 | 9.0% |
| 10 to 14 Minutes | 19 | 2.5% |
| 15 to 19 Minutes | 69 | 9.0% |
| 20 to 24 Minutes | 118 | 15.4% |
| 25 to 29 Minutes | 58 | 7.6% |
| 30 to 34 Minutes | 215 | 28.1% |
| 35 to 39 Minutes | 21 | 2.7% |
| 40 to 44 Minutes | 61 | 8.0% |
| 45 to 59 Minutes | 38 | 5.0% |
| 60 to 89 Minutes | 24 | 3.1% |
| 90 or more Minutes | 6 | 0.8% |
Commute Time by Sex in Haven
The most common commute times in Haven are 20 to 24 minutes (72 commuters, 23.2%) for males and 30 to 34 minutes (188 commuters, 41.3%) for females.
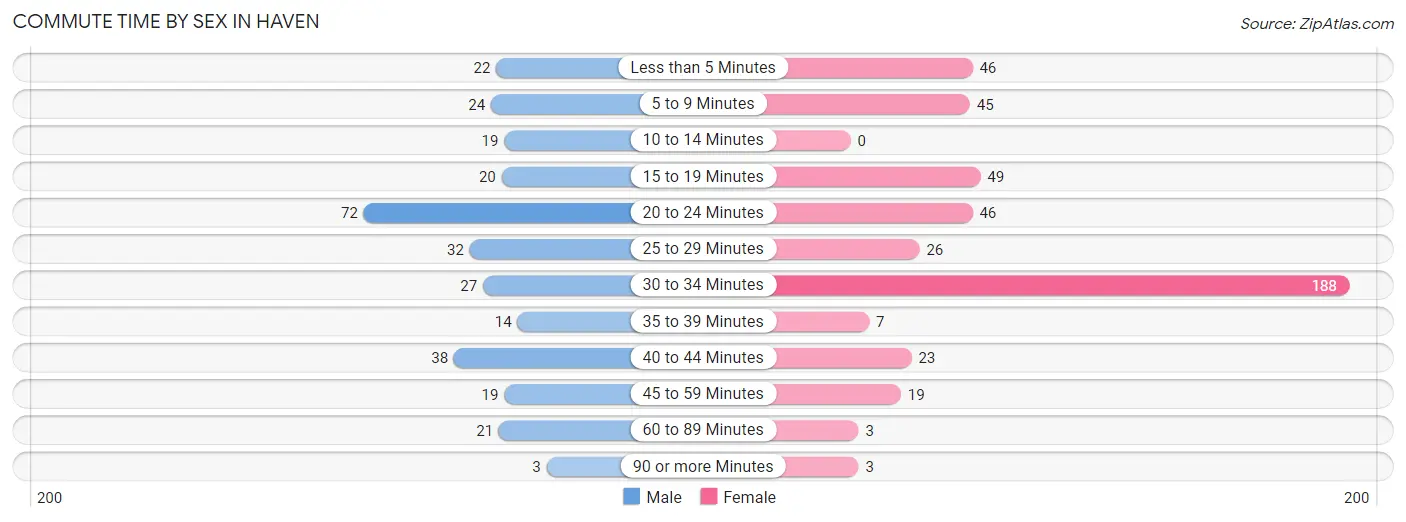
| Commute Time | Male | Female |
| Less than 5 Minutes | 22 (7.1%) | 46 (10.1%) |
| 5 to 9 Minutes | 24 (7.7%) | 45 (9.9%) |
| 10 to 14 Minutes | 19 (6.1%) | 0 (0.0%) |
| 15 to 19 Minutes | 20 (6.4%) | 49 (10.8%) |
| 20 to 24 Minutes | 72 (23.2%) | 46 (10.1%) |
| 25 to 29 Minutes | 32 (10.3%) | 26 (5.7%) |
| 30 to 34 Minutes | 27 (8.7%) | 188 (41.3%) |
| 35 to 39 Minutes | 14 (4.5%) | 7 (1.5%) |
| 40 to 44 Minutes | 38 (12.2%) | 23 (5.1%) |
| 45 to 59 Minutes | 19 (6.1%) | 19 (4.2%) |
| 60 to 89 Minutes | 21 (6.8%) | 3 (0.7%) |
| 90 or more Minutes | 3 (1.0%) | 3 (0.7%) |
Time of Departure to Work by Sex in Haven
The most frequent times of departure to work in Haven are 7:00 AM to 7:29 AM (61, 19.6%) for males and 7:30 AM to 7:59 AM (253, 55.6%) for females.
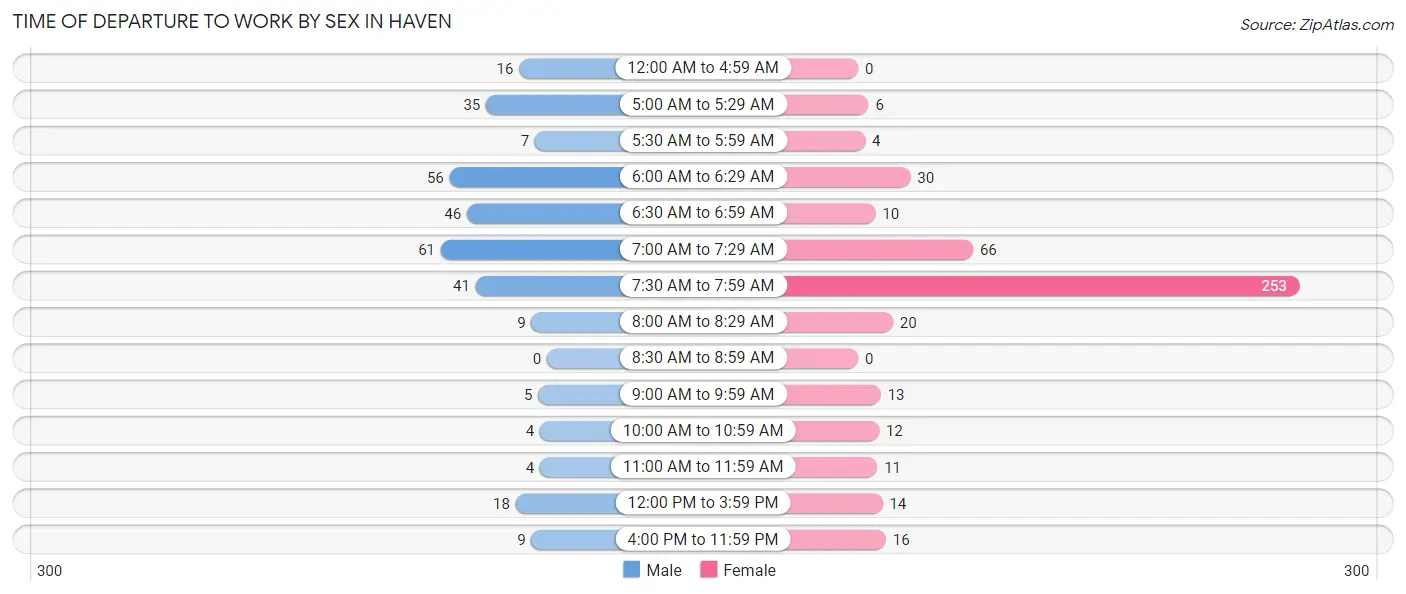
| Time of Departure | Male | Female |
| 12:00 AM to 4:59 AM | 16 (5.1%) | 0 (0.0%) |
| 5:00 AM to 5:29 AM | 35 (11.3%) | 6 (1.3%) |
| 5:30 AM to 5:59 AM | 7 (2.2%) | 4 (0.9%) |
| 6:00 AM to 6:29 AM | 56 (18.0%) | 30 (6.6%) |
| 6:30 AM to 6:59 AM | 46 (14.8%) | 10 (2.2%) |
| 7:00 AM to 7:29 AM | 61 (19.6%) | 66 (14.5%) |
| 7:30 AM to 7:59 AM | 41 (13.2%) | 253 (55.6%) |
| 8:00 AM to 8:29 AM | 9 (2.9%) | 20 (4.4%) |
| 8:30 AM to 8:59 AM | 0 (0.0%) | 0 (0.0%) |
| 9:00 AM to 9:59 AM | 5 (1.6%) | 13 (2.9%) |
| 10:00 AM to 10:59 AM | 4 (1.3%) | 12 (2.6%) |
| 11:00 AM to 11:59 AM | 4 (1.3%) | 11 (2.4%) |
| 12:00 PM to 3:59 PM | 18 (5.8%) | 14 (3.1%) |
| 4:00 PM to 11:59 PM | 9 (2.9%) | 16 (3.5%) |
| Total | 311 (100.0%) | 455 (100.0%) |
Housing Occupancy in Haven
Occupancy by Ownership in Haven
Of the total 607 dwellings in Haven, owner-occupied units account for 528 (87.0%), while renter-occupied units make up 79 (13.0%).
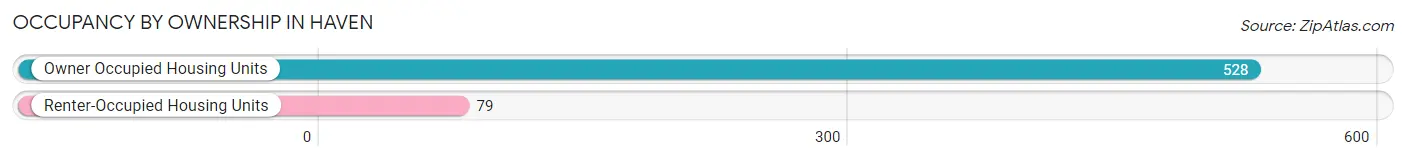
| Occupancy | # Housing Units | % Housing Units |
| Owner Occupied Housing Units | 528 | 87.0% |
| Renter-Occupied Housing Units | 79 | 13.0% |
| Total Occupied Housing Units | 607 | 100.0% |
Occupancy by Household Size in Haven
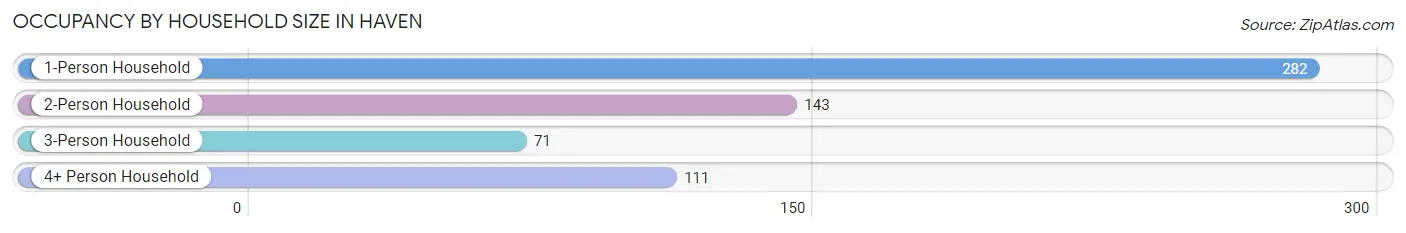
| Household Size | # Housing Units | % Housing Units |
| 1-Person Household | 282 | 46.5% |
| 2-Person Household | 143 | 23.6% |
| 3-Person Household | 71 | 11.7% |
| 4+ Person Household | 111 | 18.3% |
| Total Housing Units | 607 | 100.0% |
Occupancy by Ownership by Household Size in Haven
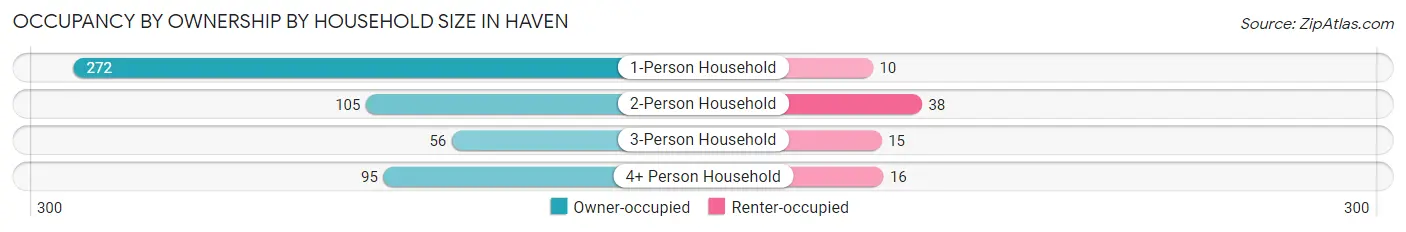
| Household Size | Owner-occupied | Renter-occupied |
| 1-Person Household | 272 (96.5%) | 10 (3.5%) |
| 2-Person Household | 105 (73.4%) | 38 (26.6%) |
| 3-Person Household | 56 (78.9%) | 15 (21.1%) |
| 4+ Person Household | 95 (85.6%) | 16 (14.4%) |
| Total Housing Units | 528 (87.0%) | 79 (13.0%) |
Occupancy by Educational Attainment in Haven
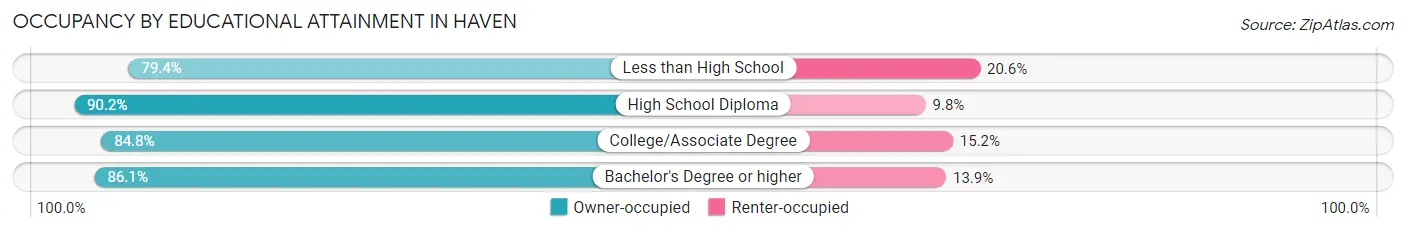
| Household Size | Owner-occupied | Renter-occupied |
| Less than High School | 27 (79.4%) | 7 (20.6%) |
| High School Diploma | 230 (90.2%) | 25 (9.8%) |
| College/Associate Degree | 184 (84.8%) | 33 (15.2%) |
| Bachelor's Degree or higher | 87 (86.1%) | 14 (13.9%) |
Occupancy by Age of Householder in Haven
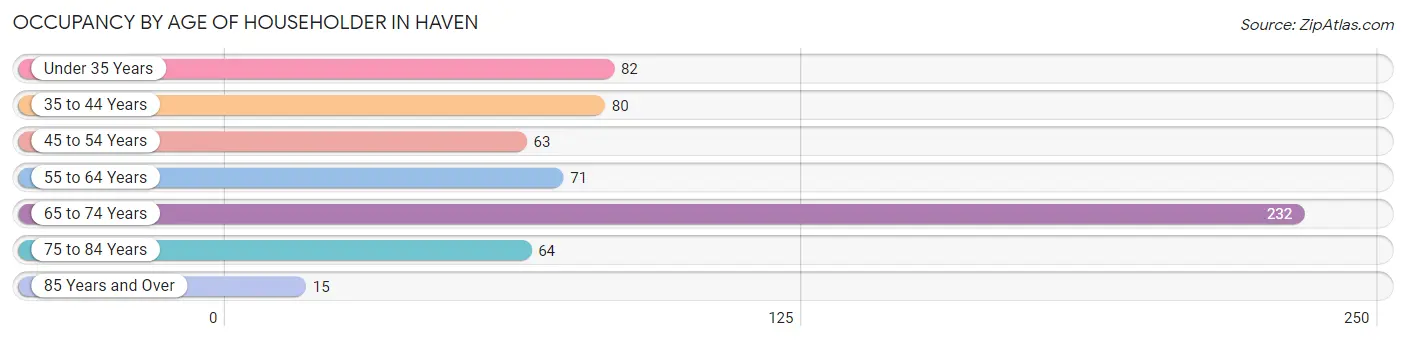
| Age Bracket | # Households | % Households |
| Under 35 Years | 82 | 13.5% |
| 35 to 44 Years | 80 | 13.2% |
| 45 to 54 Years | 63 | 10.4% |
| 55 to 64 Years | 71 | 11.7% |
| 65 to 74 Years | 232 | 38.2% |
| 75 to 84 Years | 64 | 10.5% |
| 85 Years and Over | 15 | 2.5% |
| Total | 607 | 100.0% |
Housing Finances in Haven
Median Income by Occupancy in Haven
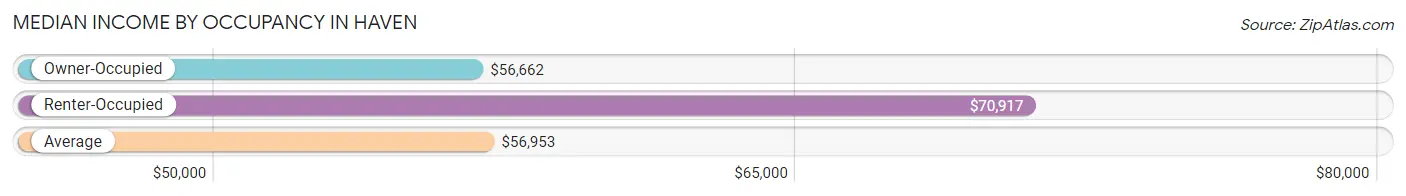
| Occupancy Type | # Households | Median Income |
| Owner-Occupied | 528 (87.0%) | $56,662 |
| Renter-Occupied | 79 (13.0%) | $70,917 |
| Average | 607 (100.0%) | $56,953 |
Occupancy by Householder Income Bracket in Haven
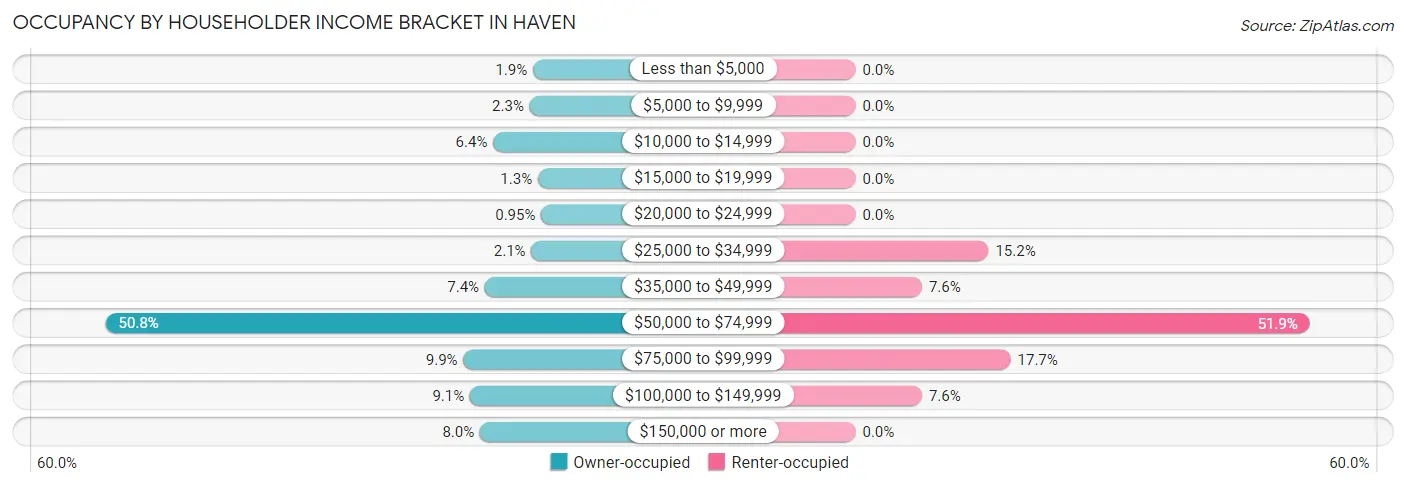
| Income Bracket | Owner-occupied | Renter-occupied |
| Less than $5,000 | 10 (1.9%) | 0 (0.0%) |
| $5,000 to $9,999 | 12 (2.3%) | 0 (0.0%) |
| $10,000 to $14,999 | 34 (6.4%) | 0 (0.0%) |
| $15,000 to $19,999 | 7 (1.3%) | 0 (0.0%) |
| $20,000 to $24,999 | 5 (0.9%) | 0 (0.0%) |
| $25,000 to $34,999 | 11 (2.1%) | 12 (15.2%) |
| $35,000 to $49,999 | 39 (7.4%) | 6 (7.6%) |
| $50,000 to $74,999 | 268 (50.8%) | 41 (51.9%) |
| $75,000 to $99,999 | 52 (9.9%) | 14 (17.7%) |
| $100,000 to $149,999 | 48 (9.1%) | 6 (7.6%) |
| $150,000 or more | 42 (8.0%) | 0 (0.0%) |
| Total | 528 (100.0%) | 79 (100.0%) |
Monthly Housing Cost Tiers in Haven
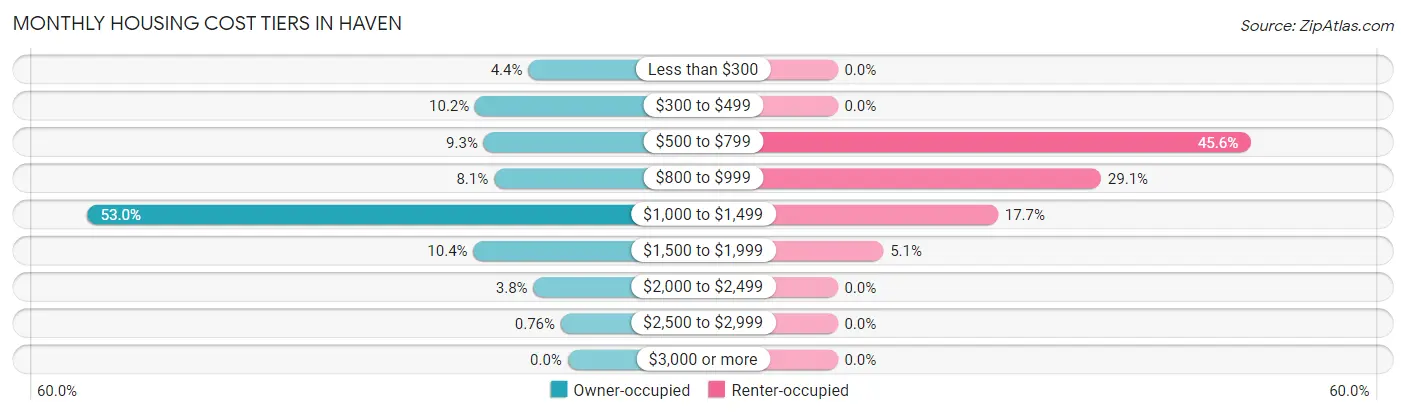
| Monthly Cost | Owner-occupied | Renter-occupied |
| Less than $300 | 23 (4.4%) | 0 (0.0%) |
| $300 to $499 | 54 (10.2%) | 0 (0.0%) |
| $500 to $799 | 49 (9.3%) | 36 (45.6%) |
| $800 to $999 | 43 (8.1%) | 23 (29.1%) |
| $1,000 to $1,499 | 280 (53.0%) | 14 (17.7%) |
| $1,500 to $1,999 | 55 (10.4%) | 4 (5.1%) |
| $2,000 to $2,499 | 20 (3.8%) | 0 (0.0%) |
| $2,500 to $2,999 | 4 (0.8%) | 0 (0.0%) |
| $3,000 or more | 0 (0.0%) | 0 (0.0%) |
| Total | 528 (100.0%) | 79 (100.0%) |
Physical Housing Characteristics in Haven
Housing Structures in Haven
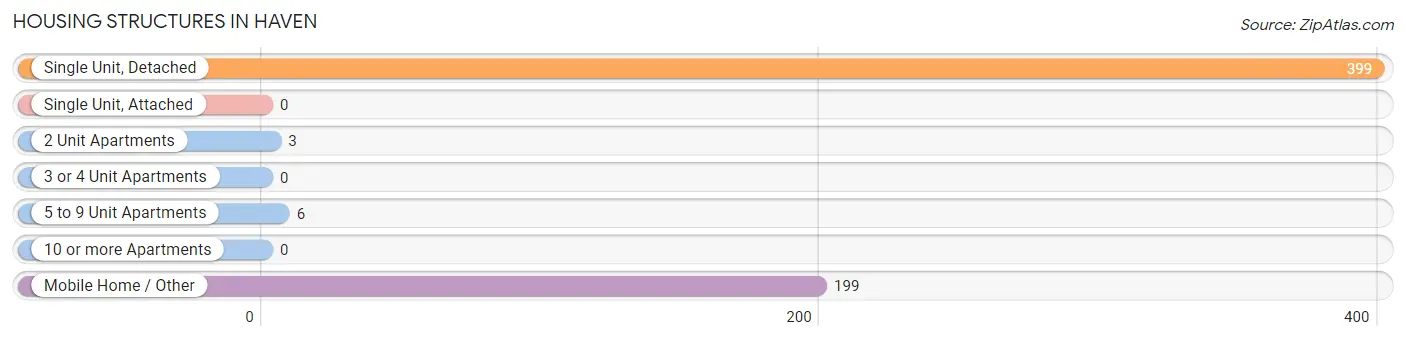
| Structure Type | # Housing Units | % Housing Units |
| Single Unit, Detached | 399 | 65.7% |
| Single Unit, Attached | 0 | 0.0% |
| 2 Unit Apartments | 3 | 0.5% |
| 3 or 4 Unit Apartments | 0 | 0.0% |
| 5 to 9 Unit Apartments | 6 | 1.0% |
| 10 or more Apartments | 0 | 0.0% |
| Mobile Home / Other | 199 | 32.8% |
| Total | 607 | 100.0% |
Housing Structures by Occupancy in Haven
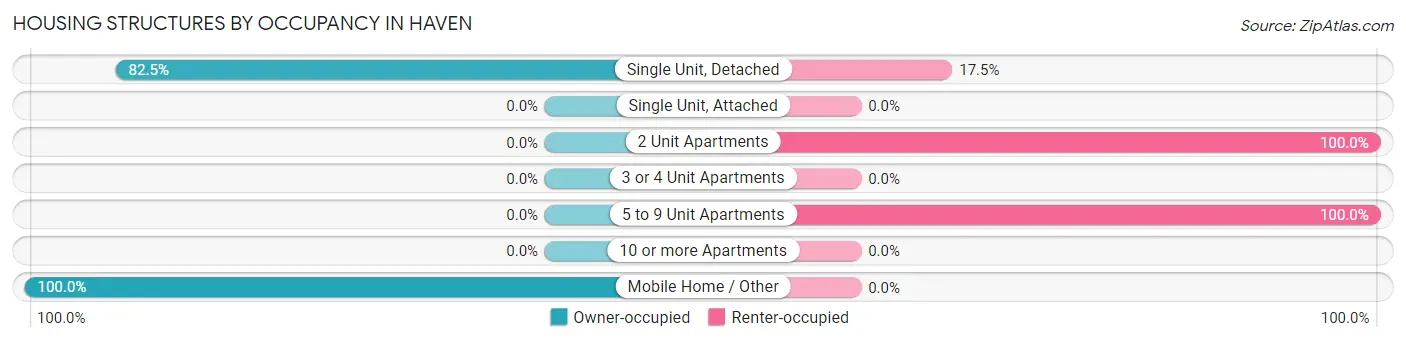
| Structure Type | Owner-occupied | Renter-occupied |
| Single Unit, Detached | 329 (82.5%) | 70 (17.5%) |
| Single Unit, Attached | 0 (0.0%) | 0 (0.0%) |
| 2 Unit Apartments | 0 (0.0%) | 3 (100.0%) |
| 3 or 4 Unit Apartments | 0 (0.0%) | 0 (0.0%) |
| 5 to 9 Unit Apartments | 0 (0.0%) | 6 (100.0%) |
| 10 or more Apartments | 0 (0.0%) | 0 (0.0%) |
| Mobile Home / Other | 199 (100.0%) | 0 (0.0%) |
| Total | 528 (87.0%) | 79 (13.0%) |
Housing Structures by Number of Rooms in Haven
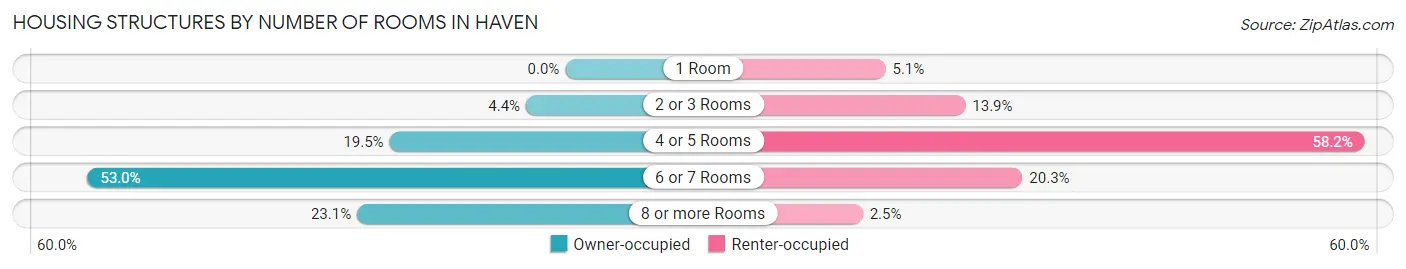
| Number of Rooms | Owner-occupied | Renter-occupied |
| 1 Room | 0 (0.0%) | 4 (5.1%) |
| 2 or 3 Rooms | 23 (4.4%) | 11 (13.9%) |
| 4 or 5 Rooms | 103 (19.5%) | 46 (58.2%) |
| 6 or 7 Rooms | 280 (53.0%) | 16 (20.3%) |
| 8 or more Rooms | 122 (23.1%) | 2 (2.5%) |
| Total | 528 (100.0%) | 79 (100.0%) |
Housing Structure by Heating Type in Haven
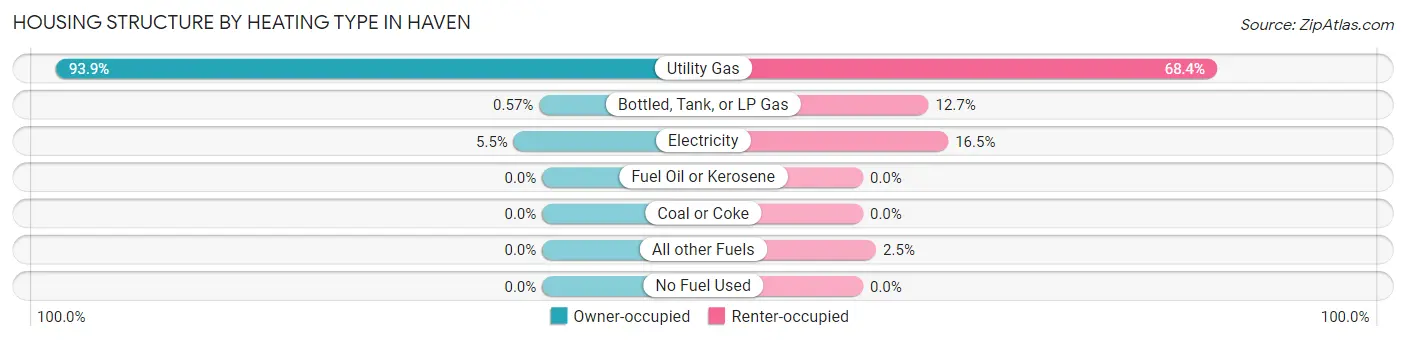
| Heating Type | Owner-occupied | Renter-occupied |
| Utility Gas | 496 (93.9%) | 54 (68.3%) |
| Bottled, Tank, or LP Gas | 3 (0.6%) | 10 (12.7%) |
| Electricity | 29 (5.5%) | 13 (16.5%) |
| Fuel Oil or Kerosene | 0 (0.0%) | 0 (0.0%) |
| Coal or Coke | 0 (0.0%) | 0 (0.0%) |
| All other Fuels | 0 (0.0%) | 2 (2.5%) |
| No Fuel Used | 0 (0.0%) | 0 (0.0%) |
| Total | 528 (100.0%) | 79 (100.0%) |
Household Vehicle Usage in Haven
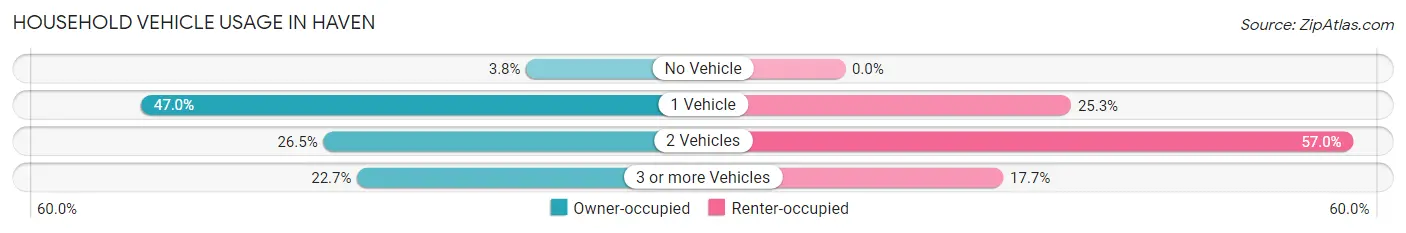
| Vehicles per Household | Owner-occupied | Renter-occupied |
| No Vehicle | 20 (3.8%) | 0 (0.0%) |
| 1 Vehicle | 248 (47.0%) | 20 (25.3%) |
| 2 Vehicles | 140 (26.5%) | 45 (57.0%) |
| 3 or more Vehicles | 120 (22.7%) | 14 (17.7%) |
| Total | 528 (100.0%) | 79 (100.0%) |
Real Estate & Mortgages in Haven
Real Estate and Mortgage Overview in Haven
| Characteristic | Without Mortgage | With Mortgage |
| Housing Units | 138 | 390 |
| Median Property Value | $83,100 | $0 |
| Median Household Income | - | - |
| Monthly Housing Costs | $470 | $0 |
| Real Estate Taxes | $1,725 | $5 |
Property Value by Mortgage Status in Haven
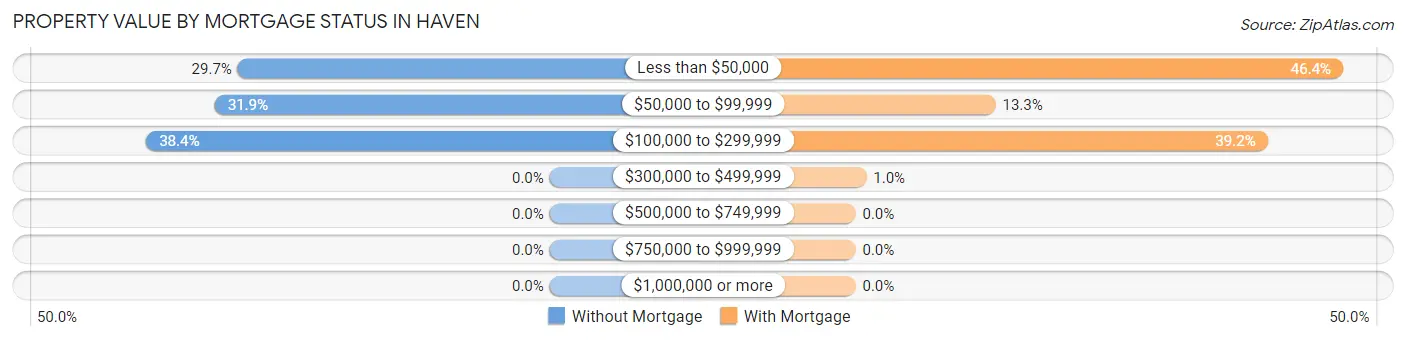
| Property Value | Without Mortgage | With Mortgage |
| Less than $50,000 | 41 (29.7%) | 181 (46.4%) |
| $50,000 to $99,999 | 44 (31.9%) | 52 (13.3%) |
| $100,000 to $299,999 | 53 (38.4%) | 153 (39.2%) |
| $300,000 to $499,999 | 0 (0.0%) | 4 (1.0%) |
| $500,000 to $749,999 | 0 (0.0%) | 0 (0.0%) |
| $750,000 to $999,999 | 0 (0.0%) | 0 (0.0%) |
| $1,000,000 or more | 0 (0.0%) | 0 (0.0%) |
| Total | 138 (100.0%) | 390 (100.0%) |
Household Income by Mortgage Status in Haven
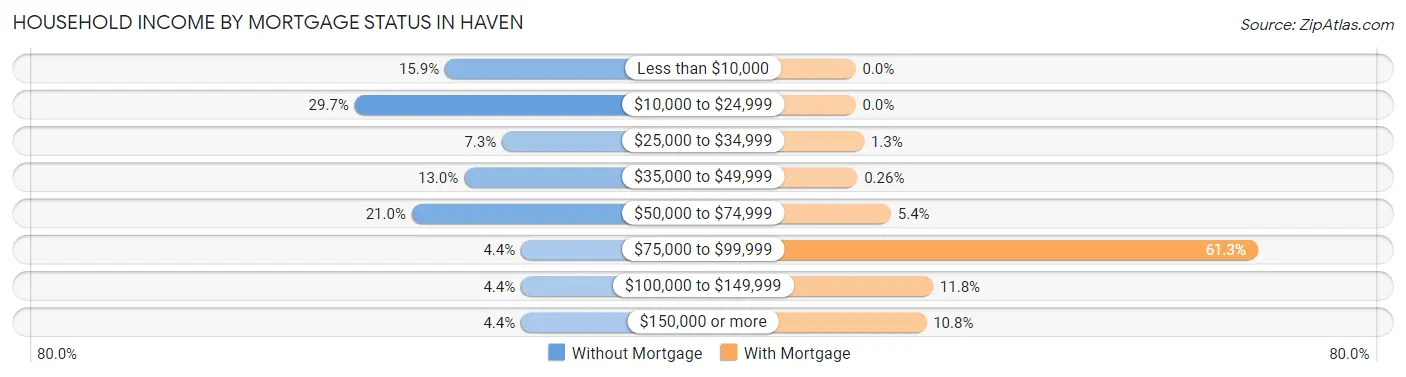
| Household Income | Without Mortgage | With Mortgage |
| Less than $10,000 | 22 (15.9%) | 0 (0.0%) |
| $10,000 to $24,999 | 41 (29.7%) | 0 (0.0%) |
| $25,000 to $34,999 | 10 (7.2%) | 5 (1.3%) |
| $35,000 to $49,999 | 18 (13.0%) | 1 (0.3%) |
| $50,000 to $74,999 | 29 (21.0%) | 21 (5.4%) |
| $75,000 to $99,999 | 6 (4.3%) | 239 (61.3%) |
| $100,000 to $149,999 | 6 (4.3%) | 46 (11.8%) |
| $150,000 or more | 6 (4.3%) | 42 (10.8%) |
| Total | 138 (100.0%) | 390 (100.0%) |
Property Value to Household Income Ratio in Haven
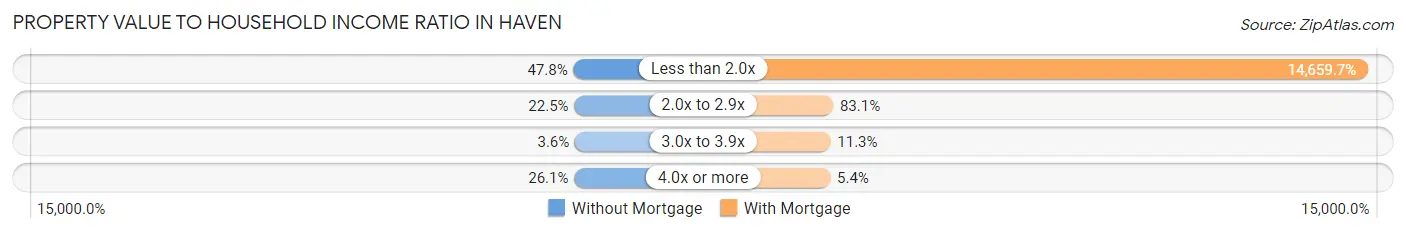
| Value-to-Income Ratio | Without Mortgage | With Mortgage |
| Less than 2.0x | 66 (47.8%) | 57,173 (14,659.7%) |
| 2.0x to 2.9x | 31 (22.5%) | 324 (83.1%) |
| 3.0x to 3.9x | 5 (3.6%) | 44 (11.3%) |
| 4.0x or more | 36 (26.1%) | 21 (5.4%) |
| Total | 138 (100.0%) | 390 (100.0%) |
Real Estate Taxes by Mortgage Status in Haven
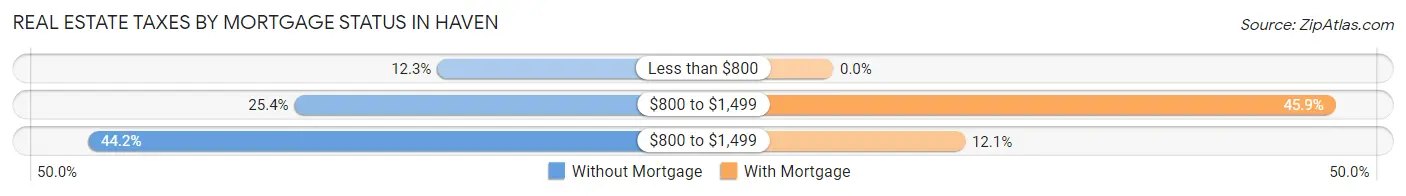
| Property Taxes | Without Mortgage | With Mortgage |
| Less than $800 | 17 (12.3%) | 0 (0.0%) |
| $800 to $1,499 | 35 (25.4%) | 179 (45.9%) |
| $800 to $1,499 | 61 (44.2%) | 47 (12.0%) |
| Total | 138 (100.0%) | 390 (100.0%) |
Health & Disability in Haven
Health Insurance Coverage by Age in Haven
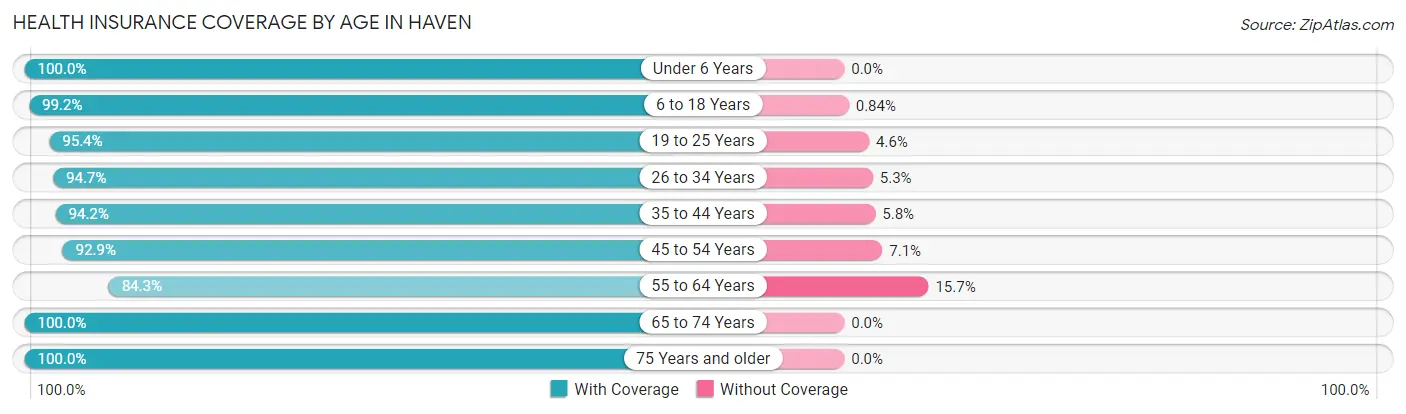
| Age Bracket | With Coverage | Without Coverage |
| Under 6 Years | 94 (100.0%) | 0 (0.0%) |
| 6 to 18 Years | 237 (99.2%) | 2 (0.8%) |
| 19 to 25 Years | 124 (95.4%) | 6 (4.6%) |
| 26 to 34 Years | 89 (94.7%) | 5 (5.3%) |
| 35 to 44 Years | 179 (94.2%) | 11 (5.8%) |
| 45 to 54 Years | 118 (92.9%) | 9 (7.1%) |
| 55 to 64 Years | 102 (84.3%) | 19 (15.7%) |
| 65 to 74 Years | 292 (100.0%) | 0 (0.0%) |
| 75 Years and older | 132 (100.0%) | 0 (0.0%) |
| Total | 1,367 (96.3%) | 52 (3.7%) |
Health Insurance Coverage by Citizenship Status in Haven
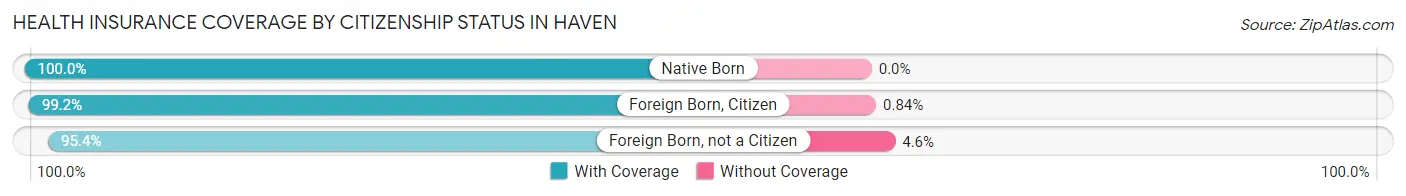
| Citizenship Status | With Coverage | Without Coverage |
| Native Born | 94 (100.0%) | 0 (0.0%) |
| Foreign Born, Citizen | 237 (99.2%) | 2 (0.8%) |
| Foreign Born, not a Citizen | 124 (95.4%) | 6 (4.6%) |
Health Insurance Coverage by Household Income in Haven
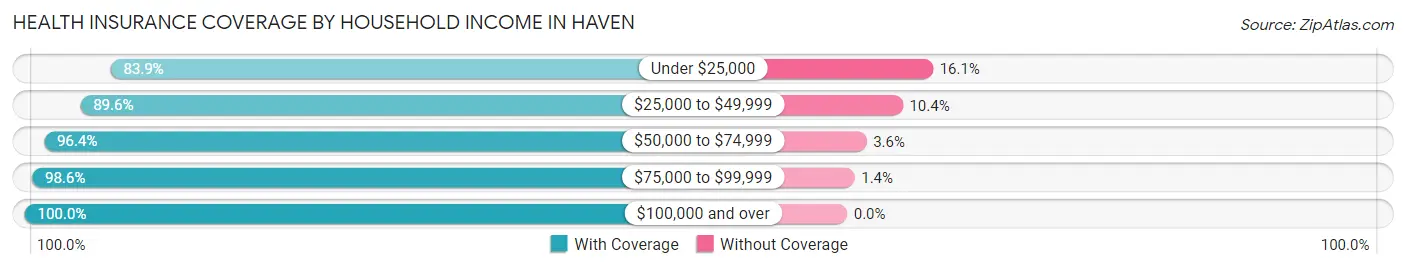
| Household Income | With Coverage | Without Coverage |
| Under $25,000 | 73 (83.9%) | 14 (16.1%) |
| $25,000 to $49,999 | 103 (89.6%) | 12 (10.4%) |
| $50,000 to $74,999 | 582 (96.4%) | 22 (3.6%) |
| $75,000 to $99,999 | 282 (98.6%) | 4 (1.4%) |
| $100,000 and over | 327 (100.0%) | 0 (0.0%) |
Public vs Private Health Insurance Coverage by Age in Haven
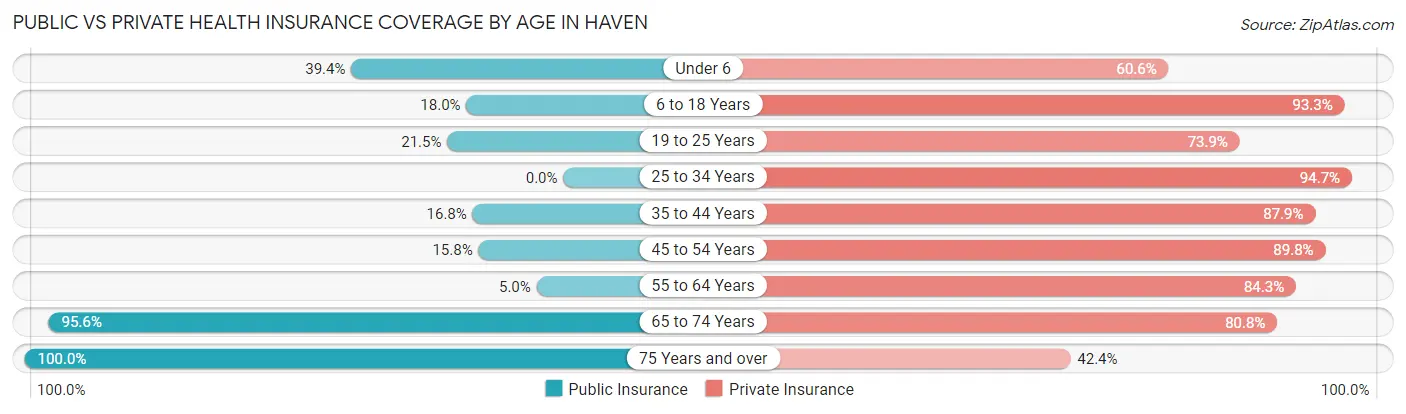
| Age Bracket | Public Insurance | Private Insurance |
| Under 6 | 37 (39.4%) | 57 (60.6%) |
| 6 to 18 Years | 43 (18.0%) | 223 (93.3%) |
| 19 to 25 Years | 28 (21.5%) | 96 (73.9%) |
| 25 to 34 Years | 0 (0.0%) | 89 (94.7%) |
| 35 to 44 Years | 32 (16.8%) | 167 (87.9%) |
| 45 to 54 Years | 20 (15.8%) | 114 (89.8%) |
| 55 to 64 Years | 6 (5.0%) | 102 (84.3%) |
| 65 to 74 Years | 279 (95.6%) | 236 (80.8%) |
| 75 Years and over | 132 (100.0%) | 56 (42.4%) |
| Total | 577 (40.7%) | 1,140 (80.3%) |
Disability Status by Sex by Age in Haven
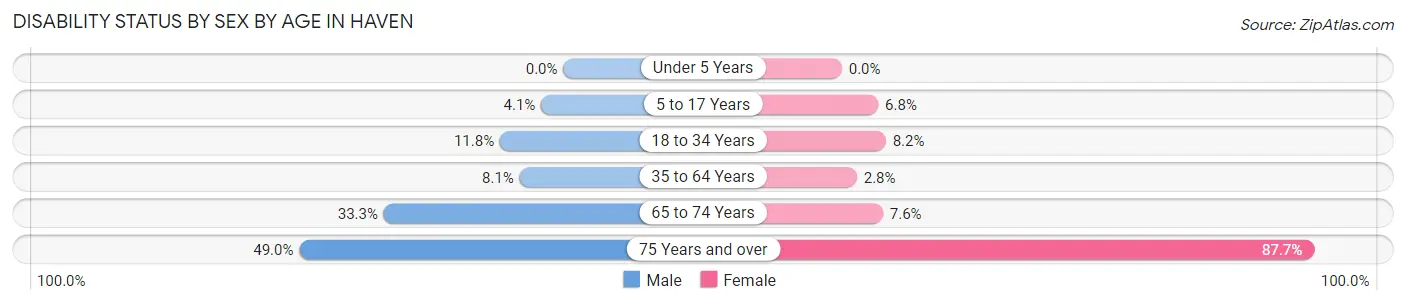
| Age Bracket | Male | Female |
| Under 5 Years | 0 (0.0%) | 0 (0.0%) |
| 5 to 17 Years | 4 (4.1%) | 11 (6.8%) |
| 18 to 34 Years | 12 (11.8%) | 11 (8.2%) |
| 35 to 64 Years | 18 (8.1%) | 6 (2.8%) |
| 65 to 74 Years | 23 (33.3%) | 17 (7.6%) |
| 75 Years and over | 25 (49.0%) | 71 (87.6%) |
Disability Class by Sex by Age in Haven
Disability Class: Hearing Difficulty
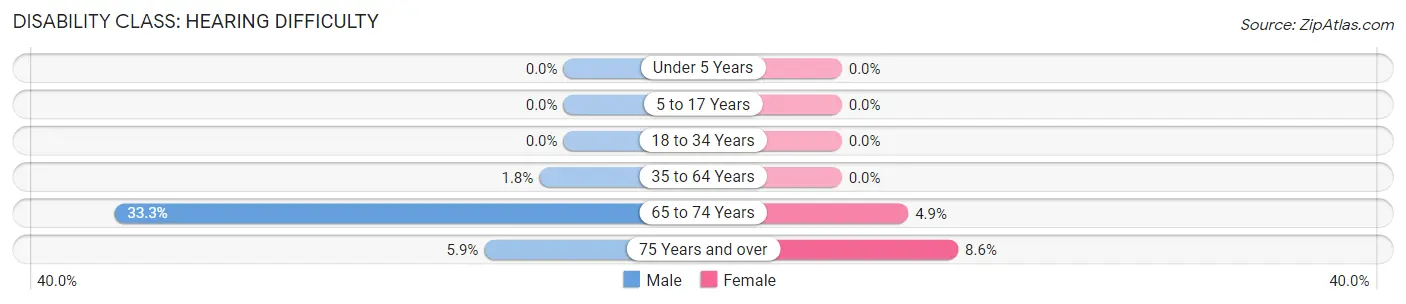
| Age Bracket | Male | Female |
| Under 5 Years | 0 (0.0%) | 0 (0.0%) |
| 5 to 17 Years | 0 (0.0%) | 0 (0.0%) |
| 18 to 34 Years | 0 (0.0%) | 0 (0.0%) |
| 35 to 64 Years | 4 (1.8%) | 0 (0.0%) |
| 65 to 74 Years | 23 (33.3%) | 11 (4.9%) |
| 75 Years and over | 3 (5.9%) | 7 (8.6%) |
Disability Class: Vision Difficulty
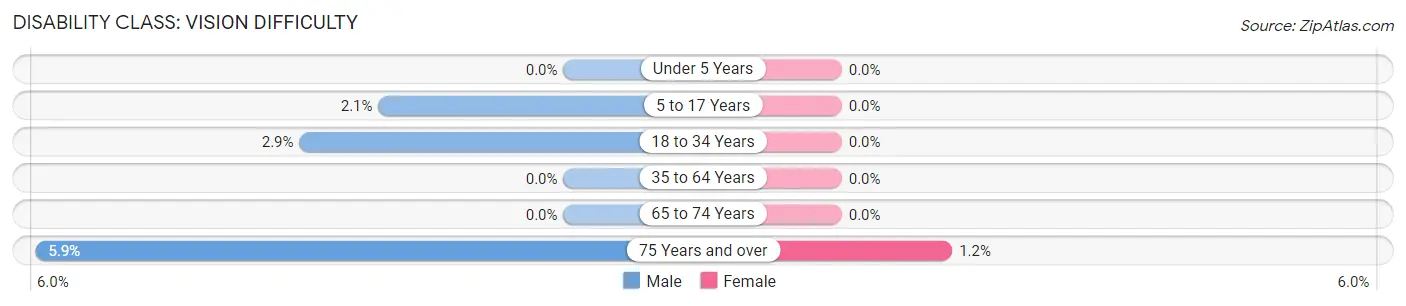
| Age Bracket | Male | Female |
| Under 5 Years | 0 (0.0%) | 0 (0.0%) |
| 5 to 17 Years | 2 (2.1%) | 0 (0.0%) |
| 18 to 34 Years | 3 (2.9%) | 0 (0.0%) |
| 35 to 64 Years | 0 (0.0%) | 0 (0.0%) |
| 65 to 74 Years | 0 (0.0%) | 0 (0.0%) |
| 75 Years and over | 3 (5.9%) | 1 (1.2%) |
Disability Class: Cognitive Difficulty
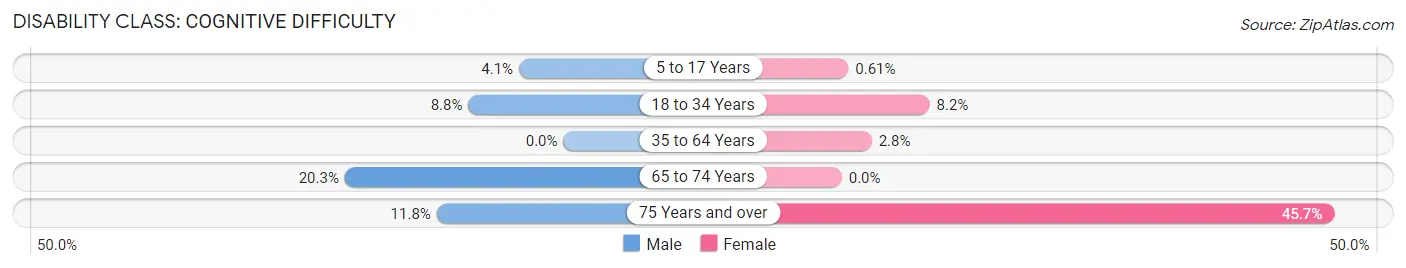
| Age Bracket | Male | Female |
| 5 to 17 Years | 4 (4.1%) | 1 (0.6%) |
| 18 to 34 Years | 9 (8.8%) | 11 (8.2%) |
| 35 to 64 Years | 0 (0.0%) | 6 (2.8%) |
| 65 to 74 Years | 14 (20.3%) | 0 (0.0%) |
| 75 Years and over | 6 (11.8%) | 37 (45.7%) |
Disability Class: Ambulatory Difficulty
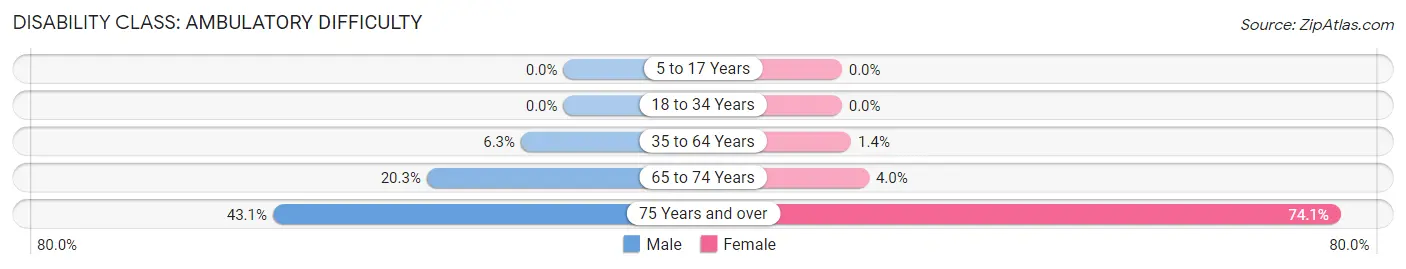
| Age Bracket | Male | Female |
| 5 to 17 Years | 0 (0.0%) | 0 (0.0%) |
| 18 to 34 Years | 0 (0.0%) | 0 (0.0%) |
| 35 to 64 Years | 14 (6.3%) | 3 (1.4%) |
| 65 to 74 Years | 14 (20.3%) | 9 (4.0%) |
| 75 Years and over | 22 (43.1%) | 60 (74.1%) |
Disability Class: Self-Care Difficulty
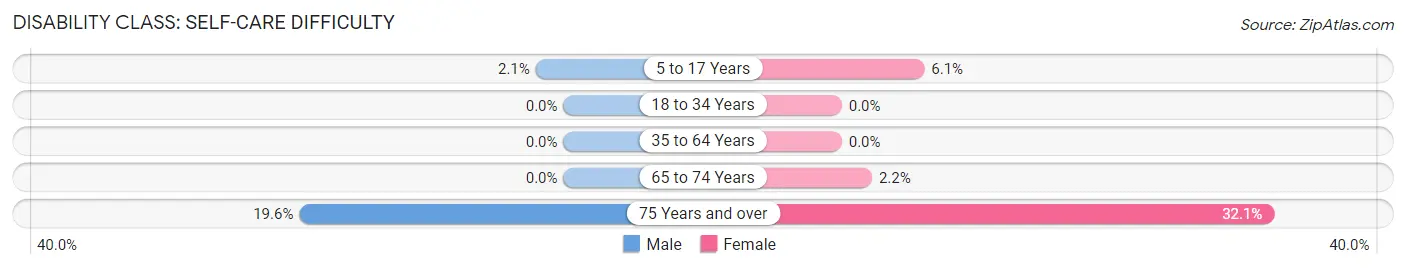
| Age Bracket | Male | Female |
| 5 to 17 Years | 2 (2.1%) | 10 (6.1%) |
| 18 to 34 Years | 0 (0.0%) | 0 (0.0%) |
| 35 to 64 Years | 0 (0.0%) | 0 (0.0%) |
| 65 to 74 Years | 0 (0.0%) | 5 (2.2%) |
| 75 Years and over | 10 (19.6%) | 26 (32.1%) |
Technology Access in Haven
Computing Device Access in Haven
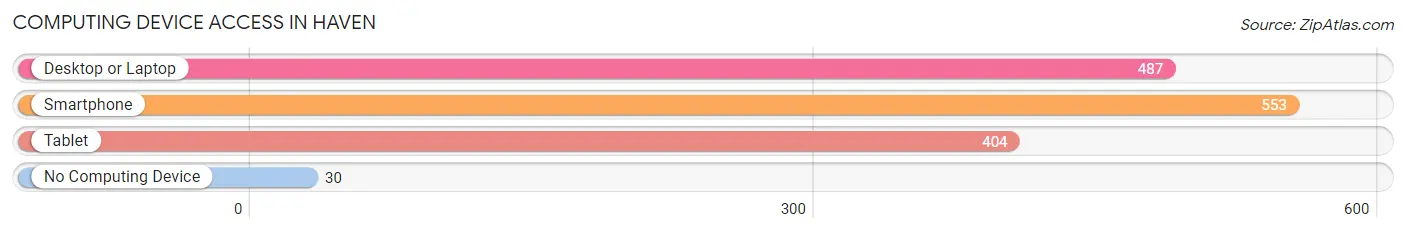
| Device Type | # Households | % Households |
| Desktop or Laptop | 487 | 80.2% |
| Smartphone | 553 | 91.1% |
| Tablet | 404 | 66.6% |
| No Computing Device | 30 | 4.9% |
| Total | 607 | 100.0% |
Internet Access in Haven
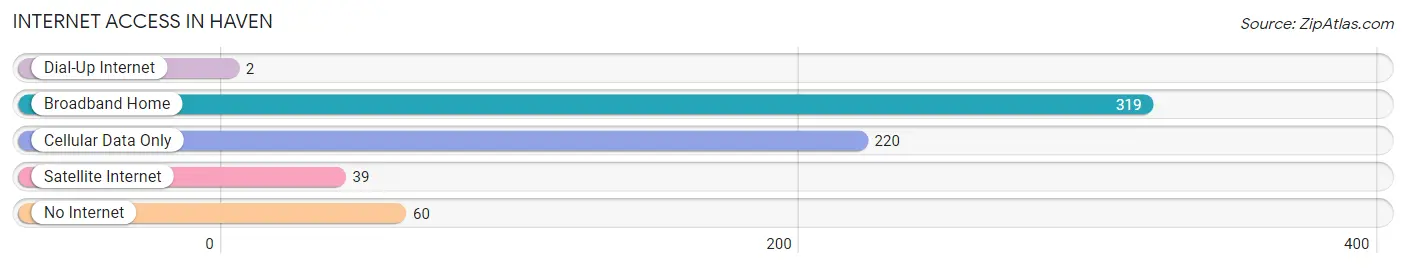
| Internet Type | # Households | % Households |
| Dial-Up Internet | 2 | 0.3% |
| Broadband Home | 319 | 52.5% |
| Cellular Data Only | 220 | 36.2% |
| Satellite Internet | 39 | 6.4% |
| No Internet | 60 | 9.9% |
| Total | 607 | 100.0% |
Haven Summary
Haven, Kansas is a small city located in Reno County, Kansas. It is situated in the south-central part of the state, approximately 30 miles northwest of Wichita. The city has a population of 1,845 people, according to the 2010 census.
Haven was founded in 1872 by a group of settlers from Haven, Connecticut. The city was named after the Connecticut town, and the settlers brought with them the same values and traditions that they had in their home state. The city was incorporated in 1887.
Haven is located in the heart of the Great Plains, and the city is surrounded by rolling hills and farmland. The city is situated on the Arkansas River, and the area is known for its rich agricultural heritage. The city is also home to a variety of wildlife, including deer, wild turkeys, and coyotes.
The economy of Haven is largely based on agriculture. The city is home to several large farms, and the surrounding area is known for its production of wheat, corn, and soybeans. The city also has a thriving business community, with several small businesses located in the downtown area.
Haven is served by the Haven Unified School District, which includes two elementary schools, one middle school, and one high school. The city also has a public library, a community center, and several parks.
Haven is a diverse city, with a population that is made up of a variety of ethnic backgrounds. According to the 2010 census, the city is home to a population that is approximately 75% white, 15% Hispanic, and 5% African American. The city also has a large population of Native Americans, with approximately 10% of the population identifying as Native American.
Haven is a great place to live, work, and raise a family. The city has a strong sense of community, and the people of Haven are proud of their city and its history. The city is a great place to visit, and it offers a variety of activities and attractions for visitors to enjoy.
Common Questions
What is Per Capita Income in Haven?
Per Capita income in Haven is $31,930.
What is the Median Family Income in Haven?
Median Family Income in Haven is $72,454.
What is the Median Household income in Haven?
Median Household Income in Haven is $56,953.
What is Income or Wage Gap in Haven?
Income or Wage Gap in Haven is 12.6%.
Women in Haven earn 87.4 cents for every dollar earned by a man.
What is Inequality or Gini Index in Haven?
Inequality or Gini Index in Haven is 0.33.
What is the Total Population of Haven?
Total Population of Haven is 1,421.
What is the Total Male Population of Haven?
Total Male Population of Haven is 570.
What is the Total Female Population of Haven?
Total Female Population of Haven is 851.
What is the Ratio of Males per 100 Females in Haven?
There are 66.98 Males per 100 Females in Haven.
What is the Ratio of Females per 100 Males in Haven?
There are 149.30 Females per 100 Males in Haven.
What is the Median Population Age in Haven?
Median Population Age in Haven is 42.0 Years.
What is the Average Family Size in Haven
Average Family Size in Haven is 3.4 People.
What is the Average Household Size in Haven
Average Household Size in Haven is 2.3 People.
How Large is the Labor Force in Haven?
There are 823 People in the Labor Forcein in Haven.
What is the Percentage of People in the Labor Force in Haven?
71.9% of People are in the Labor Force in Haven.
What is the Unemployment Rate in Haven?
Unemployment Rate in Haven is 2.4%.