Halstead, KS Map & Demographics
Halstead Map
Halstead Overview
$28,456
PER CAPITA INCOME
$85,703
AVG FAMILY INCOME
$54,394
AVG HOUSEHOLD INCOME
28.2%
WAGE / INCOME GAP [ % ]
71.8¢/ $1
WAGE / INCOME GAP [ $ ]
0.36
INEQUALITY / GINI INDEX
2,243
TOTAL POPULATION
936
MALE POPULATION
1,307
FEMALE POPULATION
71.61
MALES / 100 FEMALES
139.64
FEMALES / 100 MALES
35.3
MEDIAN AGE
3.2
AVG FAMILY SIZE
2.6
AVG HOUSEHOLD SIZE
1,014
LABOR FORCE [ PEOPLE ]
59.7%
PERCENT IN LABOR FORCE
0.4%
UNEMPLOYMENT RATE
Halstead Zip Codes
Halstead Area Codes
Income in Halstead
Income Overview in Halstead
Per Capita Income in Halstead is $28,456, while median incomes of families and households are $85,703 and $54,394 respectively.
| Characteristic | Number | Measure |
| Per Capita Income | 2,243 | $28,456 |
| Median Family Income | 559 | $85,703 |
| Mean Family Income | 559 | $81,572 |
| Median Household Income | 834 | $54,394 |
| Mean Household Income | 834 | $71,379 |
| Income Deficit | 559 | $0 |
| Wage / Income Gap (%) | 2,243 | 28.17% |
| Wage / Income Gap ($) | 2,243 | 71.83¢ per $1 |
| Gini / Inequality Index | 2,243 | 0.36 |
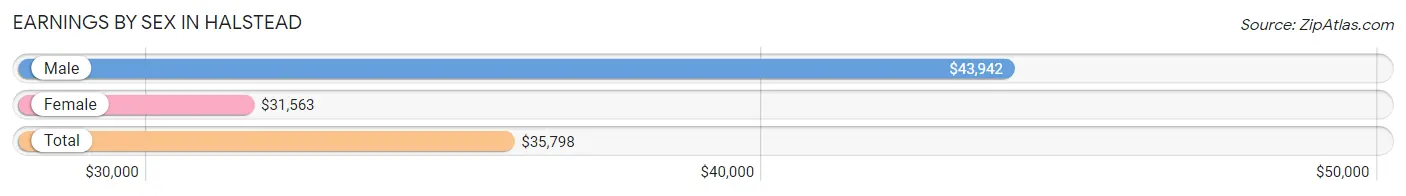
Earnings by Sex in Halstead
Average Earnings in Halstead are $35,798, $43,942 for men and $31,563 for women, a difference of 28.2%.
| Sex | Number | Average Earnings |
| Male | 477 (45.3%) | $43,942 |
| Female | 575 (54.7%) | $31,563 |
| Total | 1,052 (100.0%) | $35,798 |
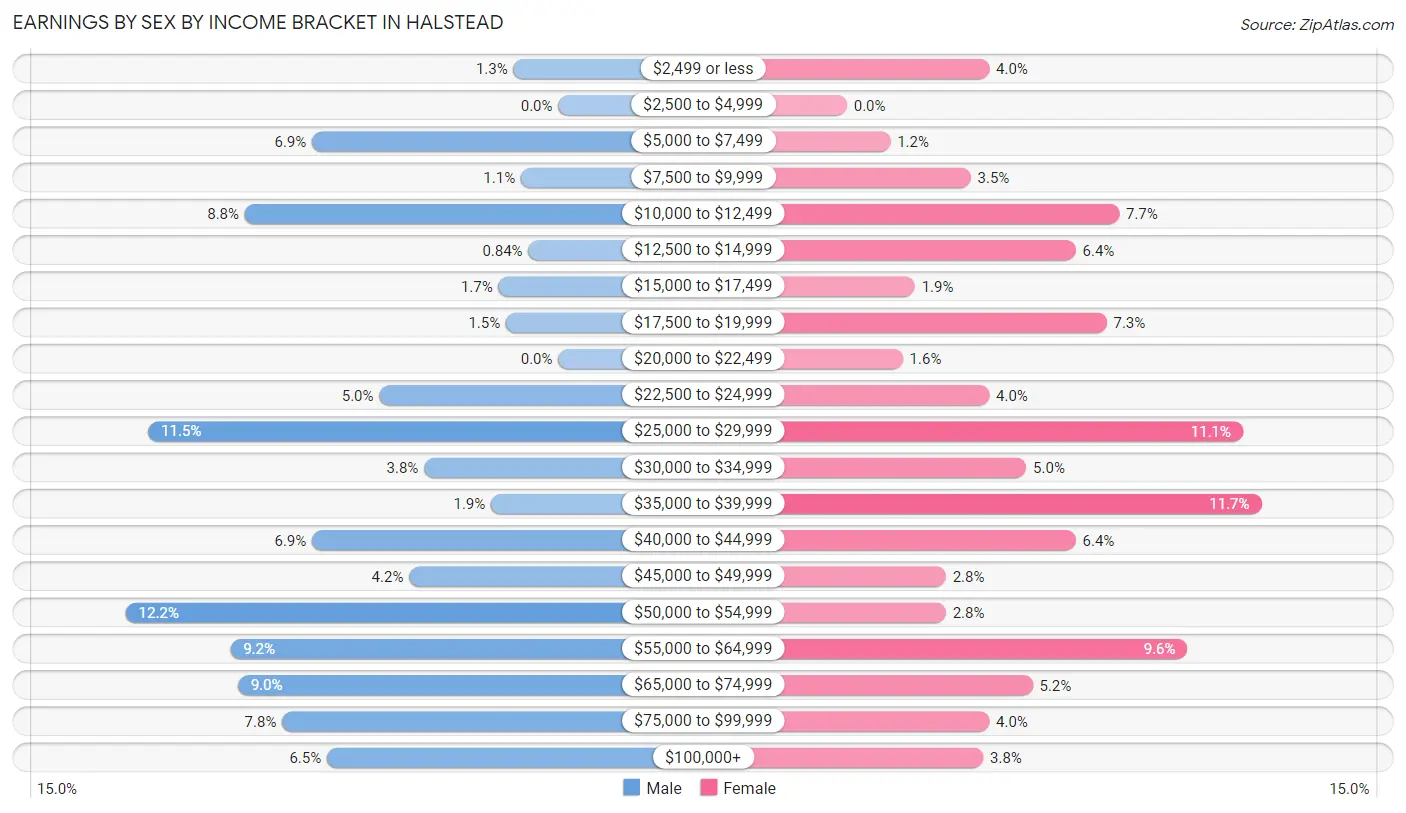
Earnings by Sex by Income Bracket in Halstead
The most common earnings brackets in Halstead are $50,000 to $54,999 for men (58 | 12.2%) and $35,000 to $39,999 for women (67 | 11.7%).
| Income | Male | Female |
| $2,499 or less | 6 (1.3%) | 23 (4.0%) |
| $2,500 to $4,999 | 0 (0.0%) | 0 (0.0%) |
| $5,000 to $7,499 | 33 (6.9%) | 7 (1.2%) |
| $7,500 to $9,999 | 5 (1.1%) | 20 (3.5%) |
| $10,000 to $12,499 | 42 (8.8%) | 44 (7.6%) |
| $12,500 to $14,999 | 4 (0.8%) | 37 (6.4%) |
| $15,000 to $17,499 | 8 (1.7%) | 11 (1.9%) |
| $17,500 to $19,999 | 7 (1.5%) | 42 (7.3%) |
| $20,000 to $22,499 | 0 (0.0%) | 9 (1.6%) |
| $22,500 to $24,999 | 24 (5.0%) | 23 (4.0%) |
| $25,000 to $29,999 | 55 (11.5%) | 64 (11.1%) |
| $30,000 to $34,999 | 18 (3.8%) | 29 (5.0%) |
| $35,000 to $39,999 | 9 (1.9%) | 67 (11.7%) |
| $40,000 to $44,999 | 33 (6.9%) | 37 (6.4%) |
| $45,000 to $49,999 | 20 (4.2%) | 16 (2.8%) |
| $50,000 to $54,999 | 58 (12.2%) | 16 (2.8%) |
| $55,000 to $64,999 | 44 (9.2%) | 55 (9.6%) |
| $65,000 to $74,999 | 43 (9.0%) | 30 (5.2%) |
| $75,000 to $99,999 | 37 (7.8%) | 23 (4.0%) |
| $100,000+ | 31 (6.5%) | 22 (3.8%) |
| Total | 477 (100.0%) | 575 (100.0%) |
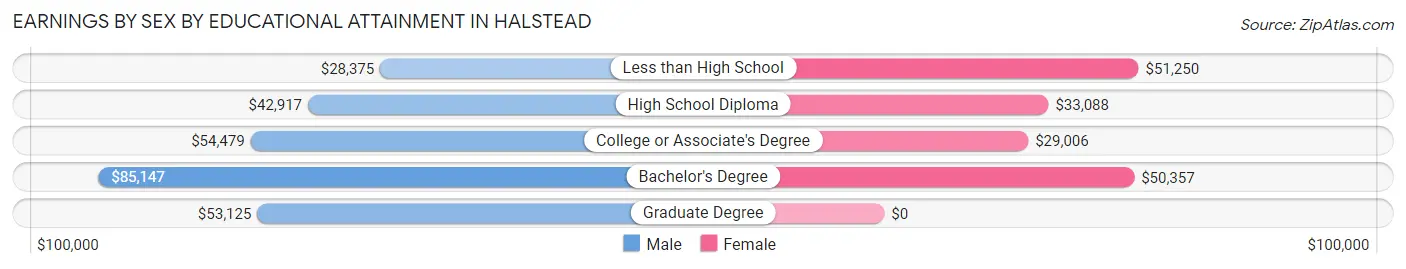
Earnings by Sex by Educational Attainment in Halstead
Average earnings in Halstead are $52,610 for men and $35,169 for women, a difference of 33.2%. Men with an educational attainment of bachelor's degree enjoy the highest average annual earnings of $85,147, while those with less than high school education earn the least with $28,375. Women with an educational attainment of less than high school earn the most with the average annual earnings of $51,250, while those with college or associate's degree education have the smallest earnings of $29,006.
| Educational Attainment | Male Income | Female Income |
| Less than High School | $28,375 | $51,250 |
| High School Diploma | $42,917 | $33,088 |
| College or Associate's Degree | $54,479 | $29,006 |
| Bachelor's Degree | $85,147 | $50,357 |
| Graduate Degree | $53,125 | $0 |
| Total | $52,610 | $35,169 |
Family Income in Halstead
Family Income Brackets in Halstead
According to the Halstead family income data, there are 160 families falling into the $100,000 to $149,999 income range, which is the most common income bracket and makes up 28.6% of all families. Conversely, the $25,000 to $34,999 income bracket is the least frequent group with only 13 families (2.3%) belonging to this category.
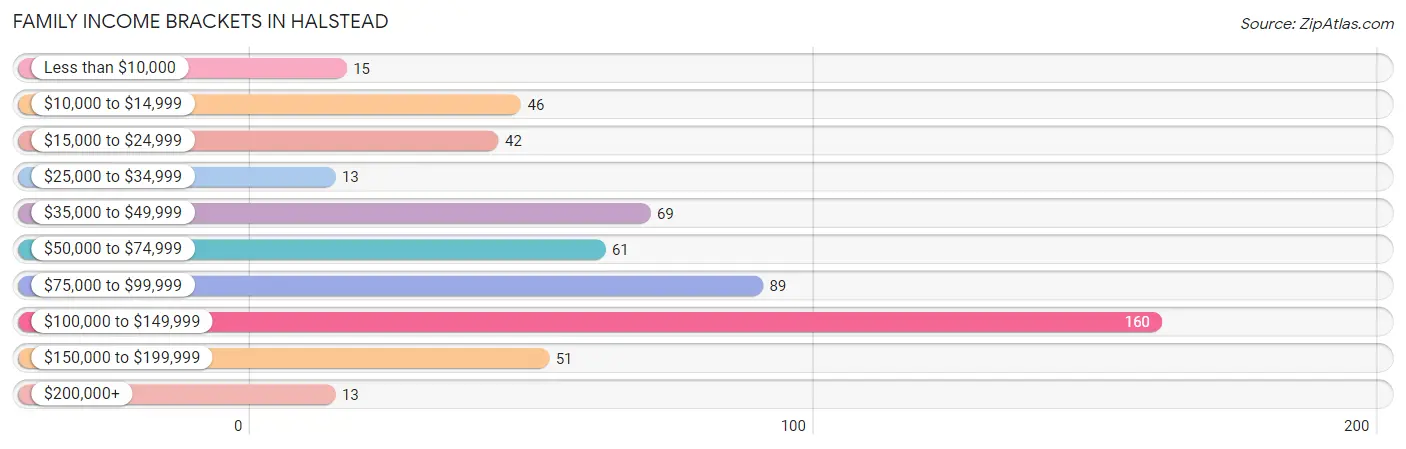
| Income Bracket | # Families | % Families |
| Less than $10,000 | 15 | 2.7% |
| $10,000 to $14,999 | 46 | 8.2% |
| $15,000 to $24,999 | 42 | 7.5% |
| $25,000 to $34,999 | 13 | 2.3% |
| $35,000 to $49,999 | 69 | 12.3% |
| $50,000 to $74,999 | 61 | 10.9% |
| $75,000 to $99,999 | 89 | 15.9% |
| $100,000 to $149,999 | 160 | 28.6% |
| $150,000 to $199,999 | 51 | 9.1% |
| $200,000+ | 13 | 2.3% |
Family Income by Famaliy Size in Halstead
4-person families (138 | 24.7%) account for the highest median family income in Halstead with $101,716 per family, while 2-person families (214 | 38.3%) have the highest median income of $30,000 per family member.
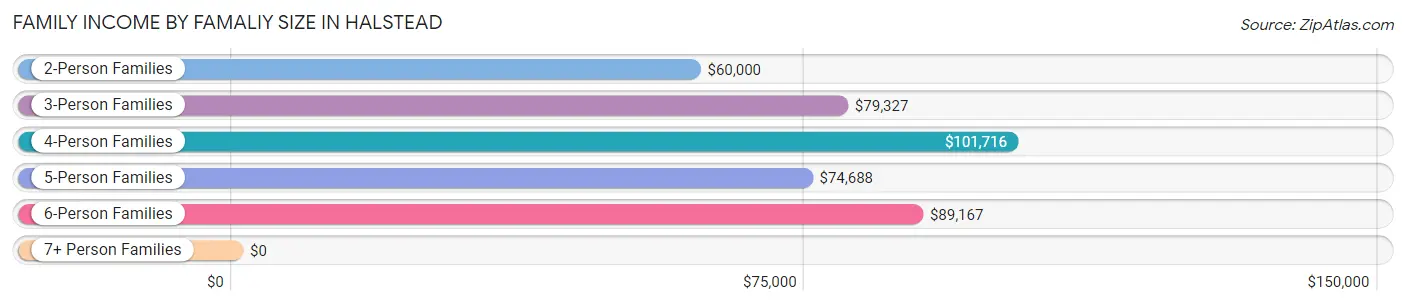
| Income Bracket | # Families | Median Income |
| 2-Person Families | 214 (38.3%) | $60,000 |
| 3-Person Families | 169 (30.2%) | $79,327 |
| 4-Person Families | 138 (24.7%) | $101,716 |
| 5-Person Families | 13 (2.3%) | $74,688 |
| 6-Person Families | 18 (3.2%) | $89,167 |
| 7+ Person Families | 7 (1.3%) | $0 |
| Total | 559 (100.0%) | $85,703 |
Family Income by Number of Earners in Halstead
The median family income in Halstead is $85,703, with families comprising 3+ earners (40) having the highest median family income of $124,286, while families with 1 earner (209) have the lowest median family income of $26,442, accounting for 7.2% and 37.4% of families, respectively.
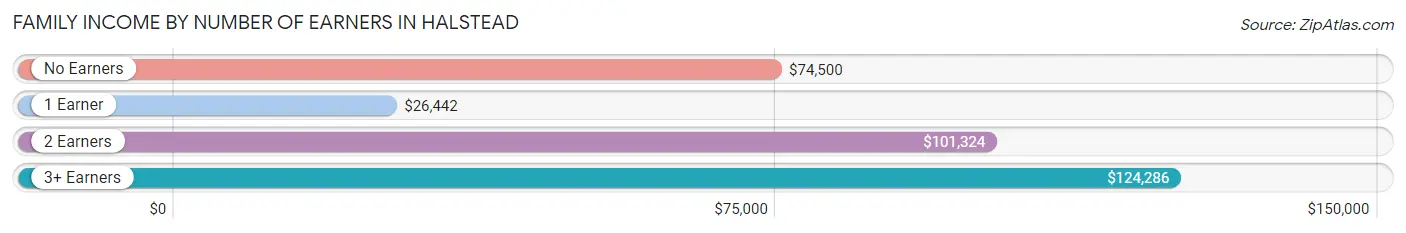
| Number of Earners | # Families | Median Income |
| No Earners | 52 (9.3%) | $74,500 |
| 1 Earner | 209 (37.4%) | $26,442 |
| 2 Earners | 258 (46.2%) | $101,324 |
| 3+ Earners | 40 (7.2%) | $124,286 |
| Total | 559 (100.0%) | $85,703 |
Household Income in Halstead
Household Income Brackets in Halstead
With 187 households falling in the category, the $50,000 to $74,999 income range is the most frequent in Halstead, accounting for 22.4% of all households. In contrast, only 13 households (1.6%) fall into the $200,000+ income bracket, making it the least populous group.
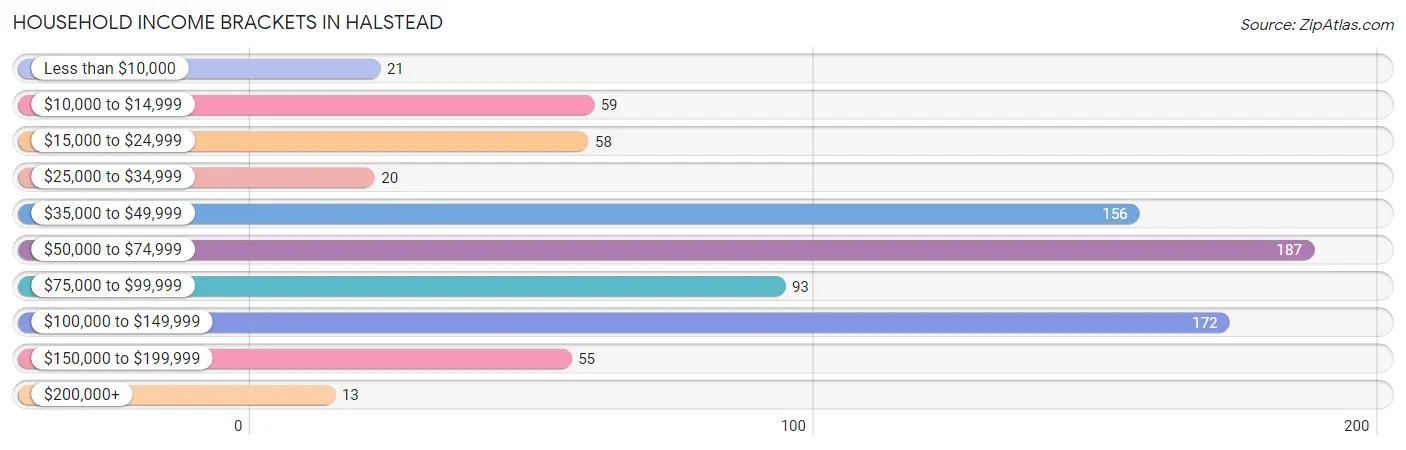
| Income Bracket | # Households | % Households |
| Less than $10,000 | 21 | 2.5% |
| $10,000 to $14,999 | 59 | 7.1% |
| $15,000 to $24,999 | 58 | 7.0% |
| $25,000 to $34,999 | 20 | 2.4% |
| $35,000 to $49,999 | 156 | 18.7% |
| $50,000 to $74,999 | 187 | 22.4% |
| $75,000 to $99,999 | 93 | 11.2% |
| $100,000 to $149,999 | 172 | 20.6% |
| $150,000 to $199,999 | 55 | 6.6% |
| $200,000+ | 13 | 1.6% |
Household Income by Householder Age in Halstead
The median household income in Halstead is $54,394, with the highest median household income of $62,500 found in the 25 to 44 years age bracket for the primary householder. A total of 328 households (39.3%) fall into this category. Meanwhile, the 15 to 24 years age bracket for the primary householder has the lowest median household income of $36,324, with 62 households (7.4%) in this group.
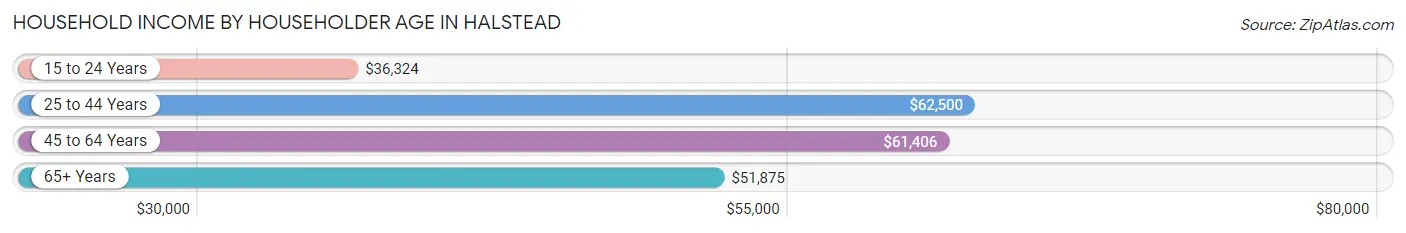
| Income Bracket | # Households | Median Income |
| 15 to 24 Years | 62 (7.4%) | $36,324 |
| 25 to 44 Years | 328 (39.3%) | $62,500 |
| 45 to 64 Years | 245 (29.4%) | $61,406 |
| 65+ Years | 199 (23.9%) | $51,875 |
| Total | 834 (100.0%) | $54,394 |
Poverty in Halstead
Income Below Poverty by Sex and Age in Halstead
With 8.1% poverty level for males and 23.7% for females among the residents of Halstead, 5 year old males and 5 year old females are the most vulnerable to poverty, with 7 males (30.4%) and 32 females (71.1%) in their respective age groups living below the poverty level.
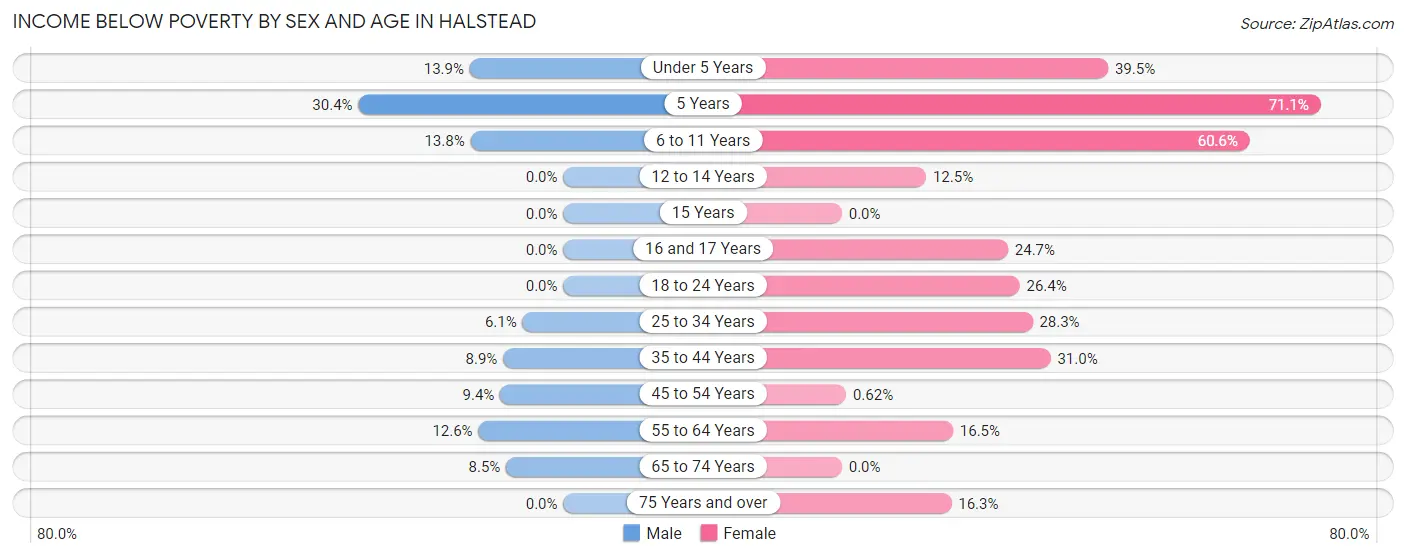
| Age Bracket | Male | Female |
| Under 5 Years | 10 (13.9%) | 34 (39.5%) |
| 5 Years | 7 (30.4%) | 32 (71.1%) |
| 6 to 11 Years | 8 (13.8%) | 63 (60.6%) |
| 12 to 14 Years | 0 (0.0%) | 7 (12.5%) |
| 15 Years | 0 (0.0%) | 0 (0.0%) |
| 16 and 17 Years | 0 (0.0%) | 18 (24.7%) |
| 18 to 24 Years | 0 (0.0%) | 19 (26.4%) |
| 25 to 34 Years | 8 (6.1%) | 47 (28.3%) |
| 35 to 44 Years | 11 (8.9%) | 44 (31.0%) |
| 45 to 54 Years | 6 (9.4%) | 1 (0.6%) |
| 55 to 64 Years | 14 (12.6%) | 16 (16.5%) |
| 65 to 74 Years | 9 (8.5%) | 0 (0.0%) |
| 75 Years and over | 0 (0.0%) | 20 (16.3%) |
| Total | 73 (8.1%) | 301 (23.7%) |
Income Above Poverty by Sex and Age in Halstead
According to the poverty statistics in Halstead, males aged 12 to 14 years and females aged 15 years are the age groups that are most secure financially, with 100.0% of males and 100.0% of females in these age groups living above the poverty line.
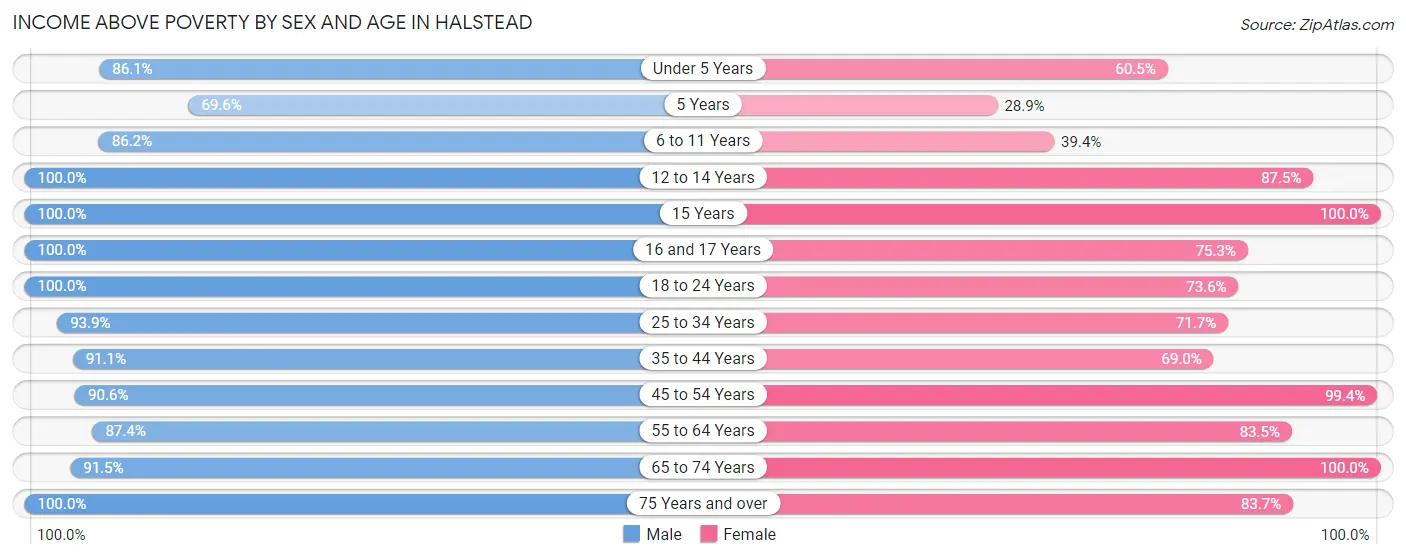
| Age Bracket | Male | Female |
| Under 5 Years | 62 (86.1%) | 52 (60.5%) |
| 5 Years | 16 (69.6%) | 13 (28.9%) |
| 6 to 11 Years | 50 (86.2%) | 41 (39.4%) |
| 12 to 14 Years | 38 (100.0%) | 49 (87.5%) |
| 15 Years | 35 (100.0%) | 27 (100.0%) |
| 16 and 17 Years | 4 (100.0%) | 55 (75.3%) |
| 18 to 24 Years | 115 (100.0%) | 53 (73.6%) |
| 25 to 34 Years | 124 (93.9%) | 119 (71.7%) |
| 35 to 44 Years | 112 (91.1%) | 98 (69.0%) |
| 45 to 54 Years | 58 (90.6%) | 159 (99.4%) |
| 55 to 64 Years | 97 (87.4%) | 81 (83.5%) |
| 65 to 74 Years | 97 (91.5%) | 118 (100.0%) |
| 75 Years and over | 18 (100.0%) | 103 (83.7%) |
| Total | 826 (91.9%) | 968 (76.3%) |
Income Below Poverty Among Married-Couple Families in Halstead
The poverty statistics for married-couple families in Halstead show that 2.3% or 9 of the total 386 families live below the poverty line. Families with 5 or more children have the highest poverty rate of 42.9%, comprising of 3 families. On the other hand, families with no children have the lowest poverty rate of 0.0%, which includes 0 families.
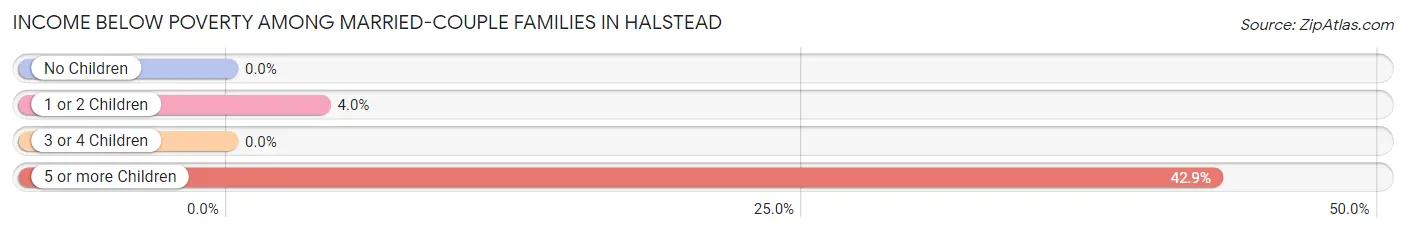
| Children | Above Poverty | Below Poverty |
| No Children | 202 (100.0%) | 0 (0.0%) |
| 1 or 2 Children | 143 (96.0%) | 6 (4.0%) |
| 3 or 4 Children | 28 (100.0%) | 0 (0.0%) |
| 5 or more Children | 4 (57.1%) | 3 (42.9%) |
| Total | 377 (97.7%) | 9 (2.3%) |
Income Below Poverty Among Single-Parent Households in Halstead
According to the poverty data in Halstead, 25.0% or 8 single-father households and 63.1% or 89 single-mother households are living below the poverty line. Among single-father households, those with 1 or 2 children have the highest poverty rate, with 8 households (38.1%) experiencing poverty. Likewise, among single-mother households, those with 1 or 2 children have the highest poverty rate, with 89 households (81.7%) falling below the poverty line.
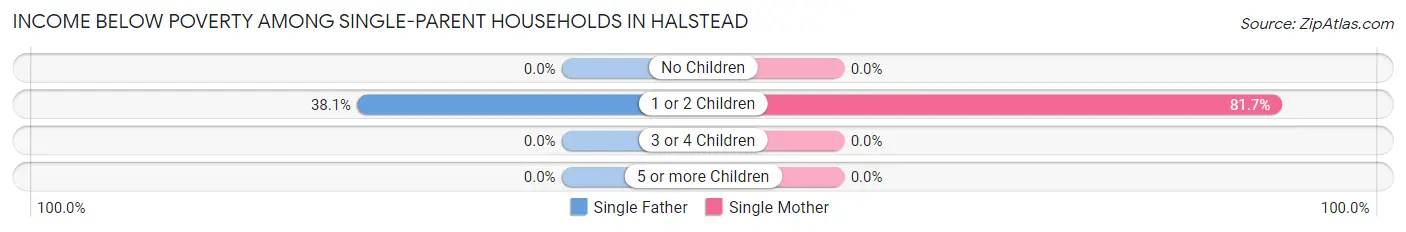
| Children | Single Father | Single Mother |
| No Children | 0 (0.0%) | 0 (0.0%) |
| 1 or 2 Children | 8 (38.1%) | 89 (81.7%) |
| 3 or 4 Children | 0 (0.0%) | 0 (0.0%) |
| 5 or more Children | 0 (0.0%) | 0 (0.0%) |
| Total | 8 (25.0%) | 89 (63.1%) |
Income Below Poverty Among Married-Couple vs Single-Parent Households in Halstead
The poverty data for Halstead shows that 9 of the married-couple family households (2.3%) and 97 of the single-parent households (56.1%) are living below the poverty level. Within the married-couple family households, those with 5 or more children have the highest poverty rate, with 3 households (42.9%) falling below the poverty line. Among the single-parent households, those with 1 or 2 children have the highest poverty rate, with 97 household (74.6%) living below poverty.
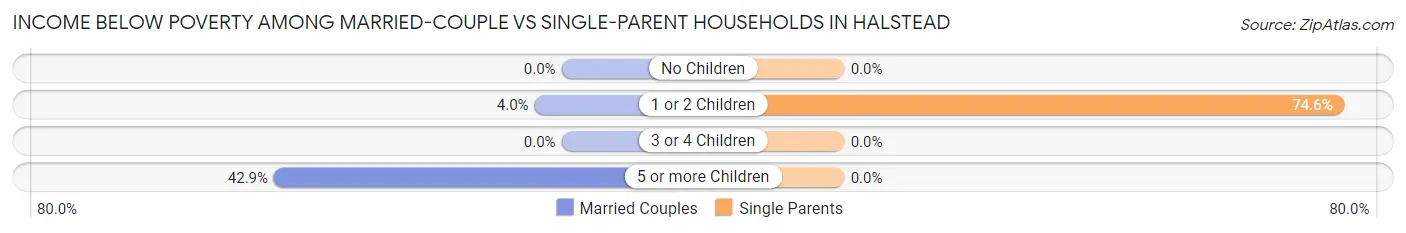
| Children | Married-Couple Families | Single-Parent Households |
| No Children | 0 (0.0%) | 0 (0.0%) |
| 1 or 2 Children | 6 (4.0%) | 97 (74.6%) |
| 3 or 4 Children | 0 (0.0%) | 0 (0.0%) |
| 5 or more Children | 3 (42.9%) | 0 (0.0%) |
| Total | 9 (2.3%) | 97 (56.1%) |
Race in Halstead
The most populous races in Halstead are White / Caucasian (1,942 | 86.6%), Two or more Races (193 | 8.6%), and Black / African American (63 | 2.8%).
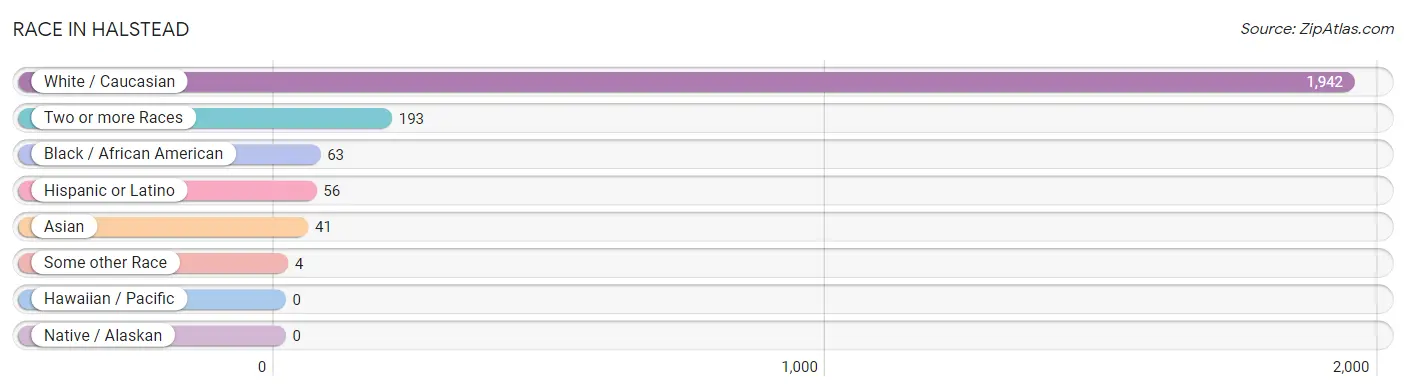
| Race | # Population | % Population |
| Asian | 41 | 1.8% |
| Black / African American | 63 | 2.8% |
| Hawaiian / Pacific | 0 | 0.0% |
| Hispanic or Latino | 56 | 2.5% |
| Native / Alaskan | 0 | 0.0% |
| White / Caucasian | 1,942 | 86.6% |
| Two or more Races | 193 | 8.6% |
| Some other Race | 4 | 0.2% |
| Total | 2,243 | 100.0% |
Ancestry in Halstead
The most populous ancestries reported in Halstead are German (714 | 31.8%), Irish (320 | 14.3%), English (256 | 11.4%), Scottish (101 | 4.5%), and Polish (84 | 3.7%), together accounting for 65.8% of all Halstead residents.
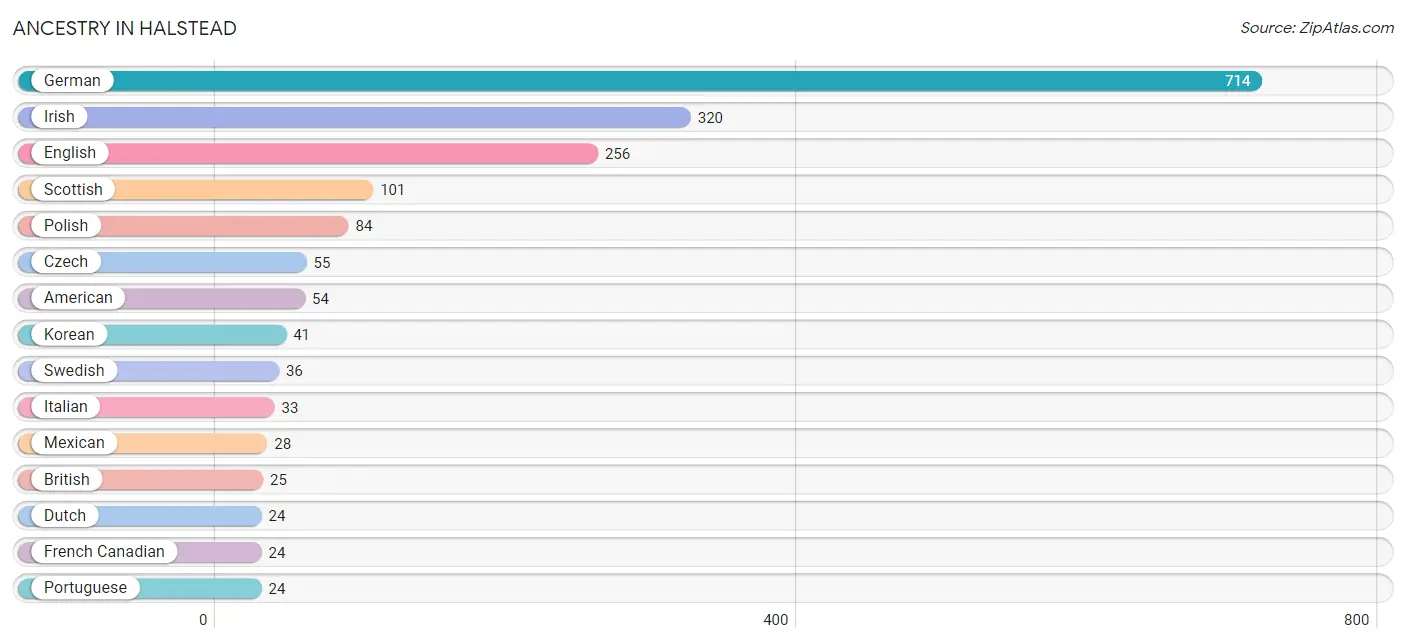
| Ancestry | # Population | % Population |
| American | 54 | 2.4% |
| Apache | 4 | 0.2% |
| British | 25 | 1.1% |
| Canadian | 2 | 0.1% |
| Cherokee | 1 | 0.0% |
| Czech | 55 | 2.5% |
| Dutch | 24 | 1.1% |
| English | 256 | 11.4% |
| European | 4 | 0.2% |
| French | 23 | 1.0% |
| French Canadian | 24 | 1.1% |
| German | 714 | 31.8% |
| Iranian | 11 | 0.5% |
| Irish | 320 | 14.3% |
| Italian | 33 | 1.5% |
| Korean | 41 | 1.8% |
| Latvian | 23 | 1.0% |
| Mexican | 28 | 1.3% |
| Navajo | 4 | 0.2% |
| Norwegian | 16 | 0.7% |
| Polish | 84 | 3.7% |
| Portuguese | 24 | 1.1% |
| Russian | 24 | 1.1% |
| Scandinavian | 1 | 0.0% |
| Scotch-Irish | 7 | 0.3% |
| Scottish | 101 | 4.5% |
| Spanish | 4 | 0.2% |
| Swedish | 36 | 1.6% |
| Ukrainian | 10 | 0.4% |
| Welsh | 4 | 0.2% | View All 30 Rows |
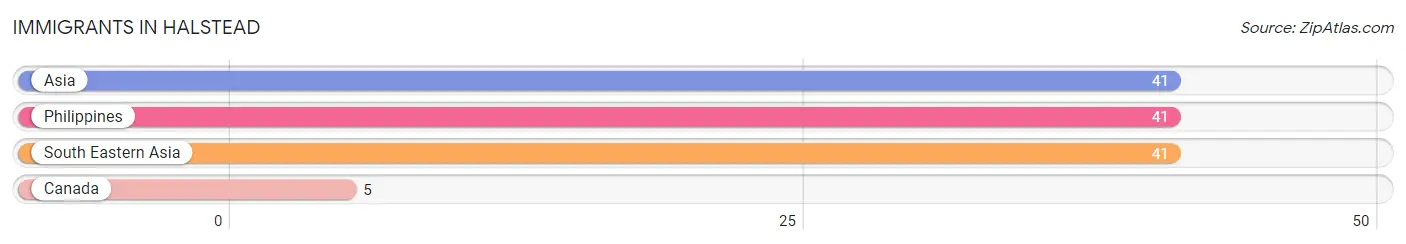
Immigrants in Halstead
The most numerous immigrant groups reported in Halstead came from Asia (41 | 1.8%), Philippines (41 | 1.8%), South Eastern Asia (41 | 1.8%), and Canada (5 | 0.2%), together accounting for 5.7% of all Halstead residents.
| Immigration Origin | # Population | % Population |
| Asia | 41 | 1.8% |
| Canada | 5 | 0.2% |
| Philippines | 41 | 1.8% |
| South Eastern Asia | 41 | 1.8% | View All 4 Rows |
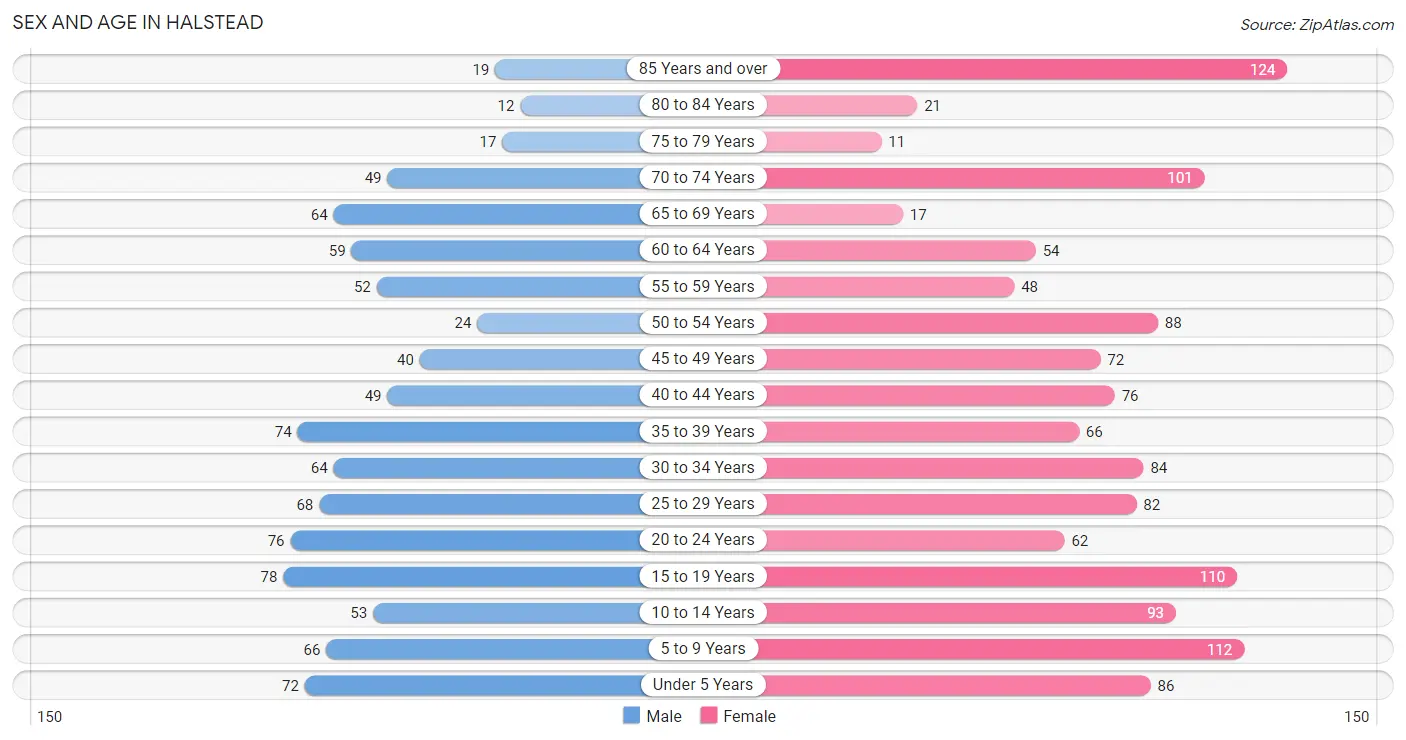
Sex and Age in Halstead
Sex and Age in Halstead
The most populous age groups in Halstead are 15 to 19 Years (78 | 8.3%) for men and 85 Years and over (124 | 9.5%) for women.
| Age Bracket | Male | Female |
| Under 5 Years | 72 (7.7%) | 86 (6.6%) |
| 5 to 9 Years | 66 (7.0%) | 112 (8.6%) |
| 10 to 14 Years | 53 (5.7%) | 93 (7.1%) |
| 15 to 19 Years | 78 (8.3%) | 110 (8.4%) |
| 20 to 24 Years | 76 (8.1%) | 62 (4.7%) |
| 25 to 29 Years | 68 (7.3%) | 82 (6.3%) |
| 30 to 34 Years | 64 (6.8%) | 84 (6.4%) |
| 35 to 39 Years | 74 (7.9%) | 66 (5.1%) |
| 40 to 44 Years | 49 (5.2%) | 76 (5.8%) |
| 45 to 49 Years | 40 (4.3%) | 72 (5.5%) |
| 50 to 54 Years | 24 (2.6%) | 88 (6.7%) |
| 55 to 59 Years | 52 (5.6%) | 48 (3.7%) |
| 60 to 64 Years | 59 (6.3%) | 54 (4.1%) |
| 65 to 69 Years | 64 (6.8%) | 17 (1.3%) |
| 70 to 74 Years | 49 (5.2%) | 101 (7.7%) |
| 75 to 79 Years | 17 (1.8%) | 11 (0.8%) |
| 80 to 84 Years | 12 (1.3%) | 21 (1.6%) |
| 85 Years and over | 19 (2.0%) | 124 (9.5%) |
| Total | 936 (100.0%) | 1,307 (100.0%) |
Families and Households in Halstead
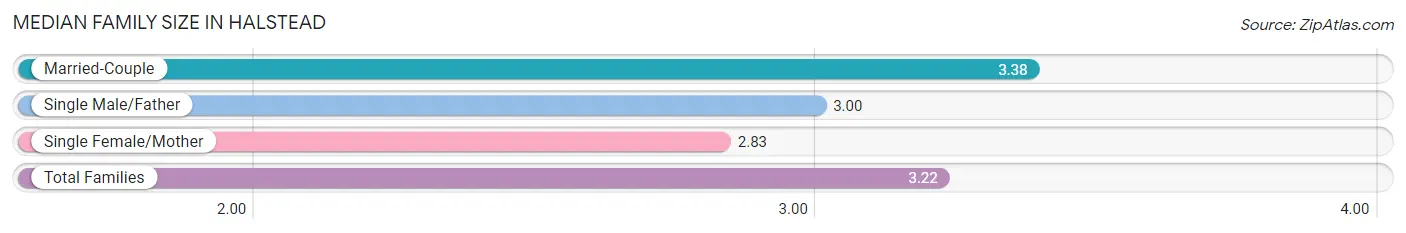
Median Family Size in Halstead
The median family size in Halstead is 3.22 persons per family, with married-couple families (386 | 69.1%) accounting for the largest median family size of 3.38 persons per family. On the other hand, single female/mother families (141 | 25.2%) represent the smallest median family size with 2.83 persons per family.
| Family Type | # Families | Family Size |
| Married-Couple | 386 (69.1%) | 3.38 |
| Single Male/Father | 32 (5.7%) | 3.00 |
| Single Female/Mother | 141 (25.2%) | 2.83 |
| Total Families | 559 (100.0%) | 3.22 |
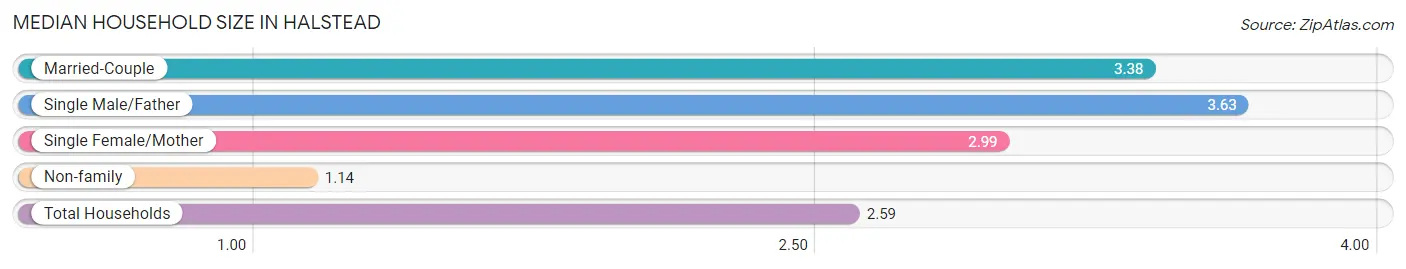
Median Household Size in Halstead
The median household size in Halstead is 2.59 persons per household, with single male/father households (32 | 3.8%) accounting for the largest median household size of 3.63 persons per household. non-family households (275 | 33.0%) represent the smallest median household size with 1.14 persons per household.
| Household Type | # Households | Household Size |
| Married-Couple | 386 (46.3%) | 3.38 |
| Single Male/Father | 32 (3.8%) | 3.63 |
| Single Female/Mother | 141 (16.9%) | 2.99 |
| Non-family | 275 (33.0%) | 1.14 |
| Total Households | 834 (100.0%) | 2.59 |
Household Size by Marriage Status in Halstead
Out of a total of 834 households in Halstead, 559 (67.0%) are family households, while 275 (33.0%) are nonfamily households. The most numerous type of family households are 2-person households, comprising 198, and the most common type of nonfamily households are 1-person households, comprising 239.
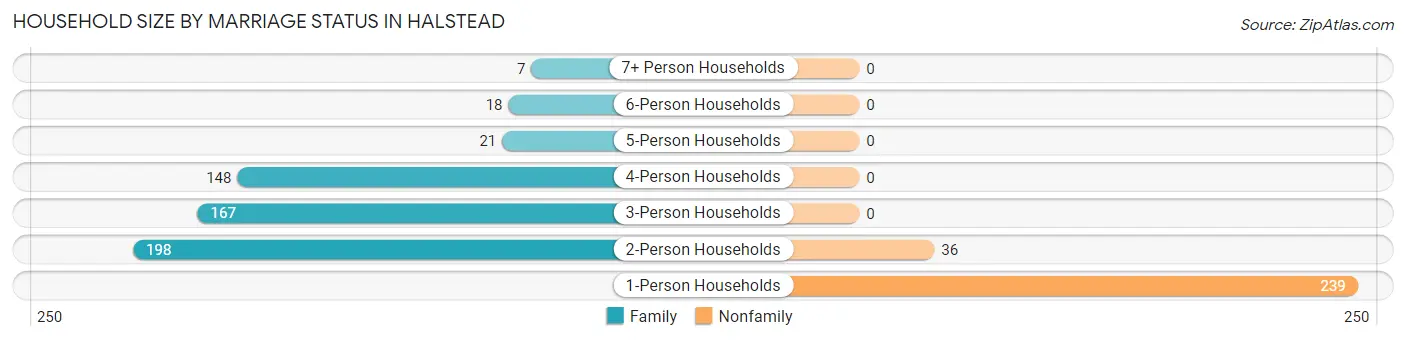
| Household Size | Family Households | Nonfamily Households |
| 1-Person Households | - | 239 (28.7%) |
| 2-Person Households | 198 (23.7%) | 36 (4.3%) |
| 3-Person Households | 167 (20.0%) | 0 (0.0%) |
| 4-Person Households | 148 (17.7%) | 0 (0.0%) |
| 5-Person Households | 21 (2.5%) | 0 (0.0%) |
| 6-Person Households | 18 (2.2%) | 0 (0.0%) |
| 7+ Person Households | 7 (0.8%) | 0 (0.0%) |
| Total | 559 (67.0%) | 275 (33.0%) |
Female Fertility in Halstead
Fertility by Age in Halstead
Average fertility rate in Halstead is 46.0 births per 1,000 women. Women in the age bracket of 20 to 34 years have the highest fertility rate with 92.0 births per 1,000 women. Women in the age bracket of 20 to 34 years acount for 80.8% of all women with births.
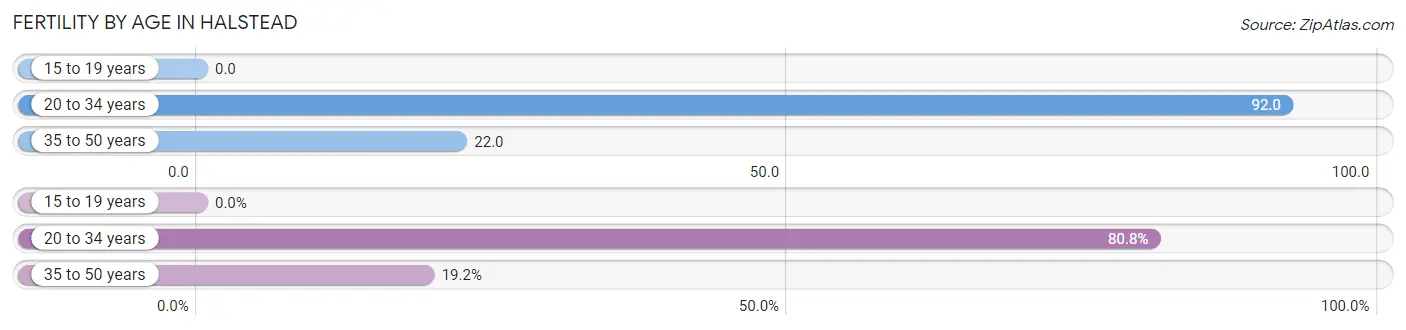
| Age Bracket | Women with Births | Births / 1,000 Women |
| 15 to 19 years | 0 (0.0%) | 0.0 |
| 20 to 34 years | 21 (80.8%) | 92.0 |
| 35 to 50 years | 5 (19.2%) | 22.0 |
| Total | 26 (100.0%) | 46.0 |
Fertility by Age by Marriage Status in Halstead
88.5% of women with births (26) in Halstead are married. The highest percentage of unmarried women with births falls into 20 to 34 years age bracket with 14.3% of them unmarried at the time of birth, while the lowest percentage of unmarried women with births belong to 35 to 50 years age bracket with 0.0% of them unmarried.
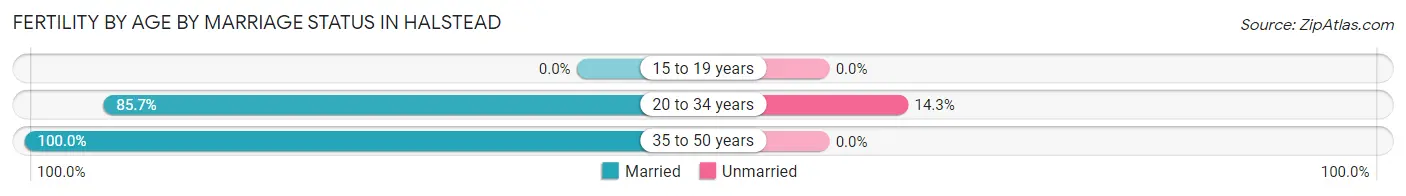
| Age Bracket | Married | Unmarried |
| 15 to 19 years | 0 (0.0%) | 0 (0.0%) |
| 20 to 34 years | 18 (85.7%) | 3 (14.3%) |
| 35 to 50 years | 5 (100.0%) | 0 (0.0%) |
| Total | 23 (88.5%) | 3 (11.5%) |
Fertility by Education in Halstead
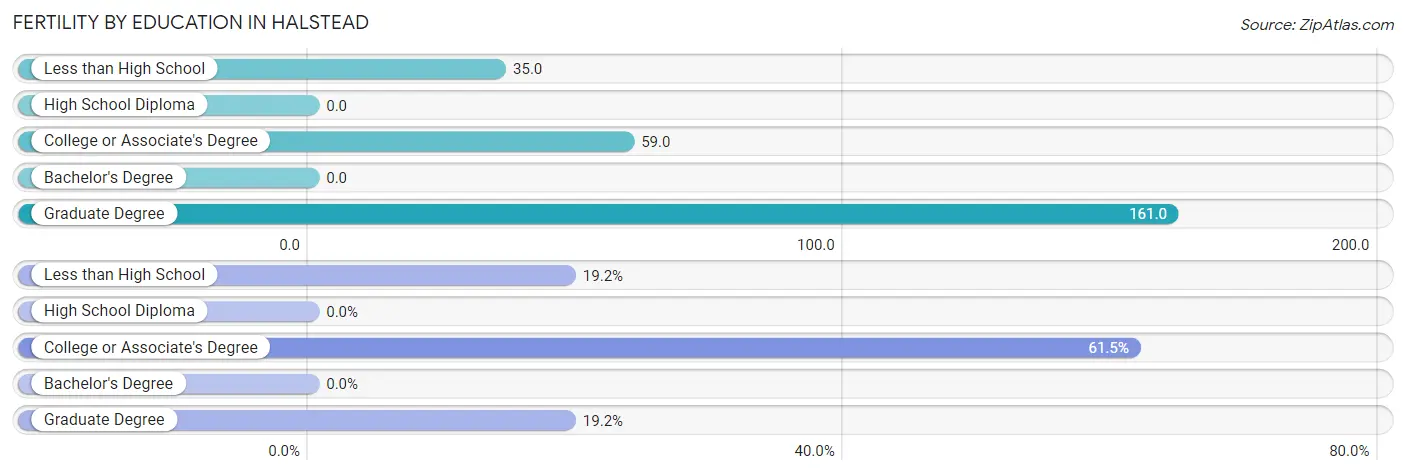
| Educational Attainment | Women with Births | Births / 1,000 Women |
| Less than High School | 5 (19.2%) | 35.0 |
| High School Diploma | 0 (0.0%) | 0.0 |
| College or Associate's Degree | 16 (61.5%) | 59.0 |
| Bachelor's Degree | 0 (0.0%) | 0.0 |
| Graduate Degree | 5 (19.2%) | 161.0 |
| Total | 26 (100.0%) | 46.0 |
Fertility by Education by Marriage Status in Halstead
11.5% of women with births in Halstead are unmarried. Women with the educational attainment of less than high school are most likely to be married with 100.0% of them married at childbirth, while women with the educational attainment of college or associate's degree are least likely to be married with 18.8% of them unmarried at childbirth.
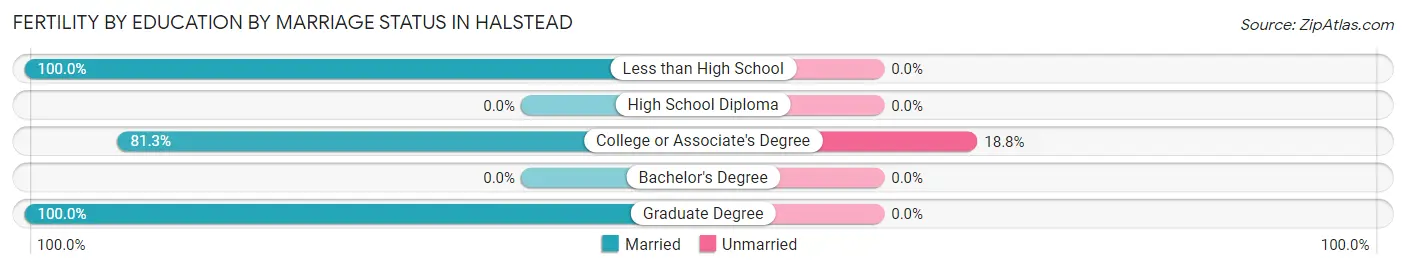
| Educational Attainment | Married | Unmarried |
| Less than High School | 5 (100.0%) | 0 (0.0%) |
| High School Diploma | 0 (0.0%) | 0 (0.0%) |
| College or Associate's Degree | 13 (81.2%) | 3 (18.8%) |
| Bachelor's Degree | 0 (0.0%) | 0 (0.0%) |
| Graduate Degree | 5 (100.0%) | 0 (0.0%) |
| Total | 23 (88.5%) | 3 (11.5%) |
Employment Characteristics in Halstead
Employment by Class of Employer in Halstead
Among the 991 employed individuals in Halstead, private company employees (561 | 56.6%), not-for-profit organizations (159 | 16.0%), and local government employees (148 | 14.9%) make up the most common classes of employment.
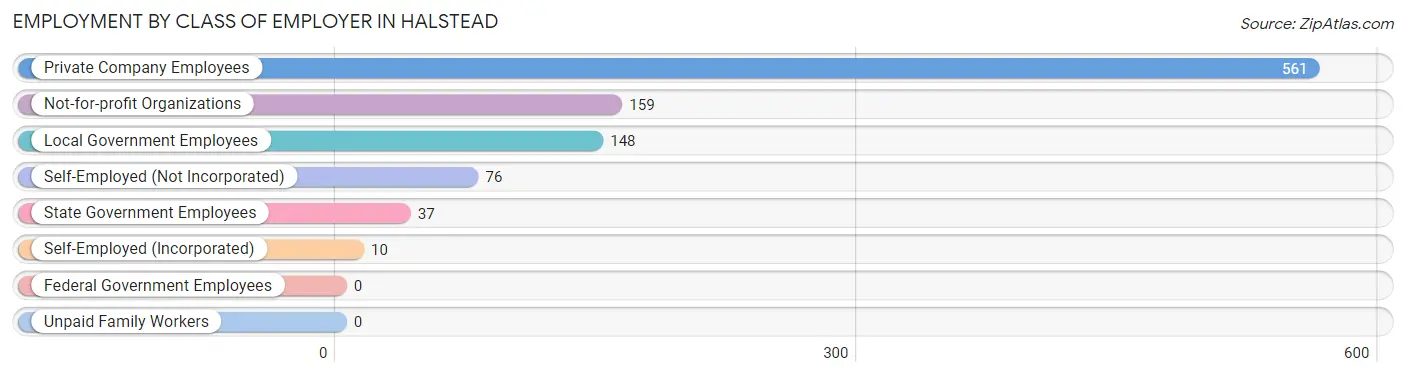
| Employer Class | # Employees | % Employees |
| Private Company Employees | 561 | 56.6% |
| Self-Employed (Incorporated) | 10 | 1.0% |
| Self-Employed (Not Incorporated) | 76 | 7.7% |
| Not-for-profit Organizations | 159 | 16.0% |
| Local Government Employees | 148 | 14.9% |
| State Government Employees | 37 | 3.7% |
| Federal Government Employees | 0 | 0.0% |
| Unpaid Family Workers | 0 | 0.0% |
| Total | 991 | 100.0% |
Employment Status by Age in Halstead
According to the labor force statistics for Halstead, out of the total population over 16 years of age (1,699), 59.7% or 1,014 individuals are in the labor force, with 0.4% or 4 of them unemployed. The age group with the highest labor force participation rate is 45 to 54 years, with 95.1% or 213 individuals in the labor force. Within the labor force, the 30 to 34 years age range has the highest percentage of unemployed individuals, with 3.0% or 4 of them being unemployed.
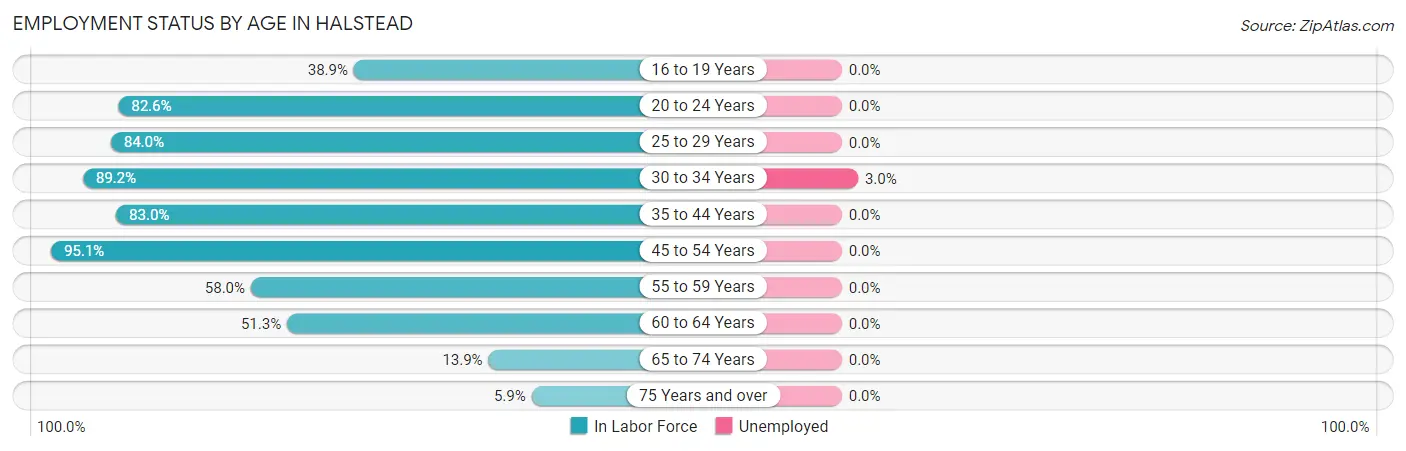
| Age Bracket | In Labor Force | Unemployed |
| 16 to 19 Years | 49 (38.9%) | 0 (0.0%) |
| 20 to 24 Years | 114 (82.6%) | 0 (0.0%) |
| 25 to 29 Years | 126 (84.0%) | 0 (0.0%) |
| 30 to 34 Years | 132 (89.2%) | 4 (3.0%) |
| 35 to 44 Years | 220 (83.0%) | 0 (0.0%) |
| 45 to 54 Years | 213 (95.1%) | 0 (0.0%) |
| 55 to 59 Years | 58 (58.0%) | 0 (0.0%) |
| 60 to 64 Years | 58 (51.3%) | 0 (0.0%) |
| 65 to 74 Years | 32 (13.9%) | 0 (0.0%) |
| 75 Years and over | 12 (5.9%) | 0 (0.0%) |
| Total | 1,014 (59.7%) | 4 (0.4%) |
Employment Status by Educational Attainment in Halstead
According to labor force statistics for Halstead, 80.7% of individuals (807) out of the total population between 25 and 64 years of age (1,000) are in the labor force, with 0.5% or 4 of them being unemployed. The group with the highest labor force participation rate are those with the educational attainment of bachelor's degree or higher, with 88.2% or 179 individuals in the labor force. Within the labor force, individuals with high school diploma education have the highest percentage of unemployment, with 2.4% or 4 of them being unemployed.
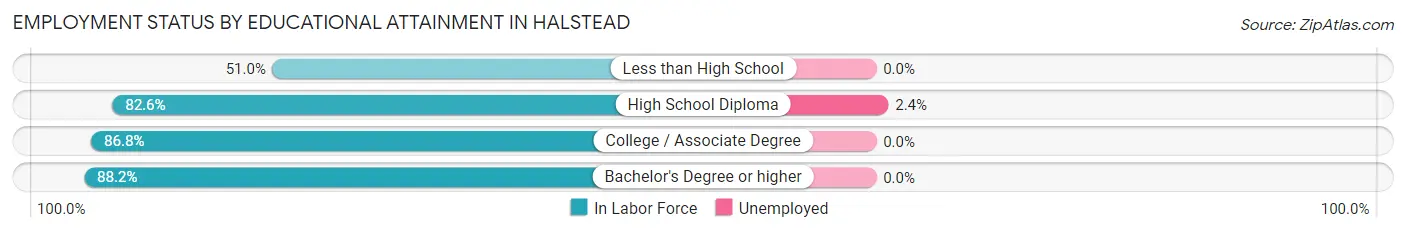
| Educational Attainment | In Labor Force | Unemployed |
| Less than High School | 79 (51.0%) | 0 (0.0%) |
| High School Diploma | 166 (82.6%) | 5 (2.4%) |
| College / Associate Degree | 383 (86.8%) | 0 (0.0%) |
| Bachelor's Degree or higher | 179 (88.2%) | 0 (0.0%) |
| Total | 807 (80.7%) | 5 (0.5%) |
Employment Occupations by Sex in Halstead
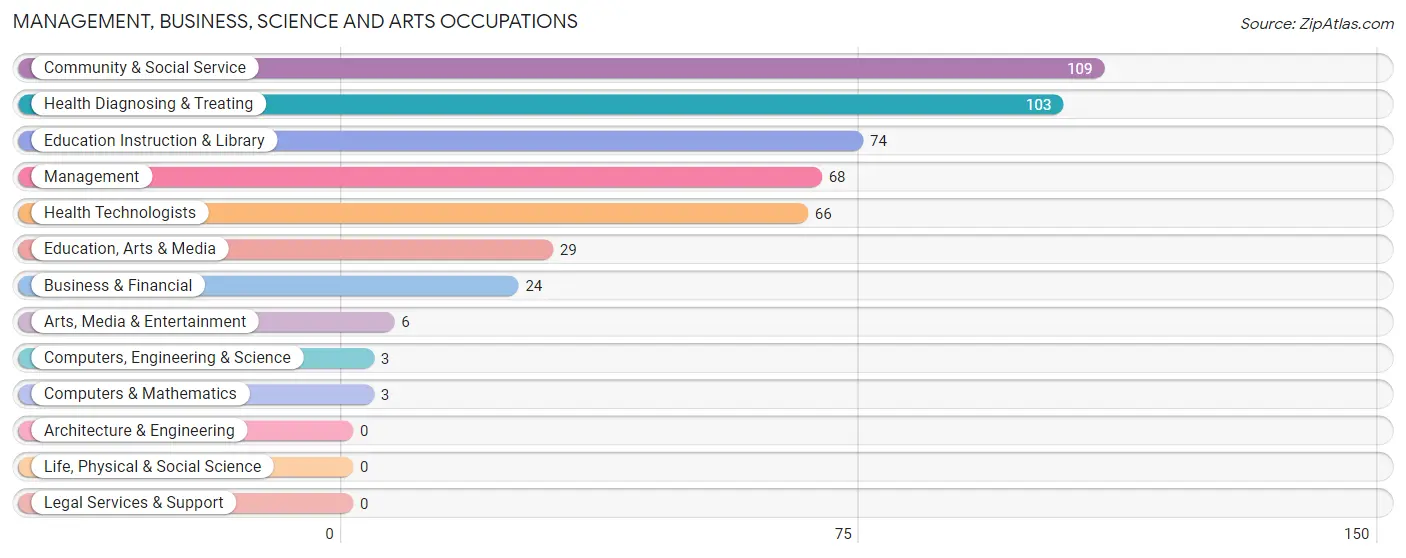
Management, Business, Science and Arts Occupations
The most common Management, Business, Science and Arts occupations in Halstead are Community & Social Service (109 | 10.8%), Health Diagnosing & Treating (103 | 10.2%), Education Instruction & Library (74 | 7.3%), Management (68 | 6.7%), and Health Technologists (66 | 6.5%).
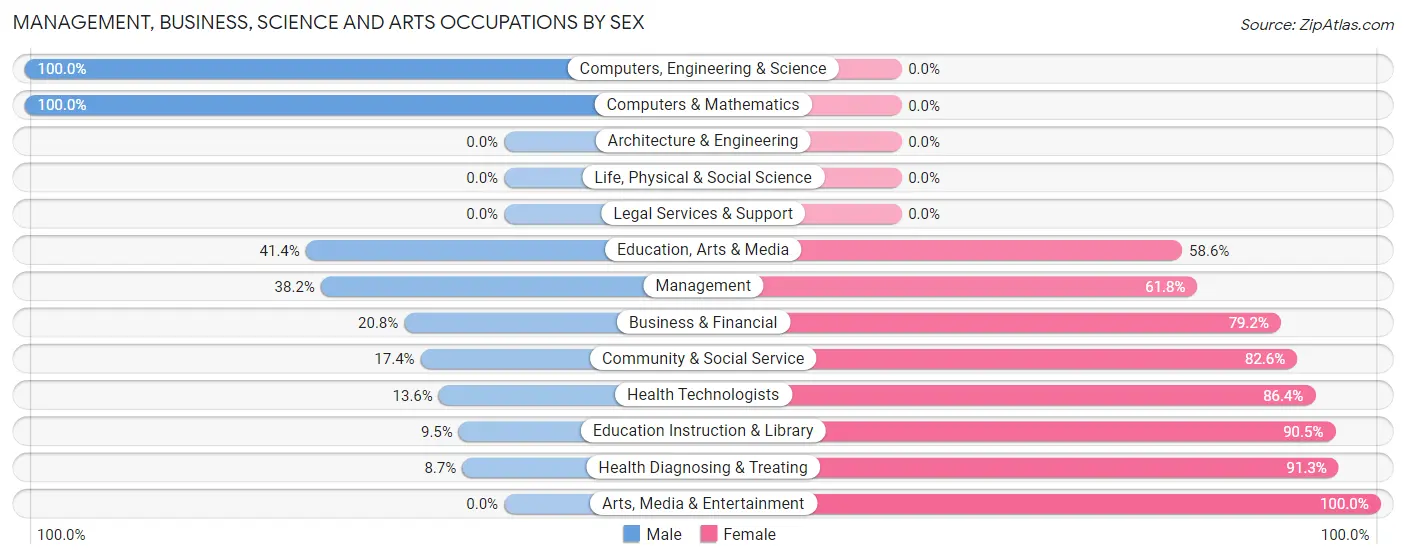
Management, Business, Science and Arts Occupations by Sex
Within the Management, Business, Science and Arts occupations in Halstead, the most male-oriented occupations are Computers, Engineering & Science (100.0%), Computers & Mathematics (100.0%), and Education, Arts & Media (41.4%), while the most female-oriented occupations are Arts, Media & Entertainment (100.0%), Health Diagnosing & Treating (91.3%), and Education Instruction & Library (90.5%).
| Occupation | Male | Female |
| Management | 26 (38.2%) | 42 (61.8%) |
| Business & Financial | 5 (20.8%) | 19 (79.2%) |
| Computers, Engineering & Science | 3 (100.0%) | 0 (0.0%) |
| Computers & Mathematics | 3 (100.0%) | 0 (0.0%) |
| Architecture & Engineering | 0 (0.0%) | 0 (0.0%) |
| Life, Physical & Social Science | 0 (0.0%) | 0 (0.0%) |
| Community & Social Service | 19 (17.4%) | 90 (82.6%) |
| Education, Arts & Media | 12 (41.4%) | 17 (58.6%) |
| Legal Services & Support | 0 (0.0%) | 0 (0.0%) |
| Education Instruction & Library | 7 (9.5%) | 67 (90.5%) |
| Arts, Media & Entertainment | 0 (0.0%) | 6 (100.0%) |
| Health Diagnosing & Treating | 9 (8.7%) | 94 (91.3%) |
| Health Technologists | 9 (13.6%) | 57 (86.4%) |
| Total (Category) | 62 (20.2%) | 245 (79.8%) |
| Total (Overall) | 461 (45.6%) | 549 (54.4%) |
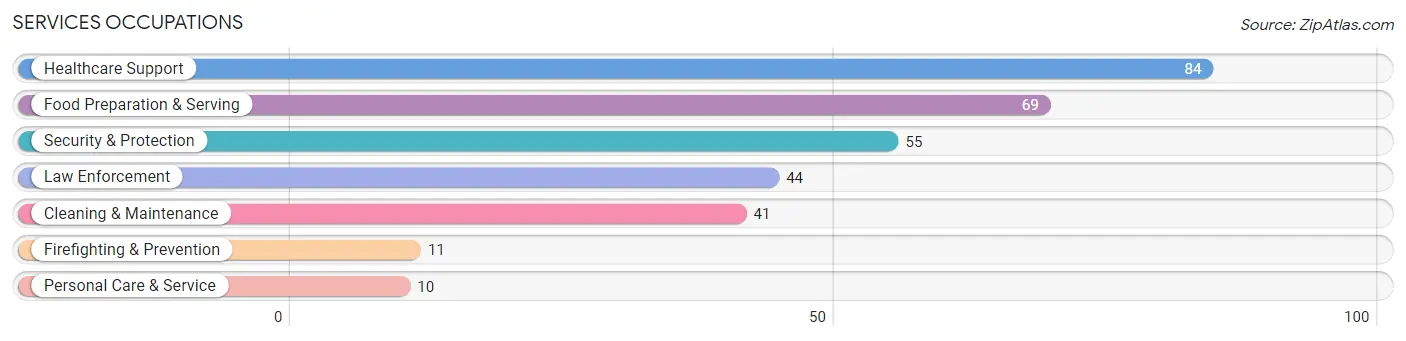
Services Occupations
The most common Services occupations in Halstead are Healthcare Support (84 | 8.3%), Food Preparation & Serving (69 | 6.8%), Security & Protection (55 | 5.4%), Law Enforcement (44 | 4.4%), and Cleaning & Maintenance (41 | 4.1%).
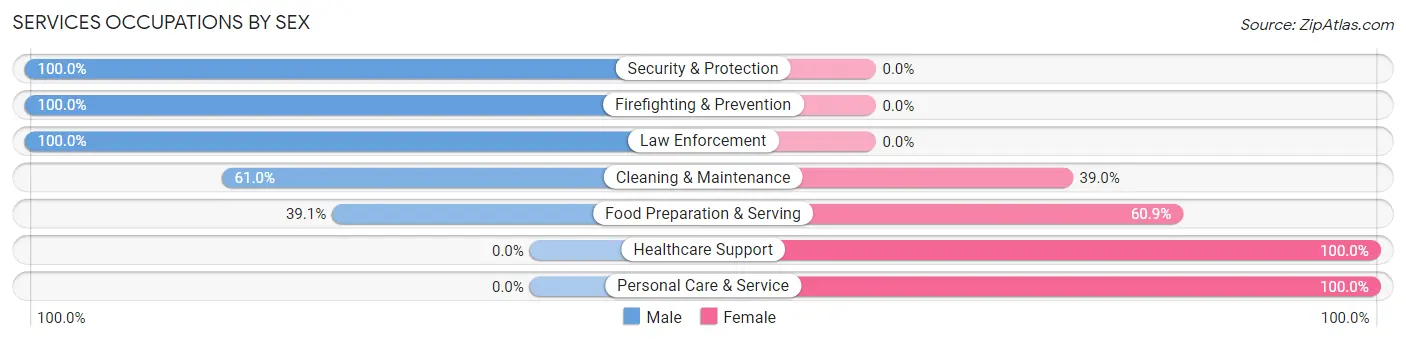
Services Occupations by Sex
Within the Services occupations in Halstead, the most male-oriented occupations are Security & Protection (100.0%), Firefighting & Prevention (100.0%), and Law Enforcement (100.0%), while the most female-oriented occupations are Healthcare Support (100.0%), Personal Care & Service (100.0%), and Food Preparation & Serving (60.9%).
| Occupation | Male | Female |
| Healthcare Support | 0 (0.0%) | 84 (100.0%) |
| Security & Protection | 55 (100.0%) | 0 (0.0%) |
| Firefighting & Prevention | 11 (100.0%) | 0 (0.0%) |
| Law Enforcement | 44 (100.0%) | 0 (0.0%) |
| Food Preparation & Serving | 27 (39.1%) | 42 (60.9%) |
| Cleaning & Maintenance | 25 (61.0%) | 16 (39.0%) |
| Personal Care & Service | 0 (0.0%) | 10 (100.0%) |
| Total (Category) | 107 (41.3%) | 152 (58.7%) |
| Total (Overall) | 461 (45.6%) | 549 (54.4%) |
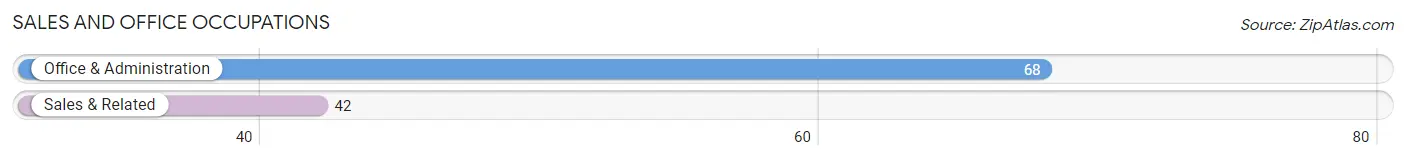
Sales and Office Occupations
The most common Sales and Office occupations in Halstead are Office & Administration (68 | 6.7%), and Sales & Related (42 | 4.2%).
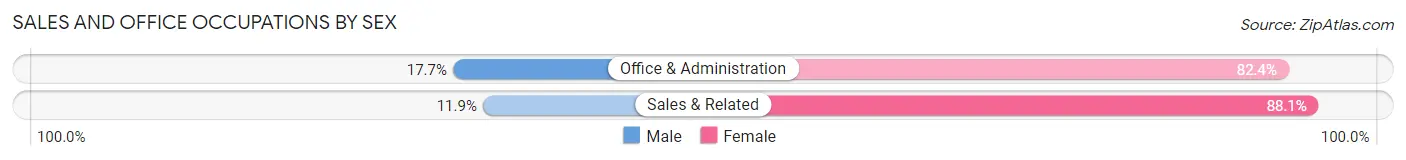
Sales and Office Occupations by Sex
| Occupation | Male | Female |
| Sales & Related | 5 (11.9%) | 37 (88.1%) |
| Office & Administration | 12 (17.6%) | 56 (82.4%) |
| Total (Category) | 17 (15.4%) | 93 (84.6%) |
| Total (Overall) | 461 (45.6%) | 549 (54.4%) |
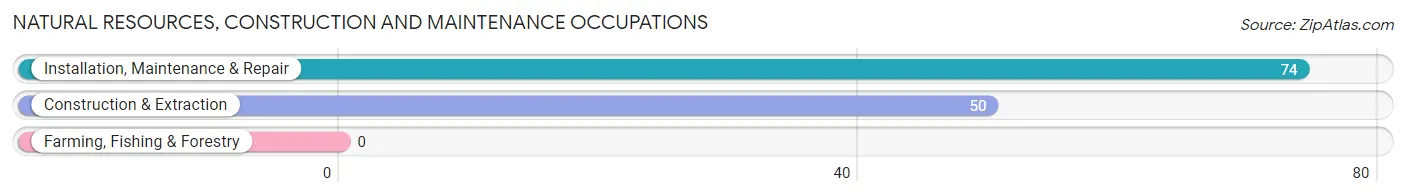
Natural Resources, Construction and Maintenance Occupations
The most common Natural Resources, Construction and Maintenance occupations in Halstead are Installation, Maintenance & Repair (74 | 7.3%), and Construction & Extraction (50 | 5.0%).
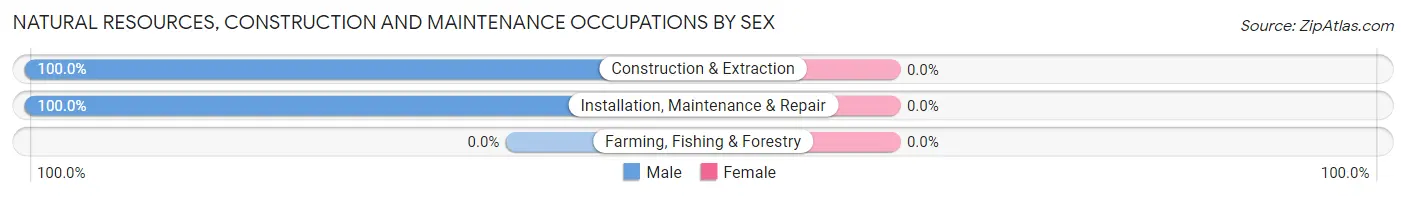
Natural Resources, Construction and Maintenance Occupations by Sex
| Occupation | Male | Female |
| Farming, Fishing & Forestry | 0 (0.0%) | 0 (0.0%) |
| Construction & Extraction | 50 (100.0%) | 0 (0.0%) |
| Installation, Maintenance & Repair | 74 (100.0%) | 0 (0.0%) |
| Total (Category) | 124 (100.0%) | 0 (0.0%) |
| Total (Overall) | 461 (45.6%) | 549 (54.4%) |
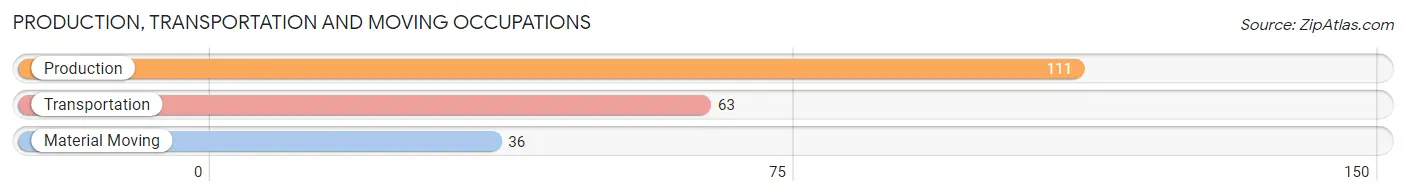
Production, Transportation and Moving Occupations
The most common Production, Transportation and Moving occupations in Halstead are Production (111 | 11.0%), Transportation (63 | 6.2%), and Material Moving (36 | 3.6%).
Production, Transportation and Moving Occupations by Sex
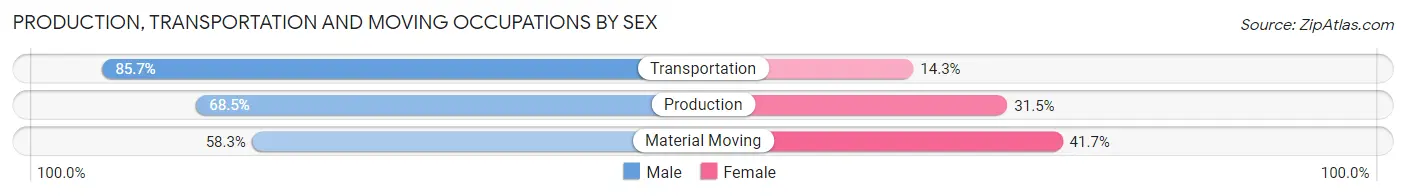
| Occupation | Male | Female |
| Production | 76 (68.5%) | 35 (31.5%) |
| Transportation | 54 (85.7%) | 9 (14.3%) |
| Material Moving | 21 (58.3%) | 15 (41.7%) |
| Total (Category) | 151 (71.9%) | 59 (28.1%) |
| Total (Overall) | 461 (45.6%) | 549 (54.4%) |
Employment Industries by Sex in Halstead
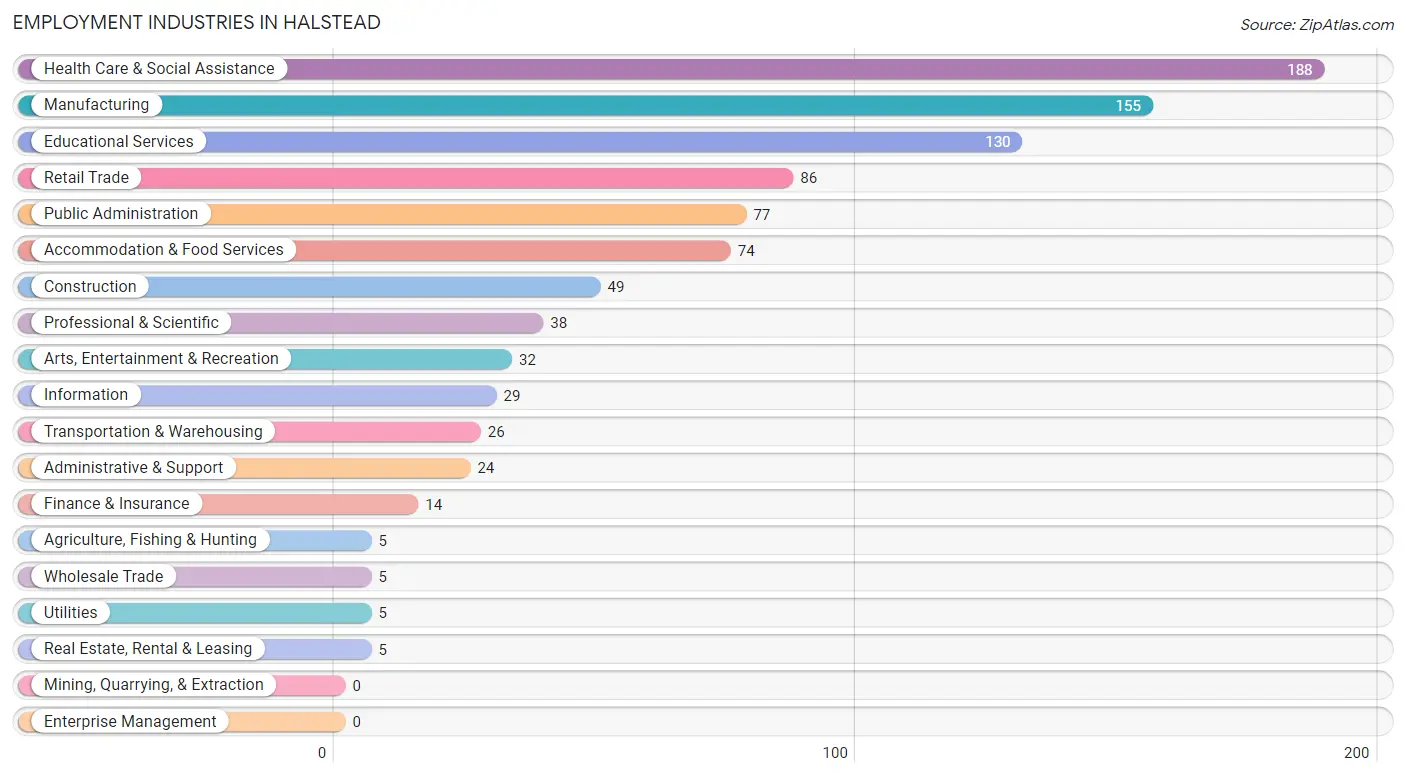
Employment Industries in Halstead
The major employment industries in Halstead include Health Care & Social Assistance (188 | 18.6%), Manufacturing (155 | 15.3%), Educational Services (130 | 12.9%), Retail Trade (86 | 8.5%), and Public Administration (77 | 7.6%).
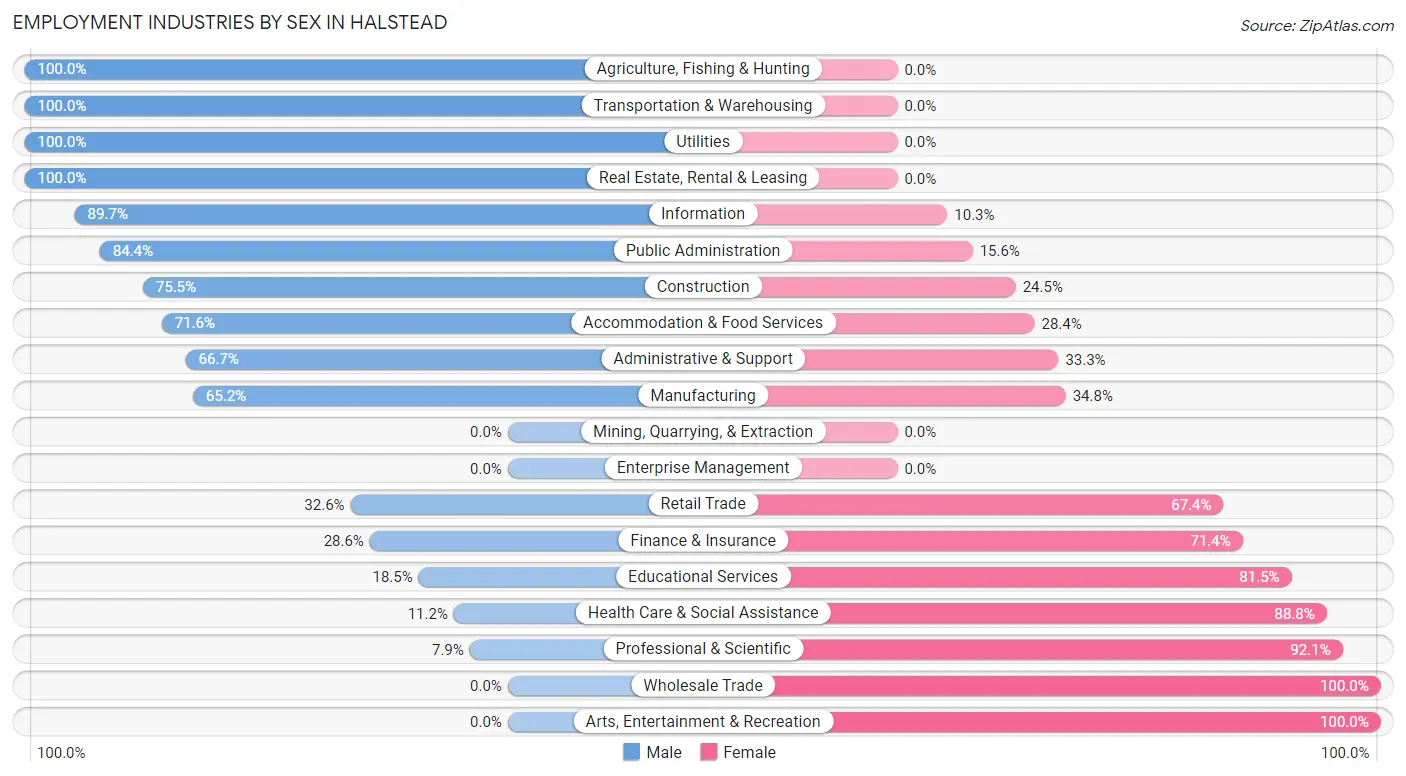
Employment Industries by Sex in Halstead
The Halstead industries that see more men than women are Agriculture, Fishing & Hunting (100.0%), Transportation & Warehousing (100.0%), and Utilities (100.0%), whereas the industries that tend to have a higher number of women are Wholesale Trade (100.0%), Arts, Entertainment & Recreation (100.0%), and Professional & Scientific (92.1%).
| Industry | Male | Female |
| Agriculture, Fishing & Hunting | 5 (100.0%) | 0 (0.0%) |
| Mining, Quarrying, & Extraction | 0 (0.0%) | 0 (0.0%) |
| Construction | 37 (75.5%) | 12 (24.5%) |
| Manufacturing | 101 (65.2%) | 54 (34.8%) |
| Wholesale Trade | 0 (0.0%) | 5 (100.0%) |
| Retail Trade | 28 (32.6%) | 58 (67.4%) |
| Transportation & Warehousing | 26 (100.0%) | 0 (0.0%) |
| Utilities | 5 (100.0%) | 0 (0.0%) |
| Information | 26 (89.7%) | 3 (10.3%) |
| Finance & Insurance | 4 (28.6%) | 10 (71.4%) |
| Real Estate, Rental & Leasing | 5 (100.0%) | 0 (0.0%) |
| Professional & Scientific | 3 (7.9%) | 35 (92.1%) |
| Enterprise Management | 0 (0.0%) | 0 (0.0%) |
| Administrative & Support | 16 (66.7%) | 8 (33.3%) |
| Educational Services | 24 (18.5%) | 106 (81.5%) |
| Health Care & Social Assistance | 21 (11.2%) | 167 (88.8%) |
| Arts, Entertainment & Recreation | 0 (0.0%) | 32 (100.0%) |
| Accommodation & Food Services | 53 (71.6%) | 21 (28.4%) |
| Public Administration | 65 (84.4%) | 12 (15.6%) |
| Total | 461 (45.6%) | 549 (54.4%) |
Education in Halstead
School Enrollment in Halstead
The most common levels of schooling among the 632 students in Halstead are high school (163 | 25.8%), elementary school (134 | 21.2%), and nursery / preschool (117 | 18.5%).
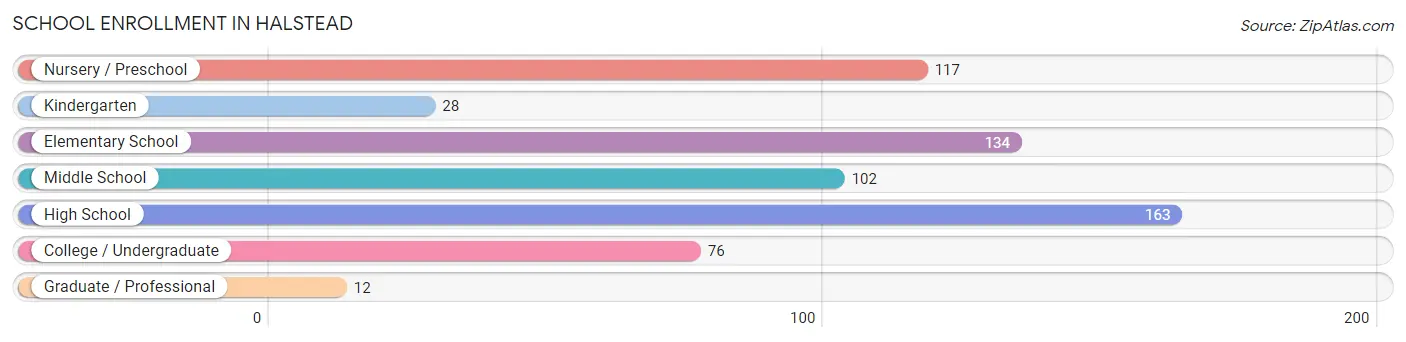
| School Level | # Students | % Students |
| Nursery / Preschool | 117 | 18.5% |
| Kindergarten | 28 | 4.4% |
| Elementary School | 134 | 21.2% |
| Middle School | 102 | 16.1% |
| High School | 163 | 25.8% |
| College / Undergraduate | 76 | 12.0% |
| Graduate / Professional | 12 | 1.9% |
| Total | 632 | 100.0% |
School Enrollment by Age by Funding Source in Halstead
Out of a total of 632 students who are enrolled in schools in Halstead, 72 (11.4%) attend a private institution, while the remaining 560 (88.6%) are enrolled in public schools. The age group of 35 years and over has the highest likelihood of being enrolled in private schools, with 5 (23.8% in the age bracket) enrolled. Conversely, the age group of 15 to 17 year olds has the lowest likelihood of being enrolled in a private school, with 139 (100.0% in the age bracket) attending a public institution.
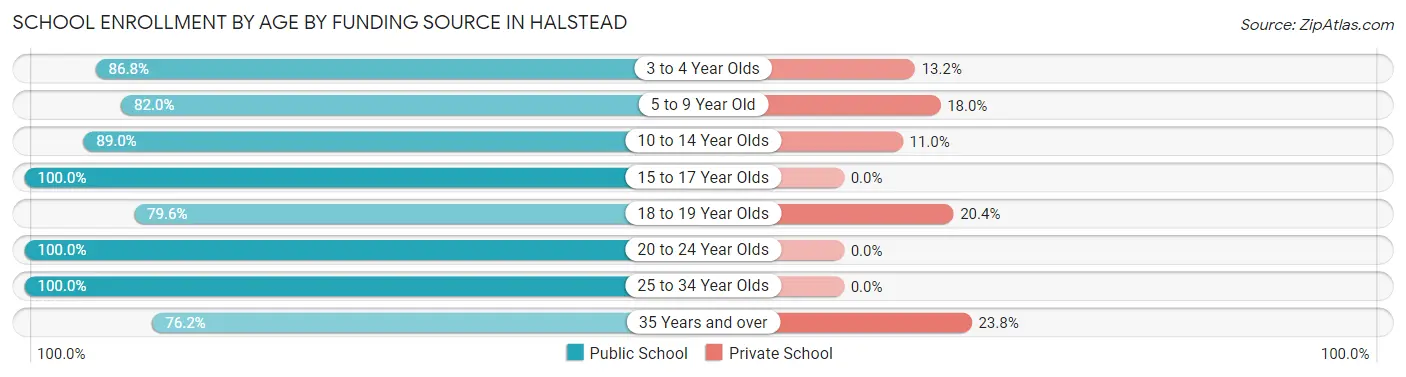
| Age Bracket | Public School | Private School |
| 3 to 4 Year Olds | 59 (86.8%) | 9 (13.2%) |
| 5 to 9 Year Old | 146 (82.0%) | 32 (18.0%) |
| 10 to 14 Year Olds | 130 (89.0%) | 16 (11.0%) |
| 15 to 17 Year Olds | 139 (100.0%) | 0 (0.0%) |
| 18 to 19 Year Olds | 39 (79.6%) | 10 (20.4%) |
| 20 to 24 Year Olds | 22 (100.0%) | 0 (0.0%) |
| 25 to 34 Year Olds | 9 (100.0%) | 0 (0.0%) |
| 35 Years and over | 16 (76.2%) | 5 (23.8%) |
| Total | 560 (88.6%) | 72 (11.4%) |
Educational Attainment by Field of Study in Halstead
Business (63 | 21.9%), science & technology (54 | 18.8%), education (42 | 14.6%), arts & humanities (29 | 10.1%), and computers & mathematics (18 | 6.2%) are the most common fields of study among 288 individuals in Halstead who have obtained a bachelor's degree or higher.
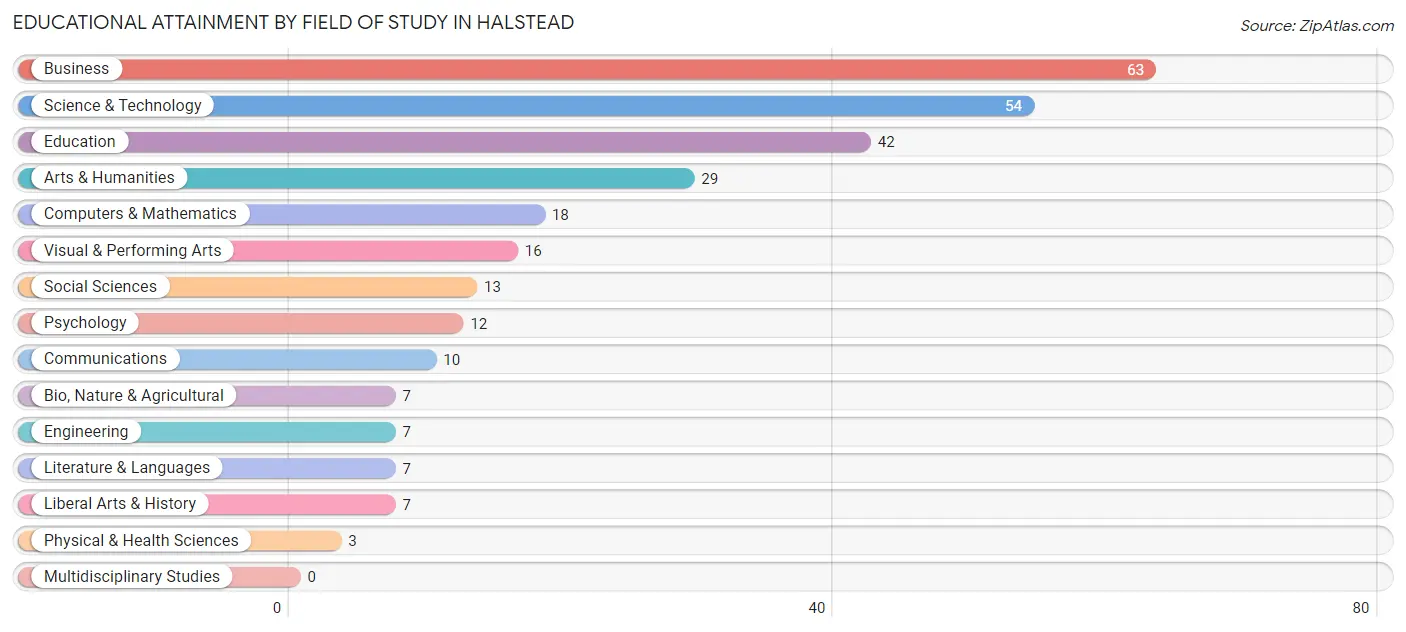
| Field of Study | # Graduates | % Graduates |
| Computers & Mathematics | 18 | 6.2% |
| Bio, Nature & Agricultural | 7 | 2.4% |
| Physical & Health Sciences | 3 | 1.0% |
| Psychology | 12 | 4.2% |
| Social Sciences | 13 | 4.5% |
| Engineering | 7 | 2.4% |
| Multidisciplinary Studies | 0 | 0.0% |
| Science & Technology | 54 | 18.8% |
| Business | 63 | 21.9% |
| Education | 42 | 14.6% |
| Literature & Languages | 7 | 2.4% |
| Liberal Arts & History | 7 | 2.4% |
| Visual & Performing Arts | 16 | 5.6% |
| Communications | 10 | 3.5% |
| Arts & Humanities | 29 | 10.1% |
| Total | 288 | 100.0% |
Transportation & Commute in Halstead
Vehicle Availability by Sex in Halstead
The most prevalent vehicle ownership categories in Halstead are males with 3 vehicles (188, accounting for 41.9%) and females with 3 vehicles (165, making up 34.7%).
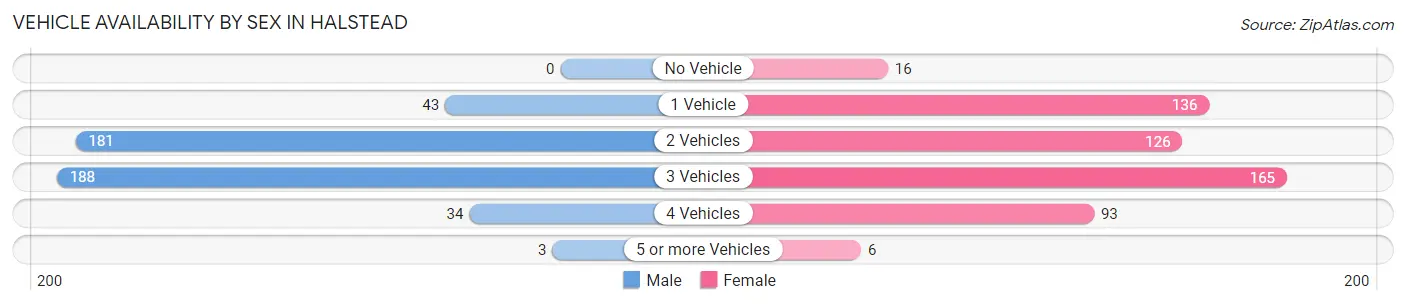
| Vehicles Available | Male | Female |
| No Vehicle | 0 (0.0%) | 16 (2.9%) |
| 1 Vehicle | 43 (9.6%) | 136 (25.1%) |
| 2 Vehicles | 181 (40.3%) | 126 (23.3%) |
| 3 Vehicles | 188 (41.9%) | 165 (30.4%) |
| 4 Vehicles | 34 (7.6%) | 93 (17.2%) |
| 5 or more Vehicles | 3 (0.7%) | 6 (1.1%) |
| Total | 449 (100.0%) | 542 (100.0%) |
Commute Time in Halstead
The most frequently occuring commute durations in Halstead are 5 to 9 minutes (179 commuters, 18.6%), less than 5 minutes (164 commuters, 17.0%), and 20 to 24 minutes (133 commuters, 13.8%).
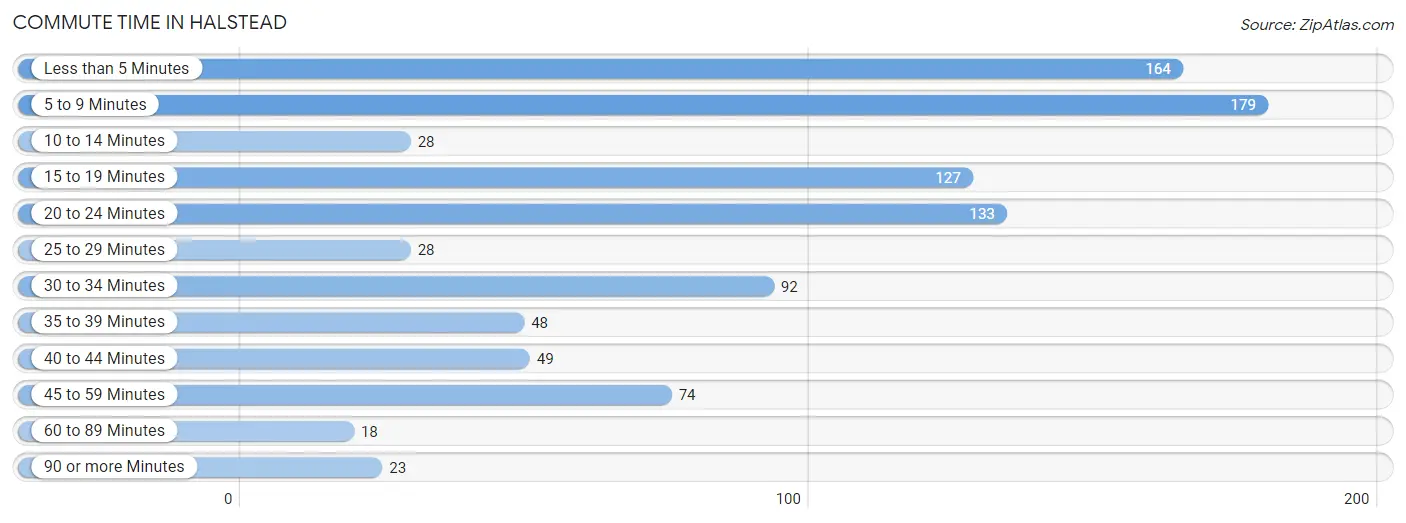
| Commute Time | # Commuters | % Commuters |
| Less than 5 Minutes | 164 | 17.0% |
| 5 to 9 Minutes | 179 | 18.6% |
| 10 to 14 Minutes | 28 | 2.9% |
| 15 to 19 Minutes | 127 | 13.2% |
| 20 to 24 Minutes | 133 | 13.8% |
| 25 to 29 Minutes | 28 | 2.9% |
| 30 to 34 Minutes | 92 | 9.6% |
| 35 to 39 Minutes | 48 | 5.0% |
| 40 to 44 Minutes | 49 | 5.1% |
| 45 to 59 Minutes | 74 | 7.7% |
| 60 to 89 Minutes | 18 | 1.9% |
| 90 or more Minutes | 23 | 2.4% |
Commute Time by Sex in Halstead
The most common commute times in Halstead are 5 to 9 minutes (123 commuters, 27.7%) for males and less than 5 minutes (98 commuters, 18.9%) for females.
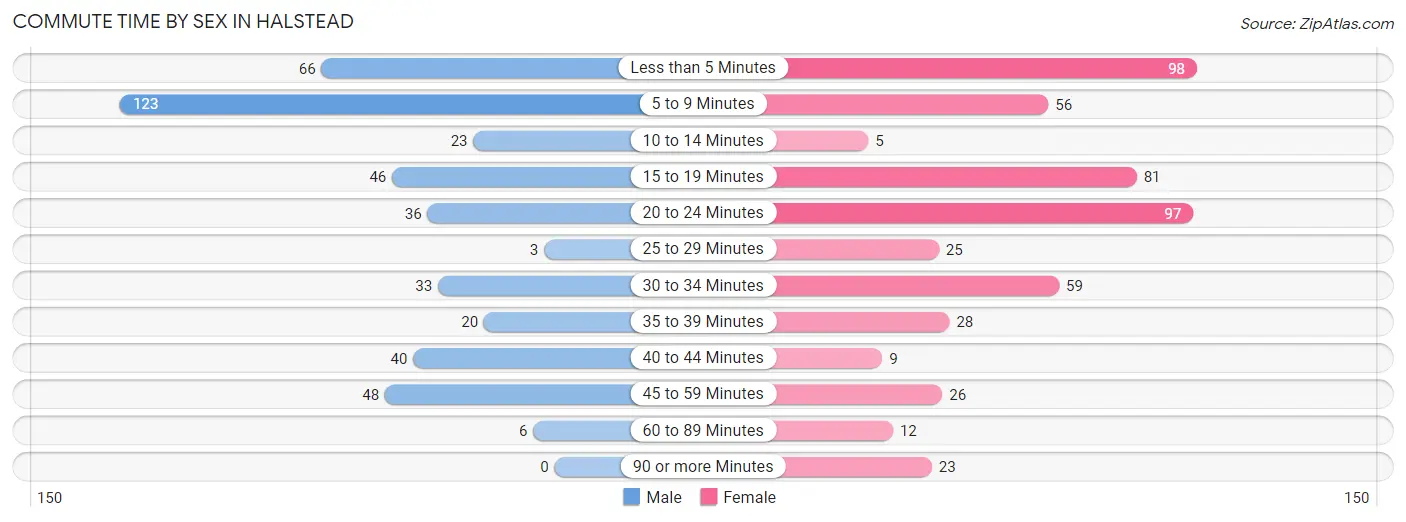
| Commute Time | Male | Female |
| Less than 5 Minutes | 66 (14.9%) | 98 (18.9%) |
| 5 to 9 Minutes | 123 (27.7%) | 56 (10.8%) |
| 10 to 14 Minutes | 23 (5.2%) | 5 (1.0%) |
| 15 to 19 Minutes | 46 (10.4%) | 81 (15.6%) |
| 20 to 24 Minutes | 36 (8.1%) | 97 (18.7%) |
| 25 to 29 Minutes | 3 (0.7%) | 25 (4.8%) |
| 30 to 34 Minutes | 33 (7.4%) | 59 (11.4%) |
| 35 to 39 Minutes | 20 (4.5%) | 28 (5.4%) |
| 40 to 44 Minutes | 40 (9.0%) | 9 (1.7%) |
| 45 to 59 Minutes | 48 (10.8%) | 26 (5.0%) |
| 60 to 89 Minutes | 6 (1.3%) | 12 (2.3%) |
| 90 or more Minutes | 0 (0.0%) | 23 (4.4%) |
Time of Departure to Work by Sex in Halstead
The most frequent times of departure to work in Halstead are 7:00 AM to 7:29 AM (81, 18.2%) for males and 7:00 AM to 7:29 AM (94, 18.1%) for females.
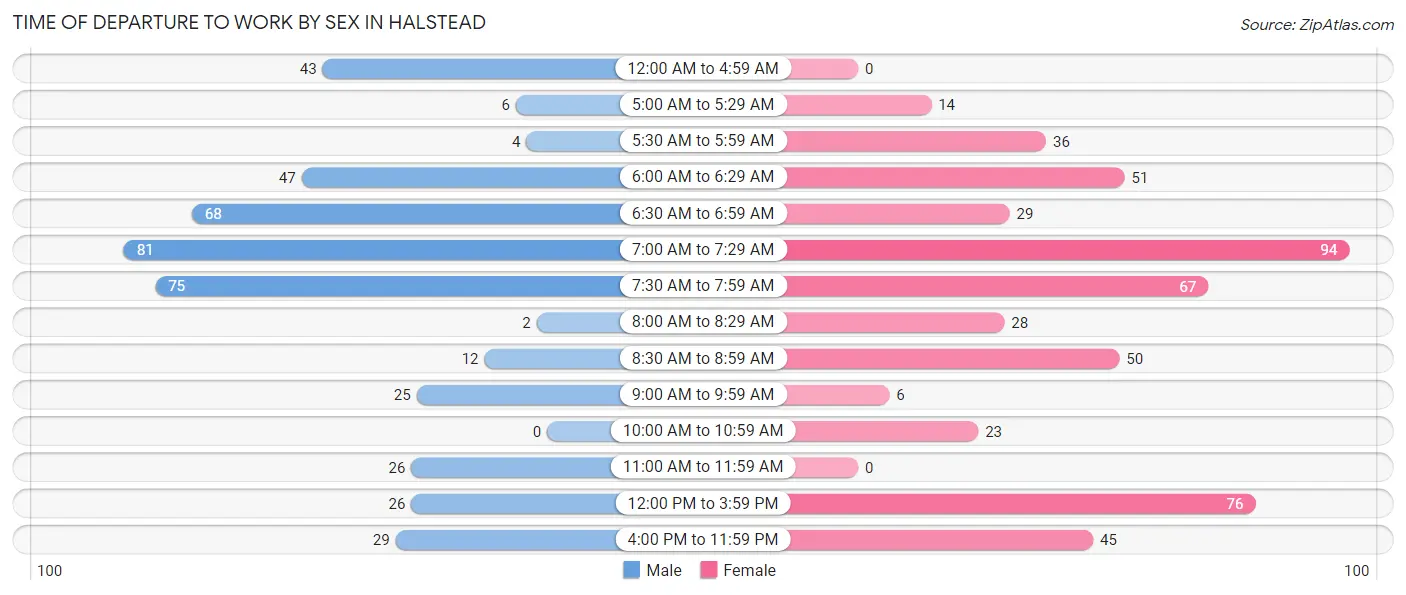
| Time of Departure | Male | Female |
| 12:00 AM to 4:59 AM | 43 (9.7%) | 0 (0.0%) |
| 5:00 AM to 5:29 AM | 6 (1.3%) | 14 (2.7%) |
| 5:30 AM to 5:59 AM | 4 (0.9%) | 36 (6.9%) |
| 6:00 AM to 6:29 AM | 47 (10.6%) | 51 (9.8%) |
| 6:30 AM to 6:59 AM | 68 (15.3%) | 29 (5.6%) |
| 7:00 AM to 7:29 AM | 81 (18.2%) | 94 (18.1%) |
| 7:30 AM to 7:59 AM | 75 (16.9%) | 67 (12.9%) |
| 8:00 AM to 8:29 AM | 2 (0.4%) | 28 (5.4%) |
| 8:30 AM to 8:59 AM | 12 (2.7%) | 50 (9.6%) |
| 9:00 AM to 9:59 AM | 25 (5.6%) | 6 (1.2%) |
| 10:00 AM to 10:59 AM | 0 (0.0%) | 23 (4.4%) |
| 11:00 AM to 11:59 AM | 26 (5.9%) | 0 (0.0%) |
| 12:00 PM to 3:59 PM | 26 (5.9%) | 76 (14.6%) |
| 4:00 PM to 11:59 PM | 29 (6.5%) | 45 (8.7%) |
| Total | 444 (100.0%) | 519 (100.0%) |
Housing Occupancy in Halstead
Occupancy by Ownership in Halstead
Of the total 834 dwellings in Halstead, owner-occupied units account for 596 (71.5%), while renter-occupied units make up 238 (28.5%).
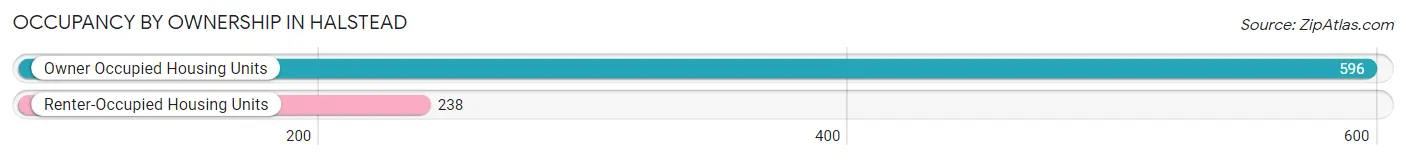
| Occupancy | # Housing Units | % Housing Units |
| Owner Occupied Housing Units | 596 | 71.5% |
| Renter-Occupied Housing Units | 238 | 28.5% |
| Total Occupied Housing Units | 834 | 100.0% |
Occupancy by Household Size in Halstead
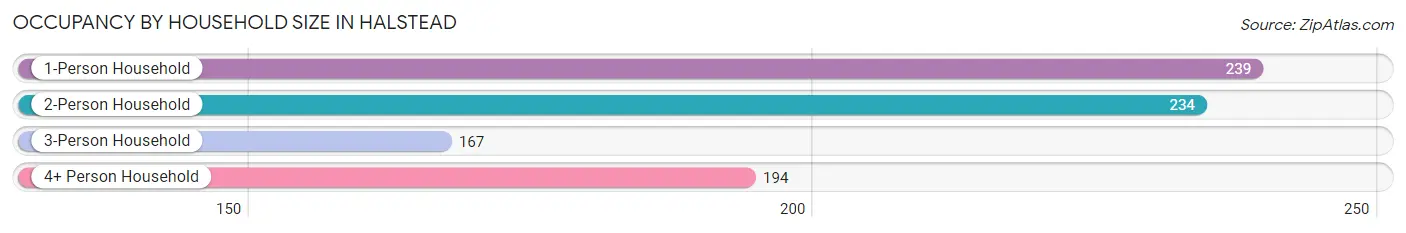
| Household Size | # Housing Units | % Housing Units |
| 1-Person Household | 239 | 28.7% |
| 2-Person Household | 234 | 28.1% |
| 3-Person Household | 167 | 20.0% |
| 4+ Person Household | 194 | 23.3% |
| Total Housing Units | 834 | 100.0% |
Occupancy by Ownership by Household Size in Halstead
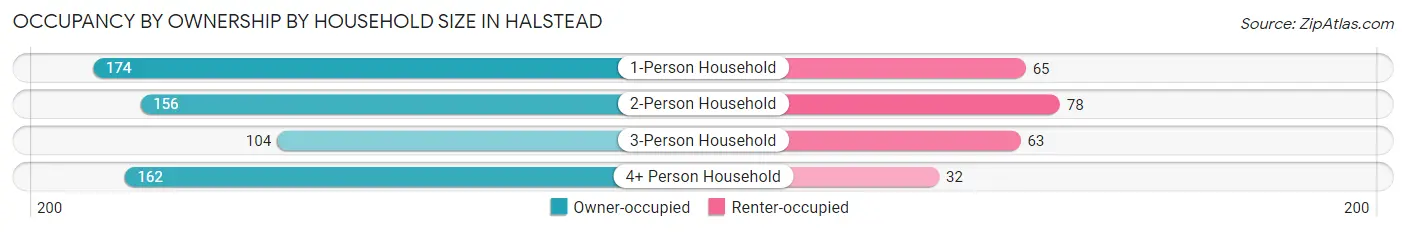
| Household Size | Owner-occupied | Renter-occupied |
| 1-Person Household | 174 (72.8%) | 65 (27.2%) |
| 2-Person Household | 156 (66.7%) | 78 (33.3%) |
| 3-Person Household | 104 (62.3%) | 63 (37.7%) |
| 4+ Person Household | 162 (83.5%) | 32 (16.5%) |
| Total Housing Units | 596 (71.5%) | 238 (28.5%) |
Occupancy by Educational Attainment in Halstead
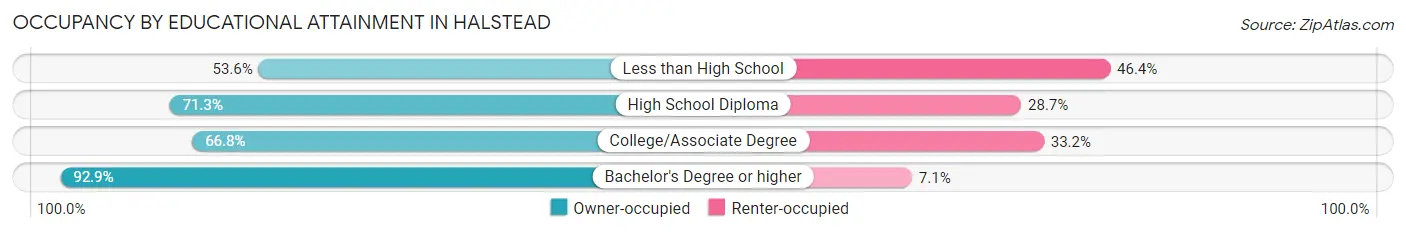
| Household Size | Owner-occupied | Renter-occupied |
| Less than High School | 37 (53.6%) | 32 (46.4%) |
| High School Diploma | 181 (71.3%) | 73 (28.7%) |
| College/Associate Degree | 247 (66.8%) | 123 (33.2%) |
| Bachelor's Degree or higher | 131 (92.9%) | 10 (7.1%) |
Occupancy by Age of Householder in Halstead
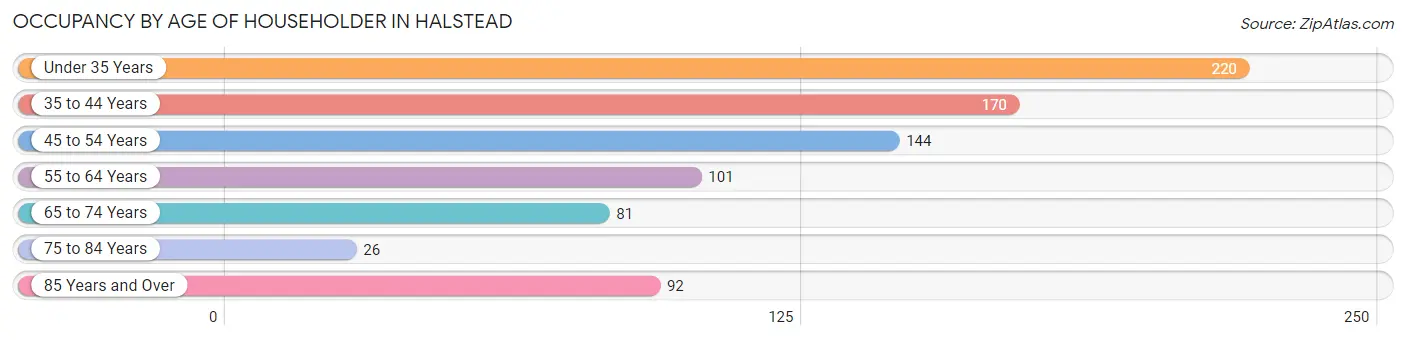
| Age Bracket | # Households | % Households |
| Under 35 Years | 220 | 26.4% |
| 35 to 44 Years | 170 | 20.4% |
| 45 to 54 Years | 144 | 17.3% |
| 55 to 64 Years | 101 | 12.1% |
| 65 to 74 Years | 81 | 9.7% |
| 75 to 84 Years | 26 | 3.1% |
| 85 Years and Over | 92 | 11.0% |
| Total | 834 | 100.0% |
Housing Finances in Halstead
Median Income by Occupancy in Halstead
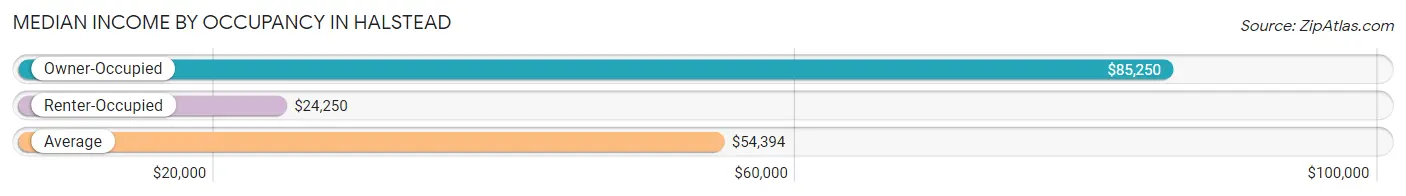
| Occupancy Type | # Households | Median Income |
| Owner-Occupied | 596 (71.5%) | $85,250 |
| Renter-Occupied | 238 (28.5%) | $24,250 |
| Average | 834 (100.0%) | $54,394 |
Occupancy by Householder Income Bracket in Halstead
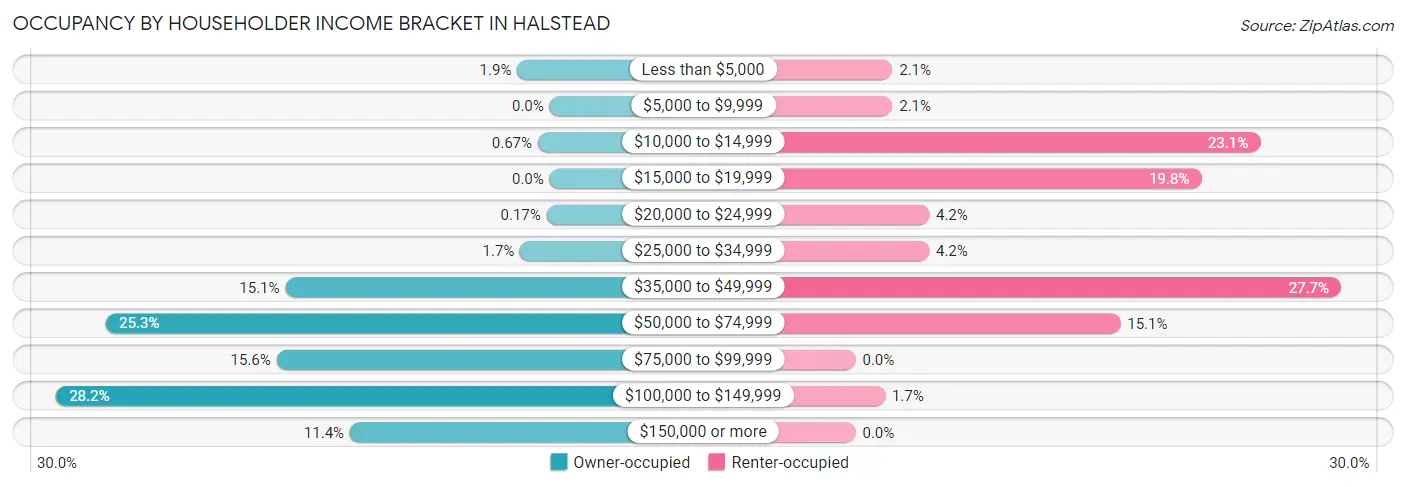
| Income Bracket | Owner-occupied | Renter-occupied |
| Less than $5,000 | 11 (1.8%) | 5 (2.1%) |
| $5,000 to $9,999 | 0 (0.0%) | 5 (2.1%) |
| $10,000 to $14,999 | 4 (0.7%) | 55 (23.1%) |
| $15,000 to $19,999 | 0 (0.0%) | 47 (19.8%) |
| $20,000 to $24,999 | 1 (0.2%) | 10 (4.2%) |
| $25,000 to $34,999 | 10 (1.7%) | 10 (4.2%) |
| $35,000 to $49,999 | 90 (15.1%) | 66 (27.7%) |
| $50,000 to $74,999 | 151 (25.3%) | 36 (15.1%) |
| $75,000 to $99,999 | 93 (15.6%) | 0 (0.0%) |
| $100,000 to $149,999 | 168 (28.2%) | 4 (1.7%) |
| $150,000 or more | 68 (11.4%) | 0 (0.0%) |
| Total | 596 (100.0%) | 238 (100.0%) |
Monthly Housing Cost Tiers in Halstead
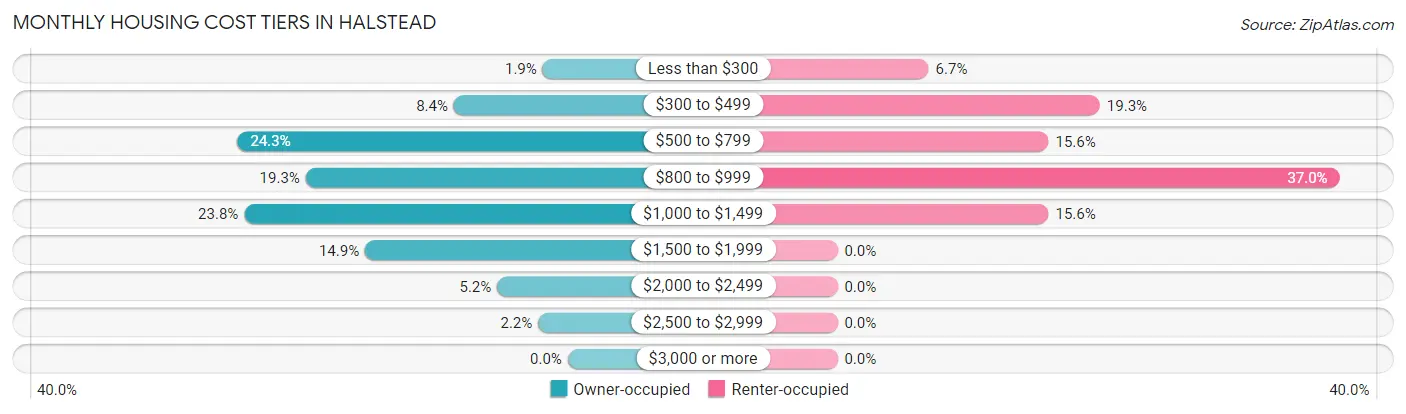
| Monthly Cost | Owner-occupied | Renter-occupied |
| Less than $300 | 11 (1.8%) | 16 (6.7%) |
| $300 to $499 | 50 (8.4%) | 46 (19.3%) |
| $500 to $799 | 145 (24.3%) | 37 (15.5%) |
| $800 to $999 | 115 (19.3%) | 88 (37.0%) |
| $1,000 to $1,499 | 142 (23.8%) | 37 (15.5%) |
| $1,500 to $1,999 | 89 (14.9%) | 0 (0.0%) |
| $2,000 to $2,499 | 31 (5.2%) | 0 (0.0%) |
| $2,500 to $2,999 | 13 (2.2%) | 0 (0.0%) |
| $3,000 or more | 0 (0.0%) | 0 (0.0%) |
| Total | 596 (100.0%) | 238 (100.0%) |
Physical Housing Characteristics in Halstead
Housing Structures in Halstead
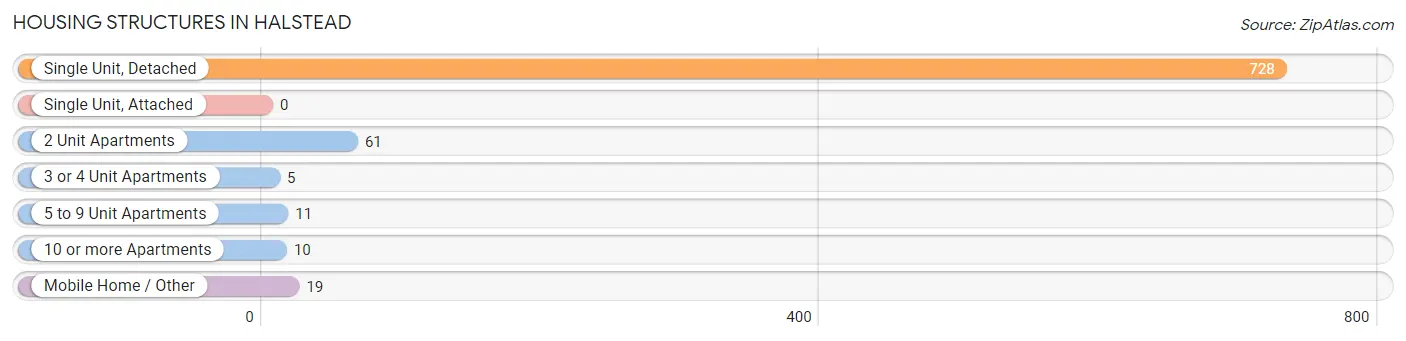
| Structure Type | # Housing Units | % Housing Units |
| Single Unit, Detached | 728 | 87.3% |
| Single Unit, Attached | 0 | 0.0% |
| 2 Unit Apartments | 61 | 7.3% |
| 3 or 4 Unit Apartments | 5 | 0.6% |
| 5 to 9 Unit Apartments | 11 | 1.3% |
| 10 or more Apartments | 10 | 1.2% |
| Mobile Home / Other | 19 | 2.3% |
| Total | 834 | 100.0% |
Housing Structures by Occupancy in Halstead
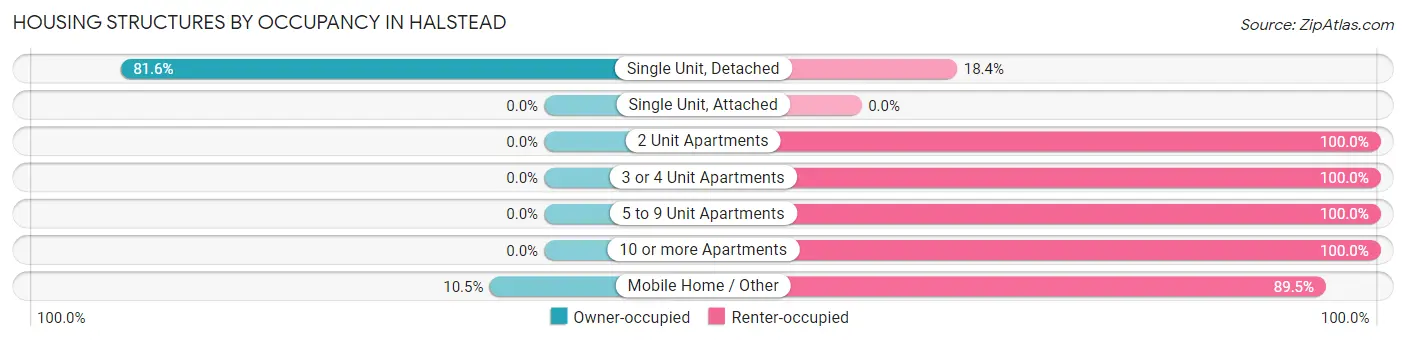
| Structure Type | Owner-occupied | Renter-occupied |
| Single Unit, Detached | 594 (81.6%) | 134 (18.4%) |
| Single Unit, Attached | 0 (0.0%) | 0 (0.0%) |
| 2 Unit Apartments | 0 (0.0%) | 61 (100.0%) |
| 3 or 4 Unit Apartments | 0 (0.0%) | 5 (100.0%) |
| 5 to 9 Unit Apartments | 0 (0.0%) | 11 (100.0%) |
| 10 or more Apartments | 0 (0.0%) | 10 (100.0%) |
| Mobile Home / Other | 2 (10.5%) | 17 (89.5%) |
| Total | 596 (71.5%) | 238 (28.5%) |
Housing Structures by Number of Rooms in Halstead
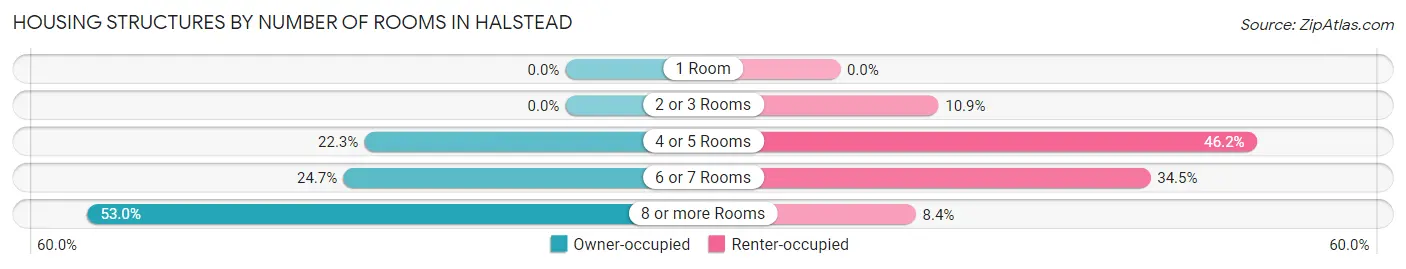
| Number of Rooms | Owner-occupied | Renter-occupied |
| 1 Room | 0 (0.0%) | 0 (0.0%) |
| 2 or 3 Rooms | 0 (0.0%) | 26 (10.9%) |
| 4 or 5 Rooms | 133 (22.3%) | 110 (46.2%) |
| 6 or 7 Rooms | 147 (24.7%) | 82 (34.4%) |
| 8 or more Rooms | 316 (53.0%) | 20 (8.4%) |
| Total | 596 (100.0%) | 238 (100.0%) |
Housing Structure by Heating Type in Halstead
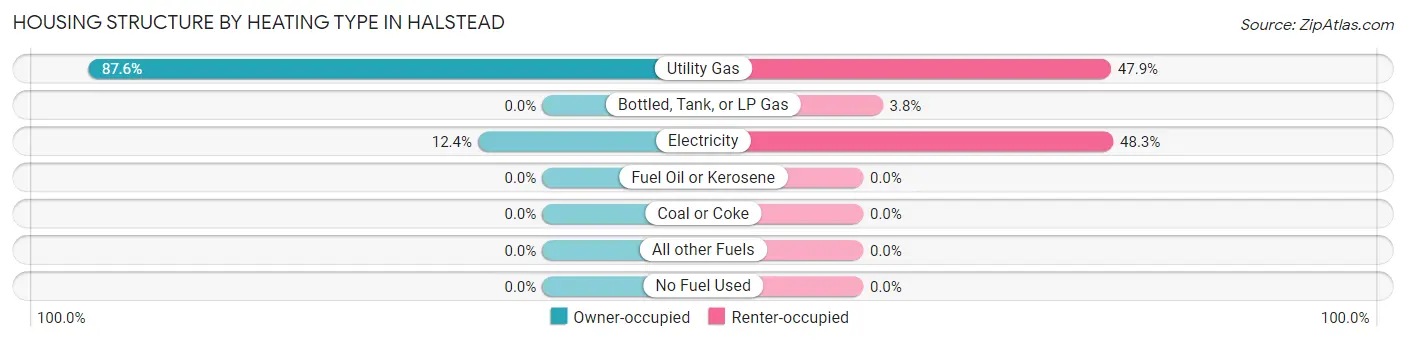
| Heating Type | Owner-occupied | Renter-occupied |
| Utility Gas | 522 (87.6%) | 114 (47.9%) |
| Bottled, Tank, or LP Gas | 0 (0.0%) | 9 (3.8%) |
| Electricity | 74 (12.4%) | 115 (48.3%) |
| Fuel Oil or Kerosene | 0 (0.0%) | 0 (0.0%) |
| Coal or Coke | 0 (0.0%) | 0 (0.0%) |
| All other Fuels | 0 (0.0%) | 0 (0.0%) |
| No Fuel Used | 0 (0.0%) | 0 (0.0%) |
| Total | 596 (100.0%) | 238 (100.0%) |
Household Vehicle Usage in Halstead
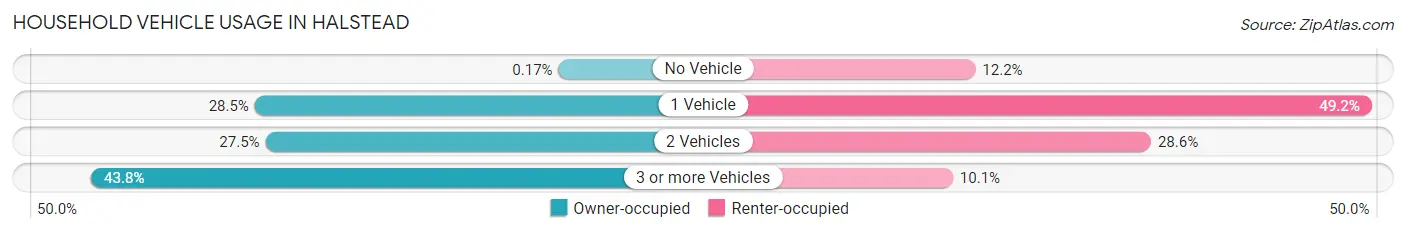
| Vehicles per Household | Owner-occupied | Renter-occupied |
| No Vehicle | 1 (0.2%) | 29 (12.2%) |
| 1 Vehicle | 170 (28.5%) | 117 (49.2%) |
| 2 Vehicles | 164 (27.5%) | 68 (28.6%) |
| 3 or more Vehicles | 261 (43.8%) | 24 (10.1%) |
| Total | 596 (100.0%) | 238 (100.0%) |
Real Estate & Mortgages in Halstead
Real Estate and Mortgage Overview in Halstead
| Characteristic | Without Mortgage | With Mortgage |
| Housing Units | 211 | 385 |
| Median Property Value | $137,200 | $144,500 |
| Median Household Income | $52,035 | $59 |
| Monthly Housing Costs | $703 | $0 |
| Real Estate Taxes | $2,608 | $51 |
Property Value by Mortgage Status in Halstead
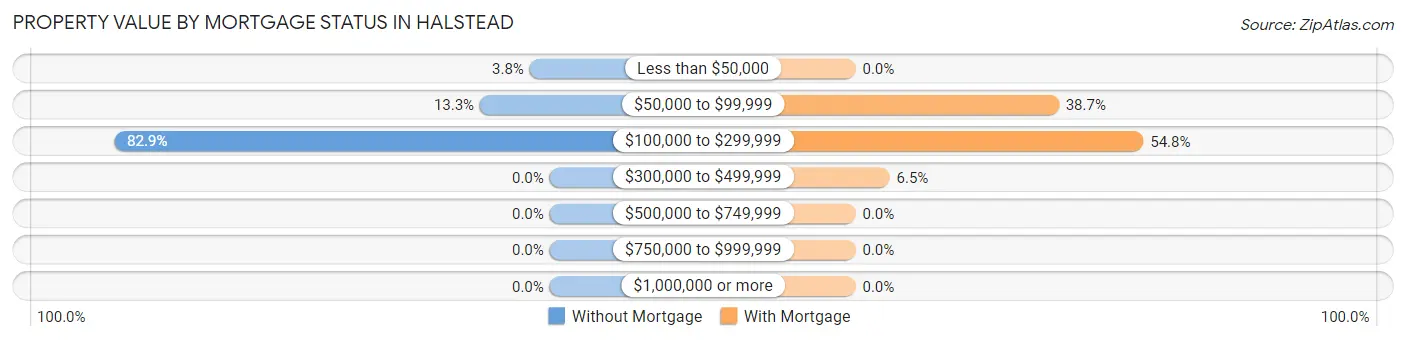
| Property Value | Without Mortgage | With Mortgage |
| Less than $50,000 | 8 (3.8%) | 0 (0.0%) |
| $50,000 to $99,999 | 28 (13.3%) | 149 (38.7%) |
| $100,000 to $299,999 | 175 (82.9%) | 211 (54.8%) |
| $300,000 to $499,999 | 0 (0.0%) | 25 (6.5%) |
| $500,000 to $749,999 | 0 (0.0%) | 0 (0.0%) |
| $750,000 to $999,999 | 0 (0.0%) | 0 (0.0%) |
| $1,000,000 or more | 0 (0.0%) | 0 (0.0%) |
| Total | 211 (100.0%) | 385 (100.0%) |
Household Income by Mortgage Status in Halstead
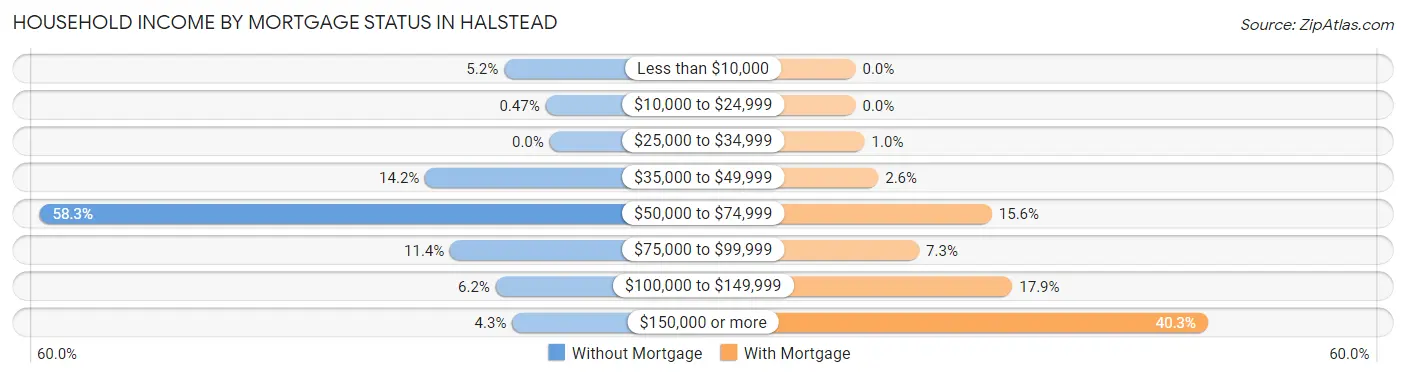
| Household Income | Without Mortgage | With Mortgage |
| Less than $10,000 | 11 (5.2%) | 0 (0.0%) |
| $10,000 to $24,999 | 1 (0.5%) | 0 (0.0%) |
| $25,000 to $34,999 | 0 (0.0%) | 4 (1.0%) |
| $35,000 to $49,999 | 30 (14.2%) | 10 (2.6%) |
| $50,000 to $74,999 | 123 (58.3%) | 60 (15.6%) |
| $75,000 to $99,999 | 24 (11.4%) | 28 (7.3%) |
| $100,000 to $149,999 | 13 (6.2%) | 69 (17.9%) |
| $150,000 or more | 9 (4.3%) | 155 (40.3%) |
| Total | 211 (100.0%) | 385 (100.0%) |
Property Value to Household Income Ratio in Halstead
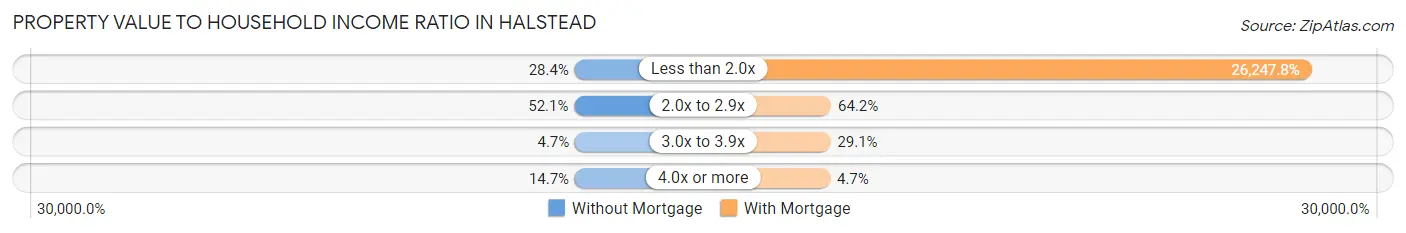
| Value-to-Income Ratio | Without Mortgage | With Mortgage |
| Less than 2.0x | 60 (28.4%) | 101,054 (26,247.8%) |
| 2.0x to 2.9x | 110 (52.1%) | 247 (64.2%) |
| 3.0x to 3.9x | 10 (4.7%) | 112 (29.1%) |
| 4.0x or more | 31 (14.7%) | 18 (4.7%) |
| Total | 211 (100.0%) | 385 (100.0%) |
Real Estate Taxes by Mortgage Status in Halstead
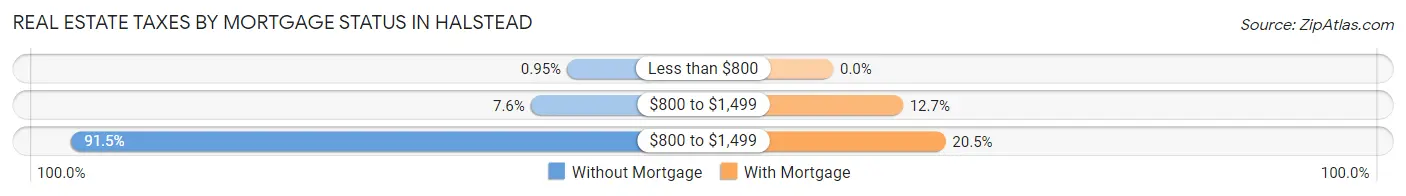
| Property Taxes | Without Mortgage | With Mortgage |
| Less than $800 | 2 (0.9%) | 0 (0.0%) |
| $800 to $1,499 | 16 (7.6%) | 49 (12.7%) |
| $800 to $1,499 | 193 (91.5%) | 79 (20.5%) |
| Total | 211 (100.0%) | 385 (100.0%) |
Health & Disability in Halstead
Health Insurance Coverage by Age in Halstead
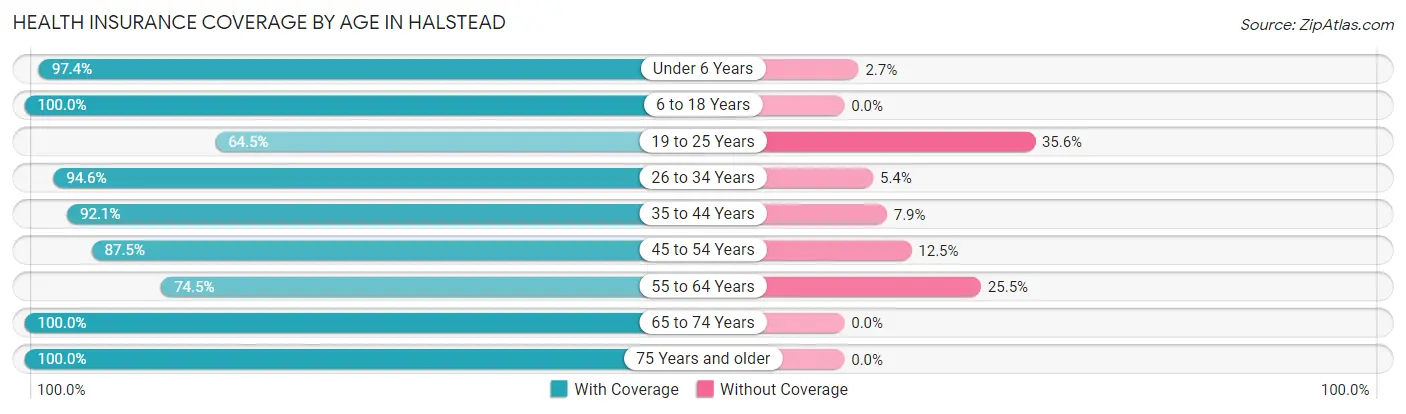
| Age Bracket | With Coverage | Without Coverage |
| Under 6 Years | 220 (97.4%) | 6 (2.6%) |
| 6 to 18 Years | 408 (100.0%) | 0 (0.0%) |
| 19 to 25 Years | 136 (64.4%) | 75 (35.5%) |
| 26 to 34 Years | 247 (94.6%) | 14 (5.4%) |
| 35 to 44 Years | 244 (92.1%) | 21 (7.9%) |
| 45 to 54 Years | 196 (87.5%) | 28 (12.5%) |
| 55 to 64 Years | 155 (74.5%) | 53 (25.5%) |
| 65 to 74 Years | 224 (100.0%) | 0 (0.0%) |
| 75 Years and older | 141 (100.0%) | 0 (0.0%) |
| Total | 1,971 (90.9%) | 197 (9.1%) |
Health Insurance Coverage by Citizenship Status in Halstead
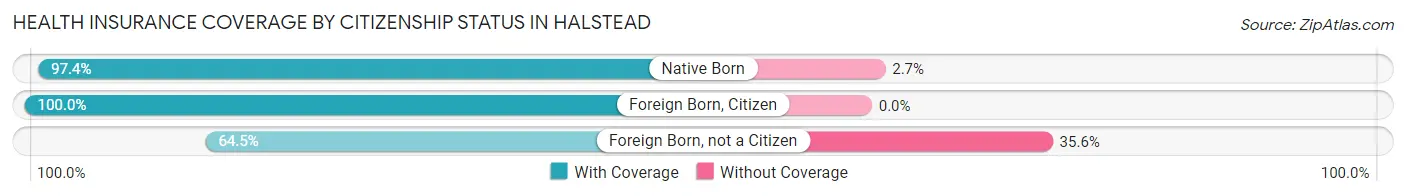
| Citizenship Status | With Coverage | Without Coverage |
| Native Born | 220 (97.4%) | 6 (2.6%) |
| Foreign Born, Citizen | 408 (100.0%) | 0 (0.0%) |
| Foreign Born, not a Citizen | 136 (64.4%) | 75 (35.5%) |
Health Insurance Coverage by Household Income in Halstead
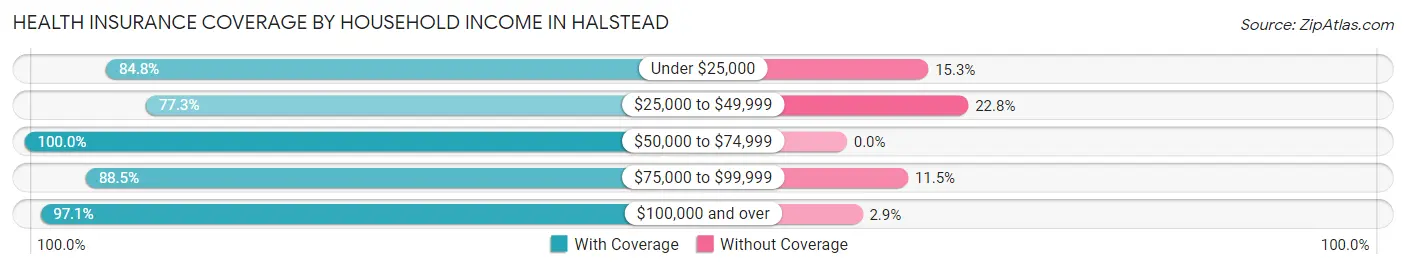
| Household Income | With Coverage | Without Coverage |
| Under $25,000 | 250 (84.8%) | 45 (15.2%) |
| $25,000 to $49,999 | 326 (77.2%) | 96 (22.8%) |
| $50,000 to $74,999 | 369 (100.0%) | 0 (0.0%) |
| $75,000 to $99,999 | 255 (88.5%) | 33 (11.5%) |
| $100,000 and over | 760 (97.1%) | 23 (2.9%) |
Public vs Private Health Insurance Coverage by Age in Halstead
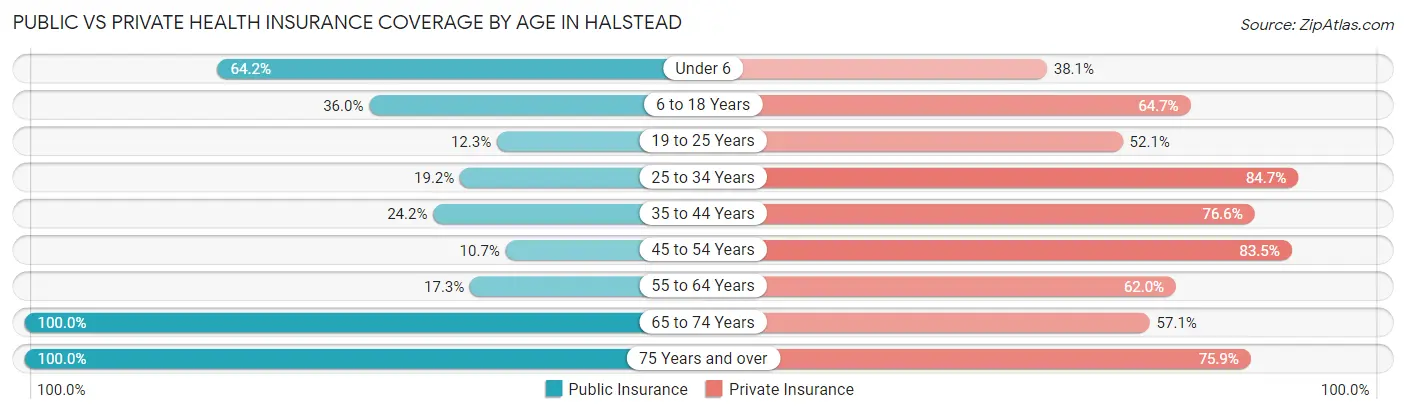
| Age Bracket | Public Insurance | Private Insurance |
| Under 6 | 145 (64.2%) | 86 (38.1%) |
| 6 to 18 Years | 147 (36.0%) | 264 (64.7%) |
| 19 to 25 Years | 26 (12.3%) | 110 (52.1%) |
| 25 to 34 Years | 50 (19.2%) | 221 (84.7%) |
| 35 to 44 Years | 64 (24.1%) | 203 (76.6%) |
| 45 to 54 Years | 24 (10.7%) | 187 (83.5%) |
| 55 to 64 Years | 36 (17.3%) | 129 (62.0%) |
| 65 to 74 Years | 224 (100.0%) | 128 (57.1%) |
| 75 Years and over | 141 (100.0%) | 107 (75.9%) |
| Total | 857 (39.5%) | 1,435 (66.2%) |
Disability Status by Sex by Age in Halstead
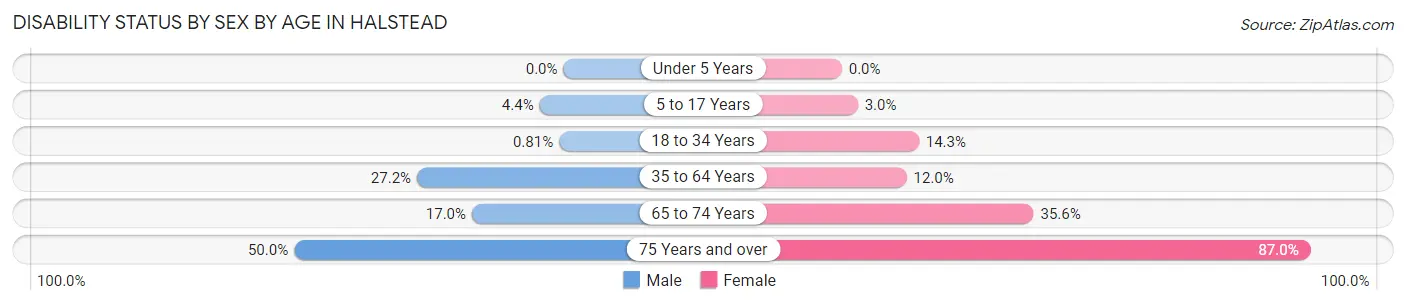
| Age Bracket | Male | Female |
| Under 5 Years | 0 (0.0%) | 0 (0.0%) |
| 5 to 17 Years | 7 (4.4%) | 9 (2.9%) |
| 18 to 34 Years | 2 (0.8%) | 34 (14.3%) |
| 35 to 64 Years | 81 (27.2%) | 48 (12.0%) |
| 65 to 74 Years | 18 (17.0%) | 42 (35.6%) |
| 75 Years and over | 9 (50.0%) | 107 (87.0%) |
Disability Class by Sex by Age in Halstead
Disability Class: Hearing Difficulty
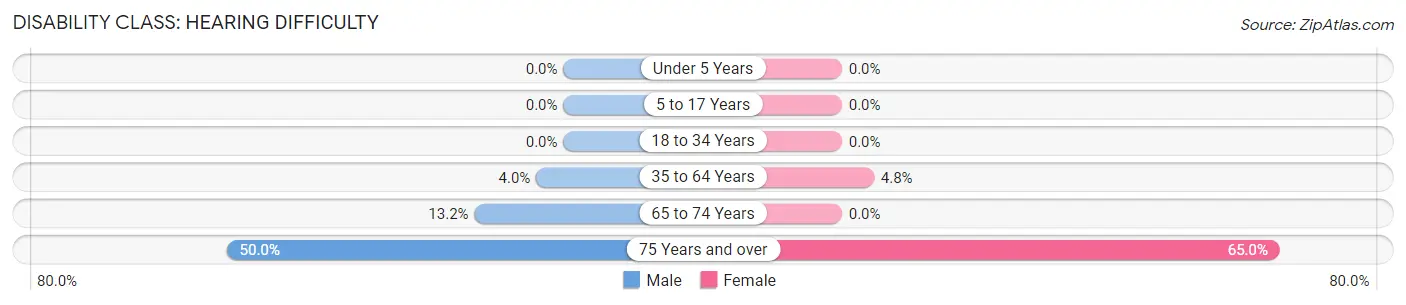
| Age Bracket | Male | Female |
| Under 5 Years | 0 (0.0%) | 0 (0.0%) |
| 5 to 17 Years | 0 (0.0%) | 0 (0.0%) |
| 18 to 34 Years | 0 (0.0%) | 0 (0.0%) |
| 35 to 64 Years | 12 (4.0%) | 19 (4.8%) |
| 65 to 74 Years | 14 (13.2%) | 0 (0.0%) |
| 75 Years and over | 9 (50.0%) | 80 (65.0%) |
Disability Class: Vision Difficulty
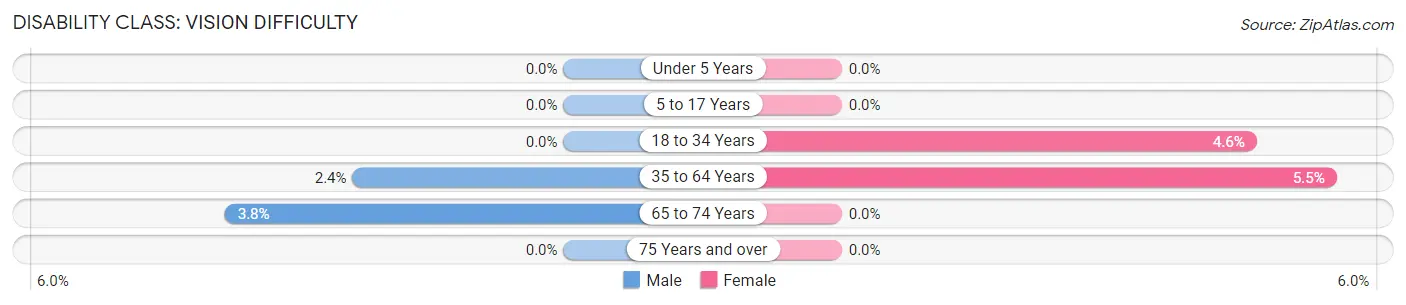
| Age Bracket | Male | Female |
| Under 5 Years | 0 (0.0%) | 0 (0.0%) |
| 5 to 17 Years | 0 (0.0%) | 0 (0.0%) |
| 18 to 34 Years | 0 (0.0%) | 11 (4.6%) |
| 35 to 64 Years | 7 (2.4%) | 22 (5.5%) |
| 65 to 74 Years | 4 (3.8%) | 0 (0.0%) |
| 75 Years and over | 0 (0.0%) | 0 (0.0%) |
Disability Class: Cognitive Difficulty
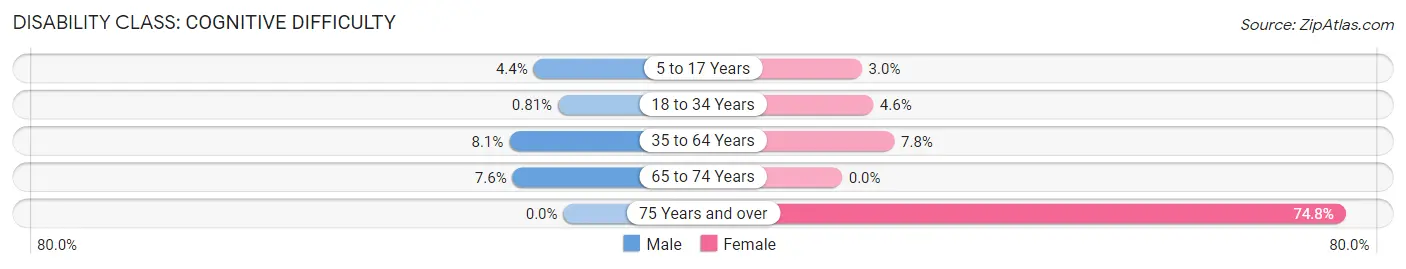
| Age Bracket | Male | Female |
| 5 to 17 Years | 7 (4.4%) | 9 (2.9%) |
| 18 to 34 Years | 2 (0.8%) | 11 (4.6%) |
| 35 to 64 Years | 24 (8.1%) | 31 (7.8%) |
| 65 to 74 Years | 8 (7.5%) | 0 (0.0%) |
| 75 Years and over | 0 (0.0%) | 92 (74.8%) |
Disability Class: Ambulatory Difficulty
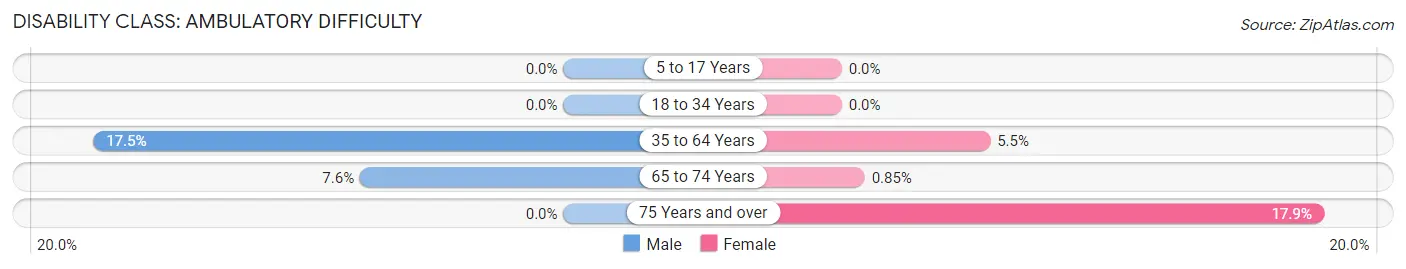
| Age Bracket | Male | Female |
| 5 to 17 Years | 0 (0.0%) | 0 (0.0%) |
| 18 to 34 Years | 0 (0.0%) | 0 (0.0%) |
| 35 to 64 Years | 52 (17.4%) | 22 (5.5%) |
| 65 to 74 Years | 8 (7.5%) | 1 (0.9%) |
| 75 Years and over | 0 (0.0%) | 22 (17.9%) |
Disability Class: Self-Care Difficulty
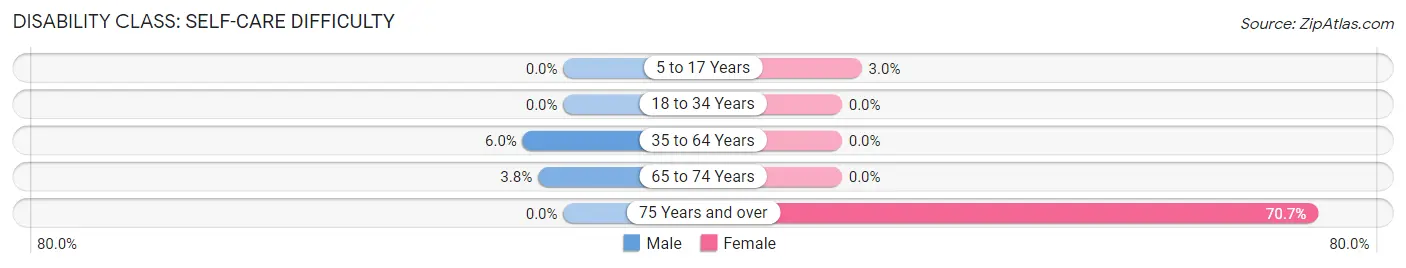
| Age Bracket | Male | Female |
| 5 to 17 Years | 0 (0.0%) | 9 (2.9%) |
| 18 to 34 Years | 0 (0.0%) | 0 (0.0%) |
| 35 to 64 Years | 18 (6.0%) | 0 (0.0%) |
| 65 to 74 Years | 4 (3.8%) | 0 (0.0%) |
| 75 Years and over | 0 (0.0%) | 87 (70.7%) |
Technology Access in Halstead
Computing Device Access in Halstead
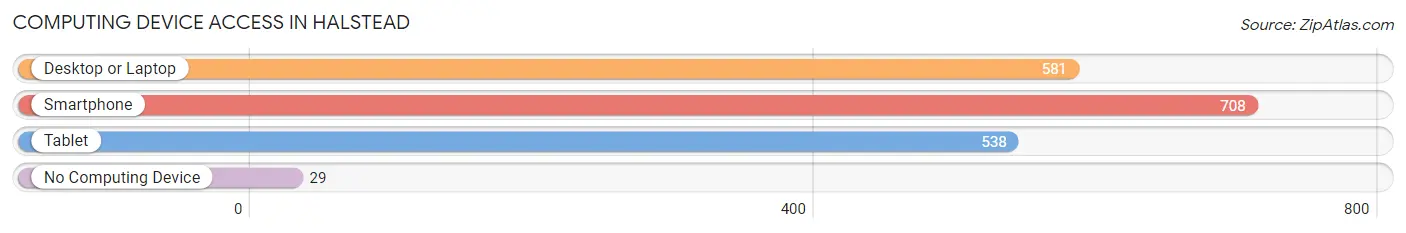
| Device Type | # Households | % Households |
| Desktop or Laptop | 581 | 69.7% |
| Smartphone | 708 | 84.9% |
| Tablet | 538 | 64.5% |
| No Computing Device | 29 | 3.5% |
| Total | 834 | 100.0% |
Internet Access in Halstead
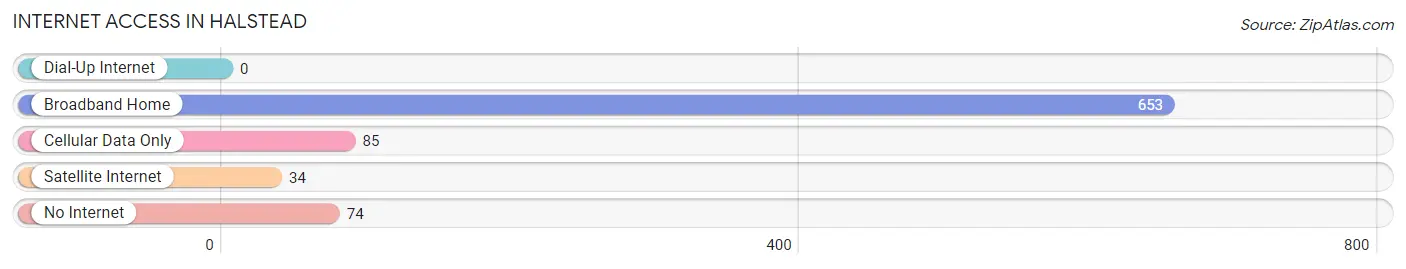
| Internet Type | # Households | % Households |
| Dial-Up Internet | 0 | 0.0% |
| Broadband Home | 653 | 78.3% |
| Cellular Data Only | 85 | 10.2% |
| Satellite Internet | 34 | 4.1% |
| No Internet | 74 | 8.9% |
| Total | 834 | 100.0% |
Halstead Summary
Halstead, Kansas is a small town located in Harvey County, Kansas. It is situated in the south-central part of the state, approximately 30 miles north of Wichita. The town was founded in 1871 and was named after the Halstead family, who were early settlers in the area. As of the 2010 census, the population of Halstead was 1,814.
Geography
Halstead is located at 37°37'N 97°37'W (37.6167, -97.6167). It is situated in the south-central part of the state, approximately 30 miles north of Wichita. The town is located in the Arkansas River Valley, which is part of the Great Plains region. The terrain is mostly flat, with some rolling hills in the area. The climate is semi-arid, with hot summers and cold winters.
Economy
The economy of Halstead is largely based on agriculture. The town is home to several grain elevators, as well as a number of small businesses. The town is also home to a number of manufacturing companies, including a plastics plant and a metal fabrication plant. The town is also home to a number of retail stores, including a grocery store, a hardware store, and a variety of other shops.
Demographics
As of the 2010 census, the population of Halstead was 1,814. The racial makeup of the town was 95.2% White, 0.7% African American, 0.3% Native American, 0.3% Asian, 0.1% Pacific Islander, 1.3% from other races, and 2.3% from two or more races. Hispanic or Latino of any race were 4.2% of the population.
The median income for a household in Halstead was $41,250, and the median income for a family was $48,750. The per capita income for the town was $19,945. About 8.2% of families and 10.2% of the population were below the poverty line, including 14.2% of those under age 18 and 8.3% of those age 65 or over.
History
Halstead was founded in 1871 by the Halstead family, who were early settlers in the area. The town was originally known as Halsteadville, but the name was changed to Halstead in 1873. The town was incorporated in 1887.
In the early 1900s, Halstead was a thriving agricultural community. The town was home to several grain elevators, as well as a number of small businesses. The town was also home to a number of manufacturing companies, including a plastics plant and a metal fabrication plant.
In the late 20th century, Halstead experienced a period of decline. Many of the town's businesses closed, and the population began to decline. However, in recent years, the town has seen a resurgence in population and economic activity. The town is now home to a number of small businesses, as well as a number of retail stores.
Common Questions
What is Per Capita Income in Halstead?
Per Capita income in Halstead is $28,456.
What is the Median Family Income in Halstead?
Median Family Income in Halstead is $85,703.
What is the Median Household income in Halstead?
Median Household Income in Halstead is $54,394.
What is Income or Wage Gap in Halstead?
Income or Wage Gap in Halstead is 28.2%.
Women in Halstead earn 71.8 cents for every dollar earned by a man.
What is Inequality or Gini Index in Halstead?
Inequality or Gini Index in Halstead is 0.36.
What is the Total Population of Halstead?
Total Population of Halstead is 2,243.
What is the Total Male Population of Halstead?
Total Male Population of Halstead is 936.
What is the Total Female Population of Halstead?
Total Female Population of Halstead is 1,307.
What is the Ratio of Males per 100 Females in Halstead?
There are 71.61 Males per 100 Females in Halstead.
What is the Ratio of Females per 100 Males in Halstead?
There are 139.64 Females per 100 Males in Halstead.
What is the Median Population Age in Halstead?
Median Population Age in Halstead is 35.3 Years.
What is the Average Family Size in Halstead
Average Family Size in Halstead is 3.2 People.
What is the Average Household Size in Halstead
Average Household Size in Halstead is 2.6 People.
How Large is the Labor Force in Halstead?
There are 1,014 People in the Labor Forcein in Halstead.
What is the Percentage of People in the Labor Force in Halstead?
59.7% of People are in the Labor Force in Halstead.
What is the Unemployment Rate in Halstead?
Unemployment Rate in Halstead is 0.4%.