Gridley, KS Map & Demographics
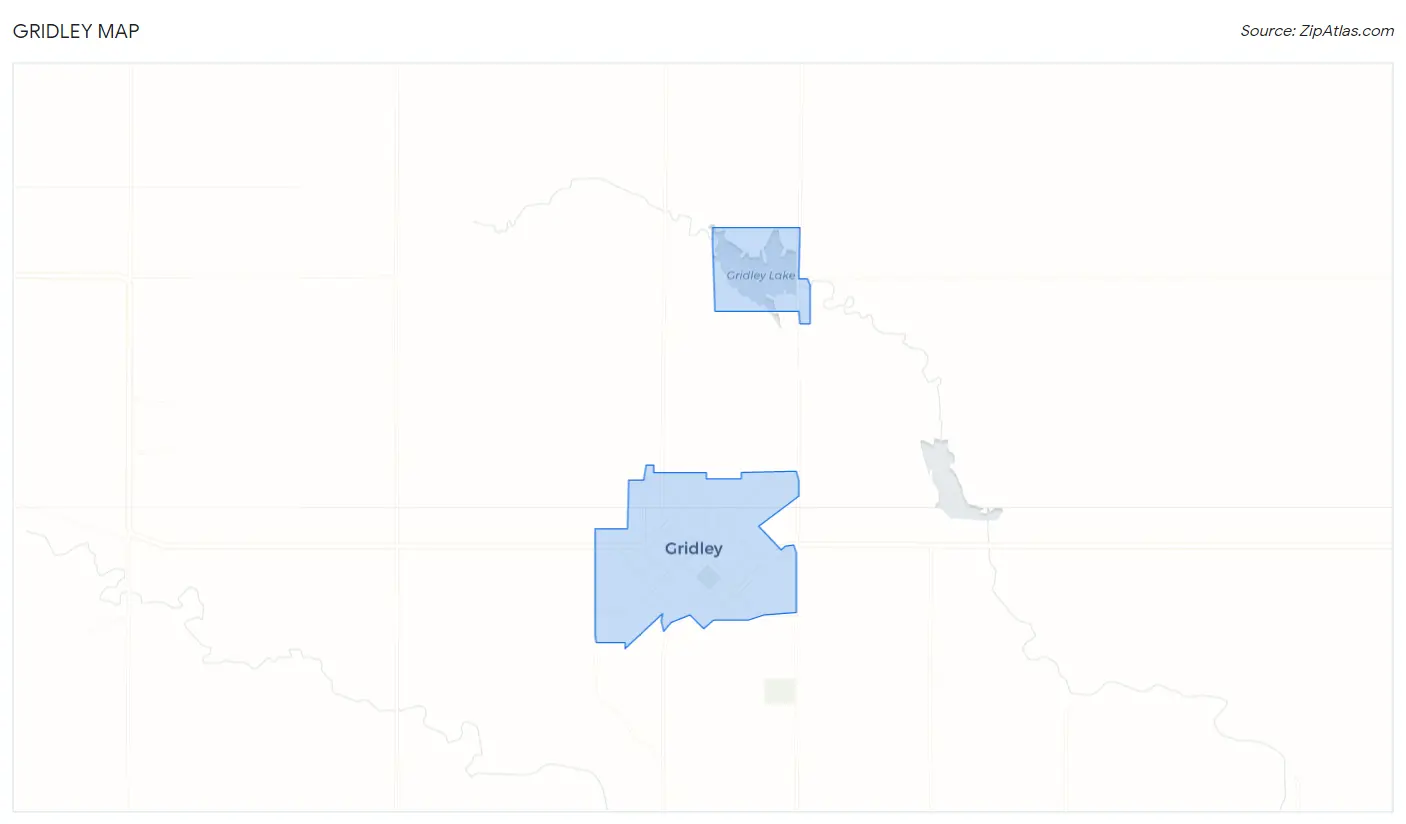
Gridley Map
Gridley Overview
$28,456
PER CAPITA INCOME
$71,250
AVG FAMILY INCOME
$55,865
AVG HOUSEHOLD INCOME
41.4%
WAGE / INCOME GAP [ % ]
58.6¢/ $1
WAGE / INCOME GAP [ $ ]
0.33
INEQUALITY / GINI INDEX
432
TOTAL POPULATION
191
MALE POPULATION
241
FEMALE POPULATION
79.25
MALES / 100 FEMALES
126.18
FEMALES / 100 MALES
38.0
MEDIAN AGE
2.9
AVG FAMILY SIZE
2.1
AVG HOUSEHOLD SIZE
217
LABOR FORCE [ PEOPLE ]
64.6%
PERCENT IN LABOR FORCE
0.9%
UNEMPLOYMENT RATE
Gridley Zip Codes
Gridley Area Codes
Income in Gridley
Income Overview in Gridley
Per Capita Income in Gridley is $28,456, while median incomes of families and households are $71,250 and $55,865 respectively.
| Characteristic | Number | Measure |
| Per Capita Income | 432 | $28,456 |
| Median Family Income | 104 | $71,250 |
| Mean Family Income | 104 | $73,854 |
| Median Household Income | 203 | $55,865 |
| Mean Household Income | 203 | $61,903 |
| Income Deficit | 104 | $0 |
| Wage / Income Gap (%) | 432 | 41.39% |
| Wage / Income Gap ($) | 432 | 58.61¢ per $1 |
| Gini / Inequality Index | 432 | 0.33 |
Earnings by Sex in Gridley
Average Earnings in Gridley are $26,875, $38,125 for men and $22,344 for women, a difference of 41.4%.
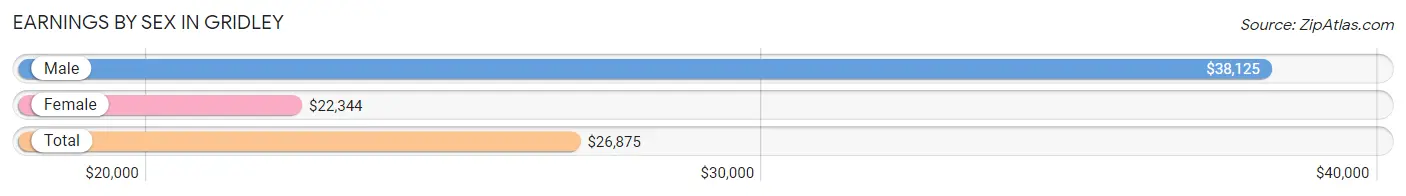
| Sex | Number | Average Earnings |
| Male | 115 (49.1%) | $38,125 |
| Female | 119 (50.8%) | $22,344 |
| Total | 234 (100.0%) | $26,875 |
Earnings by Sex by Income Bracket in Gridley
The most common earnings brackets in Gridley are $25,000 to $29,999 for men (17 | 14.8%) and $30,000 to $34,999 for women (20 | 16.8%).
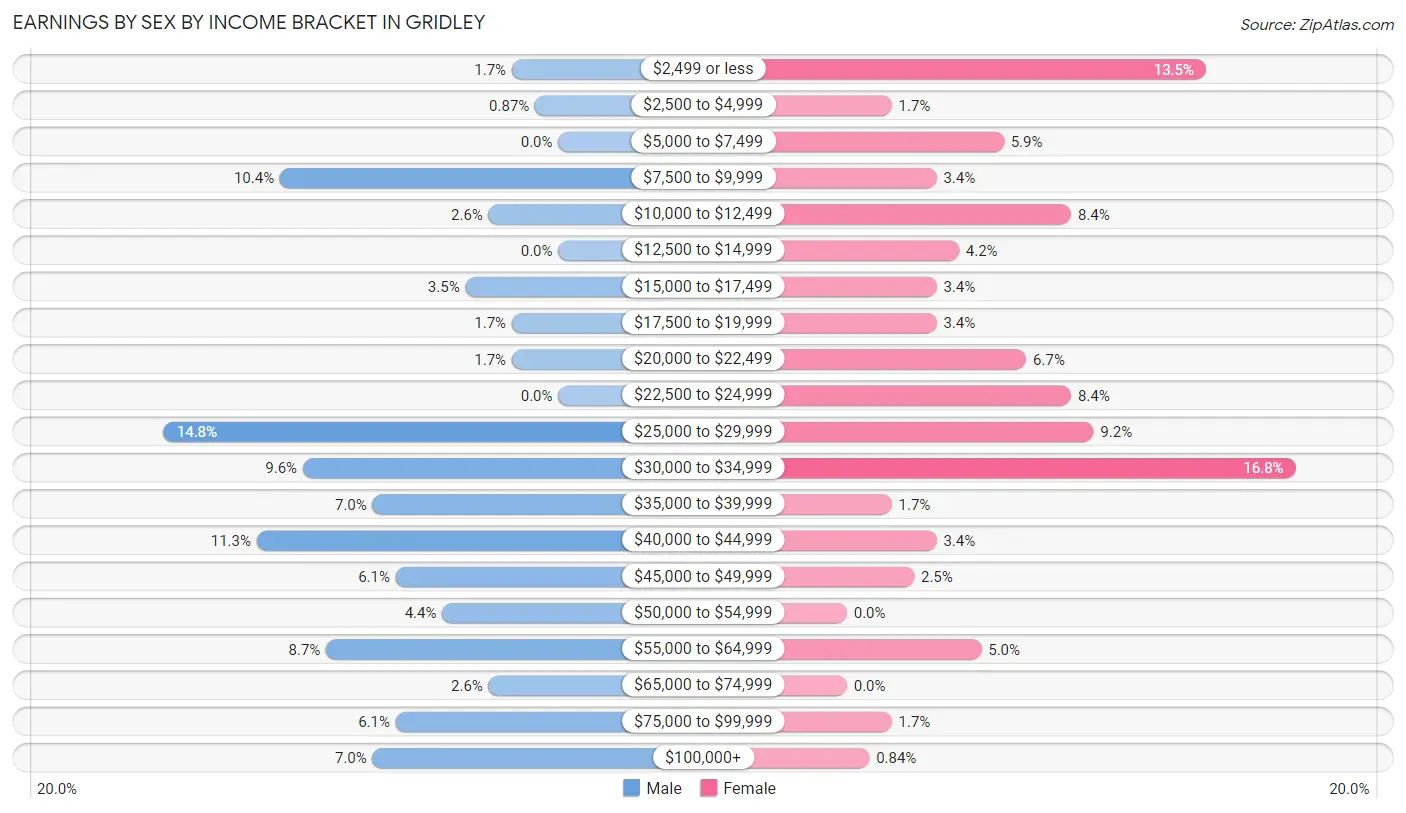
| Income | Male | Female |
| $2,499 or less | 2 (1.7%) | 16 (13.5%) |
| $2,500 to $4,999 | 1 (0.9%) | 2 (1.7%) |
| $5,000 to $7,499 | 0 (0.0%) | 7 (5.9%) |
| $7,500 to $9,999 | 12 (10.4%) | 4 (3.4%) |
| $10,000 to $12,499 | 3 (2.6%) | 10 (8.4%) |
| $12,500 to $14,999 | 0 (0.0%) | 5 (4.2%) |
| $15,000 to $17,499 | 4 (3.5%) | 4 (3.4%) |
| $17,500 to $19,999 | 2 (1.7%) | 4 (3.4%) |
| $20,000 to $22,499 | 2 (1.7%) | 8 (6.7%) |
| $22,500 to $24,999 | 0 (0.0%) | 10 (8.4%) |
| $25,000 to $29,999 | 17 (14.8%) | 11 (9.2%) |
| $30,000 to $34,999 | 11 (9.6%) | 20 (16.8%) |
| $35,000 to $39,999 | 8 (7.0%) | 2 (1.7%) |
| $40,000 to $44,999 | 13 (11.3%) | 4 (3.4%) |
| $45,000 to $49,999 | 7 (6.1%) | 3 (2.5%) |
| $50,000 to $54,999 | 5 (4.3%) | 0 (0.0%) |
| $55,000 to $64,999 | 10 (8.7%) | 6 (5.0%) |
| $65,000 to $74,999 | 3 (2.6%) | 0 (0.0%) |
| $75,000 to $99,999 | 7 (6.1%) | 2 (1.7%) |
| $100,000+ | 8 (7.0%) | 1 (0.8%) |
| Total | 115 (100.0%) | 119 (100.0%) |
Earnings by Sex by Educational Attainment in Gridley
Average earnings in Gridley are $37,917 for men and $25,357 for women, a difference of 33.1%. Men with an educational attainment of bachelor's degree enjoy the highest average annual earnings of $44,750, while those with college or associate's degree education earn the least with $31,875. Women with an educational attainment of bachelor's degree earn the most with the average annual earnings of $41,250, while those with less than high school education have the smallest earnings of $12,750.
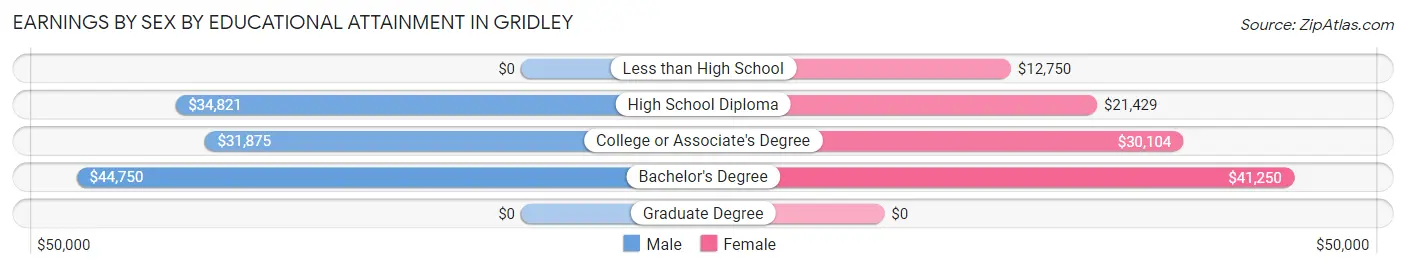
| Educational Attainment | Male Income | Female Income |
| Less than High School | - | - |
| High School Diploma | $34,821 | $21,429 |
| College or Associate's Degree | $31,875 | $30,104 |
| Bachelor's Degree | $44,750 | $41,250 |
| Graduate Degree | - | - |
| Total | $37,917 | $25,357 |
Family Income in Gridley
Family Income Brackets in Gridley
According to the Gridley family income data, there are 36 families falling into the $75,000 to $99,999 income range, which is the most common income bracket and makes up 34.6% of all families.
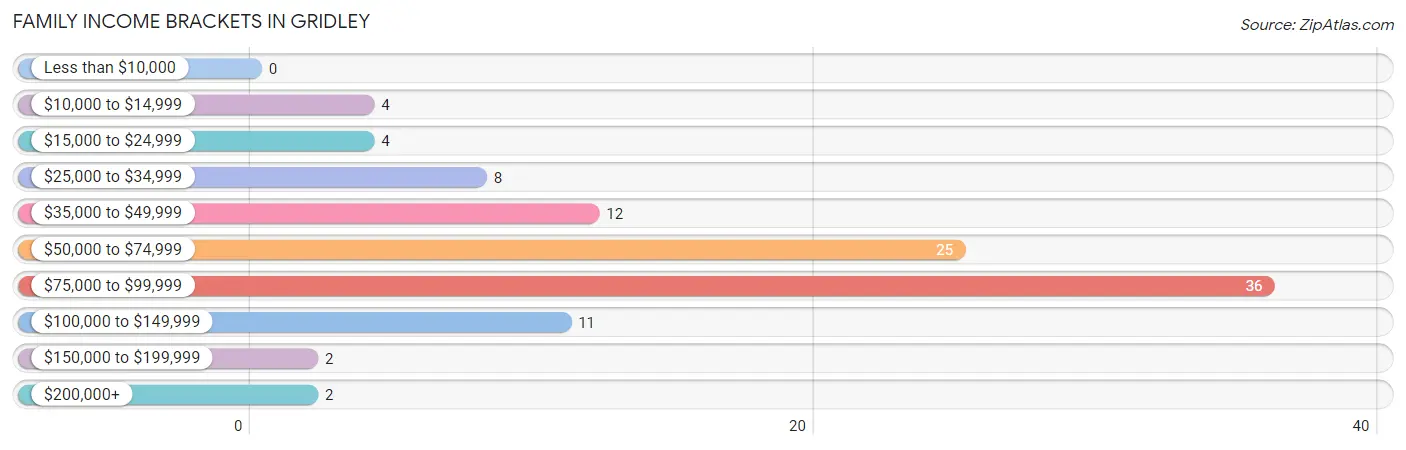
| Income Bracket | # Families | % Families |
| Less than $10,000 | 0 | 0.0% |
| $10,000 to $14,999 | 4 | 3.8% |
| $15,000 to $24,999 | 4 | 3.8% |
| $25,000 to $34,999 | 8 | 7.7% |
| $35,000 to $49,999 | 12 | 11.5% |
| $50,000 to $74,999 | 25 | 24.0% |
| $75,000 to $99,999 | 36 | 34.6% |
| $100,000 to $149,999 | 11 | 10.6% |
| $150,000 to $199,999 | 2 | 1.9% |
| $200,000+ | 2 | 1.9% |
Family Income by Famaliy Size in Gridley
2-person families (46 | 44.2%) account for the highest median family income in Gridley with $80,000 per family, while 2-person families (46 | 44.2%) have the highest median income of $40,000 per family member.
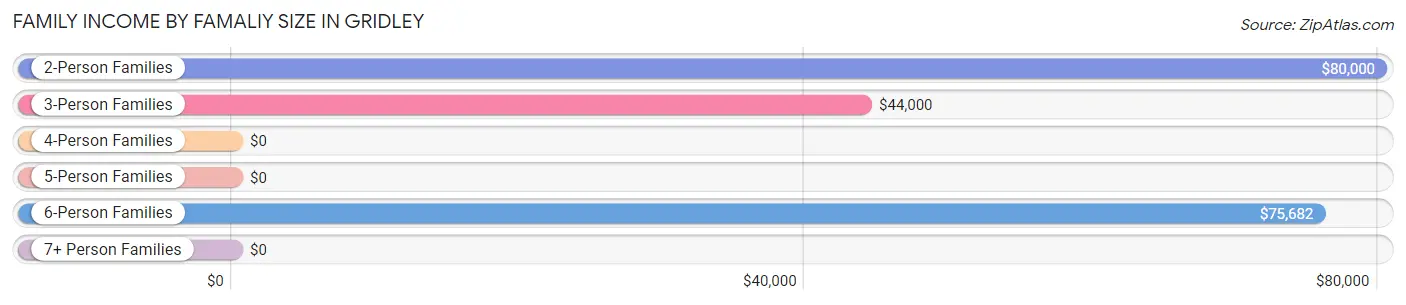
| Income Bracket | # Families | Median Income |
| 2-Person Families | 46 (44.2%) | $80,000 |
| 3-Person Families | 26 (25.0%) | $44,000 |
| 4-Person Families | 10 (9.6%) | $0 |
| 5-Person Families | 2 (1.9%) | $0 |
| 6-Person Families | 20 (19.2%) | $75,682 |
| 7+ Person Families | 0 (0.0%) | $0 |
| Total | 104 (100.0%) | $71,250 |
Family Income by Number of Earners in Gridley
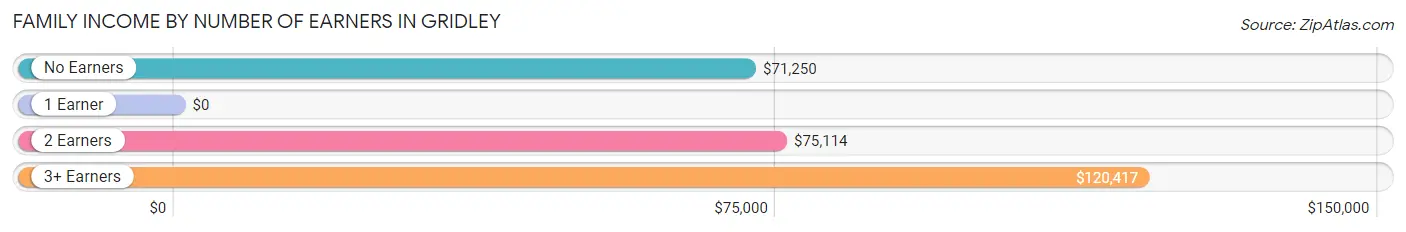
| Number of Earners | # Families | Median Income |
| No Earners | 26 (25.0%) | $71,250 |
| 1 Earner | 16 (15.4%) | $0 |
| 2 Earners | 55 (52.9%) | $75,114 |
| 3+ Earners | 7 (6.7%) | $120,417 |
| Total | 104 (100.0%) | $71,250 |
Household Income in Gridley
Household Income Brackets in Gridley
With 60 households falling in the category, the $50,000 to $74,999 income range is the most frequent in Gridley, accounting for 29.6% of all households. In contrast, only 2 households (1.0%) fall into the less than $10,000 income bracket, making it the least populous group.
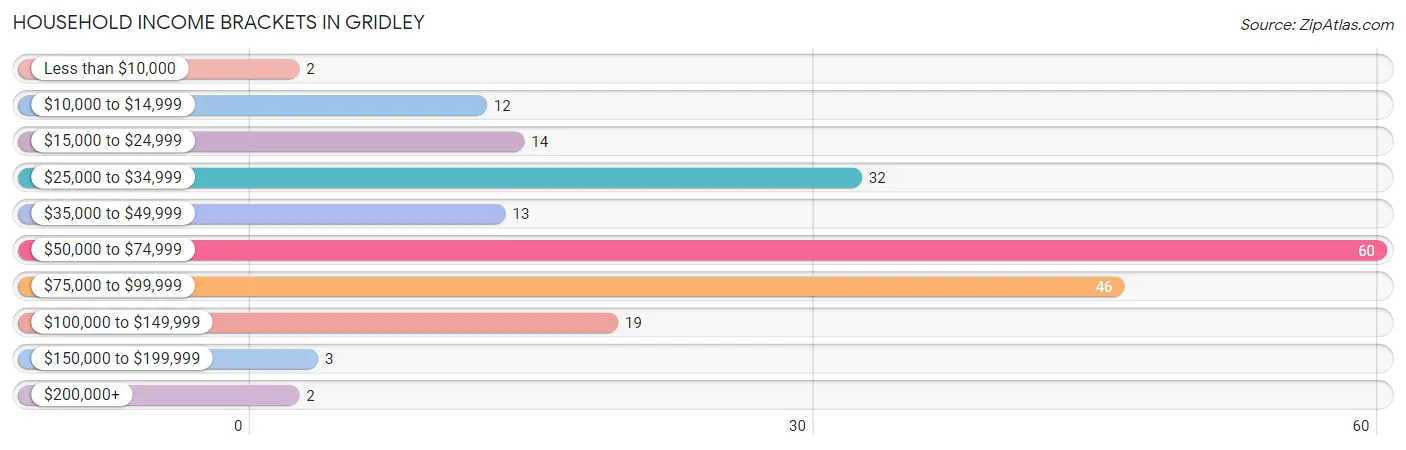
| Income Bracket | # Households | % Households |
| Less than $10,000 | 2 | 1.0% |
| $10,000 to $14,999 | 12 | 5.9% |
| $15,000 to $24,999 | 14 | 6.9% |
| $25,000 to $34,999 | 32 | 15.8% |
| $35,000 to $49,999 | 13 | 6.4% |
| $50,000 to $74,999 | 60 | 29.6% |
| $75,000 to $99,999 | 46 | 22.7% |
| $100,000 to $149,999 | 19 | 9.4% |
| $150,000 to $199,999 | 3 | 1.5% |
| $200,000+ | 2 | 1.0% |
Household Income by Householder Age in Gridley
The median household income in Gridley is $55,865, with the highest median household income of $81,667 found in the 45 to 64 years age bracket for the primary householder. A total of 30 households (14.8%) fall into this category. Meanwhile, the 15 to 24 years age bracket for the primary householder has the lowest median household income of $0, with 14 households (6.9%) in this group.
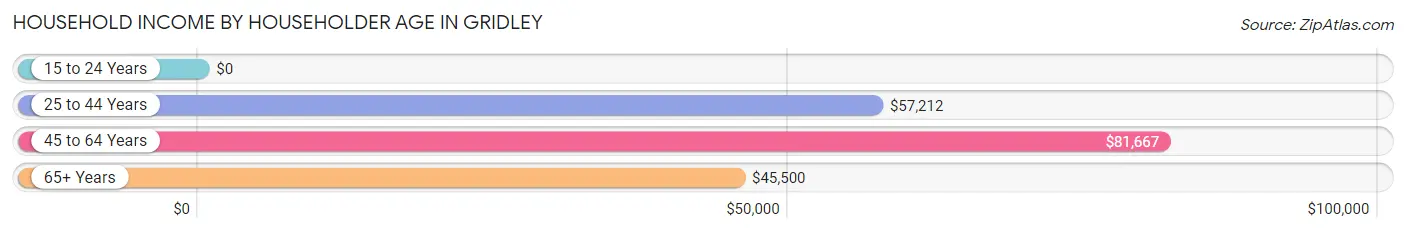
| Income Bracket | # Households | Median Income |
| 15 to 24 Years | 14 (6.9%) | $0 |
| 25 to 44 Years | 67 (33.0%) | $57,212 |
| 45 to 64 Years | 30 (14.8%) | $81,667 |
| 65+ Years | 92 (45.3%) | $45,500 |
| Total | 203 (100.0%) | $55,865 |
Poverty in Gridley
Income Below Poverty by Sex and Age in Gridley
With 3.7% poverty level for males and 10.8% for females among the residents of Gridley, 75 year old and over males and 18 to 24 year old females are the most vulnerable to poverty, with 2 males (11.8%) and 8 females (36.4%) in their respective age groups living below the poverty level.
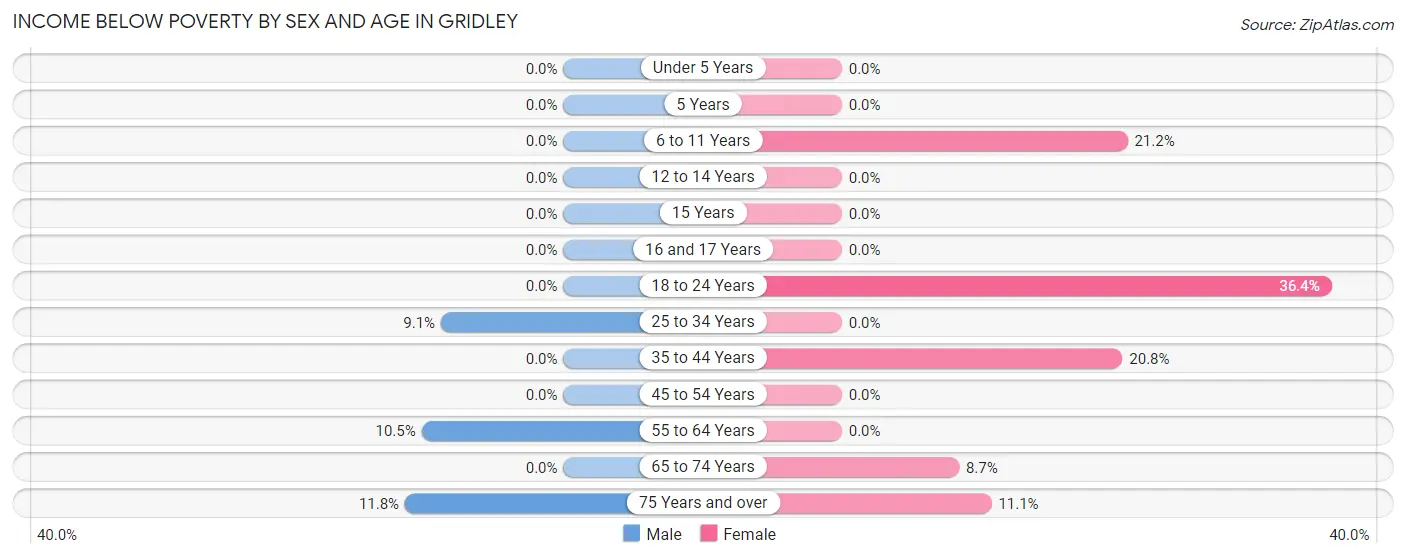
| Age Bracket | Male | Female |
| Under 5 Years | 0 (0.0%) | 0 (0.0%) |
| 5 Years | 0 (0.0%) | 0 (0.0%) |
| 6 to 11 Years | 0 (0.0%) | 7 (21.2%) |
| 12 to 14 Years | 0 (0.0%) | 0 (0.0%) |
| 15 Years | 0 (0.0%) | 0 (0.0%) |
| 16 and 17 Years | 0 (0.0%) | 0 (0.0%) |
| 18 to 24 Years | 0 (0.0%) | 8 (36.4%) |
| 25 to 34 Years | 3 (9.1%) | 0 (0.0%) |
| 35 to 44 Years | 0 (0.0%) | 5 (20.8%) |
| 45 to 54 Years | 0 (0.0%) | 0 (0.0%) |
| 55 to 64 Years | 2 (10.5%) | 0 (0.0%) |
| 65 to 74 Years | 0 (0.0%) | 4 (8.7%) |
| 75 Years and over | 2 (11.8%) | 2 (11.1%) |
| Total | 7 (3.7%) | 26 (10.8%) |
Income Above Poverty by Sex and Age in Gridley
According to the poverty statistics in Gridley, males aged under 5 years and females aged under 5 years are the age groups that are most secure financially, with 100.0% of males and 100.0% of females in these age groups living above the poverty line.
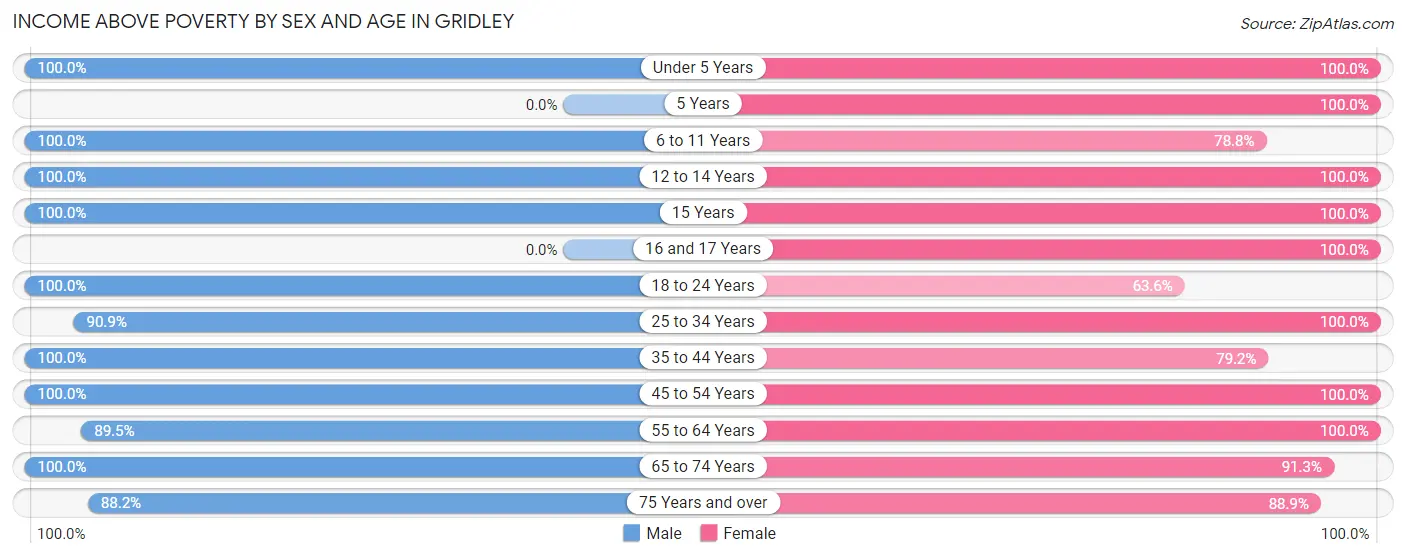
| Age Bracket | Male | Female |
| Under 5 Years | 7 (100.0%) | 5 (100.0%) |
| 5 Years | 0 (0.0%) | 2 (100.0%) |
| 6 to 11 Years | 6 (100.0%) | 26 (78.8%) |
| 12 to 14 Years | 16 (100.0%) | 18 (100.0%) |
| 15 Years | 1 (100.0%) | 5 (100.0%) |
| 16 and 17 Years | 0 (0.0%) | 15 (100.0%) |
| 18 to 24 Years | 9 (100.0%) | 14 (63.6%) |
| 25 to 34 Years | 30 (90.9%) | 30 (100.0%) |
| 35 to 44 Years | 26 (100.0%) | 19 (79.2%) |
| 45 to 54 Years | 17 (100.0%) | 12 (100.0%) |
| 55 to 64 Years | 17 (89.5%) | 10 (100.0%) |
| 65 to 74 Years | 38 (100.0%) | 42 (91.3%) |
| 75 Years and over | 15 (88.2%) | 16 (88.9%) |
| Total | 182 (96.3%) | 214 (89.2%) |
Income Below Poverty Among Married-Couple Families in Gridley
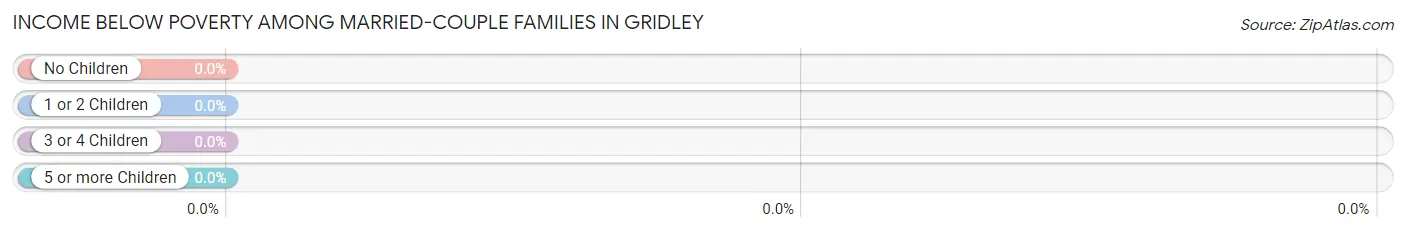
| Children | Above Poverty | Below Poverty |
| No Children | 47 (100.0%) | 0 (0.0%) |
| 1 or 2 Children | 19 (100.0%) | 0 (0.0%) |
| 3 or 4 Children | 20 (100.0%) | 0 (0.0%) |
| 5 or more Children | 0 (0.0%) | 0 (0.0%) |
| Total | 86 (100.0%) | 0 (0.0%) |
Income Below Poverty Among Single-Parent Households in Gridley
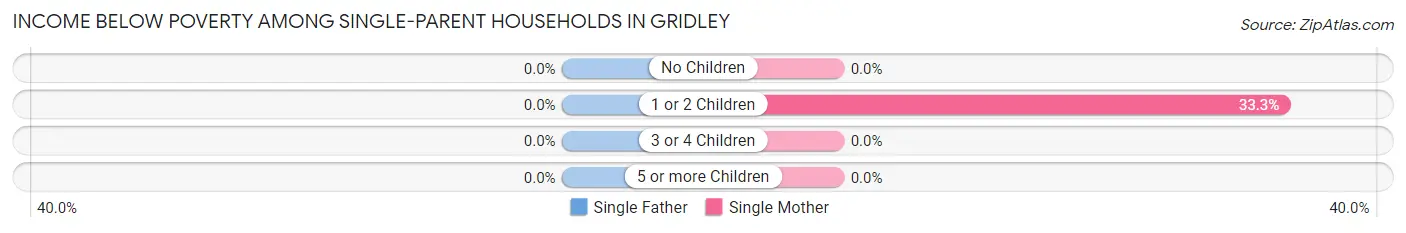
| Children | Single Father | Single Mother |
| No Children | 0 (0.0%) | 0 (0.0%) |
| 1 or 2 Children | 0 (0.0%) | 4 (33.3%) |
| 3 or 4 Children | 0 (0.0%) | 0 (0.0%) |
| 5 or more Children | 0 (0.0%) | 0 (0.0%) |
| Total | 0 (0.0%) | 4 (33.3%) |
Income Below Poverty Among Married-Couple vs Single-Parent Households in Gridley
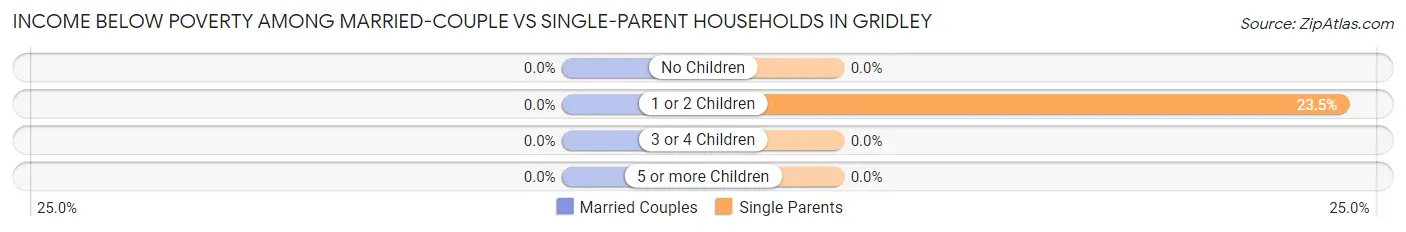
| Children | Married-Couple Families | Single-Parent Households |
| No Children | 0 (0.0%) | 0 (0.0%) |
| 1 or 2 Children | 0 (0.0%) | 4 (23.5%) |
| 3 or 4 Children | 0 (0.0%) | 0 (0.0%) |
| 5 or more Children | 0 (0.0%) | 0 (0.0%) |
| Total | 0 (0.0%) | 4 (22.2%) |
Race in Gridley
The most populous races in Gridley are White / Caucasian (410 | 94.9%), Hispanic or Latino (25 | 5.8%), and Two or more Races (22 | 5.1%).
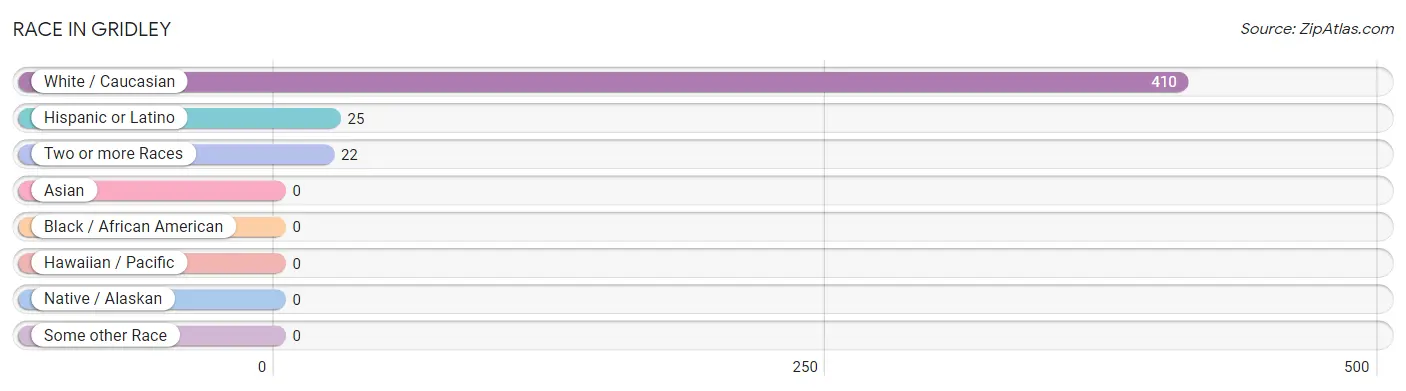
| Race | # Population | % Population |
| Asian | 0 | 0.0% |
| Black / African American | 0 | 0.0% |
| Hawaiian / Pacific | 0 | 0.0% |
| Hispanic or Latino | 25 | 5.8% |
| Native / Alaskan | 0 | 0.0% |
| White / Caucasian | 410 | 94.9% |
| Two or more Races | 22 | 5.1% |
| Some other Race | 0 | 0.0% |
| Total | 432 | 100.0% |
Ancestry in Gridley
The most populous ancestries reported in Gridley are German (88 | 20.4%), English (75 | 17.4%), Irish (54 | 12.5%), European (45 | 10.4%), and American (20 | 4.6%), together accounting for 65.3% of all Gridley residents.
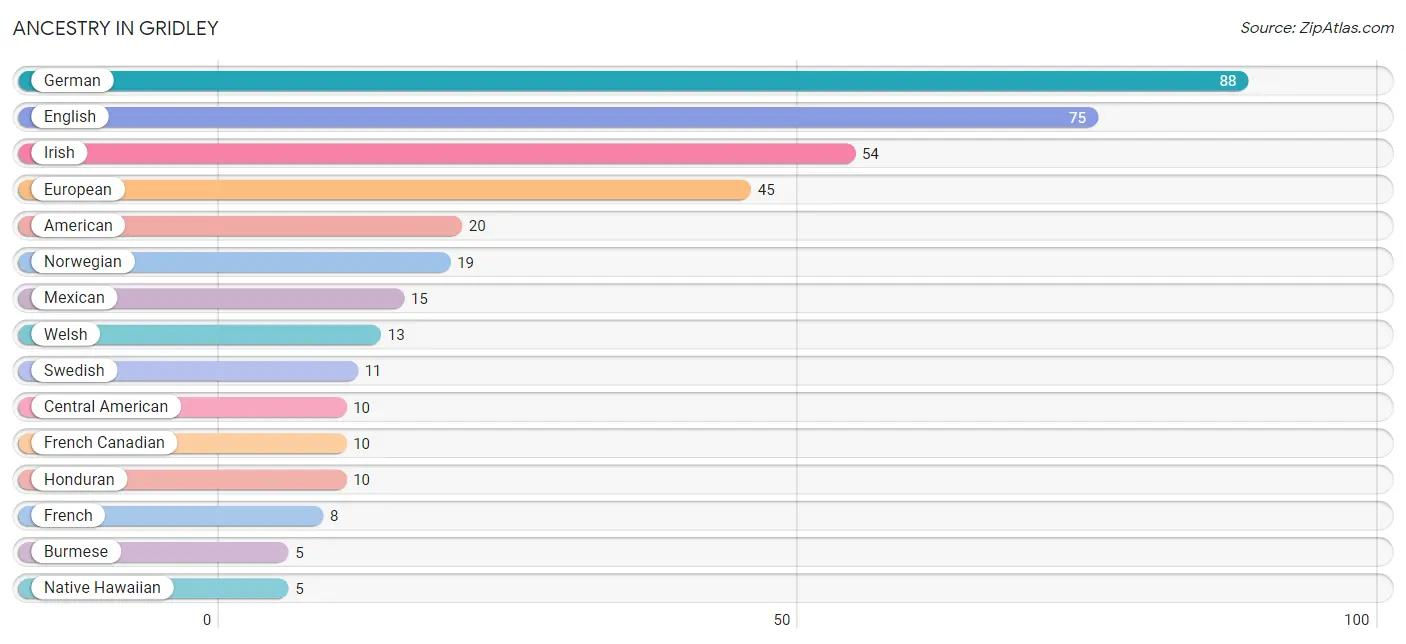
| Ancestry | # Population | % Population |
| American | 20 | 4.6% |
| Apache | 2 | 0.5% |
| British | 2 | 0.5% |
| Burmese | 5 | 1.2% |
| Canadian | 3 | 0.7% |
| Central American | 10 | 2.3% |
| Czech | 2 | 0.5% |
| English | 75 | 17.4% |
| European | 45 | 10.4% |
| French | 8 | 1.8% |
| French Canadian | 10 | 2.3% |
| German | 88 | 20.4% |
| Honduran | 10 | 2.3% |
| Irish | 54 | 12.5% |
| Italian | 1 | 0.2% |
| Mexican | 15 | 3.5% |
| Native Hawaiian | 5 | 1.2% |
| Northern European | 2 | 0.5% |
| Norwegian | 19 | 4.4% |
| Polish | 1 | 0.2% |
| Russian | 4 | 0.9% |
| Scotch-Irish | 1 | 0.2% |
| Scottish | 2 | 0.5% |
| Swedish | 11 | 2.5% |
| Swiss | 1 | 0.2% |
| Welsh | 13 | 3.0% | View All 26 Rows |
Immigrants in Gridley

| Immigration Origin | # Population | % Population | View All 0 Rows |
Sex and Age in Gridley
Sex and Age in Gridley
The most populous age groups in Gridley are 65 to 69 Years (28 | 14.7%) for men and 10 to 14 Years (34 | 14.1%) for women.
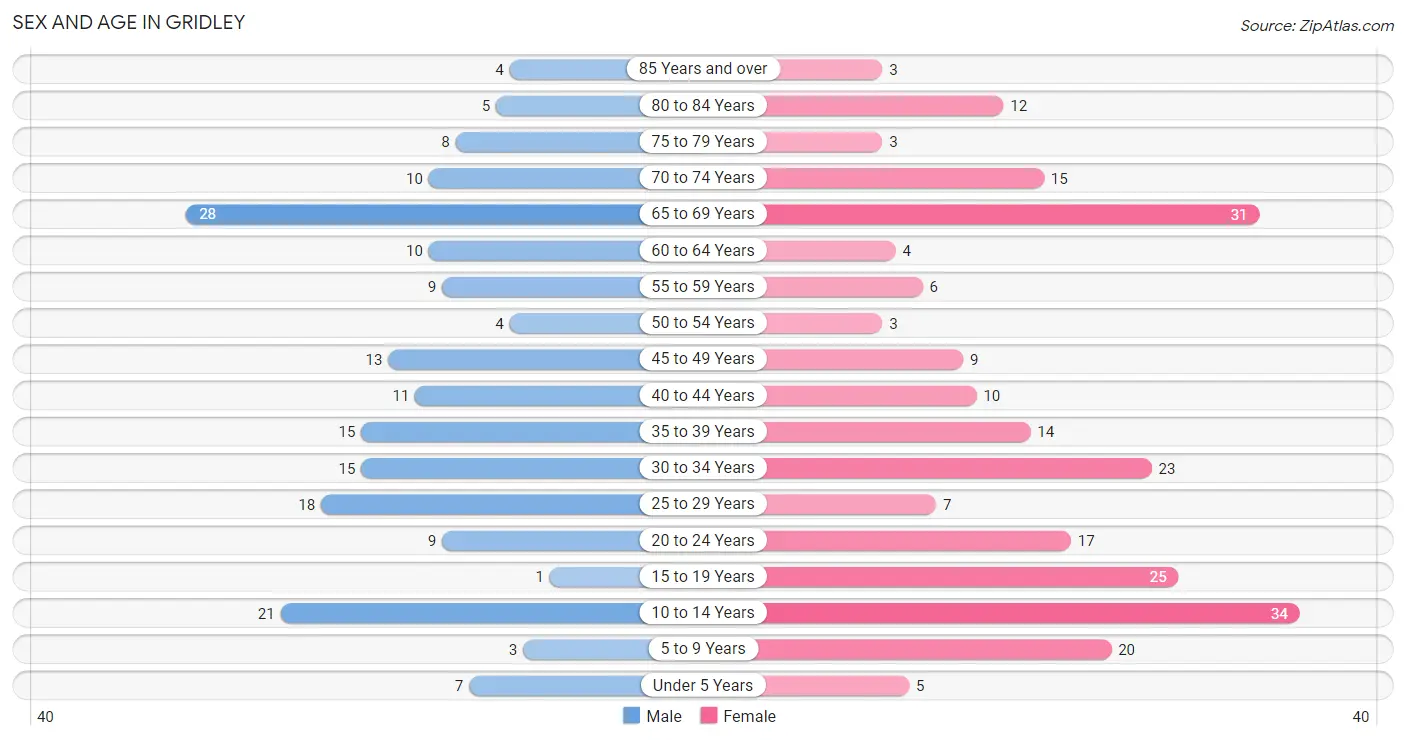
| Age Bracket | Male | Female |
| Under 5 Years | 7 (3.7%) | 5 (2.1%) |
| 5 to 9 Years | 3 (1.6%) | 20 (8.3%) |
| 10 to 14 Years | 21 (11.0%) | 34 (14.1%) |
| 15 to 19 Years | 1 (0.5%) | 25 (10.4%) |
| 20 to 24 Years | 9 (4.7%) | 17 (7.0%) |
| 25 to 29 Years | 18 (9.4%) | 7 (2.9%) |
| 30 to 34 Years | 15 (7.9%) | 23 (9.5%) |
| 35 to 39 Years | 15 (7.9%) | 14 (5.8%) |
| 40 to 44 Years | 11 (5.8%) | 10 (4.2%) |
| 45 to 49 Years | 13 (6.8%) | 9 (3.7%) |
| 50 to 54 Years | 4 (2.1%) | 3 (1.2%) |
| 55 to 59 Years | 9 (4.7%) | 6 (2.5%) |
| 60 to 64 Years | 10 (5.2%) | 4 (1.7%) |
| 65 to 69 Years | 28 (14.7%) | 31 (12.9%) |
| 70 to 74 Years | 10 (5.2%) | 15 (6.2%) |
| 75 to 79 Years | 8 (4.2%) | 3 (1.2%) |
| 80 to 84 Years | 5 (2.6%) | 12 (5.0%) |
| 85 Years and over | 4 (2.1%) | 3 (1.2%) |
| Total | 191 (100.0%) | 241 (100.0%) |
Families and Households in Gridley
Median Family Size in Gridley
The median family size in Gridley is 2.93 persons per family, with single female/mother families (12 | 11.5%) accounting for the largest median family size of 3 persons per family. On the other hand, single male/father families (6 | 5.8%) represent the smallest median family size with 2.83 persons per family.
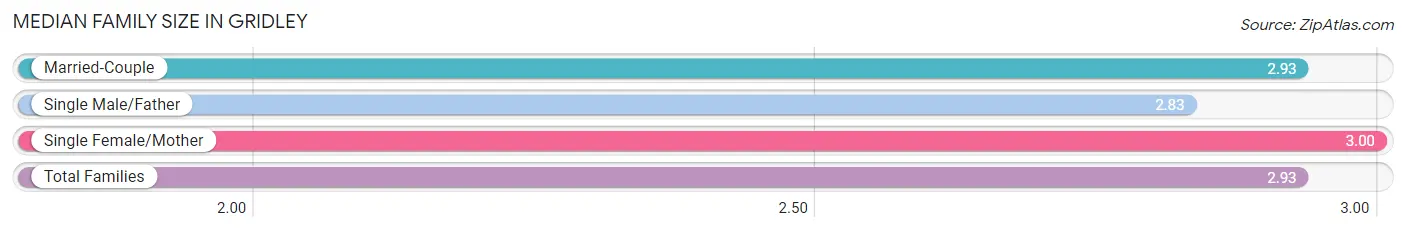
| Family Type | # Families | Family Size |
| Married-Couple | 86 (82.7%) | 2.93 |
| Single Male/Father | 6 (5.8%) | 2.83 |
| Single Female/Mother | 12 (11.5%) | 3.00 |
| Total Families | 104 (100.0%) | 2.93 |
Median Household Size in Gridley
The median household size in Gridley is 2.13 persons per household, with single male/father households (6 | 3.0%) accounting for the largest median household size of 3.5 persons per household. non-family households (99 | 48.8%) represent the smallest median household size with 1.18 persons per household.
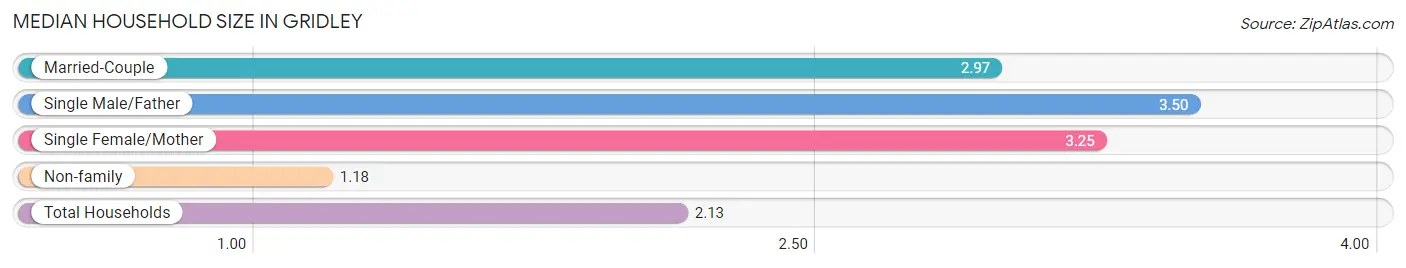
| Household Type | # Households | Household Size |
| Married-Couple | 86 (42.4%) | 2.97 |
| Single Male/Father | 6 (3.0%) | 3.50 |
| Single Female/Mother | 12 (5.9%) | 3.25 |
| Non-family | 99 (48.8%) | 1.18 |
| Total Households | 203 (100.0%) | 2.13 |
Household Size by Marriage Status in Gridley
Out of a total of 203 households in Gridley, 104 (51.2%) are family households, while 99 (48.8%) are nonfamily households. The most numerous type of family households are 2-person households, comprising 44, and the most common type of nonfamily households are 1-person households, comprising 78.
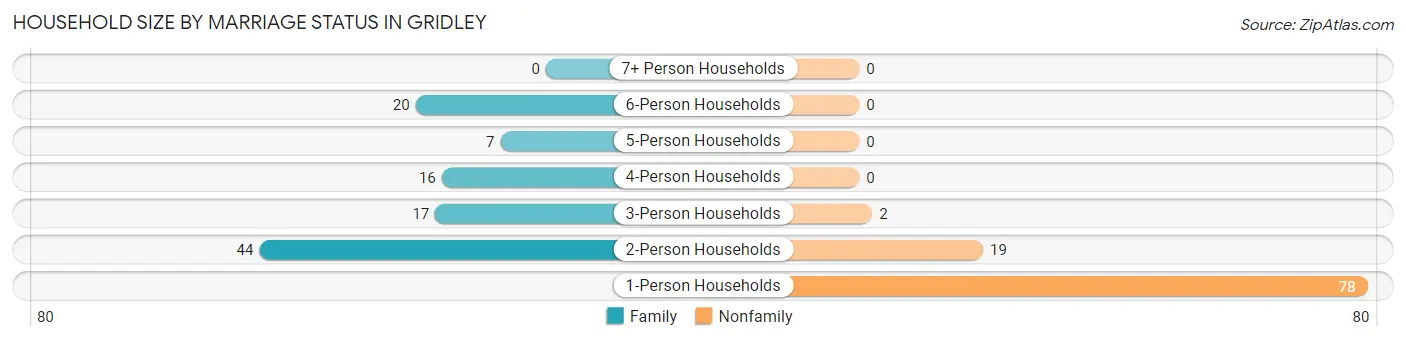
| Household Size | Family Households | Nonfamily Households |
| 1-Person Households | - | 78 (38.4%) |
| 2-Person Households | 44 (21.7%) | 19 (9.4%) |
| 3-Person Households | 17 (8.4%) | 2 (1.0%) |
| 4-Person Households | 16 (7.9%) | 0 (0.0%) |
| 5-Person Households | 7 (3.5%) | 0 (0.0%) |
| 6-Person Households | 20 (9.9%) | 0 (0.0%) |
| 7+ Person Households | 0 (0.0%) | 0 (0.0%) |
| Total | 104 (51.2%) | 99 (48.8%) |
Female Fertility in Gridley
Fertility by Age in Gridley
Average fertility rate in Gridley is 38.0 births per 1,000 women. Women in the age bracket of 20 to 34 years have the highest fertility rate with 85.0 births per 1,000 women. Women in the age bracket of 20 to 34 years acount for 100.0% of all women with births.
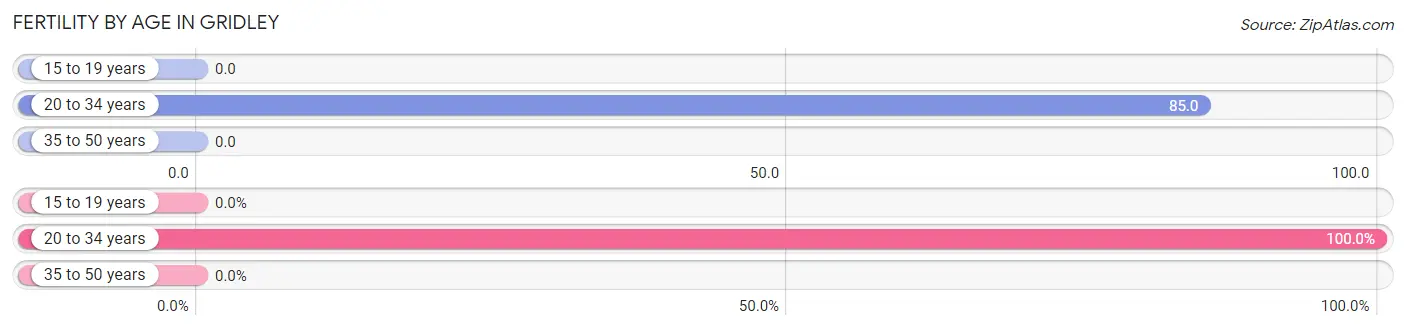
| Age Bracket | Women with Births | Births / 1,000 Women |
| 15 to 19 years | 0 (0.0%) | 0.0 |
| 20 to 34 years | 4 (100.0%) | 85.0 |
| 35 to 50 years | 0 (0.0%) | 0.0 |
| Total | 4 (100.0%) | 38.0 |
Fertility by Age by Marriage Status in Gridley
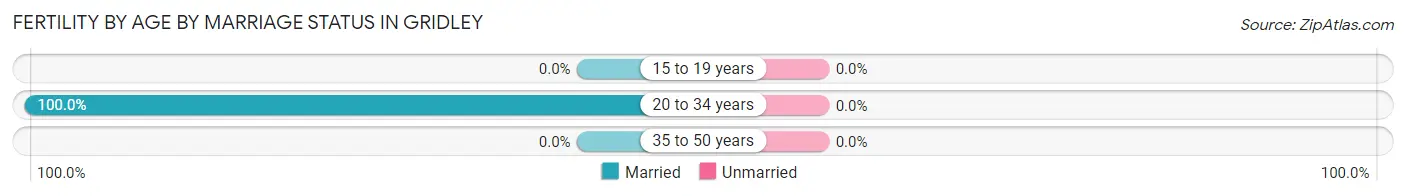
| Age Bracket | Married | Unmarried |
| 15 to 19 years | 0 (0.0%) | 0 (0.0%) |
| 20 to 34 years | 4 (100.0%) | 0 (0.0%) |
| 35 to 50 years | 0 (0.0%) | 0 (0.0%) |
| Total | 4 (100.0%) | 0 (0.0%) |
Fertility by Education in Gridley
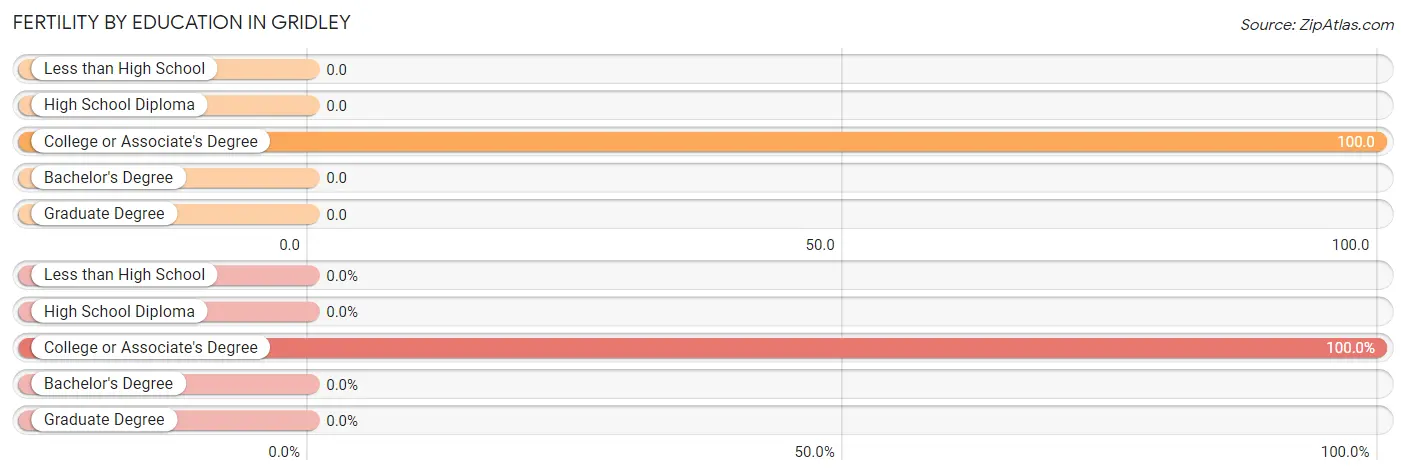
| Educational Attainment | Women with Births | Births / 1,000 Women |
| Less than High School | 0 (0.0%) | 0.0 |
| High School Diploma | 0 (0.0%) | 0.0 |
| College or Associate's Degree | 4 (100.0%) | 100.0 |
| Bachelor's Degree | 0 (0.0%) | 0.0 |
| Graduate Degree | 0 (0.0%) | 0.0 |
| Total | 4 (100.0%) | 38.0 |
Fertility by Education by Marriage Status in Gridley
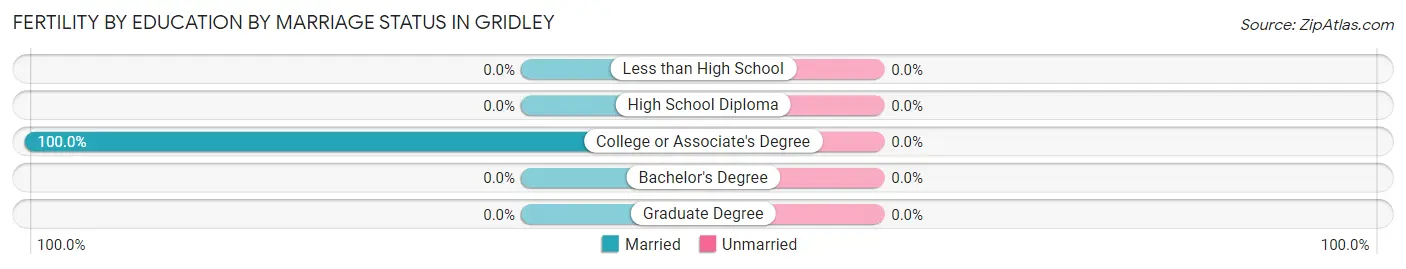
| Educational Attainment | Married | Unmarried |
| Less than High School | 0 (0.0%) | 0 (0.0%) |
| High School Diploma | 0 (0.0%) | 0 (0.0%) |
| College or Associate's Degree | 4 (100.0%) | 0 (0.0%) |
| Bachelor's Degree | 0 (0.0%) | 0 (0.0%) |
| Graduate Degree | 0 (0.0%) | 0 (0.0%) |
| Total | 4 (100.0%) | 0 (0.0%) |
Employment Characteristics in Gridley
Employment by Class of Employer in Gridley
Among the 199 employed individuals in Gridley, private company employees (118 | 59.3%), local government employees (31 | 15.6%), and self-employed (incorporated) (26 | 13.1%) make up the most common classes of employment.
| Employer Class | # Employees | % Employees |
| Private Company Employees | 118 | 59.3% |
| Self-Employed (Incorporated) | 26 | 13.1% |
| Self-Employed (Not Incorporated) | 9 | 4.5% |
| Not-for-profit Organizations | 3 | 1.5% |
| Local Government Employees | 31 | 15.6% |
| State Government Employees | 9 | 4.5% |
| Federal Government Employees | 3 | 1.5% |
| Unpaid Family Workers | 0 | 0.0% |
| Total | 199 | 100.0% |
Employment Status by Age in Gridley
According to the labor force statistics for Gridley, out of the total population over 16 years of age (336), 64.6% or 217 individuals are in the labor force, with 0.9% or 2 of them unemployed. The age group with the highest labor force participation rate is 20 to 24 years, with 100.0% or 26 individuals in the labor force. Within the labor force, the 30 to 34 years age range has the highest percentage of unemployed individuals, with 5.3% or 2 of them being unemployed.
| Age Bracket | In Labor Force | Unemployed |
| 16 to 19 Years | 7 (35.0%) | 0 (0.0%) |
| 20 to 24 Years | 26 (100.0%) | 0 (0.0%) |
| 25 to 29 Years | 22 (88.0%) | 0 (0.0%) |
| 30 to 34 Years | 38 (100.0%) | 2 (5.3%) |
| 35 to 44 Years | 44 (88.0%) | 0 (0.0%) |
| 45 to 54 Years | 25 (86.2%) | 0 (0.0%) |
| 55 to 59 Years | 14 (93.3%) | 0 (0.0%) |
| 60 to 64 Years | 6 (42.9%) | 0 (0.0%) |
| 65 to 74 Years | 33 (39.3%) | 0 (0.0%) |
| 75 Years and over | 2 (5.7%) | 0 (0.0%) |
| Total | 217 (64.6%) | 2 (0.9%) |
Employment Status by Educational Attainment in Gridley
According to labor force statistics for Gridley, 87.1% of individuals (149) out of the total population between 25 and 64 years of age (171) are in the labor force, with 1.3% or 2 of them being unemployed. The group with the highest labor force participation rate are those with the educational attainment of college / associate degree, with 98.4% or 61 individuals in the labor force. Within the labor force, individuals with high school diploma education have the highest percentage of unemployment, with 3.9% or 2 of them being unemployed.
| Educational Attainment | In Labor Force | Unemployed |
| Less than High School | 9 (60.0%) | 0 (0.0%) |
| High School Diploma | 51 (82.3%) | 2 (3.9%) |
| College / Associate Degree | 61 (98.4%) | 0 (0.0%) |
| Bachelor's Degree or higher | 28 (87.5%) | 0 (0.0%) |
| Total | 149 (87.1%) | 2 (1.3%) |
Employment Occupations by Sex in Gridley
Management, Business, Science and Arts Occupations
The most common Management, Business, Science and Arts occupations in Gridley are Community & Social Service (26 | 12.1%), Education Instruction & Library (22 | 10.2%), Management (9 | 4.2%), Computers, Engineering & Science (7 | 3.3%), and Education, Arts & Media (4 | 1.9%).
Management, Business, Science and Arts Occupations by Sex
Within the Management, Business, Science and Arts occupations in Gridley, the most male-oriented occupations are Business & Financial (100.0%), Architecture & Engineering (100.0%), and Life, Physical & Social Science (100.0%), while the most female-oriented occupations are Computers & Mathematics (100.0%), Education Instruction & Library (100.0%), and Health Diagnosing & Treating (100.0%).
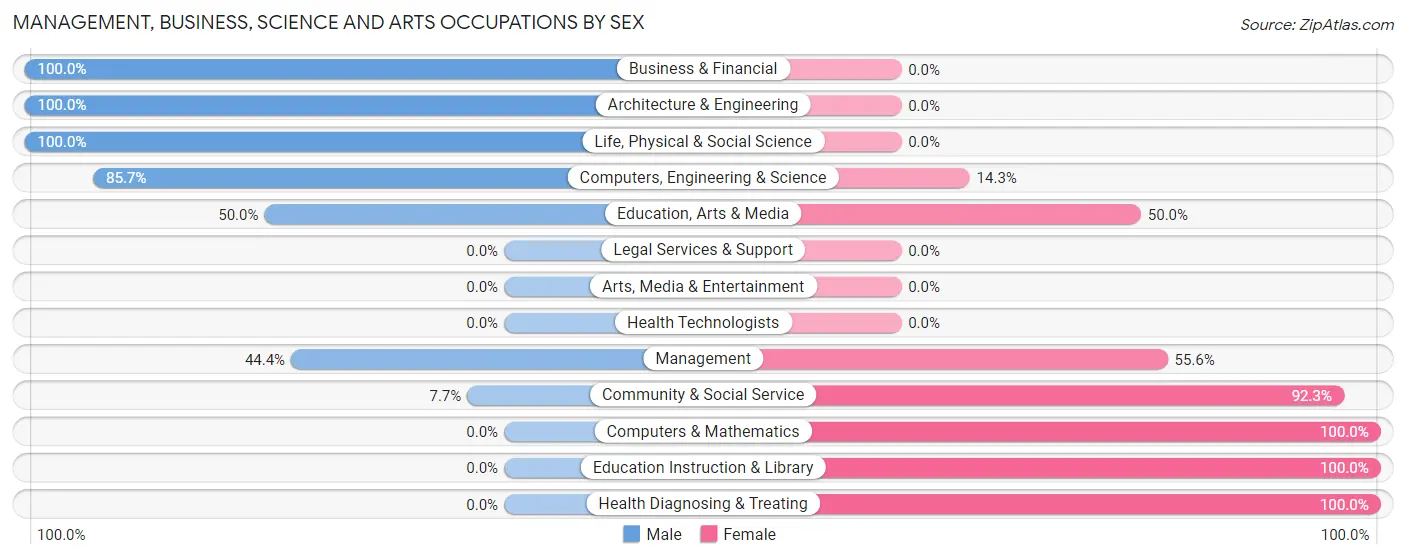
| Occupation | Male | Female |
| Management | 4 (44.4%) | 5 (55.6%) |
| Business & Financial | 3 (100.0%) | 0 (0.0%) |
| Computers, Engineering & Science | 6 (85.7%) | 1 (14.3%) |
| Computers & Mathematics | 0 (0.0%) | 1 (100.0%) |
| Architecture & Engineering | 3 (100.0%) | 0 (0.0%) |
| Life, Physical & Social Science | 3 (100.0%) | 0 (0.0%) |
| Community & Social Service | 2 (7.7%) | 24 (92.3%) |
| Education, Arts & Media | 2 (50.0%) | 2 (50.0%) |
| Legal Services & Support | 0 (0.0%) | 0 (0.0%) |
| Education Instruction & Library | 0 (0.0%) | 22 (100.0%) |
| Arts, Media & Entertainment | 0 (0.0%) | 0 (0.0%) |
| Health Diagnosing & Treating | 0 (0.0%) | 1 (100.0%) |
| Health Technologists | 0 (0.0%) | 0 (0.0%) |
| Total (Category) | 15 (32.6%) | 31 (67.4%) |
| Total (Overall) | 112 (52.1%) | 103 (47.9%) |
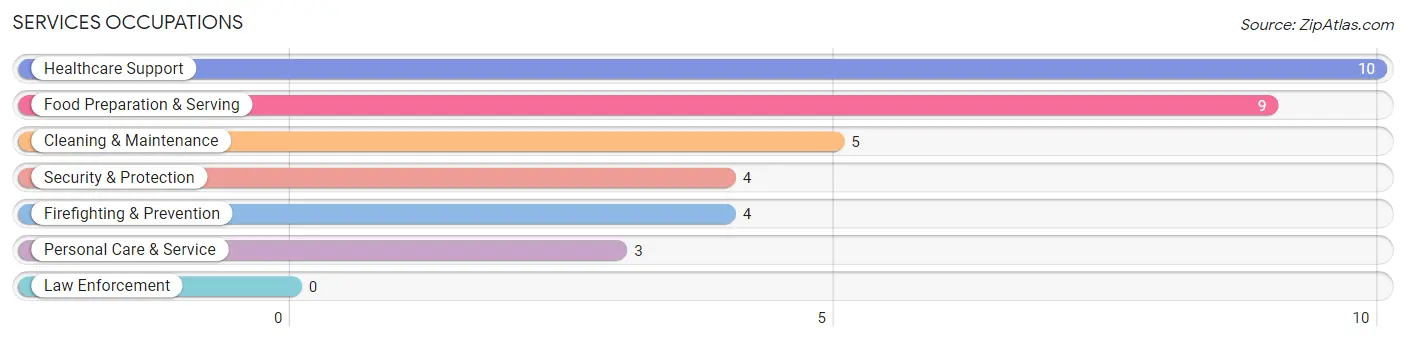
Services Occupations
The most common Services occupations in Gridley are Healthcare Support (10 | 4.6%), Food Preparation & Serving (9 | 4.2%), Cleaning & Maintenance (5 | 2.3%), Security & Protection (4 | 1.9%), and Firefighting & Prevention (4 | 1.9%).
Services Occupations by Sex
Within the Services occupations in Gridley, the most male-oriented occupations are Security & Protection (100.0%), Firefighting & Prevention (100.0%), and Cleaning & Maintenance (60.0%), while the most female-oriented occupations are Healthcare Support (100.0%), Personal Care & Service (100.0%), and Food Preparation & Serving (66.7%).
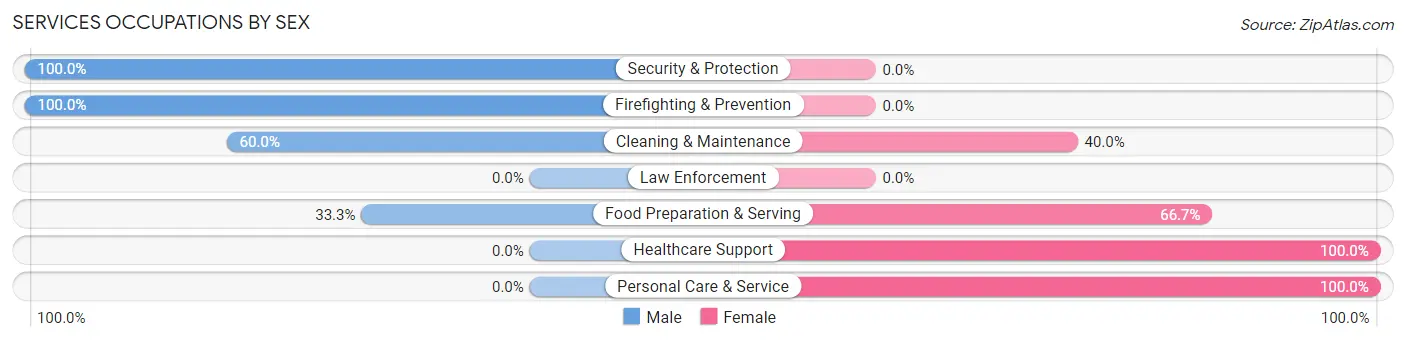
| Occupation | Male | Female |
| Healthcare Support | 0 (0.0%) | 10 (100.0%) |
| Security & Protection | 4 (100.0%) | 0 (0.0%) |
| Firefighting & Prevention | 4 (100.0%) | 0 (0.0%) |
| Law Enforcement | 0 (0.0%) | 0 (0.0%) |
| Food Preparation & Serving | 3 (33.3%) | 6 (66.7%) |
| Cleaning & Maintenance | 3 (60.0%) | 2 (40.0%) |
| Personal Care & Service | 0 (0.0%) | 3 (100.0%) |
| Total (Category) | 10 (32.3%) | 21 (67.7%) |
| Total (Overall) | 112 (52.1%) | 103 (47.9%) |
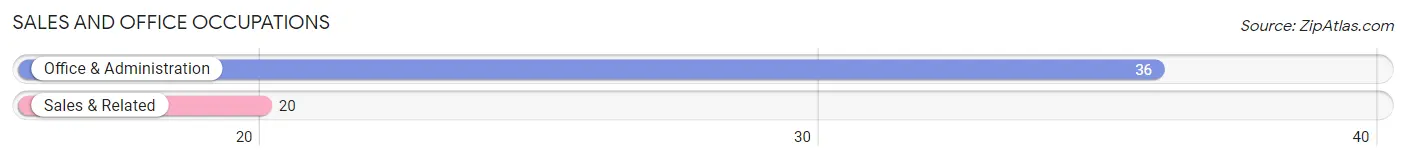
Sales and Office Occupations
The most common Sales and Office occupations in Gridley are Office & Administration (36 | 16.7%), and Sales & Related (20 | 9.3%).
Sales and Office Occupations by Sex
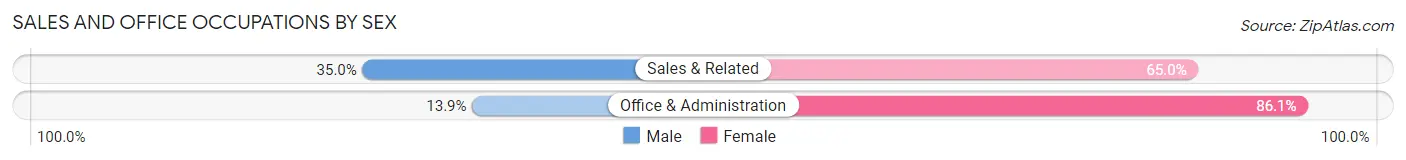
| Occupation | Male | Female |
| Sales & Related | 7 (35.0%) | 13 (65.0%) |
| Office & Administration | 5 (13.9%) | 31 (86.1%) |
| Total (Category) | 12 (21.4%) | 44 (78.6%) |
| Total (Overall) | 112 (52.1%) | 103 (47.9%) |
Natural Resources, Construction and Maintenance Occupations
The most common Natural Resources, Construction and Maintenance occupations in Gridley are Construction & Extraction (34 | 15.8%), and Installation, Maintenance & Repair (17 | 7.9%).
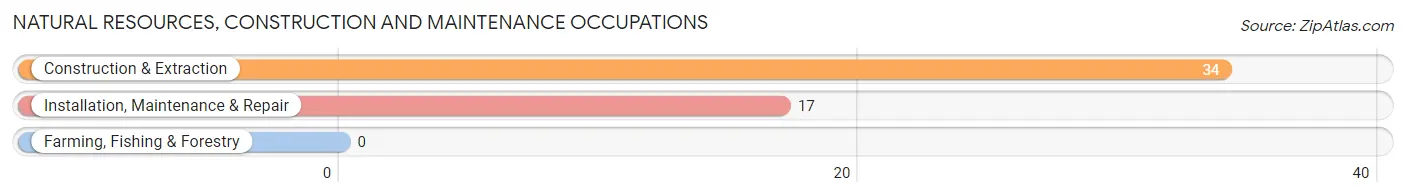
Natural Resources, Construction and Maintenance Occupations by Sex
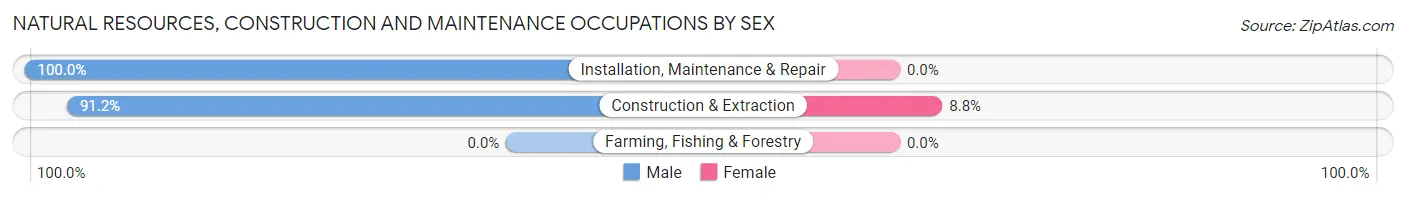
| Occupation | Male | Female |
| Farming, Fishing & Forestry | 0 (0.0%) | 0 (0.0%) |
| Construction & Extraction | 31 (91.2%) | 3 (8.8%) |
| Installation, Maintenance & Repair | 17 (100.0%) | 0 (0.0%) |
| Total (Category) | 48 (94.1%) | 3 (5.9%) |
| Total (Overall) | 112 (52.1%) | 103 (47.9%) |
Production, Transportation and Moving Occupations
The most common Production, Transportation and Moving occupations in Gridley are Transportation (19 | 8.8%), Production (8 | 3.7%), and Material Moving (4 | 1.9%).
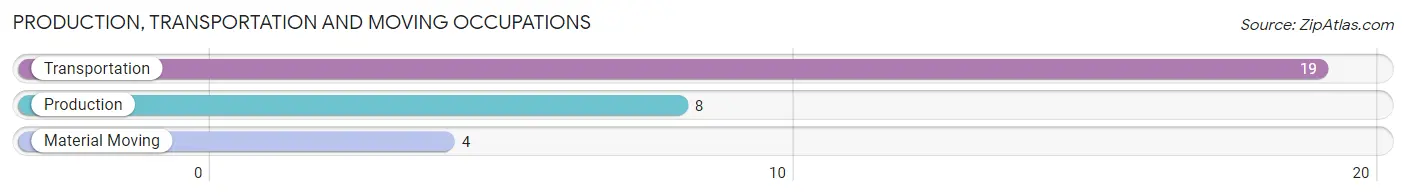
Production, Transportation and Moving Occupations by Sex
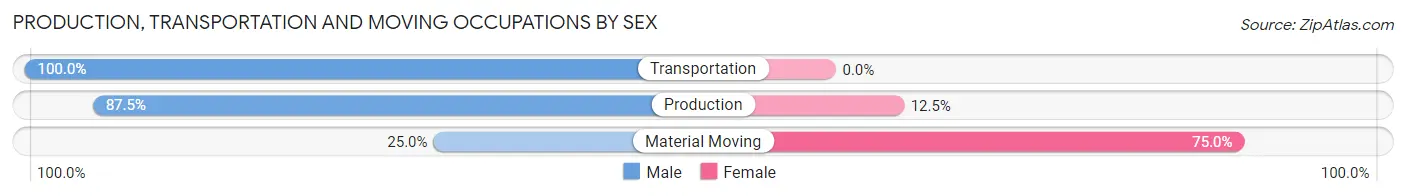
| Occupation | Male | Female |
| Production | 7 (87.5%) | 1 (12.5%) |
| Transportation | 19 (100.0%) | 0 (0.0%) |
| Material Moving | 1 (25.0%) | 3 (75.0%) |
| Total (Category) | 27 (87.1%) | 4 (12.9%) |
| Total (Overall) | 112 (52.1%) | 103 (47.9%) |
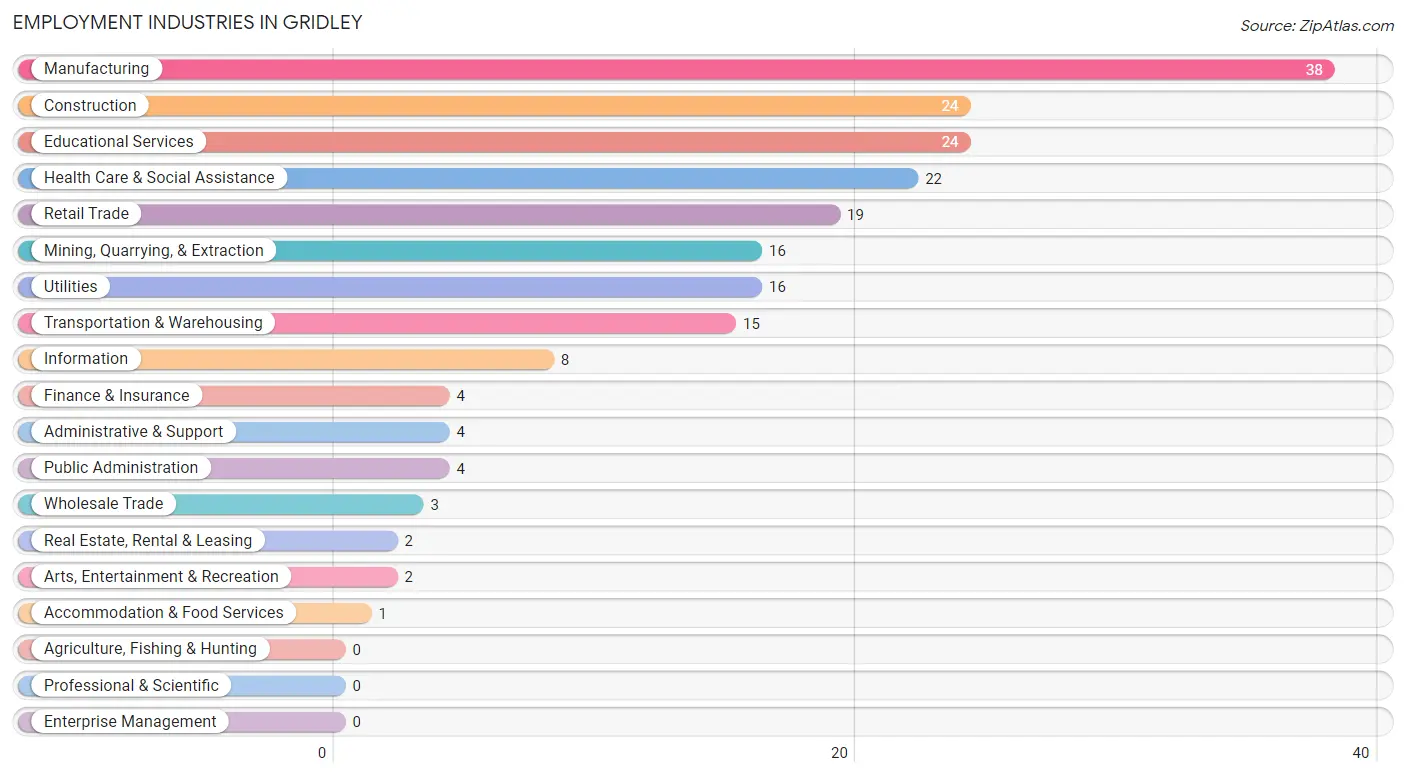
Employment Industries by Sex in Gridley
Employment Industries in Gridley
The major employment industries in Gridley include Manufacturing (38 | 17.7%), Construction (24 | 11.2%), Educational Services (24 | 11.2%), Health Care & Social Assistance (22 | 10.2%), and Retail Trade (19 | 8.8%).
Employment Industries by Sex in Gridley
The Gridley industries that see more men than women are Wholesale Trade (100.0%), Transportation & Warehousing (100.0%), and Arts, Entertainment & Recreation (100.0%), whereas the industries that tend to have a higher number of women are Information (100.0%), Finance & Insurance (100.0%), and Real Estate, Rental & Leasing (100.0%).
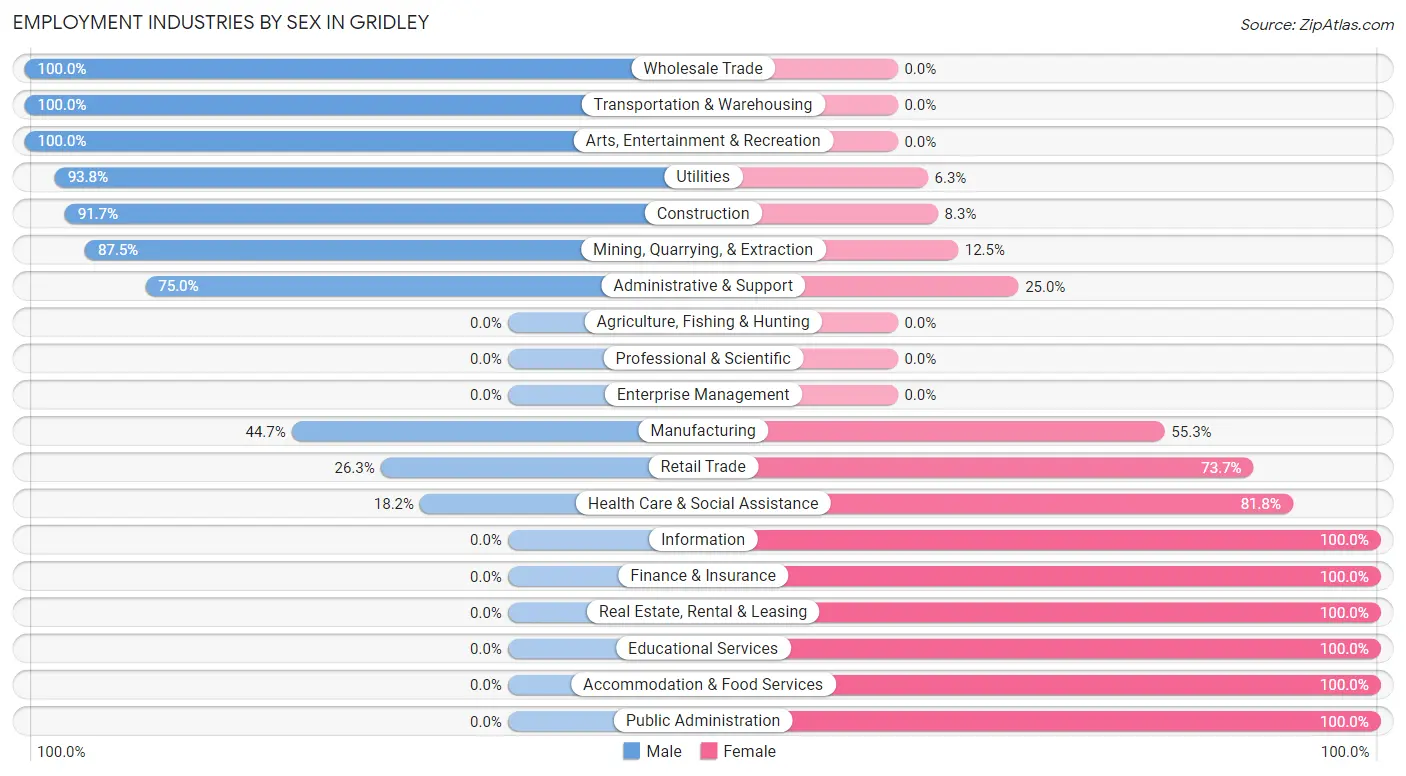
| Industry | Male | Female |
| Agriculture, Fishing & Hunting | 0 (0.0%) | 0 (0.0%) |
| Mining, Quarrying, & Extraction | 14 (87.5%) | 2 (12.5%) |
| Construction | 22 (91.7%) | 2 (8.3%) |
| Manufacturing | 17 (44.7%) | 21 (55.3%) |
| Wholesale Trade | 3 (100.0%) | 0 (0.0%) |
| Retail Trade | 5 (26.3%) | 14 (73.7%) |
| Transportation & Warehousing | 15 (100.0%) | 0 (0.0%) |
| Utilities | 15 (93.8%) | 1 (6.2%) |
| Information | 0 (0.0%) | 8 (100.0%) |
| Finance & Insurance | 0 (0.0%) | 4 (100.0%) |
| Real Estate, Rental & Leasing | 0 (0.0%) | 2 (100.0%) |
| Professional & Scientific | 0 (0.0%) | 0 (0.0%) |
| Enterprise Management | 0 (0.0%) | 0 (0.0%) |
| Administrative & Support | 3 (75.0%) | 1 (25.0%) |
| Educational Services | 0 (0.0%) | 24 (100.0%) |
| Health Care & Social Assistance | 4 (18.2%) | 18 (81.8%) |
| Arts, Entertainment & Recreation | 2 (100.0%) | 0 (0.0%) |
| Accommodation & Food Services | 0 (0.0%) | 1 (100.0%) |
| Public Administration | 0 (0.0%) | 4 (100.0%) |
| Total | 112 (52.1%) | 103 (47.9%) |
Education in Gridley
School Enrollment in Gridley
The most common levels of schooling among the 100 students in Gridley are middle school (45 | 45.0%), elementary school (23 | 23.0%), and high school (13 | 13.0%).
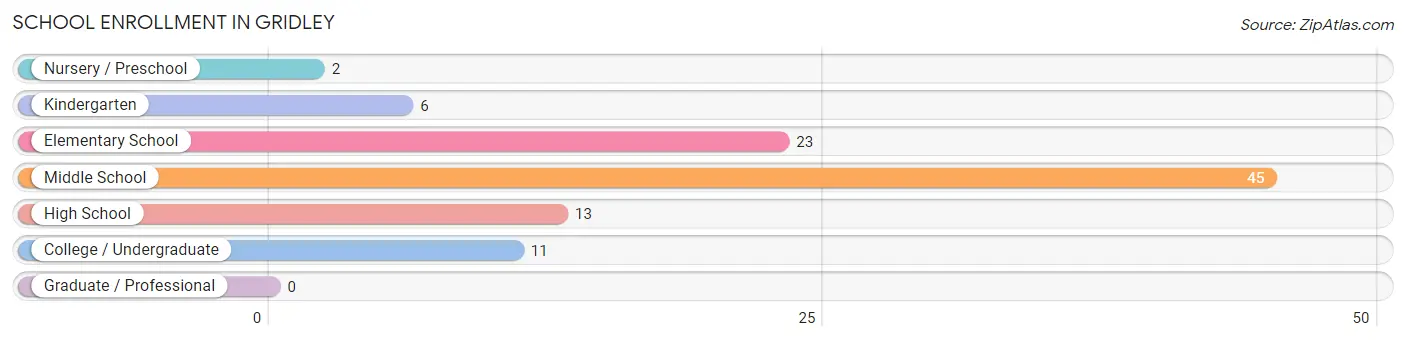
| School Level | # Students | % Students |
| Nursery / Preschool | 2 | 2.0% |
| Kindergarten | 6 | 6.0% |
| Elementary School | 23 | 23.0% |
| Middle School | 45 | 45.0% |
| High School | 13 | 13.0% |
| College / Undergraduate | 11 | 11.0% |
| Graduate / Professional | 0 | 0.0% |
| Total | 100 | 100.0% |
School Enrollment by Age by Funding Source in Gridley
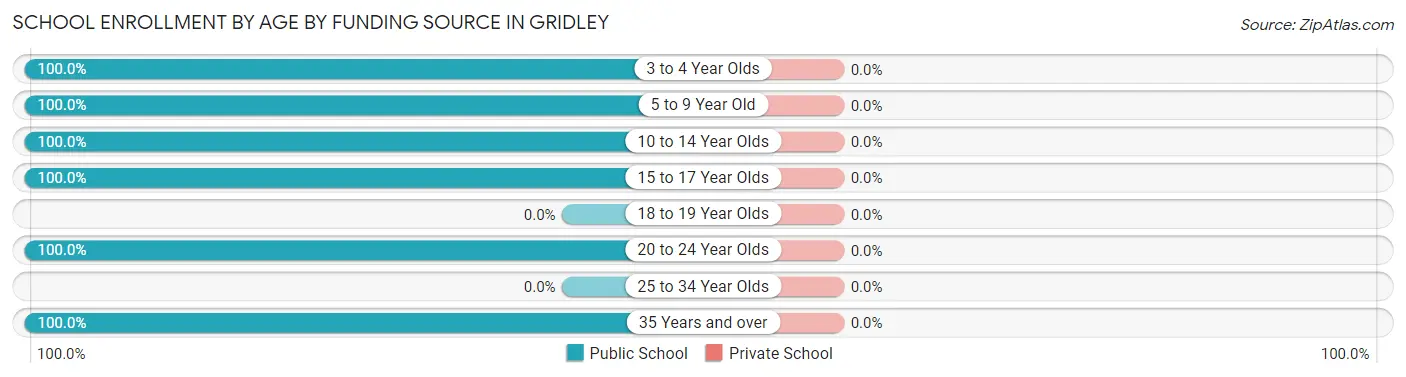
| Age Bracket | Public School | Private School |
| 3 to 4 Year Olds | 2 (100.0%) | 0 (0.0%) |
| 5 to 9 Year Old | 23 (100.0%) | 0 (0.0%) |
| 10 to 14 Year Olds | 51 (100.0%) | 0 (0.0%) |
| 15 to 17 Year Olds | 13 (100.0%) | 0 (0.0%) |
| 18 to 19 Year Olds | 0 (0.0%) | 0 (0.0%) |
| 20 to 24 Year Olds | 9 (100.0%) | 0 (0.0%) |
| 25 to 34 Year Olds | 0 (0.0%) | 0 (0.0%) |
| 35 Years and over | 2 (100.0%) | 0 (0.0%) |
| Total | 100 (100.0%) | 0 (0.0%) |
Educational Attainment by Field of Study in Gridley
Education (13 | 25.5%), business (10 | 19.6%), arts & humanities (8 | 15.7%), engineering (5 | 9.8%), and psychology (4 | 7.8%) are the most common fields of study among 51 individuals in Gridley who have obtained a bachelor's degree or higher.
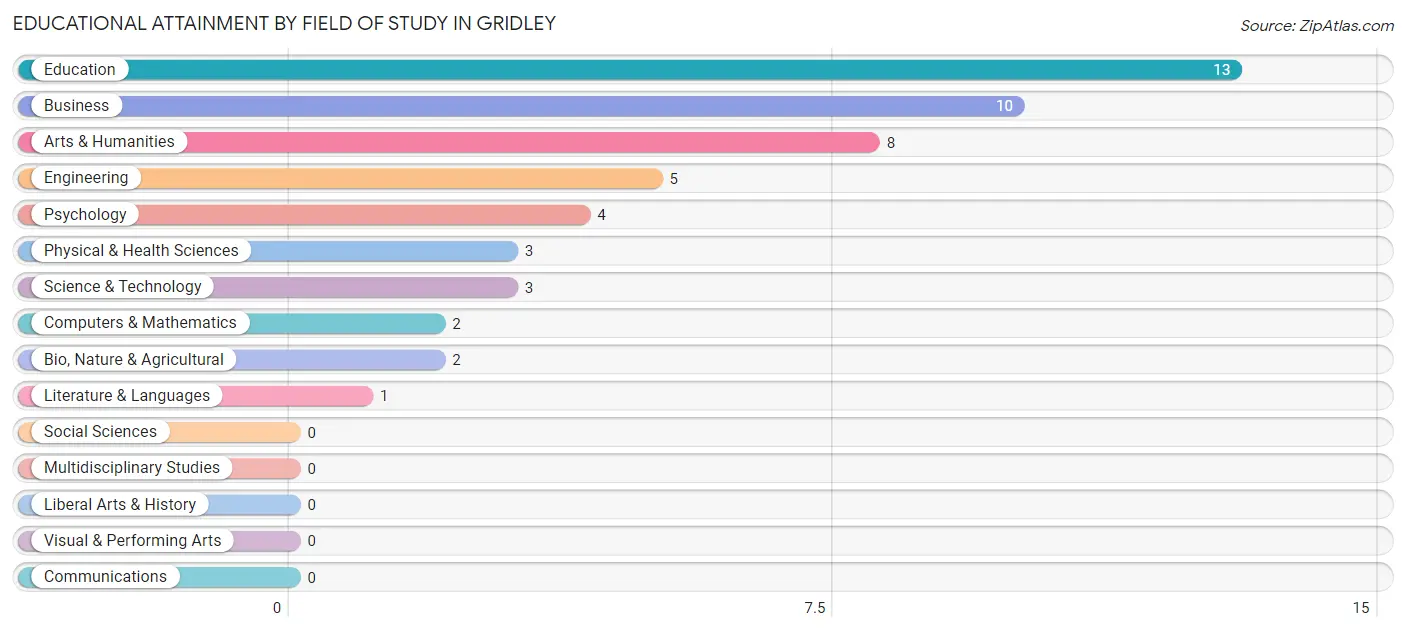
| Field of Study | # Graduates | % Graduates |
| Computers & Mathematics | 2 | 3.9% |
| Bio, Nature & Agricultural | 2 | 3.9% |
| Physical & Health Sciences | 3 | 5.9% |
| Psychology | 4 | 7.8% |
| Social Sciences | 0 | 0.0% |
| Engineering | 5 | 9.8% |
| Multidisciplinary Studies | 0 | 0.0% |
| Science & Technology | 3 | 5.9% |
| Business | 10 | 19.6% |
| Education | 13 | 25.5% |
| Literature & Languages | 1 | 2.0% |
| Liberal Arts & History | 0 | 0.0% |
| Visual & Performing Arts | 0 | 0.0% |
| Communications | 0 | 0.0% |
| Arts & Humanities | 8 | 15.7% |
| Total | 51 | 100.0% |
Transportation & Commute in Gridley
Vehicle Availability by Sex in Gridley
The most prevalent vehicle ownership categories in Gridley are males with 2 vehicles (39, accounting for 36.4%) and females with 2 vehicles (37, making up 42.4%).
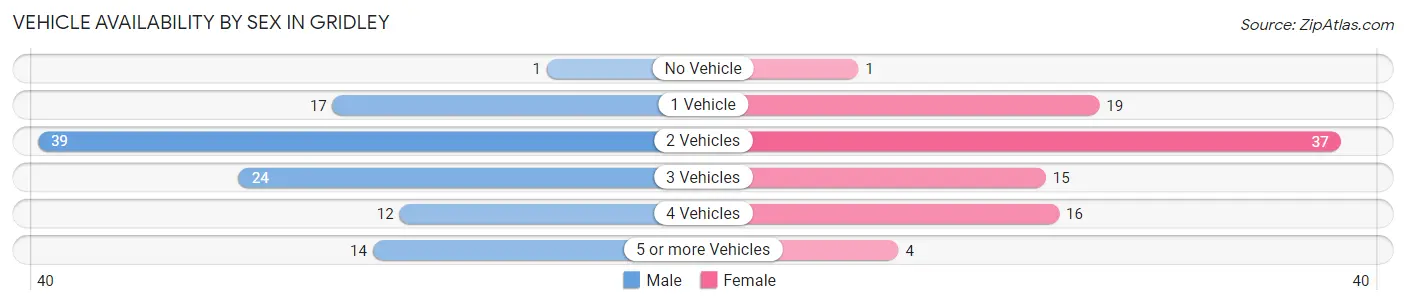
| Vehicles Available | Male | Female |
| No Vehicle | 1 (0.9%) | 1 (1.1%) |
| 1 Vehicle | 17 (15.9%) | 19 (20.6%) |
| 2 Vehicles | 39 (36.4%) | 37 (40.2%) |
| 3 Vehicles | 24 (22.4%) | 15 (16.3%) |
| 4 Vehicles | 12 (11.2%) | 16 (17.4%) |
| 5 or more Vehicles | 14 (13.1%) | 4 (4.3%) |
| Total | 107 (100.0%) | 92 (100.0%) |
Commute Time in Gridley
The most frequently occuring commute durations in Gridley are less than 5 minutes (68 commuters, 35.0%), 45 to 59 minutes (36 commuters, 18.6%), and 20 to 24 minutes (31 commuters, 16.0%).
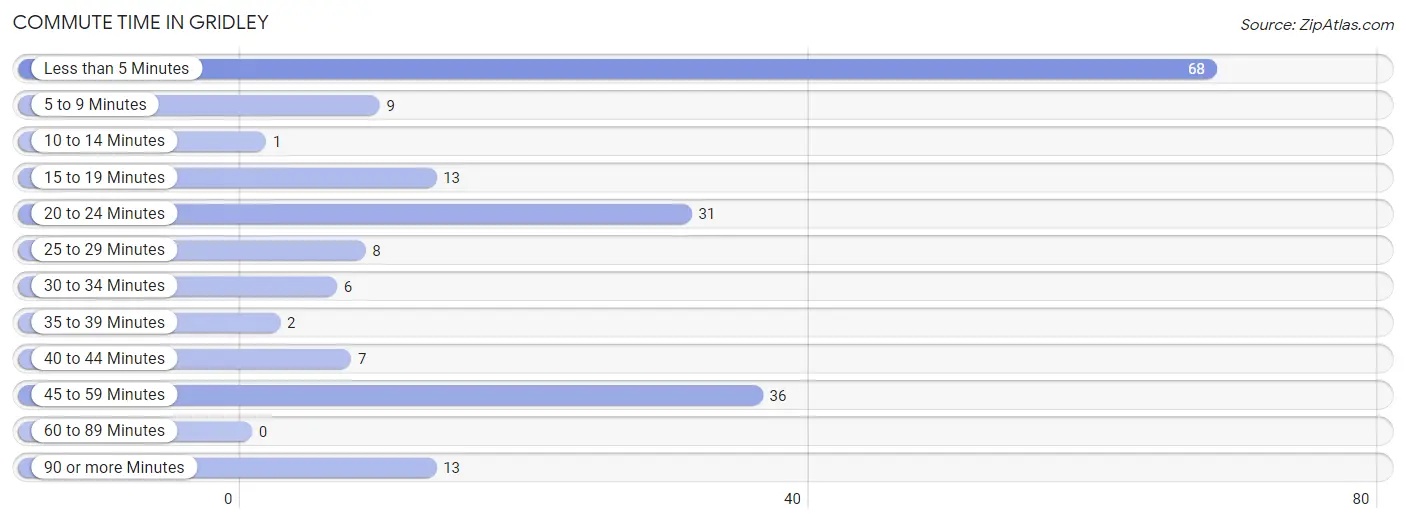
| Commute Time | # Commuters | % Commuters |
| Less than 5 Minutes | 68 | 35.0% |
| 5 to 9 Minutes | 9 | 4.6% |
| 10 to 14 Minutes | 1 | 0.5% |
| 15 to 19 Minutes | 13 | 6.7% |
| 20 to 24 Minutes | 31 | 16.0% |
| 25 to 29 Minutes | 8 | 4.1% |
| 30 to 34 Minutes | 6 | 3.1% |
| 35 to 39 Minutes | 2 | 1.0% |
| 40 to 44 Minutes | 7 | 3.6% |
| 45 to 59 Minutes | 36 | 18.6% |
| 60 to 89 Minutes | 0 | 0.0% |
| 90 or more Minutes | 13 | 6.7% |
Commute Time by Sex in Gridley
The most common commute times in Gridley are less than 5 minutes (37 commuters, 35.6%) for males and less than 5 minutes (31 commuters, 34.4%) for females.
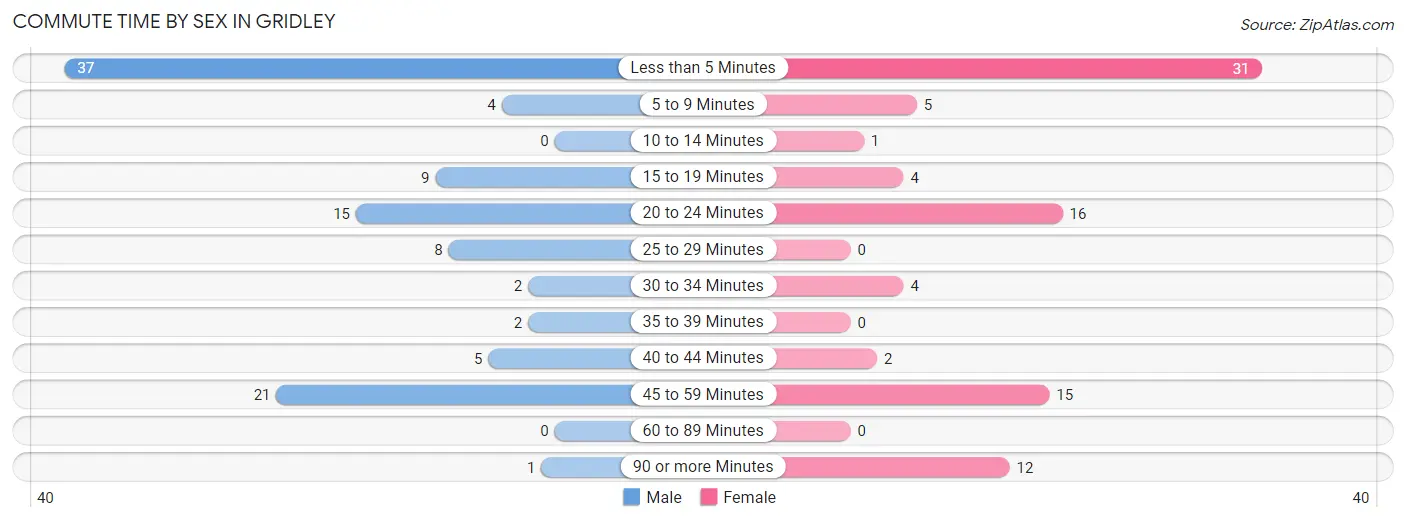
| Commute Time | Male | Female |
| Less than 5 Minutes | 37 (35.6%) | 31 (34.4%) |
| 5 to 9 Minutes | 4 (3.8%) | 5 (5.6%) |
| 10 to 14 Minutes | 0 (0.0%) | 1 (1.1%) |
| 15 to 19 Minutes | 9 (8.6%) | 4 (4.4%) |
| 20 to 24 Minutes | 15 (14.4%) | 16 (17.8%) |
| 25 to 29 Minutes | 8 (7.7%) | 0 (0.0%) |
| 30 to 34 Minutes | 2 (1.9%) | 4 (4.4%) |
| 35 to 39 Minutes | 2 (1.9%) | 0 (0.0%) |
| 40 to 44 Minutes | 5 (4.8%) | 2 (2.2%) |
| 45 to 59 Minutes | 21 (20.2%) | 15 (16.7%) |
| 60 to 89 Minutes | 0 (0.0%) | 0 (0.0%) |
| 90 or more Minutes | 1 (1.0%) | 12 (13.3%) |
Time of Departure to Work by Sex in Gridley
The most frequent times of departure to work in Gridley are 6:30 AM to 6:59 AM (27, 26.0%) for males and 7:30 AM to 7:59 AM (24, 26.7%) for females.
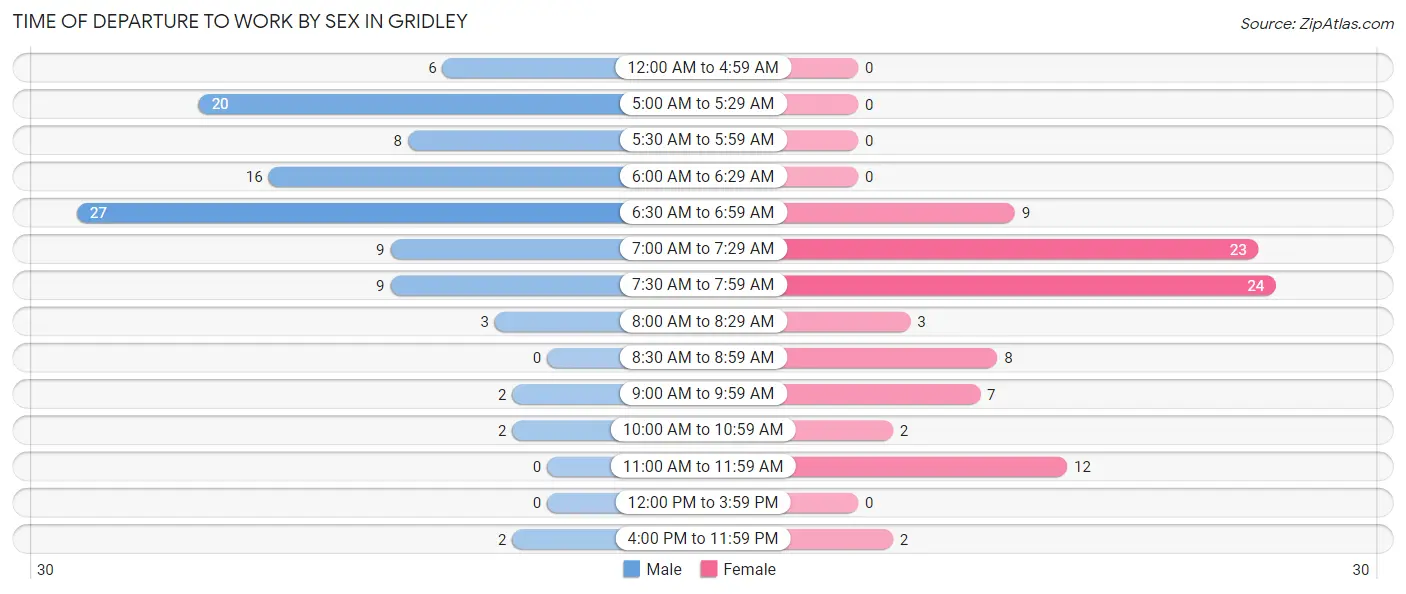
| Time of Departure | Male | Female |
| 12:00 AM to 4:59 AM | 6 (5.8%) | 0 (0.0%) |
| 5:00 AM to 5:29 AM | 20 (19.2%) | 0 (0.0%) |
| 5:30 AM to 5:59 AM | 8 (7.7%) | 0 (0.0%) |
| 6:00 AM to 6:29 AM | 16 (15.4%) | 0 (0.0%) |
| 6:30 AM to 6:59 AM | 27 (26.0%) | 9 (10.0%) |
| 7:00 AM to 7:29 AM | 9 (8.6%) | 23 (25.6%) |
| 7:30 AM to 7:59 AM | 9 (8.6%) | 24 (26.7%) |
| 8:00 AM to 8:29 AM | 3 (2.9%) | 3 (3.3%) |
| 8:30 AM to 8:59 AM | 0 (0.0%) | 8 (8.9%) |
| 9:00 AM to 9:59 AM | 2 (1.9%) | 7 (7.8%) |
| 10:00 AM to 10:59 AM | 2 (1.9%) | 2 (2.2%) |
| 11:00 AM to 11:59 AM | 0 (0.0%) | 12 (13.3%) |
| 12:00 PM to 3:59 PM | 0 (0.0%) | 0 (0.0%) |
| 4:00 PM to 11:59 PM | 2 (1.9%) | 2 (2.2%) |
| Total | 104 (100.0%) | 90 (100.0%) |
Housing Occupancy in Gridley
Occupancy by Ownership in Gridley
Of the total 203 dwellings in Gridley, owner-occupied units account for 117 (57.6%), while renter-occupied units make up 86 (42.4%).
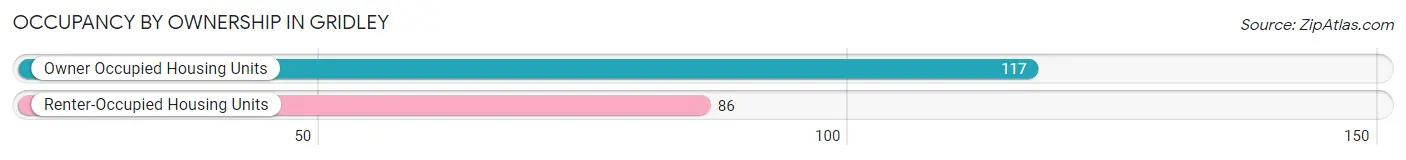
| Occupancy | # Housing Units | % Housing Units |
| Owner Occupied Housing Units | 117 | 57.6% |
| Renter-Occupied Housing Units | 86 | 42.4% |
| Total Occupied Housing Units | 203 | 100.0% |
Occupancy by Household Size in Gridley
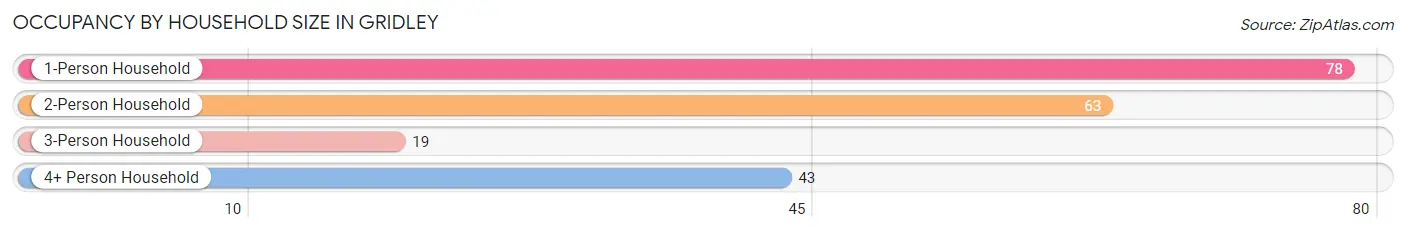
| Household Size | # Housing Units | % Housing Units |
| 1-Person Household | 78 | 38.4% |
| 2-Person Household | 63 | 31.0% |
| 3-Person Household | 19 | 9.4% |
| 4+ Person Household | 43 | 21.2% |
| Total Housing Units | 203 | 100.0% |
Occupancy by Ownership by Household Size in Gridley
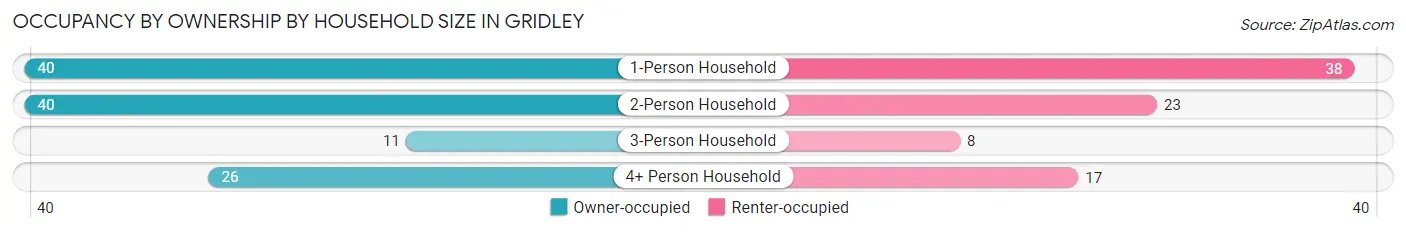
| Household Size | Owner-occupied | Renter-occupied |
| 1-Person Household | 40 (51.3%) | 38 (48.7%) |
| 2-Person Household | 40 (63.5%) | 23 (36.5%) |
| 3-Person Household | 11 (57.9%) | 8 (42.1%) |
| 4+ Person Household | 26 (60.5%) | 17 (39.5%) |
| Total Housing Units | 117 (57.6%) | 86 (42.4%) |
Occupancy by Educational Attainment in Gridley
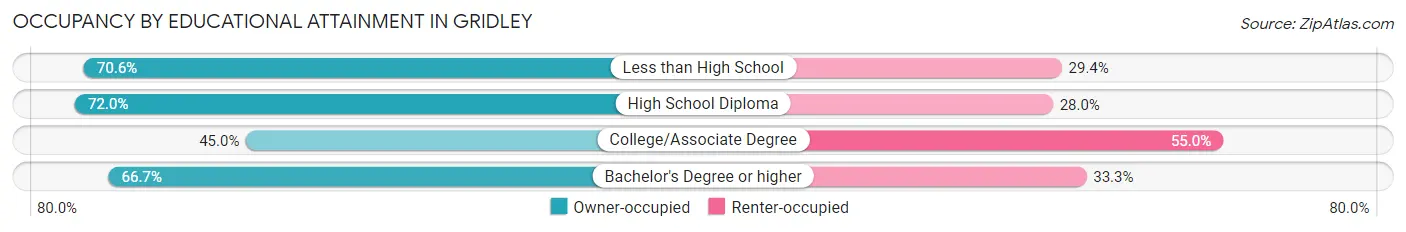
| Household Size | Owner-occupied | Renter-occupied |
| Less than High School | 12 (70.6%) | 5 (29.4%) |
| High School Diploma | 36 (72.0%) | 14 (28.0%) |
| College/Associate Degree | 45 (45.0%) | 55 (55.0%) |
| Bachelor's Degree or higher | 24 (66.7%) | 12 (33.3%) |
Occupancy by Age of Householder in Gridley
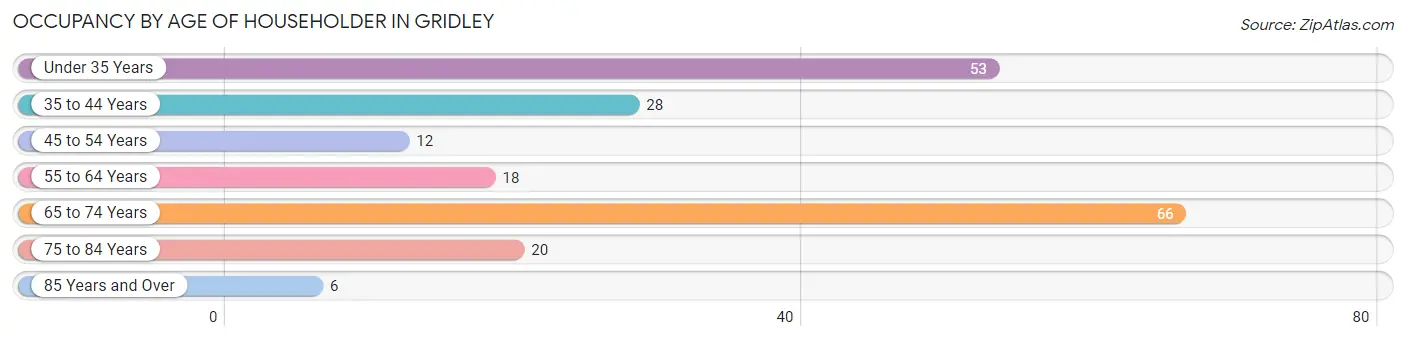
| Age Bracket | # Households | % Households |
| Under 35 Years | 53 | 26.1% |
| 35 to 44 Years | 28 | 13.8% |
| 45 to 54 Years | 12 | 5.9% |
| 55 to 64 Years | 18 | 8.9% |
| 65 to 74 Years | 66 | 32.5% |
| 75 to 84 Years | 20 | 9.9% |
| 85 Years and Over | 6 | 3.0% |
| Total | 203 | 100.0% |
Housing Finances in Gridley
Median Income by Occupancy in Gridley
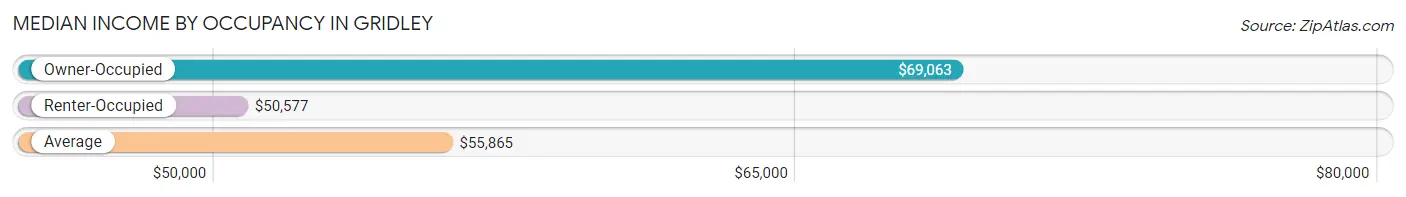
| Occupancy Type | # Households | Median Income |
| Owner-Occupied | 117 (57.6%) | $69,063 |
| Renter-Occupied | 86 (42.4%) | $50,577 |
| Average | 203 (100.0%) | $55,865 |
Occupancy by Householder Income Bracket in Gridley
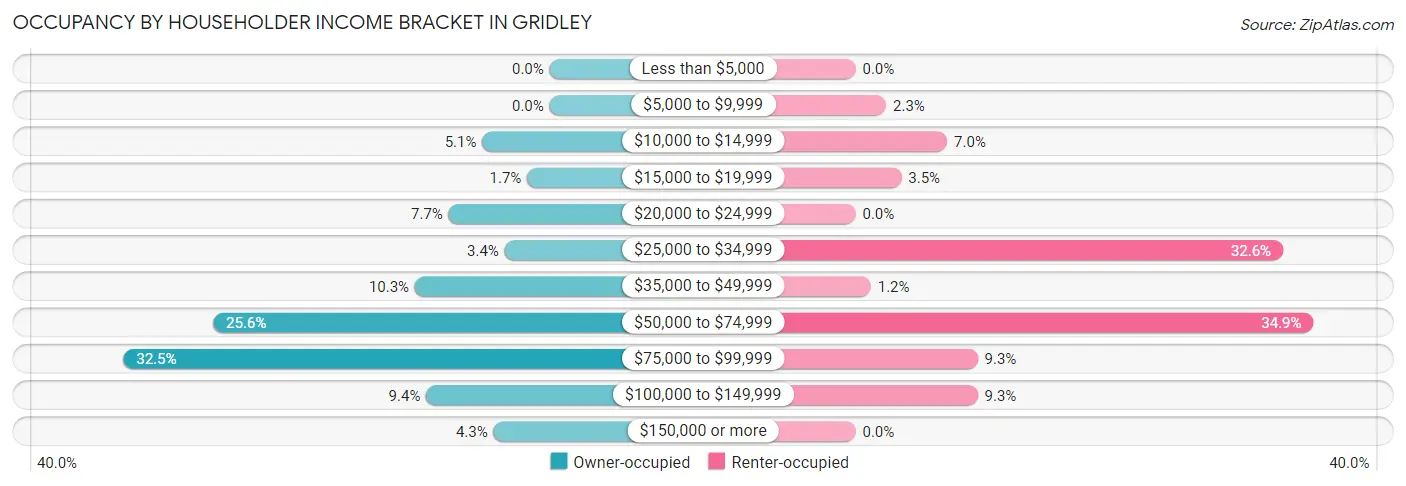
| Income Bracket | Owner-occupied | Renter-occupied |
| Less than $5,000 | 0 (0.0%) | 0 (0.0%) |
| $5,000 to $9,999 | 0 (0.0%) | 2 (2.3%) |
| $10,000 to $14,999 | 6 (5.1%) | 6 (7.0%) |
| $15,000 to $19,999 | 2 (1.7%) | 3 (3.5%) |
| $20,000 to $24,999 | 9 (7.7%) | 0 (0.0%) |
| $25,000 to $34,999 | 4 (3.4%) | 28 (32.6%) |
| $35,000 to $49,999 | 12 (10.3%) | 1 (1.2%) |
| $50,000 to $74,999 | 30 (25.6%) | 30 (34.9%) |
| $75,000 to $99,999 | 38 (32.5%) | 8 (9.3%) |
| $100,000 to $149,999 | 11 (9.4%) | 8 (9.3%) |
| $150,000 or more | 5 (4.3%) | 0 (0.0%) |
| Total | 117 (100.0%) | 86 (100.0%) |
Monthly Housing Cost Tiers in Gridley
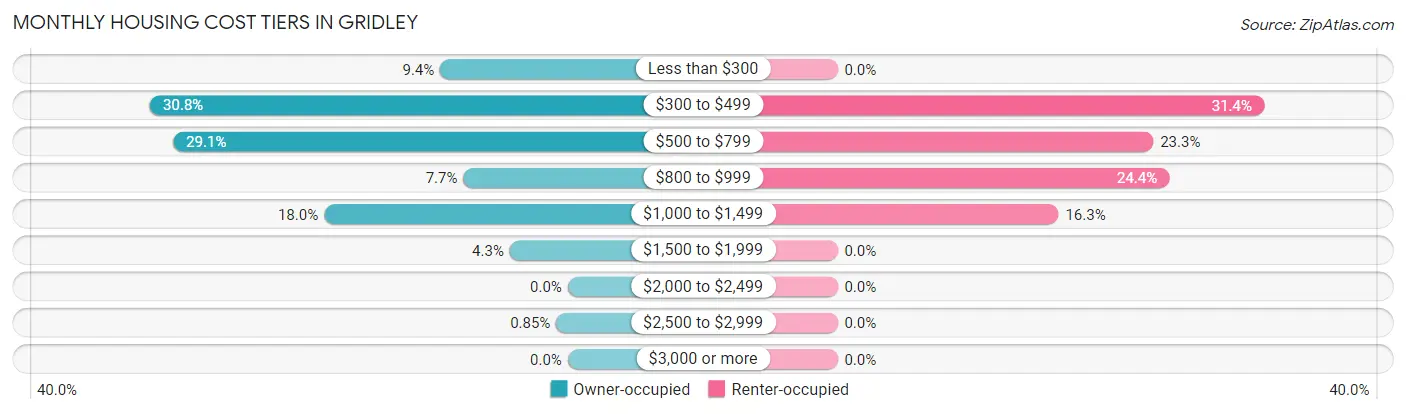
| Monthly Cost | Owner-occupied | Renter-occupied |
| Less than $300 | 11 (9.4%) | 0 (0.0%) |
| $300 to $499 | 36 (30.8%) | 27 (31.4%) |
| $500 to $799 | 34 (29.1%) | 20 (23.3%) |
| $800 to $999 | 9 (7.7%) | 21 (24.4%) |
| $1,000 to $1,499 | 21 (17.9%) | 14 (16.3%) |
| $1,500 to $1,999 | 5 (4.3%) | 0 (0.0%) |
| $2,000 to $2,499 | 0 (0.0%) | 0 (0.0%) |
| $2,500 to $2,999 | 1 (0.9%) | 0 (0.0%) |
| $3,000 or more | 0 (0.0%) | 0 (0.0%) |
| Total | 117 (100.0%) | 86 (100.0%) |
Physical Housing Characteristics in Gridley
Housing Structures in Gridley
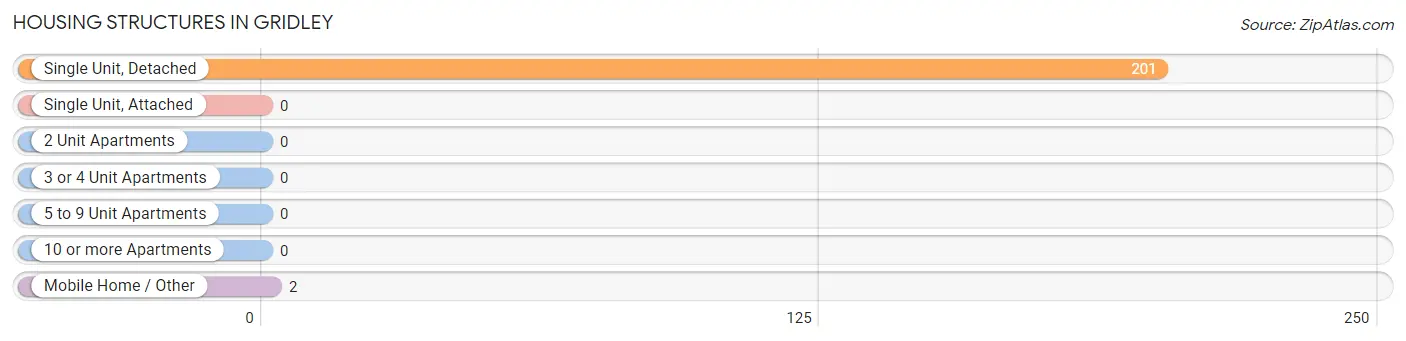
| Structure Type | # Housing Units | % Housing Units |
| Single Unit, Detached | 201 | 99.0% |
| Single Unit, Attached | 0 | 0.0% |
| 2 Unit Apartments | 0 | 0.0% |
| 3 or 4 Unit Apartments | 0 | 0.0% |
| 5 to 9 Unit Apartments | 0 | 0.0% |
| 10 or more Apartments | 0 | 0.0% |
| Mobile Home / Other | 2 | 1.0% |
| Total | 203 | 100.0% |
Housing Structures by Occupancy in Gridley
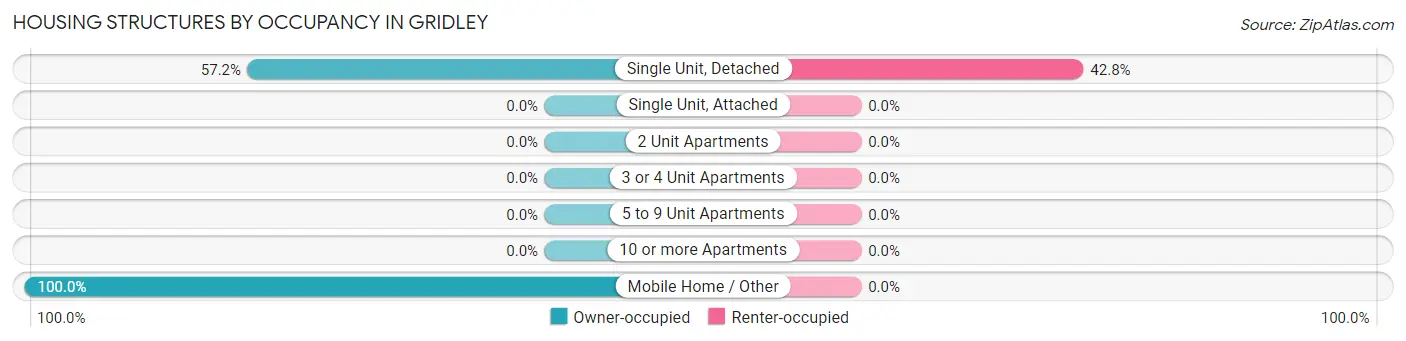
| Structure Type | Owner-occupied | Renter-occupied |
| Single Unit, Detached | 115 (57.2%) | 86 (42.8%) |
| Single Unit, Attached | 0 (0.0%) | 0 (0.0%) |
| 2 Unit Apartments | 0 (0.0%) | 0 (0.0%) |
| 3 or 4 Unit Apartments | 0 (0.0%) | 0 (0.0%) |
| 5 to 9 Unit Apartments | 0 (0.0%) | 0 (0.0%) |
| 10 or more Apartments | 0 (0.0%) | 0 (0.0%) |
| Mobile Home / Other | 2 (100.0%) | 0 (0.0%) |
| Total | 117 (57.6%) | 86 (42.4%) |
Housing Structures by Number of Rooms in Gridley
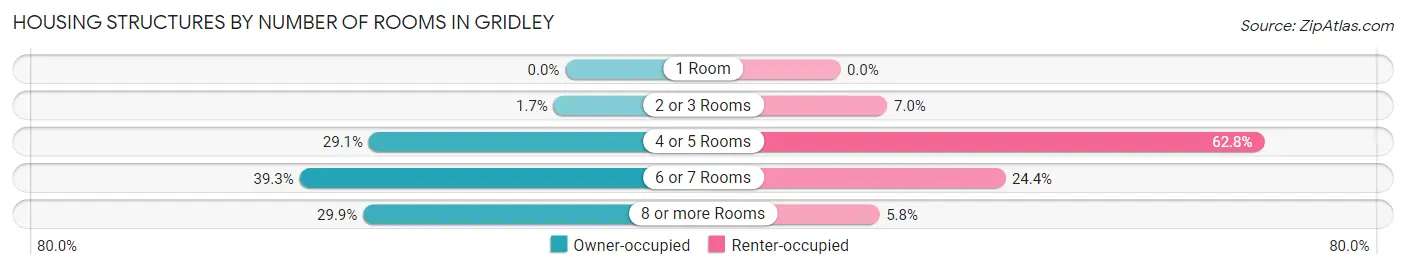
| Number of Rooms | Owner-occupied | Renter-occupied |
| 1 Room | 0 (0.0%) | 0 (0.0%) |
| 2 or 3 Rooms | 2 (1.7%) | 6 (7.0%) |
| 4 or 5 Rooms | 34 (29.1%) | 54 (62.8%) |
| 6 or 7 Rooms | 46 (39.3%) | 21 (24.4%) |
| 8 or more Rooms | 35 (29.9%) | 5 (5.8%) |
| Total | 117 (100.0%) | 86 (100.0%) |
Housing Structure by Heating Type in Gridley
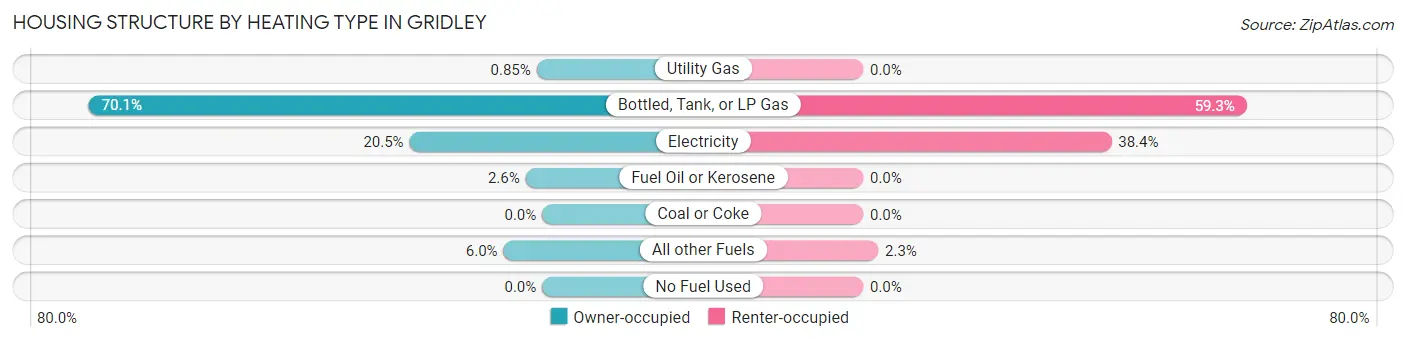
| Heating Type | Owner-occupied | Renter-occupied |
| Utility Gas | 1 (0.9%) | 0 (0.0%) |
| Bottled, Tank, or LP Gas | 82 (70.1%) | 51 (59.3%) |
| Electricity | 24 (20.5%) | 33 (38.4%) |
| Fuel Oil or Kerosene | 3 (2.6%) | 0 (0.0%) |
| Coal or Coke | 0 (0.0%) | 0 (0.0%) |
| All other Fuels | 7 (6.0%) | 2 (2.3%) |
| No Fuel Used | 0 (0.0%) | 0 (0.0%) |
| Total | 117 (100.0%) | 86 (100.0%) |
Household Vehicle Usage in Gridley
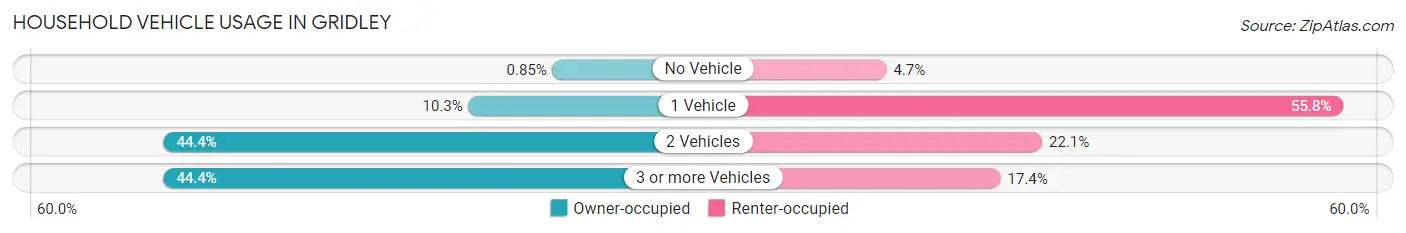
| Vehicles per Household | Owner-occupied | Renter-occupied |
| No Vehicle | 1 (0.9%) | 4 (4.6%) |
| 1 Vehicle | 12 (10.3%) | 48 (55.8%) |
| 2 Vehicles | 52 (44.4%) | 19 (22.1%) |
| 3 or more Vehicles | 52 (44.4%) | 15 (17.4%) |
| Total | 117 (100.0%) | 86 (100.0%) |
Real Estate & Mortgages in Gridley
Real Estate and Mortgage Overview in Gridley
| Characteristic | Without Mortgage | With Mortgage |
| Housing Units | 80 | 37 |
| Median Property Value | $76,900 | $93,000 |
| Median Household Income | $65,000 | $1 |
| Monthly Housing Costs | $478 | $0 |
| Real Estate Taxes | $1,031 | $0 |
Property Value by Mortgage Status in Gridley
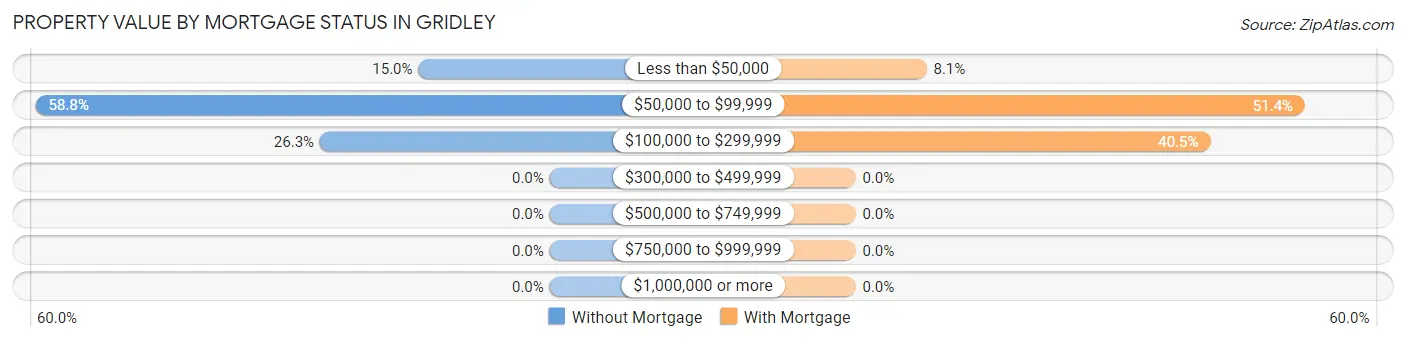
| Property Value | Without Mortgage | With Mortgage |
| Less than $50,000 | 12 (15.0%) | 3 (8.1%) |
| $50,000 to $99,999 | 47 (58.8%) | 19 (51.3%) |
| $100,000 to $299,999 | 21 (26.3%) | 15 (40.5%) |
| $300,000 to $499,999 | 0 (0.0%) | 0 (0.0%) |
| $500,000 to $749,999 | 0 (0.0%) | 0 (0.0%) |
| $750,000 to $999,999 | 0 (0.0%) | 0 (0.0%) |
| $1,000,000 or more | 0 (0.0%) | 0 (0.0%) |
| Total | 80 (100.0%) | 37 (100.0%) |
Household Income by Mortgage Status in Gridley
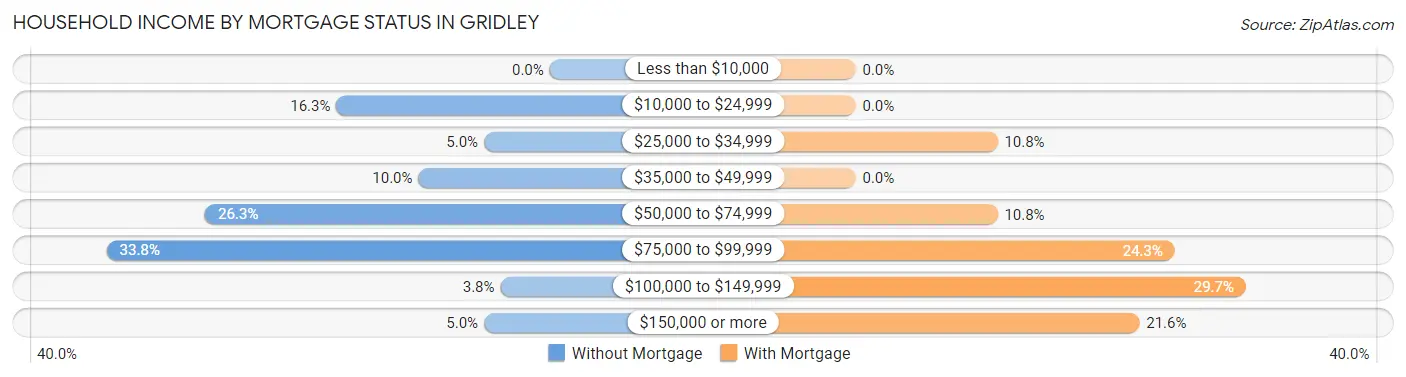
| Household Income | Without Mortgage | With Mortgage |
| Less than $10,000 | 0 (0.0%) | 0 (0.0%) |
| $10,000 to $24,999 | 13 (16.3%) | 0 (0.0%) |
| $25,000 to $34,999 | 4 (5.0%) | 4 (10.8%) |
| $35,000 to $49,999 | 8 (10.0%) | 0 (0.0%) |
| $50,000 to $74,999 | 21 (26.3%) | 4 (10.8%) |
| $75,000 to $99,999 | 27 (33.8%) | 9 (24.3%) |
| $100,000 to $149,999 | 3 (3.7%) | 11 (29.7%) |
| $150,000 or more | 4 (5.0%) | 8 (21.6%) |
| Total | 80 (100.0%) | 37 (100.0%) |
Property Value to Household Income Ratio in Gridley
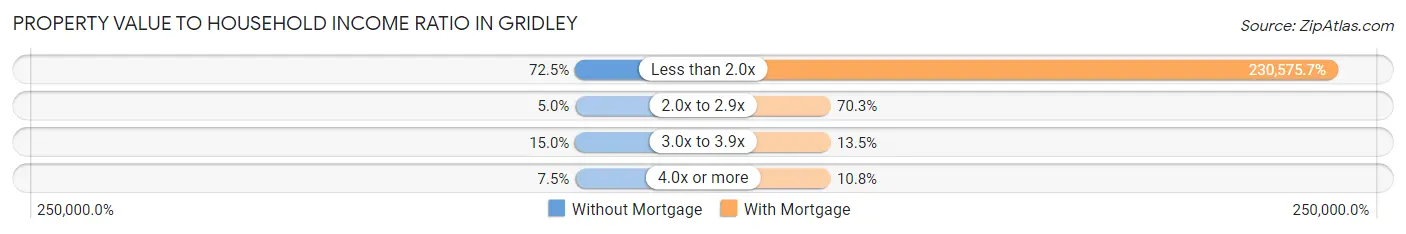
| Value-to-Income Ratio | Without Mortgage | With Mortgage |
| Less than 2.0x | 58 (72.5%) | 85,313 (230,575.7%) |
| 2.0x to 2.9x | 4 (5.0%) | 26 (70.3%) |
| 3.0x to 3.9x | 12 (15.0%) | 5 (13.5%) |
| 4.0x or more | 6 (7.5%) | 4 (10.8%) |
| Total | 80 (100.0%) | 37 (100.0%) |
Real Estate Taxes by Mortgage Status in Gridley
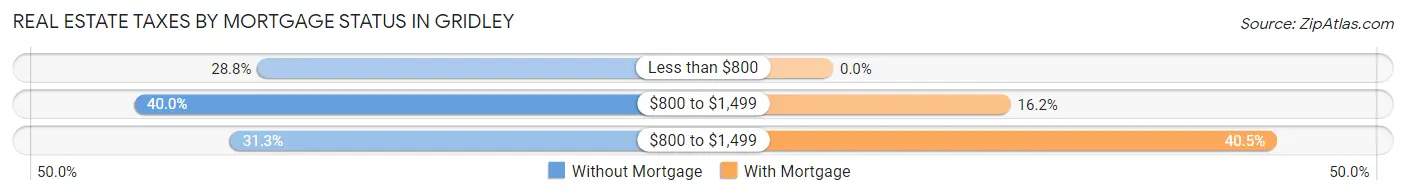
| Property Taxes | Without Mortgage | With Mortgage |
| Less than $800 | 23 (28.7%) | 0 (0.0%) |
| $800 to $1,499 | 32 (40.0%) | 6 (16.2%) |
| $800 to $1,499 | 25 (31.2%) | 15 (40.5%) |
| Total | 80 (100.0%) | 37 (100.0%) |
Health & Disability in Gridley
Health Insurance Coverage by Age in Gridley
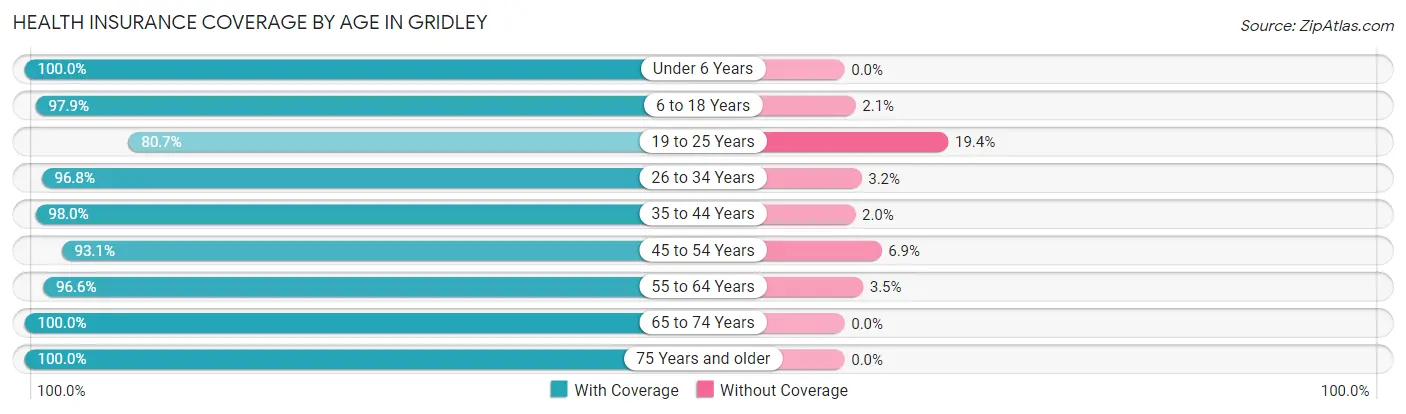
| Age Bracket | With Coverage | Without Coverage |
| Under 6 Years | 14 (100.0%) | 0 (0.0%) |
| 6 to 18 Years | 95 (97.9%) | 2 (2.1%) |
| 19 to 25 Years | 25 (80.6%) | 6 (19.4%) |
| 26 to 34 Years | 61 (96.8%) | 2 (3.2%) |
| 35 to 44 Years | 49 (98.0%) | 1 (2.0%) |
| 45 to 54 Years | 27 (93.1%) | 2 (6.9%) |
| 55 to 64 Years | 28 (96.6%) | 1 (3.5%) |
| 65 to 74 Years | 84 (100.0%) | 0 (0.0%) |
| 75 Years and older | 35 (100.0%) | 0 (0.0%) |
| Total | 418 (96.8%) | 14 (3.2%) |
Health Insurance Coverage by Citizenship Status in Gridley
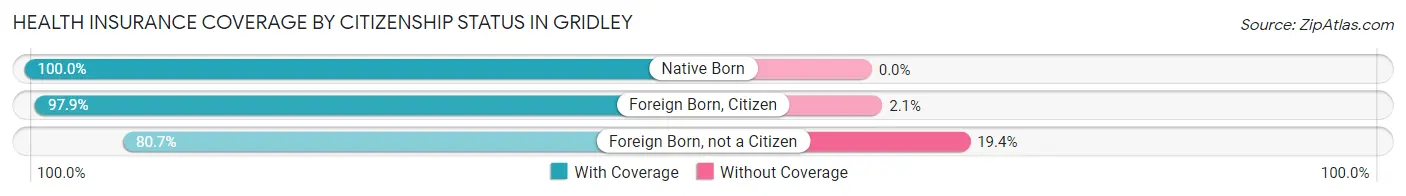
| Citizenship Status | With Coverage | Without Coverage |
| Native Born | 14 (100.0%) | 0 (0.0%) |
| Foreign Born, Citizen | 95 (97.9%) | 2 (2.1%) |
| Foreign Born, not a Citizen | 25 (80.6%) | 6 (19.4%) |
Health Insurance Coverage by Household Income in Gridley
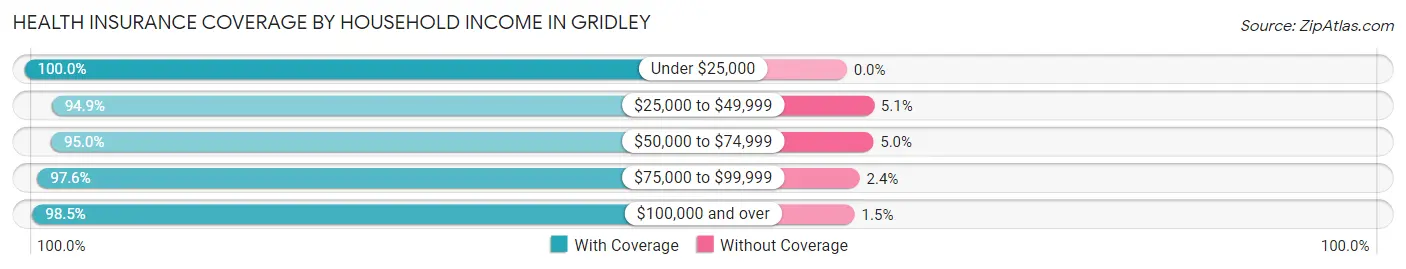
| Household Income | With Coverage | Without Coverage |
| Under $25,000 | 39 (100.0%) | 0 (0.0%) |
| $25,000 to $49,999 | 56 (94.9%) | 3 (5.1%) |
| $50,000 to $74,999 | 134 (95.0%) | 7 (5.0%) |
| $75,000 to $99,999 | 122 (97.6%) | 3 (2.4%) |
| $100,000 and over | 67 (98.5%) | 1 (1.5%) |
Public vs Private Health Insurance Coverage by Age in Gridley
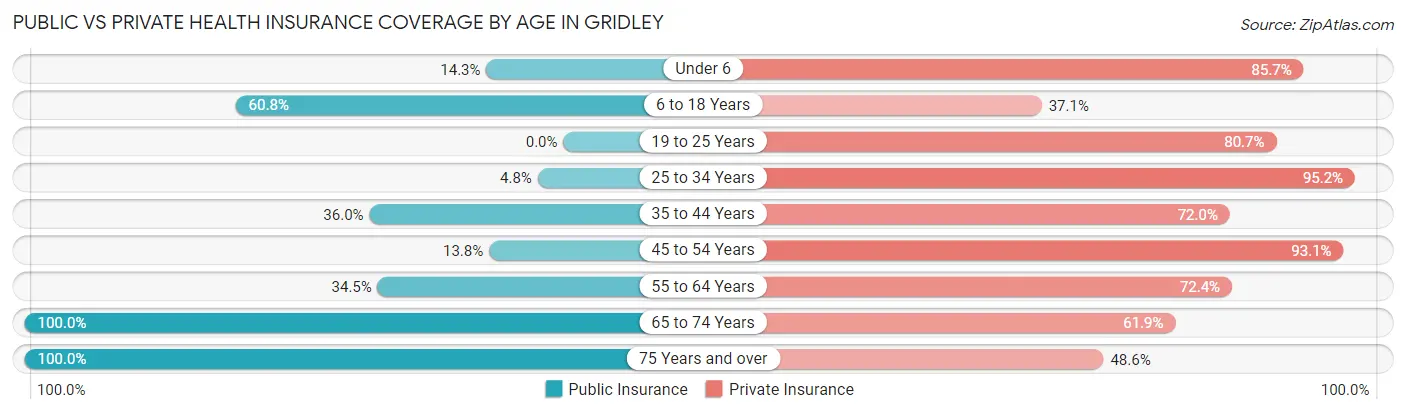
| Age Bracket | Public Insurance | Private Insurance |
| Under 6 | 2 (14.3%) | 12 (85.7%) |
| 6 to 18 Years | 59 (60.8%) | 36 (37.1%) |
| 19 to 25 Years | 0 (0.0%) | 25 (80.6%) |
| 25 to 34 Years | 3 (4.8%) | 60 (95.2%) |
| 35 to 44 Years | 18 (36.0%) | 36 (72.0%) |
| 45 to 54 Years | 4 (13.8%) | 27 (93.1%) |
| 55 to 64 Years | 10 (34.5%) | 21 (72.4%) |
| 65 to 74 Years | 84 (100.0%) | 52 (61.9%) |
| 75 Years and over | 35 (100.0%) | 17 (48.6%) |
| Total | 215 (49.8%) | 286 (66.2%) |
Disability Status by Sex by Age in Gridley
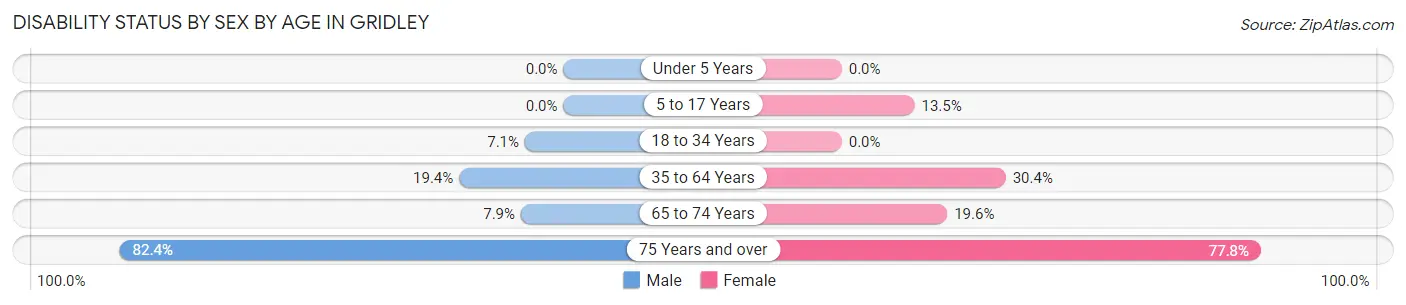
| Age Bracket | Male | Female |
| Under 5 Years | 0 (0.0%) | 0 (0.0%) |
| 5 to 17 Years | 0 (0.0%) | 10 (13.5%) |
| 18 to 34 Years | 3 (7.1%) | 0 (0.0%) |
| 35 to 64 Years | 12 (19.4%) | 14 (30.4%) |
| 65 to 74 Years | 3 (7.9%) | 9 (19.6%) |
| 75 Years and over | 14 (82.4%) | 14 (77.8%) |
Disability Class by Sex by Age in Gridley
Disability Class: Hearing Difficulty
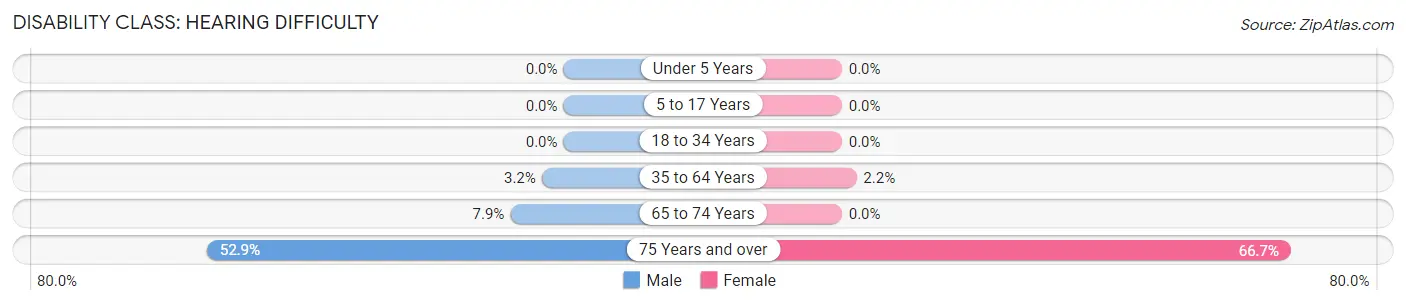
| Age Bracket | Male | Female |
| Under 5 Years | 0 (0.0%) | 0 (0.0%) |
| 5 to 17 Years | 0 (0.0%) | 0 (0.0%) |
| 18 to 34 Years | 0 (0.0%) | 0 (0.0%) |
| 35 to 64 Years | 2 (3.2%) | 1 (2.2%) |
| 65 to 74 Years | 3 (7.9%) | 0 (0.0%) |
| 75 Years and over | 9 (52.9%) | 12 (66.7%) |
Disability Class: Vision Difficulty
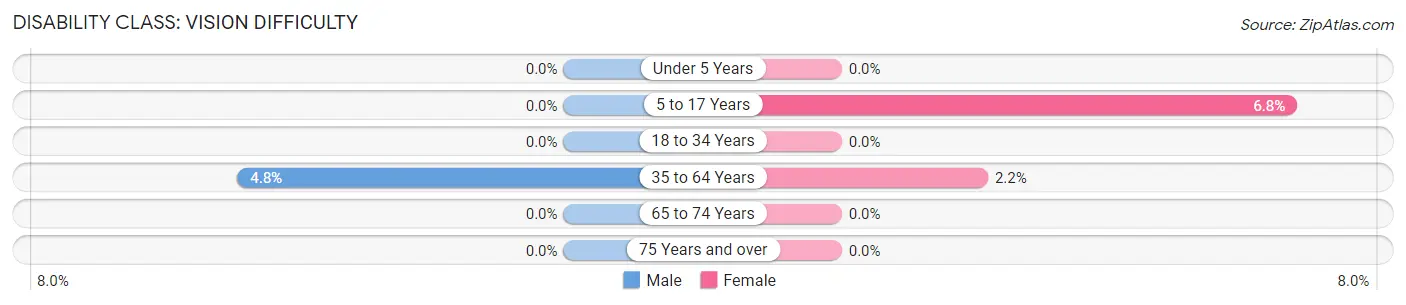
| Age Bracket | Male | Female |
| Under 5 Years | 0 (0.0%) | 0 (0.0%) |
| 5 to 17 Years | 0 (0.0%) | 5 (6.8%) |
| 18 to 34 Years | 0 (0.0%) | 0 (0.0%) |
| 35 to 64 Years | 3 (4.8%) | 1 (2.2%) |
| 65 to 74 Years | 0 (0.0%) | 0 (0.0%) |
| 75 Years and over | 0 (0.0%) | 0 (0.0%) |
Disability Class: Cognitive Difficulty
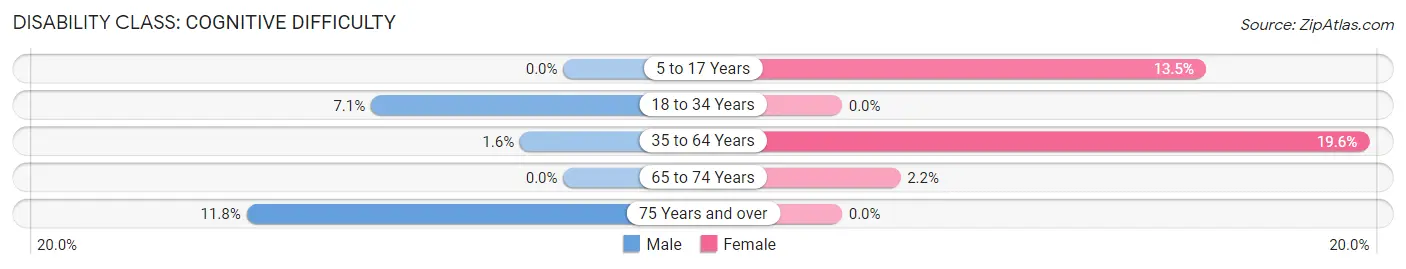
| Age Bracket | Male | Female |
| 5 to 17 Years | 0 (0.0%) | 10 (13.5%) |
| 18 to 34 Years | 3 (7.1%) | 0 (0.0%) |
| 35 to 64 Years | 1 (1.6%) | 9 (19.6%) |
| 65 to 74 Years | 0 (0.0%) | 1 (2.2%) |
| 75 Years and over | 2 (11.8%) | 0 (0.0%) |
Disability Class: Ambulatory Difficulty
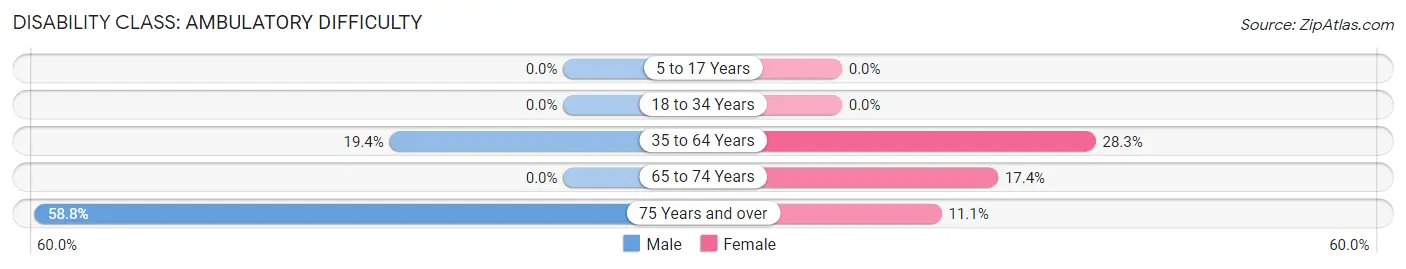
| Age Bracket | Male | Female |
| 5 to 17 Years | 0 (0.0%) | 0 (0.0%) |
| 18 to 34 Years | 0 (0.0%) | 0 (0.0%) |
| 35 to 64 Years | 12 (19.4%) | 13 (28.3%) |
| 65 to 74 Years | 0 (0.0%) | 8 (17.4%) |
| 75 Years and over | 10 (58.8%) | 2 (11.1%) |
Disability Class: Self-Care Difficulty
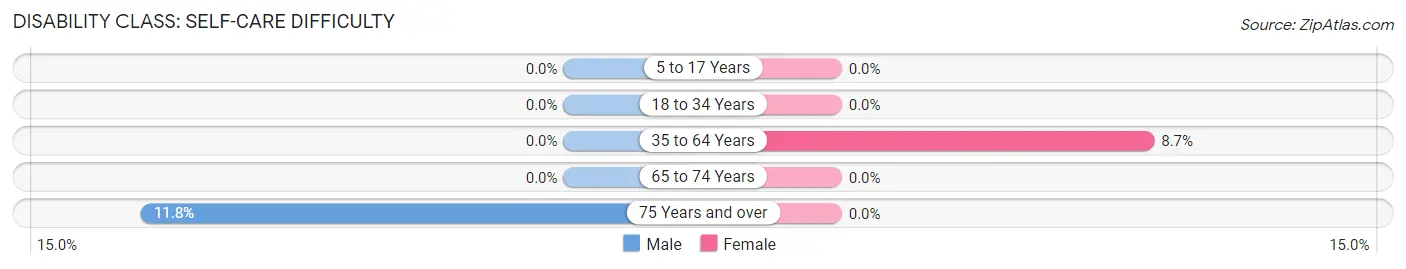
| Age Bracket | Male | Female |
| 5 to 17 Years | 0 (0.0%) | 0 (0.0%) |
| 18 to 34 Years | 0 (0.0%) | 0 (0.0%) |
| 35 to 64 Years | 0 (0.0%) | 4 (8.7%) |
| 65 to 74 Years | 0 (0.0%) | 0 (0.0%) |
| 75 Years and over | 2 (11.8%) | 0 (0.0%) |
Technology Access in Gridley
Computing Device Access in Gridley
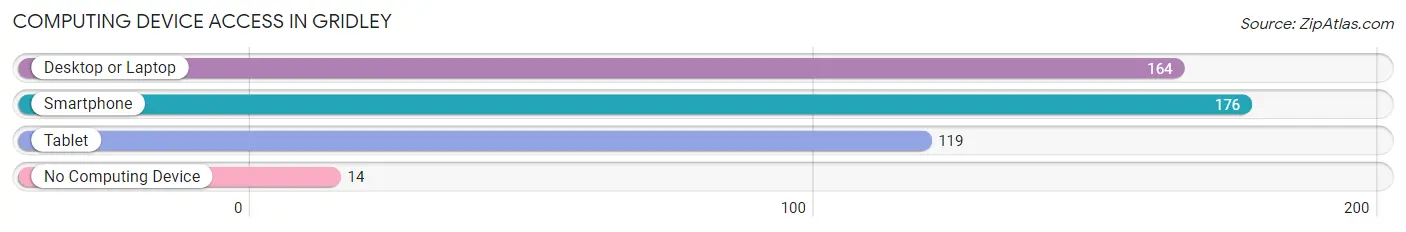
| Device Type | # Households | % Households |
| Desktop or Laptop | 164 | 80.8% |
| Smartphone | 176 | 86.7% |
| Tablet | 119 | 58.6% |
| No Computing Device | 14 | 6.9% |
| Total | 203 | 100.0% |
Internet Access in Gridley
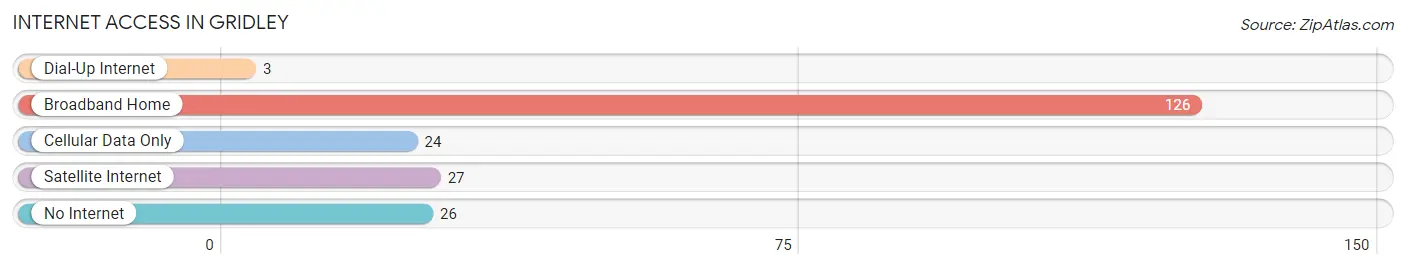
| Internet Type | # Households | % Households |
| Dial-Up Internet | 3 | 1.5% |
| Broadband Home | 126 | 62.1% |
| Cellular Data Only | 24 | 11.8% |
| Satellite Internet | 27 | 13.3% |
| No Internet | 26 | 12.8% |
| Total | 203 | 100.0% |
Gridley Summary
History
The small town of Gridley, Kansas is located in the southeastern corner of the state, in the county of Coffey. It is situated on the banks of the Neosho River, and is surrounded by rolling hills and lush farmland. The town was founded in 1871 by a group of settlers from Ohio, led by William Gridley. The town was named after him, and it quickly grew into a thriving agricultural community.
Gridley was an important stop on the Santa Fe Trail, and it was also a major stop on the Missouri Pacific Railroad. The town was a popular destination for travelers, and it was also a major trading center for the surrounding area.
In the early 1900s, Gridley was a bustling town with a population of over 1,000 people. It had a variety of businesses, including a bank, a hotel, a general store, a blacksmith, a livery stable, and a post office. The town also had a school, a church, and a newspaper.
The town continued to grow and prosper until the Great Depression hit in the 1930s. The town’s population declined, and many of the businesses closed. The town was able to survive, however, and it continued to be an important agricultural center.
In the 1950s, the town began to experience a resurgence. The population increased, and new businesses opened. The town also became a popular tourist destination, as it was located near several lakes and rivers.
Today, Gridley is a small town with a population of just over 500 people. It is still an important agricultural center, and it is also a popular tourist destination. The town is home to several historic buildings, including the Gridley Hotel, which was built in 1871.
Geography
Gridley is located in the southeastern corner of Kansas, in the county of Coffey. It is situated on the banks of the Neosho River, and is surrounded by rolling hills and lush farmland. The town is located about 30 miles south of the city of Topeka, and about 50 miles west of the city of Kansas City.
The town is located in a temperate climate, with hot summers and cold winters. The average temperature in the summer is around 80 degrees Fahrenheit, and the average temperature in the winter is around 40 degrees Fahrenheit. The town receives an average of about 40 inches of precipitation each year.
Economy
Gridley’s economy is largely based on agriculture. The town is home to several farms, and the surrounding area is known for its production of corn, soybeans, wheat, and other crops. The town is also home to several businesses, including a bank, a hotel, a general store, a blacksmith, a livery stable, and a post office.
The town is also home to several tourist attractions, including the Gridley Hotel, which was built in 1871. The town is also home to several parks, including the Gridley Park, which is located on the banks of the Neosho River.
Demographics
As of the 2010 census, the population of Gridley was 514 people. The town is predominantly white, with about 95% of the population being white. The median age of the population is 44 years old, and the median household income is $41,250. The town has a poverty rate of about 15%, which is slightly higher than the national average.
Common Questions
What is Per Capita Income in Gridley?
Per Capita income in Gridley is $28,456.
What is the Median Family Income in Gridley?
Median Family Income in Gridley is $71,250.
What is the Median Household income in Gridley?
Median Household Income in Gridley is $55,865.
What is Income or Wage Gap in Gridley?
Income or Wage Gap in Gridley is 41.4%.
Women in Gridley earn 58.6 cents for every dollar earned by a man.
What is Inequality or Gini Index in Gridley?
Inequality or Gini Index in Gridley is 0.33.
What is the Total Population of Gridley?
Total Population of Gridley is 432.
What is the Total Male Population of Gridley?
Total Male Population of Gridley is 191.
What is the Total Female Population of Gridley?
Total Female Population of Gridley is 241.
What is the Ratio of Males per 100 Females in Gridley?
There are 79.25 Males per 100 Females in Gridley.
What is the Ratio of Females per 100 Males in Gridley?
There are 126.18 Females per 100 Males in Gridley.
What is the Median Population Age in Gridley?
Median Population Age in Gridley is 38.0 Years.
What is the Average Family Size in Gridley
Average Family Size in Gridley is 2.9 People.
What is the Average Household Size in Gridley
Average Household Size in Gridley is 2.1 People.
How Large is the Labor Force in Gridley?
There are 217 People in the Labor Forcein in Gridley.
What is the Percentage of People in the Labor Force in Gridley?
64.6% of People are in the Labor Force in Gridley.
What is the Unemployment Rate in Gridley?
Unemployment Rate in Gridley is 0.9%.