Green, KS Map & Demographics
Green Map
Green Overview
$24,951
PER CAPITA INCOME
$75,833
AVG FAMILY INCOME
$52,500
AVG HOUSEHOLD INCOME
16.1%
WAGE / INCOME GAP [ % ]
83.9¢/ $1
WAGE / INCOME GAP [ $ ]
0.36
INEQUALITY / GINI INDEX
105
TOTAL POPULATION
49
MALE POPULATION
56
FEMALE POPULATION
87.50
MALES / 100 FEMALES
114.29
FEMALES / 100 MALES
27.5
MEDIAN AGE
3.6
AVG FAMILY SIZE
2.9
AVG HOUSEHOLD SIZE
57
LABOR FORCE [ PEOPLE ]
81.4%
PERCENT IN LABOR FORCE
Green Zip Codes
Green Area Codes
Income in Green
Income Overview in Green
Per Capita Income in Green is $24,951, while median incomes of families and households are $75,833 and $52,500 respectively.
| Characteristic | Number | Measure |
| Per Capita Income | 105 | $24,951 |
| Median Family Income | 26 | $75,833 |
| Mean Family Income | 26 | $70,985 |
| Median Household Income | 36 | $52,500 |
| Mean Household Income | 36 | $66,828 |
| Income Deficit | 26 | $0 |
| Wage / Income Gap (%) | 105 | 16.11% |
| Wage / Income Gap ($) | 105 | 83.89¢ per $1 |
| Gini / Inequality Index | 105 | 0.36 |
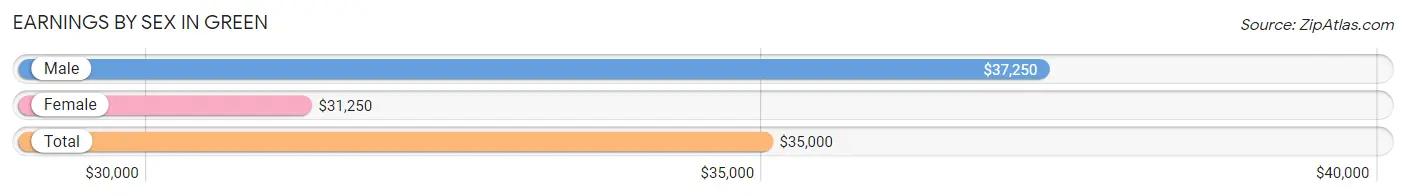
Earnings by Sex in Green
Average Earnings in Green are $35,000, $37,250 for men and $31,250 for women, a difference of 16.1%.
| Sex | Number | Average Earnings |
| Male | 35 (60.3%) | $37,250 |
| Female | 23 (39.7%) | $31,250 |
| Total | 58 (100.0%) | $35,000 |
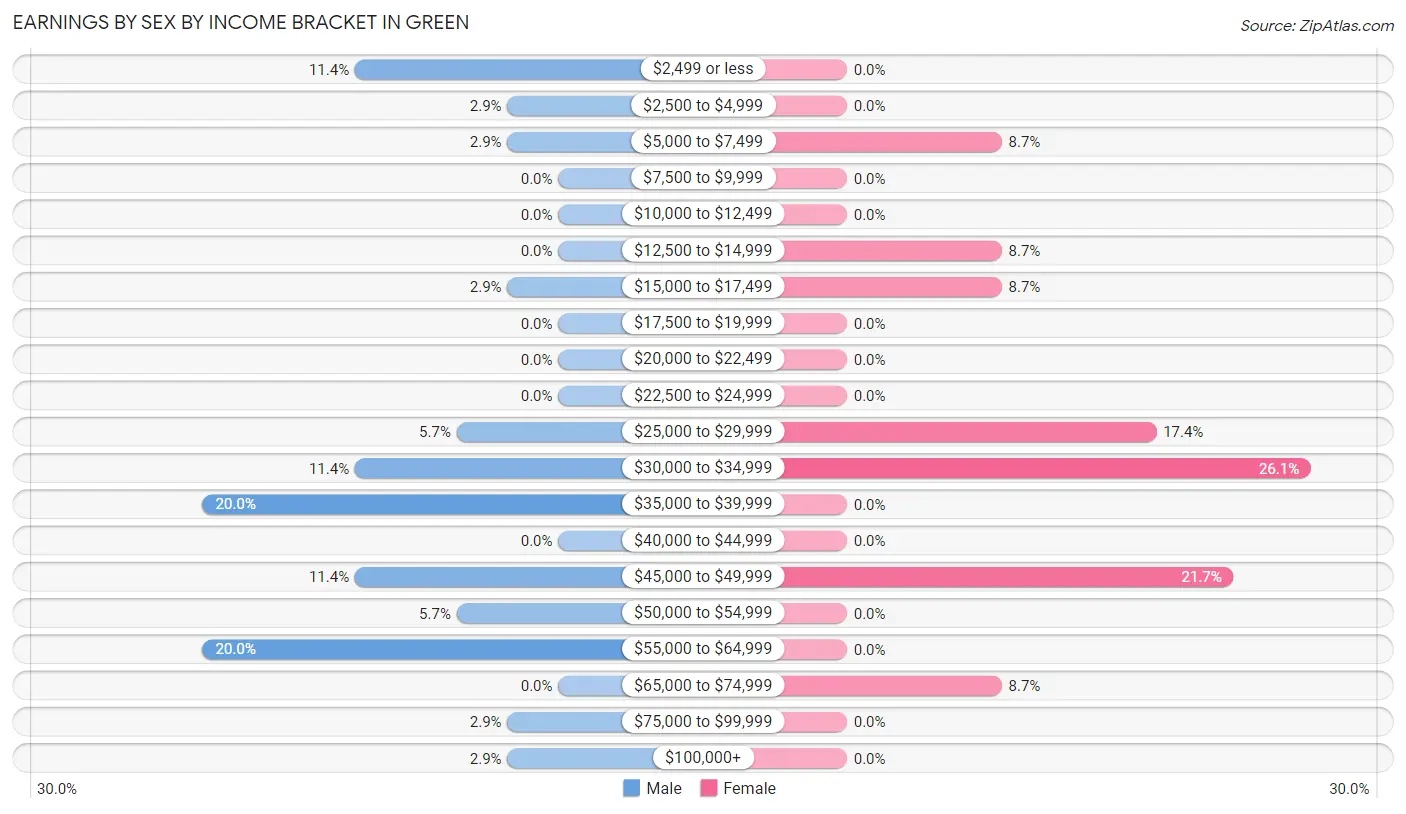
Earnings by Sex by Income Bracket in Green
The most common earnings brackets in Green are $35,000 to $39,999 for men (7 | 20.0%) and $30,000 to $34,999 for women (6 | 26.1%).
| Income | Male | Female |
| $2,499 or less | 4 (11.4%) | 0 (0.0%) |
| $2,500 to $4,999 | 1 (2.9%) | 0 (0.0%) |
| $5,000 to $7,499 | 1 (2.9%) | 2 (8.7%) |
| $7,500 to $9,999 | 0 (0.0%) | 0 (0.0%) |
| $10,000 to $12,499 | 0 (0.0%) | 0 (0.0%) |
| $12,500 to $14,999 | 0 (0.0%) | 2 (8.7%) |
| $15,000 to $17,499 | 1 (2.9%) | 2 (8.7%) |
| $17,500 to $19,999 | 0 (0.0%) | 0 (0.0%) |
| $20,000 to $22,499 | 0 (0.0%) | 0 (0.0%) |
| $22,500 to $24,999 | 0 (0.0%) | 0 (0.0%) |
| $25,000 to $29,999 | 2 (5.7%) | 4 (17.4%) |
| $30,000 to $34,999 | 4 (11.4%) | 6 (26.1%) |
| $35,000 to $39,999 | 7 (20.0%) | 0 (0.0%) |
| $40,000 to $44,999 | 0 (0.0%) | 0 (0.0%) |
| $45,000 to $49,999 | 4 (11.4%) | 5 (21.7%) |
| $50,000 to $54,999 | 2 (5.7%) | 0 (0.0%) |
| $55,000 to $64,999 | 7 (20.0%) | 0 (0.0%) |
| $65,000 to $74,999 | 0 (0.0%) | 2 (8.7%) |
| $75,000 to $99,999 | 1 (2.9%) | 0 (0.0%) |
| $100,000+ | 1 (2.9%) | 0 (0.0%) |
| Total | 35 (100.0%) | 23 (100.0%) |
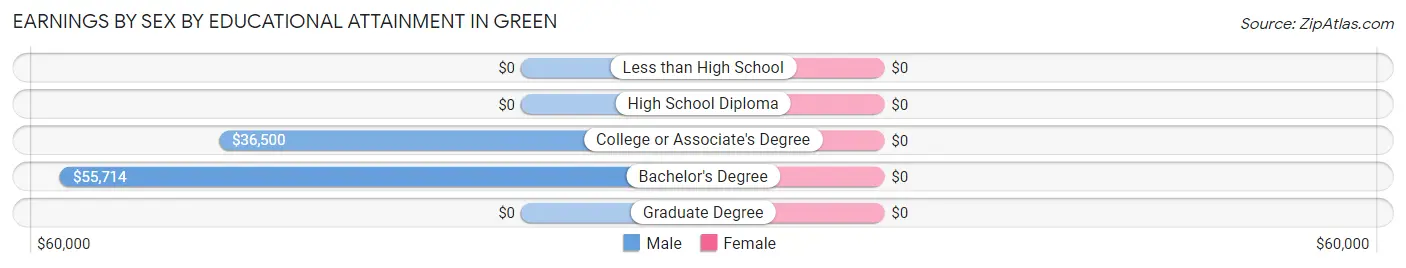
Earnings by Sex by Educational Attainment in Green
| Educational Attainment | Male Income | Female Income |
| Less than High School | - | - |
| High School Diploma | - | - |
| College or Associate's Degree | $36,500 | $0 |
| Bachelor's Degree | $55,714 | $0 |
| Graduate Degree | - | - |
| Total | $45,938 | $32,917 |
Family Income in Green
Family Income Brackets in Green
According to the Green family income data, there are 9 families falling into the $35,000 to $49,999 income range, which is the most common income bracket and makes up 34.6% of all families.
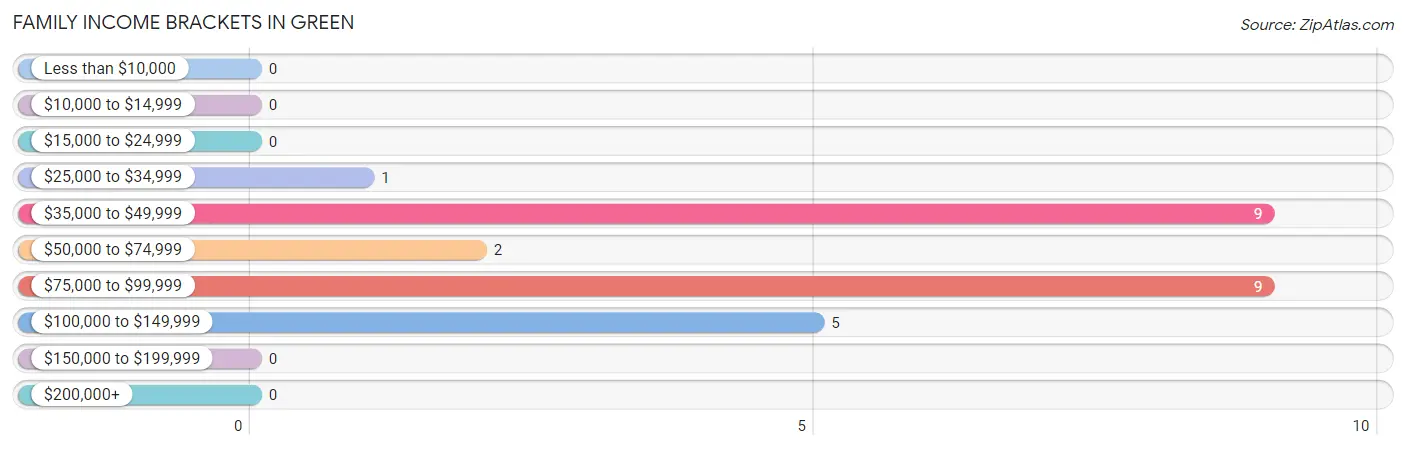
| Income Bracket | # Families | % Families |
| Less than $10,000 | 0 | 0.0% |
| $10,000 to $14,999 | 0 | 0.0% |
| $15,000 to $24,999 | 0 | 0.0% |
| $25,000 to $34,999 | 1 | 3.8% |
| $35,000 to $49,999 | 9 | 34.6% |
| $50,000 to $74,999 | 2 | 7.7% |
| $75,000 to $99,999 | 9 | 34.6% |
| $100,000 to $149,999 | 5 | 19.2% |
| $150,000 to $199,999 | 0 | 0.0% |
| $200,000+ | 0 | 0.0% |
Family Income by Famaliy Size in Green
3-person families (7 | 26.9%) account for the highest median family income in Green with $91,750 per family, while 3-person families (7 | 26.9%) have the highest median income of $30,583 per family member.
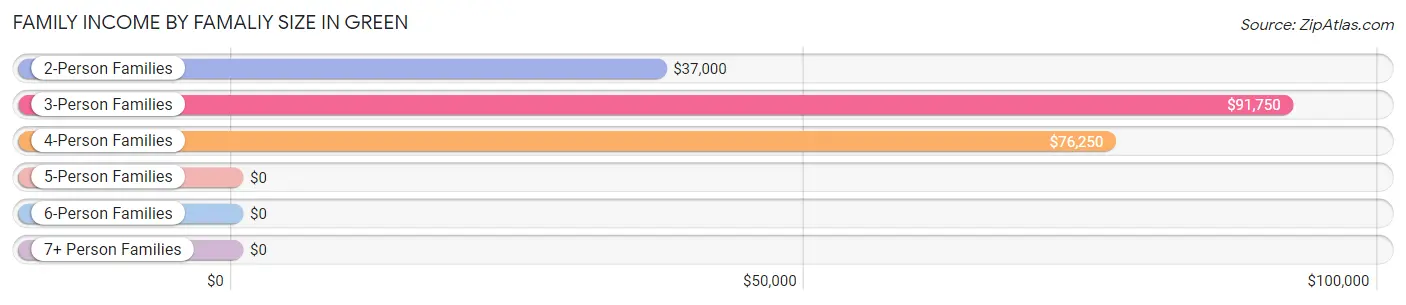
| Income Bracket | # Families | Median Income |
| 2-Person Families | 10 (38.5%) | $37,000 |
| 3-Person Families | 7 (26.9%) | $91,750 |
| 4-Person Families | 9 (34.6%) | $76,250 |
| 5-Person Families | 0 (0.0%) | $0 |
| 6-Person Families | 0 (0.0%) | $0 |
| 7+ Person Families | 0 (0.0%) | $0 |
| Total | 26 (100.0%) | $75,833 |
Family Income by Number of Earners in Green
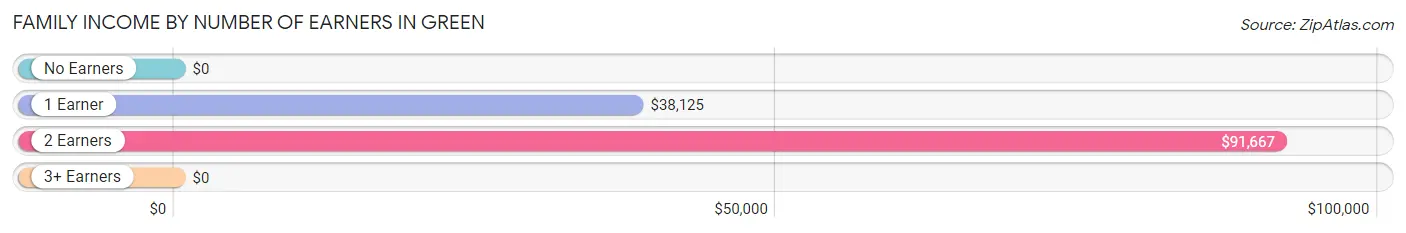
| Number of Earners | # Families | Median Income |
| No Earners | 1 (3.8%) | $0 |
| 1 Earner | 11 (42.3%) | $38,125 |
| 2 Earners | 10 (38.5%) | $91,667 |
| 3+ Earners | 4 (15.4%) | $0 |
| Total | 26 (100.0%) | $75,833 |
Household Income in Green
Household Income Brackets in Green
With 9 households falling in the category, the $35,000 to $49,999 income range is the most frequent in Green, accounting for 25.0% of all households.
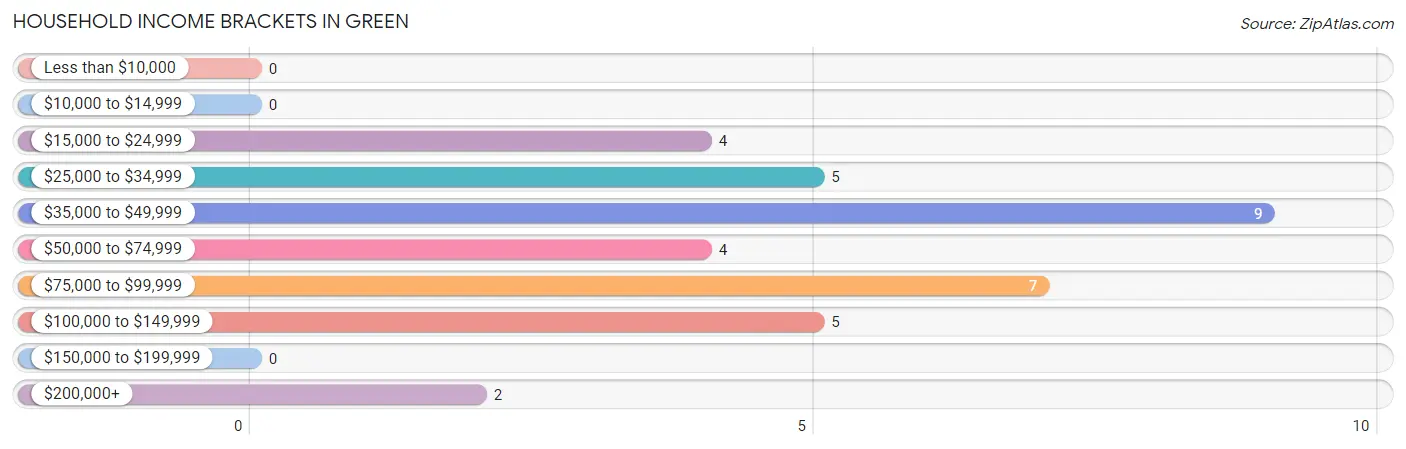
| Income Bracket | # Households | % Households |
| Less than $10,000 | 0 | 0.0% |
| $10,000 to $14,999 | 0 | 0.0% |
| $15,000 to $24,999 | 4 | 11.1% |
| $25,000 to $34,999 | 5 | 13.9% |
| $35,000 to $49,999 | 9 | 25.0% |
| $50,000 to $74,999 | 4 | 11.1% |
| $75,000 to $99,999 | 7 | 19.4% |
| $100,000 to $149,999 | 5 | 13.9% |
| $150,000 to $199,999 | 0 | 0.0% |
| $200,000+ | 2 | 5.6% |
Household Income by Householder Age in Green
The median household income in Green is $52,500, with the highest median household income of $75,417 found in the 45 to 64 years age bracket for the primary householder. A total of 15 households (41.7%) fall into this category. Meanwhile, the 15 to 24 years age bracket for the primary householder has the lowest median household income of $0, with 4 households (11.1%) in this group.
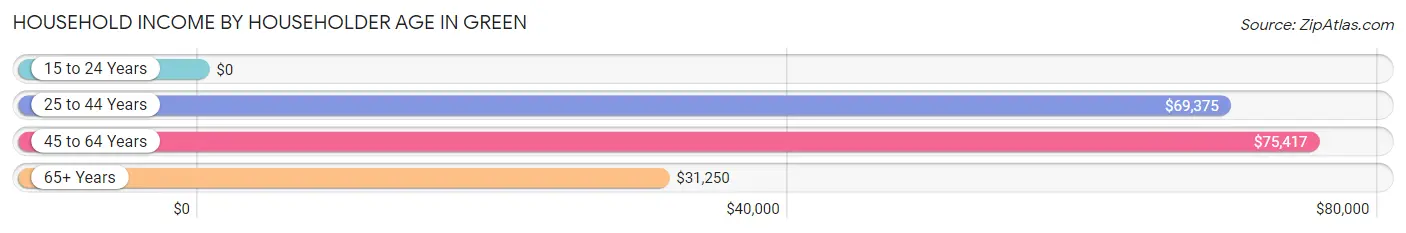
| Income Bracket | # Households | Median Income |
| 15 to 24 Years | 4 (11.1%) | $0 |
| 25 to 44 Years | 13 (36.1%) | $69,375 |
| 45 to 64 Years | 15 (41.7%) | $75,417 |
| 65+ Years | 4 (11.1%) | $31,250 |
| Total | 36 (100.0%) | $52,500 |
Poverty in Green
Income Below Poverty by Sex and Age in Green
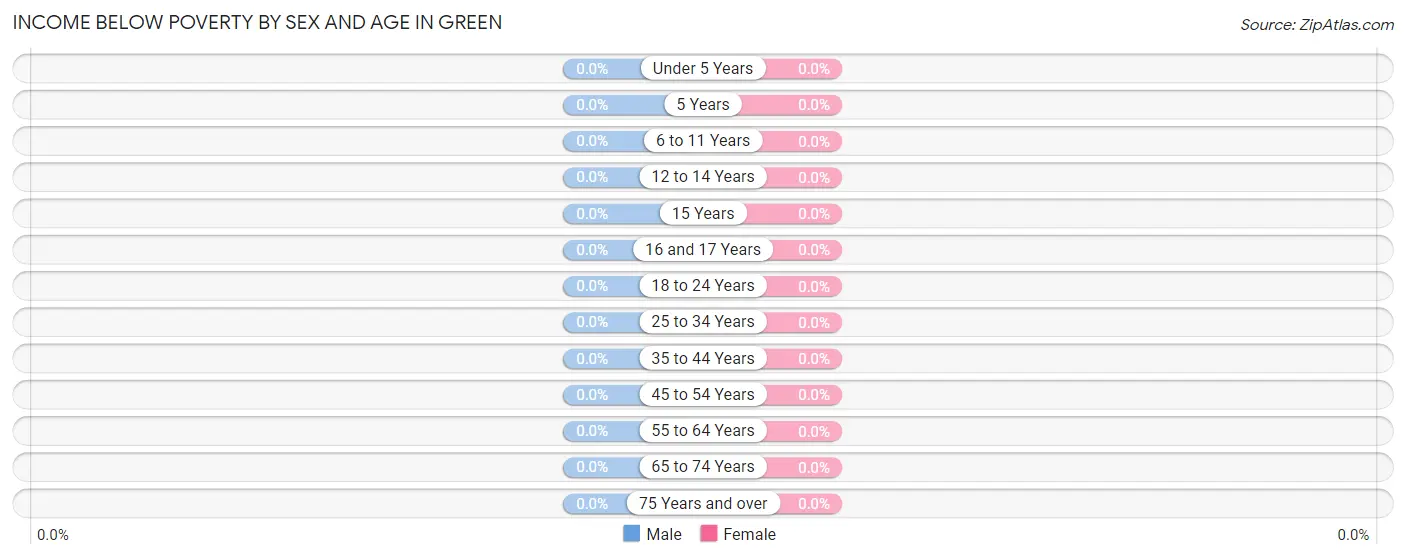
| Age Bracket | Male | Female |
| Under 5 Years | 0 (0.0%) | 0 (0.0%) |
| 5 Years | 0 (0.0%) | 0 (0.0%) |
| 6 to 11 Years | 0 (0.0%) | 0 (0.0%) |
| 12 to 14 Years | 0 (0.0%) | 0 (0.0%) |
| 15 Years | 0 (0.0%) | 0 (0.0%) |
| 16 and 17 Years | 0 (0.0%) | 0 (0.0%) |
| 18 to 24 Years | 0 (0.0%) | 0 (0.0%) |
| 25 to 34 Years | 0 (0.0%) | 0 (0.0%) |
| 35 to 44 Years | 0 (0.0%) | 0 (0.0%) |
| 45 to 54 Years | 0 (0.0%) | 0 (0.0%) |
| 55 to 64 Years | 0 (0.0%) | 0 (0.0%) |
| 65 to 74 Years | 0 (0.0%) | 0 (0.0%) |
| 75 Years and over | 0 (0.0%) | 0 (0.0%) |
| Total | 0 (0.0%) | 0 (0.0%) |
Income Above Poverty by Sex and Age in Green
According to the poverty statistics in Green, males aged under 5 years and females aged under 5 years are the age groups that are most secure financially, with 100.0% of males and 100.0% of females in these age groups living above the poverty line.
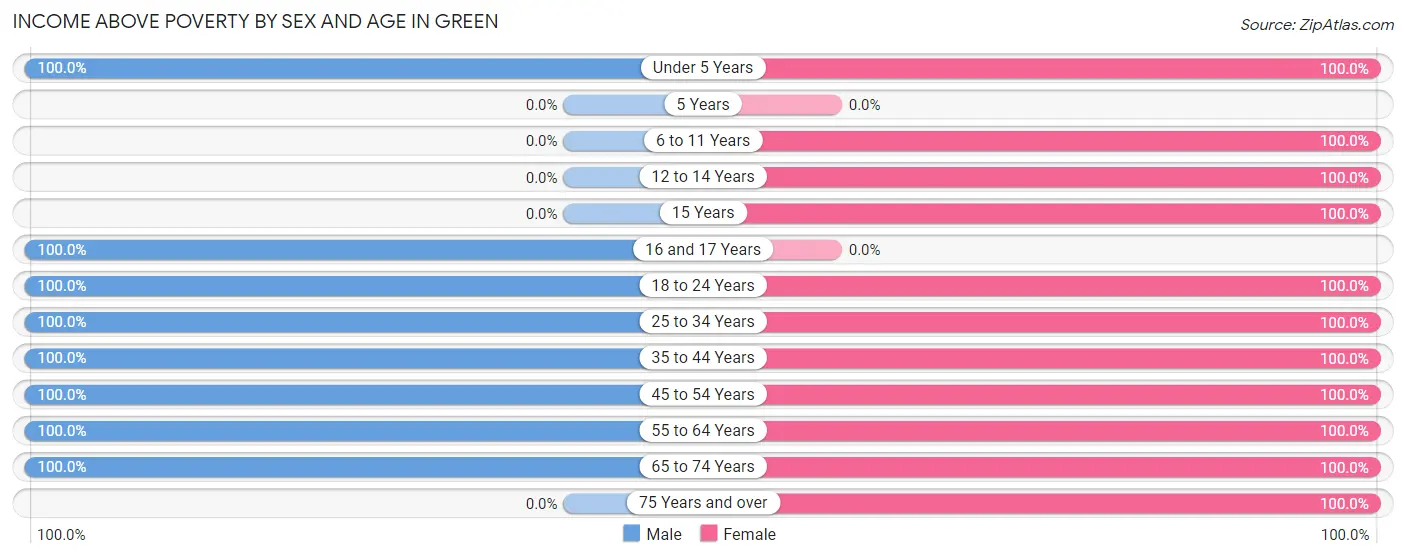
| Age Bracket | Male | Female |
| Under 5 Years | 7 (100.0%) | 12 (100.0%) |
| 5 Years | 0 (0.0%) | 0 (0.0%) |
| 6 to 11 Years | 0 (0.0%) | 14 (100.0%) |
| 12 to 14 Years | 0 (0.0%) | 1 (100.0%) |
| 15 Years | 0 (0.0%) | 1 (100.0%) |
| 16 and 17 Years | 5 (100.0%) | 0 (0.0%) |
| 18 to 24 Years | 3 (100.0%) | 4 (100.0%) |
| 25 to 34 Years | 4 (100.0%) | 8 (100.0%) |
| 35 to 44 Years | 10 (100.0%) | 2 (100.0%) |
| 45 to 54 Years | 12 (100.0%) | 9 (100.0%) |
| 55 to 64 Years | 5 (100.0%) | 2 (100.0%) |
| 65 to 74 Years | 3 (100.0%) | 1 (100.0%) |
| 75 Years and over | 0 (0.0%) | 2 (100.0%) |
| Total | 49 (100.0%) | 56 (100.0%) |
Income Below Poverty Among Married-Couple Families in Green
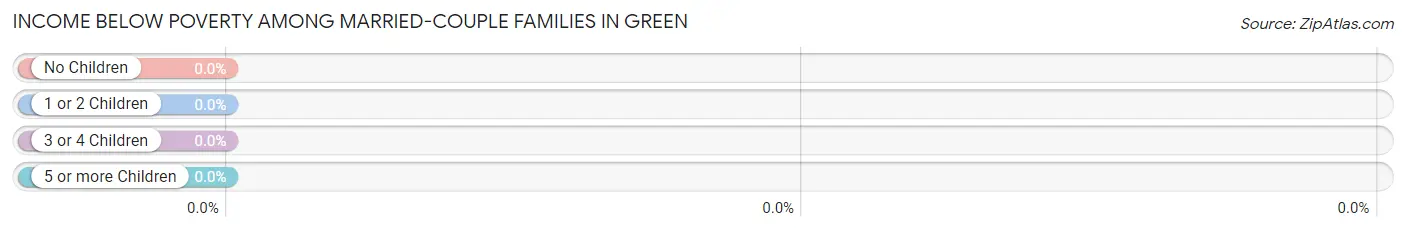
| Children | Above Poverty | Below Poverty |
| No Children | 5 (100.0%) | 0 (0.0%) |
| 1 or 2 Children | 12 (100.0%) | 0 (0.0%) |
| 3 or 4 Children | 0 (0.0%) | 0 (0.0%) |
| 5 or more Children | 0 (0.0%) | 0 (0.0%) |
| Total | 17 (100.0%) | 0 (0.0%) |
Income Below Poverty Among Single-Parent Households in Green
| Children | Single Father | Single Mother |
| No Children | 0 (0.0%) | 0 (0.0%) |
| 1 or 2 Children | 0 (0.0%) | 0 (0.0%) |
| 3 or 4 Children | 0 (0.0%) | 0 (0.0%) |
| 5 or more Children | 0 (0.0%) | 0 (0.0%) |
| Total | 0 (0.0%) | 0 (0.0%) |
Income Below Poverty Among Married-Couple vs Single-Parent Households in Green
| Children | Married-Couple Families | Single-Parent Households |
| No Children | 0 (0.0%) | 0 (0.0%) |
| 1 or 2 Children | 0 (0.0%) | 0 (0.0%) |
| 3 or 4 Children | 0 (0.0%) | 0 (0.0%) |
| 5 or more Children | 0 (0.0%) | 0 (0.0%) |
| Total | 0 (0.0%) | 0 (0.0%) |
Race in Green
The most populous races in Green are White / Caucasian (104 | 99.1%), and Two or more Races (1 | 0.9%).
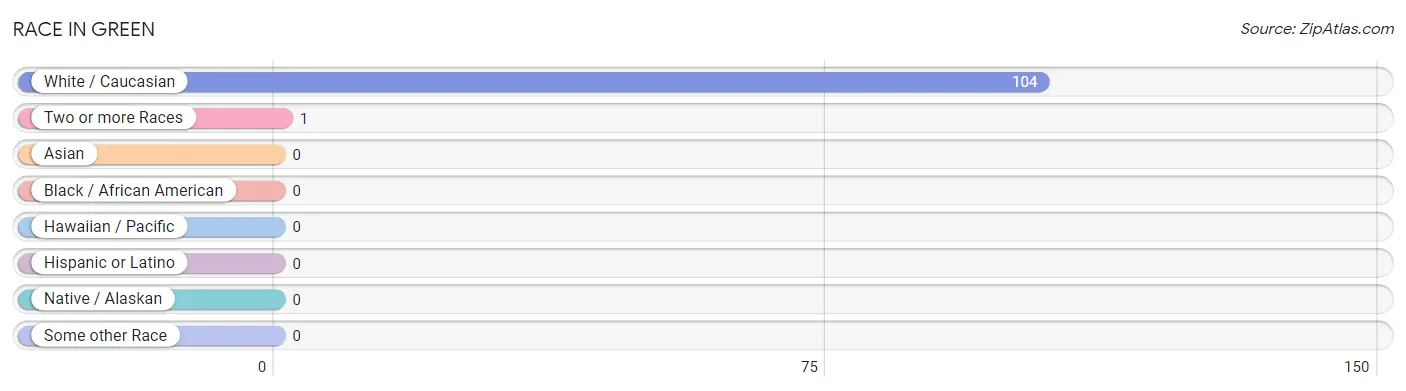
| Race | # Population | % Population |
| Asian | 0 | 0.0% |
| Black / African American | 0 | 0.0% |
| Hawaiian / Pacific | 0 | 0.0% |
| Hispanic or Latino | 0 | 0.0% |
| Native / Alaskan | 0 | 0.0% |
| White / Caucasian | 104 | 99.1% |
| Two or more Races | 1 | 0.9% |
| Some other Race | 0 | 0.0% |
| Total | 105 | 100.0% |
Ancestry in Green
The most populous ancestries reported in Green are German (46 | 43.8%), Irish (20 | 19.1%), English (11 | 10.5%), Italian (9 | 8.6%), and Swedish (6 | 5.7%), together accounting for 87.6% of all Green residents.
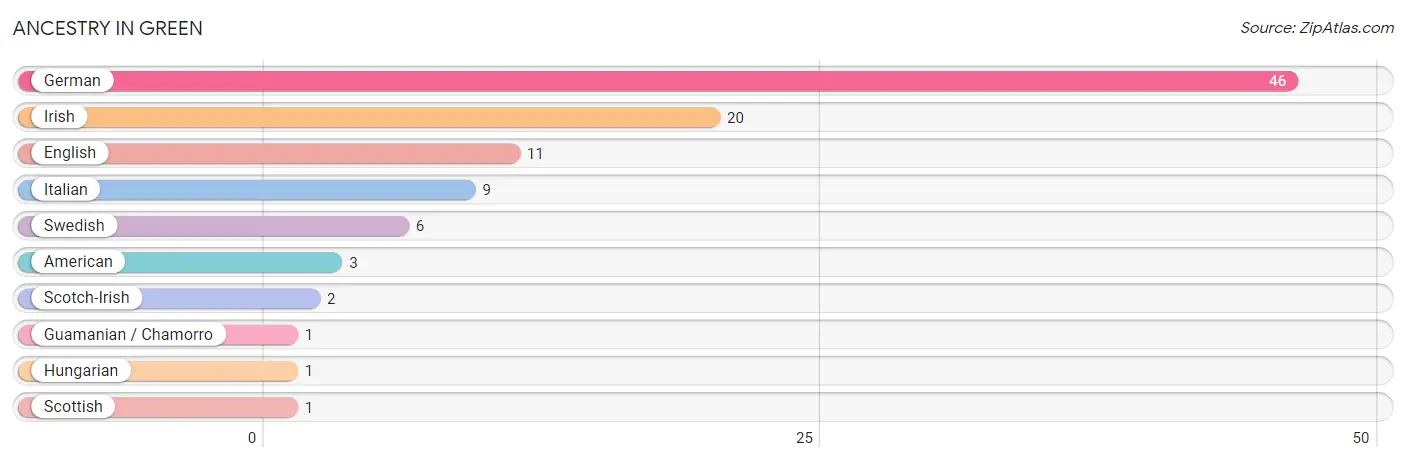
| Ancestry | # Population | % Population |
| American | 3 | 2.9% |
| English | 11 | 10.5% |
| German | 46 | 43.8% |
| Guamanian / Chamorro | 1 | 0.9% |
| Hungarian | 1 | 0.9% |
| Irish | 20 | 19.1% |
| Italian | 9 | 8.6% |
| Scotch-Irish | 2 | 1.9% |
| Scottish | 1 | 0.9% |
| Swedish | 6 | 5.7% | View All 10 Rows |
Immigrants in Green
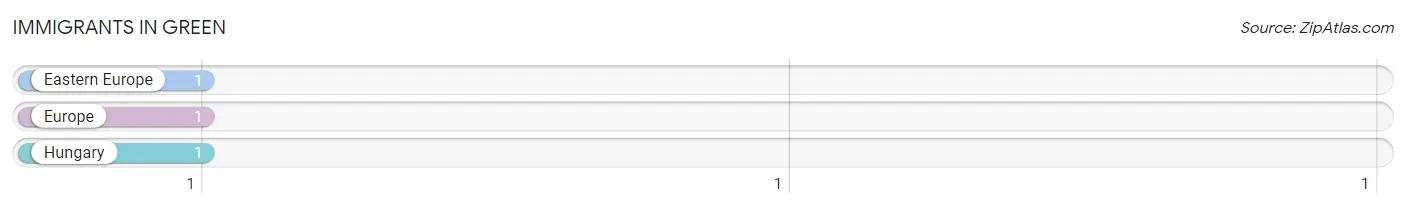
The most numerous immigrant groups reported in Green came from Eastern Europe (1 | 0.9%), Europe (1 | 0.9%), and Hungary (1 | 0.9%), together accounting for 2.8% of all Green residents.
| Immigration Origin | # Population | % Population |
| Eastern Europe | 1 | 0.9% |
| Europe | 1 | 0.9% |
| Hungary | 1 | 0.9% | View All 3 Rows |
Sex and Age in Green
Sex and Age in Green
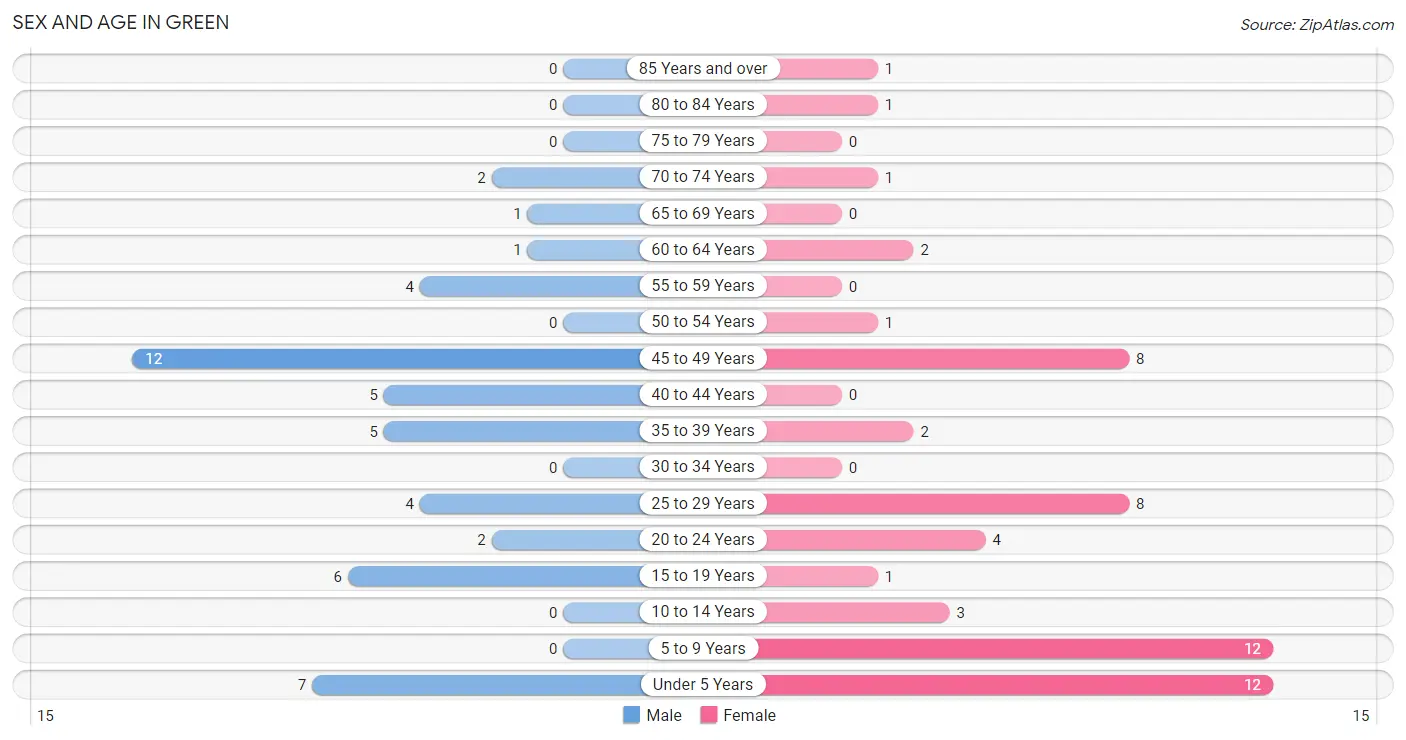
The most populous age groups in Green are 45 to 49 Years (12 | 24.5%) for men and Under 5 Years (12 | 21.4%) for women.
| Age Bracket | Male | Female |
| Under 5 Years | 7 (14.3%) | 12 (21.4%) |
| 5 to 9 Years | 0 (0.0%) | 12 (21.4%) |
| 10 to 14 Years | 0 (0.0%) | 3 (5.4%) |
| 15 to 19 Years | 6 (12.2%) | 1 (1.8%) |
| 20 to 24 Years | 2 (4.1%) | 4 (7.1%) |
| 25 to 29 Years | 4 (8.2%) | 8 (14.3%) |
| 30 to 34 Years | 0 (0.0%) | 0 (0.0%) |
| 35 to 39 Years | 5 (10.2%) | 2 (3.6%) |
| 40 to 44 Years | 5 (10.2%) | 0 (0.0%) |
| 45 to 49 Years | 12 (24.5%) | 8 (14.3%) |
| 50 to 54 Years | 0 (0.0%) | 1 (1.8%) |
| 55 to 59 Years | 4 (8.2%) | 0 (0.0%) |
| 60 to 64 Years | 1 (2.0%) | 2 (3.6%) |
| 65 to 69 Years | 1 (2.0%) | 0 (0.0%) |
| 70 to 74 Years | 2 (4.1%) | 1 (1.8%) |
| 75 to 79 Years | 0 (0.0%) | 0 (0.0%) |
| 80 to 84 Years | 0 (0.0%) | 1 (1.8%) |
| 85 Years and over | 0 (0.0%) | 1 (1.8%) |
| Total | 49 (100.0%) | 56 (100.0%) |
Families and Households in Green
Median Family Size in Green
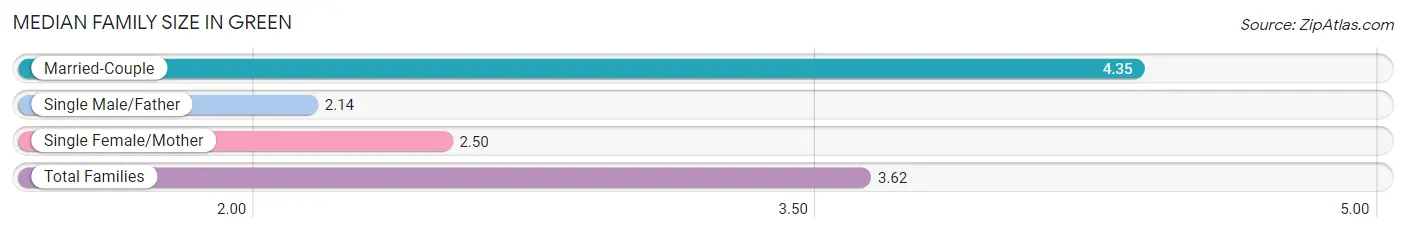
The median family size in Green is 3.62 persons per family, with married-couple families (17 | 65.4%) accounting for the largest median family size of 4.35 persons per family. On the other hand, single male/father families (7 | 26.9%) represent the smallest median family size with 2.14 persons per family.
| Family Type | # Families | Family Size |
| Married-Couple | 17 (65.4%) | 4.35 |
| Single Male/Father | 7 (26.9%) | 2.14 |
| Single Female/Mother | 2 (7.7%) | 2.50 |
| Total Families | 26 (100.0%) | 3.62 |
Median Household Size in Green
| Household Type | # Households | Household Size |
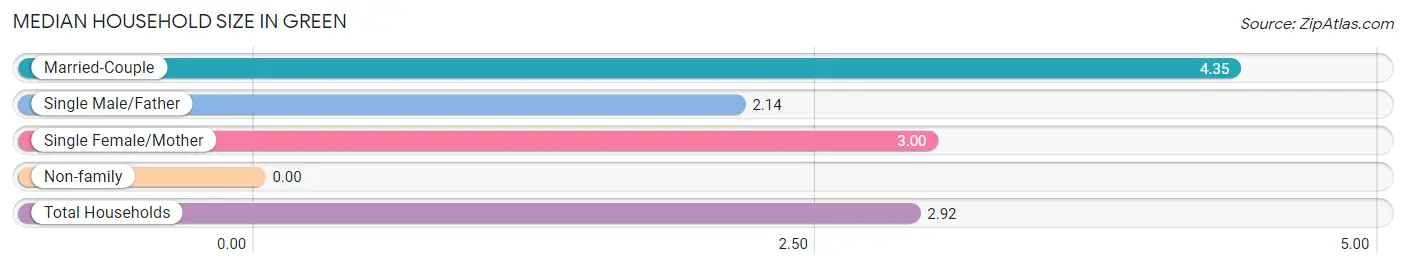
| Married-Couple | 17 (47.2%) | 4.35 |
| Single Male/Father | 7 (19.4%) | 2.14 |
| Single Female/Mother | 2 (5.6%) | 3.00 |
| Non-family | 10 (27.8%) | - |
| Total Households | 36 (100.0%) | 2.92 |
Household Size by Marriage Status in Green
Out of a total of 36 households in Green, 26 (72.2%) are family households, while 10 (27.8%) are nonfamily households. The most numerous type of family households are 4-person households, comprising 11, and the most common type of nonfamily households are 1-person households, comprising 10.
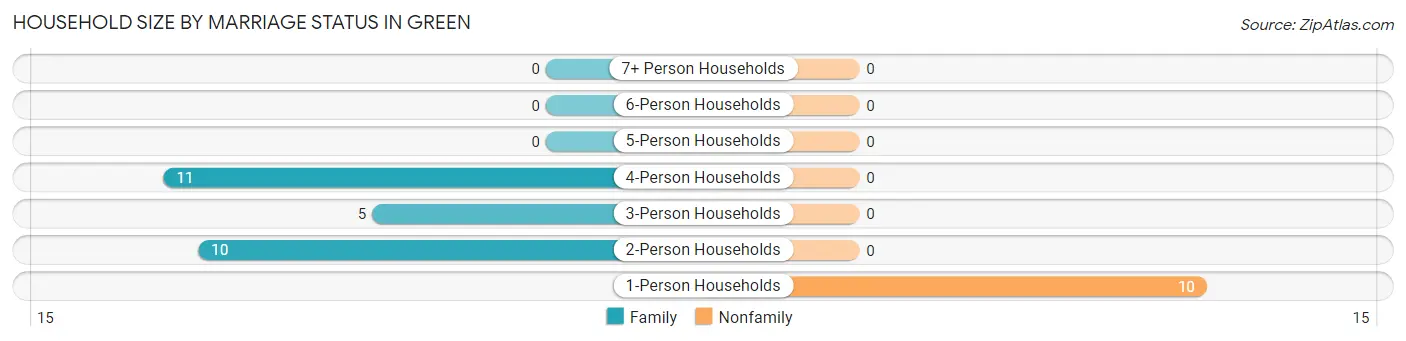
| Household Size | Family Households | Nonfamily Households |
| 1-Person Households | - | 10 (27.8%) |
| 2-Person Households | 10 (27.8%) | 0 (0.0%) |
| 3-Person Households | 5 (13.9%) | 0 (0.0%) |
| 4-Person Households | 11 (30.6%) | 0 (0.0%) |
| 5-Person Households | 0 (0.0%) | 0 (0.0%) |
| 6-Person Households | 0 (0.0%) | 0 (0.0%) |
| 7+ Person Households | 0 (0.0%) | 0 (0.0%) |
| Total | 26 (72.2%) | 10 (27.8%) |
Female Fertility in Green
Fertility by Age in Green
Average fertility rate in Green is 208.0 births per 1,000 women. Women in the age bracket of 20 to 34 years have the highest fertility rate with 417.0 births per 1,000 women. Women in the age bracket of 20 to 34 years acount for 100.0% of all women with births.
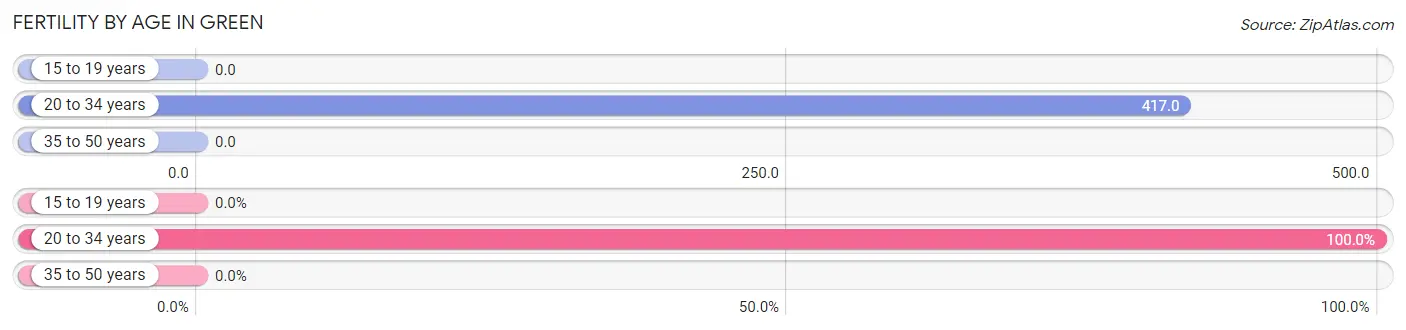
| Age Bracket | Women with Births | Births / 1,000 Women |
| 15 to 19 years | 0 (0.0%) | 0.0 |
| 20 to 34 years | 5 (100.0%) | 417.0 |
| 35 to 50 years | 0 (0.0%) | 0.0 |
| Total | 5 (100.0%) | 208.0 |
Fertility by Age by Marriage Status in Green
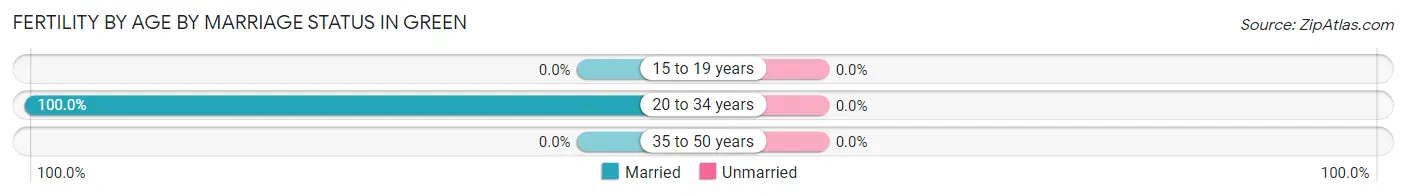
| Age Bracket | Married | Unmarried |
| 15 to 19 years | 0 (0.0%) | 0 (0.0%) |
| 20 to 34 years | 5 (100.0%) | 0 (0.0%) |
| 35 to 50 years | 0 (0.0%) | 0 (0.0%) |
| Total | 5 (100.0%) | 0 (0.0%) |
Fertility by Education in Green
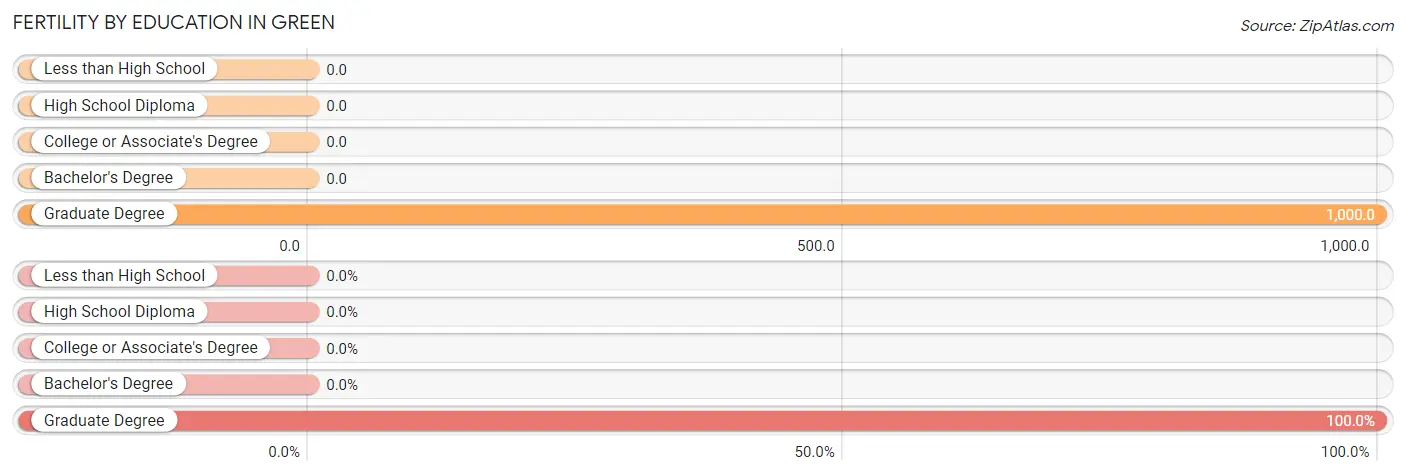
| Educational Attainment | Women with Births | Births / 1,000 Women |
| Less than High School | 0 (0.0%) | 0.0 |
| High School Diploma | 0 (0.0%) | 0.0 |
| College or Associate's Degree | 0 (0.0%) | 0.0 |
| Bachelor's Degree | 0 (0.0%) | 0.0 |
| Graduate Degree | 5 (100.0%) | 1,000.0 |
| Total | 5 (100.0%) | 208.0 |
Fertility by Education by Marriage Status in Green
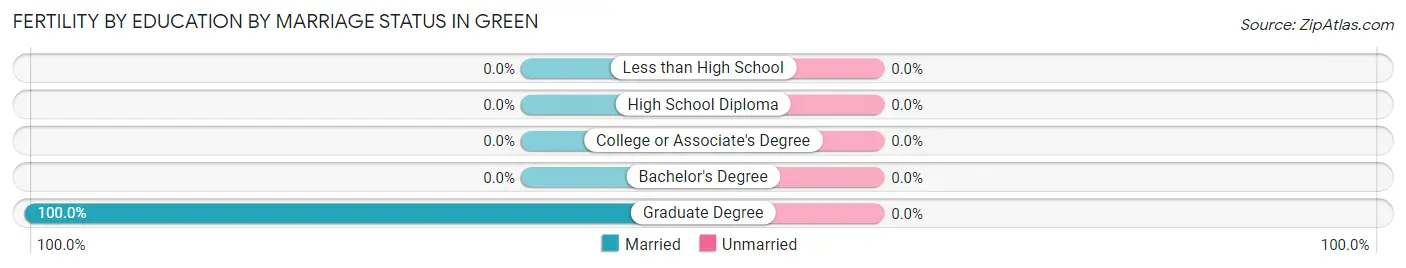
| Educational Attainment | Married | Unmarried |
| Less than High School | 0 (0.0%) | 0 (0.0%) |
| High School Diploma | 0 (0.0%) | 0 (0.0%) |
| College or Associate's Degree | 0 (0.0%) | 0 (0.0%) |
| Bachelor's Degree | 0 (0.0%) | 0 (0.0%) |
| Graduate Degree | 5 (100.0%) | 0 (0.0%) |
| Total | 5 (100.0%) | 0 (0.0%) |
Employment Characteristics in Green
Employment by Class of Employer in Green
Among the 52 employed individuals in Green, private company employees (21 | 40.4%), local government employees (17 | 32.7%), and self-employed (not incorporated) (7 | 13.5%) make up the most common classes of employment.
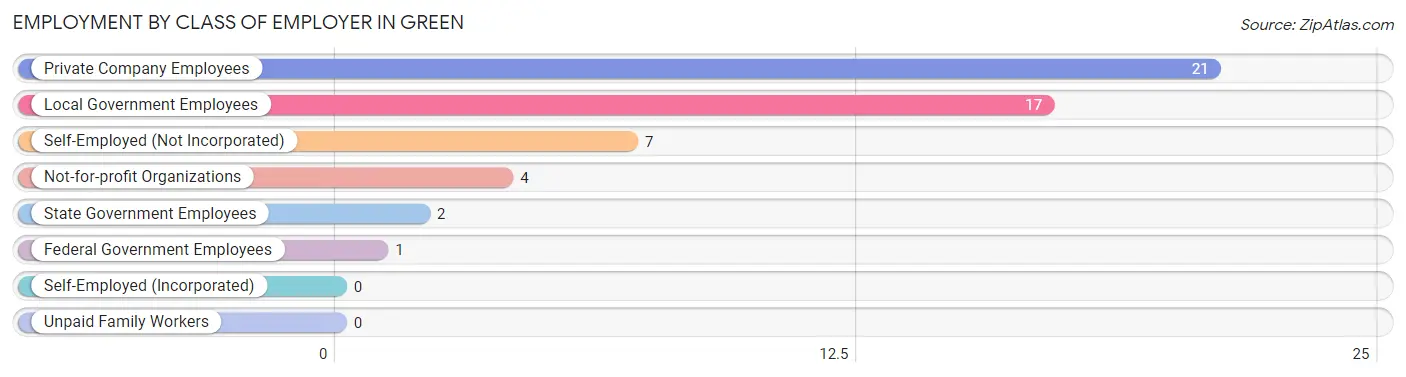
| Employer Class | # Employees | % Employees |
| Private Company Employees | 21 | 40.4% |
| Self-Employed (Incorporated) | 0 | 0.0% |
| Self-Employed (Not Incorporated) | 7 | 13.5% |
| Not-for-profit Organizations | 4 | 7.7% |
| Local Government Employees | 17 | 32.7% |
| State Government Employees | 2 | 3.8% |
| Federal Government Employees | 1 | 1.9% |
| Unpaid Family Workers | 0 | 0.0% |
| Total | 52 | 100.0% |
Employment Status by Age in Green
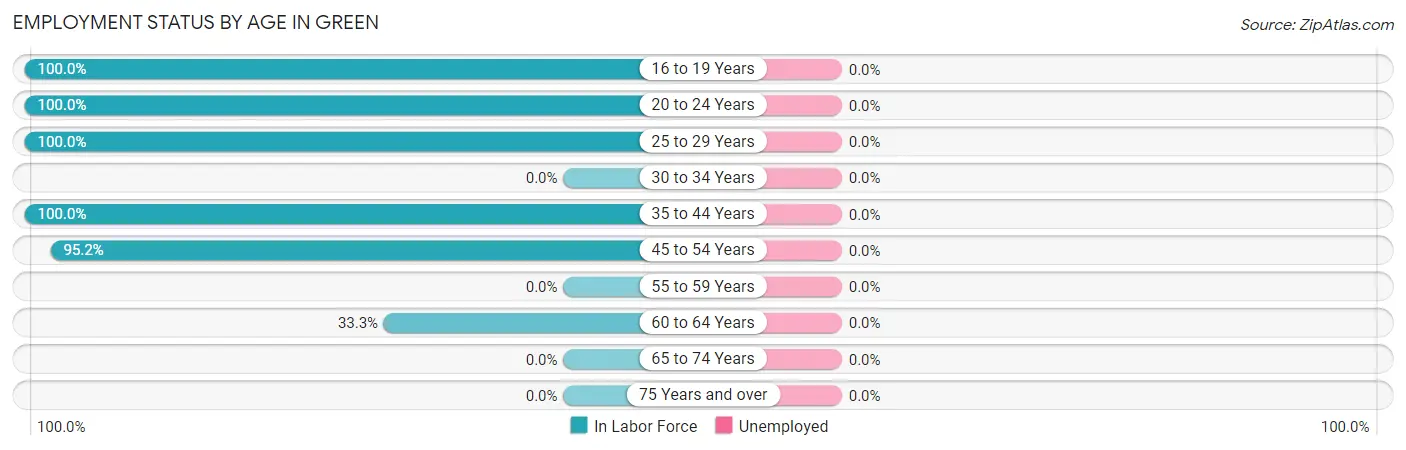
| Age Bracket | In Labor Force | Unemployed |
| 16 to 19 Years | 6 (100.0%) | 0 (0.0%) |
| 20 to 24 Years | 6 (100.0%) | 0 (0.0%) |
| 25 to 29 Years | 12 (100.0%) | 0 (0.0%) |
| 30 to 34 Years | 0 (0.0%) | 0 (0.0%) |
| 35 to 44 Years | 12 (100.0%) | 0 (0.0%) |
| 45 to 54 Years | 20 (95.2%) | 0 (0.0%) |
| 55 to 59 Years | 0 (0.0%) | 0 (0.0%) |
| 60 to 64 Years | 1 (33.3%) | 0 (0.0%) |
| 65 to 74 Years | 0 (0.0%) | 0 (0.0%) |
| 75 Years and over | 0 (0.0%) | 0 (0.0%) |
| Total | 57 (81.4%) | 0 (0.0%) |
Employment Status by Educational Attainment in Green
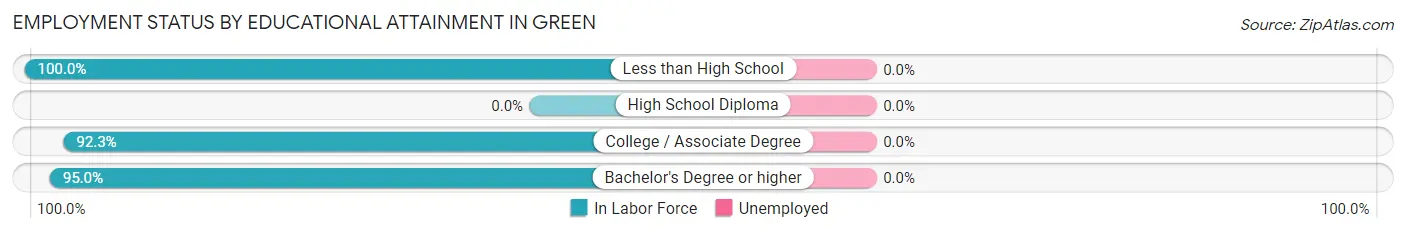
| Educational Attainment | In Labor Force | Unemployed |
| Less than High School | 2 (100.0%) | 0 (0.0%) |
| High School Diploma | 0 (0.0%) | 0 (0.0%) |
| College / Associate Degree | 24 (92.3%) | 0 (0.0%) |
| Bachelor's Degree or higher | 19 (95.0%) | 0 (0.0%) |
| Total | 45 (86.5%) | 0 (0.0%) |
Employment Occupations by Sex in Green
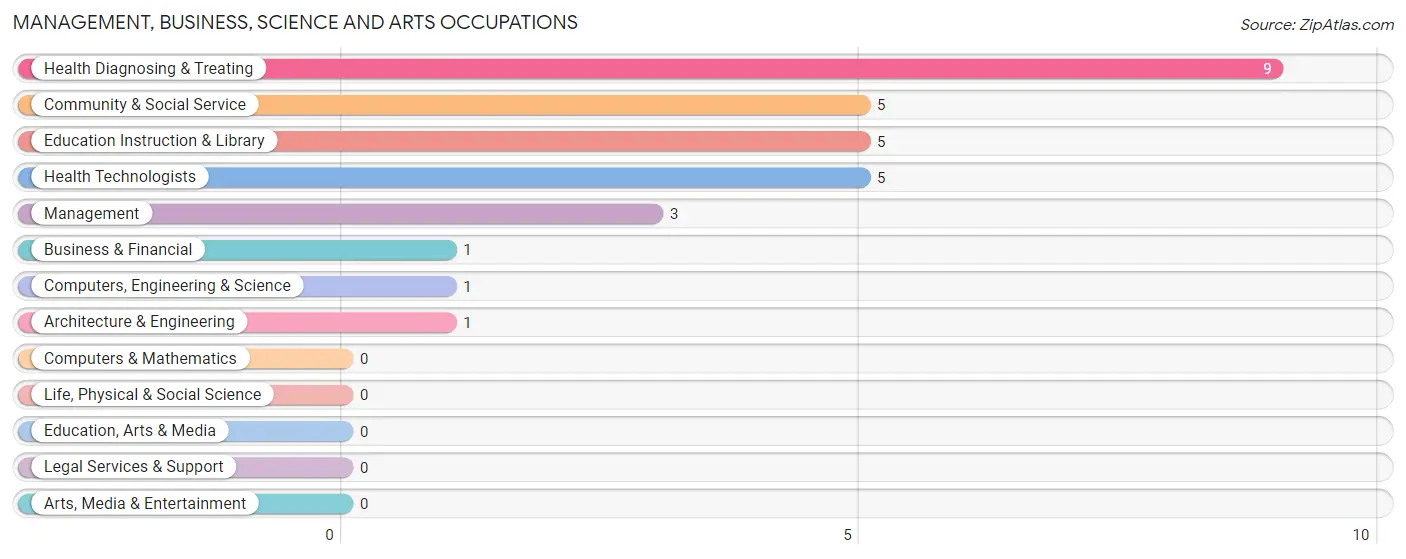
Management, Business, Science and Arts Occupations
The most common Management, Business, Science and Arts occupations in Green are Health Diagnosing & Treating (9 | 15.8%), Community & Social Service (5 | 8.8%), Education Instruction & Library (5 | 8.8%), Health Technologists (5 | 8.8%), and Management (3 | 5.3%).
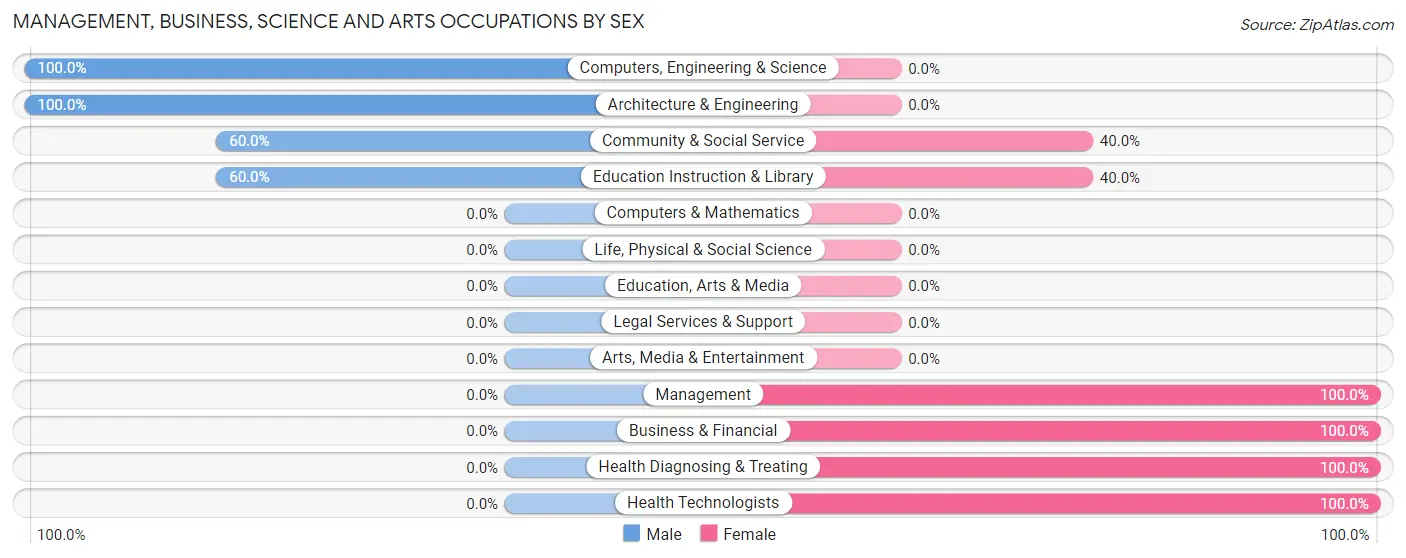
Management, Business, Science and Arts Occupations by Sex
Within the Management, Business, Science and Arts occupations in Green, the most male-oriented occupations are Computers, Engineering & Science (100.0%), Architecture & Engineering (100.0%), and Community & Social Service (60.0%), while the most female-oriented occupations are Management (100.0%), Business & Financial (100.0%), and Health Diagnosing & Treating (100.0%).
| Occupation | Male | Female |
| Management | 0 (0.0%) | 3 (100.0%) |
| Business & Financial | 0 (0.0%) | 1 (100.0%) |
| Computers, Engineering & Science | 1 (100.0%) | 0 (0.0%) |
| Computers & Mathematics | 0 (0.0%) | 0 (0.0%) |
| Architecture & Engineering | 1 (100.0%) | 0 (0.0%) |
| Life, Physical & Social Science | 0 (0.0%) | 0 (0.0%) |
| Community & Social Service | 3 (60.0%) | 2 (40.0%) |
| Education, Arts & Media | 0 (0.0%) | 0 (0.0%) |
| Legal Services & Support | 0 (0.0%) | 0 (0.0%) |
| Education Instruction & Library | 3 (60.0%) | 2 (40.0%) |
| Arts, Media & Entertainment | 0 (0.0%) | 0 (0.0%) |
| Health Diagnosing & Treating | 0 (0.0%) | 9 (100.0%) |
| Health Technologists | 0 (0.0%) | 5 (100.0%) |
| Total (Category) | 4 (21.0%) | 15 (78.9%) |
| Total (Overall) | 34 (59.7%) | 23 (40.4%) |
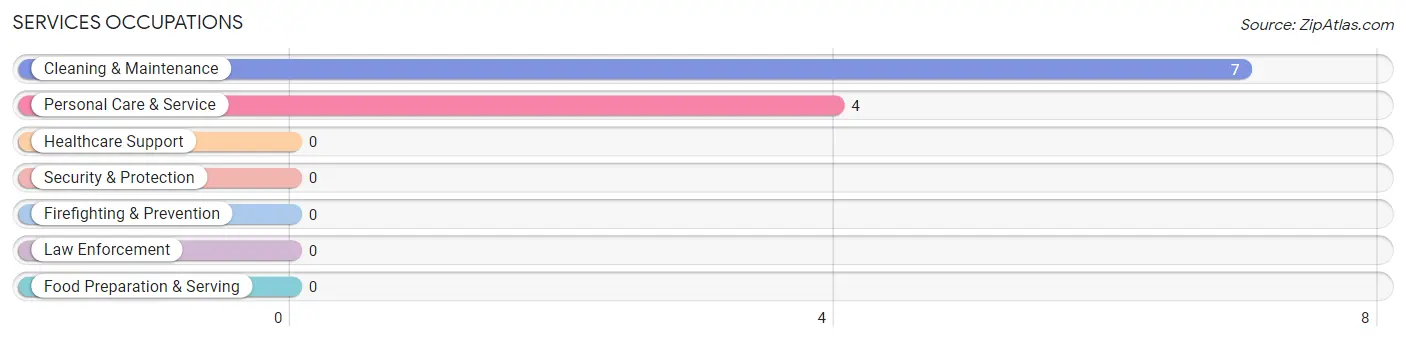
Services Occupations
The most common Services occupations in Green are Cleaning & Maintenance (7 | 12.3%), and Personal Care & Service (4 | 7.0%).
Services Occupations by Sex
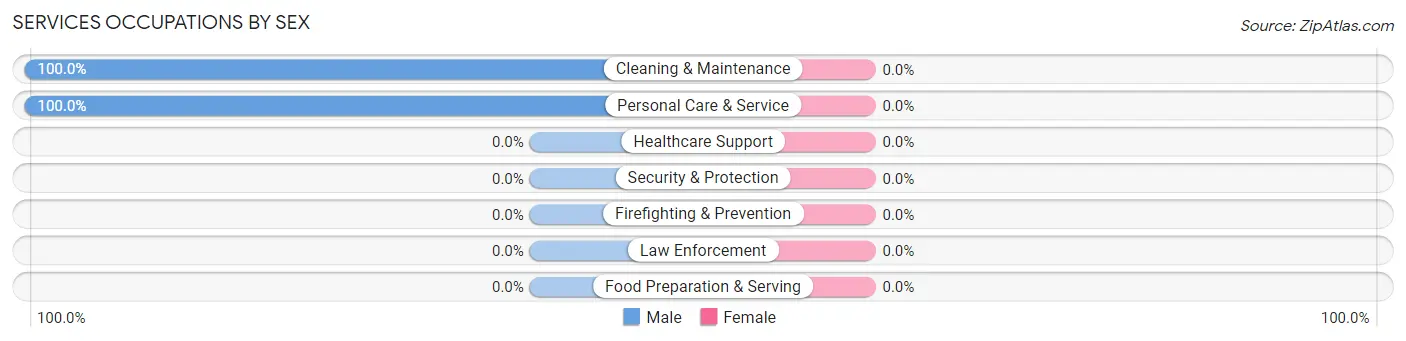
| Occupation | Male | Female |
| Healthcare Support | 0 (0.0%) | 0 (0.0%) |
| Security & Protection | 0 (0.0%) | 0 (0.0%) |
| Firefighting & Prevention | 0 (0.0%) | 0 (0.0%) |
| Law Enforcement | 0 (0.0%) | 0 (0.0%) |
| Food Preparation & Serving | 0 (0.0%) | 0 (0.0%) |
| Cleaning & Maintenance | 7 (100.0%) | 0 (0.0%) |
| Personal Care & Service | 4 (100.0%) | 0 (0.0%) |
| Total (Category) | 11 (100.0%) | 0 (0.0%) |
| Total (Overall) | 34 (59.7%) | 23 (40.4%) |
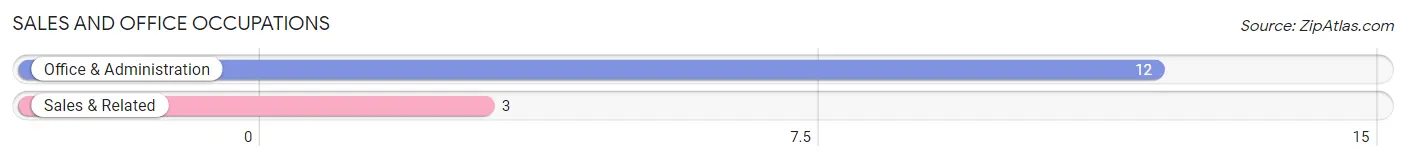
Sales and Office Occupations
The most common Sales and Office occupations in Green are Office & Administration (12 | 21.0%), and Sales & Related (3 | 5.3%).
Sales and Office Occupations by Sex
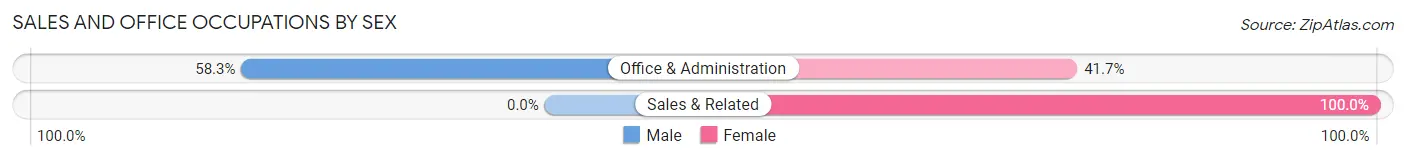
| Occupation | Male | Female |
| Sales & Related | 0 (0.0%) | 3 (100.0%) |
| Office & Administration | 7 (58.3%) | 5 (41.7%) |
| Total (Category) | 7 (46.7%) | 8 (53.3%) |
| Total (Overall) | 34 (59.7%) | 23 (40.4%) |
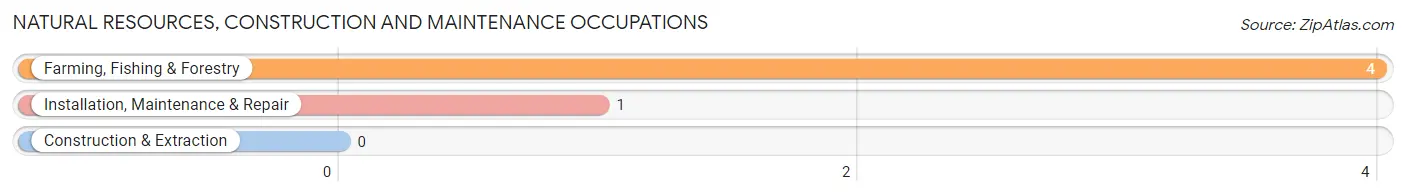
Natural Resources, Construction and Maintenance Occupations
The most common Natural Resources, Construction and Maintenance occupations in Green are Farming, Fishing & Forestry (4 | 7.0%), and Installation, Maintenance & Repair (1 | 1.8%).
Natural Resources, Construction and Maintenance Occupations by Sex
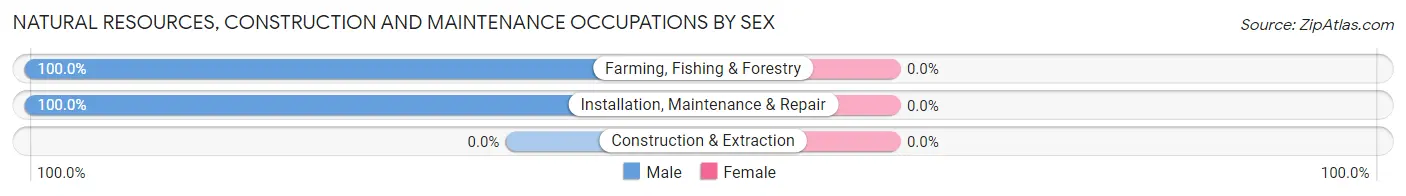
| Occupation | Male | Female |
| Farming, Fishing & Forestry | 4 (100.0%) | 0 (0.0%) |
| Construction & Extraction | 0 (0.0%) | 0 (0.0%) |
| Installation, Maintenance & Repair | 1 (100.0%) | 0 (0.0%) |
| Total (Category) | 5 (100.0%) | 0 (0.0%) |
| Total (Overall) | 34 (59.7%) | 23 (40.4%) |
Production, Transportation and Moving Occupations
The most common Production, Transportation and Moving occupations in Green are Production (6 | 10.5%), and Material Moving (1 | 1.8%).
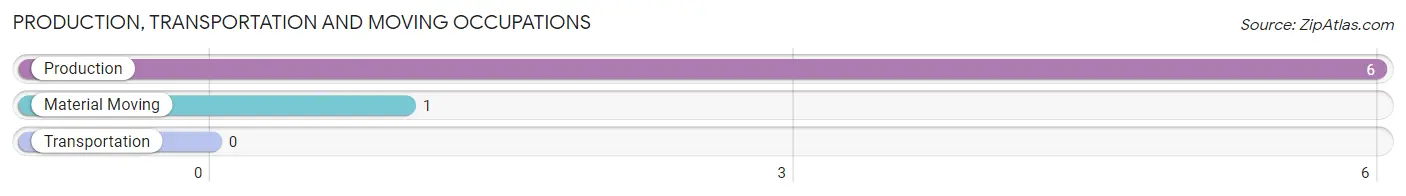
Production, Transportation and Moving Occupations by Sex
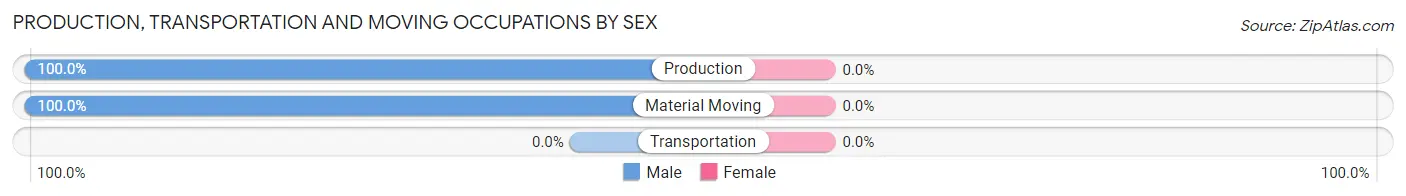
| Occupation | Male | Female |
| Production | 6 (100.0%) | 0 (0.0%) |
| Transportation | 0 (0.0%) | 0 (0.0%) |
| Material Moving | 1 (100.0%) | 0 (0.0%) |
| Total (Category) | 7 (100.0%) | 0 (0.0%) |
| Total (Overall) | 34 (59.7%) | 23 (40.4%) |
Employment Industries by Sex in Green
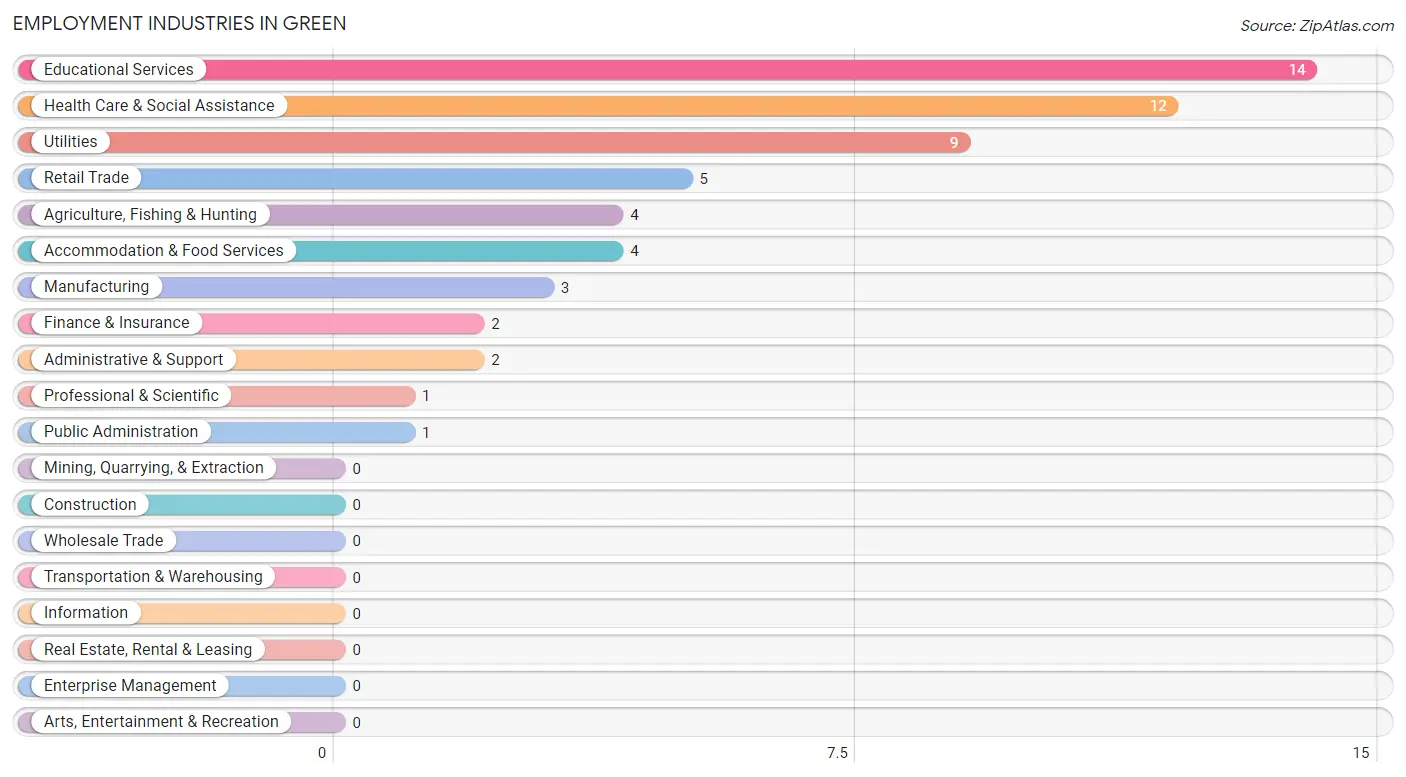
Employment Industries in Green
The major employment industries in Green include Educational Services (14 | 24.6%), Health Care & Social Assistance (12 | 21.0%), Utilities (9 | 15.8%), Retail Trade (5 | 8.8%), and Agriculture, Fishing & Hunting (4 | 7.0%).
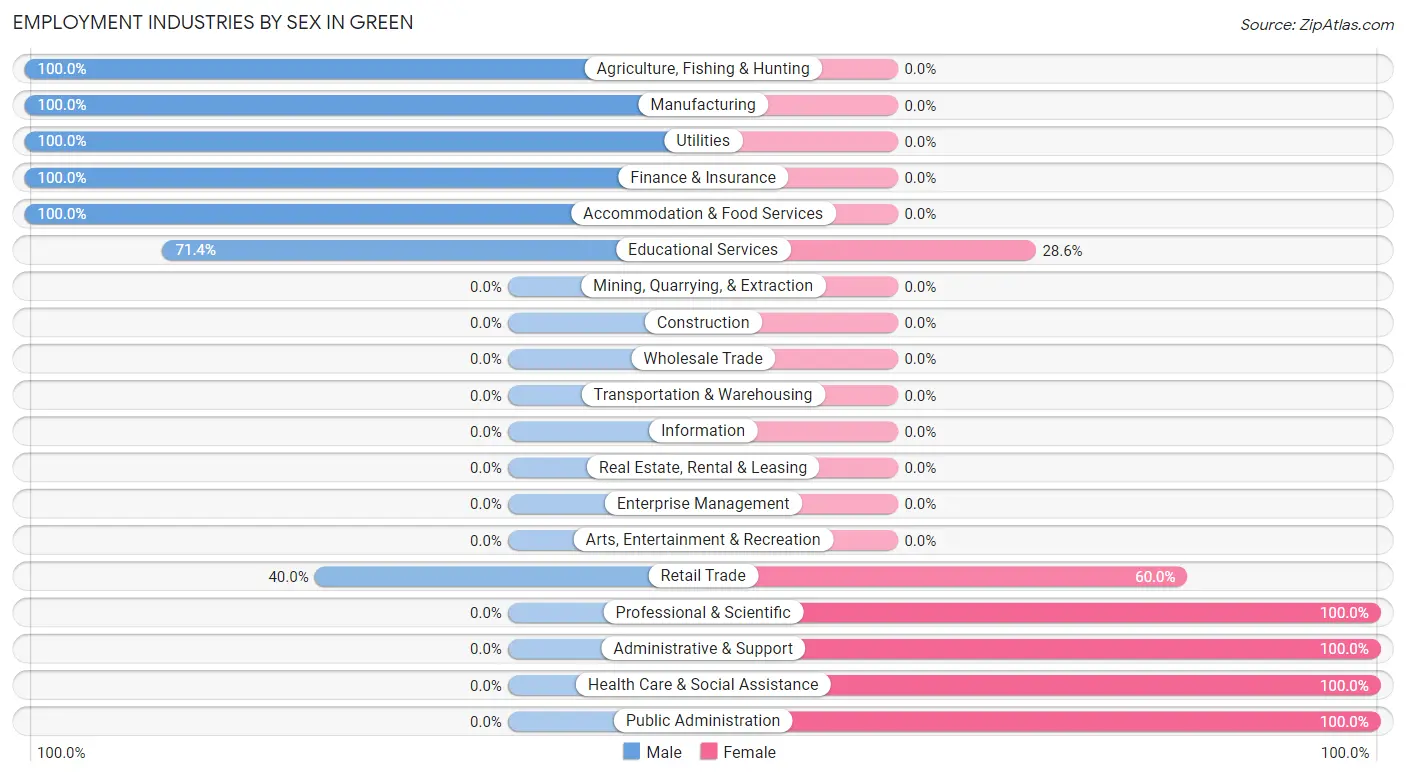
Employment Industries by Sex in Green
The Green industries that see more men than women are Agriculture, Fishing & Hunting (100.0%), Manufacturing (100.0%), and Utilities (100.0%), whereas the industries that tend to have a higher number of women are Professional & Scientific (100.0%), Administrative & Support (100.0%), and Health Care & Social Assistance (100.0%).
| Industry | Male | Female |
| Agriculture, Fishing & Hunting | 4 (100.0%) | 0 (0.0%) |
| Mining, Quarrying, & Extraction | 0 (0.0%) | 0 (0.0%) |
| Construction | 0 (0.0%) | 0 (0.0%) |
| Manufacturing | 3 (100.0%) | 0 (0.0%) |
| Wholesale Trade | 0 (0.0%) | 0 (0.0%) |
| Retail Trade | 2 (40.0%) | 3 (60.0%) |
| Transportation & Warehousing | 0 (0.0%) | 0 (0.0%) |
| Utilities | 9 (100.0%) | 0 (0.0%) |
| Information | 0 (0.0%) | 0 (0.0%) |
| Finance & Insurance | 2 (100.0%) | 0 (0.0%) |
| Real Estate, Rental & Leasing | 0 (0.0%) | 0 (0.0%) |
| Professional & Scientific | 0 (0.0%) | 1 (100.0%) |
| Enterprise Management | 0 (0.0%) | 0 (0.0%) |
| Administrative & Support | 0 (0.0%) | 2 (100.0%) |
| Educational Services | 10 (71.4%) | 4 (28.6%) |
| Health Care & Social Assistance | 0 (0.0%) | 12 (100.0%) |
| Arts, Entertainment & Recreation | 0 (0.0%) | 0 (0.0%) |
| Accommodation & Food Services | 4 (100.0%) | 0 (0.0%) |
| Public Administration | 0 (0.0%) | 1 (100.0%) |
| Total | 34 (59.7%) | 23 (40.4%) |
Education in Green
School Enrollment in Green
The most common levels of schooling among the 25 students in Green are elementary school (12 | 48.0%), high school (7 | 28.0%), and college / undergraduate (4 | 16.0%).
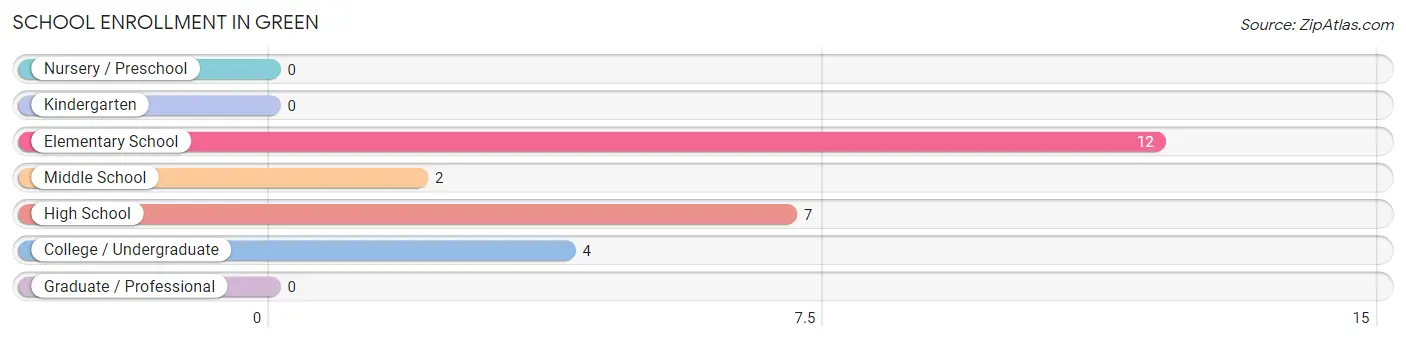
| School Level | # Students | % Students |
| Nursery / Preschool | 0 | 0.0% |
| Kindergarten | 0 | 0.0% |
| Elementary School | 12 | 48.0% |
| Middle School | 2 | 8.0% |
| High School | 7 | 28.0% |
| College / Undergraduate | 4 | 16.0% |
| Graduate / Professional | 0 | 0.0% |
| Total | 25 | 100.0% |
School Enrollment by Age by Funding Source in Green
Out of a total of 25 students who are enrolled in schools in Green, 1 (4.0%) attend a private institution, while the remaining 24 (96.0%) are enrolled in public schools. The age group of 18 to 19 year olds has the highest likelihood of being enrolled in private schools, with 1 (100.0% in the age bracket) enrolled. Conversely, the age group of 5 to 9 year old has the lowest likelihood of being enrolled in a private school, with 12 (100.0% in the age bracket) attending a public institution.
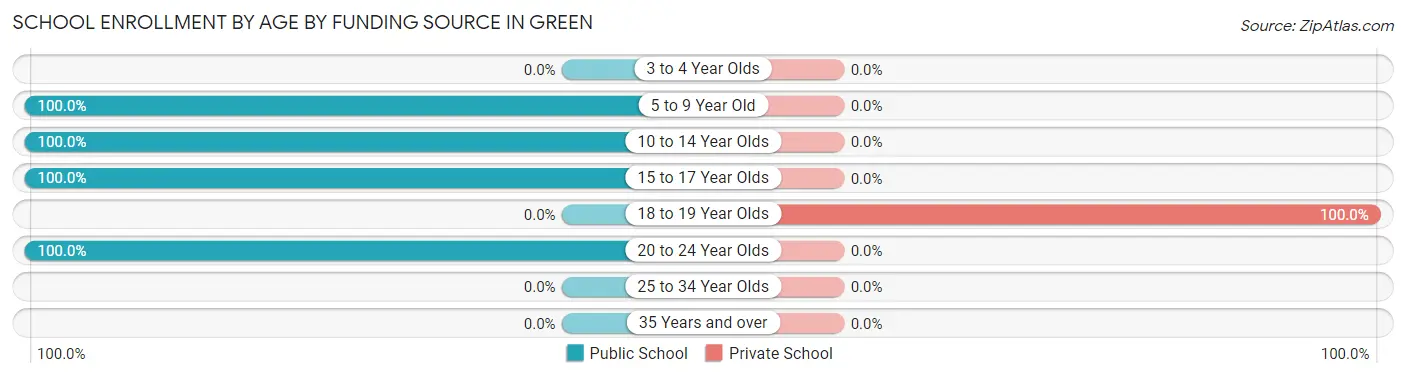
| Age Bracket | Public School | Private School |
| 3 to 4 Year Olds | 0 (0.0%) | 0 (0.0%) |
| 5 to 9 Year Old | 12 (100.0%) | 0 (0.0%) |
| 10 to 14 Year Olds | 3 (100.0%) | 0 (0.0%) |
| 15 to 17 Year Olds | 5 (100.0%) | 0 (0.0%) |
| 18 to 19 Year Olds | 0 (0.0%) | 1 (100.0%) |
| 20 to 24 Year Olds | 4 (100.0%) | 0 (0.0%) |
| 25 to 34 Year Olds | 0 (0.0%) | 0 (0.0%) |
| 35 Years and over | 0 (0.0%) | 0 (0.0%) |
| Total | 24 (96.0%) | 1 (4.0%) |
Educational Attainment by Field of Study in Green
Bio, nature & agricultural (6 | 28.6%), science & technology (5 | 23.8%), education (4 | 19.1%), arts & humanities (3 | 14.3%), and business (2 | 9.5%) are the most common fields of study among 21 individuals in Green who have obtained a bachelor's degree or higher.
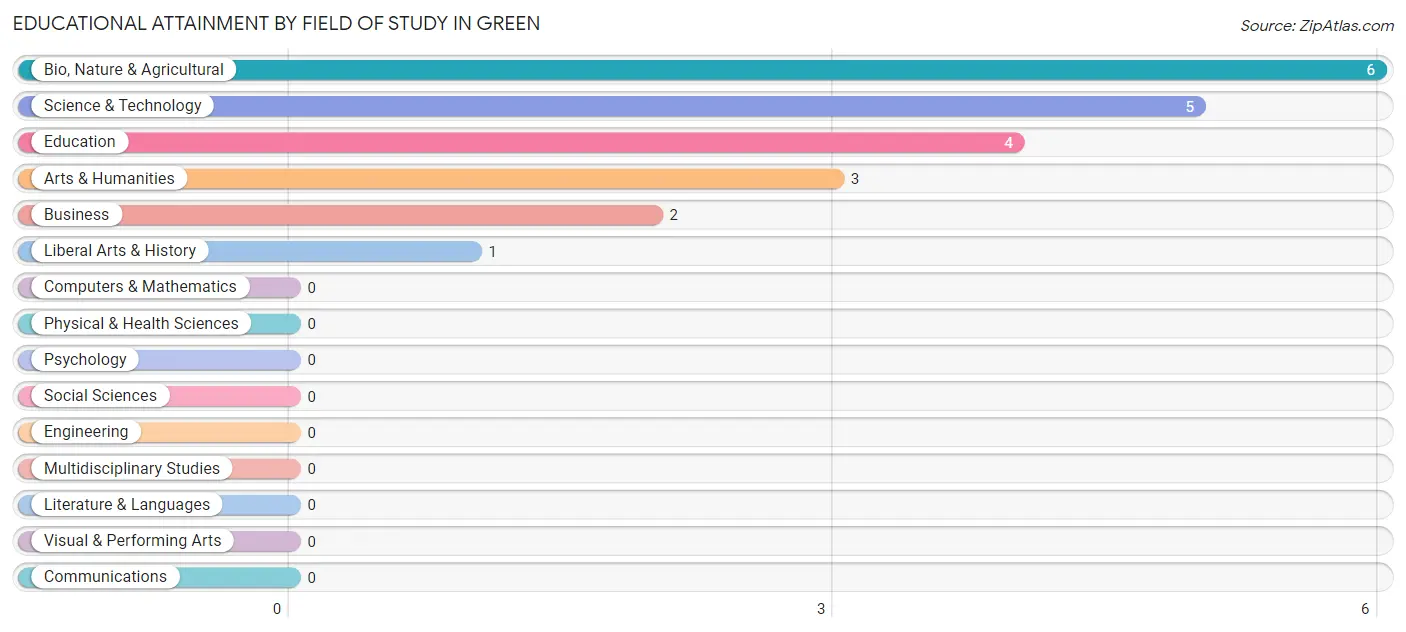
| Field of Study | # Graduates | % Graduates |
| Computers & Mathematics | 0 | 0.0% |
| Bio, Nature & Agricultural | 6 | 28.6% |
| Physical & Health Sciences | 0 | 0.0% |
| Psychology | 0 | 0.0% |
| Social Sciences | 0 | 0.0% |
| Engineering | 0 | 0.0% |
| Multidisciplinary Studies | 0 | 0.0% |
| Science & Technology | 5 | 23.8% |
| Business | 2 | 9.5% |
| Education | 4 | 19.1% |
| Literature & Languages | 0 | 0.0% |
| Liberal Arts & History | 1 | 4.8% |
| Visual & Performing Arts | 0 | 0.0% |
| Communications | 0 | 0.0% |
| Arts & Humanities | 3 | 14.3% |
| Total | 21 | 100.0% |
Transportation & Commute in Green
Vehicle Availability by Sex in Green
The most prevalent vehicle ownership categories in Green are males with 2 vehicles (15, accounting for 44.1%) and females with 2 vehicles (6, making up 83.3%).
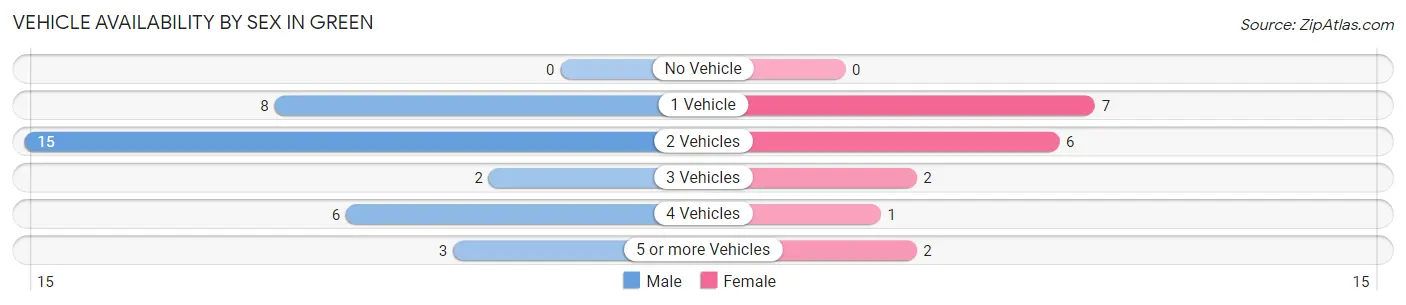
| Vehicles Available | Male | Female |
| No Vehicle | 0 (0.0%) | 0 (0.0%) |
| 1 Vehicle | 8 (23.5%) | 7 (38.9%) |
| 2 Vehicles | 15 (44.1%) | 6 (33.3%) |
| 3 Vehicles | 2 (5.9%) | 2 (11.1%) |
| 4 Vehicles | 6 (17.6%) | 1 (5.6%) |
| 5 or more Vehicles | 3 (8.8%) | 2 (11.1%) |
| Total | 34 (100.0%) | 18 (100.0%) |
Commute Time in Green
The most frequently occuring commute durations in Green are 15 to 19 minutes (17 commuters, 37.8%), 10 to 14 minutes (8 commuters, 17.8%), and 20 to 24 minutes (7 commuters, 15.6%).
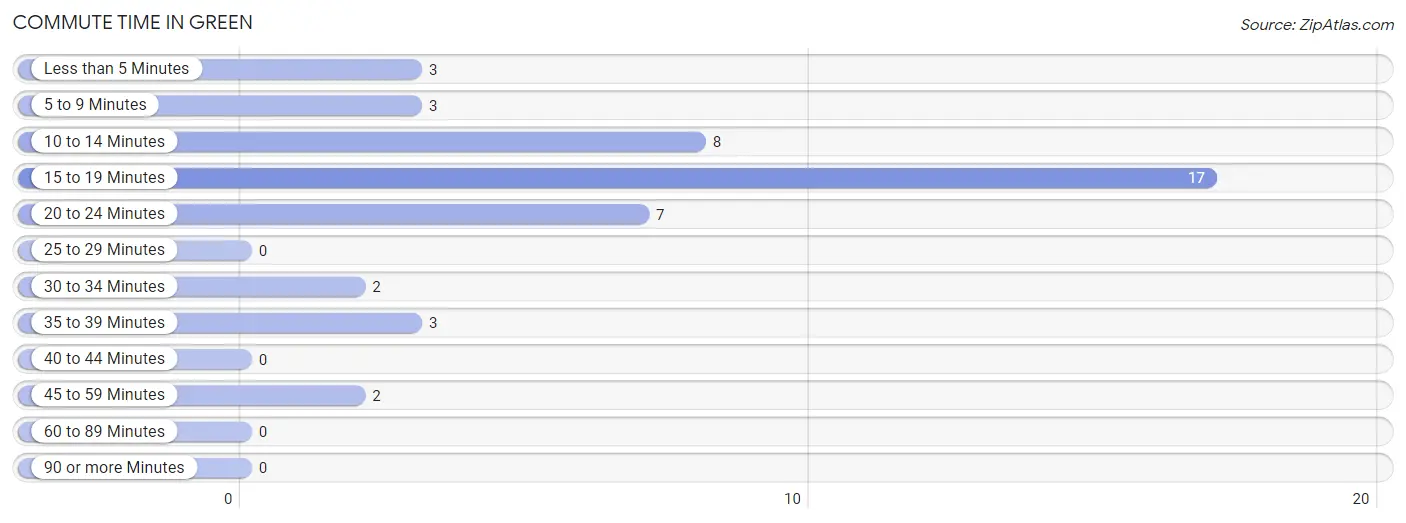
| Commute Time | # Commuters | % Commuters |
| Less than 5 Minutes | 3 | 6.7% |
| 5 to 9 Minutes | 3 | 6.7% |
| 10 to 14 Minutes | 8 | 17.8% |
| 15 to 19 Minutes | 17 | 37.8% |
| 20 to 24 Minutes | 7 | 15.6% |
| 25 to 29 Minutes | 0 | 0.0% |
| 30 to 34 Minutes | 2 | 4.4% |
| 35 to 39 Minutes | 3 | 6.7% |
| 40 to 44 Minutes | 0 | 0.0% |
| 45 to 59 Minutes | 2 | 4.4% |
| 60 to 89 Minutes | 0 | 0.0% |
| 90 or more Minutes | 0 | 0.0% |
Commute Time by Sex in Green
The most common commute times in Green are 15 to 19 minutes (13 commuters, 43.3%) for males and 15 to 19 minutes (4 commuters, 26.7%) for females.
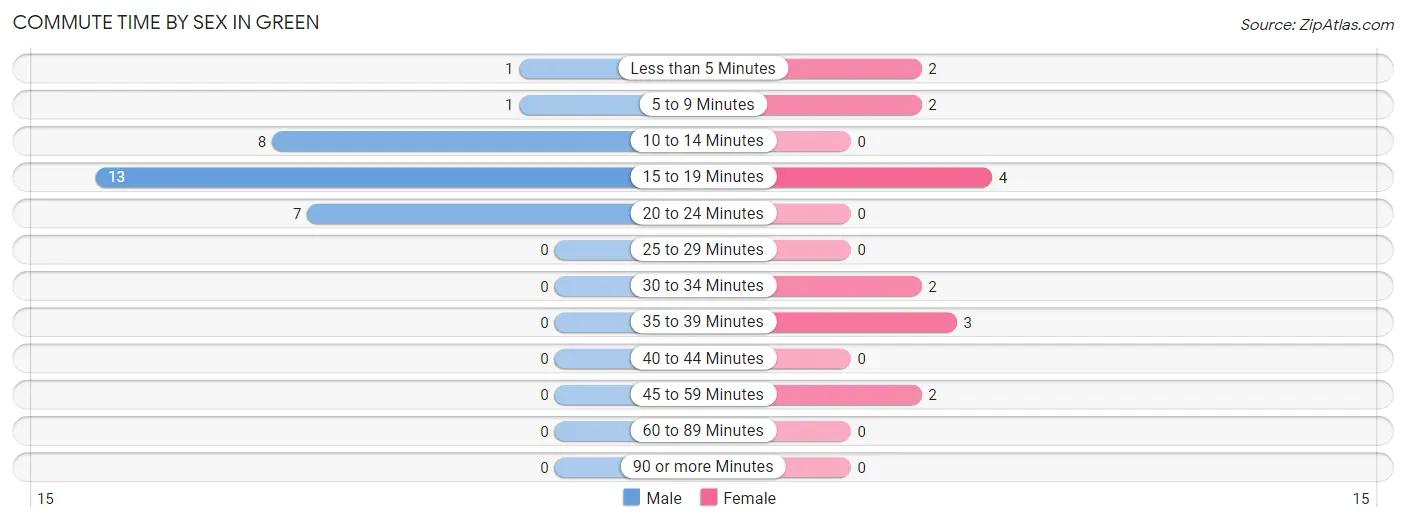
| Commute Time | Male | Female |
| Less than 5 Minutes | 1 (3.3%) | 2 (13.3%) |
| 5 to 9 Minutes | 1 (3.3%) | 2 (13.3%) |
| 10 to 14 Minutes | 8 (26.7%) | 0 (0.0%) |
| 15 to 19 Minutes | 13 (43.3%) | 4 (26.7%) |
| 20 to 24 Minutes | 7 (23.3%) | 0 (0.0%) |
| 25 to 29 Minutes | 0 (0.0%) | 0 (0.0%) |
| 30 to 34 Minutes | 0 (0.0%) | 2 (13.3%) |
| 35 to 39 Minutes | 0 (0.0%) | 3 (20.0%) |
| 40 to 44 Minutes | 0 (0.0%) | 0 (0.0%) |
| 45 to 59 Minutes | 0 (0.0%) | 2 (13.3%) |
| 60 to 89 Minutes | 0 (0.0%) | 0 (0.0%) |
| 90 or more Minutes | 0 (0.0%) | 0 (0.0%) |
Time of Departure to Work by Sex in Green
The most frequent times of departure to work in Green are 7:30 AM to 7:59 AM (10, 33.3%) for males and 7:00 AM to 7:29 AM (5, 33.3%) for females.
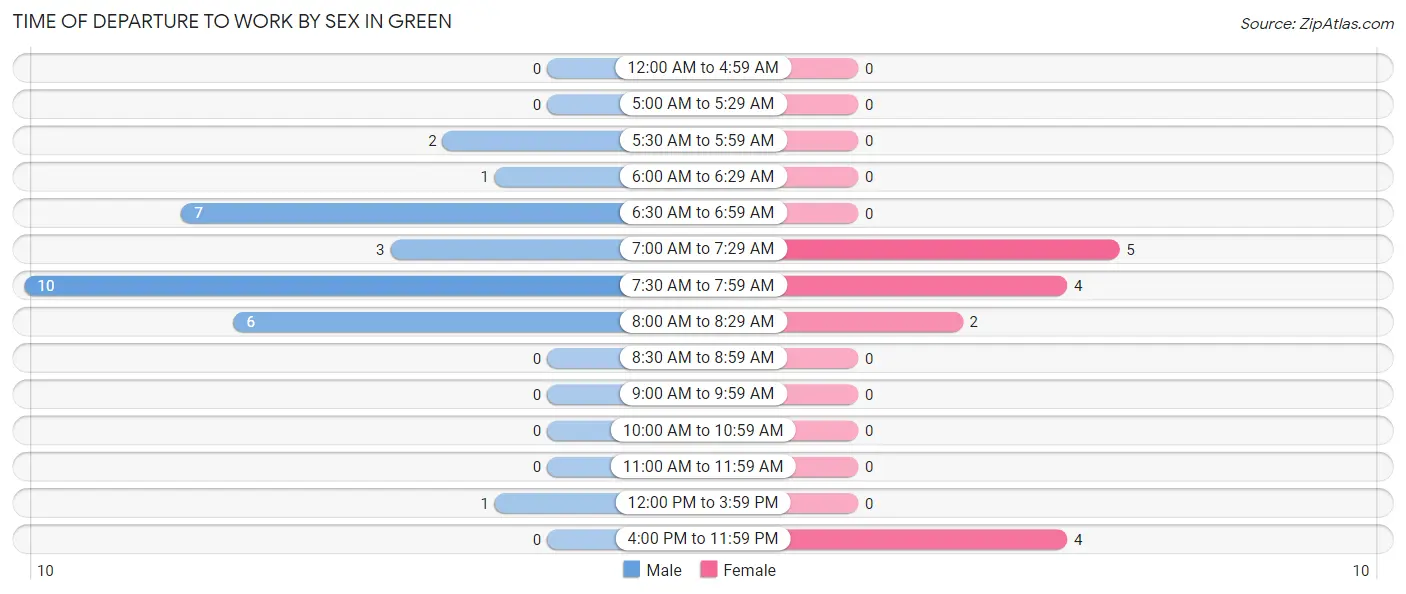
| Time of Departure | Male | Female |
| 12:00 AM to 4:59 AM | 0 (0.0%) | 0 (0.0%) |
| 5:00 AM to 5:29 AM | 0 (0.0%) | 0 (0.0%) |
| 5:30 AM to 5:59 AM | 2 (6.7%) | 0 (0.0%) |
| 6:00 AM to 6:29 AM | 1 (3.3%) | 0 (0.0%) |
| 6:30 AM to 6:59 AM | 7 (23.3%) | 0 (0.0%) |
| 7:00 AM to 7:29 AM | 3 (10.0%) | 5 (33.3%) |
| 7:30 AM to 7:59 AM | 10 (33.3%) | 4 (26.7%) |
| 8:00 AM to 8:29 AM | 6 (20.0%) | 2 (13.3%) |
| 8:30 AM to 8:59 AM | 0 (0.0%) | 0 (0.0%) |
| 9:00 AM to 9:59 AM | 0 (0.0%) | 0 (0.0%) |
| 10:00 AM to 10:59 AM | 0 (0.0%) | 0 (0.0%) |
| 11:00 AM to 11:59 AM | 0 (0.0%) | 0 (0.0%) |
| 12:00 PM to 3:59 PM | 1 (3.3%) | 0 (0.0%) |
| 4:00 PM to 11:59 PM | 0 (0.0%) | 4 (26.7%) |
| Total | 30 (100.0%) | 15 (100.0%) |
Housing Occupancy in Green
Occupancy by Ownership in Green
Of the total 36 dwellings in Green, owner-occupied units account for 23 (63.9%), while renter-occupied units make up 13 (36.1%).
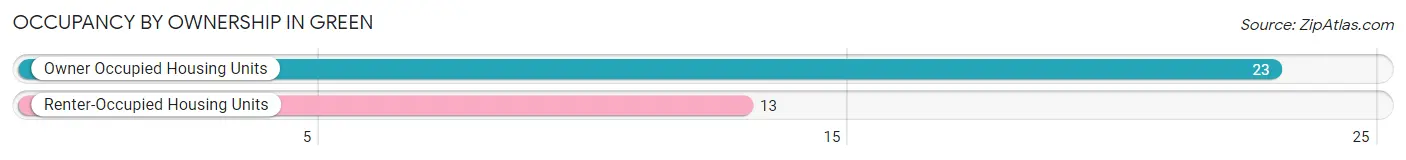
| Occupancy | # Housing Units | % Housing Units |
| Owner Occupied Housing Units | 23 | 63.9% |
| Renter-Occupied Housing Units | 13 | 36.1% |
| Total Occupied Housing Units | 36 | 100.0% |
Occupancy by Household Size in Green
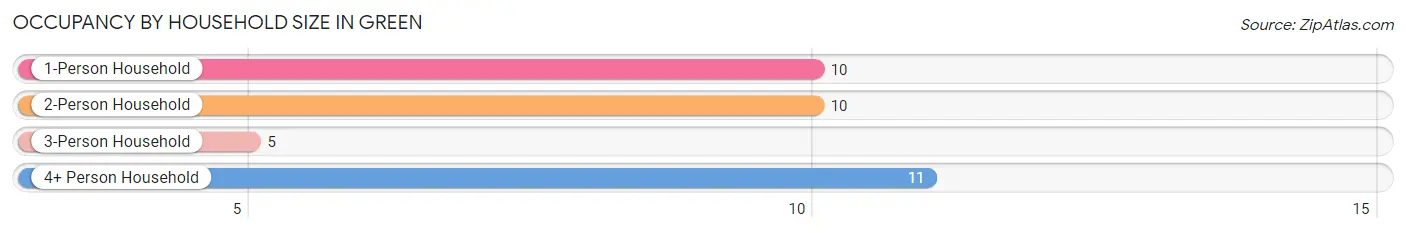
| Household Size | # Housing Units | % Housing Units |
| 1-Person Household | 10 | 27.8% |
| 2-Person Household | 10 | 27.8% |
| 3-Person Household | 5 | 13.9% |
| 4+ Person Household | 11 | 30.6% |
| Total Housing Units | 36 | 100.0% |
Occupancy by Ownership by Household Size in Green
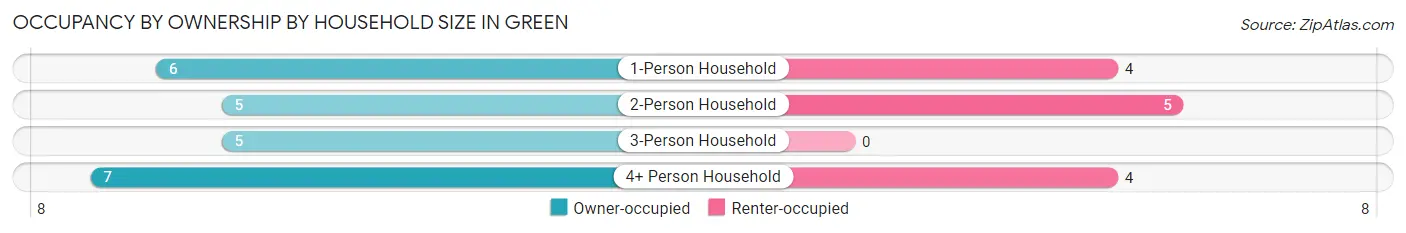
| Household Size | Owner-occupied | Renter-occupied |
| 1-Person Household | 6 (60.0%) | 4 (40.0%) |
| 2-Person Household | 5 (50.0%) | 5 (50.0%) |
| 3-Person Household | 5 (100.0%) | 0 (0.0%) |
| 4+ Person Household | 7 (63.6%) | 4 (36.4%) |
| Total Housing Units | 23 (63.9%) | 13 (36.1%) |
Occupancy by Educational Attainment in Green
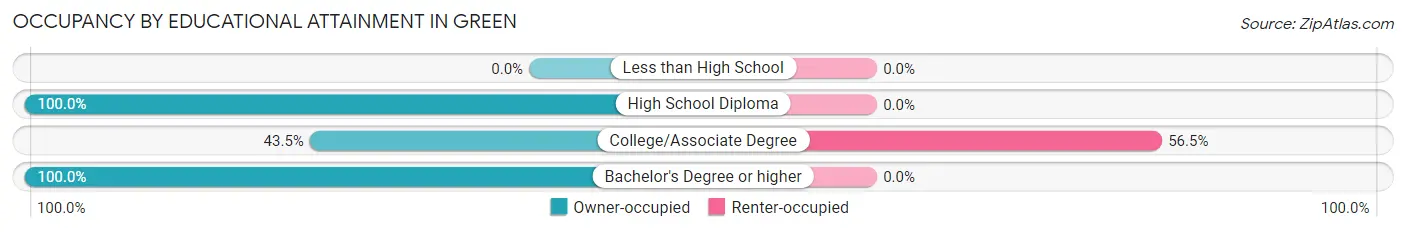
| Household Size | Owner-occupied | Renter-occupied |
| Less than High School | 0 (0.0%) | 0 (0.0%) |
| High School Diploma | 3 (100.0%) | 0 (0.0%) |
| College/Associate Degree | 10 (43.5%) | 13 (56.5%) |
| Bachelor's Degree or higher | 10 (100.0%) | 0 (0.0%) |
Occupancy by Age of Householder in Green
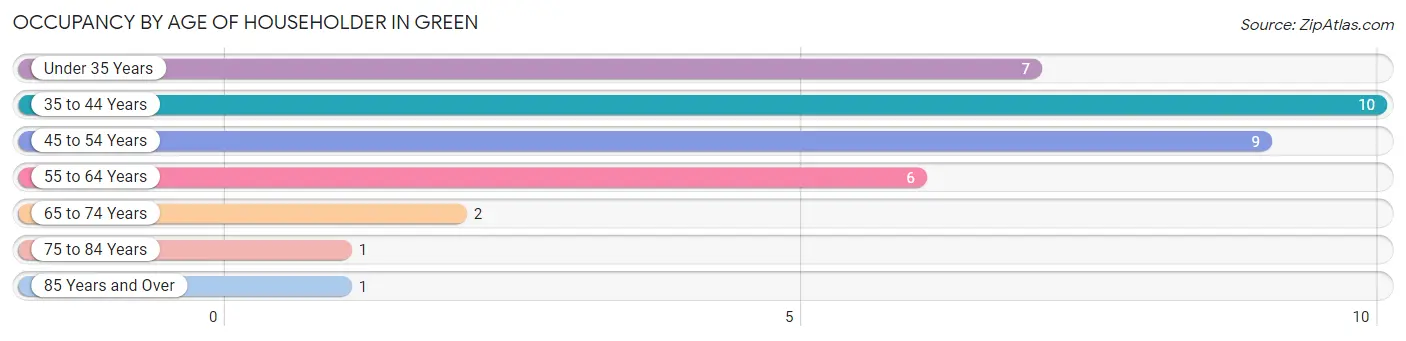
| Age Bracket | # Households | % Households |
| Under 35 Years | 7 | 19.4% |
| 35 to 44 Years | 10 | 27.8% |
| 45 to 54 Years | 9 | 25.0% |
| 55 to 64 Years | 6 | 16.7% |
| 65 to 74 Years | 2 | 5.6% |
| 75 to 84 Years | 1 | 2.8% |
| 85 Years and Over | 1 | 2.8% |
| Total | 36 | 100.0% |
Housing Finances in Green
Median Income by Occupancy in Green
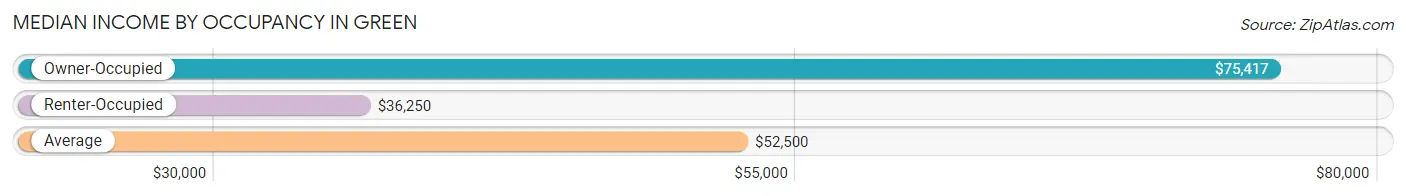
| Occupancy Type | # Households | Median Income |
| Owner-Occupied | 23 (63.9%) | $75,417 |
| Renter-Occupied | 13 (36.1%) | $36,250 |
| Average | 36 (100.0%) | $52,500 |
Occupancy by Householder Income Bracket in Green
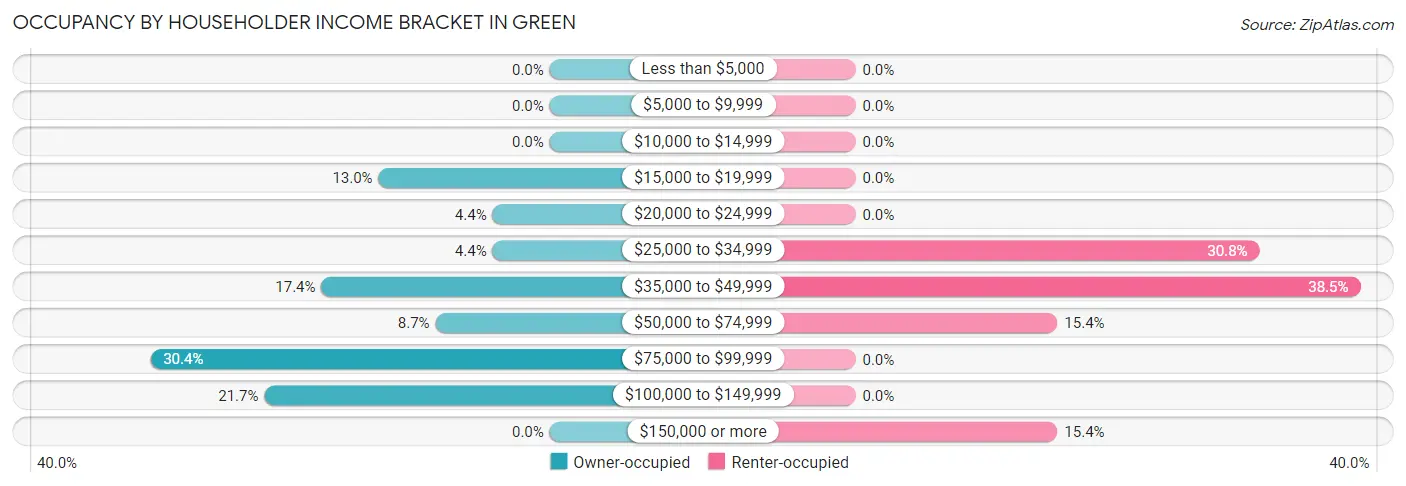
| Income Bracket | Owner-occupied | Renter-occupied |
| Less than $5,000 | 0 (0.0%) | 0 (0.0%) |
| $5,000 to $9,999 | 0 (0.0%) | 0 (0.0%) |
| $10,000 to $14,999 | 0 (0.0%) | 0 (0.0%) |
| $15,000 to $19,999 | 3 (13.0%) | 0 (0.0%) |
| $20,000 to $24,999 | 1 (4.3%) | 0 (0.0%) |
| $25,000 to $34,999 | 1 (4.3%) | 4 (30.8%) |
| $35,000 to $49,999 | 4 (17.4%) | 5 (38.5%) |
| $50,000 to $74,999 | 2 (8.7%) | 2 (15.4%) |
| $75,000 to $99,999 | 7 (30.4%) | 0 (0.0%) |
| $100,000 to $149,999 | 5 (21.7%) | 0 (0.0%) |
| $150,000 or more | 0 (0.0%) | 2 (15.4%) |
| Total | 23 (100.0%) | 13 (100.0%) |
Monthly Housing Cost Tiers in Green
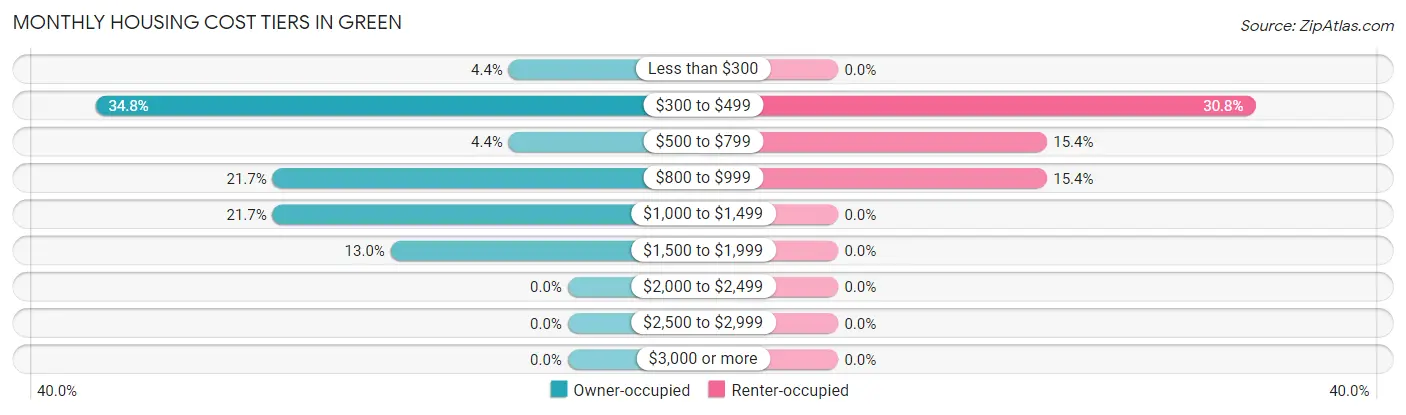
| Monthly Cost | Owner-occupied | Renter-occupied |
| Less than $300 | 1 (4.3%) | 0 (0.0%) |
| $300 to $499 | 8 (34.8%) | 4 (30.8%) |
| $500 to $799 | 1 (4.3%) | 2 (15.4%) |
| $800 to $999 | 5 (21.7%) | 2 (15.4%) |
| $1,000 to $1,499 | 5 (21.7%) | 0 (0.0%) |
| $1,500 to $1,999 | 3 (13.0%) | 0 (0.0%) |
| $2,000 to $2,499 | 0 (0.0%) | 0 (0.0%) |
| $2,500 to $2,999 | 0 (0.0%) | 0 (0.0%) |
| $3,000 or more | 0 (0.0%) | 0 (0.0%) |
| Total | 23 (100.0%) | 13 (100.0%) |
Physical Housing Characteristics in Green
Housing Structures in Green
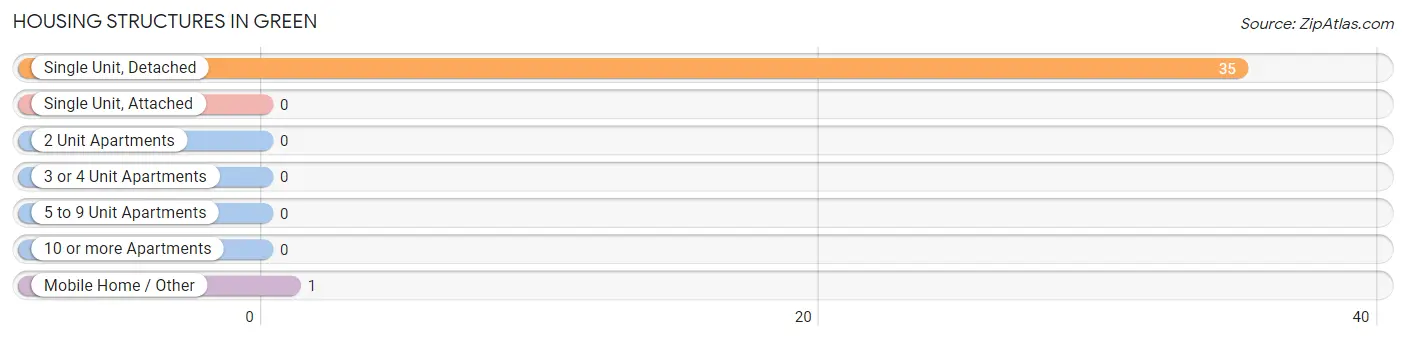
| Structure Type | # Housing Units | % Housing Units |
| Single Unit, Detached | 35 | 97.2% |
| Single Unit, Attached | 0 | 0.0% |
| 2 Unit Apartments | 0 | 0.0% |
| 3 or 4 Unit Apartments | 0 | 0.0% |
| 5 to 9 Unit Apartments | 0 | 0.0% |
| 10 or more Apartments | 0 | 0.0% |
| Mobile Home / Other | 1 | 2.8% |
| Total | 36 | 100.0% |
Housing Structures by Occupancy in Green
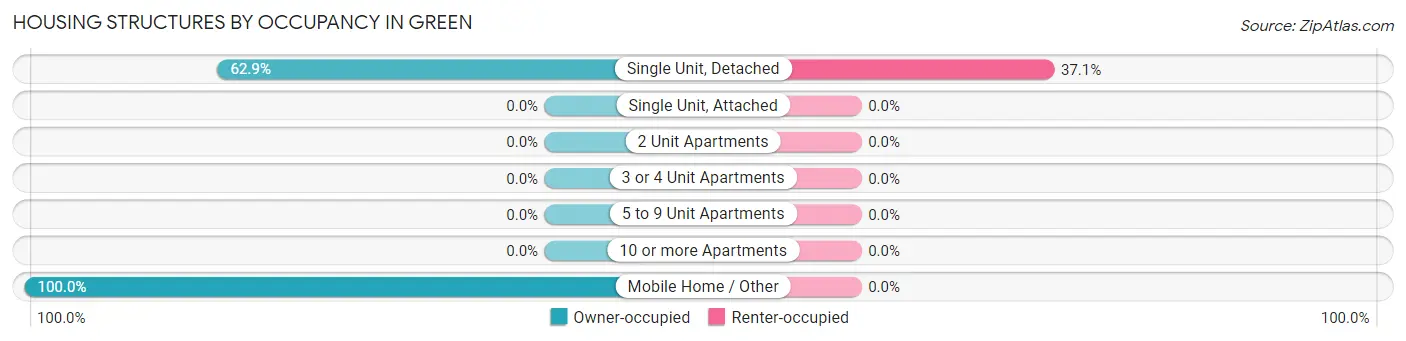
| Structure Type | Owner-occupied | Renter-occupied |
| Single Unit, Detached | 22 (62.9%) | 13 (37.1%) |
| Single Unit, Attached | 0 (0.0%) | 0 (0.0%) |
| 2 Unit Apartments | 0 (0.0%) | 0 (0.0%) |
| 3 or 4 Unit Apartments | 0 (0.0%) | 0 (0.0%) |
| 5 to 9 Unit Apartments | 0 (0.0%) | 0 (0.0%) |
| 10 or more Apartments | 0 (0.0%) | 0 (0.0%) |
| Mobile Home / Other | 1 (100.0%) | 0 (0.0%) |
| Total | 23 (63.9%) | 13 (36.1%) |
Housing Structures by Number of Rooms in Green
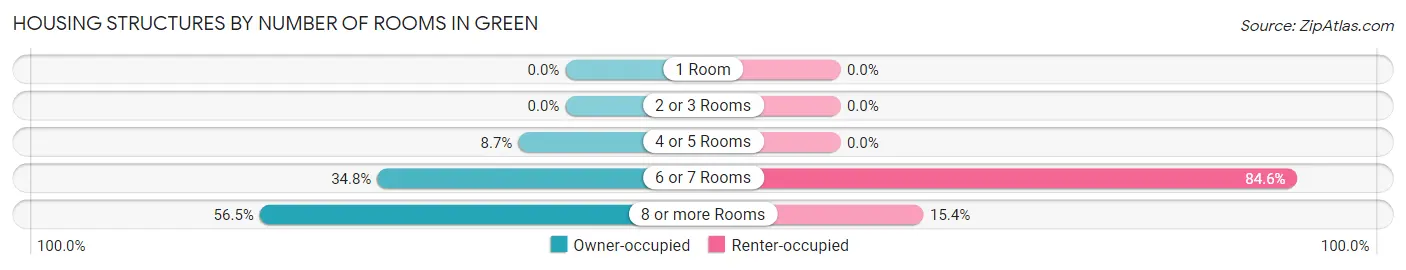
| Number of Rooms | Owner-occupied | Renter-occupied |
| 1 Room | 0 (0.0%) | 0 (0.0%) |
| 2 or 3 Rooms | 0 (0.0%) | 0 (0.0%) |
| 4 or 5 Rooms | 2 (8.7%) | 0 (0.0%) |
| 6 or 7 Rooms | 8 (34.8%) | 11 (84.6%) |
| 8 or more Rooms | 13 (56.5%) | 2 (15.4%) |
| Total | 23 (100.0%) | 13 (100.0%) |
Housing Structure by Heating Type in Green
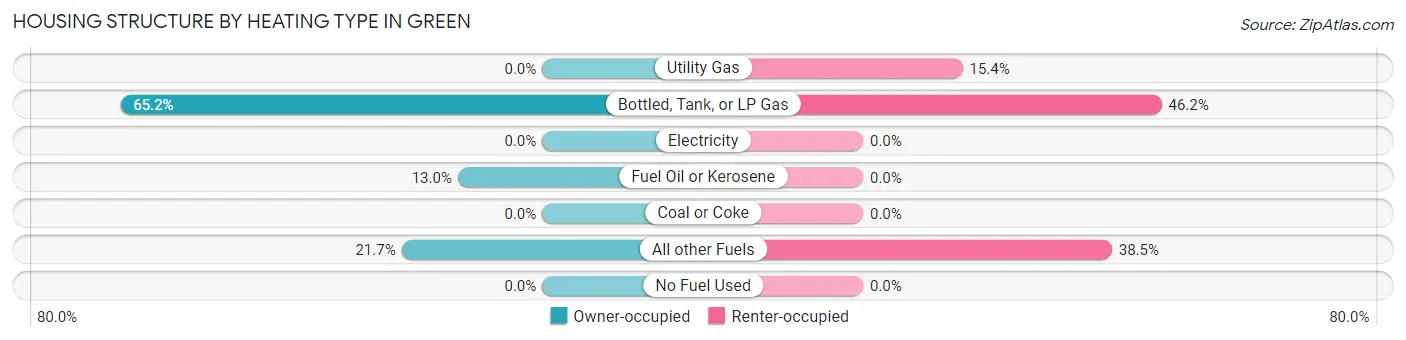
| Heating Type | Owner-occupied | Renter-occupied |
| Utility Gas | 0 (0.0%) | 2 (15.4%) |
| Bottled, Tank, or LP Gas | 15 (65.2%) | 6 (46.2%) |
| Electricity | 0 (0.0%) | 0 (0.0%) |
| Fuel Oil or Kerosene | 3 (13.0%) | 0 (0.0%) |
| Coal or Coke | 0 (0.0%) | 0 (0.0%) |
| All other Fuels | 5 (21.7%) | 5 (38.5%) |
| No Fuel Used | 0 (0.0%) | 0 (0.0%) |
| Total | 23 (100.0%) | 13 (100.0%) |
Household Vehicle Usage in Green
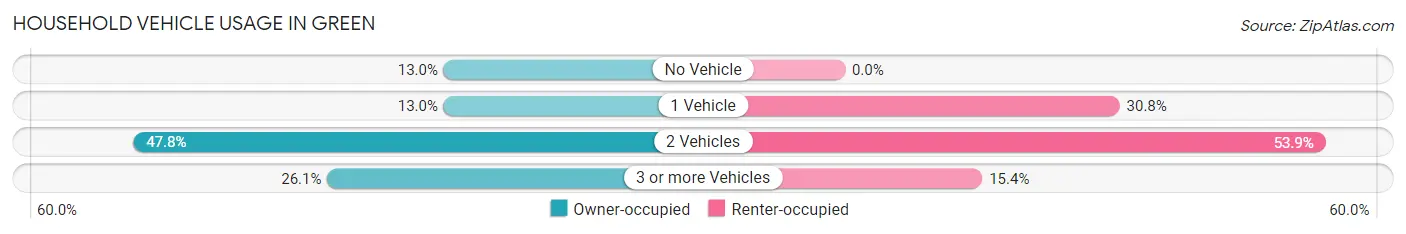
| Vehicles per Household | Owner-occupied | Renter-occupied |
| No Vehicle | 3 (13.0%) | 0 (0.0%) |
| 1 Vehicle | 3 (13.0%) | 4 (30.8%) |
| 2 Vehicles | 11 (47.8%) | 7 (53.8%) |
| 3 or more Vehicles | 6 (26.1%) | 2 (15.4%) |
| Total | 23 (100.0%) | 13 (100.0%) |
Real Estate & Mortgages in Green
Real Estate and Mortgage Overview in Green
| Characteristic | Without Mortgage | With Mortgage |
| Housing Units | 12 | 11 |
| Median Property Value | $45,000 | $152,100 |
| Median Household Income | $38,750 | $0 |
| Monthly Housing Costs | $440 | $0 |
| Real Estate Taxes | $680 | $0 |
Property Value by Mortgage Status in Green
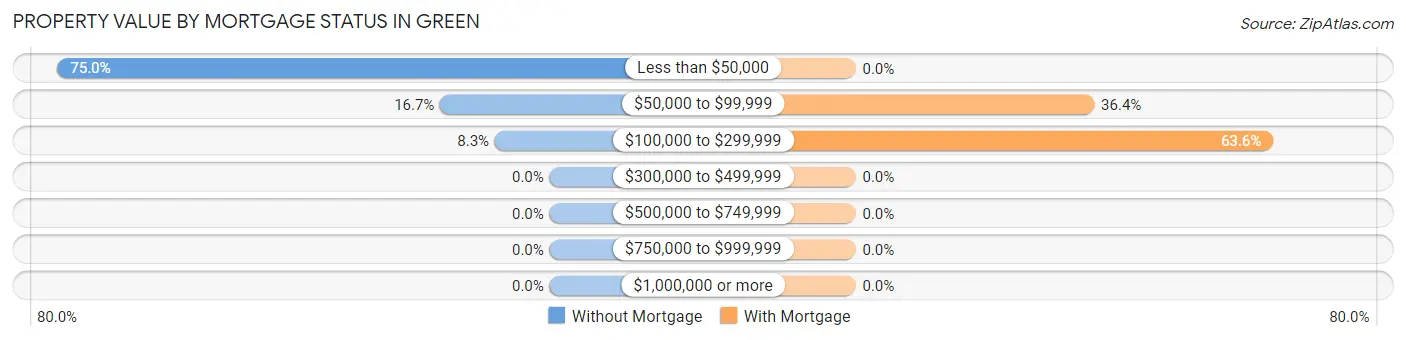
| Property Value | Without Mortgage | With Mortgage |
| Less than $50,000 | 9 (75.0%) | 0 (0.0%) |
| $50,000 to $99,999 | 2 (16.7%) | 4 (36.4%) |
| $100,000 to $299,999 | 1 (8.3%) | 7 (63.6%) |
| $300,000 to $499,999 | 0 (0.0%) | 0 (0.0%) |
| $500,000 to $749,999 | 0 (0.0%) | 0 (0.0%) |
| $750,000 to $999,999 | 0 (0.0%) | 0 (0.0%) |
| $1,000,000 or more | 0 (0.0%) | 0 (0.0%) |
| Total | 12 (100.0%) | 11 (100.0%) |
Household Income by Mortgage Status in Green
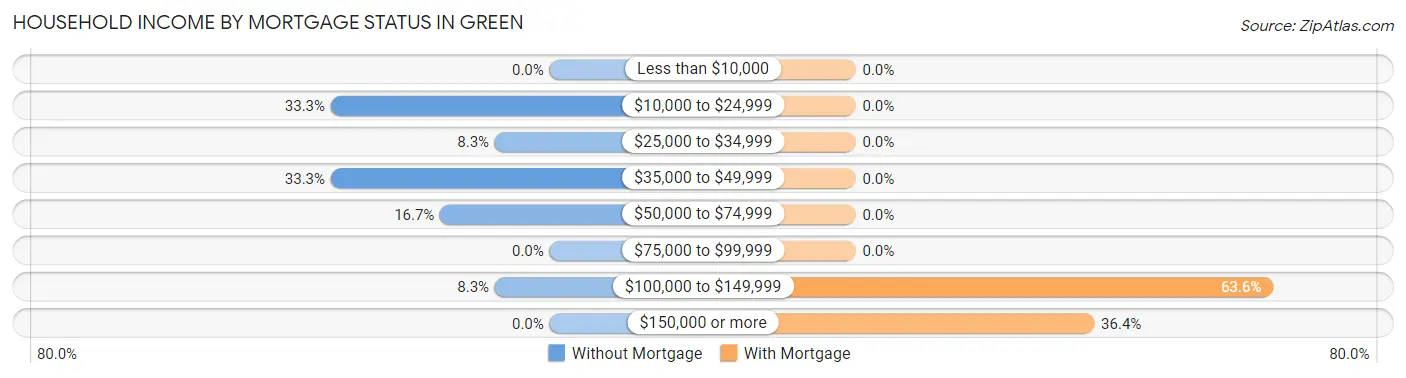
| Household Income | Without Mortgage | With Mortgage |
| Less than $10,000 | 0 (0.0%) | 0 (0.0%) |
| $10,000 to $24,999 | 4 (33.3%) | 0 (0.0%) |
| $25,000 to $34,999 | 1 (8.3%) | 0 (0.0%) |
| $35,000 to $49,999 | 4 (33.3%) | 0 (0.0%) |
| $50,000 to $74,999 | 2 (16.7%) | 0 (0.0%) |
| $75,000 to $99,999 | 0 (0.0%) | 0 (0.0%) |
| $100,000 to $149,999 | 1 (8.3%) | 7 (63.6%) |
| $150,000 or more | 0 (0.0%) | 4 (36.4%) |
| Total | 12 (100.0%) | 11 (100.0%) |
Property Value to Household Income Ratio in Green
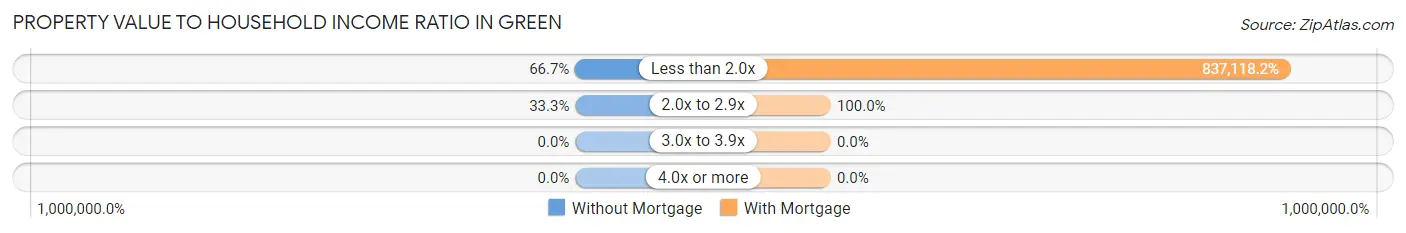
| Value-to-Income Ratio | Without Mortgage | With Mortgage |
| Less than 2.0x | 8 (66.7%) | 92,083 (837,118.2%) |
| 2.0x to 2.9x | 4 (33.3%) | 11 (100.0%) |
| 3.0x to 3.9x | 0 (0.0%) | 0 (0.0%) |
| 4.0x or more | 0 (0.0%) | 0 (0.0%) |
| Total | 12 (100.0%) | 11 (100.0%) |
Real Estate Taxes by Mortgage Status in Green
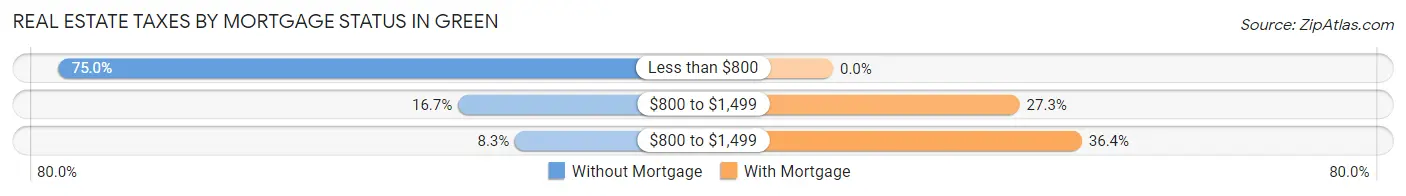
| Property Taxes | Without Mortgage | With Mortgage |
| Less than $800 | 9 (75.0%) | 0 (0.0%) |
| $800 to $1,499 | 2 (16.7%) | 3 (27.3%) |
| $800 to $1,499 | 1 (8.3%) | 4 (36.4%) |
| Total | 12 (100.0%) | 11 (100.0%) |
Health & Disability in Green
Health Insurance Coverage by Age in Green
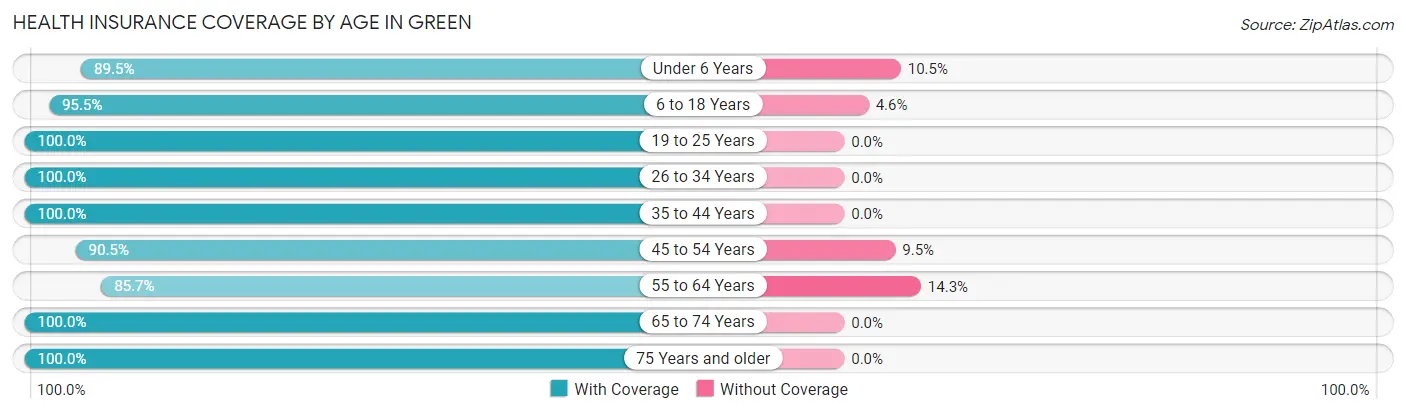
| Age Bracket | With Coverage | Without Coverage |
| Under 6 Years | 17 (89.5%) | 2 (10.5%) |
| 6 to 18 Years | 21 (95.5%) | 1 (4.5%) |
| 19 to 25 Years | 10 (100.0%) | 0 (0.0%) |
| 26 to 34 Years | 8 (100.0%) | 0 (0.0%) |
| 35 to 44 Years | 12 (100.0%) | 0 (0.0%) |
| 45 to 54 Years | 19 (90.5%) | 2 (9.5%) |
| 55 to 64 Years | 6 (85.7%) | 1 (14.3%) |
| 65 to 74 Years | 4 (100.0%) | 0 (0.0%) |
| 75 Years and older | 2 (100.0%) | 0 (0.0%) |
| Total | 99 (94.3%) | 6 (5.7%) |
Health Insurance Coverage by Citizenship Status in Green
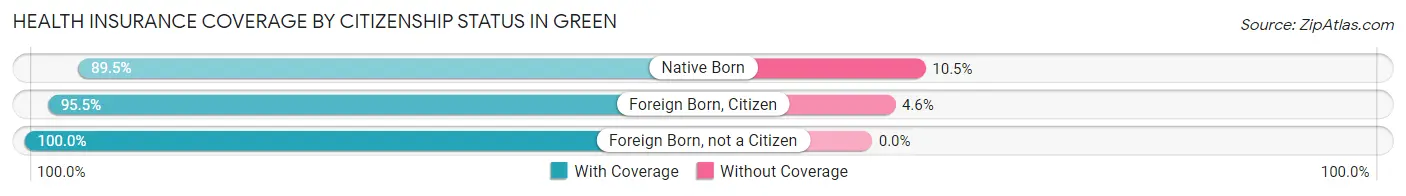
| Citizenship Status | With Coverage | Without Coverage |
| Native Born | 17 (89.5%) | 2 (10.5%) |
| Foreign Born, Citizen | 21 (95.5%) | 1 (4.5%) |
| Foreign Born, not a Citizen | 10 (100.0%) | 0 (0.0%) |
Health Insurance Coverage by Household Income in Green
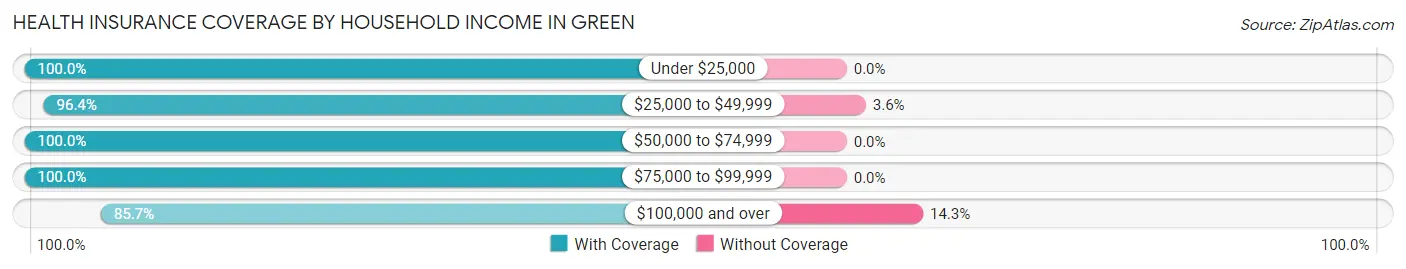
| Household Income | With Coverage | Without Coverage |
| Under $25,000 | 4 (100.0%) | 0 (0.0%) |
| $25,000 to $49,999 | 27 (96.4%) | 1 (3.6%) |
| $50,000 to $74,999 | 11 (100.0%) | 0 (0.0%) |
| $75,000 to $99,999 | 27 (100.0%) | 0 (0.0%) |
| $100,000 and over | 30 (85.7%) | 5 (14.3%) |
Public vs Private Health Insurance Coverage by Age in Green
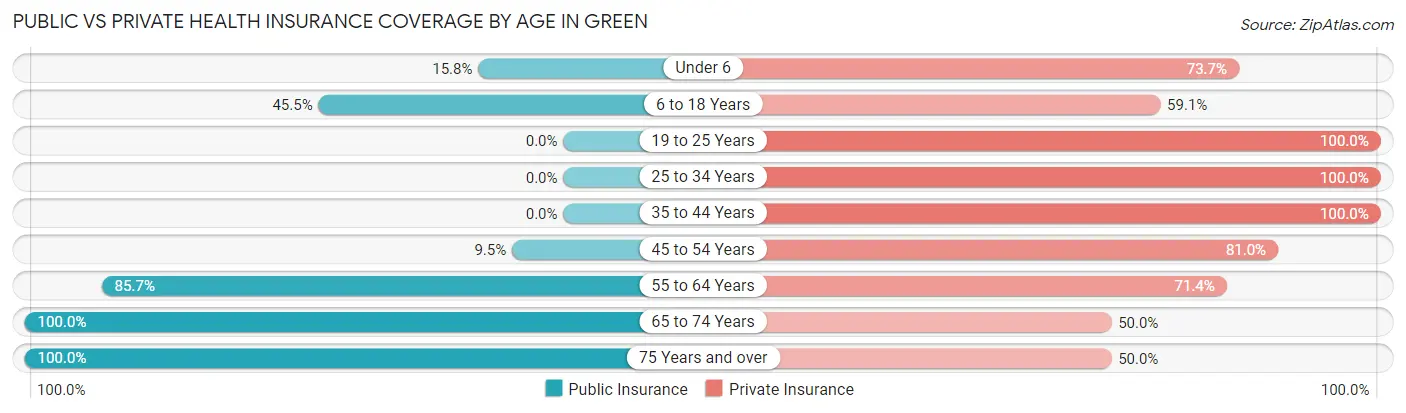
| Age Bracket | Public Insurance | Private Insurance |
| Under 6 | 3 (15.8%) | 14 (73.7%) |
| 6 to 18 Years | 10 (45.5%) | 13 (59.1%) |
| 19 to 25 Years | 0 (0.0%) | 10 (100.0%) |
| 25 to 34 Years | 0 (0.0%) | 8 (100.0%) |
| 35 to 44 Years | 0 (0.0%) | 12 (100.0%) |
| 45 to 54 Years | 2 (9.5%) | 17 (80.9%) |
| 55 to 64 Years | 6 (85.7%) | 5 (71.4%) |
| 65 to 74 Years | 4 (100.0%) | 2 (50.0%) |
| 75 Years and over | 2 (100.0%) | 1 (50.0%) |
| Total | 27 (25.7%) | 82 (78.1%) |
Disability Status by Sex by Age in Green
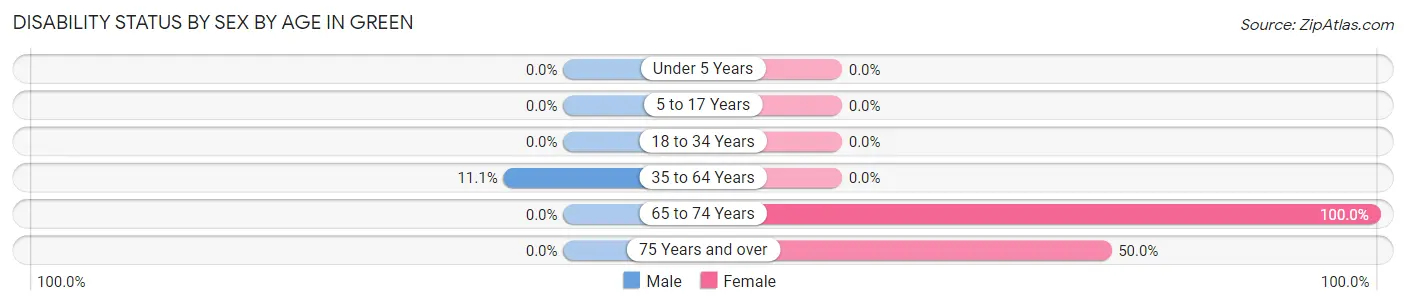
| Age Bracket | Male | Female |
| Under 5 Years | 0 (0.0%) | 0 (0.0%) |
| 5 to 17 Years | 0 (0.0%) | 0 (0.0%) |
| 18 to 34 Years | 0 (0.0%) | 0 (0.0%) |
| 35 to 64 Years | 3 (11.1%) | 0 (0.0%) |
| 65 to 74 Years | 0 (0.0%) | 1 (100.0%) |
| 75 Years and over | 0 (0.0%) | 1 (50.0%) |
Disability Class by Sex by Age in Green
Disability Class: Hearing Difficulty
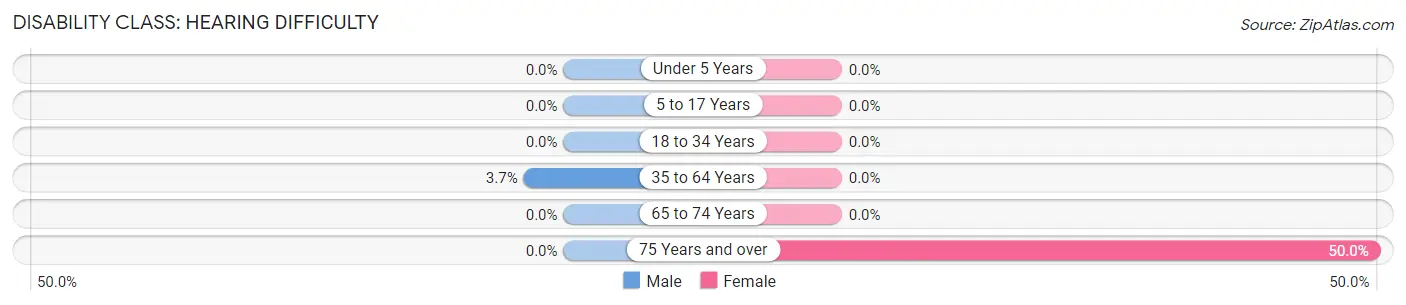
| Age Bracket | Male | Female |
| Under 5 Years | 0 (0.0%) | 0 (0.0%) |
| 5 to 17 Years | 0 (0.0%) | 0 (0.0%) |
| 18 to 34 Years | 0 (0.0%) | 0 (0.0%) |
| 35 to 64 Years | 1 (3.7%) | 0 (0.0%) |
| 65 to 74 Years | 0 (0.0%) | 0 (0.0%) |
| 75 Years and over | 0 (0.0%) | 1 (50.0%) |
Disability Class: Vision Difficulty
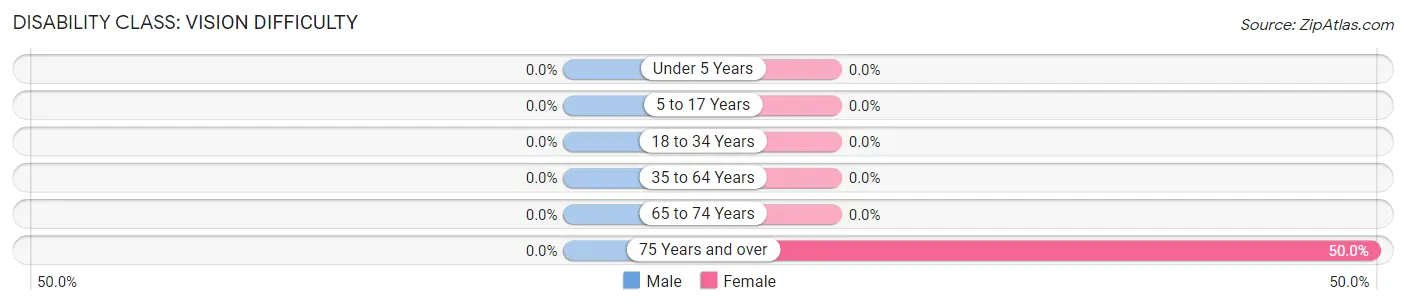
| Age Bracket | Male | Female |
| Under 5 Years | 0 (0.0%) | 0 (0.0%) |
| 5 to 17 Years | 0 (0.0%) | 0 (0.0%) |
| 18 to 34 Years | 0 (0.0%) | 0 (0.0%) |
| 35 to 64 Years | 0 (0.0%) | 0 (0.0%) |
| 65 to 74 Years | 0 (0.0%) | 0 (0.0%) |
| 75 Years and over | 0 (0.0%) | 1 (50.0%) |
Disability Class: Cognitive Difficulty
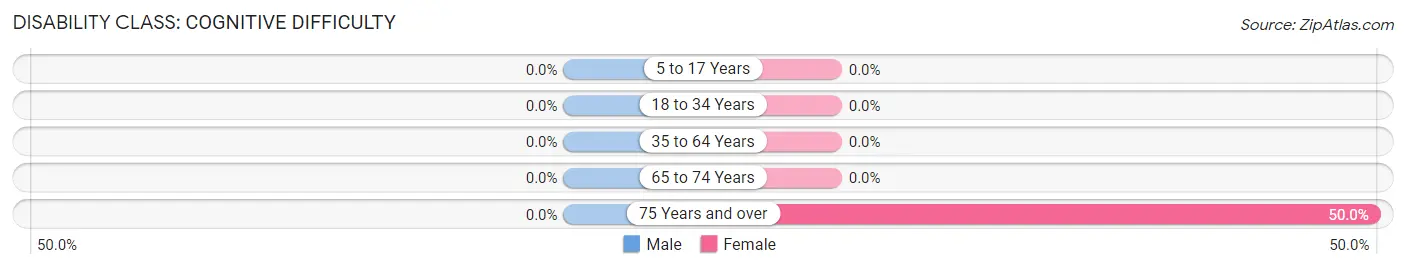
| Age Bracket | Male | Female |
| 5 to 17 Years | 0 (0.0%) | 0 (0.0%) |
| 18 to 34 Years | 0 (0.0%) | 0 (0.0%) |
| 35 to 64 Years | 0 (0.0%) | 0 (0.0%) |
| 65 to 74 Years | 0 (0.0%) | 0 (0.0%) |
| 75 Years and over | 0 (0.0%) | 1 (50.0%) |
Disability Class: Ambulatory Difficulty
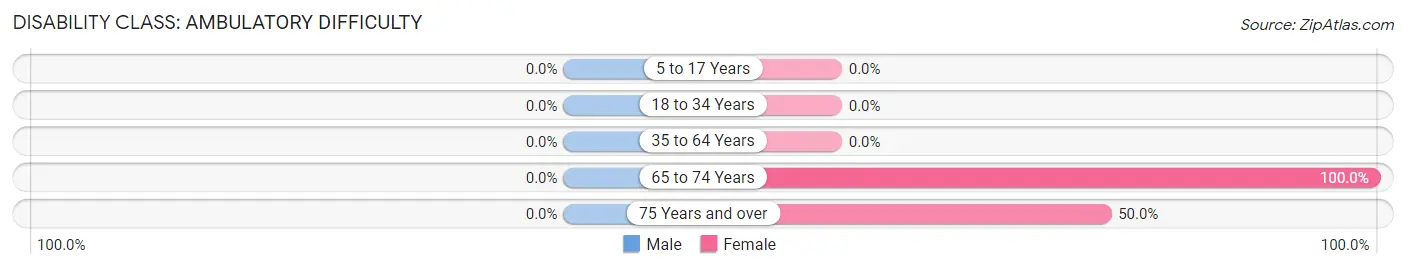
| Age Bracket | Male | Female |
| 5 to 17 Years | 0 (0.0%) | 0 (0.0%) |
| 18 to 34 Years | 0 (0.0%) | 0 (0.0%) |
| 35 to 64 Years | 0 (0.0%) | 0 (0.0%) |
| 65 to 74 Years | 0 (0.0%) | 1 (100.0%) |
| 75 Years and over | 0 (0.0%) | 1 (50.0%) |
Disability Class: Self-Care Difficulty
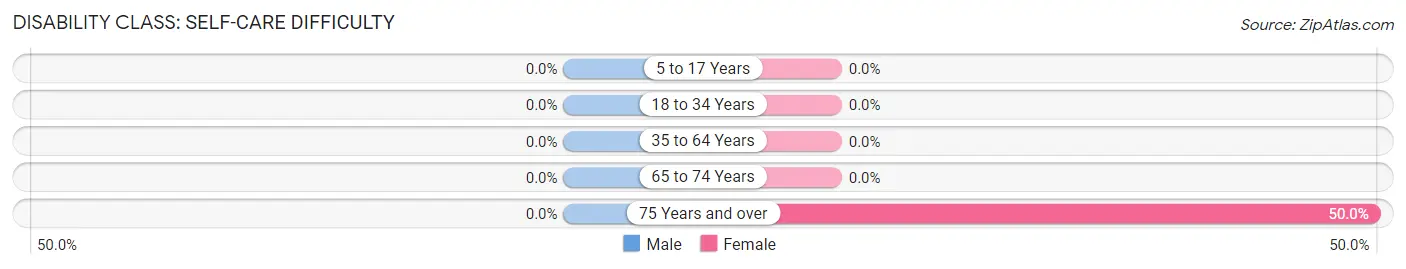
| Age Bracket | Male | Female |
| 5 to 17 Years | 0 (0.0%) | 0 (0.0%) |
| 18 to 34 Years | 0 (0.0%) | 0 (0.0%) |
| 35 to 64 Years | 0 (0.0%) | 0 (0.0%) |
| 65 to 74 Years | 0 (0.0%) | 0 (0.0%) |
| 75 Years and over | 0 (0.0%) | 1 (50.0%) |
Technology Access in Green
Computing Device Access in Green
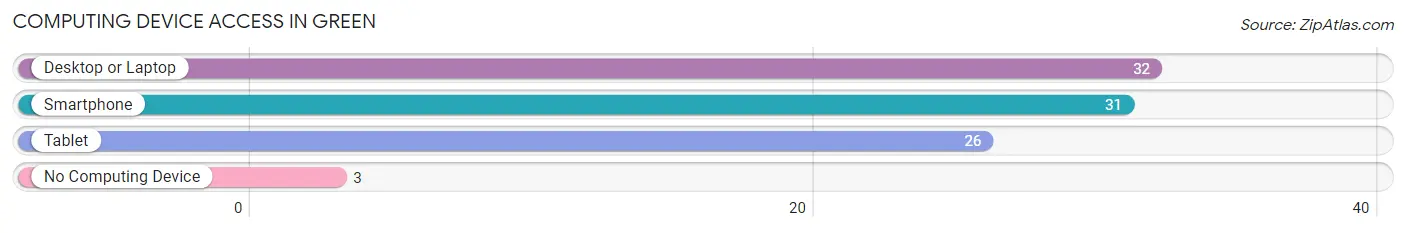
| Device Type | # Households | % Households |
| Desktop or Laptop | 32 | 88.9% |
| Smartphone | 31 | 86.1% |
| Tablet | 26 | 72.2% |
| No Computing Device | 3 | 8.3% |
| Total | 36 | 100.0% |
Internet Access in Green
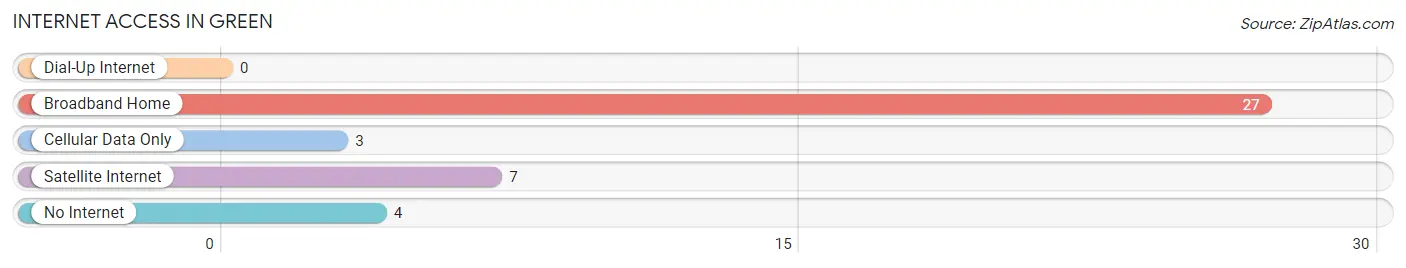
| Internet Type | # Households | % Households |
| Dial-Up Internet | 0 | 0.0% |
| Broadband Home | 27 | 75.0% |
| Cellular Data Only | 3 | 8.3% |
| Satellite Internet | 7 | 19.4% |
| No Internet | 4 | 11.1% |
| Total | 36 | 100.0% |
Green Summary
Green, Kansas is a small city located in the northeastern corner of the state. It is situated in the Flint Hills region of Kansas, and is part of the Manhattan metropolitan area. The city has a population of approximately 1,400 people, and is the county seat of Clay County.
Geography
Green is located in the Flint Hills region of Kansas, and is situated in the northeastern corner of the state. The city is located at the intersection of U.S. Route 24 and Kansas Highway 9. The city is situated on the banks of the Republican River, and is surrounded by rolling hills and prairies. The city is located approximately 30 miles south of Manhattan, and is approximately 90 miles west of Topeka.
Climate
Green has a humid continental climate, with hot summers and cold winters. The average annual temperature is 54 degrees Fahrenheit, and the average annual precipitation is approximately 30 inches. The city experiences all four seasons, with the warmest months being June, July, and August, and the coldest months being December, January, and February.
Economy
Green’s economy is largely based on agriculture and manufacturing. The city is home to several large agricultural operations, including cattle ranches, grain farms, and dairy farms. The city is also home to several manufacturing companies, including a plastics factory and a metal fabrication plant. The city is also home to several small businesses, including restaurants, retail stores, and service providers.
Demographics
As of the 2010 census, the population of Green was 1,400 people. The racial makeup of the city was 95.6% White, 0.6% African American, 0.4% Native American, 0.4% Asian, 0.1% Pacific Islander, 0.9% from other races, and 1.9% from two or more races. Hispanic or Latino of any race were 2.3% of the population.
The median income for a household in Green was $37,500, and the median income for a family was $45,000. The per capita income for the city was $18,000. About 11.2% of families and 14.2% of the population were below the poverty line, including 18.2% of those under age 18 and 8.3% of those age 65 or over.
History
Green was founded in 1872, and was named after the nearby Green Creek. The city was originally a trading post for settlers in the area, and was later incorporated in 1887. The city was an important stop on the Santa Fe Trail, and was also a major stop on the Union Pacific Railroad. The city was also home to several military installations during World War II, and was the site of a prisoner of war camp.
Today, Green is a small city with a population of approximately 1,400 people. The city is home to several small businesses, and is a popular destination for tourists who are interested in exploring the Flint Hills region of Kansas. The city is also home to several historic sites, including the Clay County Courthouse and the Clay County Museum.
Common Questions
What is Per Capita Income in Green?
Per Capita income in Green is $24,951.
What is the Median Family Income in Green?
Median Family Income in Green is $75,833.
What is the Median Household income in Green?
Median Household Income in Green is $52,500.
What is Income or Wage Gap in Green?
Income or Wage Gap in Green is 16.1%.
Women in Green earn 83.9 cents for every dollar earned by a man.
What is Inequality or Gini Index in Green?
Inequality or Gini Index in Green is 0.36.
What is the Total Population of Green?
Total Population of Green is 105.
What is the Total Male Population of Green?
Total Male Population of Green is 49.
What is the Total Female Population of Green?
Total Female Population of Green is 56.
What is the Ratio of Males per 100 Females in Green?
There are 87.50 Males per 100 Females in Green.
What is the Ratio of Females per 100 Males in Green?
There are 114.29 Females per 100 Males in Green.
What is the Median Population Age in Green?
Median Population Age in Green is 27.5 Years.
What is the Average Family Size in Green
Average Family Size in Green is 3.6 People.
What is the Average Household Size in Green
Average Household Size in Green is 2.9 People.
How Large is the Labor Force in Green?
There are 57 People in the Labor Forcein in Green.
What is the Percentage of People in the Labor Force in Green?
81.4% of People are in the Labor Force in Green.