Great Bend, KS Map & Demographics
Great Bend Map
Great Bend Overview
$29,069
PER CAPITA INCOME
$71,957
AVG FAMILY INCOME
$53,885
AVG HOUSEHOLD INCOME
30.8%
WAGE / INCOME GAP [ % ]
69.2¢/ $1
WAGE / INCOME GAP [ $ ]
0.43
INEQUALITY / GINI INDEX
14,725
TOTAL POPULATION
7,059
MALE POPULATION
7,666
FEMALE POPULATION
92.08
MALES / 100 FEMALES
108.60
FEMALES / 100 MALES
36.5
MEDIAN AGE
3.2
AVG FAMILY SIZE
2.5
AVG HOUSEHOLD SIZE
7,559
LABOR FORCE [ PEOPLE ]
66.4%
PERCENT IN LABOR FORCE
4.8%
UNEMPLOYMENT RATE
Great Bend Zip Codes
Great Bend Area Codes
Income in Great Bend
Income Overview in Great Bend
Per Capita Income in Great Bend is $29,069, while median incomes of families and households are $71,957 and $53,885 respectively.
| Characteristic | Number | Measure |
| Per Capita Income | 14,725 | $29,069 |
| Median Family Income | 3,461 | $71,957 |
| Mean Family Income | 3,461 | $87,883 |
| Median Household Income | 5,721 | $53,885 |
| Mean Household Income | 5,721 | $70,142 |
| Income Deficit | 3,461 | $0 |
| Wage / Income Gap (%) | 14,725 | 30.79% |
| Wage / Income Gap ($) | 14,725 | 69.21¢ per $1 |
| Gini / Inequality Index | 14,725 | 0.43 |
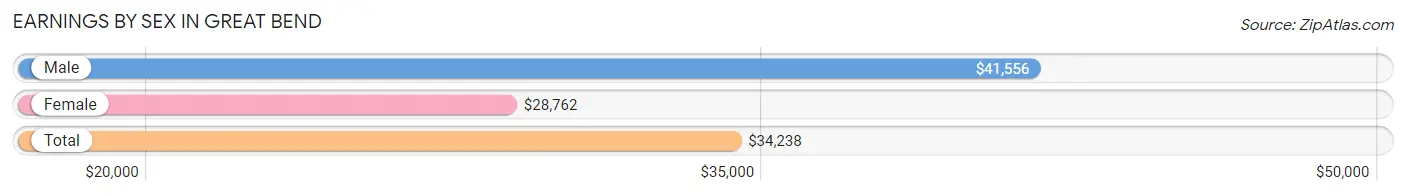
Earnings by Sex in Great Bend
Average Earnings in Great Bend are $34,238, $41,556 for men and $28,762 for women, a difference of 30.8%.
| Sex | Number | Average Earnings |
| Male | 4,061 (52.8%) | $41,556 |
| Female | 3,632 (47.2%) | $28,762 |
| Total | 7,693 (100.0%) | $34,238 |
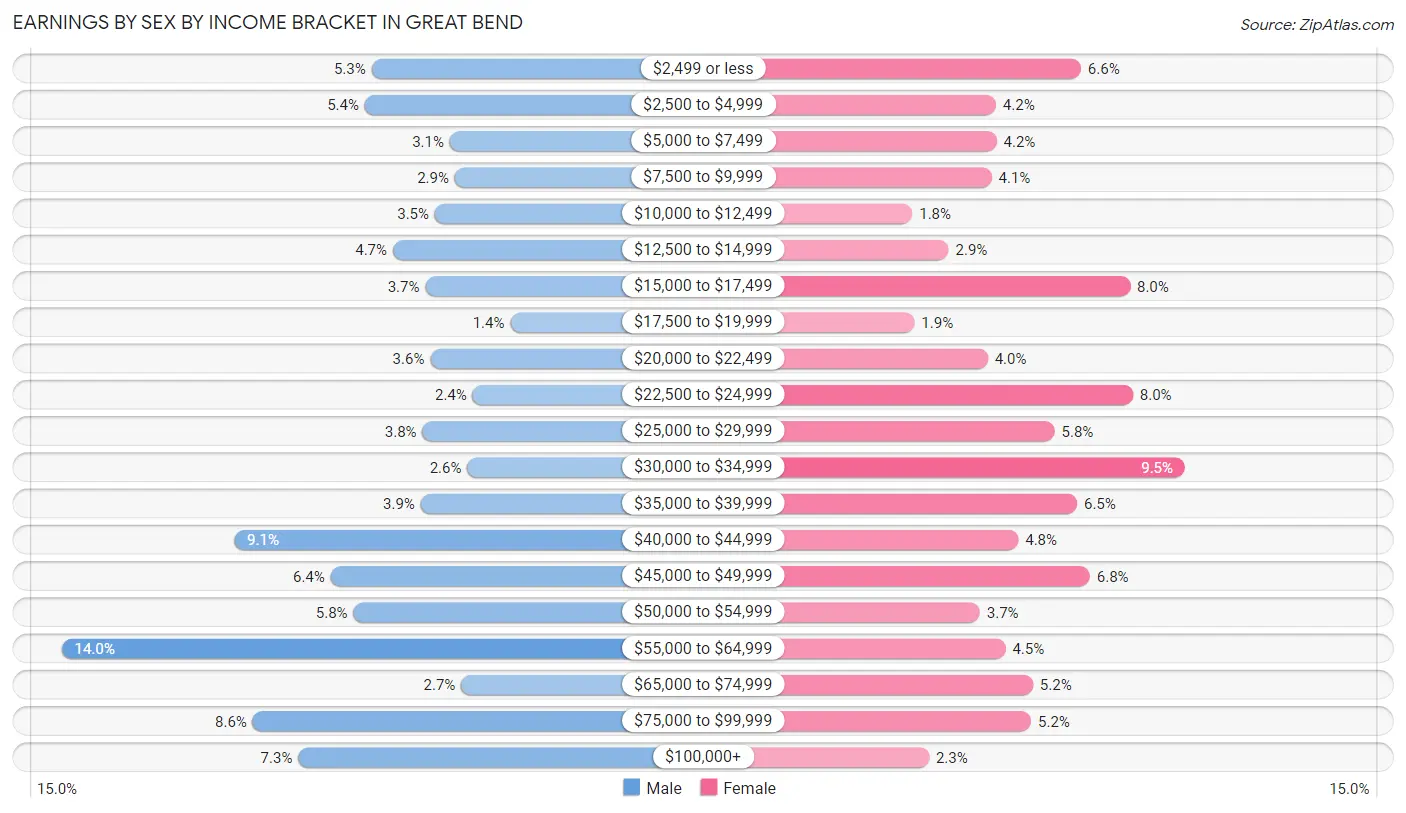
Earnings by Sex by Income Bracket in Great Bend
The most common earnings brackets in Great Bend are $55,000 to $64,999 for men (567 | 14.0%) and $30,000 to $34,999 for women (345 | 9.5%).
| Income | Male | Female |
| $2,499 or less | 213 (5.2%) | 239 (6.6%) |
| $2,500 to $4,999 | 221 (5.4%) | 152 (4.2%) |
| $5,000 to $7,499 | 124 (3.0%) | 153 (4.2%) |
| $7,500 to $9,999 | 118 (2.9%) | 148 (4.1%) |
| $10,000 to $12,499 | 141 (3.5%) | 67 (1.8%) |
| $12,500 to $14,999 | 189 (4.6%) | 104 (2.9%) |
| $15,000 to $17,499 | 152 (3.7%) | 289 (8.0%) |
| $17,500 to $19,999 | 55 (1.3%) | 69 (1.9%) |
| $20,000 to $22,499 | 146 (3.6%) | 144 (4.0%) |
| $22,500 to $24,999 | 98 (2.4%) | 292 (8.0%) |
| $25,000 to $29,999 | 155 (3.8%) | 212 (5.8%) |
| $30,000 to $34,999 | 104 (2.6%) | 345 (9.5%) |
| $35,000 to $39,999 | 157 (3.9%) | 235 (6.5%) |
| $40,000 to $44,999 | 370 (9.1%) | 175 (4.8%) |
| $45,000 to $49,999 | 260 (6.4%) | 248 (6.8%) |
| $50,000 to $54,999 | 234 (5.8%) | 136 (3.7%) |
| $55,000 to $64,999 | 567 (14.0%) | 162 (4.5%) |
| $65,000 to $74,999 | 111 (2.7%) | 190 (5.2%) |
| $75,000 to $99,999 | 349 (8.6%) | 188 (5.2%) |
| $100,000+ | 297 (7.3%) | 84 (2.3%) |
| Total | 4,061 (100.0%) | 3,632 (100.0%) |
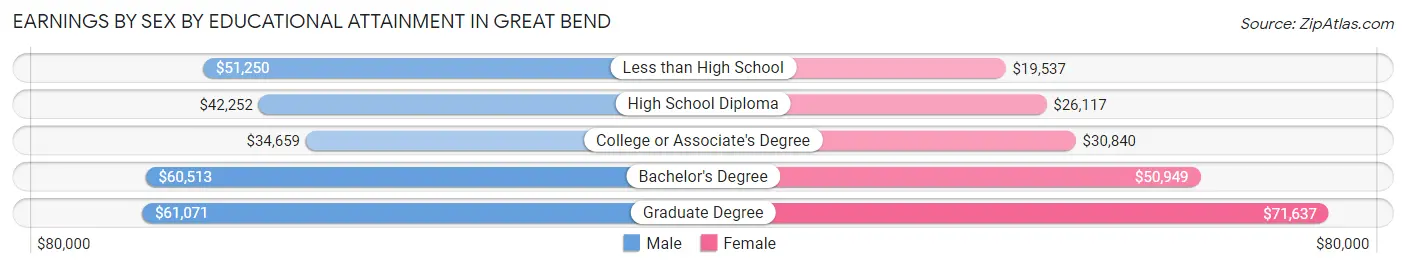
Earnings by Sex by Educational Attainment in Great Bend
Average earnings in Great Bend are $46,000 for men and $33,102 for women, a difference of 28.0%. Men with an educational attainment of graduate degree enjoy the highest average annual earnings of $61,071, while those with college or associate's degree education earn the least with $34,659. Women with an educational attainment of graduate degree earn the most with the average annual earnings of $71,637, while those with less than high school education have the smallest earnings of $19,537.
| Educational Attainment | Male Income | Female Income |
| Less than High School | $51,250 | $19,537 |
| High School Diploma | $42,252 | $26,117 |
| College or Associate's Degree | $34,659 | $30,840 |
| Bachelor's Degree | $60,513 | $50,949 |
| Graduate Degree | $61,071 | $71,637 |
| Total | $46,000 | $33,102 |
Family Income in Great Bend
Family Income Brackets in Great Bend
According to the Great Bend family income data, there are 640 families falling into the $50,000 to $74,999 income range, which is the most common income bracket and makes up 18.5% of all families. Conversely, the $10,000 to $14,999 income bracket is the least frequent group with only 42 families (1.2%) belonging to this category.
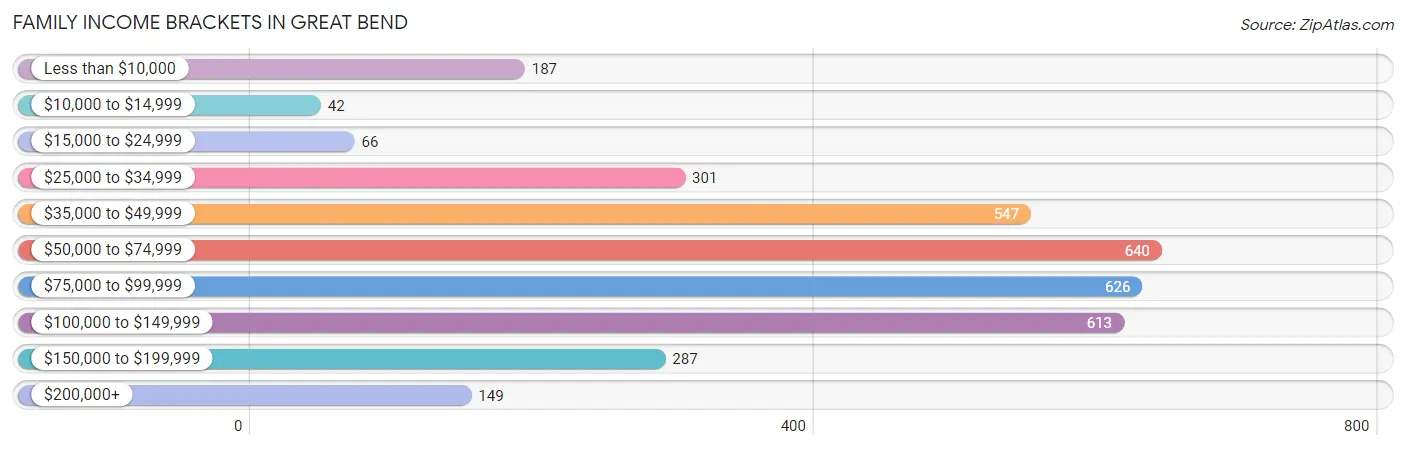
| Income Bracket | # Families | % Families |
| Less than $10,000 | 187 | 5.4% |
| $10,000 to $14,999 | 42 | 1.2% |
| $15,000 to $24,999 | 66 | 1.9% |
| $25,000 to $34,999 | 301 | 8.7% |
| $35,000 to $49,999 | 547 | 15.8% |
| $50,000 to $74,999 | 640 | 18.5% |
| $75,000 to $99,999 | 626 | 18.1% |
| $100,000 to $149,999 | 613 | 17.7% |
| $150,000 to $199,999 | 287 | 8.3% |
| $200,000+ | 149 | 4.3% |
Family Income by Famaliy Size in Great Bend
5-person families (163 | 4.7%) account for the highest median family income in Great Bend with $101,094 per family, while 2-person families (1,927 | 55.7%) have the highest median income of $35,112 per family member.
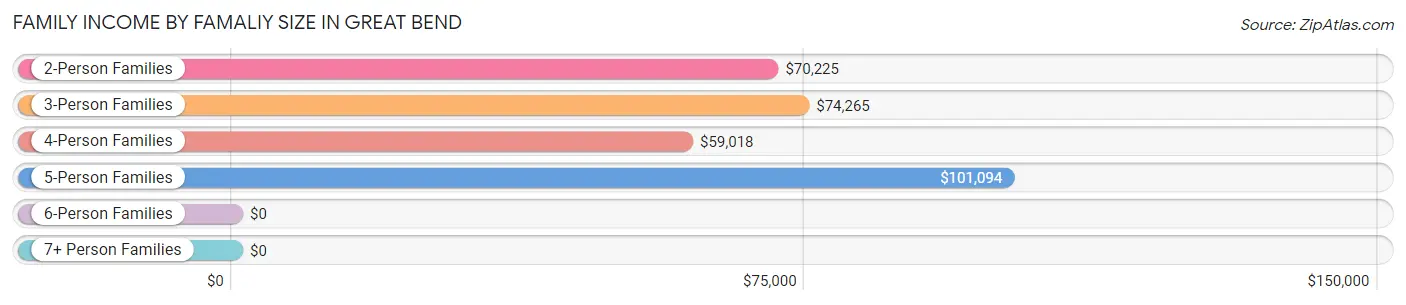
| Income Bracket | # Families | Median Income |
| 2-Person Families | 1,927 (55.7%) | $70,225 |
| 3-Person Families | 640 (18.5%) | $74,265 |
| 4-Person Families | 597 (17.2%) | $59,018 |
| 5-Person Families | 163 (4.7%) | $101,094 |
| 6-Person Families | 108 (3.1%) | $0 |
| 7+ Person Families | 26 (0.7%) | $0 |
| Total | 3,461 (100.0%) | $71,957 |
Family Income by Number of Earners in Great Bend
The median family income in Great Bend is $71,957, with families comprising 3+ earners (213) having the highest median family income of $127,991, while families with no earners (410) have the lowest median family income of $40,726, accounting for 6.1% and 11.8% of families, respectively.
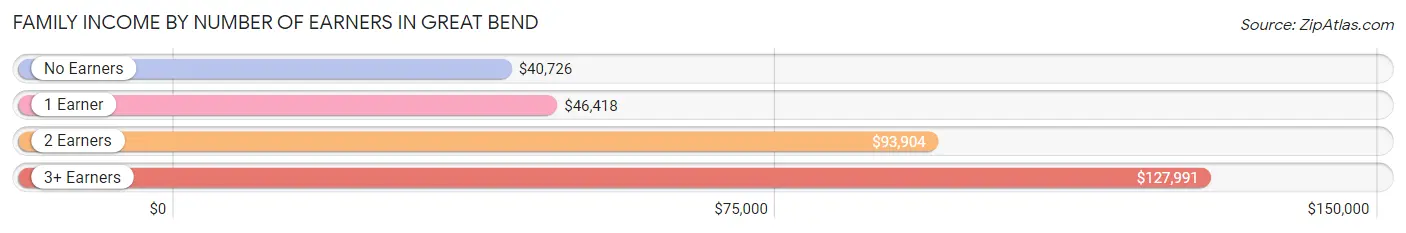
| Number of Earners | # Families | Median Income |
| No Earners | 410 (11.8%) | $40,726 |
| 1 Earner | 1,190 (34.4%) | $46,418 |
| 2 Earners | 1,648 (47.6%) | $93,904 |
| 3+ Earners | 213 (6.1%) | $127,991 |
| Total | 3,461 (100.0%) | $71,957 |
Household Income in Great Bend
Household Income Brackets in Great Bend
With 1,133 households falling in the category, the $50,000 to $74,999 income range is the most frequent in Great Bend, accounting for 19.8% of all households. In contrast, only 154 households (2.7%) fall into the $200,000+ income bracket, making it the least populous group.
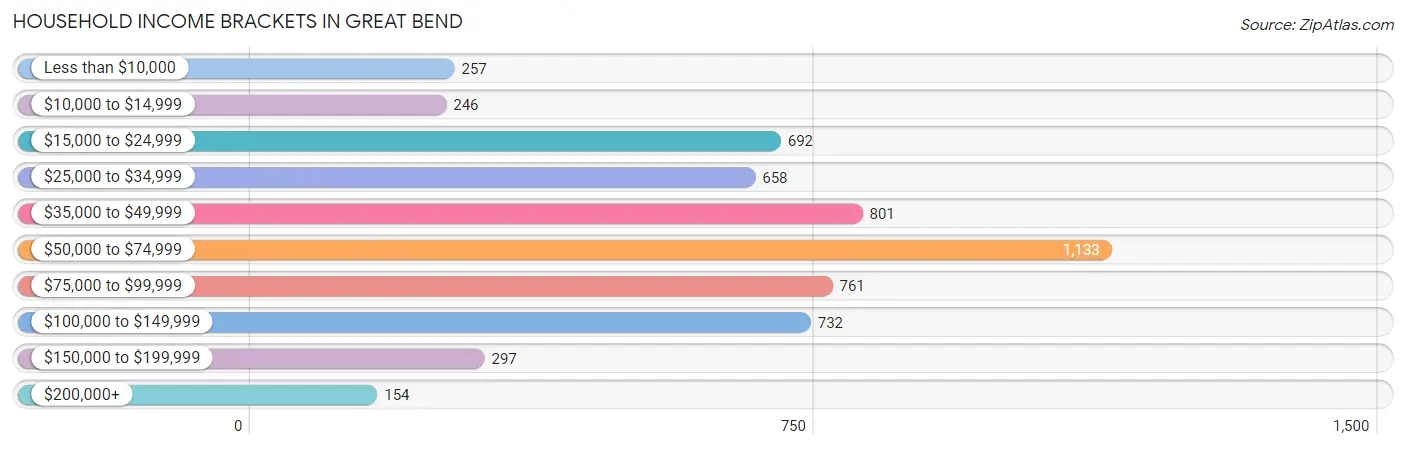
| Income Bracket | # Households | % Households |
| Less than $10,000 | 257 | 4.5% |
| $10,000 to $14,999 | 246 | 4.3% |
| $15,000 to $24,999 | 692 | 12.1% |
| $25,000 to $34,999 | 658 | 11.5% |
| $35,000 to $49,999 | 801 | 14.0% |
| $50,000 to $74,999 | 1,133 | 19.8% |
| $75,000 to $99,999 | 761 | 13.3% |
| $100,000 to $149,999 | 732 | 12.8% |
| $150,000 to $199,999 | 297 | 5.2% |
| $200,000+ | 154 | 2.7% |
Household Income by Householder Age in Great Bend
The median household income in Great Bend is $53,885, with the highest median household income of $64,548 found in the 45 to 64 years age bracket for the primary householder. A total of 1,968 households (34.4%) fall into this category. Meanwhile, the 15 to 24 years age bracket for the primary householder has the lowest median household income of $21,567, with 383 households (6.7%) in this group.
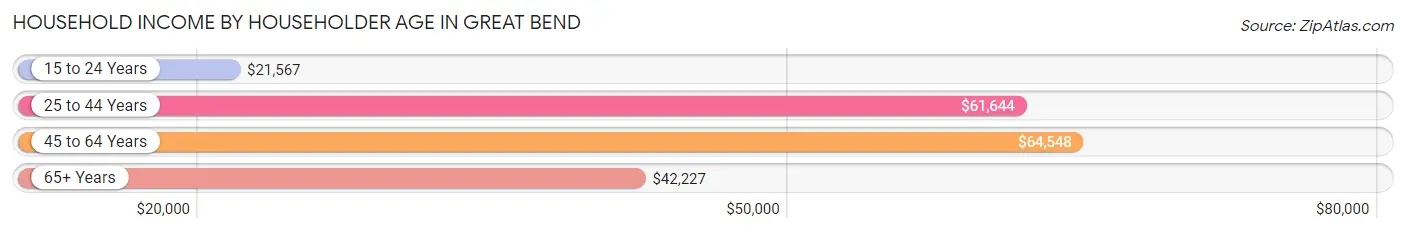
| Income Bracket | # Households | Median Income |
| 15 to 24 Years | 383 (6.7%) | $21,567 |
| 25 to 44 Years | 1,846 (32.3%) | $61,644 |
| 45 to 64 Years | 1,968 (34.4%) | $64,548 |
| 65+ Years | 1,524 (26.6%) | $42,227 |
| Total | 5,721 (100.0%) | $53,885 |
Poverty in Great Bend
Income Below Poverty by Sex and Age in Great Bend
With 15.2% poverty level for males and 17.3% for females among the residents of Great Bend, 18 to 24 year old males and under 5 year old females are the most vulnerable to poverty, with 271 males (51.3%) and 248 females (48.2%) in their respective age groups living below the poverty level.
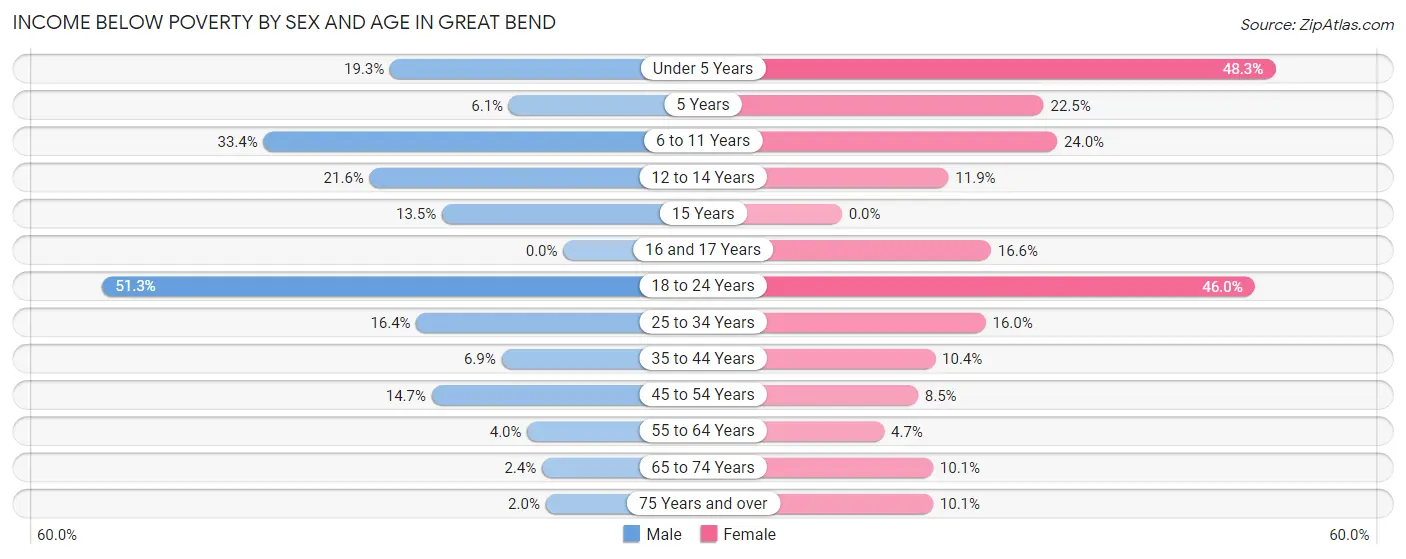
| Age Bracket | Male | Female |
| Under 5 Years | 116 (19.3%) | 248 (48.2%) |
| 5 Years | 6 (6.1%) | 20 (22.5%) |
| 6 to 11 Years | 213 (33.4%) | 178 (24.0%) |
| 12 to 14 Years | 33 (21.6%) | 26 (11.9%) |
| 15 Years | 15 (13.5%) | 0 (0.0%) |
| 16 and 17 Years | 0 (0.0%) | 39 (16.6%) |
| 18 to 24 Years | 271 (51.3%) | 250 (46.0%) |
| 25 to 34 Years | 171 (16.4%) | 203 (16.0%) |
| 35 to 44 Years | 66 (6.9%) | 70 (10.4%) |
| 45 to 54 Years | 93 (14.6%) | 57 (8.5%) |
| 55 to 64 Years | 36 (4.0%) | 45 (4.7%) |
| 65 to 74 Years | 13 (2.4%) | 77 (10.1%) |
| 75 Years and over | 10 (2.0%) | 74 (10.1%) |
| Total | 1,043 (15.2%) | 1,287 (17.3%) |
Income Above Poverty by Sex and Age in Great Bend
According to the poverty statistics in Great Bend, males aged 16 and 17 years and females aged 15 years are the age groups that are most secure financially, with 100.0% of males and 100.0% of females in these age groups living above the poverty line.
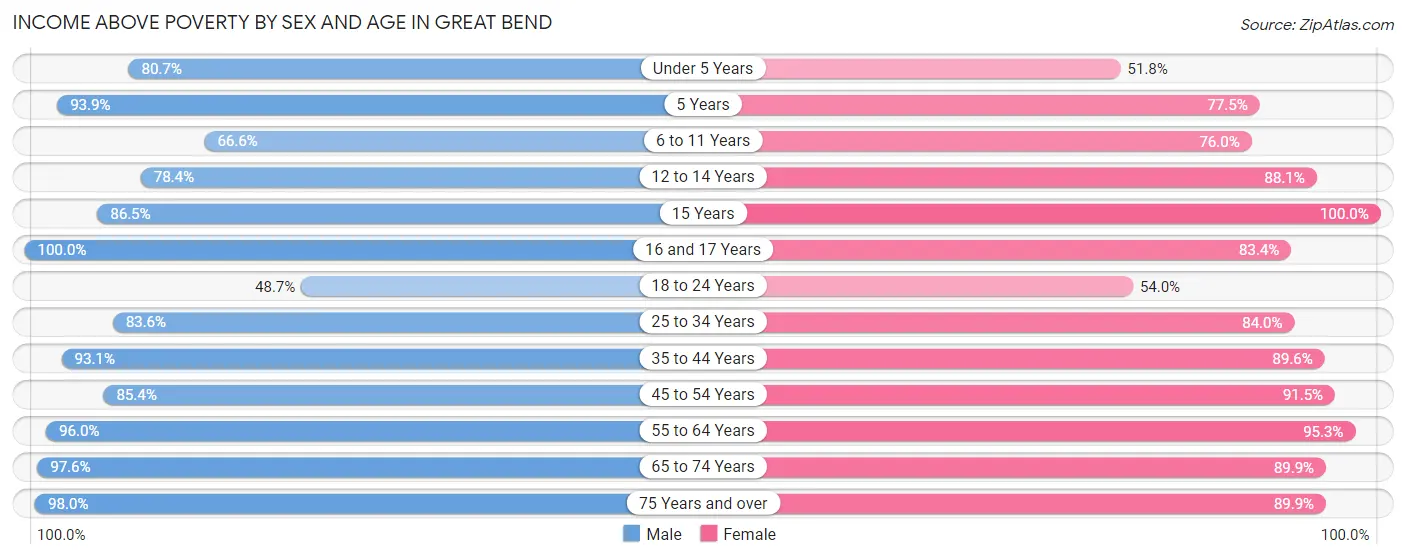
| Age Bracket | Male | Female |
| Under 5 Years | 485 (80.7%) | 266 (51.7%) |
| 5 Years | 93 (93.9%) | 69 (77.5%) |
| 6 to 11 Years | 425 (66.6%) | 565 (76.0%) |
| 12 to 14 Years | 120 (78.4%) | 193 (88.1%) |
| 15 Years | 96 (86.5%) | 40 (100.0%) |
| 16 and 17 Years | 131 (100.0%) | 196 (83.4%) |
| 18 to 24 Years | 257 (48.7%) | 294 (54.0%) |
| 25 to 34 Years | 874 (83.6%) | 1,065 (84.0%) |
| 35 to 44 Years | 894 (93.1%) | 604 (89.6%) |
| 45 to 54 Years | 542 (85.4%) | 616 (91.5%) |
| 55 to 64 Years | 861 (96.0%) | 910 (95.3%) |
| 65 to 74 Years | 535 (97.6%) | 682 (89.9%) |
| 75 Years and over | 501 (98.0%) | 656 (89.9%) |
| Total | 5,814 (84.8%) | 6,156 (82.7%) |
Income Below Poverty Among Married-Couple Families in Great Bend
The poverty statistics for married-couple families in Great Bend show that 4.2% or 106 of the total 2,510 families live below the poverty line. Families with 3 or 4 children have the highest poverty rate of 17.9%, comprising of 42 families. On the other hand, families with 5 or more children have the lowest poverty rate of 0.0%, which includes 0 families.
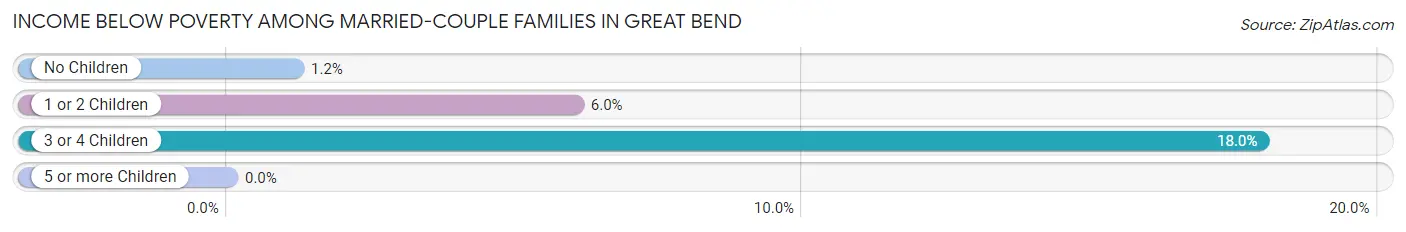
| Children | Above Poverty | Below Poverty |
| No Children | 1,461 (98.9%) | 17 (1.1%) |
| 1 or 2 Children | 734 (94.0%) | 47 (6.0%) |
| 3 or 4 Children | 192 (82.1%) | 42 (17.9%) |
| 5 or more Children | 17 (100.0%) | 0 (0.0%) |
| Total | 2,404 (95.8%) | 106 (4.2%) |
Income Below Poverty Among Single-Parent Households in Great Bend
According to the poverty data in Great Bend, 11.1% or 45 single-father households and 33.4% or 182 single-mother households are living below the poverty line. Among single-father households, those with 3 or 4 children have the highest poverty rate, with 35 households (100.0%) experiencing poverty. Likewise, among single-mother households, those with 5 or more children have the highest poverty rate, with 3 households (100.0%) falling below the poverty line.
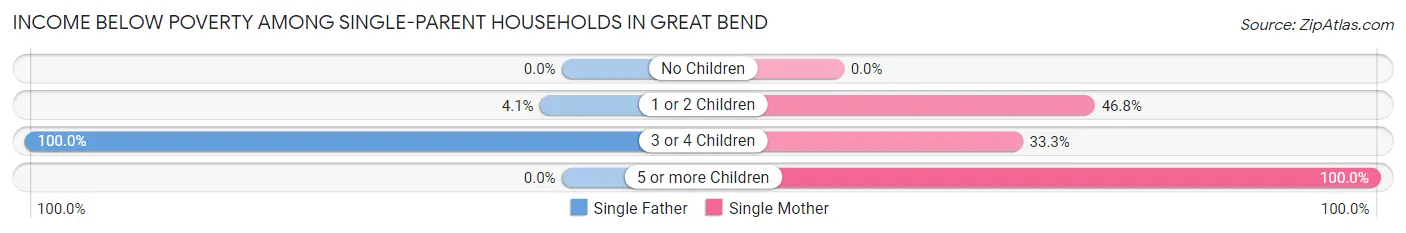
| Children | Single Father | Single Mother |
| No Children | 0 (0.0%) | 0 (0.0%) |
| 1 or 2 Children | 10 (4.1%) | 159 (46.8%) |
| 3 or 4 Children | 35 (100.0%) | 20 (33.3%) |
| 5 or more Children | 0 (0.0%) | 3 (100.0%) |
| Total | 45 (11.1%) | 182 (33.4%) |
Income Below Poverty Among Married-Couple vs Single-Parent Households in Great Bend
The poverty data for Great Bend shows that 106 of the married-couple family households (4.2%) and 227 of the single-parent households (23.9%) are living below the poverty level. Within the married-couple family households, those with 3 or 4 children have the highest poverty rate, with 42 households (17.9%) falling below the poverty line. Among the single-parent households, those with 5 or more children have the highest poverty rate, with 3 household (100.0%) living below poverty.
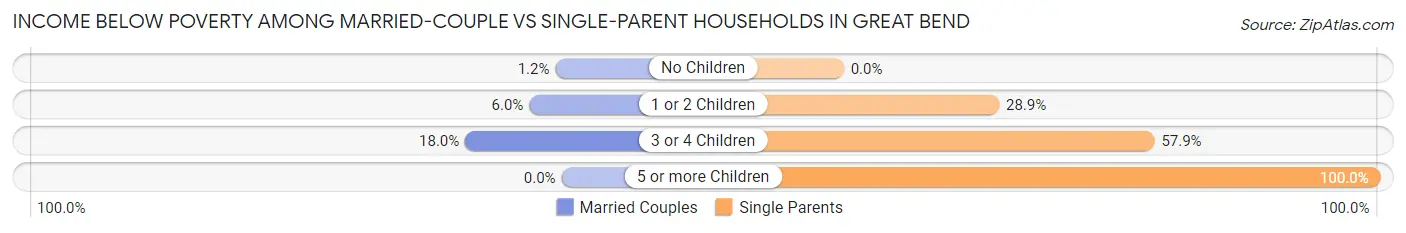
| Children | Married-Couple Families | Single-Parent Households |
| No Children | 17 (1.1%) | 0 (0.0%) |
| 1 or 2 Children | 47 (6.0%) | 169 (28.9%) |
| 3 or 4 Children | 42 (17.9%) | 55 (57.9%) |
| 5 or more Children | 0 (0.0%) | 3 (100.0%) |
| Total | 106 (4.2%) | 227 (23.9%) |
Race in Great Bend
The most populous races in Great Bend are White / Caucasian (11,761 | 79.9%), Hispanic or Latino (3,500 | 23.8%), and Two or more Races (2,063 | 14.0%).
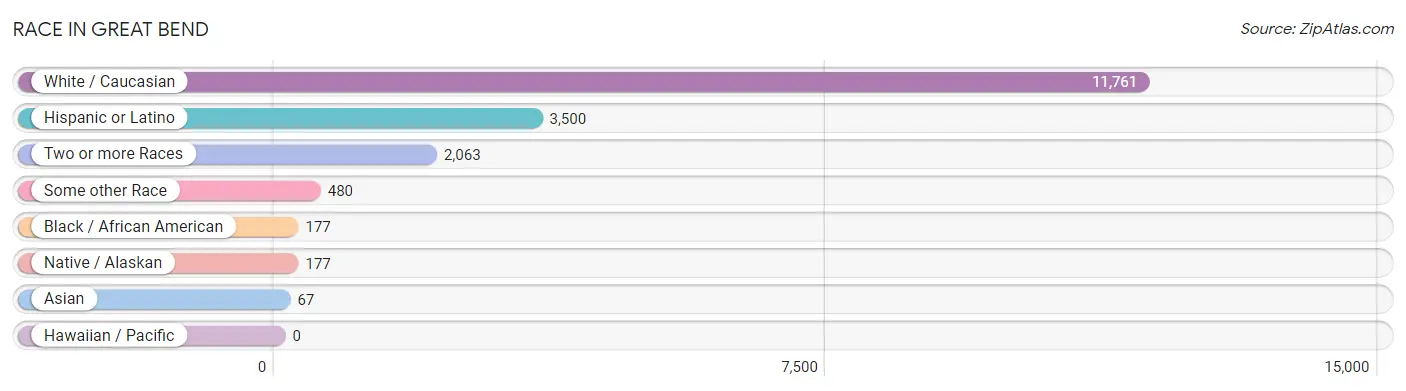
| Race | # Population | % Population |
| Asian | 67 | 0.5% |
| Black / African American | 177 | 1.2% |
| Hawaiian / Pacific | 0 | 0.0% |
| Hispanic or Latino | 3,500 | 23.8% |
| Native / Alaskan | 177 | 1.2% |
| White / Caucasian | 11,761 | 79.9% |
| Two or more Races | 2,063 | 14.0% |
| Some other Race | 480 | 3.3% |
| Total | 14,725 | 100.0% |
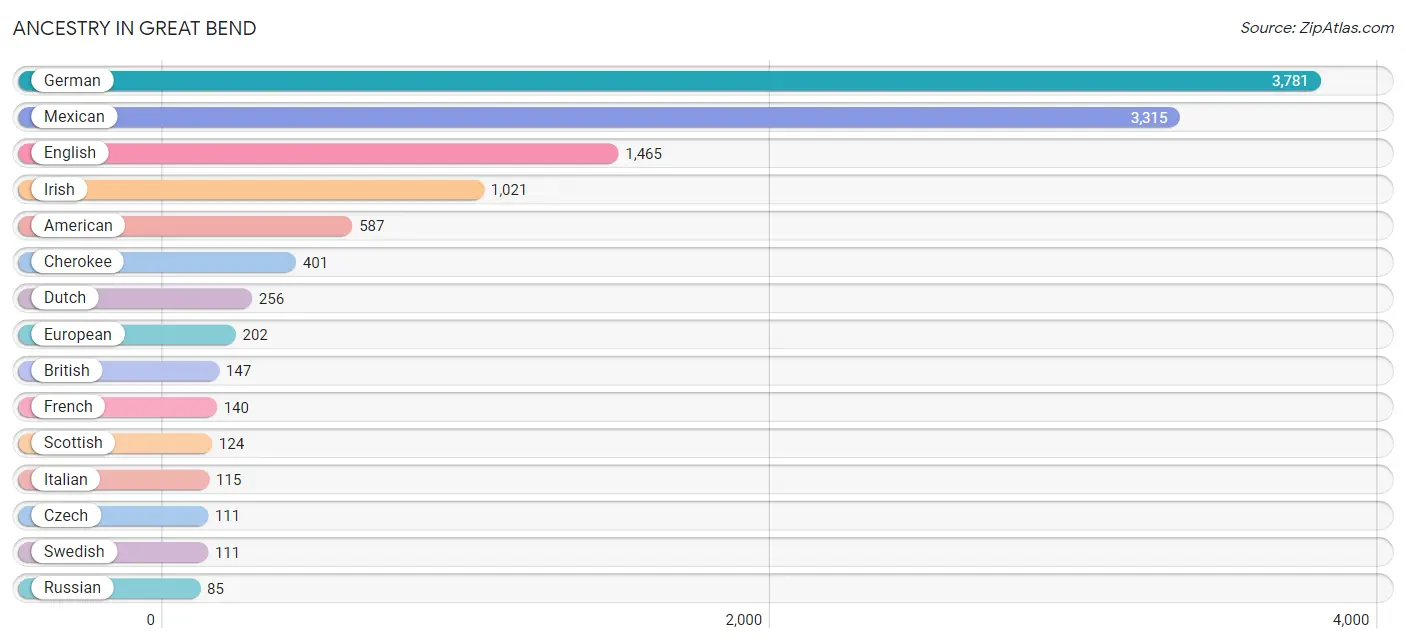
Ancestry in Great Bend
The most populous ancestries reported in Great Bend are German (3,781 | 25.7%), Mexican (3,315 | 22.5%), English (1,465 | 10.0%), Irish (1,021 | 6.9%), and American (587 | 4.0%), together accounting for 69.1% of all Great Bend residents.
| Ancestry | # Population | % Population |
| American | 587 | 4.0% |
| Austrian | 63 | 0.4% |
| Belgian | 6 | 0.0% |
| British | 147 | 1.0% |
| Burmese | 35 | 0.2% |
| Cambodian | 17 | 0.1% |
| Cherokee | 401 | 2.7% |
| Chickasaw | 14 | 0.1% |
| Choctaw | 10 | 0.1% |
| Cuban | 2 | 0.0% |
| Czech | 111 | 0.7% |
| Czechoslovakian | 18 | 0.1% |
| Danish | 75 | 0.5% |
| Dutch | 256 | 1.7% |
| English | 1,465 | 10.0% |
| European | 202 | 1.4% |
| French | 140 | 0.9% |
| French Canadian | 36 | 0.2% |
| German | 3,781 | 25.7% |
| German Russian | 11 | 0.1% |
| Greek | 14 | 0.1% |
| Hungarian | 23 | 0.2% |
| Indian (Asian) | 16 | 0.1% |
| Irish | 1,021 | 6.9% |
| Italian | 115 | 0.8% |
| Malaysian | 1 | 0.0% |
| Mexican | 3,315 | 22.5% |
| Mexican American Indian | 6 | 0.0% |
| Native Hawaiian | 6 | 0.0% |
| Northern European | 17 | 0.1% |
| Norwegian | 54 | 0.4% |
| Pennsylvania German | 70 | 0.5% |
| Polish | 16 | 0.1% |
| Portuguese | 6 | 0.0% |
| Puerto Rican | 25 | 0.2% |
| Russian | 85 | 0.6% |
| Scandinavian | 31 | 0.2% |
| Scotch-Irish | 51 | 0.4% |
| Scottish | 124 | 0.8% |
| Sioux | 6 | 0.0% |
| Slovak | 8 | 0.1% |
| Spanish | 15 | 0.1% |
| Swedish | 111 | 0.7% |
| Swiss | 26 | 0.2% |
| Thai | 21 | 0.1% |
| Tlingit-Haida | 42 | 0.3% |
| Tsimshian | 42 | 0.3% |
| Welsh | 49 | 0.3% | View All 48 Rows |
Immigrants in Great Bend
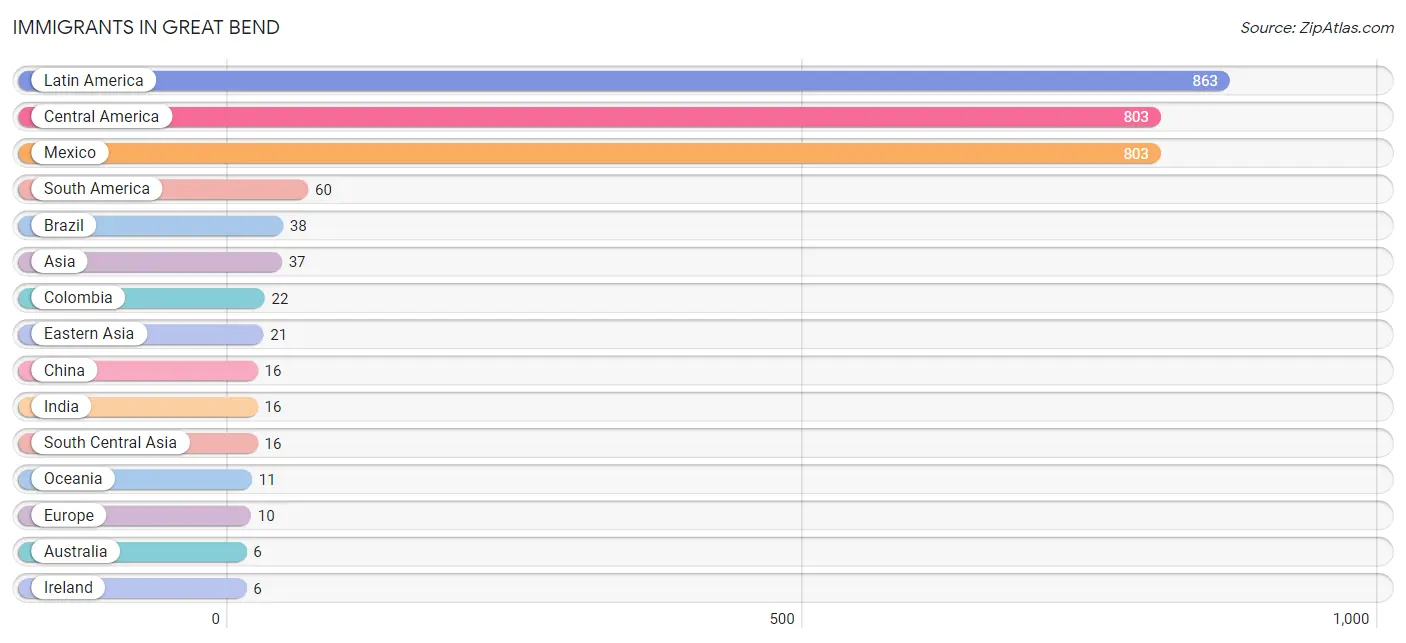
The most numerous immigrant groups reported in Great Bend came from Latin America (863 | 5.9%), Central America (803 | 5.4%), Mexico (803 | 5.4%), South America (60 | 0.4%), and Brazil (38 | 0.3%), together accounting for 17.4% of all Great Bend residents.
| Immigration Origin | # Population | % Population |
| Asia | 37 | 0.3% |
| Australia | 6 | 0.0% |
| Brazil | 38 | 0.3% |
| Central America | 803 | 5.4% |
| China | 16 | 0.1% |
| Colombia | 22 | 0.2% |
| Eastern Asia | 21 | 0.1% |
| Europe | 10 | 0.1% |
| Germany | 4 | 0.0% |
| India | 16 | 0.1% |
| Ireland | 6 | 0.0% |
| Korea | 5 | 0.0% |
| Latin America | 863 | 5.9% |
| Mexico | 803 | 5.4% |
| Northern Europe | 6 | 0.0% |
| Oceania | 11 | 0.1% |
| South America | 60 | 0.4% |
| South Central Asia | 16 | 0.1% |
| Western Europe | 4 | 0.0% | View All 19 Rows |
Sex and Age in Great Bend
Sex and Age in Great Bend
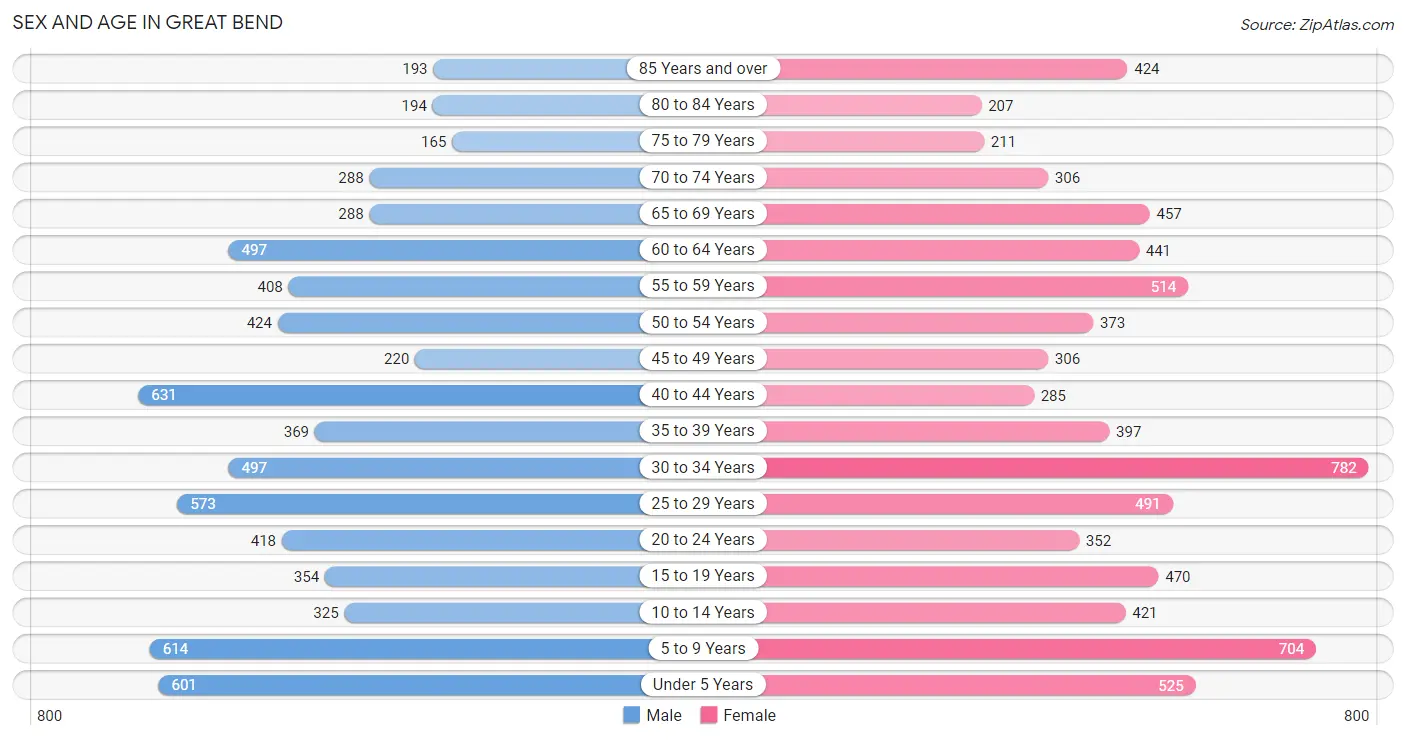
The most populous age groups in Great Bend are 40 to 44 Years (631 | 8.9%) for men and 30 to 34 Years (782 | 10.2%) for women.
| Age Bracket | Male | Female |
| Under 5 Years | 601 (8.5%) | 525 (6.9%) |
| 5 to 9 Years | 614 (8.7%) | 704 (9.2%) |
| 10 to 14 Years | 325 (4.6%) | 421 (5.5%) |
| 15 to 19 Years | 354 (5.0%) | 470 (6.1%) |
| 20 to 24 Years | 418 (5.9%) | 352 (4.6%) |
| 25 to 29 Years | 573 (8.1%) | 491 (6.4%) |
| 30 to 34 Years | 497 (7.0%) | 782 (10.2%) |
| 35 to 39 Years | 369 (5.2%) | 397 (5.2%) |
| 40 to 44 Years | 631 (8.9%) | 285 (3.7%) |
| 45 to 49 Years | 220 (3.1%) | 306 (4.0%) |
| 50 to 54 Years | 424 (6.0%) | 373 (4.9%) |
| 55 to 59 Years | 408 (5.8%) | 514 (6.7%) |
| 60 to 64 Years | 497 (7.0%) | 441 (5.8%) |
| 65 to 69 Years | 288 (4.1%) | 457 (6.0%) |
| 70 to 74 Years | 288 (4.1%) | 306 (4.0%) |
| 75 to 79 Years | 165 (2.3%) | 211 (2.8%) |
| 80 to 84 Years | 194 (2.8%) | 207 (2.7%) |
| 85 Years and over | 193 (2.7%) | 424 (5.5%) |
| Total | 7,059 (100.0%) | 7,666 (100.0%) |
Families and Households in Great Bend
Median Family Size in Great Bend
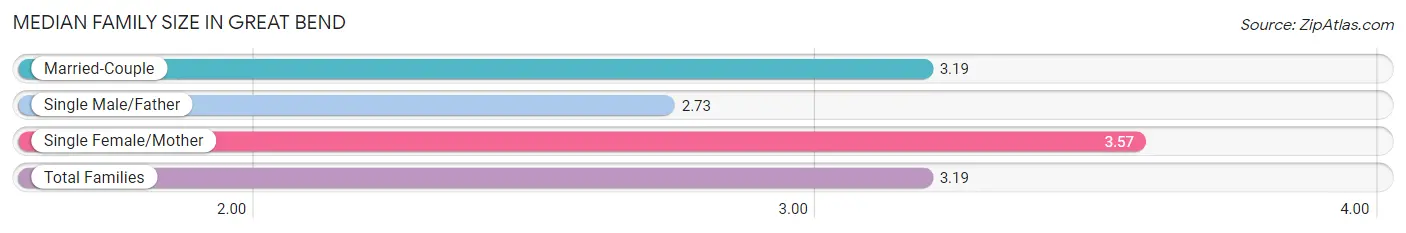
The median family size in Great Bend is 3.19 persons per family, with single female/mother families (545 | 15.8%) accounting for the largest median family size of 3.57 persons per family. On the other hand, single male/father families (406 | 11.7%) represent the smallest median family size with 2.73 persons per family.
| Family Type | # Families | Family Size |
| Married-Couple | 2,510 (72.5%) | 3.19 |
| Single Male/Father | 406 (11.7%) | 2.73 |
| Single Female/Mother | 545 (15.8%) | 3.57 |
| Total Families | 3,461 (100.0%) | 3.19 |
Median Household Size in Great Bend
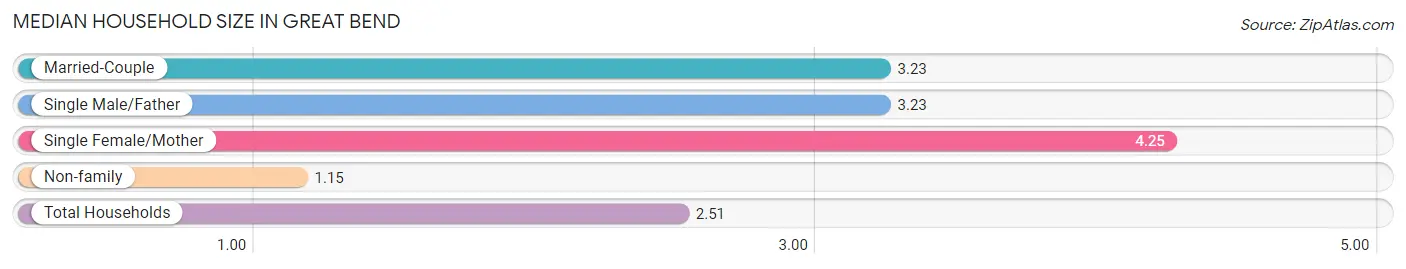
The median household size in Great Bend is 2.51 persons per household, with single female/mother households (545 | 9.5%) accounting for the largest median household size of 4.25 persons per household. non-family households (2,260 | 39.5%) represent the smallest median household size with 1.15 persons per household.
| Household Type | # Households | Household Size |
| Married-Couple | 2,510 (43.9%) | 3.23 |
| Single Male/Father | 406 (7.1%) | 3.23 |
| Single Female/Mother | 545 (9.5%) | 4.25 |
| Non-family | 2,260 (39.5%) | 1.15 |
| Total Households | 5,721 (100.0%) | 2.51 |
Household Size by Marriage Status in Great Bend
Out of a total of 5,721 households in Great Bend, 3,461 (60.5%) are family households, while 2,260 (39.5%) are nonfamily households. The most numerous type of family households are 2-person households, comprising 1,737, and the most common type of nonfamily households are 1-person households, comprising 2,019.
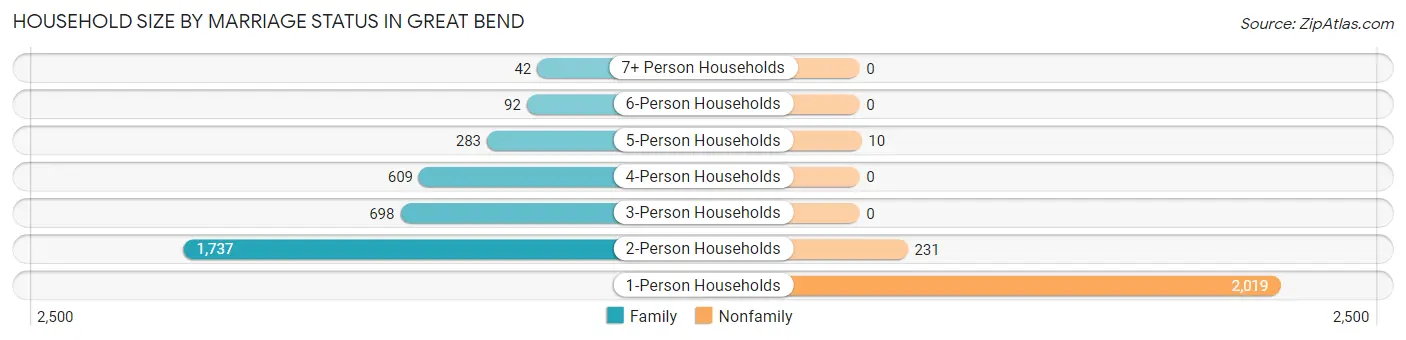
| Household Size | Family Households | Nonfamily Households |
| 1-Person Households | - | 2,019 (35.3%) |
| 2-Person Households | 1,737 (30.4%) | 231 (4.0%) |
| 3-Person Households | 698 (12.2%) | 0 (0.0%) |
| 4-Person Households | 609 (10.6%) | 0 (0.0%) |
| 5-Person Households | 283 (5.0%) | 10 (0.2%) |
| 6-Person Households | 92 (1.6%) | 0 (0.0%) |
| 7+ Person Households | 42 (0.7%) | 0 (0.0%) |
| Total | 3,461 (60.5%) | 2,260 (39.5%) |
Female Fertility in Great Bend
Fertility by Age in Great Bend
Average fertility rate in Great Bend is 74.0 births per 1,000 women. Women in the age bracket of 20 to 34 years have the highest fertility rate with 110.0 births per 1,000 women. Women in the age bracket of 20 to 34 years acount for 75.4% of all women with births.
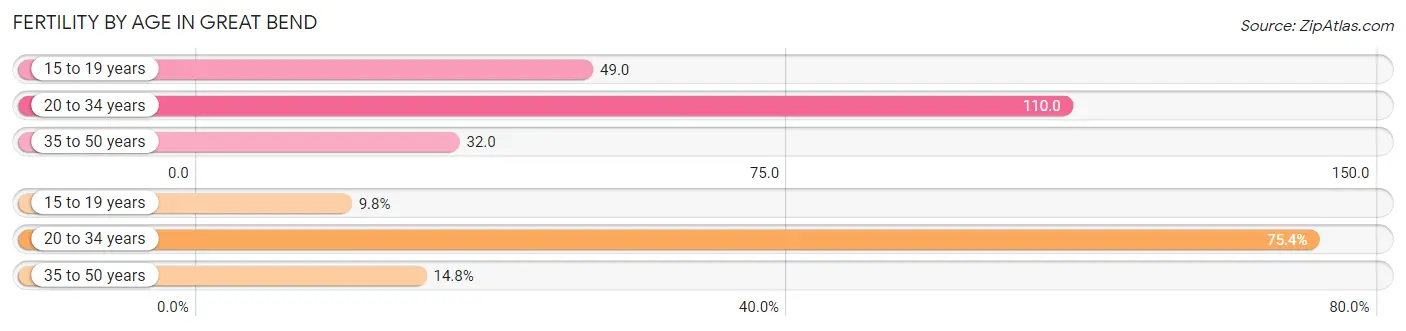
| Age Bracket | Women with Births | Births / 1,000 Women |
| 15 to 19 years | 23 (9.8%) | 49.0 |
| 20 to 34 years | 178 (75.4%) | 110.0 |
| 35 to 50 years | 35 (14.8%) | 32.0 |
| Total | 236 (100.0%) | 74.0 |
Fertility by Age by Marriage Status in Great Bend
73.3% of women with births (236) in Great Bend are married. The highest percentage of unmarried women with births falls into 15 to 19 years age bracket with 100.0% of them unmarried at the time of birth, while the lowest percentage of unmarried women with births belong to 20 to 34 years age bracket with 12.9% of them unmarried.
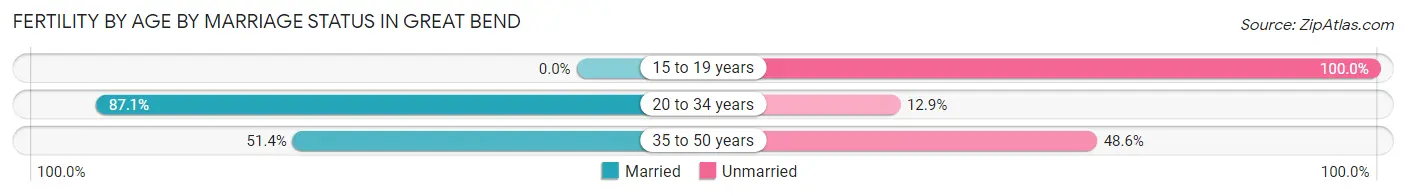
| Age Bracket | Married | Unmarried |
| 15 to 19 years | 0 (0.0%) | 23 (100.0%) |
| 20 to 34 years | 155 (87.1%) | 23 (12.9%) |
| 35 to 50 years | 18 (51.4%) | 17 (48.6%) |
| Total | 173 (73.3%) | 63 (26.7%) |
Fertility by Education in Great Bend
Average fertility rate in Great Bend is 74.0 births per 1,000 women. Women with the education attainment of graduate degree have the highest fertility rate of 400.0 births per 1,000 women, while women with the education attainment of less than high school have the lowest fertility at 46.0 births per 1,000 women. Women with the education attainment of high school diploma represent 28.4% of all women with births.
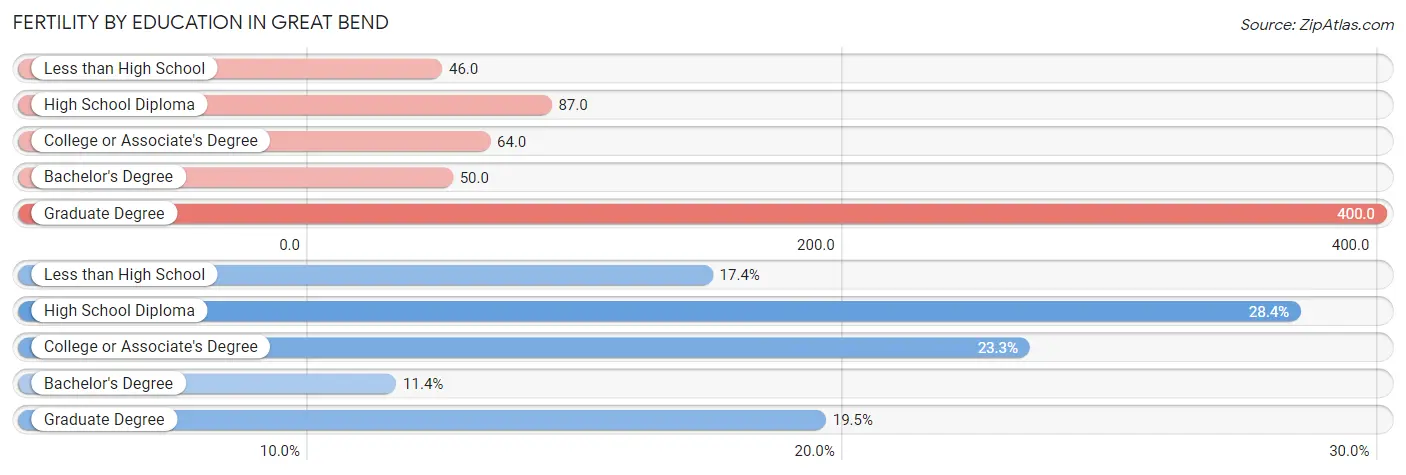
| Educational Attainment | Women with Births | Births / 1,000 Women |
| Less than High School | 41 (17.4%) | 46.0 |
| High School Diploma | 67 (28.4%) | 87.0 |
| College or Associate's Degree | 55 (23.3%) | 64.0 |
| Bachelor's Degree | 27 (11.4%) | 50.0 |
| Graduate Degree | 46 (19.5%) | 400.0 |
| Total | 236 (100.0%) | 74.0 |
Fertility by Education by Marriage Status in Great Bend
26.7% of women with births in Great Bend are unmarried. Women with the educational attainment of college or associate's degree are most likely to be married with 100.0% of them married at childbirth, while women with the educational attainment of less than high school are least likely to be married with 100.0% of them unmarried at childbirth.
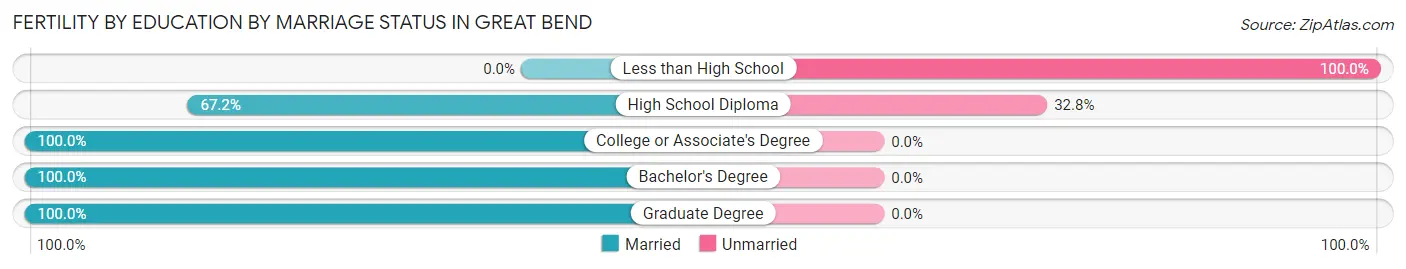
| Educational Attainment | Married | Unmarried |
| Less than High School | 0 (0.0%) | 41 (100.0%) |
| High School Diploma | 45 (67.2%) | 22 (32.8%) |
| College or Associate's Degree | 55 (100.0%) | 0 (0.0%) |
| Bachelor's Degree | 27 (100.0%) | 0 (0.0%) |
| Graduate Degree | 46 (100.0%) | 0 (0.0%) |
| Total | 173 (73.3%) | 63 (26.7%) |
Employment Characteristics in Great Bend
Employment by Class of Employer in Great Bend
Among the 7,117 employed individuals in Great Bend, private company employees (4,789 | 67.3%), local government employees (715 | 10.1%), and not-for-profit organizations (537 | 7.5%) make up the most common classes of employment.
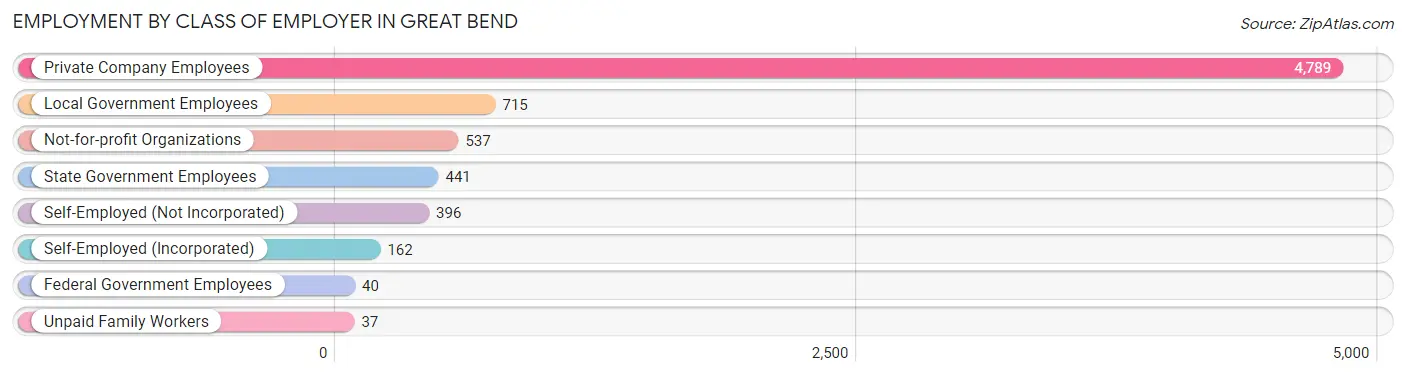
| Employer Class | # Employees | % Employees |
| Private Company Employees | 4,789 | 67.3% |
| Self-Employed (Incorporated) | 162 | 2.3% |
| Self-Employed (Not Incorporated) | 396 | 5.6% |
| Not-for-profit Organizations | 537 | 7.5% |
| Local Government Employees | 715 | 10.1% |
| State Government Employees | 441 | 6.2% |
| Federal Government Employees | 40 | 0.6% |
| Unpaid Family Workers | 37 | 0.5% |
| Total | 7,117 | 100.0% |
Employment Status by Age in Great Bend
According to the labor force statistics for Great Bend, out of the total population over 16 years of age (11,384), 66.4% or 7,559 individuals are in the labor force, with 4.8% or 363 of them unemployed. The age group with the highest labor force participation rate is 20 to 24 years, with 93.6% or 721 individuals in the labor force. Within the labor force, the 16 to 19 years age range has the highest percentage of unemployed individuals, with 17.1% or 77 of them being unemployed.
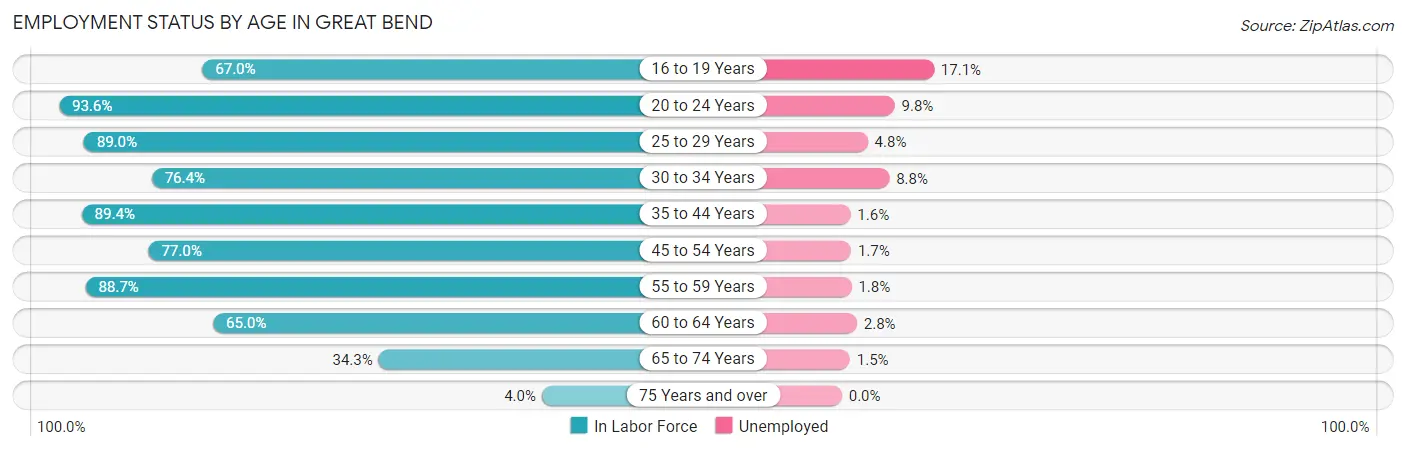
| Age Bracket | In Labor Force | Unemployed |
| 16 to 19 Years | 451 (67.0%) | 77 (17.1%) |
| 20 to 24 Years | 721 (93.6%) | 71 (9.8%) |
| 25 to 29 Years | 947 (89.0%) | 45 (4.8%) |
| 30 to 34 Years | 977 (76.4%) | 86 (8.8%) |
| 35 to 44 Years | 1,504 (89.4%) | 24 (1.6%) |
| 45 to 54 Years | 1,019 (77.0%) | 17 (1.7%) |
| 55 to 59 Years | 818 (88.7%) | 15 (1.8%) |
| 60 to 64 Years | 610 (65.0%) | 17 (2.8%) |
| 65 to 74 Years | 459 (34.3%) | 7 (1.5%) |
| 75 Years and over | 56 (4.0%) | 0 (0.0%) |
| Total | 7,559 (66.4%) | 363 (4.8%) |
Employment Status by Educational Attainment in Great Bend
According to labor force statistics for Great Bend, 81.5% of individuals (5,875) out of the total population between 25 and 64 years of age (7,208) are in the labor force, with 3.5% or 206 of them being unemployed. The group with the highest labor force participation rate are those with the educational attainment of bachelor's degree or higher, with 94.1% or 1,399 individuals in the labor force. Within the labor force, individuals with less than high school education have the highest percentage of unemployment, with 14.2% or 99 of them being unemployed.
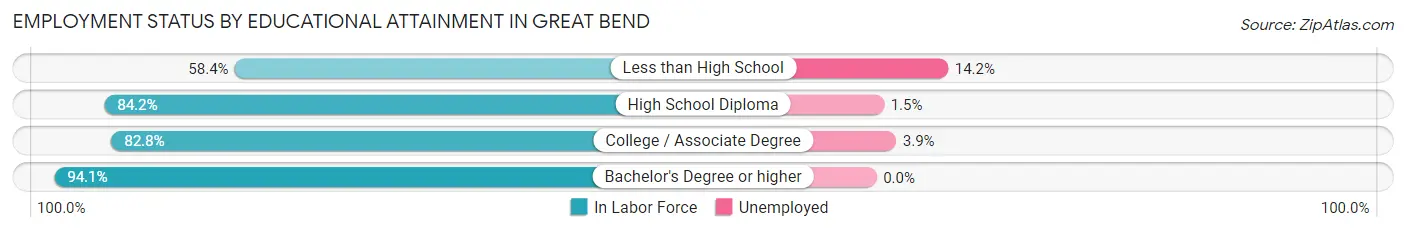
| Educational Attainment | In Labor Force | Unemployed |
| Less than High School | 696 (58.4%) | 169 (14.2%) |
| High School Diploma | 1,759 (84.2%) | 31 (1.5%) |
| College / Associate Degree | 2,021 (82.8%) | 95 (3.9%) |
| Bachelor's Degree or higher | 1,399 (94.1%) | 0 (0.0%) |
| Total | 5,875 (81.5%) | 252 (3.5%) |
Employment Occupations by Sex in Great Bend
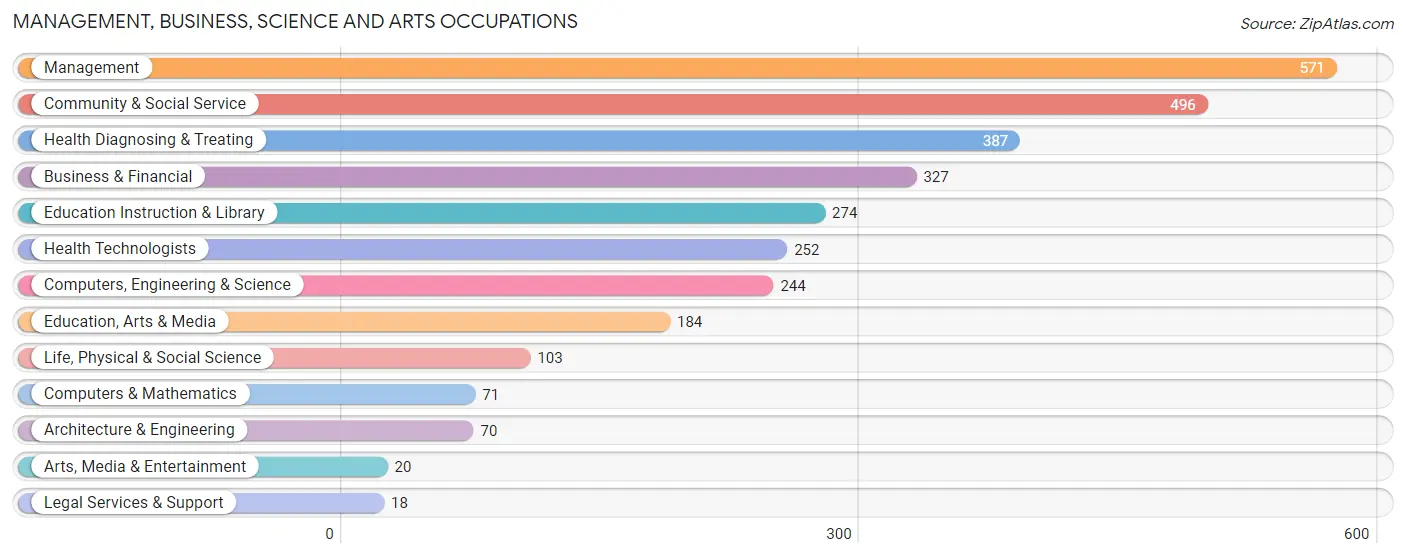
Management, Business, Science and Arts Occupations
The most common Management, Business, Science and Arts occupations in Great Bend are Management (571 | 7.9%), Community & Social Service (496 | 6.9%), Health Diagnosing & Treating (387 | 5.4%), Business & Financial (327 | 4.5%), and Education Instruction & Library (274 | 3.8%).
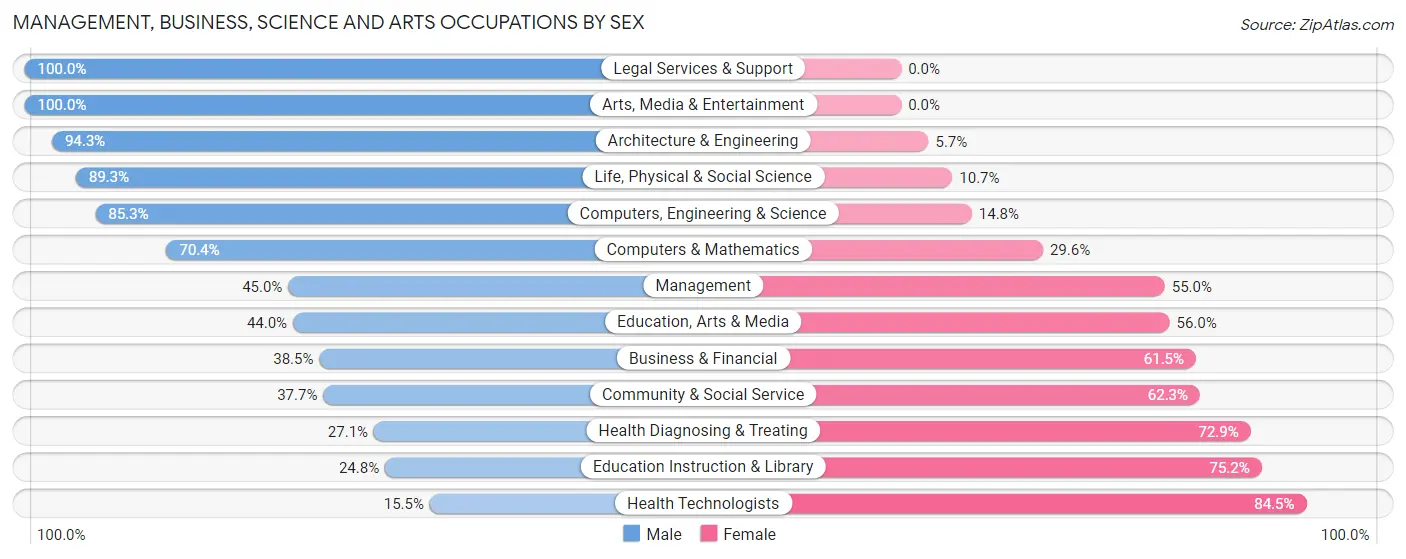
Management, Business, Science and Arts Occupations by Sex
Within the Management, Business, Science and Arts occupations in Great Bend, the most male-oriented occupations are Legal Services & Support (100.0%), Arts, Media & Entertainment (100.0%), and Architecture & Engineering (94.3%), while the most female-oriented occupations are Health Technologists (84.5%), Education Instruction & Library (75.2%), and Health Diagnosing & Treating (72.9%).
| Occupation | Male | Female |
| Management | 257 (45.0%) | 314 (55.0%) |
| Business & Financial | 126 (38.5%) | 201 (61.5%) |
| Computers, Engineering & Science | 208 (85.3%) | 36 (14.7%) |
| Computers & Mathematics | 50 (70.4%) | 21 (29.6%) |
| Architecture & Engineering | 66 (94.3%) | 4 (5.7%) |
| Life, Physical & Social Science | 92 (89.3%) | 11 (10.7%) |
| Community & Social Service | 187 (37.7%) | 309 (62.3%) |
| Education, Arts & Media | 81 (44.0%) | 103 (56.0%) |
| Legal Services & Support | 18 (100.0%) | 0 (0.0%) |
| Education Instruction & Library | 68 (24.8%) | 206 (75.2%) |
| Arts, Media & Entertainment | 20 (100.0%) | 0 (0.0%) |
| Health Diagnosing & Treating | 105 (27.1%) | 282 (72.9%) |
| Health Technologists | 39 (15.5%) | 213 (84.5%) |
| Total (Category) | 883 (43.6%) | 1,142 (56.4%) |
| Total (Overall) | 3,772 (52.5%) | 3,417 (47.5%) |
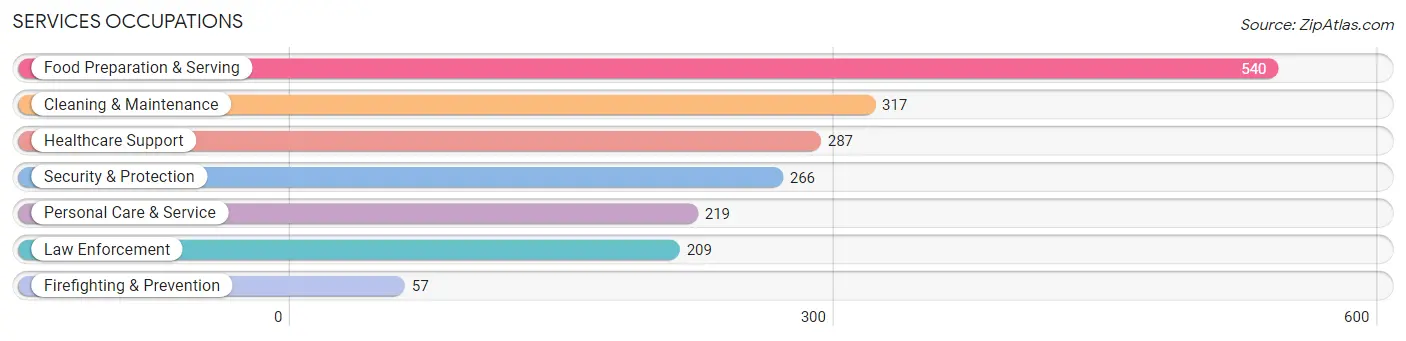
Services Occupations
The most common Services occupations in Great Bend are Food Preparation & Serving (540 | 7.5%), Cleaning & Maintenance (317 | 4.4%), Healthcare Support (287 | 4.0%), Security & Protection (266 | 3.7%), and Personal Care & Service (219 | 3.0%).
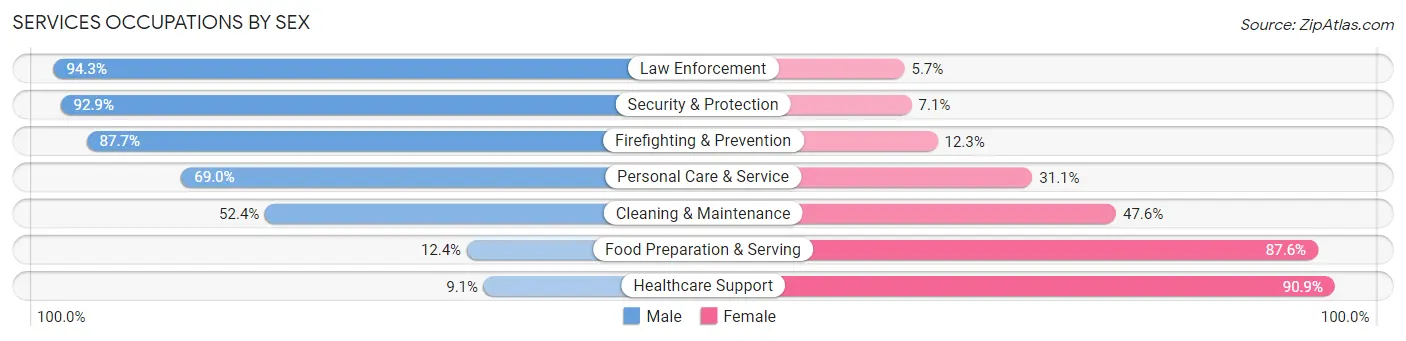
Services Occupations by Sex
Within the Services occupations in Great Bend, the most male-oriented occupations are Law Enforcement (94.3%), Security & Protection (92.9%), and Firefighting & Prevention (87.7%), while the most female-oriented occupations are Healthcare Support (90.9%), Food Preparation & Serving (87.6%), and Cleaning & Maintenance (47.6%).
| Occupation | Male | Female |
| Healthcare Support | 26 (9.1%) | 261 (90.9%) |
| Security & Protection | 247 (92.9%) | 19 (7.1%) |
| Firefighting & Prevention | 50 (87.7%) | 7 (12.3%) |
| Law Enforcement | 197 (94.3%) | 12 (5.7%) |
| Food Preparation & Serving | 67 (12.4%) | 473 (87.6%) |
| Cleaning & Maintenance | 166 (52.4%) | 151 (47.6%) |
| Personal Care & Service | 151 (69.0%) | 68 (31.0%) |
| Total (Category) | 657 (40.3%) | 972 (59.7%) |
| Total (Overall) | 3,772 (52.5%) | 3,417 (47.5%) |
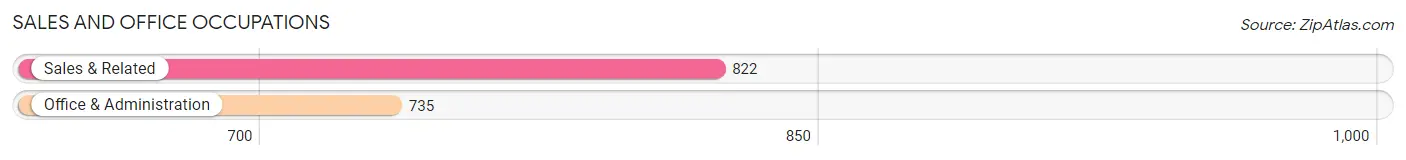
Sales and Office Occupations
The most common Sales and Office occupations in Great Bend are Sales & Related (822 | 11.4%), and Office & Administration (735 | 10.2%).
Sales and Office Occupations by Sex
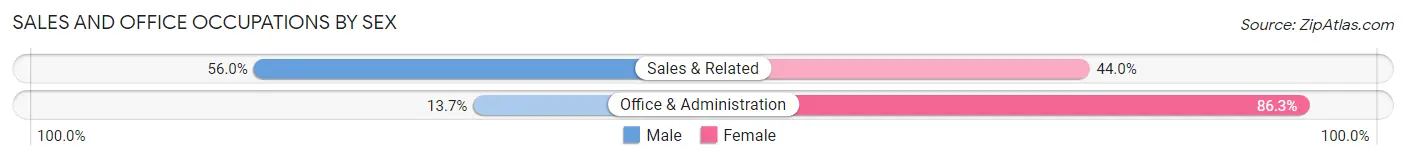
| Occupation | Male | Female |
| Sales & Related | 460 (56.0%) | 362 (44.0%) |
| Office & Administration | 101 (13.7%) | 634 (86.3%) |
| Total (Category) | 561 (36.0%) | 996 (64.0%) |
| Total (Overall) | 3,772 (52.5%) | 3,417 (47.5%) |
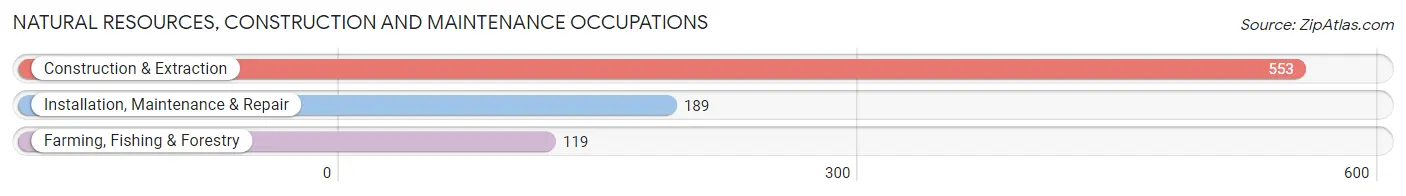
Natural Resources, Construction and Maintenance Occupations
The most common Natural Resources, Construction and Maintenance occupations in Great Bend are Construction & Extraction (553 | 7.7%), Installation, Maintenance & Repair (189 | 2.6%), and Farming, Fishing & Forestry (119 | 1.7%).
Natural Resources, Construction and Maintenance Occupations by Sex
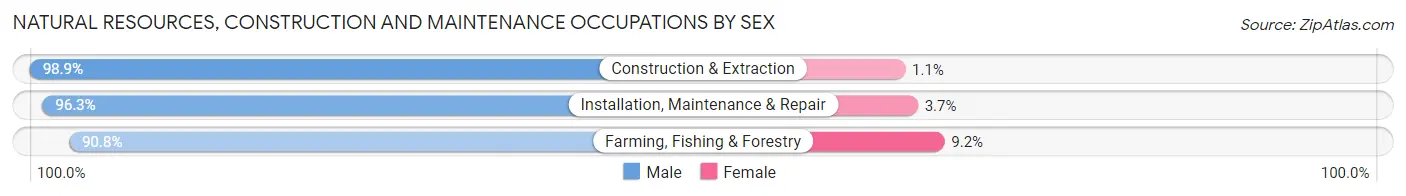
| Occupation | Male | Female |
| Farming, Fishing & Forestry | 108 (90.8%) | 11 (9.2%) |
| Construction & Extraction | 547 (98.9%) | 6 (1.1%) |
| Installation, Maintenance & Repair | 182 (96.3%) | 7 (3.7%) |
| Total (Category) | 837 (97.2%) | 24 (2.8%) |
| Total (Overall) | 3,772 (52.5%) | 3,417 (47.5%) |
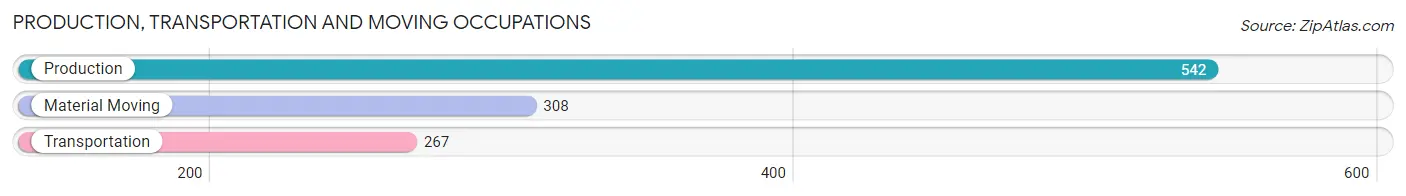
Production, Transportation and Moving Occupations
The most common Production, Transportation and Moving occupations in Great Bend are Production (542 | 7.5%), Material Moving (308 | 4.3%), and Transportation (267 | 3.7%).
Production, Transportation and Moving Occupations by Sex
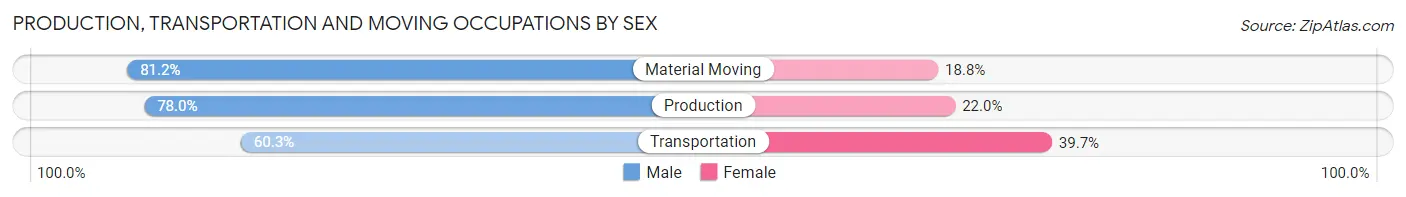
| Occupation | Male | Female |
| Production | 423 (78.0%) | 119 (22.0%) |
| Transportation | 161 (60.3%) | 106 (39.7%) |
| Material Moving | 250 (81.2%) | 58 (18.8%) |
| Total (Category) | 834 (74.7%) | 283 (25.3%) |
| Total (Overall) | 3,772 (52.5%) | 3,417 (47.5%) |
Employment Industries by Sex in Great Bend
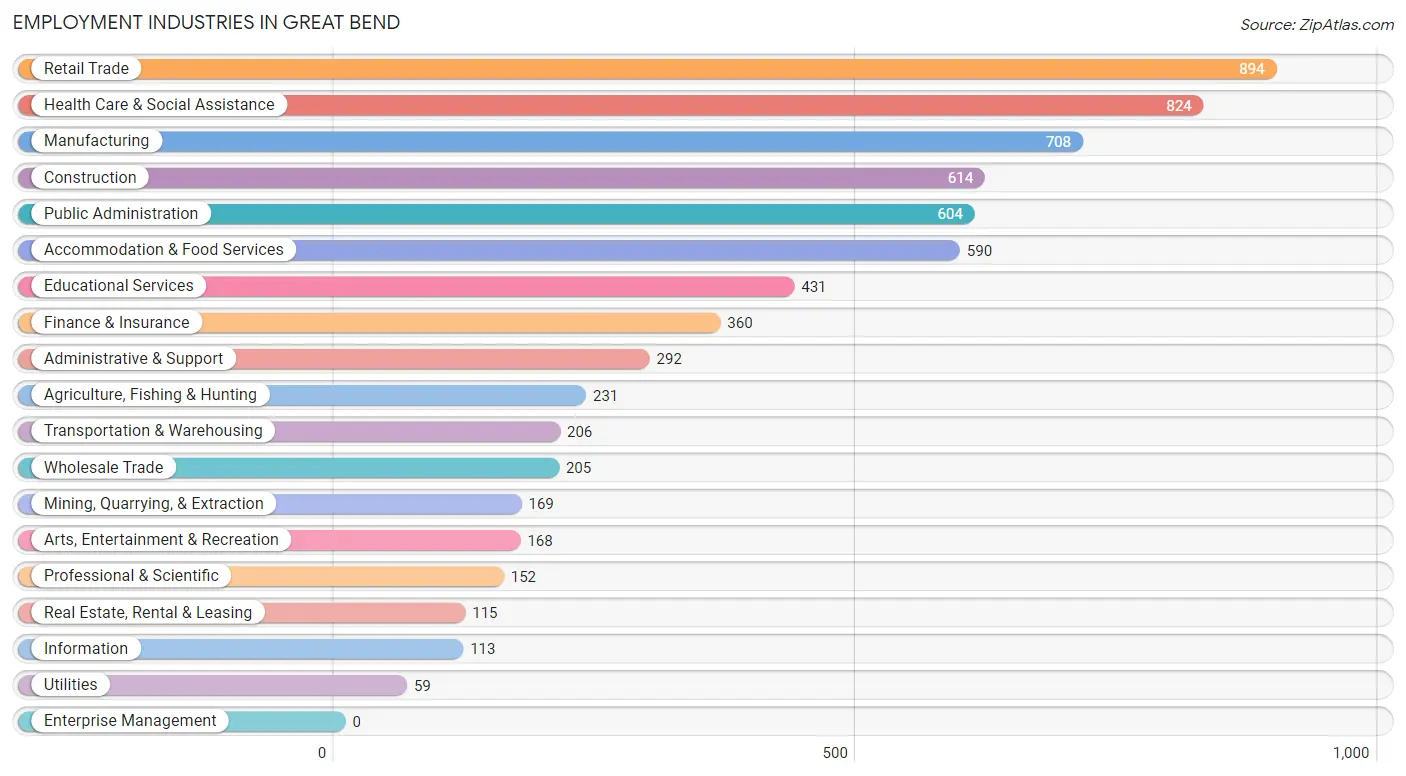
Employment Industries in Great Bend
The major employment industries in Great Bend include Retail Trade (894 | 12.4%), Health Care & Social Assistance (824 | 11.5%), Manufacturing (708 | 9.9%), Construction (614 | 8.5%), and Public Administration (604 | 8.4%).
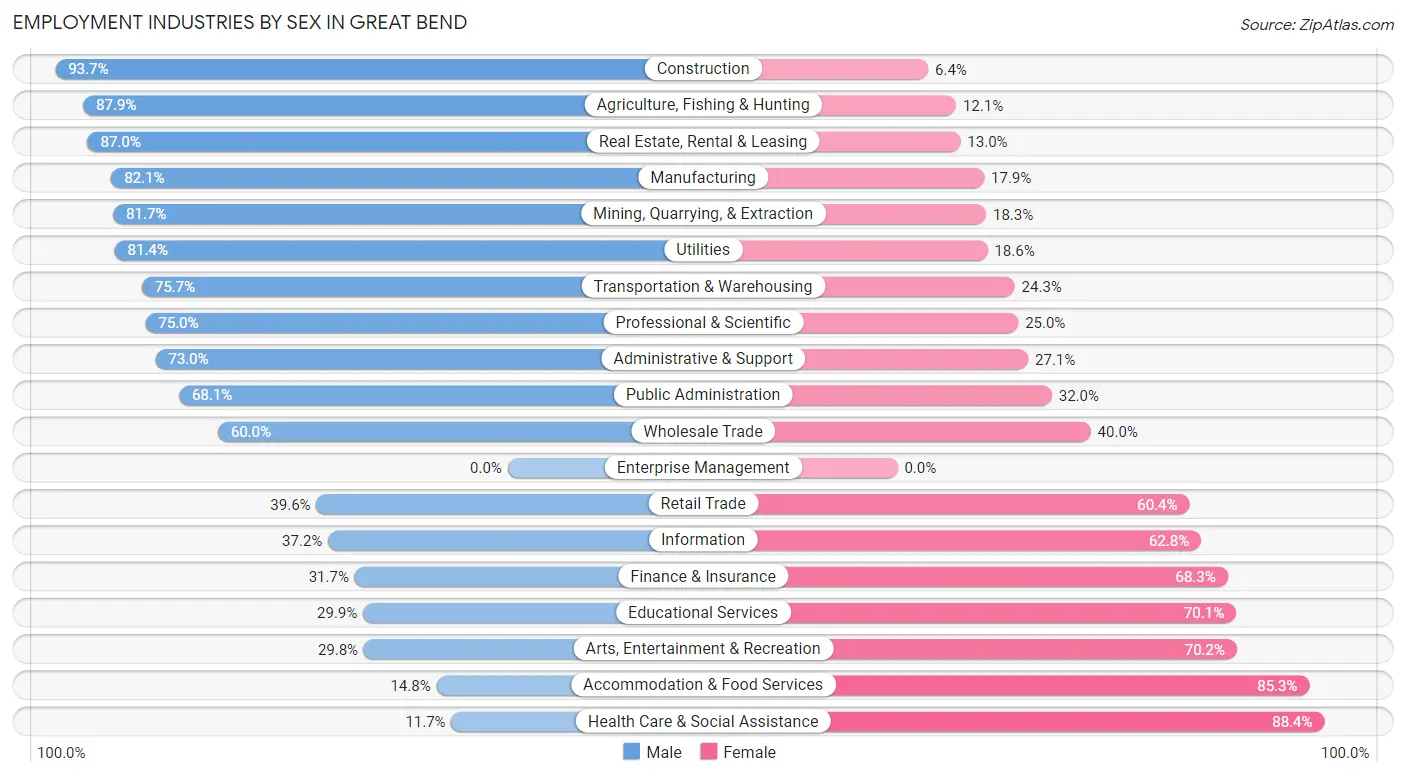
Employment Industries by Sex in Great Bend
The Great Bend industries that see more men than women are Construction (93.6%), Agriculture, Fishing & Hunting (87.9%), and Real Estate, Rental & Leasing (87.0%), whereas the industries that tend to have a higher number of women are Health Care & Social Assistance (88.3%), Accommodation & Food Services (85.3%), and Arts, Entertainment & Recreation (70.2%).
| Industry | Male | Female |
| Agriculture, Fishing & Hunting | 203 (87.9%) | 28 (12.1%) |
| Mining, Quarrying, & Extraction | 138 (81.7%) | 31 (18.3%) |
| Construction | 575 (93.6%) | 39 (6.4%) |
| Manufacturing | 581 (82.1%) | 127 (17.9%) |
| Wholesale Trade | 123 (60.0%) | 82 (40.0%) |
| Retail Trade | 354 (39.6%) | 540 (60.4%) |
| Transportation & Warehousing | 156 (75.7%) | 50 (24.3%) |
| Utilities | 48 (81.4%) | 11 (18.6%) |
| Information | 42 (37.2%) | 71 (62.8%) |
| Finance & Insurance | 114 (31.7%) | 246 (68.3%) |
| Real Estate, Rental & Leasing | 100 (87.0%) | 15 (13.0%) |
| Professional & Scientific | 114 (75.0%) | 38 (25.0%) |
| Enterprise Management | 0 (0.0%) | 0 (0.0%) |
| Administrative & Support | 213 (73.0%) | 79 (27.1%) |
| Educational Services | 129 (29.9%) | 302 (70.1%) |
| Health Care & Social Assistance | 96 (11.7%) | 728 (88.3%) |
| Arts, Entertainment & Recreation | 50 (29.8%) | 118 (70.2%) |
| Accommodation & Food Services | 87 (14.7%) | 503 (85.3%) |
| Public Administration | 411 (68.0%) | 193 (32.0%) |
| Total | 3,772 (52.5%) | 3,417 (47.5%) |
Education in Great Bend
School Enrollment in Great Bend
The most common levels of schooling among the 3,267 students in Great Bend are elementary school (958 | 29.3%), high school (782 | 23.9%), and middle school (543 | 16.6%).
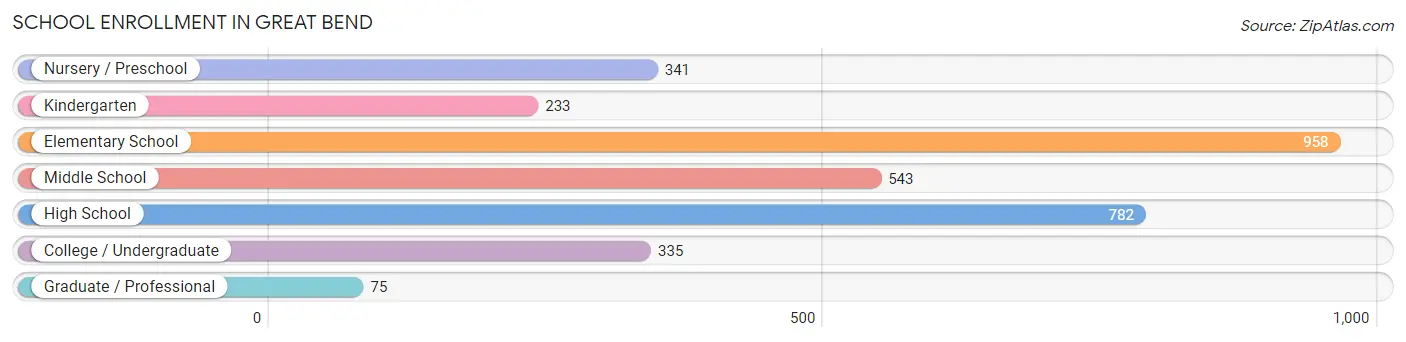
| School Level | # Students | % Students |
| Nursery / Preschool | 341 | 10.4% |
| Kindergarten | 233 | 7.1% |
| Elementary School | 958 | 29.3% |
| Middle School | 543 | 16.6% |
| High School | 782 | 23.9% |
| College / Undergraduate | 335 | 10.2% |
| Graduate / Professional | 75 | 2.3% |
| Total | 3,267 | 100.0% |
School Enrollment by Age by Funding Source in Great Bend
Out of a total of 3,267 students who are enrolled in schools in Great Bend, 392 (12.0%) attend a private institution, while the remaining 2,875 (88.0%) are enrolled in public schools. The age group of 20 to 24 year olds has the highest likelihood of being enrolled in private schools, with 21 (24.4% in the age bracket) enrolled. Conversely, the age group of 5 to 9 year old has the lowest likelihood of being enrolled in a private school, with 1,127 (94.0% in the age bracket) attending a public institution.
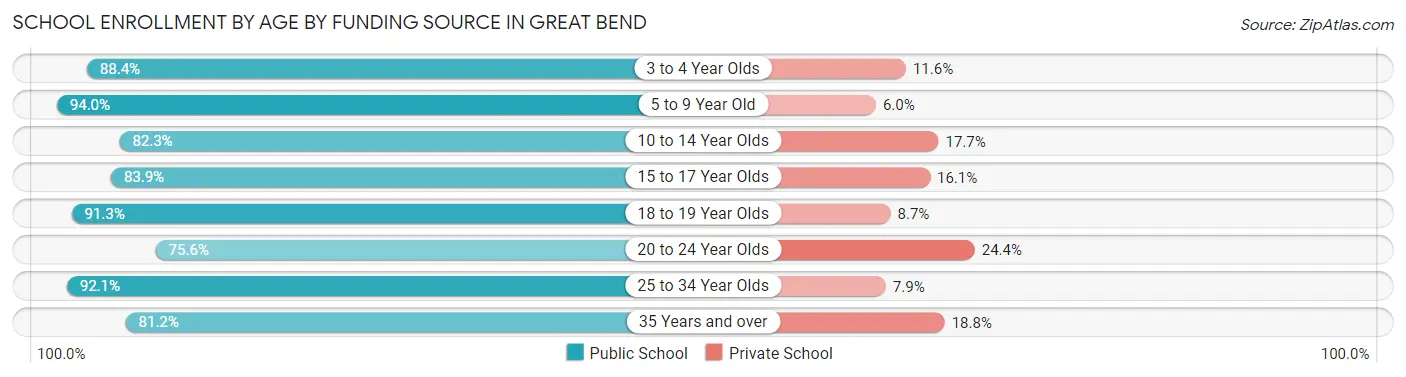
| Age Bracket | Public School | Private School |
| 3 to 4 Year Olds | 236 (88.4%) | 31 (11.6%) |
| 5 to 9 Year Old | 1,127 (94.0%) | 72 (6.0%) |
| 10 to 14 Year Olds | 587 (82.3%) | 126 (17.7%) |
| 15 to 17 Year Olds | 438 (83.9%) | 84 (16.1%) |
| 18 to 19 Year Olds | 167 (91.3%) | 16 (8.7%) |
| 20 to 24 Year Olds | 65 (75.6%) | 21 (24.4%) |
| 25 to 34 Year Olds | 117 (92.1%) | 10 (7.9%) |
| 35 Years and over | 138 (81.2%) | 32 (18.8%) |
| Total | 2,875 (88.0%) | 392 (12.0%) |
Educational Attainment by Field of Study in Great Bend
Business (558 | 23.3%), education (413 | 17.2%), science & technology (270 | 11.3%), bio, nature & agricultural (224 | 9.4%), and arts & humanities (192 | 8.0%) are the most common fields of study among 2,394 individuals in Great Bend who have obtained a bachelor's degree or higher.
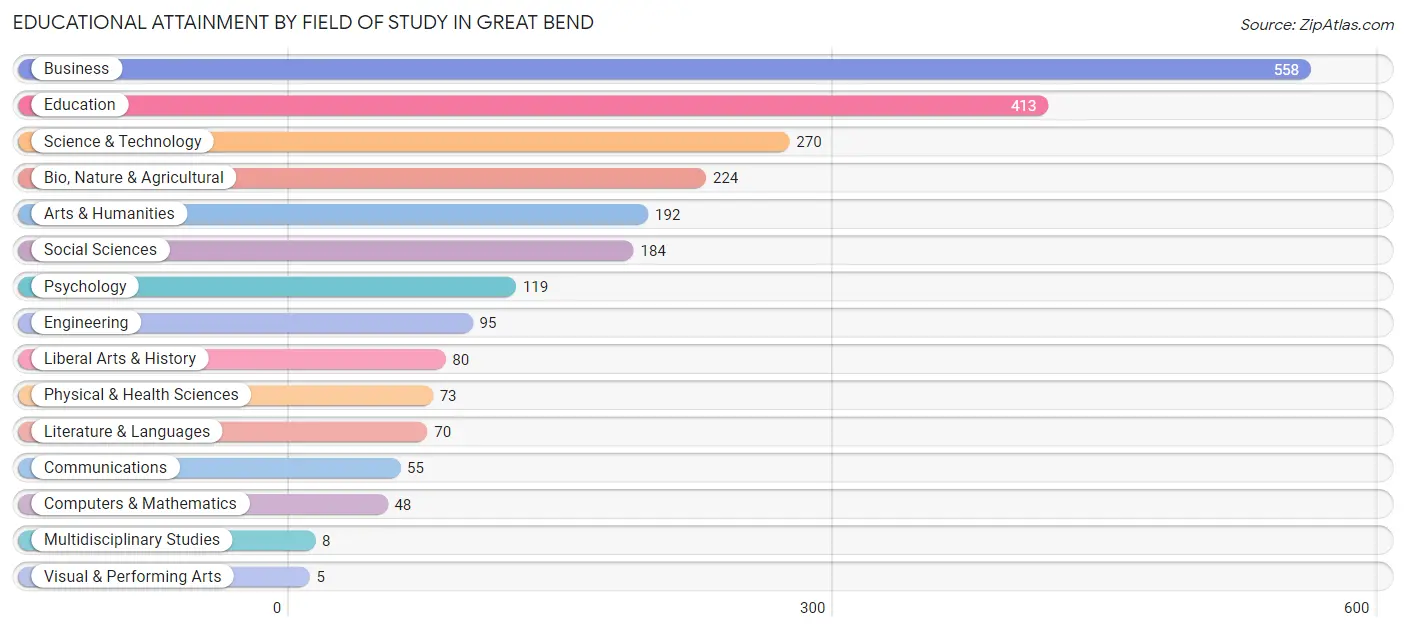
| Field of Study | # Graduates | % Graduates |
| Computers & Mathematics | 48 | 2.0% |
| Bio, Nature & Agricultural | 224 | 9.4% |
| Physical & Health Sciences | 73 | 3.0% |
| Psychology | 119 | 5.0% |
| Social Sciences | 184 | 7.7% |
| Engineering | 95 | 4.0% |
| Multidisciplinary Studies | 8 | 0.3% |
| Science & Technology | 270 | 11.3% |
| Business | 558 | 23.3% |
| Education | 413 | 17.2% |
| Literature & Languages | 70 | 2.9% |
| Liberal Arts & History | 80 | 3.3% |
| Visual & Performing Arts | 5 | 0.2% |
| Communications | 55 | 2.3% |
| Arts & Humanities | 192 | 8.0% |
| Total | 2,394 | 100.0% |
Transportation & Commute in Great Bend
Vehicle Availability by Sex in Great Bend
The most prevalent vehicle ownership categories in Great Bend are males with 2 vehicles (1,722, accounting for 46.3%) and females with 2 vehicles (1,302, making up 50.8%).
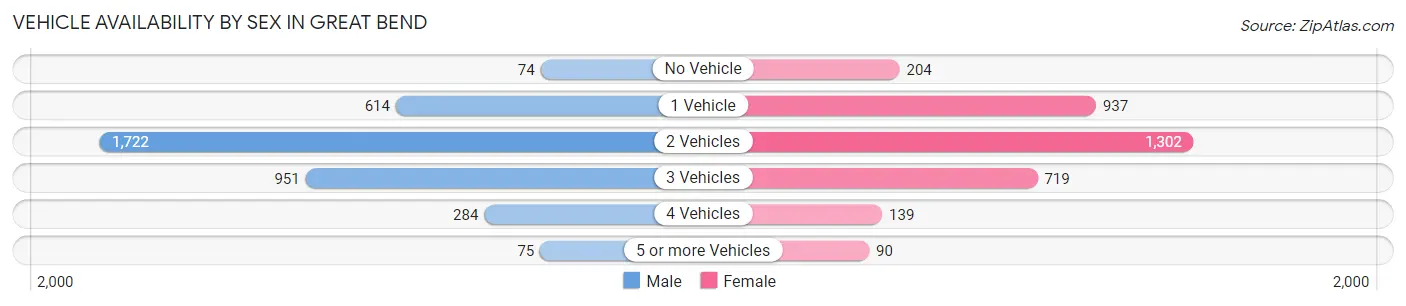
| Vehicles Available | Male | Female |
| No Vehicle | 74 (2.0%) | 204 (6.0%) |
| 1 Vehicle | 614 (16.5%) | 937 (27.6%) |
| 2 Vehicles | 1,722 (46.3%) | 1,302 (38.4%) |
| 3 Vehicles | 951 (25.6%) | 719 (21.2%) |
| 4 Vehicles | 284 (7.6%) | 139 (4.1%) |
| 5 or more Vehicles | 75 (2.0%) | 90 (2.6%) |
| Total | 3,720 (100.0%) | 3,391 (100.0%) |
Commute Time in Great Bend
The most frequently occuring commute durations in Great Bend are 5 to 9 minutes (2,257 commuters, 33.2%), 10 to 14 minutes (1,584 commuters, 23.3%), and 15 to 19 minutes (904 commuters, 13.3%).
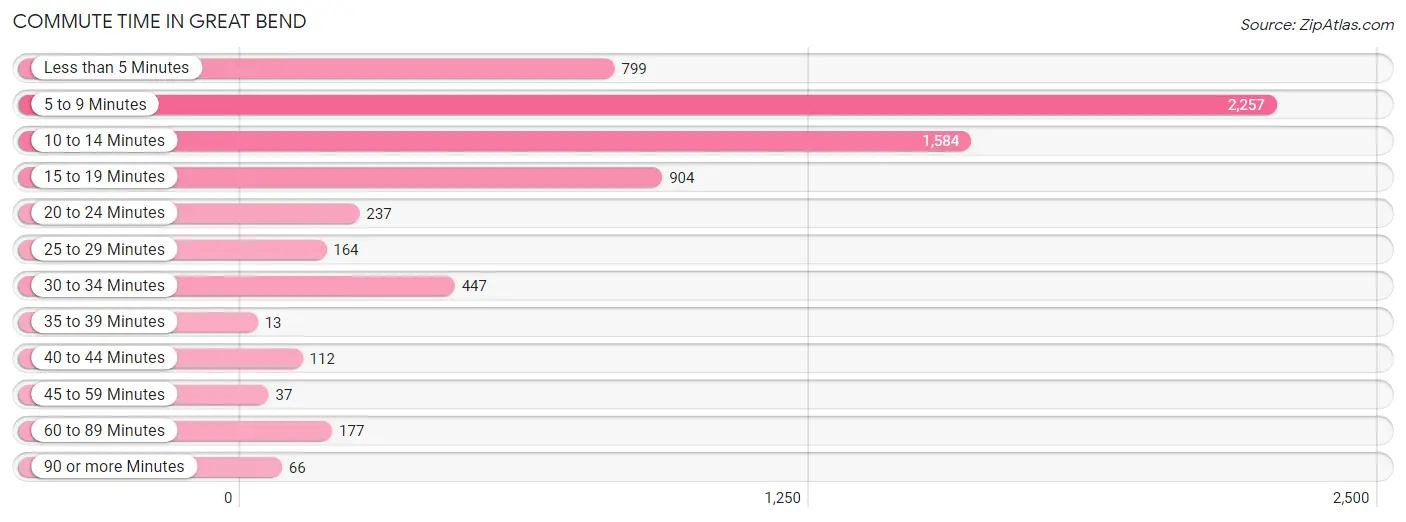
| Commute Time | # Commuters | % Commuters |
| Less than 5 Minutes | 799 | 11.8% |
| 5 to 9 Minutes | 2,257 | 33.2% |
| 10 to 14 Minutes | 1,584 | 23.3% |
| 15 to 19 Minutes | 904 | 13.3% |
| 20 to 24 Minutes | 237 | 3.5% |
| 25 to 29 Minutes | 164 | 2.4% |
| 30 to 34 Minutes | 447 | 6.6% |
| 35 to 39 Minutes | 13 | 0.2% |
| 40 to 44 Minutes | 112 | 1.7% |
| 45 to 59 Minutes | 37 | 0.5% |
| 60 to 89 Minutes | 177 | 2.6% |
| 90 or more Minutes | 66 | 1.0% |
Commute Time by Sex in Great Bend
The most common commute times in Great Bend are 5 to 9 minutes (1,040 commuters, 28.9%) for males and 5 to 9 minutes (1,217 commuters, 38.1%) for females.
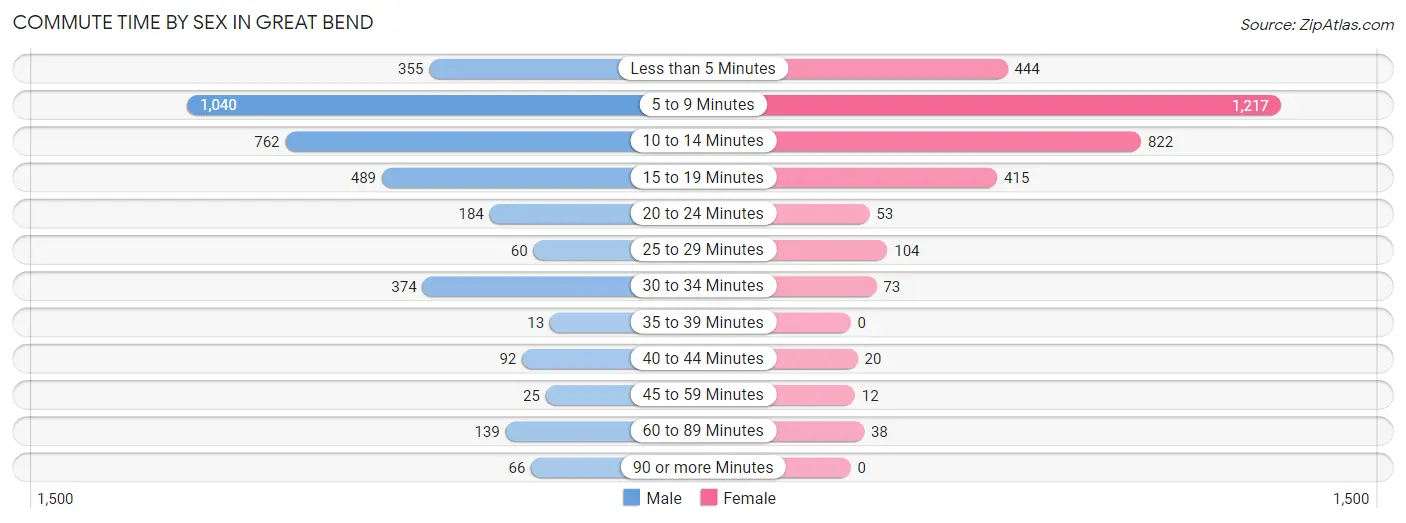
| Commute Time | Male | Female |
| Less than 5 Minutes | 355 (9.9%) | 444 (13.9%) |
| 5 to 9 Minutes | 1,040 (28.9%) | 1,217 (38.1%) |
| 10 to 14 Minutes | 762 (21.2%) | 822 (25.7%) |
| 15 to 19 Minutes | 489 (13.6%) | 415 (13.0%) |
| 20 to 24 Minutes | 184 (5.1%) | 53 (1.7%) |
| 25 to 29 Minutes | 60 (1.7%) | 104 (3.3%) |
| 30 to 34 Minutes | 374 (10.4%) | 73 (2.3%) |
| 35 to 39 Minutes | 13 (0.4%) | 0 (0.0%) |
| 40 to 44 Minutes | 92 (2.6%) | 20 (0.6%) |
| 45 to 59 Minutes | 25 (0.7%) | 12 (0.4%) |
| 60 to 89 Minutes | 139 (3.9%) | 38 (1.2%) |
| 90 or more Minutes | 66 (1.8%) | 0 (0.0%) |
Time of Departure to Work by Sex in Great Bend
The most frequent times of departure to work in Great Bend are 7:30 AM to 7:59 AM (644, 17.9%) for males and 7:30 AM to 7:59 AM (927, 29.0%) for females.
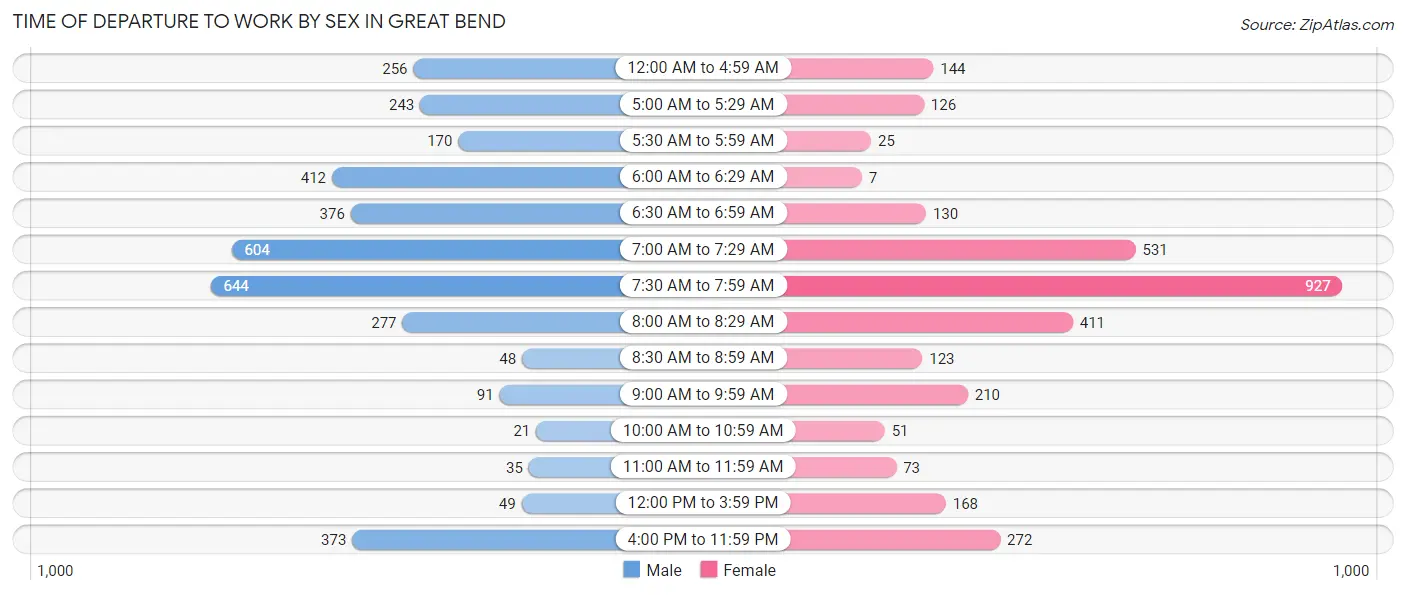
| Time of Departure | Male | Female |
| 12:00 AM to 4:59 AM | 256 (7.1%) | 144 (4.5%) |
| 5:00 AM to 5:29 AM | 243 (6.8%) | 126 (3.9%) |
| 5:30 AM to 5:59 AM | 170 (4.7%) | 25 (0.8%) |
| 6:00 AM to 6:29 AM | 412 (11.5%) | 7 (0.2%) |
| 6:30 AM to 6:59 AM | 376 (10.4%) | 130 (4.1%) |
| 7:00 AM to 7:29 AM | 604 (16.8%) | 531 (16.6%) |
| 7:30 AM to 7:59 AM | 644 (17.9%) | 927 (29.0%) |
| 8:00 AM to 8:29 AM | 277 (7.7%) | 411 (12.9%) |
| 8:30 AM to 8:59 AM | 48 (1.3%) | 123 (3.8%) |
| 9:00 AM to 9:59 AM | 91 (2.5%) | 210 (6.6%) |
| 10:00 AM to 10:59 AM | 21 (0.6%) | 51 (1.6%) |
| 11:00 AM to 11:59 AM | 35 (1.0%) | 73 (2.3%) |
| 12:00 PM to 3:59 PM | 49 (1.4%) | 168 (5.2%) |
| 4:00 PM to 11:59 PM | 373 (10.4%) | 272 (8.5%) |
| Total | 3,599 (100.0%) | 3,198 (100.0%) |
Housing Occupancy in Great Bend
Occupancy by Ownership in Great Bend
Of the total 5,721 dwellings in Great Bend, owner-occupied units account for 3,393 (59.3%), while renter-occupied units make up 2,328 (40.7%).
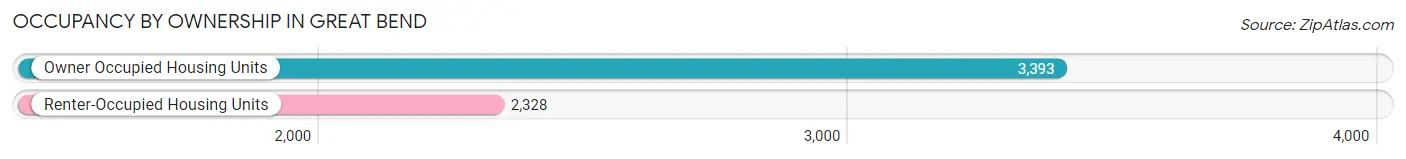
| Occupancy | # Housing Units | % Housing Units |
| Owner Occupied Housing Units | 3,393 | 59.3% |
| Renter-Occupied Housing Units | 2,328 | 40.7% |
| Total Occupied Housing Units | 5,721 | 100.0% |
Occupancy by Household Size in Great Bend
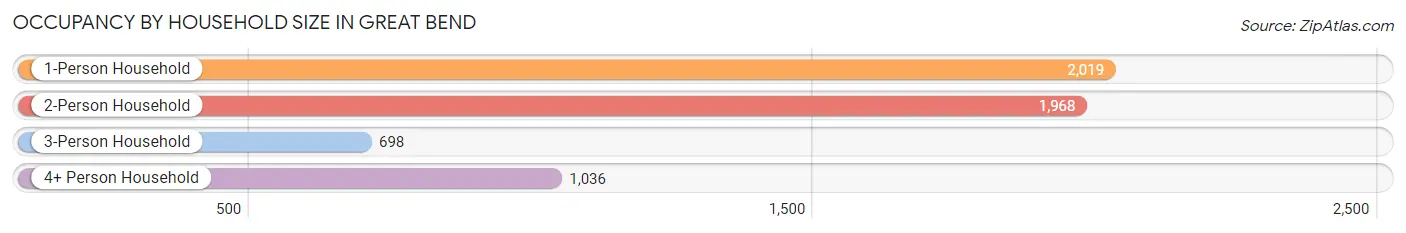
| Household Size | # Housing Units | % Housing Units |
| 1-Person Household | 2,019 | 35.3% |
| 2-Person Household | 1,968 | 34.4% |
| 3-Person Household | 698 | 12.2% |
| 4+ Person Household | 1,036 | 18.1% |
| Total Housing Units | 5,721 | 100.0% |
Occupancy by Ownership by Household Size in Great Bend
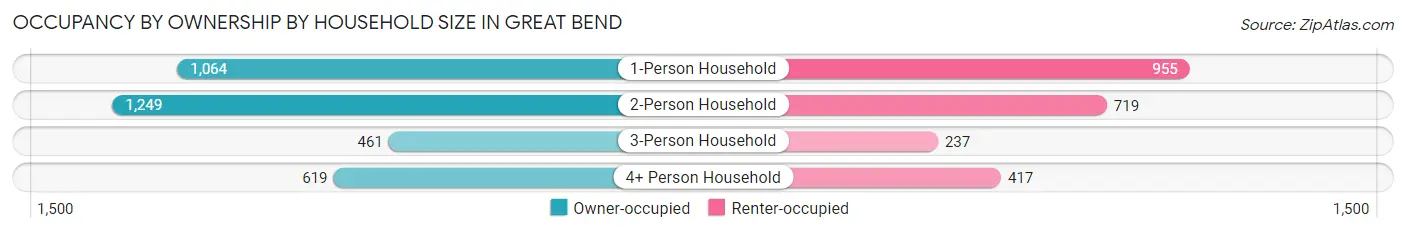
| Household Size | Owner-occupied | Renter-occupied |
| 1-Person Household | 1,064 (52.7%) | 955 (47.3%) |
| 2-Person Household | 1,249 (63.5%) | 719 (36.5%) |
| 3-Person Household | 461 (66.0%) | 237 (34.0%) |
| 4+ Person Household | 619 (59.8%) | 417 (40.3%) |
| Total Housing Units | 3,393 (59.3%) | 2,328 (40.7%) |
Occupancy by Educational Attainment in Great Bend
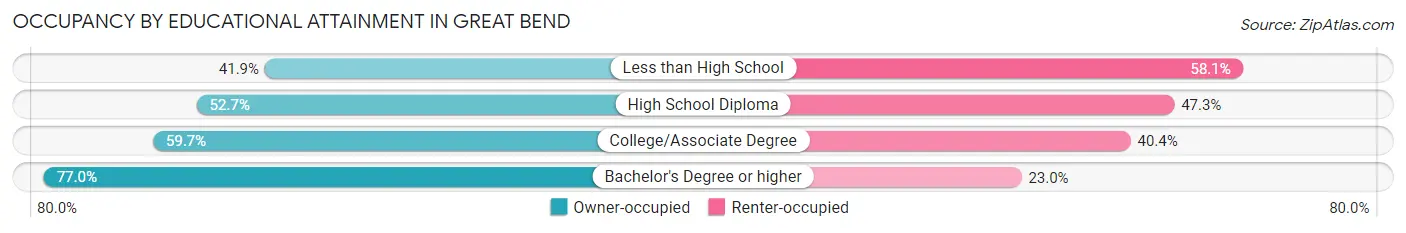
| Household Size | Owner-occupied | Renter-occupied |
| Less than High School | 235 (41.9%) | 326 (58.1%) |
| High School Diploma | 975 (52.7%) | 874 (47.3%) |
| College/Associate Degree | 1,258 (59.7%) | 851 (40.4%) |
| Bachelor's Degree or higher | 925 (77.0%) | 277 (23.0%) |
Occupancy by Age of Householder in Great Bend
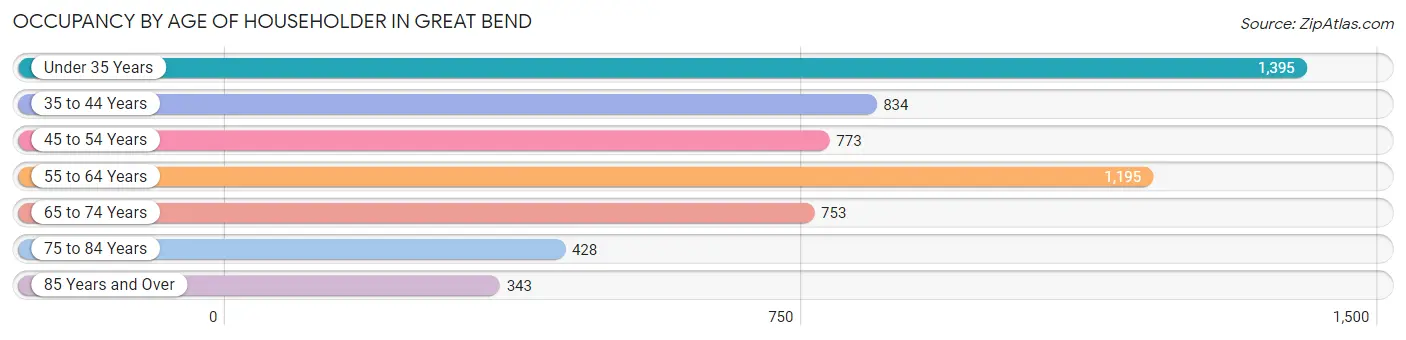
| Age Bracket | # Households | % Households |
| Under 35 Years | 1,395 | 24.4% |
| 35 to 44 Years | 834 | 14.6% |
| 45 to 54 Years | 773 | 13.5% |
| 55 to 64 Years | 1,195 | 20.9% |
| 65 to 74 Years | 753 | 13.2% |
| 75 to 84 Years | 428 | 7.5% |
| 85 Years and Over | 343 | 6.0% |
| Total | 5,721 | 100.0% |
Housing Finances in Great Bend
Median Income by Occupancy in Great Bend
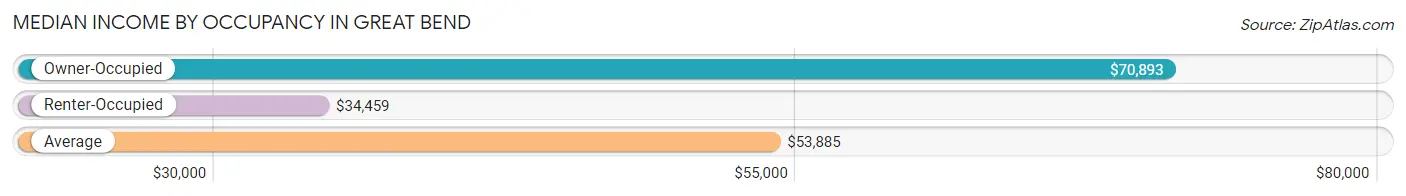
| Occupancy Type | # Households | Median Income |
| Owner-Occupied | 3,393 (59.3%) | $70,893 |
| Renter-Occupied | 2,328 (40.7%) | $34,459 |
| Average | 5,721 (100.0%) | $53,885 |
Occupancy by Householder Income Bracket in Great Bend
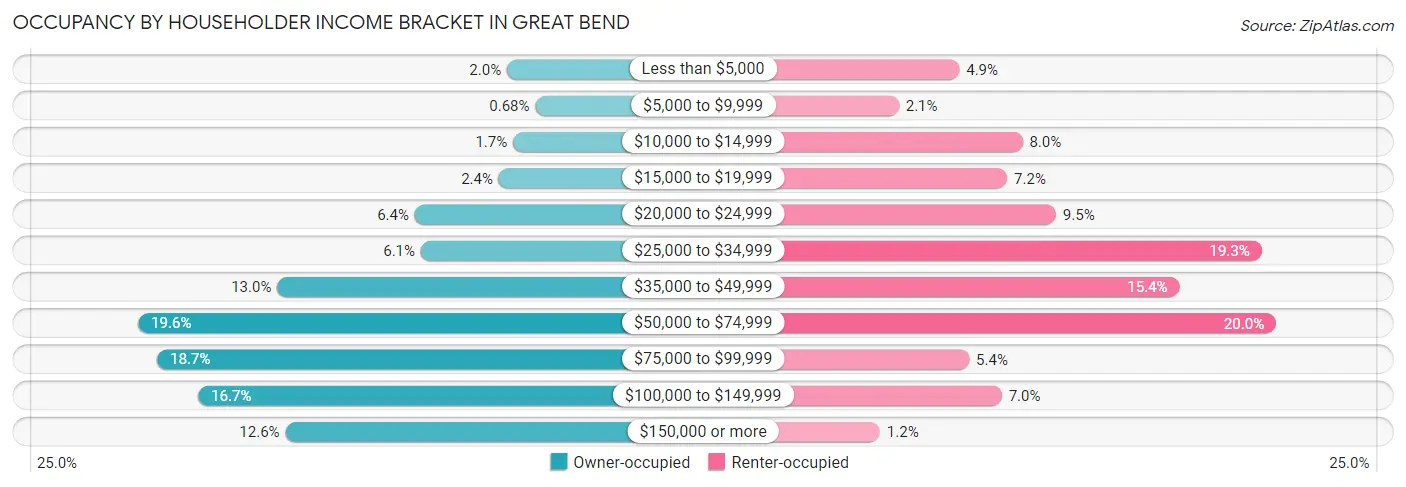
| Income Bracket | Owner-occupied | Renter-occupied |
| Less than $5,000 | 69 (2.0%) | 115 (4.9%) |
| $5,000 to $9,999 | 23 (0.7%) | 48 (2.1%) |
| $10,000 to $14,999 | 59 (1.7%) | 185 (8.0%) |
| $15,000 to $19,999 | 82 (2.4%) | 168 (7.2%) |
| $20,000 to $24,999 | 218 (6.4%) | 222 (9.5%) |
| $25,000 to $34,999 | 208 (6.1%) | 450 (19.3%) |
| $35,000 to $49,999 | 440 (13.0%) | 359 (15.4%) |
| $50,000 to $74,999 | 665 (19.6%) | 466 (20.0%) |
| $75,000 to $99,999 | 634 (18.7%) | 126 (5.4%) |
| $100,000 to $149,999 | 568 (16.7%) | 162 (7.0%) |
| $150,000 or more | 427 (12.6%) | 27 (1.2%) |
| Total | 3,393 (100.0%) | 2,328 (100.0%) |
Monthly Housing Cost Tiers in Great Bend
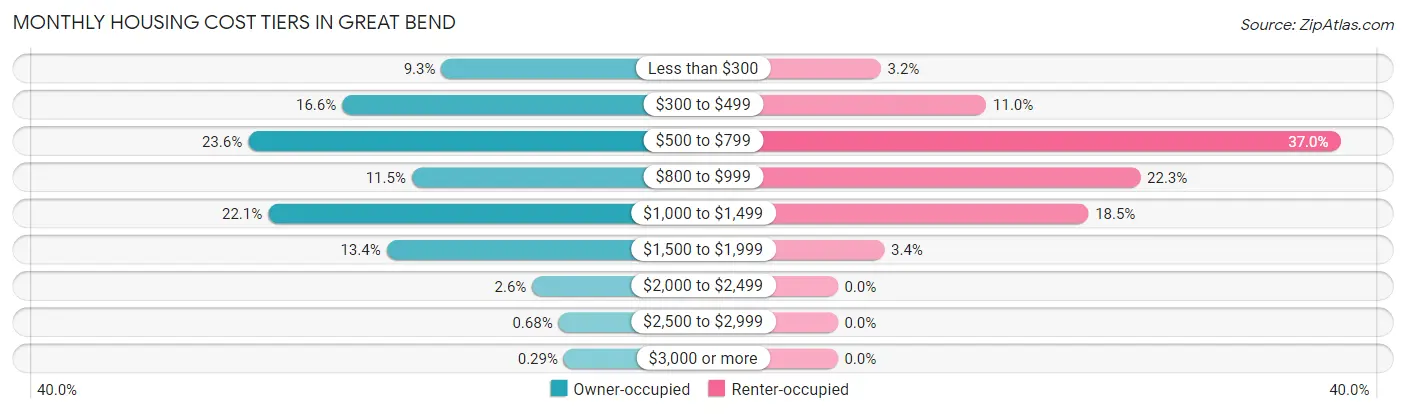
| Monthly Cost | Owner-occupied | Renter-occupied |
| Less than $300 | 316 (9.3%) | 74 (3.2%) |
| $300 to $499 | 564 (16.6%) | 255 (11.0%) |
| $500 to $799 | 799 (23.5%) | 862 (37.0%) |
| $800 to $999 | 390 (11.5%) | 519 (22.3%) |
| $1,000 to $1,499 | 749 (22.1%) | 430 (18.5%) |
| $1,500 to $1,999 | 453 (13.4%) | 80 (3.4%) |
| $2,000 to $2,499 | 89 (2.6%) | 0 (0.0%) |
| $2,500 to $2,999 | 23 (0.7%) | 0 (0.0%) |
| $3,000 or more | 10 (0.3%) | 0 (0.0%) |
| Total | 3,393 (100.0%) | 2,328 (100.0%) |
Physical Housing Characteristics in Great Bend
Housing Structures in Great Bend
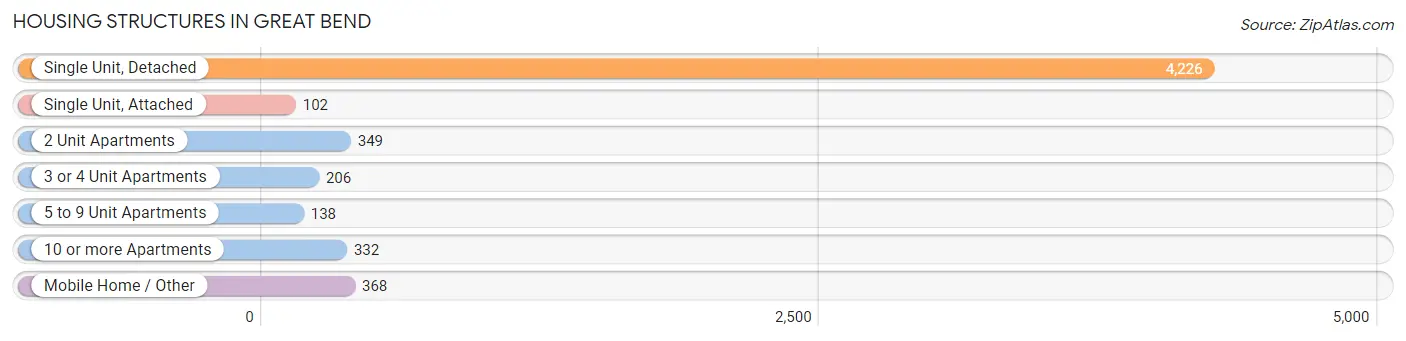
| Structure Type | # Housing Units | % Housing Units |
| Single Unit, Detached | 4,226 | 73.9% |
| Single Unit, Attached | 102 | 1.8% |
| 2 Unit Apartments | 349 | 6.1% |
| 3 or 4 Unit Apartments | 206 | 3.6% |
| 5 to 9 Unit Apartments | 138 | 2.4% |
| 10 or more Apartments | 332 | 5.8% |
| Mobile Home / Other | 368 | 6.4% |
| Total | 5,721 | 100.0% |
Housing Structures by Occupancy in Great Bend
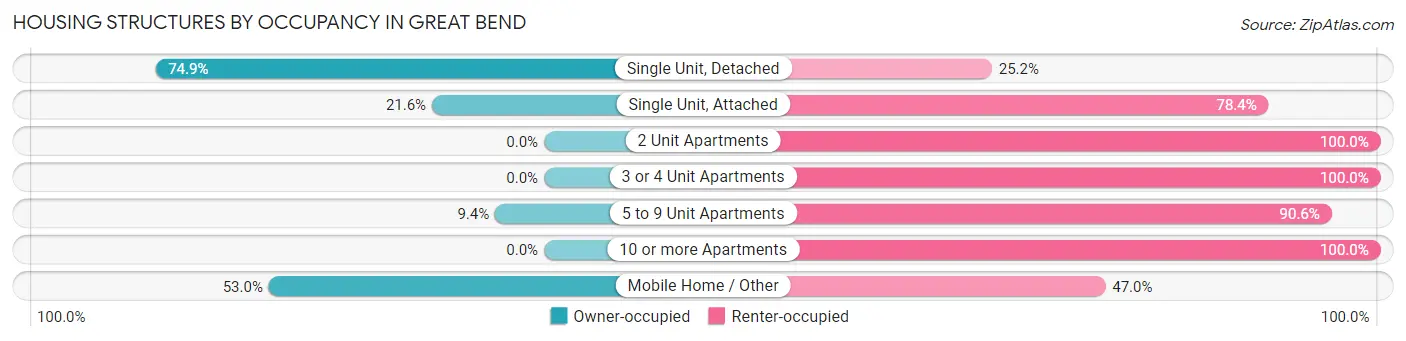
| Structure Type | Owner-occupied | Renter-occupied |
| Single Unit, Detached | 3,163 (74.9%) | 1,063 (25.2%) |
| Single Unit, Attached | 22 (21.6%) | 80 (78.4%) |
| 2 Unit Apartments | 0 (0.0%) | 349 (100.0%) |
| 3 or 4 Unit Apartments | 0 (0.0%) | 206 (100.0%) |
| 5 to 9 Unit Apartments | 13 (9.4%) | 125 (90.6%) |
| 10 or more Apartments | 0 (0.0%) | 332 (100.0%) |
| Mobile Home / Other | 195 (53.0%) | 173 (47.0%) |
| Total | 3,393 (59.3%) | 2,328 (40.7%) |
Housing Structures by Number of Rooms in Great Bend
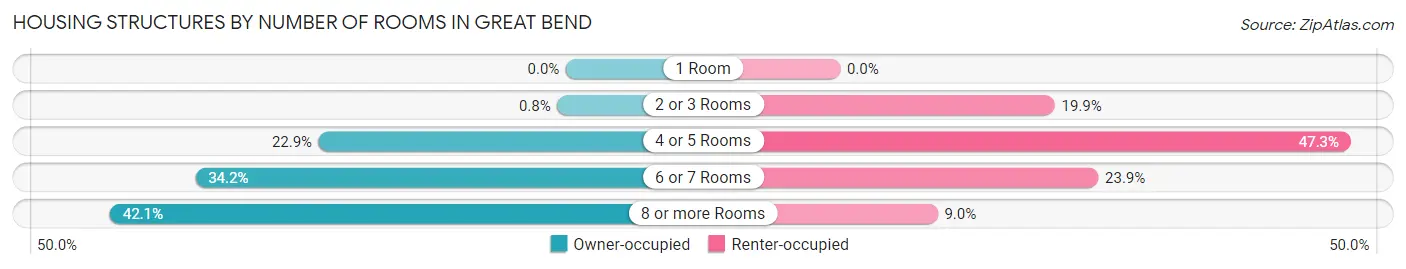
| Number of Rooms | Owner-occupied | Renter-occupied |
| 1 Room | 0 (0.0%) | 0 (0.0%) |
| 2 or 3 Rooms | 27 (0.8%) | 462 (19.9%) |
| 4 or 5 Rooms | 776 (22.9%) | 1,100 (47.2%) |
| 6 or 7 Rooms | 1,161 (34.2%) | 556 (23.9%) |
| 8 or more Rooms | 1,429 (42.1%) | 210 (9.0%) |
| Total | 3,393 (100.0%) | 2,328 (100.0%) |
Housing Structure by Heating Type in Great Bend
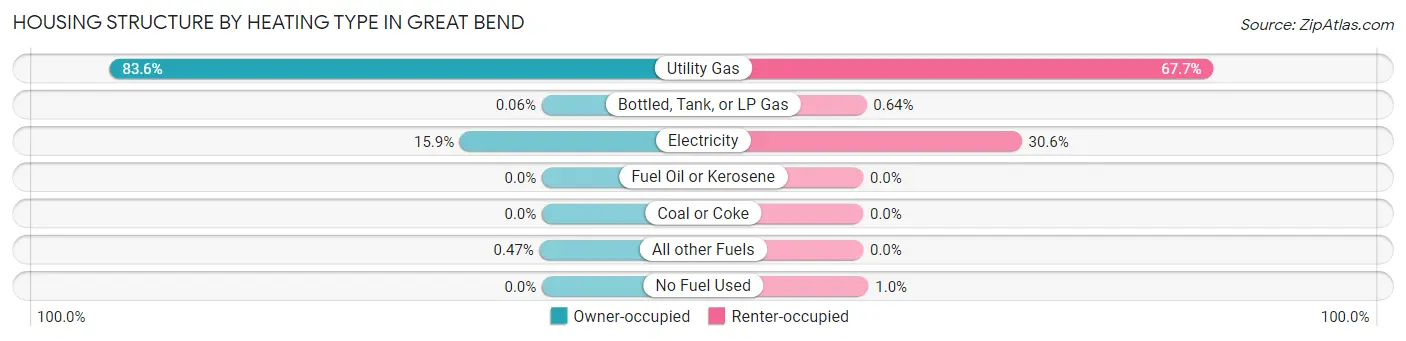
| Heating Type | Owner-occupied | Renter-occupied |
| Utility Gas | 2,837 (83.6%) | 1,576 (67.7%) |
| Bottled, Tank, or LP Gas | 2 (0.1%) | 15 (0.6%) |
| Electricity | 538 (15.9%) | 713 (30.6%) |
| Fuel Oil or Kerosene | 0 (0.0%) | 0 (0.0%) |
| Coal or Coke | 0 (0.0%) | 0 (0.0%) |
| All other Fuels | 16 (0.5%) | 0 (0.0%) |
| No Fuel Used | 0 (0.0%) | 24 (1.0%) |
| Total | 3,393 (100.0%) | 2,328 (100.0%) |
Household Vehicle Usage in Great Bend
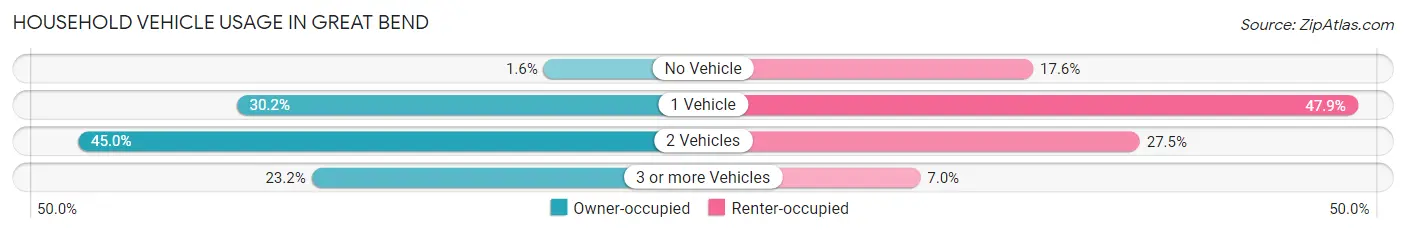
| Vehicles per Household | Owner-occupied | Renter-occupied |
| No Vehicle | 53 (1.6%) | 409 (17.6%) |
| 1 Vehicle | 1,025 (30.2%) | 1,114 (47.8%) |
| 2 Vehicles | 1,527 (45.0%) | 641 (27.5%) |
| 3 or more Vehicles | 788 (23.2%) | 164 (7.0%) |
| Total | 3,393 (100.0%) | 2,328 (100.0%) |
Real Estate & Mortgages in Great Bend
Real Estate and Mortgage Overview in Great Bend
| Characteristic | Without Mortgage | With Mortgage |
| Housing Units | 1,745 | 1,648 |
| Median Property Value | $105,100 | $132,200 |
| Median Household Income | $59,911 | $244 |
| Monthly Housing Costs | $510 | $10 |
| Real Estate Taxes | $1,802 | $37 |
Property Value by Mortgage Status in Great Bend
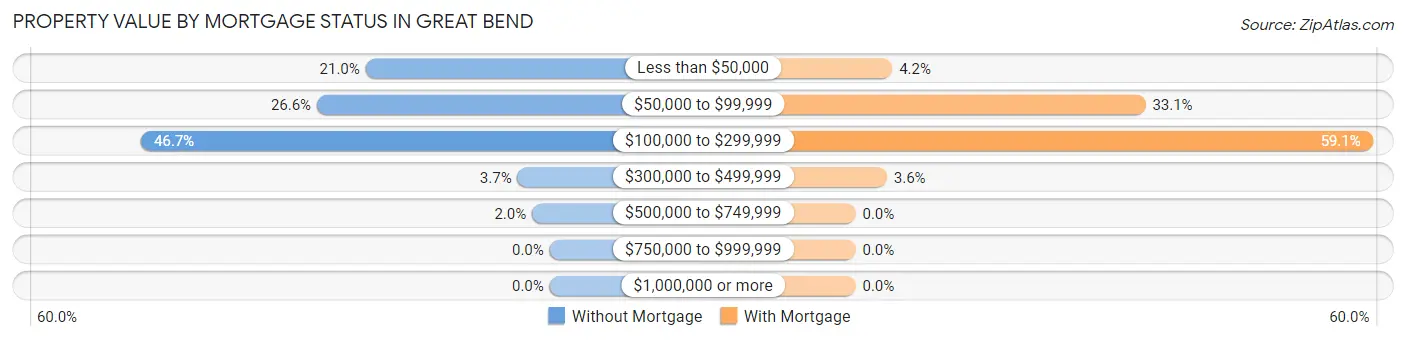
| Property Value | Without Mortgage | With Mortgage |
| Less than $50,000 | 367 (21.0%) | 69 (4.2%) |
| $50,000 to $99,999 | 464 (26.6%) | 546 (33.1%) |
| $100,000 to $299,999 | 815 (46.7%) | 974 (59.1%) |
| $300,000 to $499,999 | 64 (3.7%) | 59 (3.6%) |
| $500,000 to $749,999 | 35 (2.0%) | 0 (0.0%) |
| $750,000 to $999,999 | 0 (0.0%) | 0 (0.0%) |
| $1,000,000 or more | 0 (0.0%) | 0 (0.0%) |
| Total | 1,745 (100.0%) | 1,648 (100.0%) |
Household Income by Mortgage Status in Great Bend
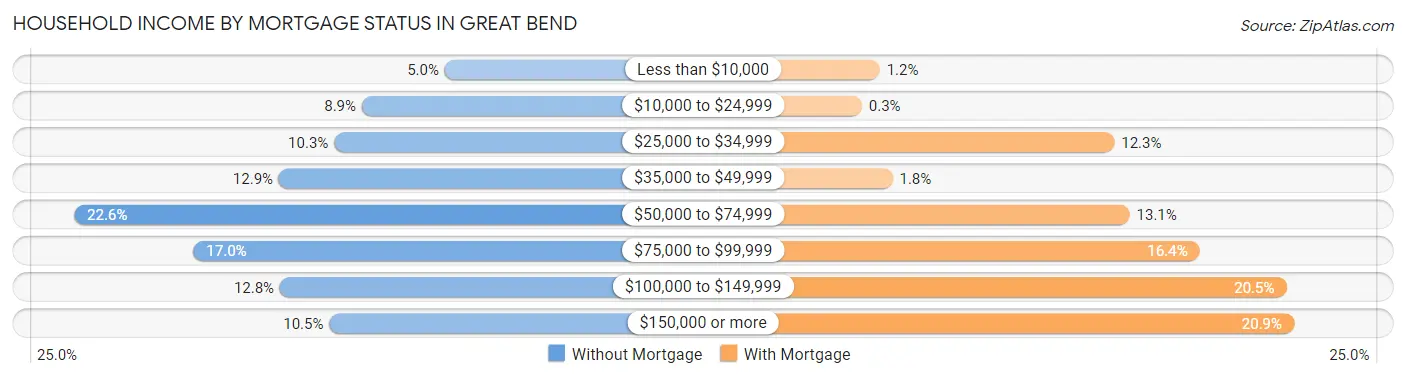
| Household Income | Without Mortgage | With Mortgage |
| Less than $10,000 | 87 (5.0%) | 19 (1.1%) |
| $10,000 to $24,999 | 156 (8.9%) | 5 (0.3%) |
| $25,000 to $34,999 | 179 (10.3%) | 203 (12.3%) |
| $35,000 to $49,999 | 225 (12.9%) | 29 (1.8%) |
| $50,000 to $74,999 | 395 (22.6%) | 215 (13.1%) |
| $75,000 to $99,999 | 296 (17.0%) | 270 (16.4%) |
| $100,000 to $149,999 | 224 (12.8%) | 338 (20.5%) |
| $150,000 or more | 183 (10.5%) | 344 (20.9%) |
| Total | 1,745 (100.0%) | 1,648 (100.0%) |
Property Value to Household Income Ratio in Great Bend
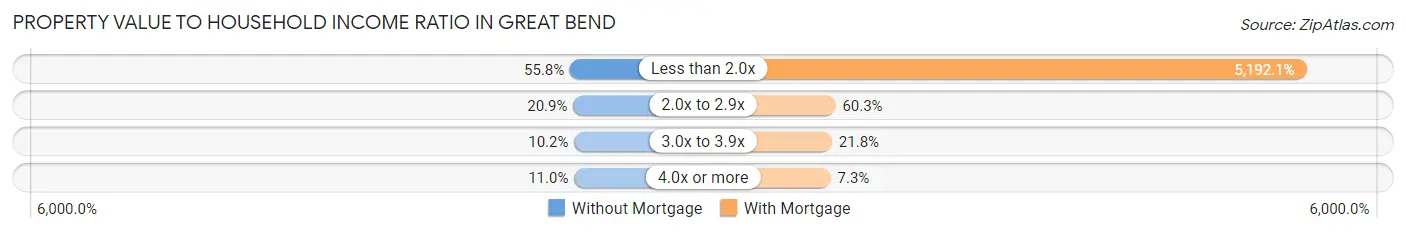
| Value-to-Income Ratio | Without Mortgage | With Mortgage |
| Less than 2.0x | 973 (55.8%) | 85,565 (5,192.0%) |
| 2.0x to 2.9x | 365 (20.9%) | 994 (60.3%) |
| 3.0x to 3.9x | 178 (10.2%) | 360 (21.8%) |
| 4.0x or more | 191 (11.0%) | 121 (7.3%) |
| Total | 1,745 (100.0%) | 1,648 (100.0%) |
Real Estate Taxes by Mortgage Status in Great Bend
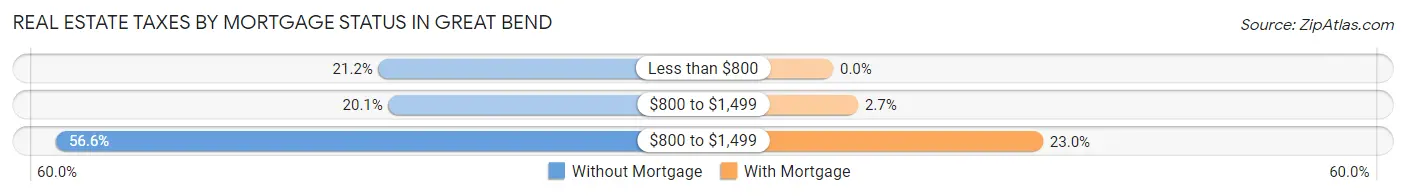
| Property Taxes | Without Mortgage | With Mortgage |
| Less than $800 | 370 (21.2%) | 0 (0.0%) |
| $800 to $1,499 | 351 (20.1%) | 45 (2.7%) |
| $800 to $1,499 | 987 (56.6%) | 379 (23.0%) |
| Total | 1,745 (100.0%) | 1,648 (100.0%) |
Health & Disability in Great Bend
Health Insurance Coverage by Age in Great Bend
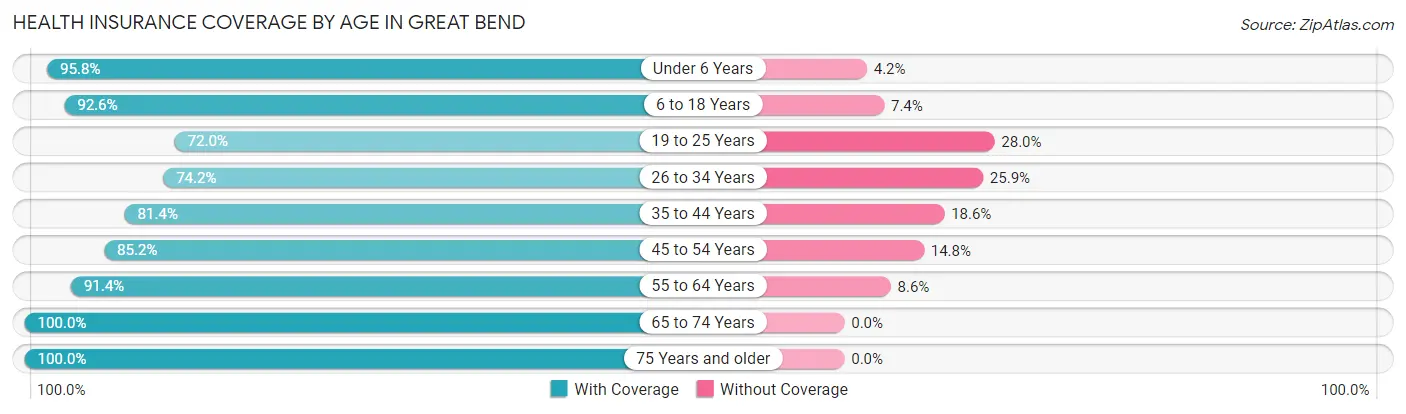
| Age Bracket | With Coverage | Without Coverage |
| Under 6 Years | 1,304 (95.8%) | 57 (4.2%) |
| 6 to 18 Years | 2,287 (92.6%) | 183 (7.4%) |
| 19 to 25 Years | 826 (72.0%) | 321 (28.0%) |
| 26 to 34 Years | 1,563 (74.2%) | 545 (25.9%) |
| 35 to 44 Years | 1,319 (81.4%) | 302 (18.6%) |
| 45 to 54 Years | 1,114 (85.2%) | 194 (14.8%) |
| 55 to 64 Years | 1,692 (91.4%) | 160 (8.6%) |
| 65 to 74 Years | 1,307 (100.0%) | 0 (0.0%) |
| 75 Years and older | 1,241 (100.0%) | 0 (0.0%) |
| Total | 12,653 (87.8%) | 1,762 (12.2%) |
Health Insurance Coverage by Citizenship Status in Great Bend
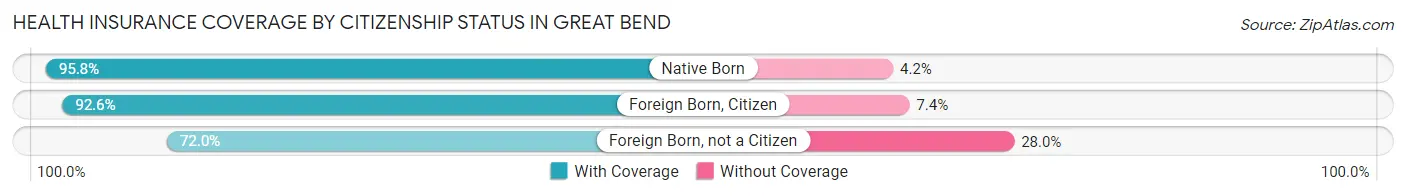
| Citizenship Status | With Coverage | Without Coverage |
| Native Born | 1,304 (95.8%) | 57 (4.2%) |
| Foreign Born, Citizen | 2,287 (92.6%) | 183 (7.4%) |
| Foreign Born, not a Citizen | 826 (72.0%) | 321 (28.0%) |
Health Insurance Coverage by Household Income in Great Bend
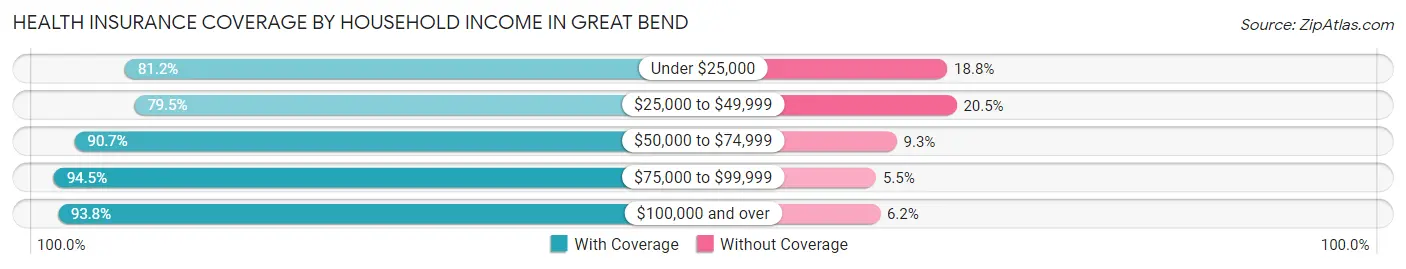
| Household Income | With Coverage | Without Coverage |
| Under $25,000 | 1,918 (81.2%) | 444 (18.8%) |
| $25,000 to $49,999 | 2,746 (79.5%) | 710 (20.5%) |
| $50,000 to $74,999 | 2,139 (90.7%) | 220 (9.3%) |
| $75,000 to $99,999 | 2,059 (94.5%) | 119 (5.5%) |
| $100,000 and over | 3,722 (93.8%) | 247 (6.2%) |
Public vs Private Health Insurance Coverage by Age in Great Bend
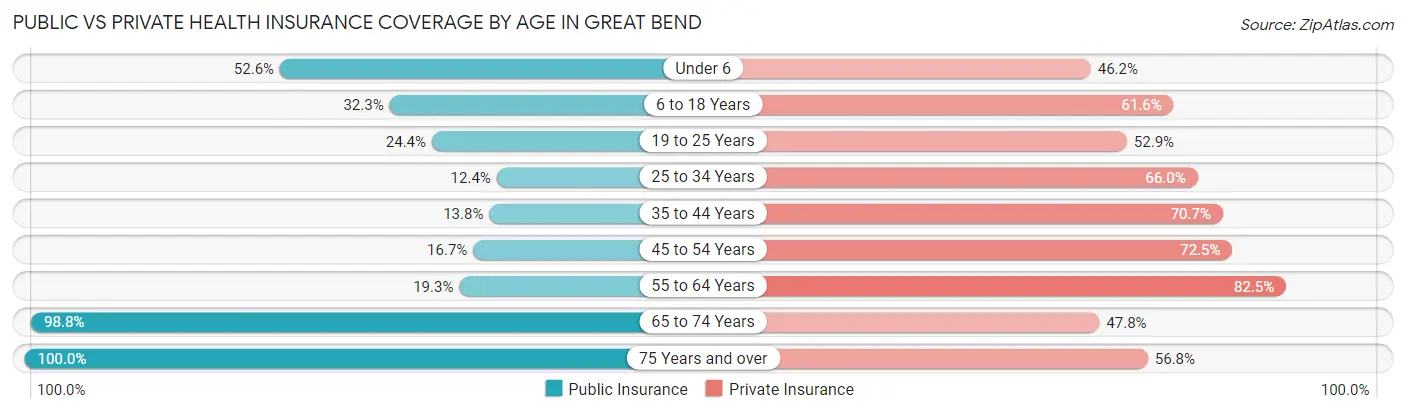
| Age Bracket | Public Insurance | Private Insurance |
| Under 6 | 716 (52.6%) | 629 (46.2%) |
| 6 to 18 Years | 797 (32.3%) | 1,521 (61.6%) |
| 19 to 25 Years | 280 (24.4%) | 607 (52.9%) |
| 25 to 34 Years | 261 (12.4%) | 1,392 (66.0%) |
| 35 to 44 Years | 223 (13.8%) | 1,146 (70.7%) |
| 45 to 54 Years | 219 (16.7%) | 948 (72.5%) |
| 55 to 64 Years | 358 (19.3%) | 1,527 (82.5%) |
| 65 to 74 Years | 1,291 (98.8%) | 625 (47.8%) |
| 75 Years and over | 1,241 (100.0%) | 705 (56.8%) |
| Total | 5,386 (37.4%) | 9,100 (63.1%) |
Disability Status by Sex by Age in Great Bend
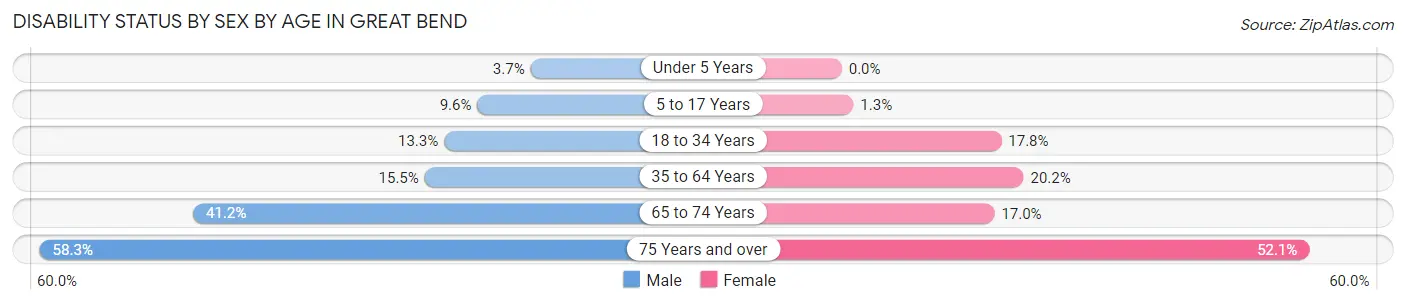
| Age Bracket | Male | Female |
| Under 5 Years | 22 (3.7%) | 0 (0.0%) |
| 5 to 17 Years | 113 (9.6%) | 18 (1.3%) |
| 18 to 34 Years | 209 (13.3%) | 322 (17.8%) |
| 35 to 64 Years | 383 (15.4%) | 466 (20.2%) |
| 65 to 74 Years | 226 (41.2%) | 129 (17.0%) |
| 75 Years and over | 298 (58.3%) | 380 (52.0%) |
Disability Class by Sex by Age in Great Bend
Disability Class: Hearing Difficulty
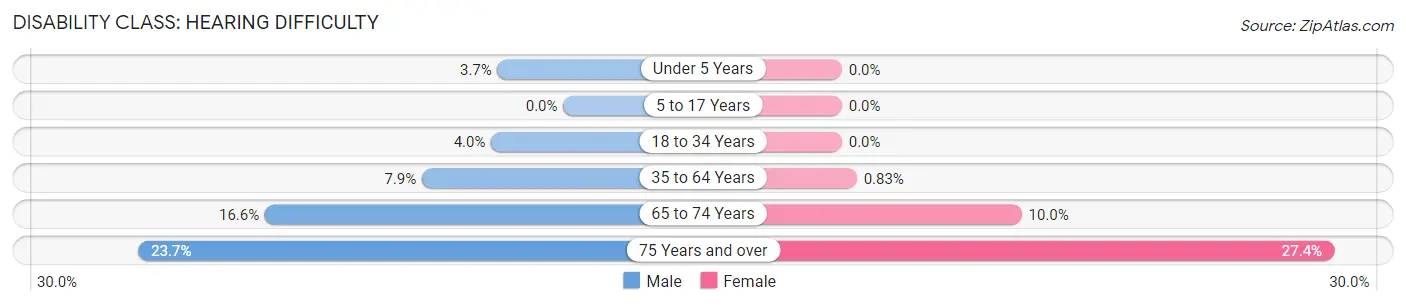
| Age Bracket | Male | Female |
| Under 5 Years | 22 (3.7%) | 0 (0.0%) |
| 5 to 17 Years | 0 (0.0%) | 0 (0.0%) |
| 18 to 34 Years | 63 (4.0%) | 0 (0.0%) |
| 35 to 64 Years | 195 (7.9%) | 19 (0.8%) |
| 65 to 74 Years | 91 (16.6%) | 76 (10.0%) |
| 75 Years and over | 121 (23.7%) | 200 (27.4%) |
Disability Class: Vision Difficulty
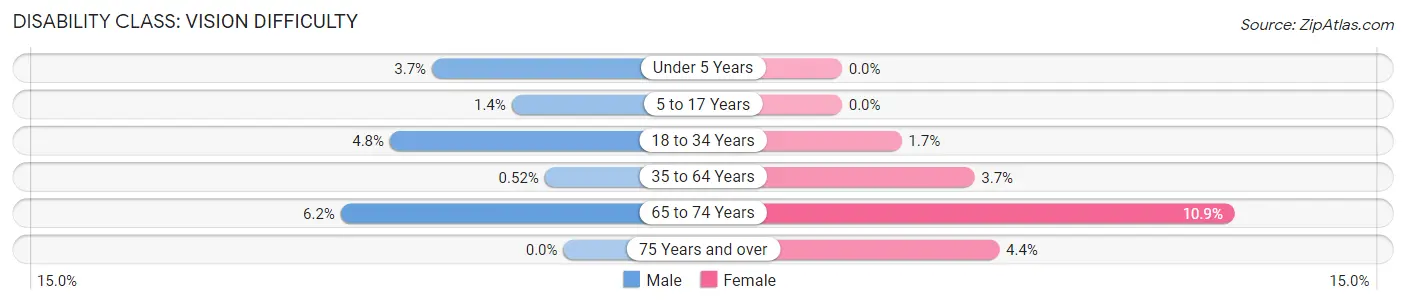
| Age Bracket | Male | Female |
| Under 5 Years | 22 (3.7%) | 0 (0.0%) |
| 5 to 17 Years | 17 (1.4%) | 0 (0.0%) |
| 18 to 34 Years | 76 (4.8%) | 30 (1.7%) |
| 35 to 64 Years | 13 (0.5%) | 85 (3.7%) |
| 65 to 74 Years | 34 (6.2%) | 83 (10.9%) |
| 75 Years and over | 0 (0.0%) | 32 (4.4%) |
Disability Class: Cognitive Difficulty
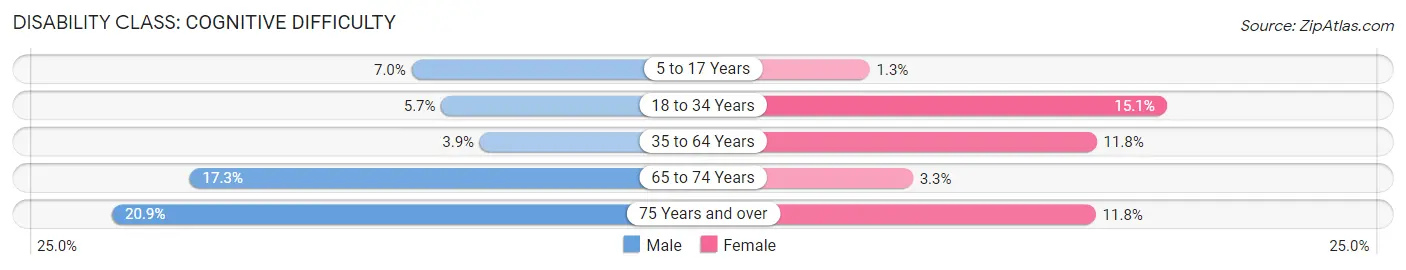
| Age Bracket | Male | Female |
| 5 to 17 Years | 83 (7.0%) | 18 (1.3%) |
| 18 to 34 Years | 89 (5.7%) | 273 (15.1%) |
| 35 to 64 Years | 96 (3.9%) | 272 (11.8%) |
| 65 to 74 Years | 95 (17.3%) | 25 (3.3%) |
| 75 Years and over | 107 (20.9%) | 86 (11.8%) |
Disability Class: Ambulatory Difficulty
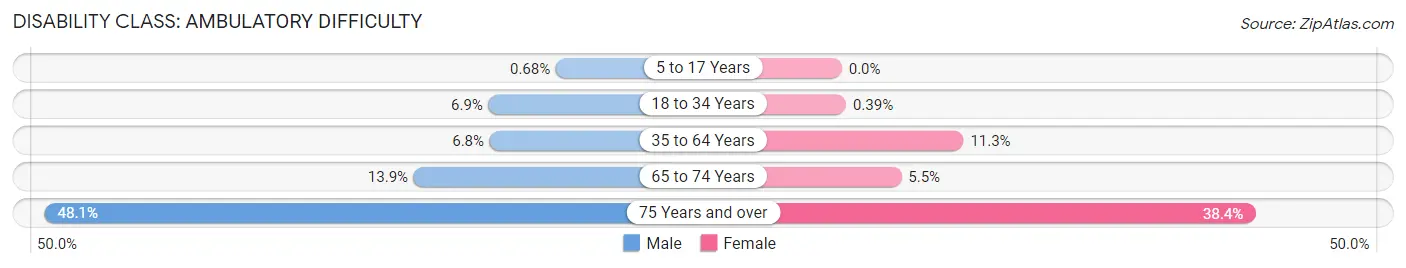
| Age Bracket | Male | Female |
| 5 to 17 Years | 8 (0.7%) | 0 (0.0%) |
| 18 to 34 Years | 109 (6.9%) | 7 (0.4%) |
| 35 to 64 Years | 169 (6.8%) | 260 (11.3%) |
| 65 to 74 Years | 76 (13.9%) | 42 (5.5%) |
| 75 Years and over | 246 (48.1%) | 280 (38.4%) |
Disability Class: Self-Care Difficulty
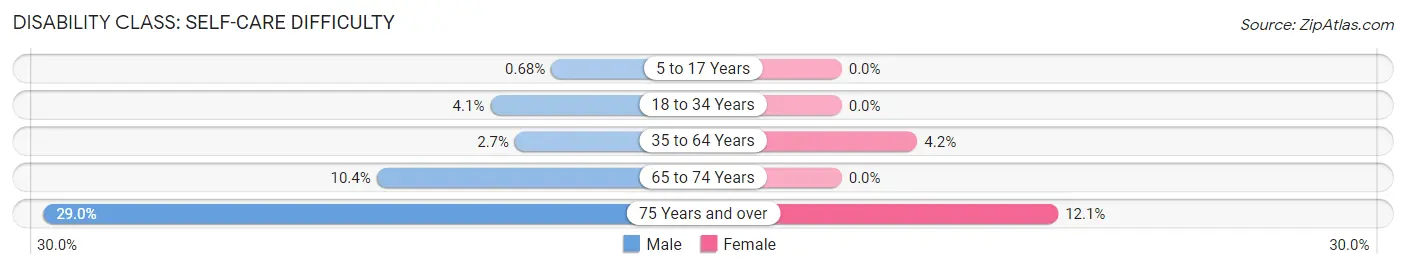
| Age Bracket | Male | Female |
| 5 to 17 Years | 8 (0.7%) | 0 (0.0%) |
| 18 to 34 Years | 64 (4.1%) | 0 (0.0%) |
| 35 to 64 Years | 67 (2.7%) | 97 (4.2%) |
| 65 to 74 Years | 57 (10.4%) | 0 (0.0%) |
| 75 Years and over | 148 (29.0%) | 88 (12.0%) |
Technology Access in Great Bend
Computing Device Access in Great Bend
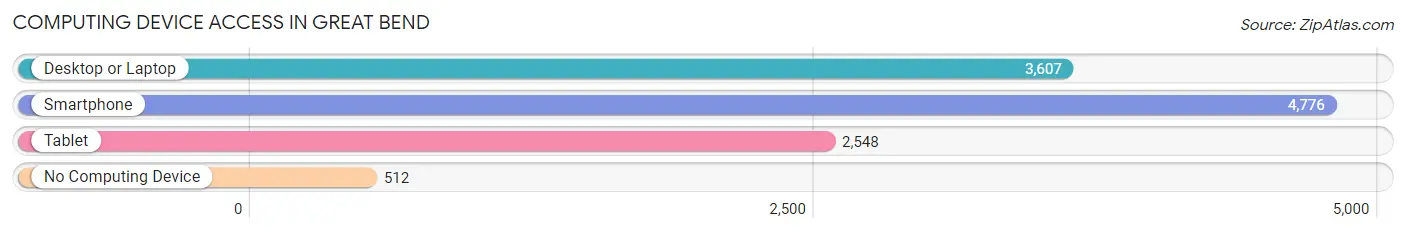
| Device Type | # Households | % Households |
| Desktop or Laptop | 3,607 | 63.0% |
| Smartphone | 4,776 | 83.5% |
| Tablet | 2,548 | 44.5% |
| No Computing Device | 512 | 8.9% |
| Total | 5,721 | 100.0% |
Internet Access in Great Bend
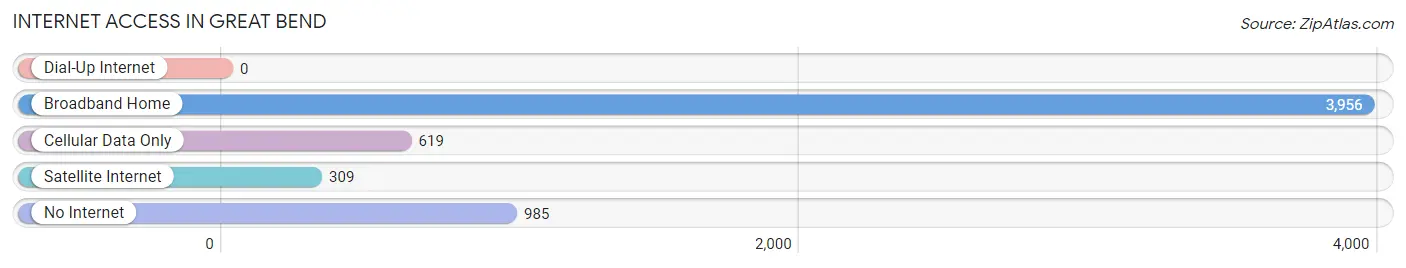
| Internet Type | # Households | % Households |
| Dial-Up Internet | 0 | 0.0% |
| Broadband Home | 3,956 | 69.2% |
| Cellular Data Only | 619 | 10.8% |
| Satellite Internet | 309 | 5.4% |
| No Internet | 985 | 17.2% |
| Total | 5,721 | 100.0% |
Great Bend Summary
History
Great Bend, Kansas is a city located in Barton County, in the central part of the state. It is the county seat of Barton County and is located along the Arkansas River. The city was founded in 1872 and was named after its location at the “great bend” of the Arkansas River. The city was originally a trading post and was a stop on the Santa Fe Trail.
The city was incorporated in 1885 and has grown steadily since then. The population of Great Bend was estimated to be 15,995 in 2019. The city is home to several industries, including agriculture, manufacturing, and oil and gas production.
Geography
Great Bend is located in the central part of Kansas, in Barton County. It is situated along the Arkansas River, which forms the city’s western boundary. The city is located at an elevation of 1,845 feet (562 m) above sea level.
The city has a total area of 8.3 square miles (21.5 km2), of which 8.2 square miles (21.3 km2) is land and 0.1 square miles (0.2 km2) is water. The city is located in the Central Great Plains ecoregion, which is characterized by flat to rolling terrain and grasslands.
Economy
Great Bend’s economy is largely based on agriculture, manufacturing, and oil and gas production. The city is home to several large agricultural operations, including grain elevators, feed mills, and livestock operations. The city is also home to several manufacturing companies, including a plastics plant, a metal fabrication plant, and a food processing plant.
The city is also home to several oil and gas production companies, including a natural gas processing plant and several oil and gas wells. The city is also home to several retail stores, restaurants, and other businesses.
Demographics
As of the 2010 census, the population of Great Bend was 15,995. The racial makeup of the city was 87.3% White, 5.2% African American, 0.7% Native American, 0.7% Asian, 0.1% Pacific Islander, 3.2% from other races, and 2.9% from two or more races. Hispanic or Latino of any race were 8.2% of the population.
The median income for a household in the city was $37,945, and the median income for a family was $45,945. The per capita income for the city was $19,945. About 11.2% of families and 14.2% of the population were below the poverty line, including 19.2% of those under age 18 and 8.2% of those age 65 or over.
Great Bend is served by the Great Bend Public Schools system, which includes four elementary schools, one middle school, and one high school. The city is also home to Barton Community College, which offers associate’s degrees and certificate programs.
Common Questions
What is Per Capita Income in Great Bend?
Per Capita income in Great Bend is $29,069.
What is the Median Family Income in Great Bend?
Median Family Income in Great Bend is $71,957.
What is the Median Household income in Great Bend?
Median Household Income in Great Bend is $53,885.
What is Income or Wage Gap in Great Bend?
Income or Wage Gap in Great Bend is 30.8%.
Women in Great Bend earn 69.2 cents for every dollar earned by a man.
What is Inequality or Gini Index in Great Bend?
Inequality or Gini Index in Great Bend is 0.43.
What is the Total Population of Great Bend?
Total Population of Great Bend is 14,725.
What is the Total Male Population of Great Bend?
Total Male Population of Great Bend is 7,059.
What is the Total Female Population of Great Bend?
Total Female Population of Great Bend is 7,666.
What is the Ratio of Males per 100 Females in Great Bend?
There are 92.08 Males per 100 Females in Great Bend.
What is the Ratio of Females per 100 Males in Great Bend?
There are 108.60 Females per 100 Males in Great Bend.
What is the Median Population Age in Great Bend?
Median Population Age in Great Bend is 36.5 Years.
What is the Average Family Size in Great Bend
Average Family Size in Great Bend is 3.2 People.
What is the Average Household Size in Great Bend
Average Household Size in Great Bend is 2.5 People.
How Large is the Labor Force in Great Bend?
There are 7,559 People in the Labor Forcein in Great Bend.
What is the Percentage of People in the Labor Force in Great Bend?
66.4% of People are in the Labor Force in Great Bend.
What is the Unemployment Rate in Great Bend?
Unemployment Rate in Great Bend is 4.8%.