Girard, KS Map & Demographics
Girard Map
Girard Overview
$24,141
PER CAPITA INCOME
$41,354
AVG FAMILY INCOME
$38,824
AVG HOUSEHOLD INCOME
23.7%
WAGE / INCOME GAP [ % ]
76.3¢/ $1
WAGE / INCOME GAP [ $ ]
0.42
INEQUALITY / GINI INDEX
2,639
TOTAL POPULATION
1,280
MALE POPULATION
1,359
FEMALE POPULATION
94.19
MALES / 100 FEMALES
106.17
FEMALES / 100 MALES
38.6
MEDIAN AGE
3.3
AVG FAMILY SIZE
2.4
AVG HOUSEHOLD SIZE
1,248
LABOR FORCE [ PEOPLE ]
56.9%
PERCENT IN LABOR FORCE
3.8%
UNEMPLOYMENT RATE
Girard Zip Codes
Girard Area Codes
Income in Girard
Income Overview in Girard
Per Capita Income in Girard is $24,141, while median incomes of families and households are $41,354 and $38,824 respectively.
| Characteristic | Number | Measure |
| Per Capita Income | 2,639 | $24,141 |
| Median Family Income | 569 | $41,354 |
| Mean Family Income | 569 | $64,615 |
| Median Household Income | 1,028 | $38,824 |
| Mean Household Income | 1,028 | $53,176 |
| Income Deficit | 569 | $0 |
| Wage / Income Gap (%) | 2,639 | 23.69% |
| Wage / Income Gap ($) | 2,639 | 76.31¢ per $1 |
| Gini / Inequality Index | 2,639 | 0.42 |
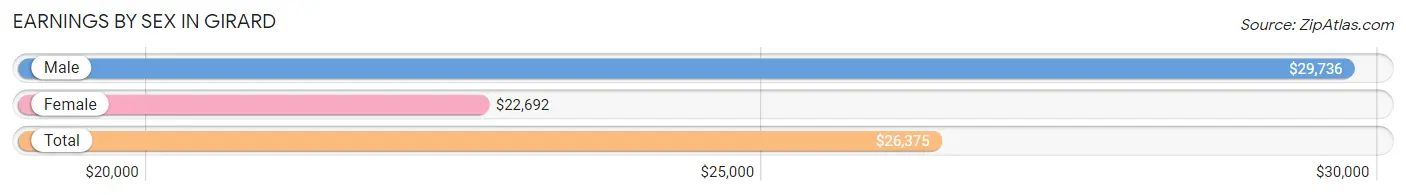
Earnings by Sex in Girard
Average Earnings in Girard are $26,375, $29,736 for men and $22,692 for women, a difference of 23.7%.
| Sex | Number | Average Earnings |
| Male | 677 (51.9%) | $29,736 |
| Female | 628 (48.1%) | $22,692 |
| Total | 1,305 (100.0%) | $26,375 |
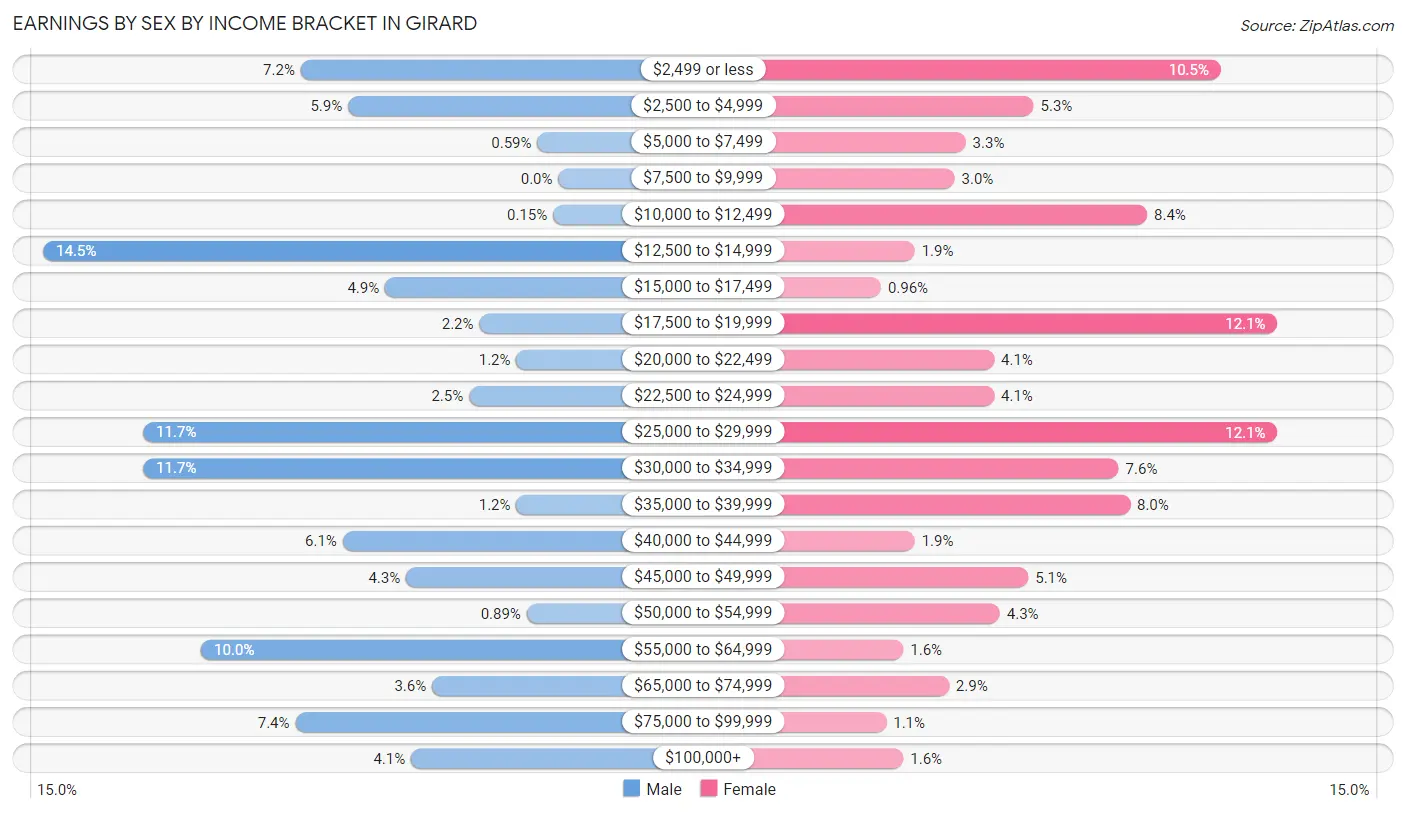
Earnings by Sex by Income Bracket in Girard
The most common earnings brackets in Girard are $12,500 to $14,999 for men (98 | 14.5%) and $17,500 to $19,999 for women (76 | 12.1%).
| Income | Male | Female |
| $2,499 or less | 49 (7.2%) | 66 (10.5%) |
| $2,500 to $4,999 | 40 (5.9%) | 33 (5.2%) |
| $5,000 to $7,499 | 4 (0.6%) | 21 (3.3%) |
| $7,500 to $9,999 | 0 (0.0%) | 19 (3.0%) |
| $10,000 to $12,499 | 1 (0.2%) | 53 (8.4%) |
| $12,500 to $14,999 | 98 (14.5%) | 12 (1.9%) |
| $15,000 to $17,499 | 33 (4.9%) | 6 (1.0%) |
| $17,500 to $19,999 | 15 (2.2%) | 76 (12.1%) |
| $20,000 to $22,499 | 8 (1.2%) | 26 (4.1%) |
| $22,500 to $24,999 | 17 (2.5%) | 26 (4.1%) |
| $25,000 to $29,999 | 79 (11.7%) | 76 (12.1%) |
| $30,000 to $34,999 | 79 (11.7%) | 48 (7.6%) |
| $35,000 to $39,999 | 8 (1.2%) | 50 (8.0%) |
| $40,000 to $44,999 | 41 (6.1%) | 12 (1.9%) |
| $45,000 to $49,999 | 29 (4.3%) | 32 (5.1%) |
| $50,000 to $54,999 | 6 (0.9%) | 27 (4.3%) |
| $55,000 to $64,999 | 68 (10.0%) | 10 (1.6%) |
| $65,000 to $74,999 | 24 (3.5%) | 18 (2.9%) |
| $75,000 to $99,999 | 50 (7.4%) | 7 (1.1%) |
| $100,000+ | 28 (4.1%) | 10 (1.6%) |
| Total | 677 (100.0%) | 628 (100.0%) |
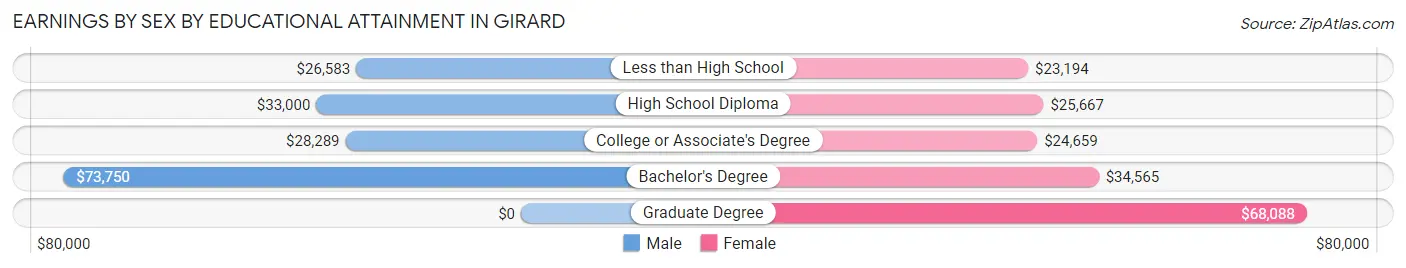
Earnings by Sex by Educational Attainment in Girard
Average earnings in Girard are $33,534 for men and $26,894 for women, a difference of 19.8%. Men with an educational attainment of bachelor's degree enjoy the highest average annual earnings of $73,750, while those with less than high school education earn the least with $26,583. Women with an educational attainment of graduate degree earn the most with the average annual earnings of $68,088, while those with less than high school education have the smallest earnings of $23,194.
| Educational Attainment | Male Income | Female Income |
| Less than High School | $26,583 | $23,194 |
| High School Diploma | $33,000 | $25,667 |
| College or Associate's Degree | $28,289 | $24,659 |
| Bachelor's Degree | $73,750 | $34,565 |
| Graduate Degree | - | - |
| Total | $33,534 | $26,894 |
Family Income in Girard
Family Income Brackets in Girard
According to the Girard family income data, there are 153 families falling into the $25,000 to $34,999 income range, which is the most common income bracket and makes up 26.9% of all families. Conversely, the $200,000+ income bracket is the least frequent group with only 9 families (1.6%) belonging to this category.
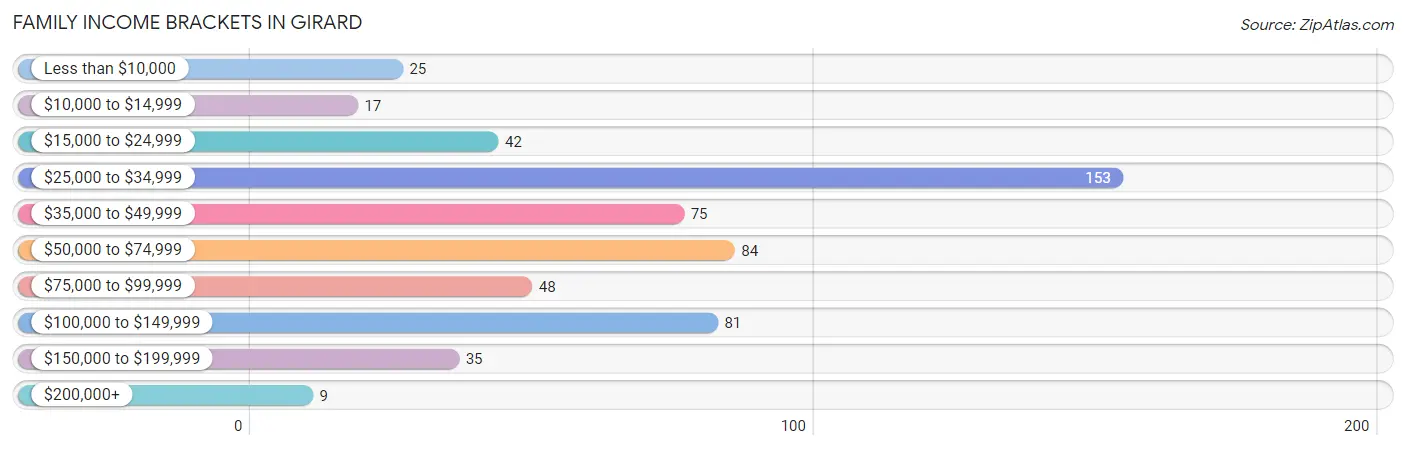
| Income Bracket | # Families | % Families |
| Less than $10,000 | 25 | 4.4% |
| $10,000 to $14,999 | 17 | 3.0% |
| $15,000 to $24,999 | 42 | 7.4% |
| $25,000 to $34,999 | 153 | 26.9% |
| $35,000 to $49,999 | 75 | 13.2% |
| $50,000 to $74,999 | 84 | 14.8% |
| $75,000 to $99,999 | 48 | 8.4% |
| $100,000 to $149,999 | 81 | 14.2% |
| $150,000 to $199,999 | 35 | 6.2% |
| $200,000+ | 9 | 1.6% |
Family Income by Famaliy Size in Girard
5-person families (34 | 6.0%) account for the highest median family income in Girard with $111,500 per family, while 5-person families (34 | 6.0%) have the highest median income of $22,300 per family member.
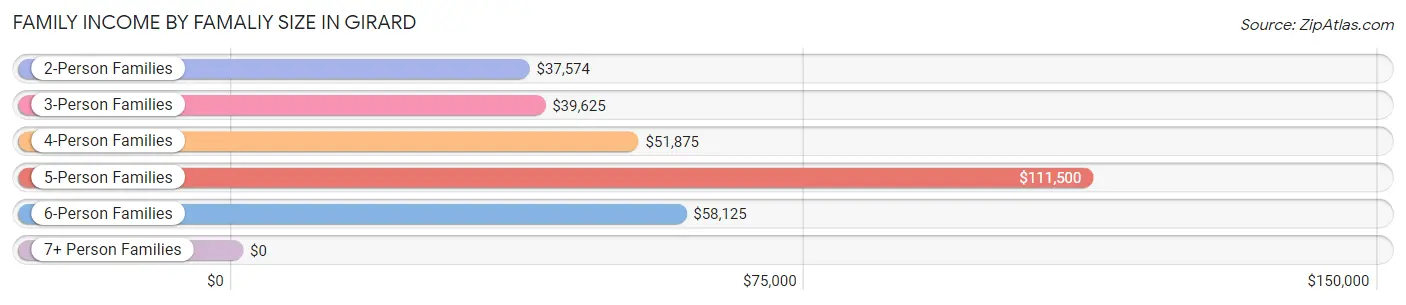
| Income Bracket | # Families | Median Income |
| 2-Person Families | 263 (46.2%) | $37,574 |
| 3-Person Families | 146 (25.7%) | $39,625 |
| 4-Person Families | 108 (19.0%) | $51,875 |
| 5-Person Families | 34 (6.0%) | $111,500 |
| 6-Person Families | 18 (3.2%) | $58,125 |
| 7+ Person Families | 0 (0.0%) | $0 |
| Total | 569 (100.0%) | $41,354 |
Family Income by Number of Earners in Girard
The median family income in Girard is $41,354, with families comprising 3+ earners (66) having the highest median family income of $119,318, while families with 1 earner (230) have the lowest median family income of $29,813, accounting for 11.6% and 40.4% of families, respectively.
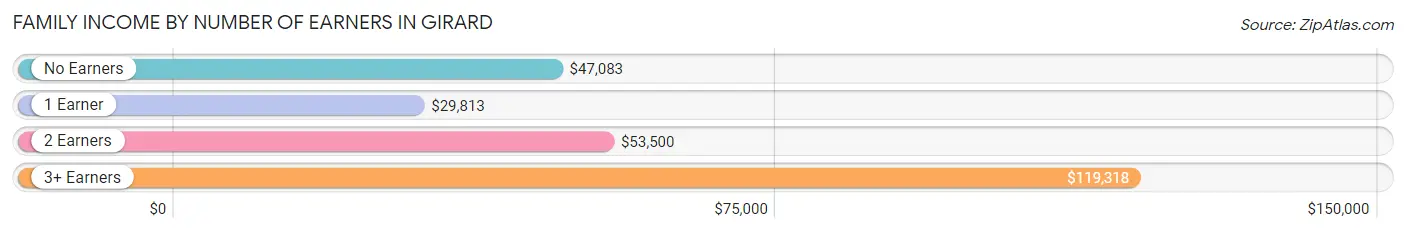
| Number of Earners | # Families | Median Income |
| No Earners | 49 (8.6%) | $47,083 |
| 1 Earner | 230 (40.4%) | $29,813 |
| 2 Earners | 224 (39.4%) | $53,500 |
| 3+ Earners | 66 (11.6%) | $119,318 |
| Total | 569 (100.0%) | $41,354 |
Household Income in Girard
Household Income Brackets in Girard
With 237 households falling in the category, the $25,000 to $34,999 income range is the most frequent in Girard, accounting for 23.1% of all households. In contrast, only 9 households (0.9%) fall into the $200,000+ income bracket, making it the least populous group.
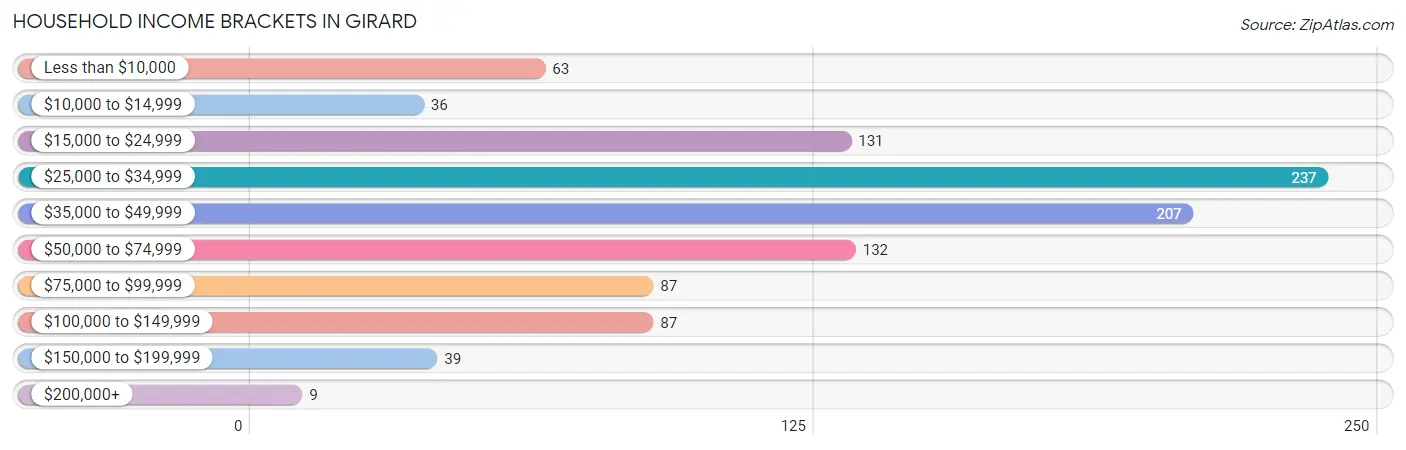
| Income Bracket | # Households | % Households |
| Less than $10,000 | 63 | 6.1% |
| $10,000 to $14,999 | 36 | 3.5% |
| $15,000 to $24,999 | 131 | 12.7% |
| $25,000 to $34,999 | 237 | 23.1% |
| $35,000 to $49,999 | 207 | 20.1% |
| $50,000 to $74,999 | 132 | 12.8% |
| $75,000 to $99,999 | 87 | 8.5% |
| $100,000 to $149,999 | 87 | 8.5% |
| $150,000 to $199,999 | 39 | 3.8% |
| $200,000+ | 9 | 0.9% |
Household Income by Householder Age in Girard
The median household income in Girard is $38,824, with the highest median household income of $47,321 found in the 45 to 64 years age bracket for the primary householder. A total of 317 households (30.8%) fall into this category. Meanwhile, the 65+ years age bracket for the primary householder has the lowest median household income of $29,244, with 336 households (32.7%) in this group.
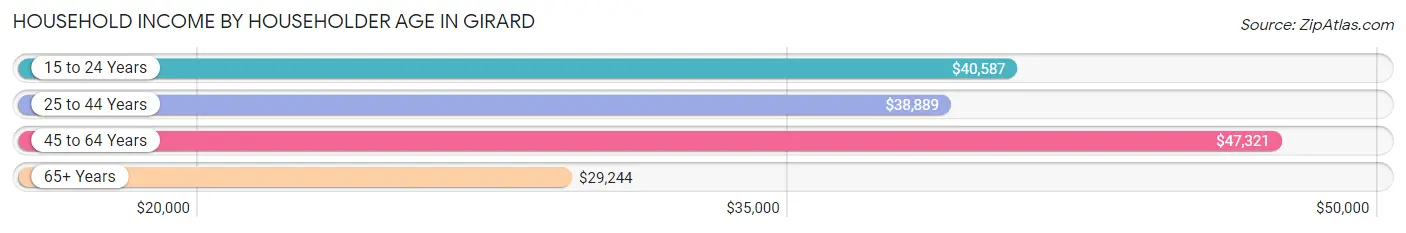
| Income Bracket | # Households | Median Income |
| 15 to 24 Years | 99 (9.6%) | $40,587 |
| 25 to 44 Years | 276 (26.9%) | $38,889 |
| 45 to 64 Years | 317 (30.8%) | $47,321 |
| 65+ Years | 336 (32.7%) | $29,244 |
| Total | 1,028 (100.0%) | $38,824 |
Poverty in Girard
Income Below Poverty by Sex and Age in Girard
With 11.6% poverty level for males and 21.5% for females among the residents of Girard, under 5 year old males and 5 year old females are the most vulnerable to poverty, with 29 males (100.0%) and 13 females (61.9%) in their respective age groups living below the poverty level.
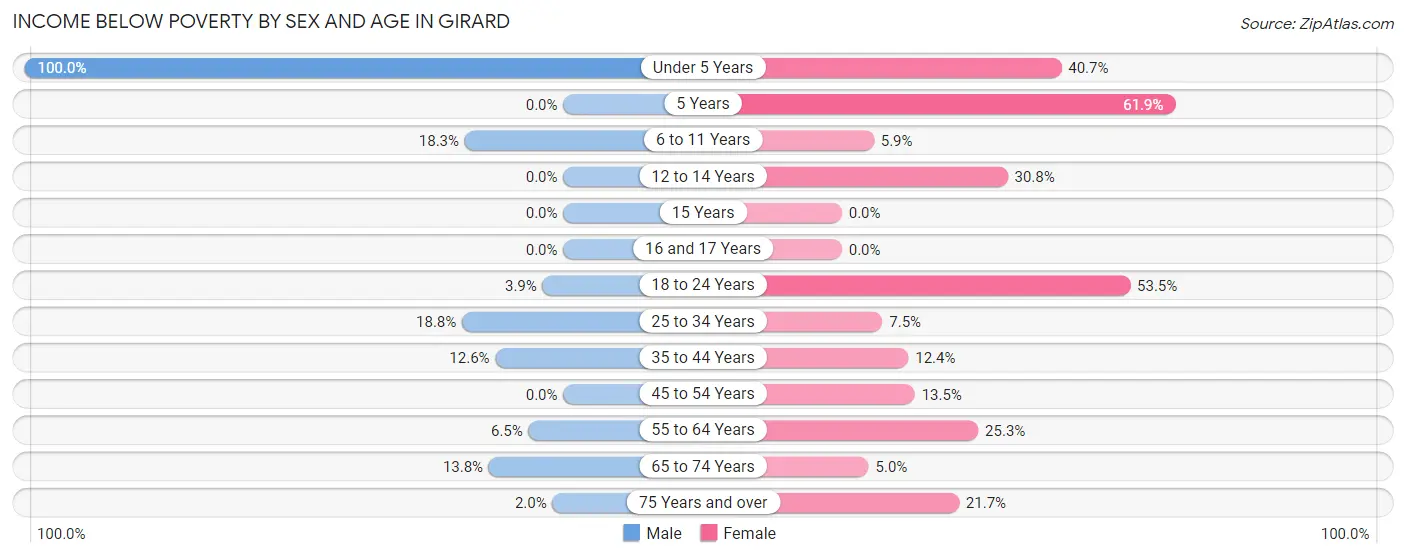
| Age Bracket | Male | Female |
| Under 5 Years | 29 (100.0%) | 33 (40.7%) |
| 5 Years | 0 (0.0%) | 13 (61.9%) |
| 6 to 11 Years | 17 (18.3%) | 6 (5.9%) |
| 12 to 14 Years | 0 (0.0%) | 16 (30.8%) |
| 15 Years | 0 (0.0%) | 0 (0.0%) |
| 16 and 17 Years | 0 (0.0%) | 0 (0.0%) |
| 18 to 24 Years | 8 (3.8%) | 99 (53.5%) |
| 25 to 34 Years | 31 (18.8%) | 7 (7.5%) |
| 35 to 44 Years | 14 (12.6%) | 20 (12.3%) |
| 45 to 54 Years | 0 (0.0%) | 18 (13.5%) |
| 55 to 64 Years | 8 (6.5%) | 41 (25.3%) |
| 65 to 74 Years | 29 (13.8%) | 9 (5.0%) |
| 75 Years and over | 1 (2.0%) | 20 (21.7%) |
| Total | 137 (11.6%) | 282 (21.5%) |
Income Above Poverty by Sex and Age in Girard
According to the poverty statistics in Girard, males aged 5 years and females aged 15 years are the age groups that are most secure financially, with 100.0% of males and 100.0% of females in these age groups living above the poverty line.
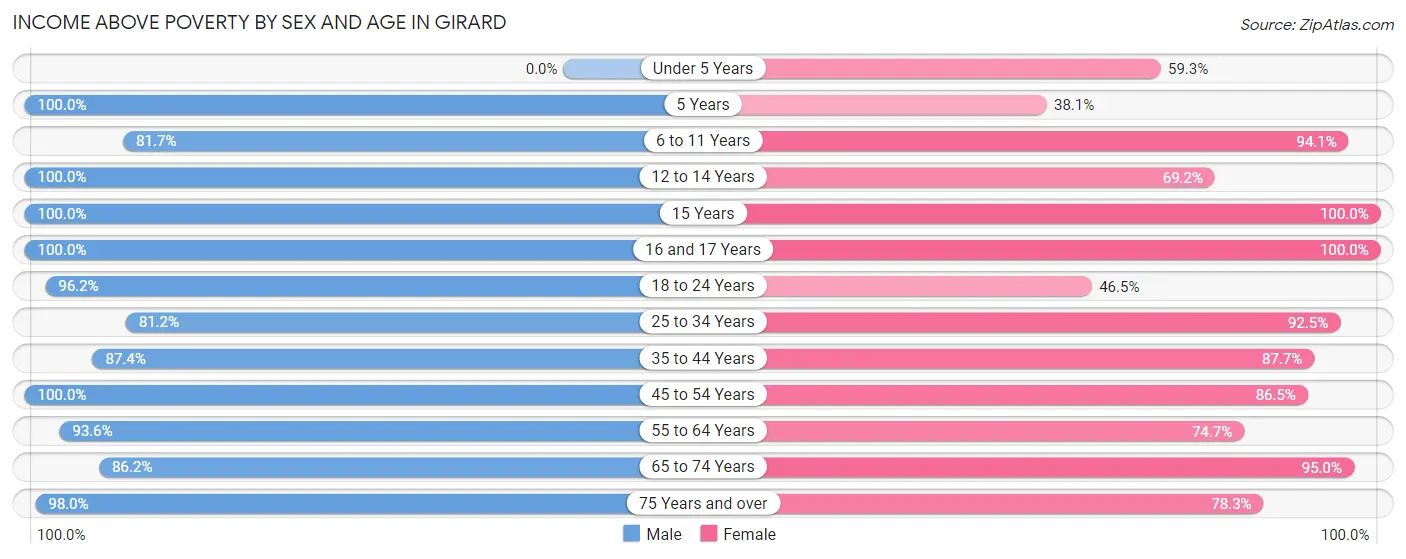
| Age Bracket | Male | Female |
| Under 5 Years | 0 (0.0%) | 48 (59.3%) |
| 5 Years | 5 (100.0%) | 8 (38.1%) |
| 6 to 11 Years | 76 (81.7%) | 95 (94.1%) |
| 12 to 14 Years | 12 (100.0%) | 36 (69.2%) |
| 15 Years | 22 (100.0%) | 18 (100.0%) |
| 16 and 17 Years | 44 (100.0%) | 33 (100.0%) |
| 18 to 24 Years | 200 (96.2%) | 86 (46.5%) |
| 25 to 34 Years | 134 (81.2%) | 86 (92.5%) |
| 35 to 44 Years | 97 (87.4%) | 142 (87.6%) |
| 45 to 54 Years | 107 (100.0%) | 115 (86.5%) |
| 55 to 64 Years | 116 (93.5%) | 121 (74.7%) |
| 65 to 74 Years | 181 (86.2%) | 172 (95.0%) |
| 75 Years and over | 49 (98.0%) | 72 (78.3%) |
| Total | 1,043 (88.4%) | 1,032 (78.5%) |
Income Below Poverty Among Married-Couple Families in Girard
The poverty statistics for married-couple families in Girard show that 8.1% or 25 of the total 308 families live below the poverty line. Families with 1 or 2 children have the highest poverty rate of 18.5%, comprising of 25 families. On the other hand, families with no children have the lowest poverty rate of 0.0%, which includes 0 families.
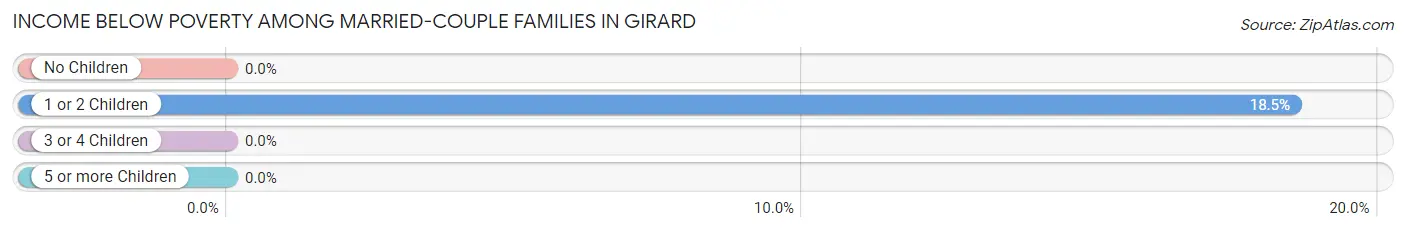
| Children | Above Poverty | Below Poverty |
| No Children | 144 (100.0%) | 0 (0.0%) |
| 1 or 2 Children | 110 (81.5%) | 25 (18.5%) |
| 3 or 4 Children | 29 (100.0%) | 0 (0.0%) |
| 5 or more Children | 0 (0.0%) | 0 (0.0%) |
| Total | 283 (91.9%) | 25 (8.1%) |
Income Below Poverty Among Single-Parent Households in Girard
According to the poverty data in Girard, 18.2% or 10 single-father households and 20.4% or 42 single-mother households are living below the poverty line. Among single-father households, those with 1 or 2 children have the highest poverty rate, with 10 households (71.4%) experiencing poverty. Likewise, among single-mother households, those with 3 or 4 children have the highest poverty rate, with 6 households (100.0%) falling below the poverty line.
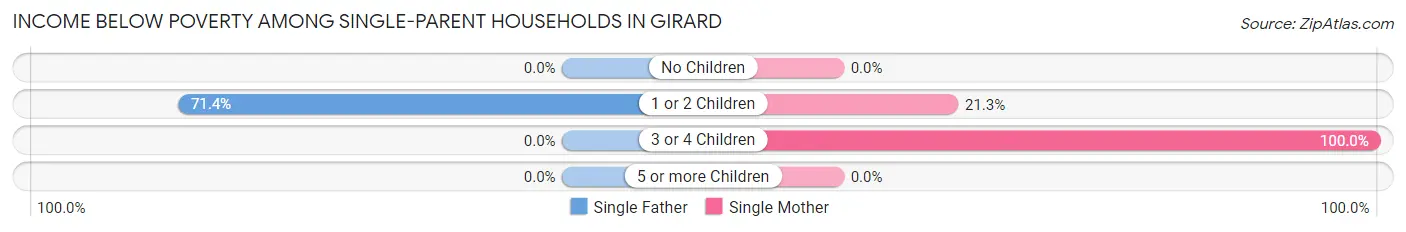
| Children | Single Father | Single Mother |
| No Children | 0 (0.0%) | 0 (0.0%) |
| 1 or 2 Children | 10 (71.4%) | 36 (21.3%) |
| 3 or 4 Children | 0 (0.0%) | 6 (100.0%) |
| 5 or more Children | 0 (0.0%) | 0 (0.0%) |
| Total | 10 (18.2%) | 42 (20.4%) |
Income Below Poverty Among Married-Couple vs Single-Parent Households in Girard
The poverty data for Girard shows that 25 of the married-couple family households (8.1%) and 52 of the single-parent households (19.9%) are living below the poverty level. Within the married-couple family households, those with 1 or 2 children have the highest poverty rate, with 25 households (18.5%) falling below the poverty line. Among the single-parent households, those with 3 or 4 children have the highest poverty rate, with 6 household (100.0%) living below poverty.
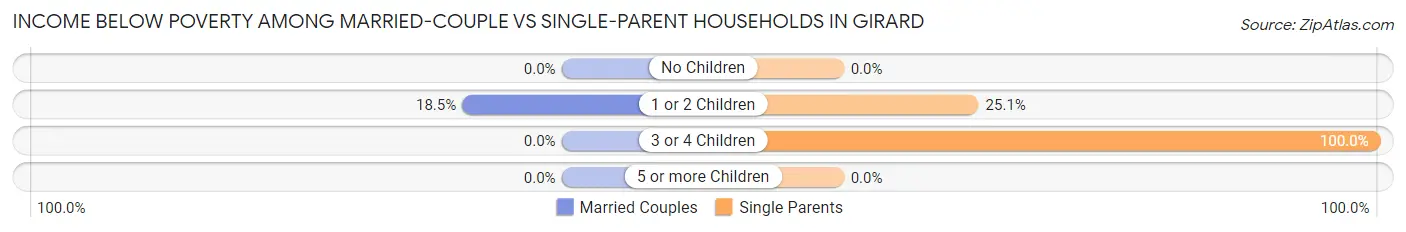
| Children | Married-Couple Families | Single-Parent Households |
| No Children | 0 (0.0%) | 0 (0.0%) |
| 1 or 2 Children | 25 (18.5%) | 46 (25.1%) |
| 3 or 4 Children | 0 (0.0%) | 6 (100.0%) |
| 5 or more Children | 0 (0.0%) | 0 (0.0%) |
| Total | 25 (8.1%) | 52 (19.9%) |
Race in Girard
The most populous races in Girard are White / Caucasian (2,493 | 94.5%), Two or more Races (94 | 3.6%), and Hispanic or Latino (72 | 2.7%).
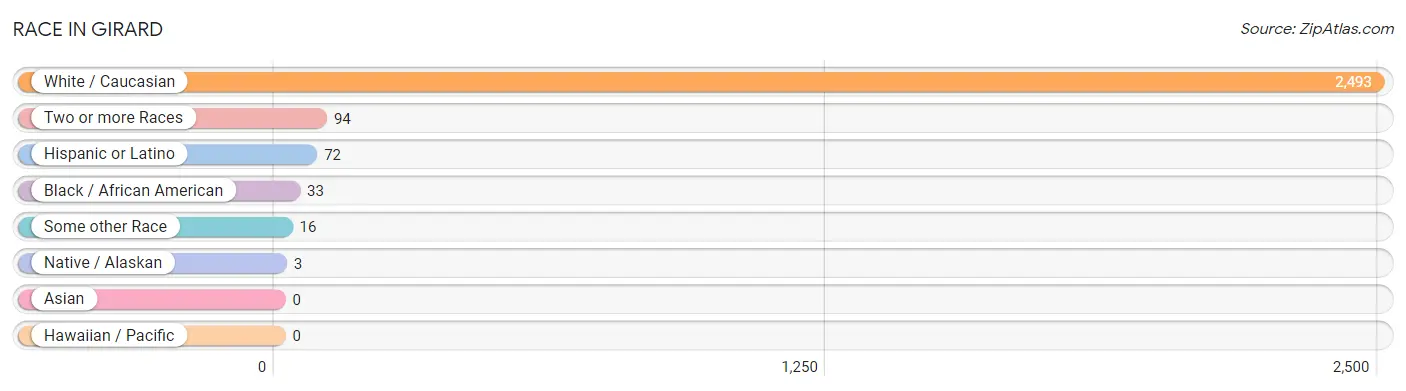
| Race | # Population | % Population |
| Asian | 0 | 0.0% |
| Black / African American | 33 | 1.3% |
| Hawaiian / Pacific | 0 | 0.0% |
| Hispanic or Latino | 72 | 2.7% |
| Native / Alaskan | 3 | 0.1% |
| White / Caucasian | 2,493 | 94.5% |
| Two or more Races | 94 | 3.6% |
| Some other Race | 16 | 0.6% |
| Total | 2,639 | 100.0% |
Ancestry in Girard
The most populous ancestries reported in Girard are German (540 | 20.5%), English (434 | 16.5%), Irish (402 | 15.2%), American (372 | 14.1%), and French (160 | 6.1%), together accounting for 72.3% of all Girard residents.
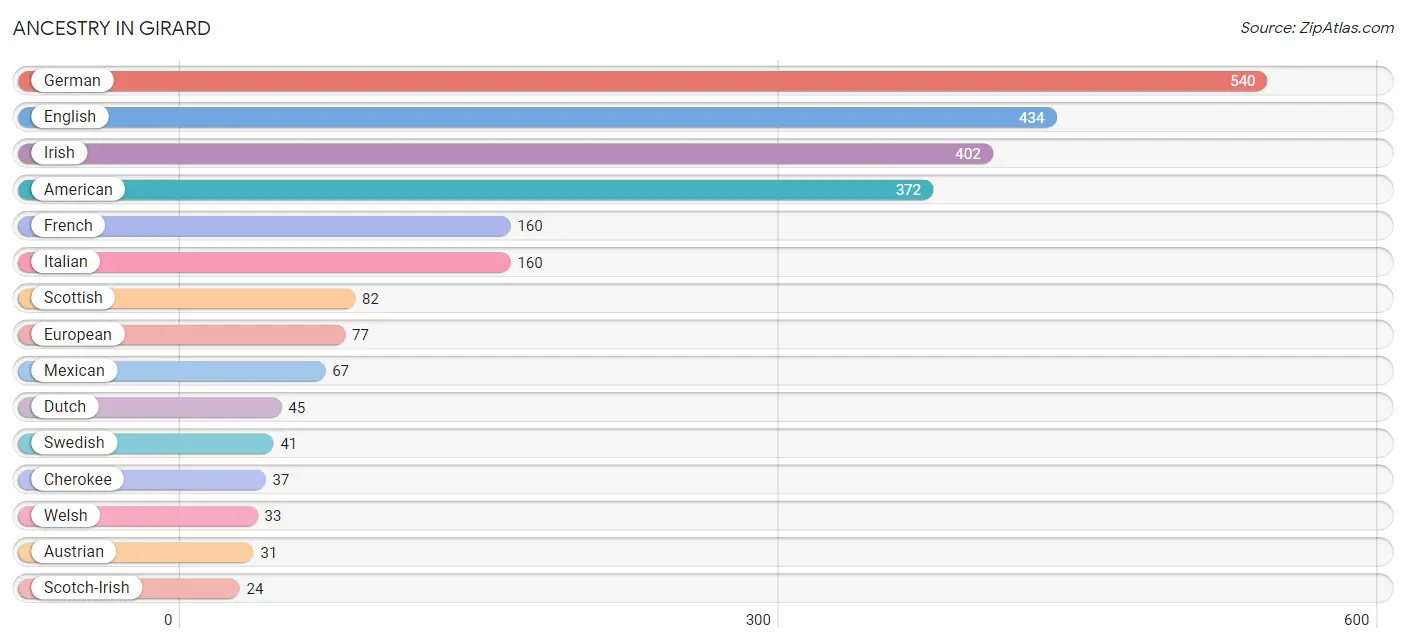
| Ancestry | # Population | % Population |
| American | 372 | 14.1% |
| Arab | 11 | 0.4% |
| Austrian | 31 | 1.2% |
| British | 16 | 0.6% |
| Celtic | 6 | 0.2% |
| Central American | 5 | 0.2% |
| Cherokee | 37 | 1.4% |
| Chickasaw | 14 | 0.5% |
| Choctaw | 4 | 0.2% |
| Czech | 5 | 0.2% |
| Czechoslovakian | 22 | 0.8% |
| Dutch | 45 | 1.7% |
| English | 434 | 16.5% |
| European | 77 | 2.9% |
| Filipino | 17 | 0.6% |
| French | 160 | 6.1% |
| German | 540 | 20.5% |
| Guatemalan | 5 | 0.2% |
| Irish | 402 | 15.2% |
| Italian | 160 | 6.1% |
| Lebanese | 11 | 0.4% |
| Mexican | 67 | 2.5% |
| Osage | 2 | 0.1% |
| Polish | 8 | 0.3% |
| Portuguese | 12 | 0.4% |
| Scandinavian | 18 | 0.7% |
| Scotch-Irish | 24 | 0.9% |
| Scottish | 82 | 3.1% |
| Swedish | 41 | 1.5% |
| Thai | 16 | 0.6% |
| Welsh | 33 | 1.3% |
| West Indian | 4 | 0.2% | View All 32 Rows |
Immigrants in Girard
The most numerous immigrant groups reported in Girard came from Central America (5 | 0.2%), Guatemala (5 | 0.2%), and Latin America (5 | 0.2%), together accounting for 0.6% of all Girard residents.
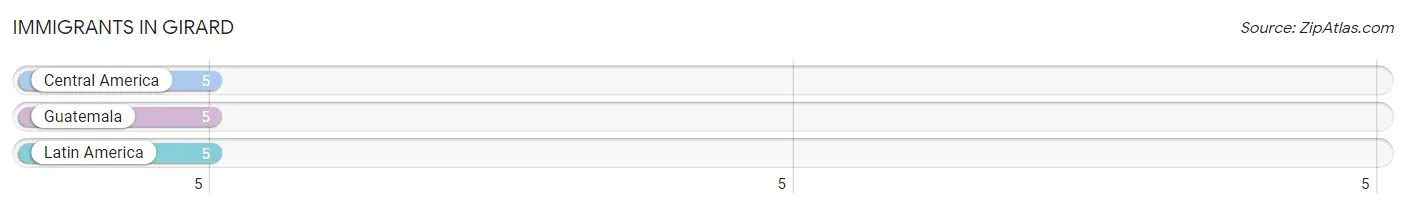
| Immigration Origin | # Population | % Population |
| Central America | 5 | 0.2% |
| Guatemala | 5 | 0.2% |
| Latin America | 5 | 0.2% | View All 3 Rows |
Sex and Age in Girard
Sex and Age in Girard
The most populous age groups in Girard are 20 to 24 Years (212 | 16.6%) for men and 20 to 24 Years (133 | 9.8%) for women.
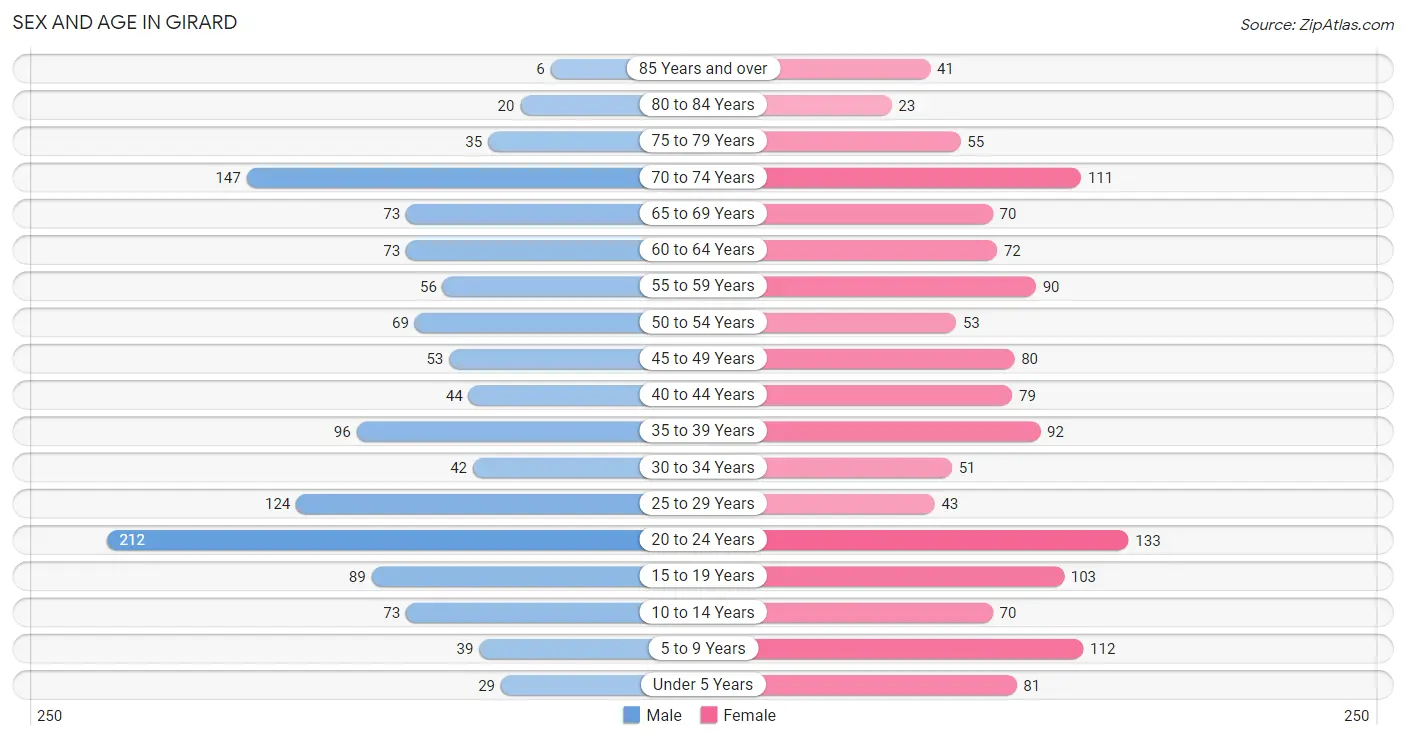
| Age Bracket | Male | Female |
| Under 5 Years | 29 (2.3%) | 81 (6.0%) |
| 5 to 9 Years | 39 (3.0%) | 112 (8.2%) |
| 10 to 14 Years | 73 (5.7%) | 70 (5.1%) |
| 15 to 19 Years | 89 (7.0%) | 103 (7.6%) |
| 20 to 24 Years | 212 (16.6%) | 133 (9.8%) |
| 25 to 29 Years | 124 (9.7%) | 43 (3.2%) |
| 30 to 34 Years | 42 (3.3%) | 51 (3.7%) |
| 35 to 39 Years | 96 (7.5%) | 92 (6.8%) |
| 40 to 44 Years | 44 (3.4%) | 79 (5.8%) |
| 45 to 49 Years | 53 (4.1%) | 80 (5.9%) |
| 50 to 54 Years | 69 (5.4%) | 53 (3.9%) |
| 55 to 59 Years | 56 (4.4%) | 90 (6.6%) |
| 60 to 64 Years | 73 (5.7%) | 72 (5.3%) |
| 65 to 69 Years | 73 (5.7%) | 70 (5.1%) |
| 70 to 74 Years | 147 (11.5%) | 111 (8.2%) |
| 75 to 79 Years | 35 (2.7%) | 55 (4.1%) |
| 80 to 84 Years | 20 (1.6%) | 23 (1.7%) |
| 85 Years and over | 6 (0.5%) | 41 (3.0%) |
| Total | 1,280 (100.0%) | 1,359 (100.0%) |
Families and Households in Girard
Median Family Size in Girard
The median family size in Girard is 3.26 persons per family, with married-couple families (308 | 54.1%) accounting for the largest median family size of 3.65 persons per family. On the other hand, single female/mother families (206 | 36.2%) represent the smallest median family size with 2.68 persons per family.
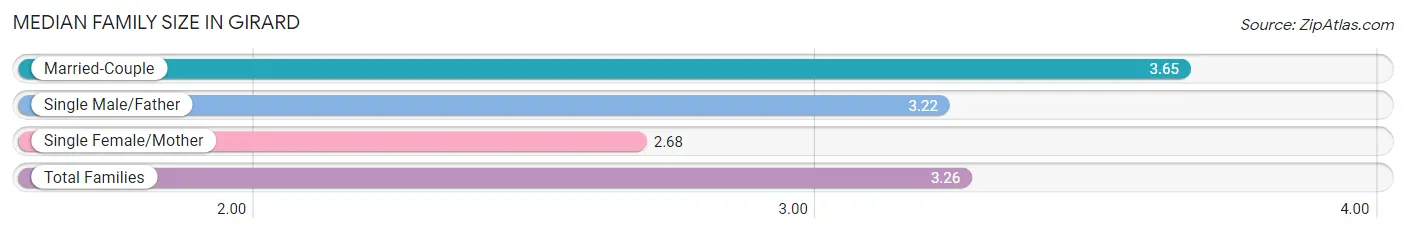
| Family Type | # Families | Family Size |
| Married-Couple | 308 (54.1%) | 3.65 |
| Single Male/Father | 55 (9.7%) | 3.22 |
| Single Female/Mother | 206 (36.2%) | 2.68 |
| Total Families | 569 (100.0%) | 3.26 |
Median Household Size in Girard
The median household size in Girard is 2.42 persons per household, with married-couple households (308 | 30.0%) accounting for the largest median household size of 3.7 persons per household. non-family households (459 | 44.7%) represent the smallest median household size with 1.18 persons per household.
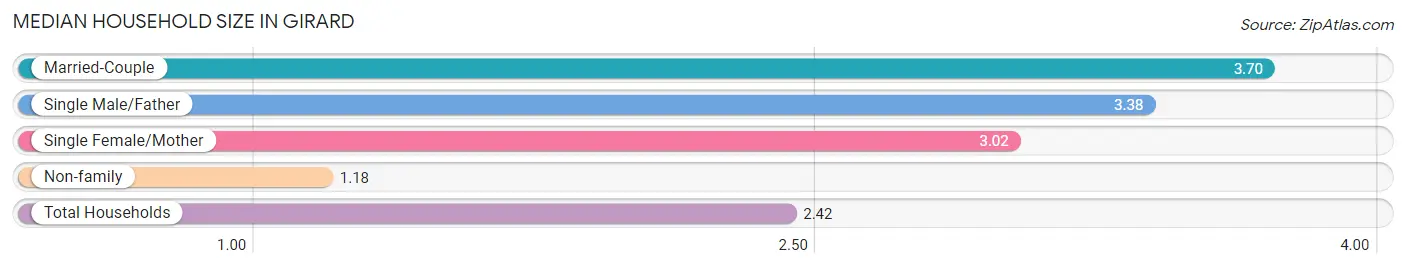
| Household Type | # Households | Household Size |
| Married-Couple | 308 (30.0%) | 3.70 |
| Single Male/Father | 55 (5.3%) | 3.38 |
| Single Female/Mother | 206 (20.0%) | 3.02 |
| Non-family | 459 (44.7%) | 1.18 |
| Total Households | 1,028 (100.0%) | 2.42 |
Household Size by Marriage Status in Girard
Out of a total of 1,028 households in Girard, 569 (55.3%) are family households, while 459 (44.7%) are nonfamily households. The most numerous type of family households are 2-person households, comprising 234, and the most common type of nonfamily households are 1-person households, comprising 395.
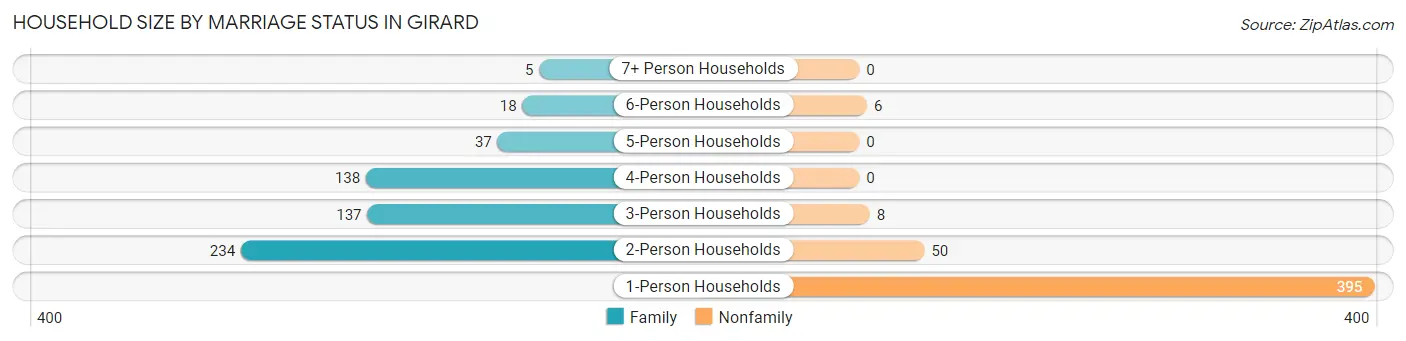
| Household Size | Family Households | Nonfamily Households |
| 1-Person Households | - | 395 (38.4%) |
| 2-Person Households | 234 (22.8%) | 50 (4.9%) |
| 3-Person Households | 137 (13.3%) | 8 (0.8%) |
| 4-Person Households | 138 (13.4%) | 0 (0.0%) |
| 5-Person Households | 37 (3.6%) | 0 (0.0%) |
| 6-Person Households | 18 (1.8%) | 6 (0.6%) |
| 7+ Person Households | 5 (0.5%) | 0 (0.0%) |
| Total | 569 (55.3%) | 459 (44.7%) |
Female Fertility in Girard
Fertility by Age in Girard
Average fertility rate in Girard is 95.0 births per 1,000 women. Women in the age bracket of 20 to 34 years have the highest fertility rate with 251.0 births per 1,000 women. Women in the age bracket of 20 to 34 years acount for 100.0% of all women with births.
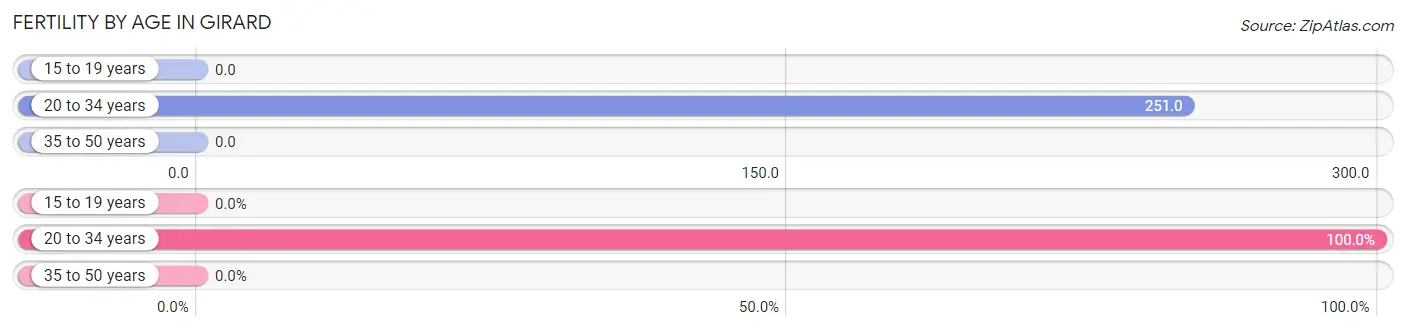
| Age Bracket | Women with Births | Births / 1,000 Women |
| 15 to 19 years | 0 (0.0%) | 0.0 |
| 20 to 34 years | 57 (100.0%) | 251.0 |
| 35 to 50 years | 0 (0.0%) | 0.0 |
| Total | 57 (100.0%) | 95.0 |
Fertility by Age by Marriage Status in Girard
7.0% of women with births (57) in Girard are married. The highest percentage of unmarried women with births falls into 20 to 34 years age bracket with 93.0% of them unmarried at the time of birth, while the lowest percentage of unmarried women with births belong to 20 to 34 years age bracket with 93.0% of them unmarried.
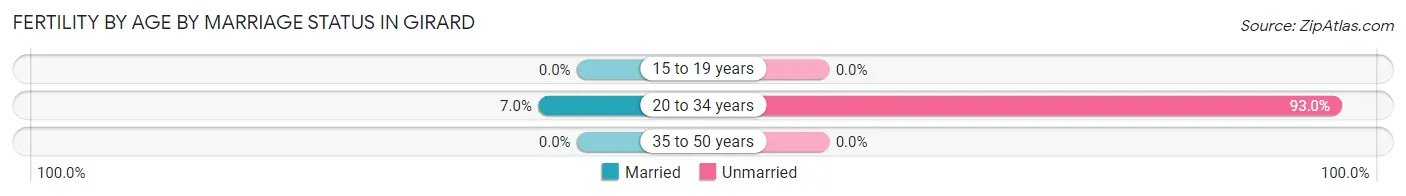
| Age Bracket | Married | Unmarried |
| 15 to 19 years | 0 (0.0%) | 0 (0.0%) |
| 20 to 34 years | 4 (7.0%) | 53 (93.0%) |
| 35 to 50 years | 0 (0.0%) | 0 (0.0%) |
| Total | 4 (7.0%) | 53 (93.0%) |
Fertility by Education in Girard
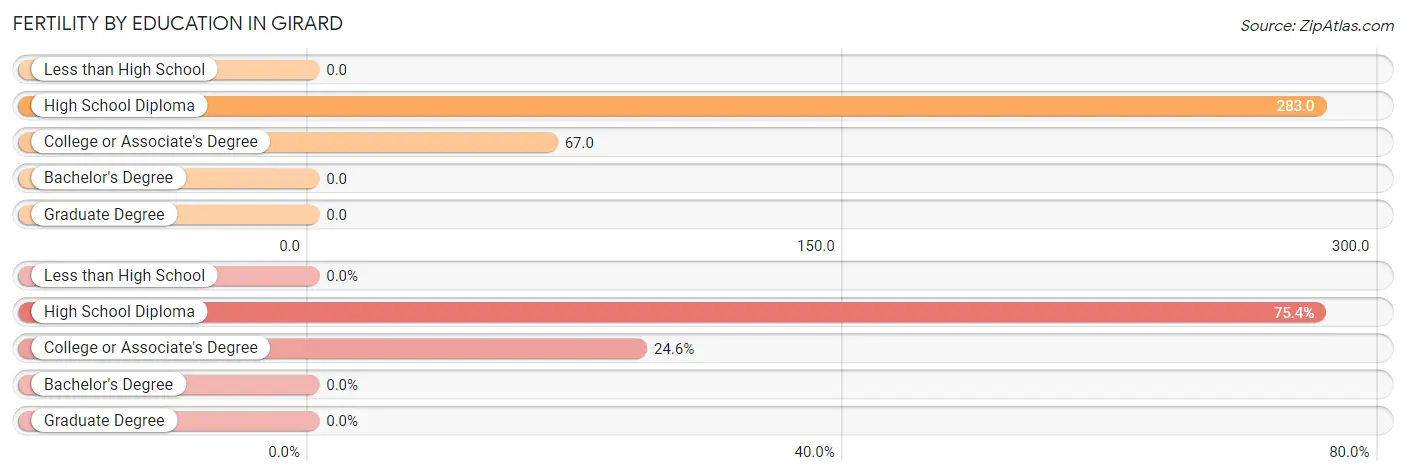
| Educational Attainment | Women with Births | Births / 1,000 Women |
| Less than High School | 0 (0.0%) | 0.0 |
| High School Diploma | 43 (75.4%) | 283.0 |
| College or Associate's Degree | 14 (24.6%) | 67.0 |
| Bachelor's Degree | 0 (0.0%) | 0.0 |
| Graduate Degree | 0 (0.0%) | 0.0 |
| Total | 57 (100.0%) | 95.0 |
Fertility by Education by Marriage Status in Girard
93.0% of women with births in Girard are unmarried. Women with the educational attainment of high school diploma are most likely to be married with 9.3% of them married at childbirth, while women with the educational attainment of college or associate's degree are least likely to be married with 100.0% of them unmarried at childbirth.
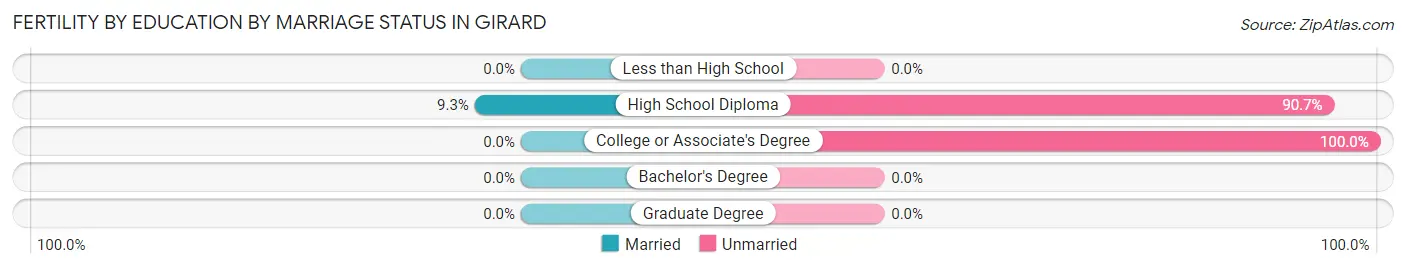
| Educational Attainment | Married | Unmarried |
| Less than High School | 0 (0.0%) | 0 (0.0%) |
| High School Diploma | 4 (9.3%) | 39 (90.7%) |
| College or Associate's Degree | 0 (0.0%) | 14 (100.0%) |
| Bachelor's Degree | 0 (0.0%) | 0 (0.0%) |
| Graduate Degree | 0 (0.0%) | 0 (0.0%) |
| Total | 4 (7.0%) | 53 (93.0%) |
Employment Characteristics in Girard
Employment by Class of Employer in Girard
Among the 1,195 employed individuals in Girard, private company employees (784 | 65.6%), local government employees (119 | 10.0%), and not-for-profit organizations (98 | 8.2%) make up the most common classes of employment.
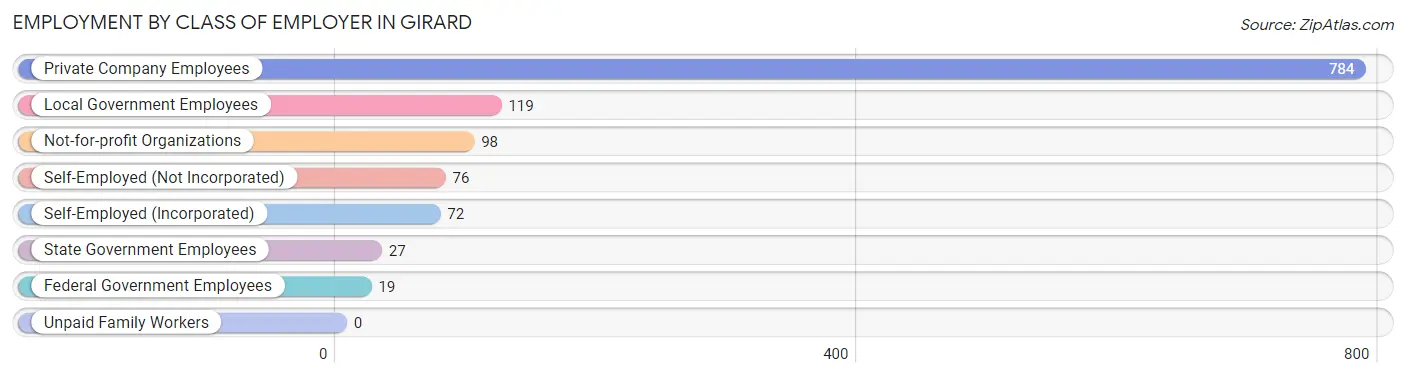
| Employer Class | # Employees | % Employees |
| Private Company Employees | 784 | 65.6% |
| Self-Employed (Incorporated) | 72 | 6.0% |
| Self-Employed (Not Incorporated) | 76 | 6.4% |
| Not-for-profit Organizations | 98 | 8.2% |
| Local Government Employees | 119 | 10.0% |
| State Government Employees | 27 | 2.3% |
| Federal Government Employees | 19 | 1.6% |
| Unpaid Family Workers | 0 | 0.0% |
| Total | 1,195 | 100.0% |
Employment Status by Age in Girard
According to the labor force statistics for Girard, out of the total population over 16 years of age (2,193), 56.9% or 1,248 individuals are in the labor force, with 3.8% or 47 of them unemployed. The age group with the highest labor force participation rate is 25 to 29 years, with 91.6% or 153 individuals in the labor force. Within the labor force, the 35 to 44 years age range has the highest percentage of unemployed individuals, with 11.7% or 29 of them being unemployed.
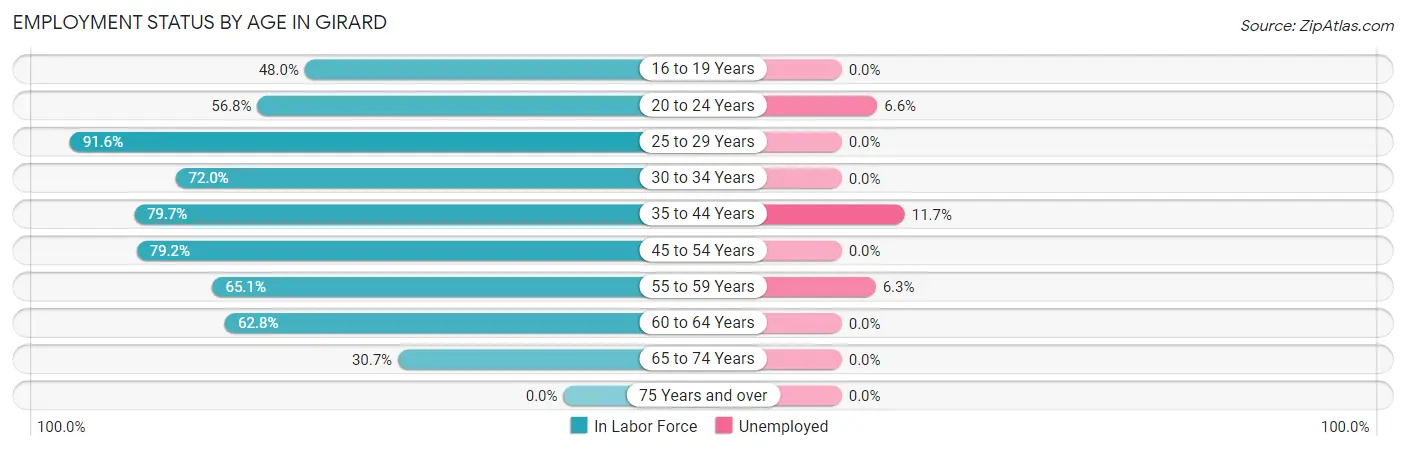
| Age Bracket | In Labor Force | Unemployed |
| 16 to 19 Years | 72 (48.0%) | 0 (0.0%) |
| 20 to 24 Years | 196 (56.8%) | 13 (6.6%) |
| 25 to 29 Years | 153 (91.6%) | 0 (0.0%) |
| 30 to 34 Years | 67 (72.0%) | 0 (0.0%) |
| 35 to 44 Years | 248 (79.7%) | 29 (11.7%) |
| 45 to 54 Years | 202 (79.2%) | 0 (0.0%) |
| 55 to 59 Years | 95 (65.1%) | 6 (6.3%) |
| 60 to 64 Years | 91 (62.8%) | 0 (0.0%) |
| 65 to 74 Years | 123 (30.7%) | 0 (0.0%) |
| 75 Years and over | 0 (0.0%) | 0 (0.0%) |
| Total | 1,248 (56.9%) | 47 (3.8%) |
Employment Status by Educational Attainment in Girard
According to labor force statistics for Girard, 76.6% of individuals (856) out of the total population between 25 and 64 years of age (1,117) are in the labor force, with 4.1% or 35 of them being unemployed. The group with the highest labor force participation rate are those with the educational attainment of bachelor's degree or higher, with 89.0% or 210 individuals in the labor force. Within the labor force, individuals with college / associate degree education have the highest percentage of unemployment, with 7.4% or 29 of them being unemployed.
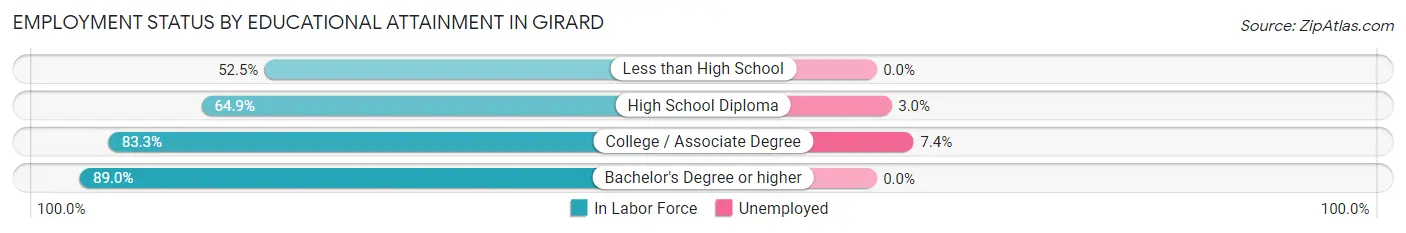
| Educational Attainment | In Labor Force | Unemployed |
| Less than High School | 53 (52.5%) | 0 (0.0%) |
| High School Diploma | 200 (64.9%) | 9 (3.0%) |
| College / Associate Degree | 393 (83.3%) | 35 (7.4%) |
| Bachelor's Degree or higher | 210 (89.0%) | 0 (0.0%) |
| Total | 856 (76.6%) | 46 (4.1%) |
Employment Occupations by Sex in Girard
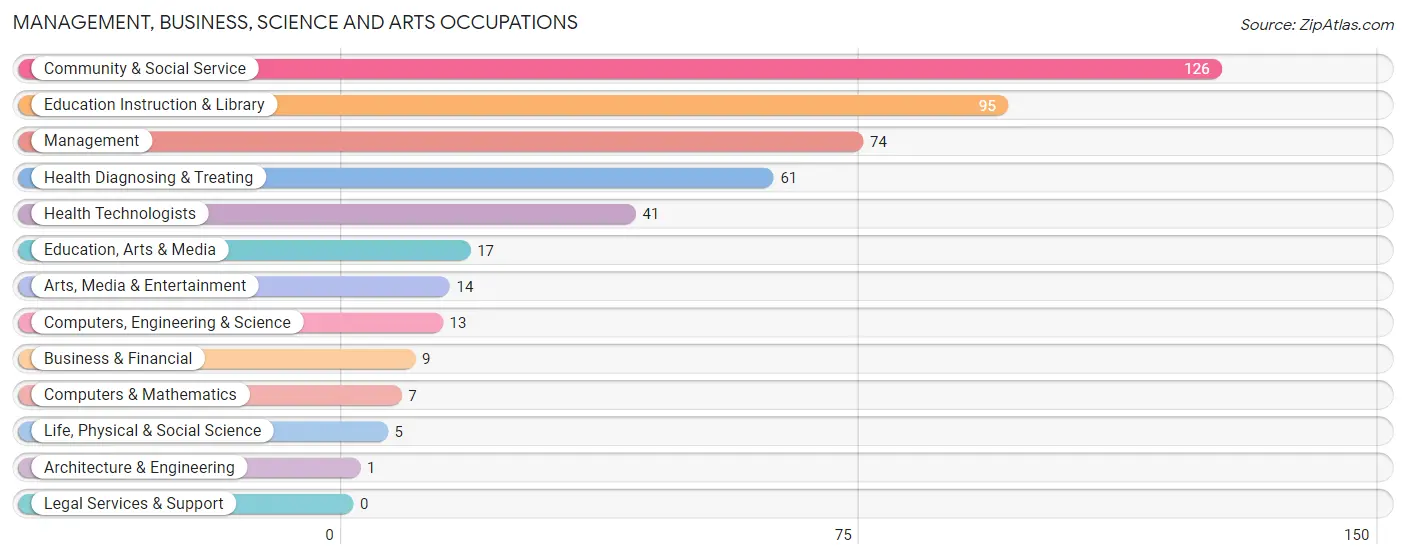
Management, Business, Science and Arts Occupations
The most common Management, Business, Science and Arts occupations in Girard are Community & Social Service (126 | 10.5%), Education Instruction & Library (95 | 7.9%), Management (74 | 6.2%), Health Diagnosing & Treating (61 | 5.1%), and Health Technologists (41 | 3.4%).
Management, Business, Science and Arts Occupations by Sex
Within the Management, Business, Science and Arts occupations in Girard, the most male-oriented occupations are Architecture & Engineering (100.0%), Life, Physical & Social Science (100.0%), and Arts, Media & Entertainment (100.0%), while the most female-oriented occupations are Business & Financial (100.0%), Computers & Mathematics (100.0%), and Health Technologists (82.9%).
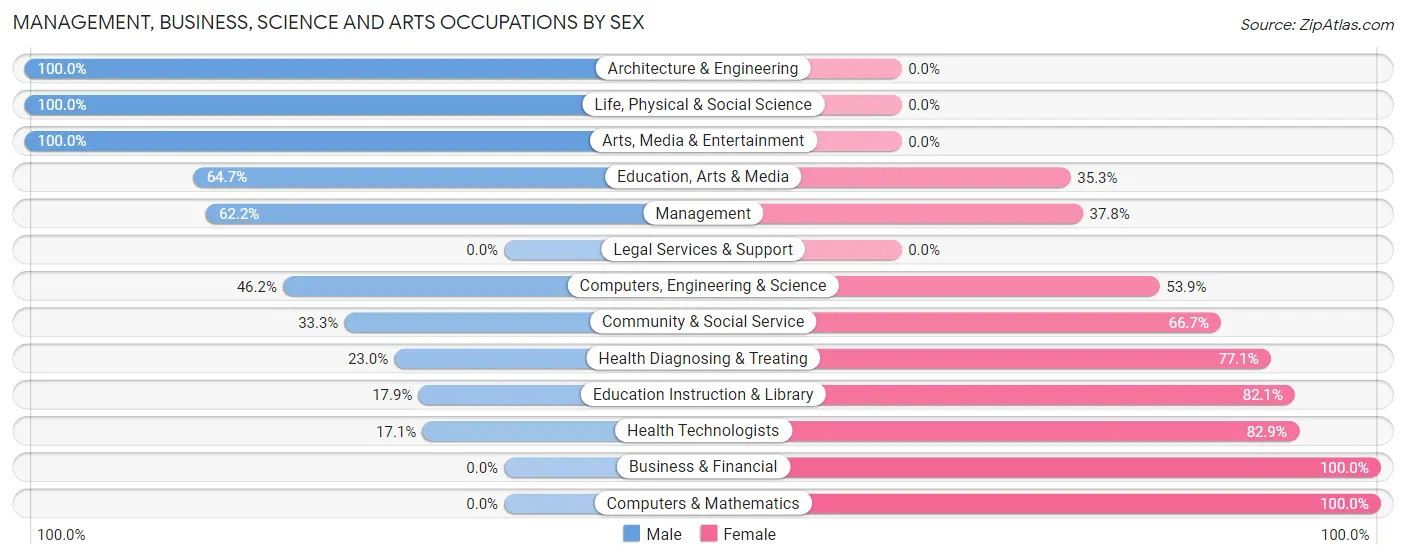
| Occupation | Male | Female |
| Management | 46 (62.2%) | 28 (37.8%) |
| Business & Financial | 0 (0.0%) | 9 (100.0%) |
| Computers, Engineering & Science | 6 (46.2%) | 7 (53.8%) |
| Computers & Mathematics | 0 (0.0%) | 7 (100.0%) |
| Architecture & Engineering | 1 (100.0%) | 0 (0.0%) |
| Life, Physical & Social Science | 5 (100.0%) | 0 (0.0%) |
| Community & Social Service | 42 (33.3%) | 84 (66.7%) |
| Education, Arts & Media | 11 (64.7%) | 6 (35.3%) |
| Legal Services & Support | 0 (0.0%) | 0 (0.0%) |
| Education Instruction & Library | 17 (17.9%) | 78 (82.1%) |
| Arts, Media & Entertainment | 14 (100.0%) | 0 (0.0%) |
| Health Diagnosing & Treating | 14 (23.0%) | 47 (77.0%) |
| Health Technologists | 7 (17.1%) | 34 (82.9%) |
| Total (Category) | 108 (38.2%) | 175 (61.8%) |
| Total (Overall) | 619 (51.6%) | 580 (48.4%) |
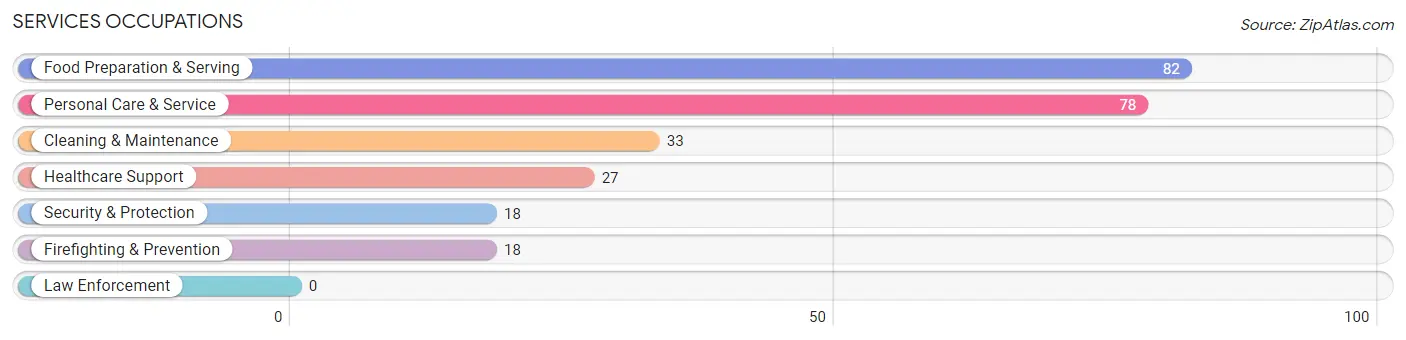
Services Occupations
The most common Services occupations in Girard are Food Preparation & Serving (82 | 6.8%), Personal Care & Service (78 | 6.5%), Cleaning & Maintenance (33 | 2.8%), Healthcare Support (27 | 2.2%), and Security & Protection (18 | 1.5%).
Services Occupations by Sex
Within the Services occupations in Girard, the most male-oriented occupations are Security & Protection (100.0%), Firefighting & Prevention (100.0%), and Cleaning & Maintenance (51.5%), while the most female-oriented occupations are Healthcare Support (100.0%), Personal Care & Service (100.0%), and Food Preparation & Serving (90.2%).
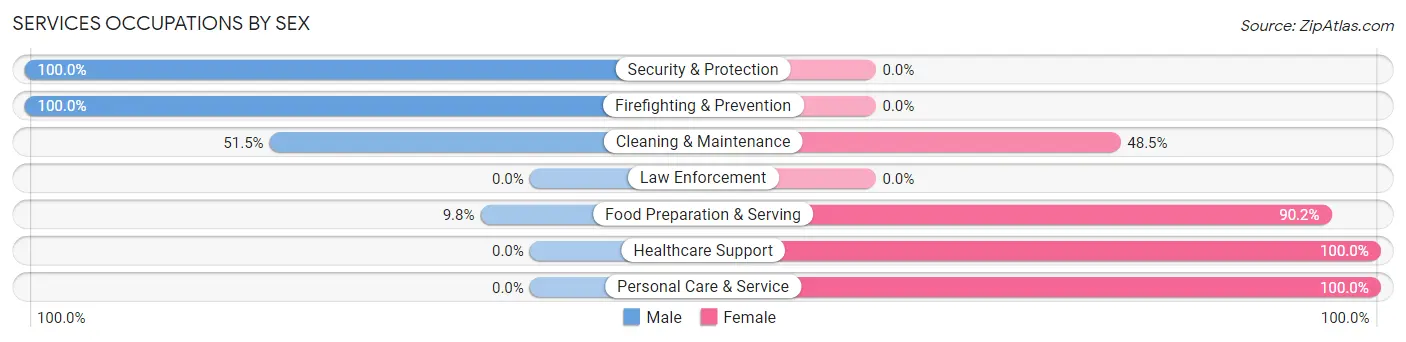
| Occupation | Male | Female |
| Healthcare Support | 0 (0.0%) | 27 (100.0%) |
| Security & Protection | 18 (100.0%) | 0 (0.0%) |
| Firefighting & Prevention | 18 (100.0%) | 0 (0.0%) |
| Law Enforcement | 0 (0.0%) | 0 (0.0%) |
| Food Preparation & Serving | 8 (9.8%) | 74 (90.2%) |
| Cleaning & Maintenance | 17 (51.5%) | 16 (48.5%) |
| Personal Care & Service | 0 (0.0%) | 78 (100.0%) |
| Total (Category) | 43 (18.1%) | 195 (81.9%) |
| Total (Overall) | 619 (51.6%) | 580 (48.4%) |
Sales and Office Occupations
The most common Sales and Office occupations in Girard are Office & Administration (164 | 13.7%), and Sales & Related (122 | 10.2%).
Sales and Office Occupations by Sex
| Occupation | Male | Female |
| Sales & Related | 49 (40.2%) | 73 (59.8%) |
| Office & Administration | 80 (48.8%) | 84 (51.2%) |
| Total (Category) | 129 (45.1%) | 157 (54.9%) |
| Total (Overall) | 619 (51.6%) | 580 (48.4%) |
Natural Resources, Construction and Maintenance Occupations
The most common Natural Resources, Construction and Maintenance occupations in Girard are Construction & Extraction (100 | 8.3%), and Installation, Maintenance & Repair (46 | 3.8%).
Natural Resources, Construction and Maintenance Occupations by Sex
| Occupation | Male | Female |
| Farming, Fishing & Forestry | 0 (0.0%) | 0 (0.0%) |
| Construction & Extraction | 100 (100.0%) | 0 (0.0%) |
| Installation, Maintenance & Repair | 42 (91.3%) | 4 (8.7%) |
| Total (Category) | 142 (97.3%) | 4 (2.7%) |
| Total (Overall) | 619 (51.6%) | 580 (48.4%) |
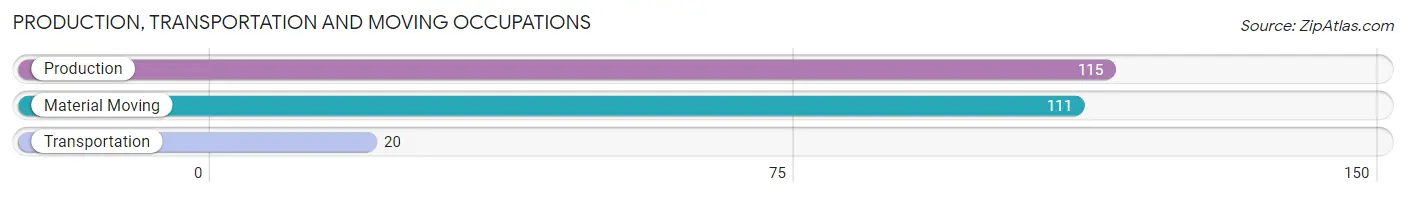
Production, Transportation and Moving Occupations
The most common Production, Transportation and Moving occupations in Girard are Production (115 | 9.6%), Material Moving (111 | 9.3%), and Transportation (20 | 1.7%).
Production, Transportation and Moving Occupations by Sex
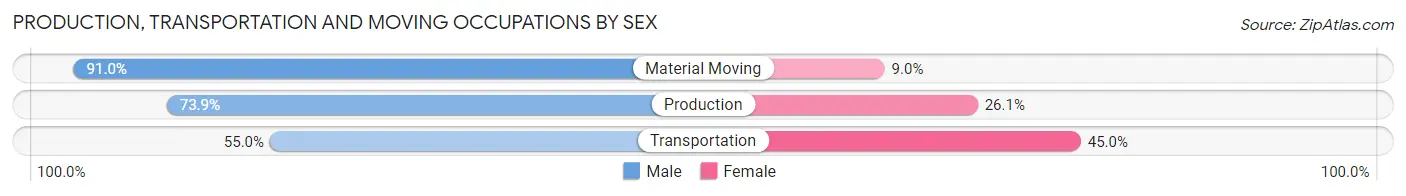
| Occupation | Male | Female |
| Production | 85 (73.9%) | 30 (26.1%) |
| Transportation | 11 (55.0%) | 9 (45.0%) |
| Material Moving | 101 (91.0%) | 10 (9.0%) |
| Total (Category) | 197 (80.1%) | 49 (19.9%) |
| Total (Overall) | 619 (51.6%) | 580 (48.4%) |
Employment Industries by Sex in Girard
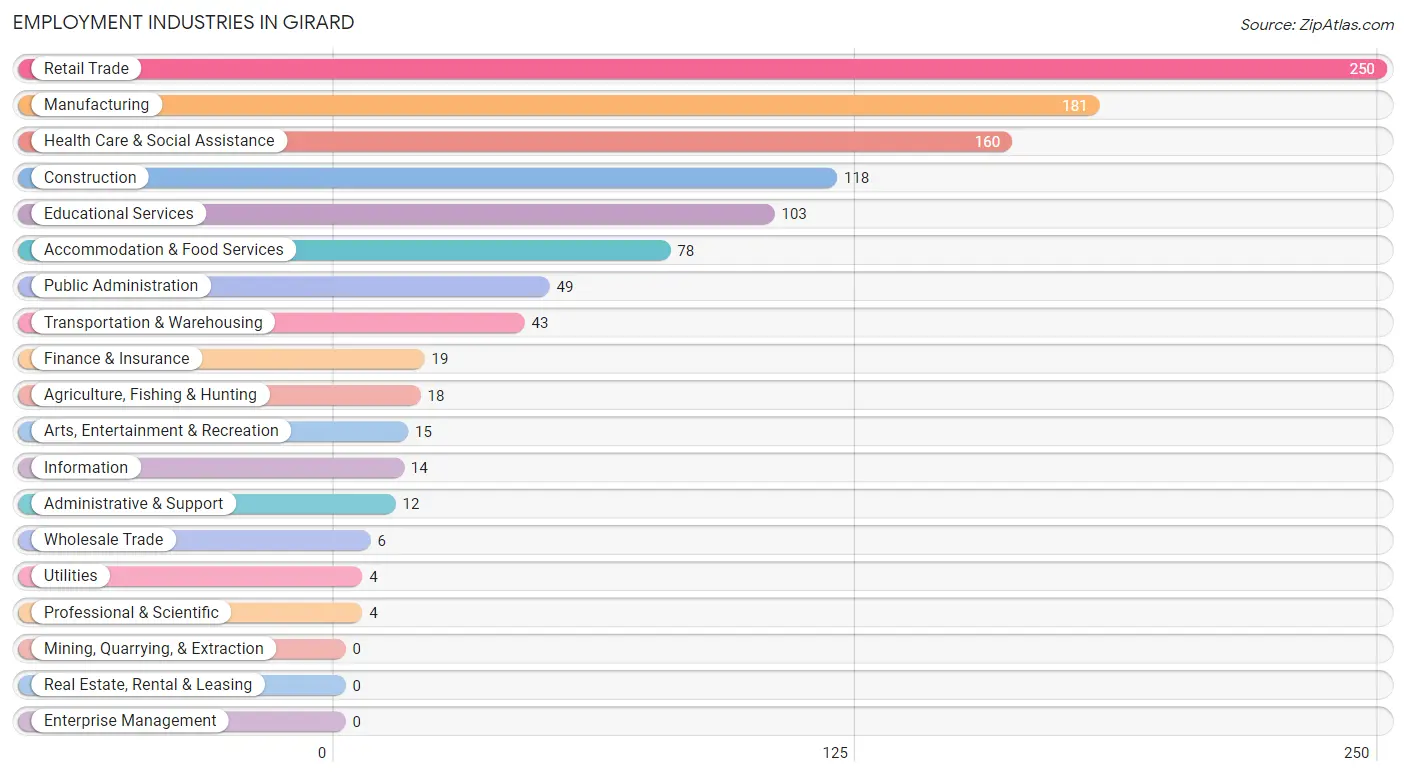
Employment Industries in Girard
The major employment industries in Girard include Retail Trade (250 | 20.8%), Manufacturing (181 | 15.1%), Health Care & Social Assistance (160 | 13.3%), Construction (118 | 9.8%), and Educational Services (103 | 8.6%).
Employment Industries by Sex in Girard
The Girard industries that see more men than women are Agriculture, Fishing & Hunting (100.0%), Wholesale Trade (100.0%), and Transportation & Warehousing (100.0%), whereas the industries that tend to have a higher number of women are Professional & Scientific (100.0%), Public Administration (89.8%), and Accommodation & Food Services (85.9%).
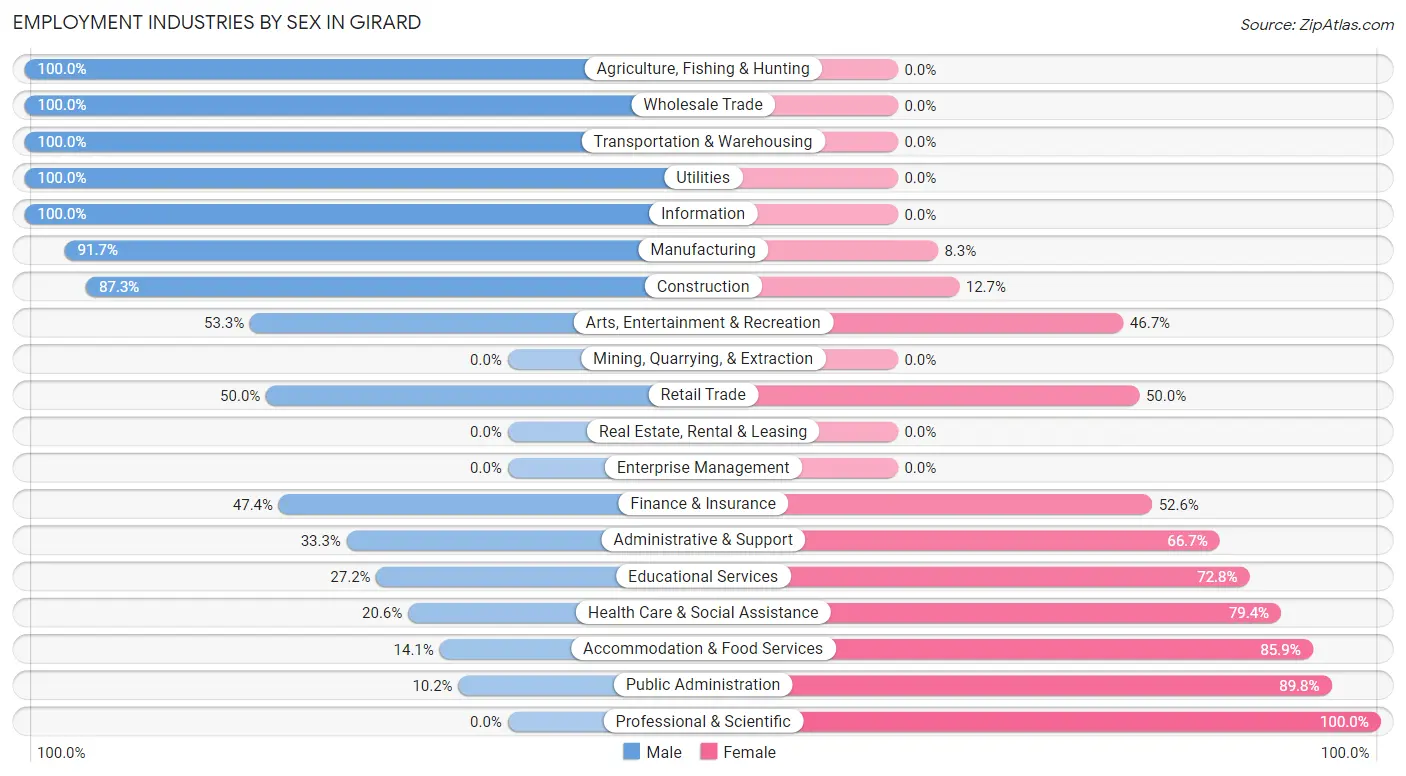
| Industry | Male | Female |
| Agriculture, Fishing & Hunting | 18 (100.0%) | 0 (0.0%) |
| Mining, Quarrying, & Extraction | 0 (0.0%) | 0 (0.0%) |
| Construction | 103 (87.3%) | 15 (12.7%) |
| Manufacturing | 166 (91.7%) | 15 (8.3%) |
| Wholesale Trade | 6 (100.0%) | 0 (0.0%) |
| Retail Trade | 125 (50.0%) | 125 (50.0%) |
| Transportation & Warehousing | 43 (100.0%) | 0 (0.0%) |
| Utilities | 4 (100.0%) | 0 (0.0%) |
| Information | 14 (100.0%) | 0 (0.0%) |
| Finance & Insurance | 9 (47.4%) | 10 (52.6%) |
| Real Estate, Rental & Leasing | 0 (0.0%) | 0 (0.0%) |
| Professional & Scientific | 0 (0.0%) | 4 (100.0%) |
| Enterprise Management | 0 (0.0%) | 0 (0.0%) |
| Administrative & Support | 4 (33.3%) | 8 (66.7%) |
| Educational Services | 28 (27.2%) | 75 (72.8%) |
| Health Care & Social Assistance | 33 (20.6%) | 127 (79.4%) |
| Arts, Entertainment & Recreation | 8 (53.3%) | 7 (46.7%) |
| Accommodation & Food Services | 11 (14.1%) | 67 (85.9%) |
| Public Administration | 5 (10.2%) | 44 (89.8%) |
| Total | 619 (51.6%) | 580 (48.4%) |
Education in Girard
School Enrollment in Girard
The most common levels of schooling among the 682 students in Girard are college / undergraduate (188 | 27.6%), high school (172 | 25.2%), and middle school (132 | 19.4%).
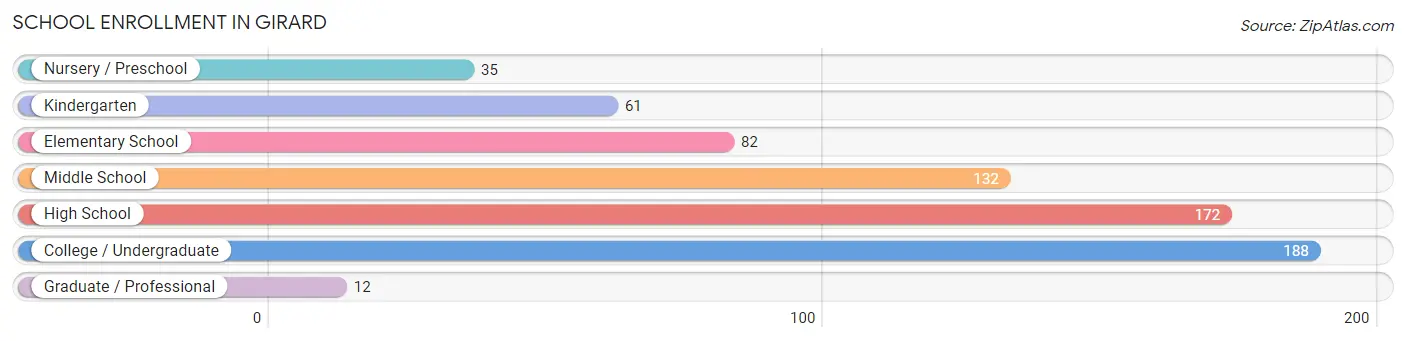
| School Level | # Students | % Students |
| Nursery / Preschool | 35 | 5.1% |
| Kindergarten | 61 | 8.9% |
| Elementary School | 82 | 12.0% |
| Middle School | 132 | 19.4% |
| High School | 172 | 25.2% |
| College / Undergraduate | 188 | 27.6% |
| Graduate / Professional | 12 | 1.8% |
| Total | 682 | 100.0% |
School Enrollment by Age by Funding Source in Girard
Out of a total of 682 students who are enrolled in schools in Girard, 47 (6.9%) attend a private institution, while the remaining 635 (93.1%) are enrolled in public schools. The age group of 35 years and over has the highest likelihood of being enrolled in private schools, with 38 (55.9% in the age bracket) enrolled. Conversely, the age group of 3 to 4 year olds has the lowest likelihood of being enrolled in a private school, with 14 (100.0% in the age bracket) attending a public institution.
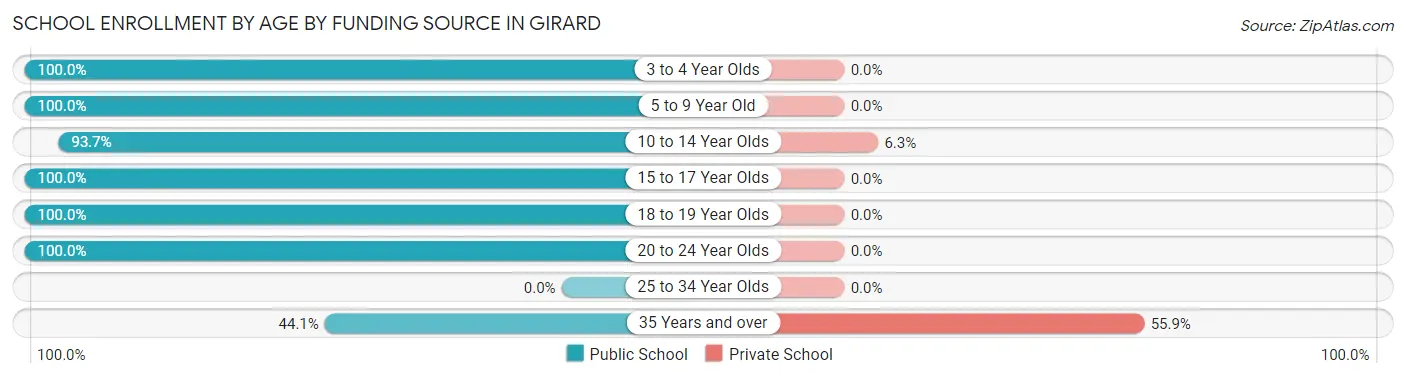
| Age Bracket | Public School | Private School |
| 3 to 4 Year Olds | 14 (100.0%) | 0 (0.0%) |
| 5 to 9 Year Old | 151 (100.0%) | 0 (0.0%) |
| 10 to 14 Year Olds | 134 (93.7%) | 9 (6.3%) |
| 15 to 17 Year Olds | 122 (100.0%) | 0 (0.0%) |
| 18 to 19 Year Olds | 62 (100.0%) | 0 (0.0%) |
| 20 to 24 Year Olds | 122 (100.0%) | 0 (0.0%) |
| 25 to 34 Year Olds | 0 (0.0%) | 0 (0.0%) |
| 35 Years and over | 30 (44.1%) | 38 (55.9%) |
| Total | 635 (93.1%) | 47 (6.9%) |
Educational Attainment by Field of Study in Girard
Education (95 | 24.9%), business (64 | 16.8%), science & technology (46 | 12.1%), visual & performing arts (33 | 8.7%), and liberal arts & history (32 | 8.4%) are the most common fields of study among 381 individuals in Girard who have obtained a bachelor's degree or higher.
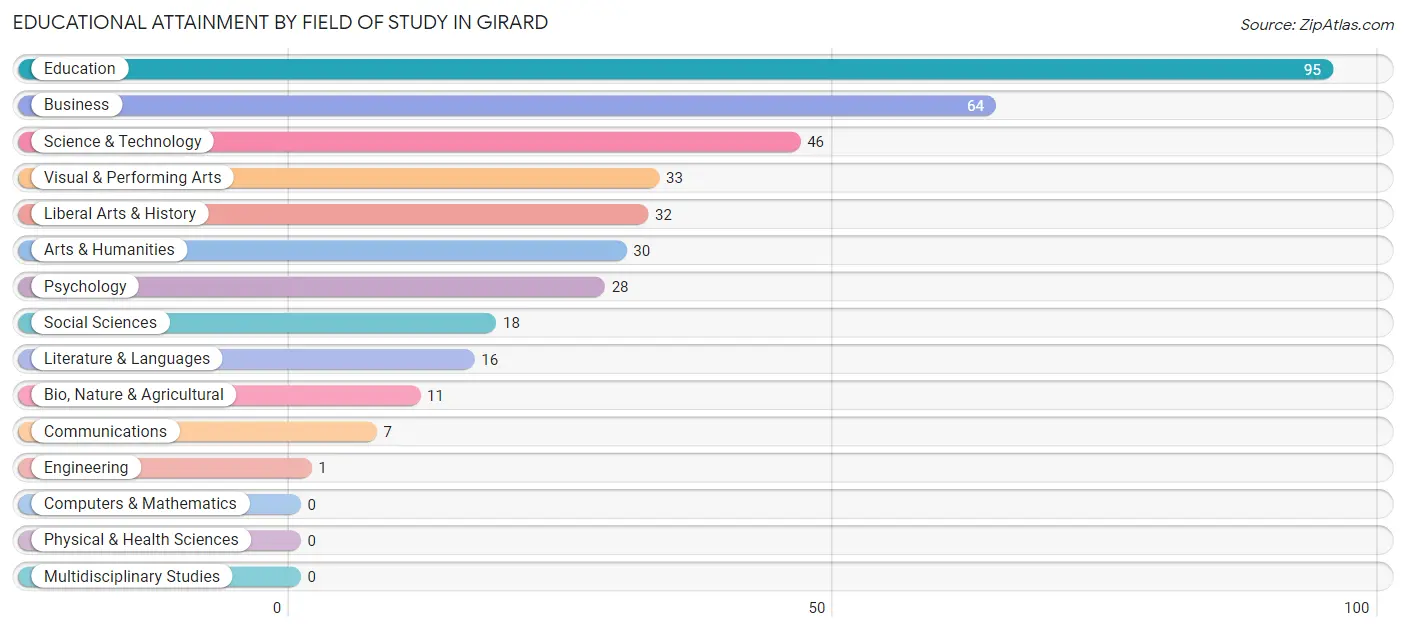
| Field of Study | # Graduates | % Graduates |
| Computers & Mathematics | 0 | 0.0% |
| Bio, Nature & Agricultural | 11 | 2.9% |
| Physical & Health Sciences | 0 | 0.0% |
| Psychology | 28 | 7.3% |
| Social Sciences | 18 | 4.7% |
| Engineering | 1 | 0.3% |
| Multidisciplinary Studies | 0 | 0.0% |
| Science & Technology | 46 | 12.1% |
| Business | 64 | 16.8% |
| Education | 95 | 24.9% |
| Literature & Languages | 16 | 4.2% |
| Liberal Arts & History | 32 | 8.4% |
| Visual & Performing Arts | 33 | 8.7% |
| Communications | 7 | 1.8% |
| Arts & Humanities | 30 | 7.9% |
| Total | 381 | 100.0% |
Transportation & Commute in Girard
Vehicle Availability by Sex in Girard
The most prevalent vehicle ownership categories in Girard are males with 2 vehicles (271, accounting for 44.5%) and females with 2 vehicles (255, making up 46.7%).
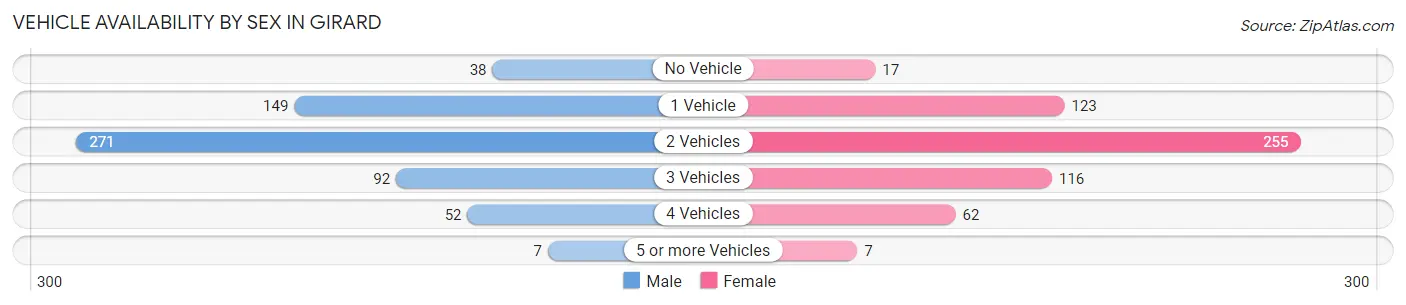
| Vehicles Available | Male | Female |
| No Vehicle | 38 (6.2%) | 17 (2.9%) |
| 1 Vehicle | 149 (24.5%) | 123 (21.2%) |
| 2 Vehicles | 271 (44.5%) | 255 (44.0%) |
| 3 Vehicles | 92 (15.1%) | 116 (20.0%) |
| 4 Vehicles | 52 (8.5%) | 62 (10.7%) |
| 5 or more Vehicles | 7 (1.1%) | 7 (1.2%) |
| Total | 609 (100.0%) | 580 (100.0%) |
Commute Time in Girard
The most frequently occuring commute durations in Girard are 5 to 9 minutes (389 commuters, 33.4%), less than 5 minutes (166 commuters, 14.2%), and 20 to 24 minutes (139 commuters, 11.9%).
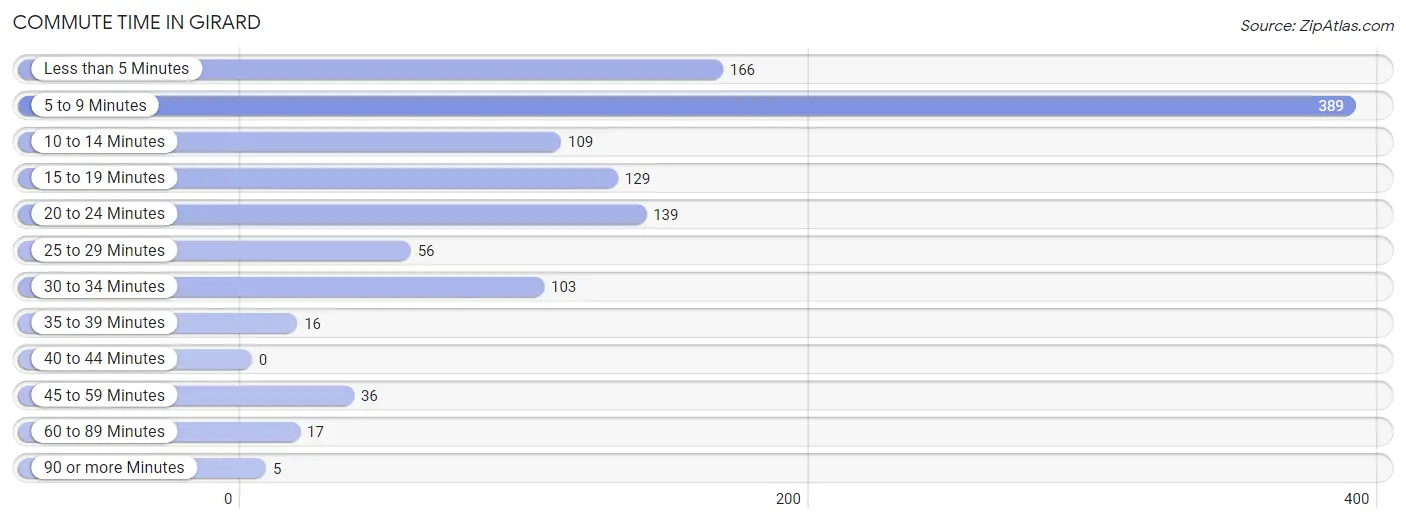
| Commute Time | # Commuters | % Commuters |
| Less than 5 Minutes | 166 | 14.2% |
| 5 to 9 Minutes | 389 | 33.4% |
| 10 to 14 Minutes | 109 | 9.4% |
| 15 to 19 Minutes | 129 | 11.1% |
| 20 to 24 Minutes | 139 | 11.9% |
| 25 to 29 Minutes | 56 | 4.8% |
| 30 to 34 Minutes | 103 | 8.8% |
| 35 to 39 Minutes | 16 | 1.4% |
| 40 to 44 Minutes | 0 | 0.0% |
| 45 to 59 Minutes | 36 | 3.1% |
| 60 to 89 Minutes | 17 | 1.5% |
| 90 or more Minutes | 5 | 0.4% |
Commute Time by Sex in Girard
The most common commute times in Girard are 5 to 9 minutes (213 commuters, 35.1%) for males and 5 to 9 minutes (176 commuters, 31.5%) for females.
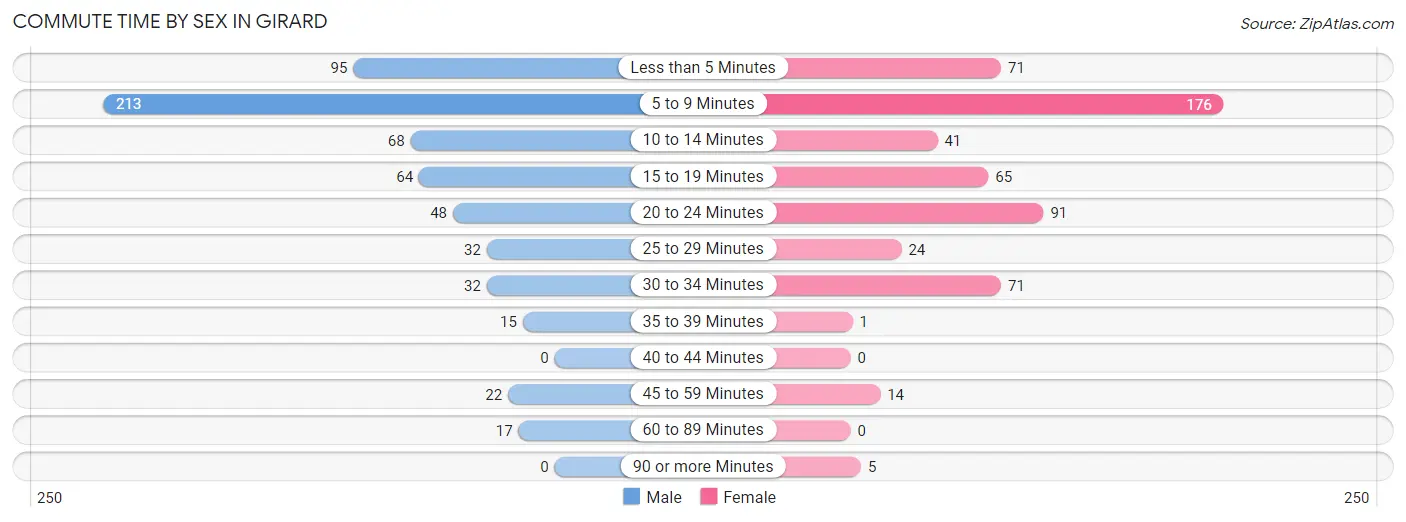
| Commute Time | Male | Female |
| Less than 5 Minutes | 95 (15.7%) | 71 (12.7%) |
| 5 to 9 Minutes | 213 (35.1%) | 176 (31.5%) |
| 10 to 14 Minutes | 68 (11.2%) | 41 (7.3%) |
| 15 to 19 Minutes | 64 (10.6%) | 65 (11.6%) |
| 20 to 24 Minutes | 48 (7.9%) | 91 (16.3%) |
| 25 to 29 Minutes | 32 (5.3%) | 24 (4.3%) |
| 30 to 34 Minutes | 32 (5.3%) | 71 (12.7%) |
| 35 to 39 Minutes | 15 (2.5%) | 1 (0.2%) |
| 40 to 44 Minutes | 0 (0.0%) | 0 (0.0%) |
| 45 to 59 Minutes | 22 (3.6%) | 14 (2.5%) |
| 60 to 89 Minutes | 17 (2.8%) | 0 (0.0%) |
| 90 or more Minutes | 0 (0.0%) | 5 (0.9%) |
Time of Departure to Work by Sex in Girard
The most frequent times of departure to work in Girard are 5:30 AM to 5:59 AM (112, 18.5%) for males and 7:30 AM to 7:59 AM (94, 16.8%) for females.
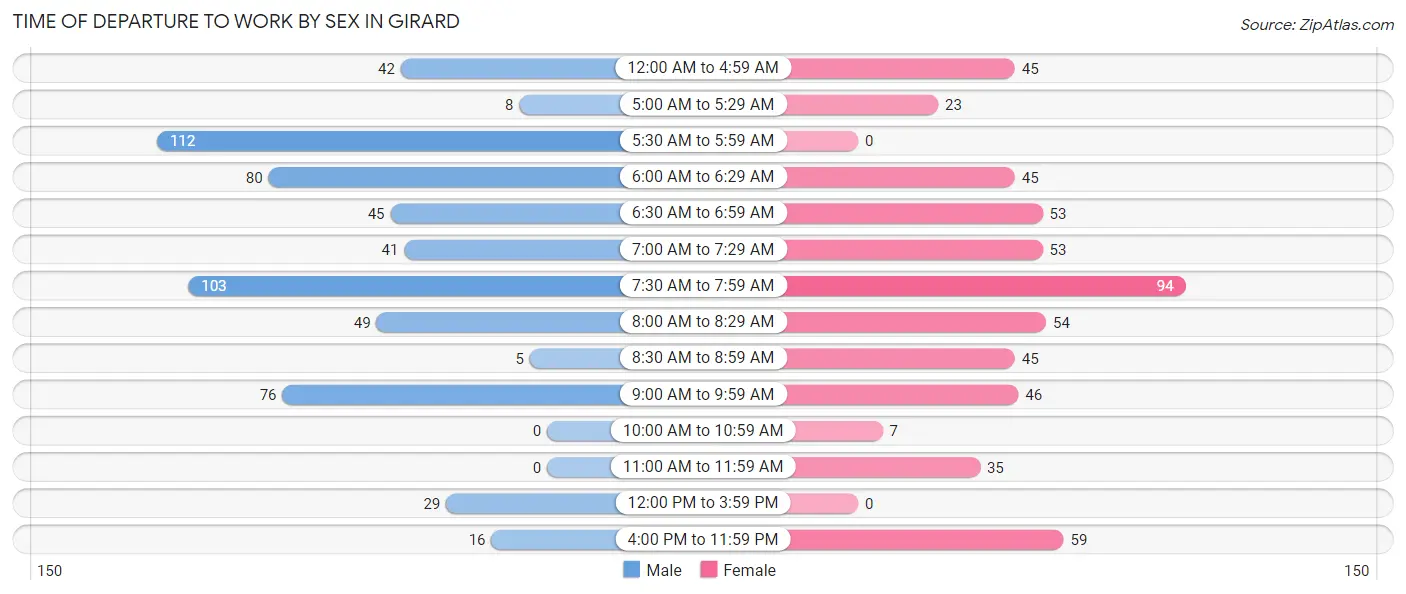
| Time of Departure | Male | Female |
| 12:00 AM to 4:59 AM | 42 (6.9%) | 45 (8.1%) |
| 5:00 AM to 5:29 AM | 8 (1.3%) | 23 (4.1%) |
| 5:30 AM to 5:59 AM | 112 (18.5%) | 0 (0.0%) |
| 6:00 AM to 6:29 AM | 80 (13.2%) | 45 (8.1%) |
| 6:30 AM to 6:59 AM | 45 (7.4%) | 53 (9.5%) |
| 7:00 AM to 7:29 AM | 41 (6.8%) | 53 (9.5%) |
| 7:30 AM to 7:59 AM | 103 (17.0%) | 94 (16.8%) |
| 8:00 AM to 8:29 AM | 49 (8.1%) | 54 (9.7%) |
| 8:30 AM to 8:59 AM | 5 (0.8%) | 45 (8.1%) |
| 9:00 AM to 9:59 AM | 76 (12.5%) | 46 (8.2%) |
| 10:00 AM to 10:59 AM | 0 (0.0%) | 7 (1.3%) |
| 11:00 AM to 11:59 AM | 0 (0.0%) | 35 (6.3%) |
| 12:00 PM to 3:59 PM | 29 (4.8%) | 0 (0.0%) |
| 4:00 PM to 11:59 PM | 16 (2.6%) | 59 (10.5%) |
| Total | 606 (100.0%) | 559 (100.0%) |
Housing Occupancy in Girard
Occupancy by Ownership in Girard
Of the total 1,028 dwellings in Girard, owner-occupied units account for 564 (54.9%), while renter-occupied units make up 464 (45.1%).
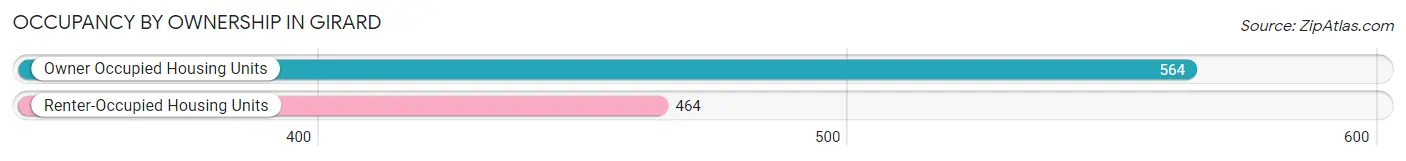
| Occupancy | # Housing Units | % Housing Units |
| Owner Occupied Housing Units | 564 | 54.9% |
| Renter-Occupied Housing Units | 464 | 45.1% |
| Total Occupied Housing Units | 1,028 | 100.0% |
Occupancy by Household Size in Girard
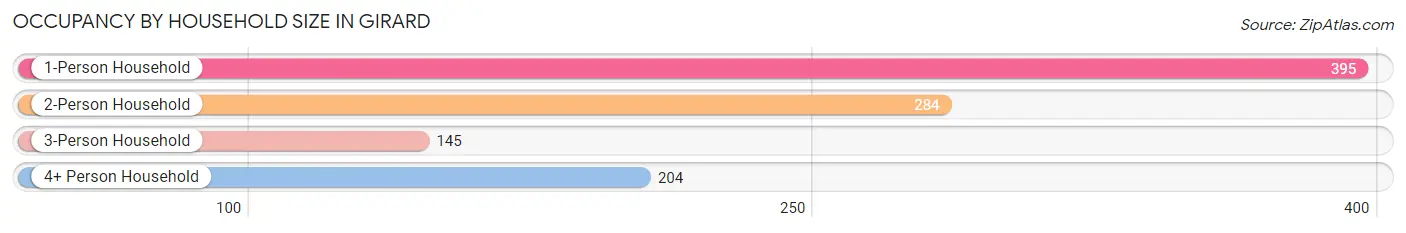
| Household Size | # Housing Units | % Housing Units |
| 1-Person Household | 395 | 38.4% |
| 2-Person Household | 284 | 27.6% |
| 3-Person Household | 145 | 14.1% |
| 4+ Person Household | 204 | 19.8% |
| Total Housing Units | 1,028 | 100.0% |
Occupancy by Ownership by Household Size in Girard
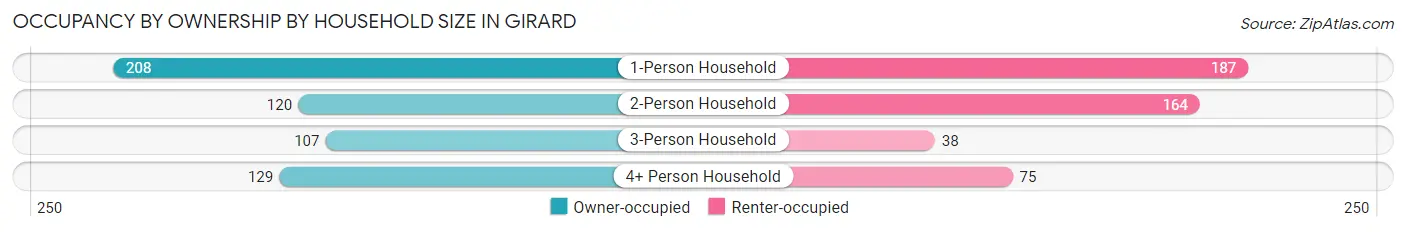
| Household Size | Owner-occupied | Renter-occupied |
| 1-Person Household | 208 (52.7%) | 187 (47.3%) |
| 2-Person Household | 120 (42.2%) | 164 (57.8%) |
| 3-Person Household | 107 (73.8%) | 38 (26.2%) |
| 4+ Person Household | 129 (63.2%) | 75 (36.8%) |
| Total Housing Units | 564 (54.9%) | 464 (45.1%) |
Occupancy by Educational Attainment in Girard
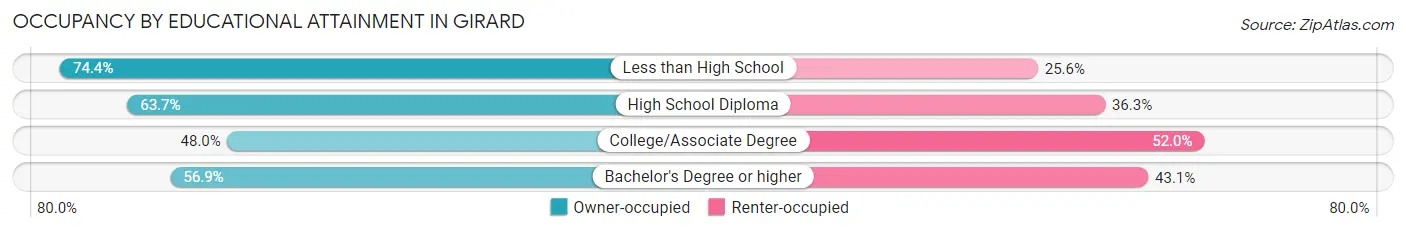
| Household Size | Owner-occupied | Renter-occupied |
| Less than High School | 29 (74.4%) | 10 (25.6%) |
| High School Diploma | 151 (63.7%) | 86 (36.3%) |
| College/Associate Degree | 235 (48.0%) | 255 (52.0%) |
| Bachelor's Degree or higher | 149 (56.9%) | 113 (43.1%) |
Occupancy by Age of Householder in Girard
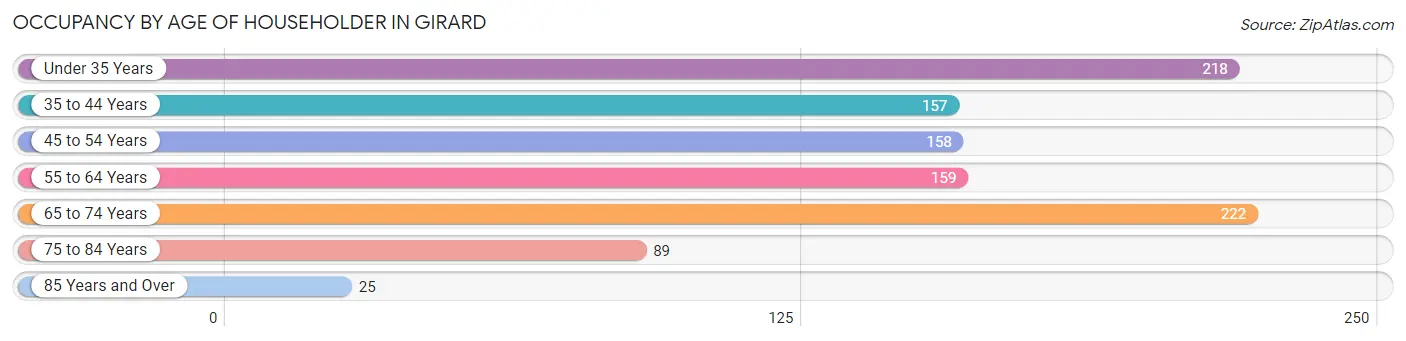
| Age Bracket | # Households | % Households |
| Under 35 Years | 218 | 21.2% |
| 35 to 44 Years | 157 | 15.3% |
| 45 to 54 Years | 158 | 15.4% |
| 55 to 64 Years | 159 | 15.5% |
| 65 to 74 Years | 222 | 21.6% |
| 75 to 84 Years | 89 | 8.7% |
| 85 Years and Over | 25 | 2.4% |
| Total | 1,028 | 100.0% |
Housing Finances in Girard
Median Income by Occupancy in Girard
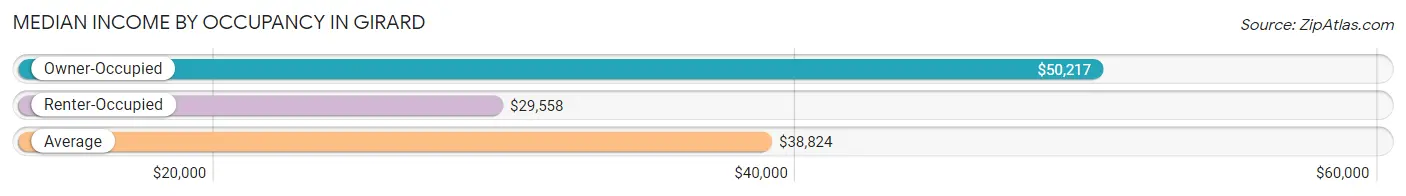
| Occupancy Type | # Households | Median Income |
| Owner-Occupied | 564 (54.9%) | $50,217 |
| Renter-Occupied | 464 (45.1%) | $29,558 |
| Average | 1,028 (100.0%) | $38,824 |
Occupancy by Householder Income Bracket in Girard
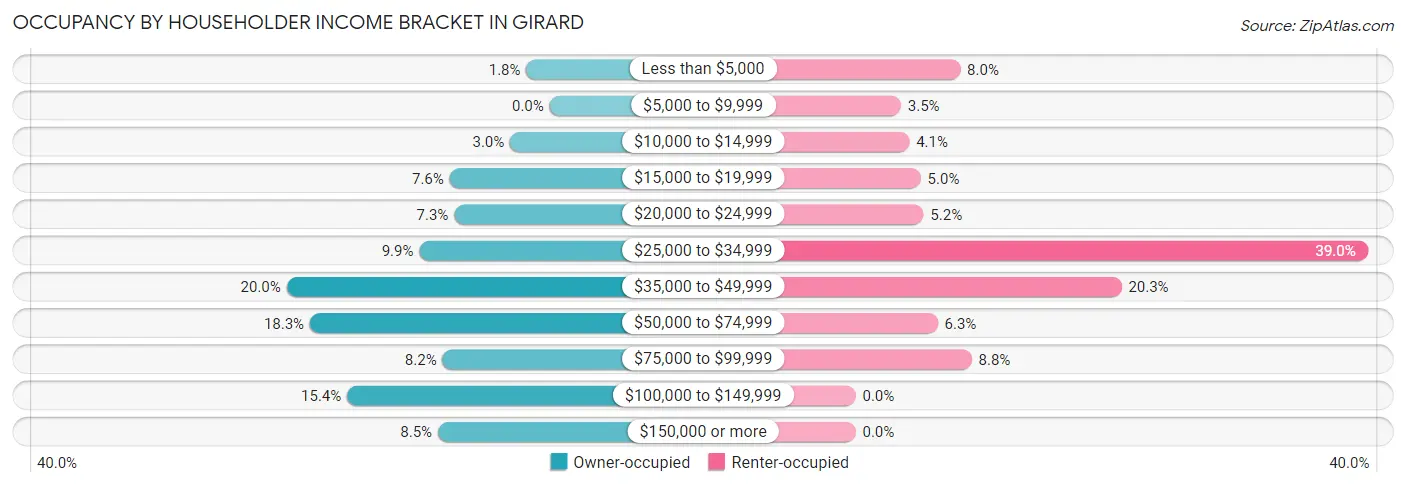
| Income Bracket | Owner-occupied | Renter-occupied |
| Less than $5,000 | 10 (1.8%) | 37 (8.0%) |
| $5,000 to $9,999 | 0 (0.0%) | 16 (3.5%) |
| $10,000 to $14,999 | 17 (3.0%) | 19 (4.1%) |
| $15,000 to $19,999 | 43 (7.6%) | 23 (5.0%) |
| $20,000 to $24,999 | 41 (7.3%) | 24 (5.2%) |
| $25,000 to $34,999 | 56 (9.9%) | 181 (39.0%) |
| $35,000 to $49,999 | 113 (20.0%) | 94 (20.3%) |
| $50,000 to $74,999 | 103 (18.3%) | 29 (6.2%) |
| $75,000 to $99,999 | 46 (8.2%) | 41 (8.8%) |
| $100,000 to $149,999 | 87 (15.4%) | 0 (0.0%) |
| $150,000 or more | 48 (8.5%) | 0 (0.0%) |
| Total | 564 (100.0%) | 464 (100.0%) |
Monthly Housing Cost Tiers in Girard
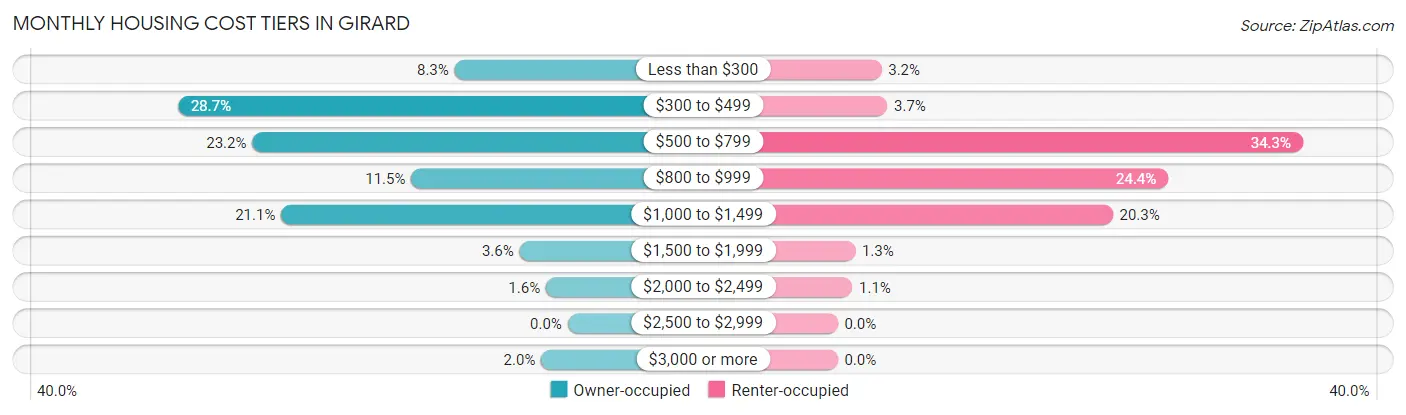
| Monthly Cost | Owner-occupied | Renter-occupied |
| Less than $300 | 47 (8.3%) | 15 (3.2%) |
| $300 to $499 | 162 (28.7%) | 17 (3.7%) |
| $500 to $799 | 131 (23.2%) | 159 (34.3%) |
| $800 to $999 | 65 (11.5%) | 113 (24.3%) |
| $1,000 to $1,499 | 119 (21.1%) | 94 (20.3%) |
| $1,500 to $1,999 | 20 (3.5%) | 6 (1.3%) |
| $2,000 to $2,499 | 9 (1.6%) | 5 (1.1%) |
| $2,500 to $2,999 | 0 (0.0%) | 0 (0.0%) |
| $3,000 or more | 11 (1.9%) | 0 (0.0%) |
| Total | 564 (100.0%) | 464 (100.0%) |
Physical Housing Characteristics in Girard
Housing Structures in Girard
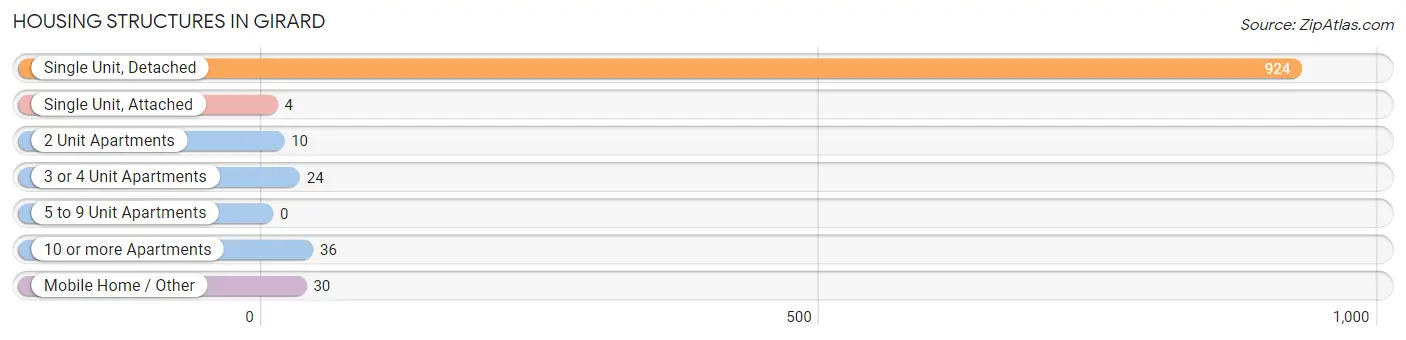
| Structure Type | # Housing Units | % Housing Units |
| Single Unit, Detached | 924 | 89.9% |
| Single Unit, Attached | 4 | 0.4% |
| 2 Unit Apartments | 10 | 1.0% |
| 3 or 4 Unit Apartments | 24 | 2.3% |
| 5 to 9 Unit Apartments | 0 | 0.0% |
| 10 or more Apartments | 36 | 3.5% |
| Mobile Home / Other | 30 | 2.9% |
| Total | 1,028 | 100.0% |
Housing Structures by Occupancy in Girard

| Structure Type | Owner-occupied | Renter-occupied |
| Single Unit, Detached | 546 (59.1%) | 378 (40.9%) |
| Single Unit, Attached | 0 (0.0%) | 4 (100.0%) |
| 2 Unit Apartments | 0 (0.0%) | 10 (100.0%) |
| 3 or 4 Unit Apartments | 0 (0.0%) | 24 (100.0%) |
| 5 to 9 Unit Apartments | 0 (0.0%) | 0 (0.0%) |
| 10 or more Apartments | 0 (0.0%) | 36 (100.0%) |
| Mobile Home / Other | 18 (60.0%) | 12 (40.0%) |
| Total | 564 (54.9%) | 464 (45.1%) |
Housing Structures by Number of Rooms in Girard
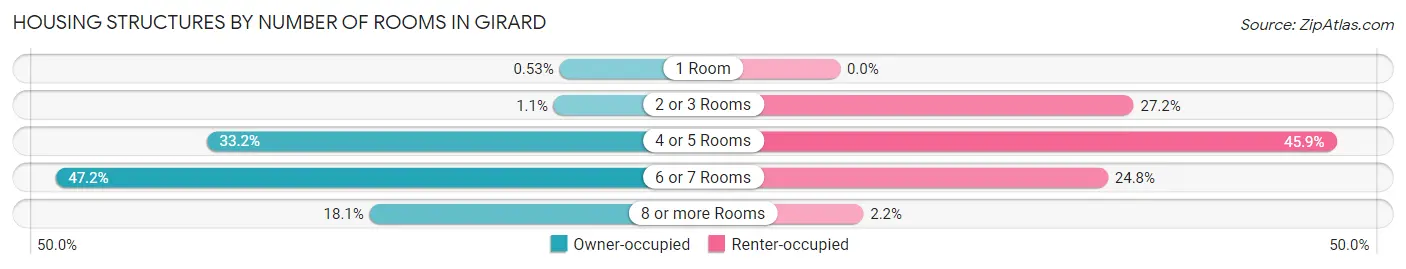
| Number of Rooms | Owner-occupied | Renter-occupied |
| 1 Room | 3 (0.5%) | 0 (0.0%) |
| 2 or 3 Rooms | 6 (1.1%) | 126 (27.2%) |
| 4 or 5 Rooms | 187 (33.2%) | 213 (45.9%) |
| 6 or 7 Rooms | 266 (47.2%) | 115 (24.8%) |
| 8 or more Rooms | 102 (18.1%) | 10 (2.2%) |
| Total | 564 (100.0%) | 464 (100.0%) |
Housing Structure by Heating Type in Girard
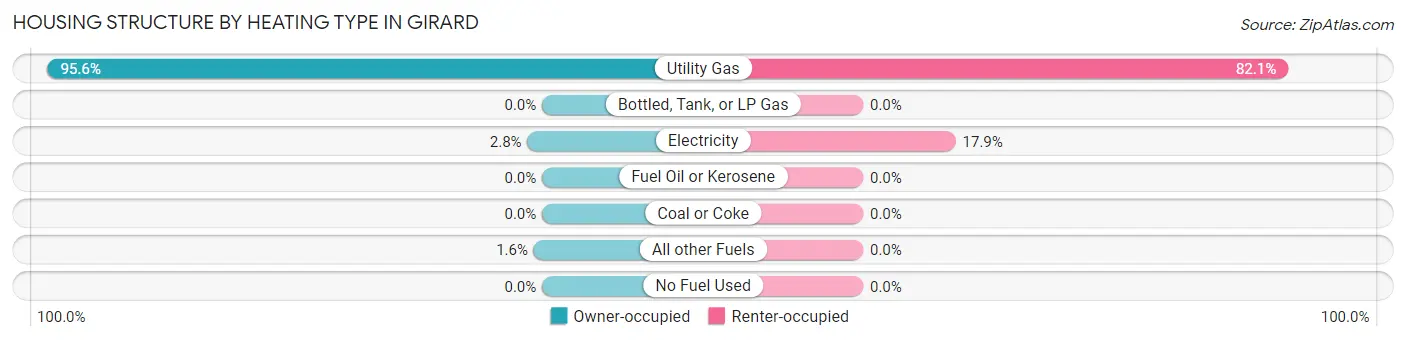
| Heating Type | Owner-occupied | Renter-occupied |
| Utility Gas | 539 (95.6%) | 381 (82.1%) |
| Bottled, Tank, or LP Gas | 0 (0.0%) | 0 (0.0%) |
| Electricity | 16 (2.8%) | 83 (17.9%) |
| Fuel Oil or Kerosene | 0 (0.0%) | 0 (0.0%) |
| Coal or Coke | 0 (0.0%) | 0 (0.0%) |
| All other Fuels | 9 (1.6%) | 0 (0.0%) |
| No Fuel Used | 0 (0.0%) | 0 (0.0%) |
| Total | 564 (100.0%) | 464 (100.0%) |
Household Vehicle Usage in Girard
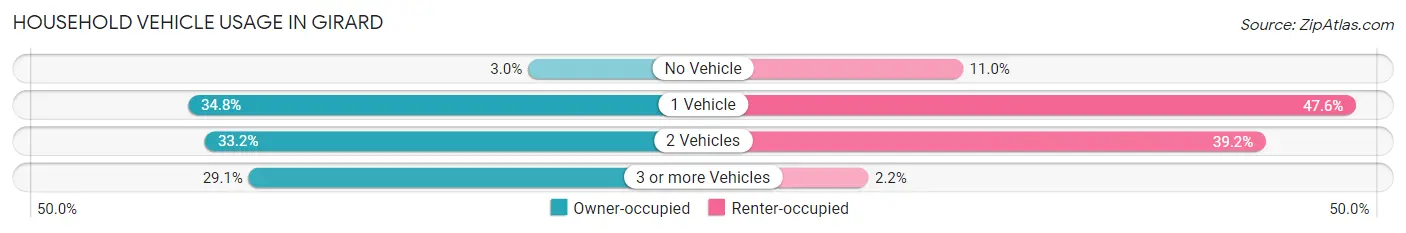
| Vehicles per Household | Owner-occupied | Renter-occupied |
| No Vehicle | 17 (3.0%) | 51 (11.0%) |
| 1 Vehicle | 196 (34.7%) | 221 (47.6%) |
| 2 Vehicles | 187 (33.2%) | 182 (39.2%) |
| 3 or more Vehicles | 164 (29.1%) | 10 (2.2%) |
| Total | 564 (100.0%) | 464 (100.0%) |
Real Estate & Mortgages in Girard
Real Estate and Mortgage Overview in Girard
| Characteristic | Without Mortgage | With Mortgage |
| Housing Units | 324 | 240 |
| Median Property Value | $77,800 | $97,500 |
| Median Household Income | $41,964 | $17 |
| Monthly Housing Costs | $456 | $11 |
| Real Estate Taxes | $1,258 | $0 |
Property Value by Mortgage Status in Girard
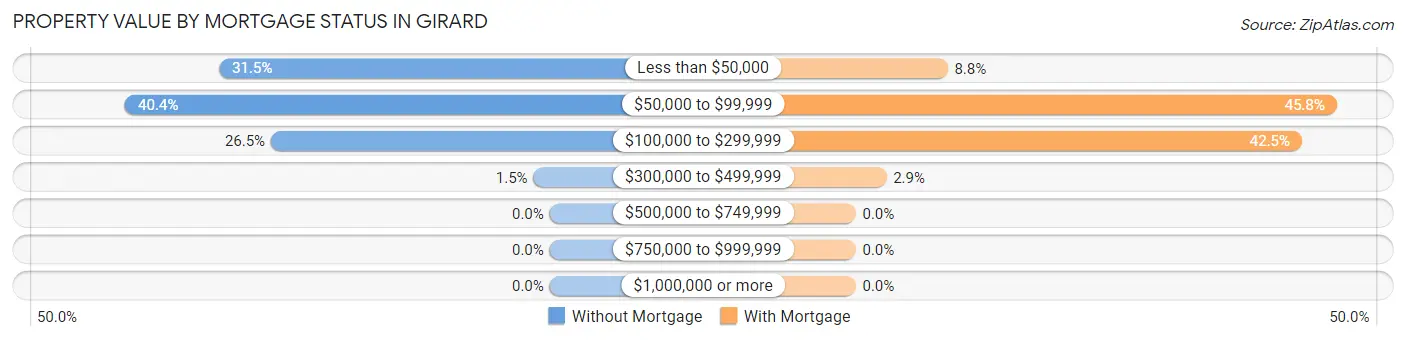
| Property Value | Without Mortgage | With Mortgage |
| Less than $50,000 | 102 (31.5%) | 21 (8.7%) |
| $50,000 to $99,999 | 131 (40.4%) | 110 (45.8%) |
| $100,000 to $299,999 | 86 (26.5%) | 102 (42.5%) |
| $300,000 to $499,999 | 5 (1.5%) | 7 (2.9%) |
| $500,000 to $749,999 | 0 (0.0%) | 0 (0.0%) |
| $750,000 to $999,999 | 0 (0.0%) | 0 (0.0%) |
| $1,000,000 or more | 0 (0.0%) | 0 (0.0%) |
| Total | 324 (100.0%) | 240 (100.0%) |
Household Income by Mortgage Status in Girard
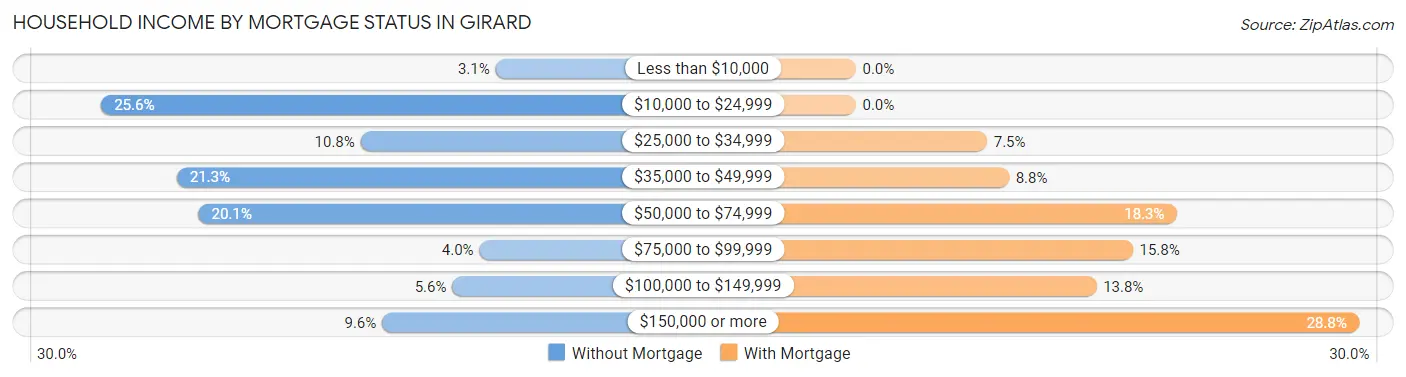
| Household Income | Without Mortgage | With Mortgage |
| Less than $10,000 | 10 (3.1%) | 0 (0.0%) |
| $10,000 to $24,999 | 83 (25.6%) | 0 (0.0%) |
| $25,000 to $34,999 | 35 (10.8%) | 18 (7.5%) |
| $35,000 to $49,999 | 69 (21.3%) | 21 (8.7%) |
| $50,000 to $74,999 | 65 (20.1%) | 44 (18.3%) |
| $75,000 to $99,999 | 13 (4.0%) | 38 (15.8%) |
| $100,000 to $149,999 | 18 (5.6%) | 33 (13.8%) |
| $150,000 or more | 31 (9.6%) | 69 (28.7%) |
| Total | 324 (100.0%) | 240 (100.0%) |
Property Value to Household Income Ratio in Girard
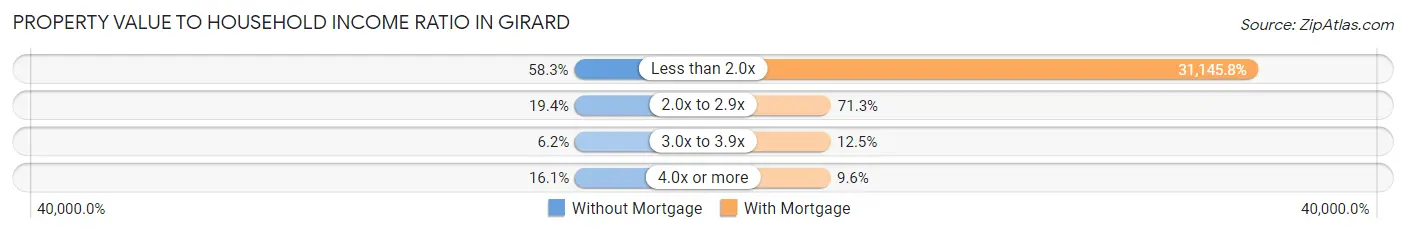
| Value-to-Income Ratio | Without Mortgage | With Mortgage |
| Less than 2.0x | 189 (58.3%) | 74,750 (31,145.8%) |
| 2.0x to 2.9x | 63 (19.4%) | 171 (71.3%) |
| 3.0x to 3.9x | 20 (6.2%) | 30 (12.5%) |
| 4.0x or more | 52 (16.1%) | 23 (9.6%) |
| Total | 324 (100.0%) | 240 (100.0%) |
Real Estate Taxes by Mortgage Status in Girard
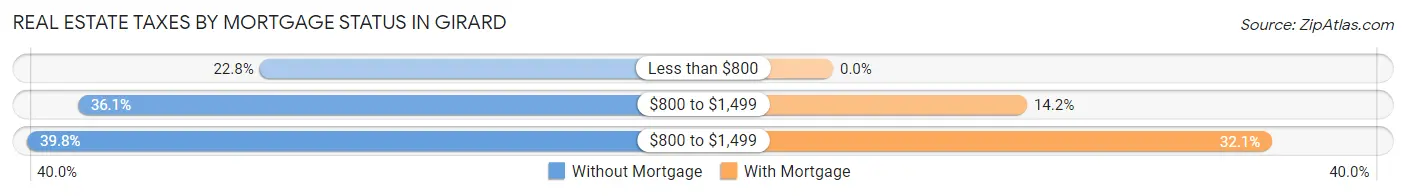
| Property Taxes | Without Mortgage | With Mortgage |
| Less than $800 | 74 (22.8%) | 0 (0.0%) |
| $800 to $1,499 | 117 (36.1%) | 34 (14.2%) |
| $800 to $1,499 | 129 (39.8%) | 77 (32.1%) |
| Total | 324 (100.0%) | 240 (100.0%) |
Health & Disability in Girard
Health Insurance Coverage by Age in Girard
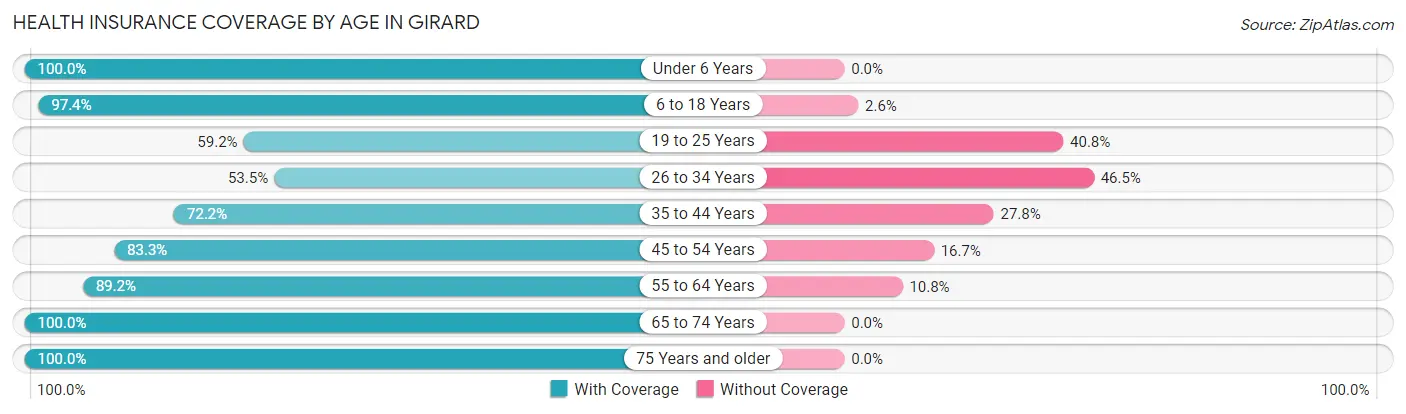
| Age Bracket | With Coverage | Without Coverage |
| Under 6 Years | 136 (100.0%) | 0 (0.0%) |
| 6 to 18 Years | 417 (97.4%) | 11 (2.6%) |
| 19 to 25 Years | 206 (59.2%) | 142 (40.8%) |
| 26 to 34 Years | 138 (53.5%) | 120 (46.5%) |
| 35 to 44 Years | 197 (72.2%) | 76 (27.8%) |
| 45 to 54 Years | 200 (83.3%) | 40 (16.7%) |
| 55 to 64 Years | 255 (89.2%) | 31 (10.8%) |
| 65 to 74 Years | 391 (100.0%) | 0 (0.0%) |
| 75 Years and older | 142 (100.0%) | 0 (0.0%) |
| Total | 2,082 (83.2%) | 420 (16.8%) |
Health Insurance Coverage by Citizenship Status in Girard
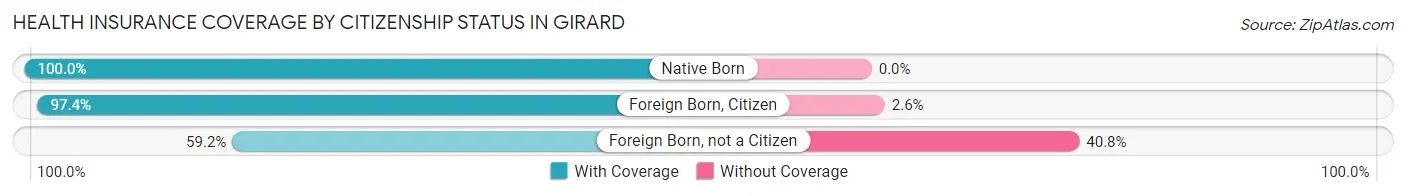
| Citizenship Status | With Coverage | Without Coverage |
| Native Born | 136 (100.0%) | 0 (0.0%) |
| Foreign Born, Citizen | 417 (97.4%) | 11 (2.6%) |
| Foreign Born, not a Citizen | 206 (59.2%) | 142 (40.8%) |
Health Insurance Coverage by Household Income in Girard
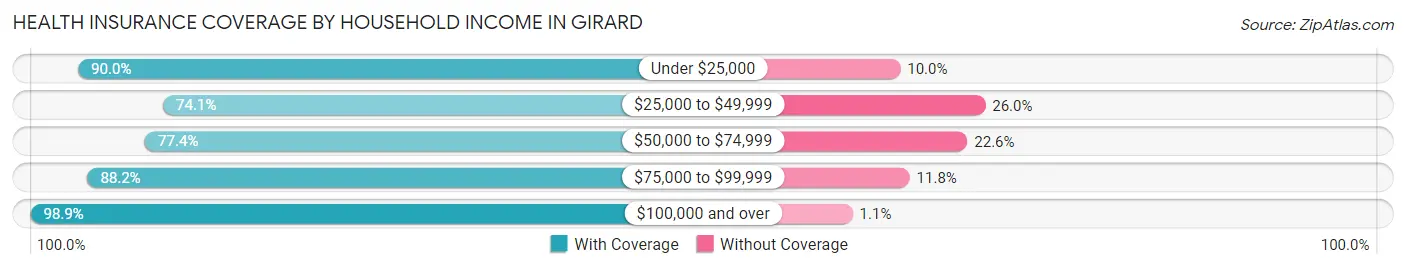
| Household Income | With Coverage | Without Coverage |
| Under $25,000 | 350 (90.0%) | 39 (10.0%) |
| $25,000 to $49,999 | 662 (74.1%) | 232 (26.0%) |
| $50,000 to $74,999 | 353 (77.4%) | 103 (22.6%) |
| $75,000 to $99,999 | 262 (88.2%) | 35 (11.8%) |
| $100,000 and over | 449 (98.9%) | 5 (1.1%) |
Public vs Private Health Insurance Coverage by Age in Girard
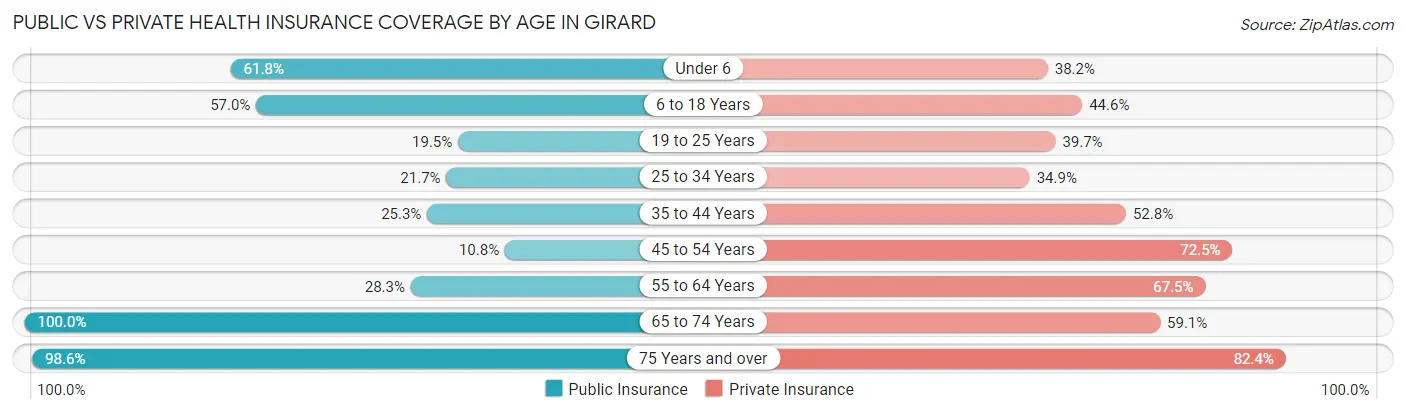
| Age Bracket | Public Insurance | Private Insurance |
| Under 6 | 84 (61.8%) | 52 (38.2%) |
| 6 to 18 Years | 244 (57.0%) | 191 (44.6%) |
| 19 to 25 Years | 68 (19.5%) | 138 (39.7%) |
| 25 to 34 Years | 56 (21.7%) | 90 (34.9%) |
| 35 to 44 Years | 69 (25.3%) | 144 (52.7%) |
| 45 to 54 Years | 26 (10.8%) | 174 (72.5%) |
| 55 to 64 Years | 81 (28.3%) | 193 (67.5%) |
| 65 to 74 Years | 391 (100.0%) | 231 (59.1%) |
| 75 Years and over | 140 (98.6%) | 117 (82.4%) |
| Total | 1,159 (46.3%) | 1,330 (53.2%) |
Disability Status by Sex by Age in Girard
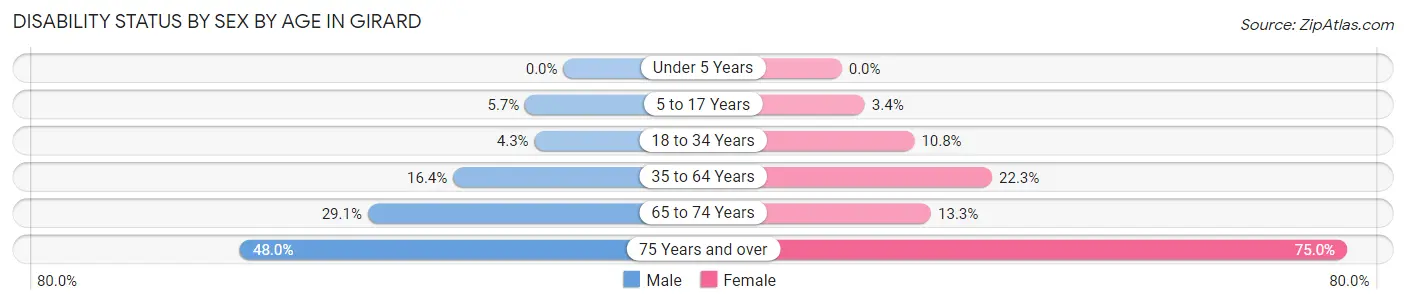
| Age Bracket | Male | Female |
| Under 5 Years | 0 (0.0%) | 0 (0.0%) |
| 5 to 17 Years | 10 (5.7%) | 8 (3.4%) |
| 18 to 34 Years | 16 (4.3%) | 30 (10.8%) |
| 35 to 64 Years | 56 (16.4%) | 102 (22.3%) |
| 65 to 74 Years | 61 (29.0%) | 24 (13.3%) |
| 75 Years and over | 24 (48.0%) | 69 (75.0%) |
Disability Class by Sex by Age in Girard
Disability Class: Hearing Difficulty
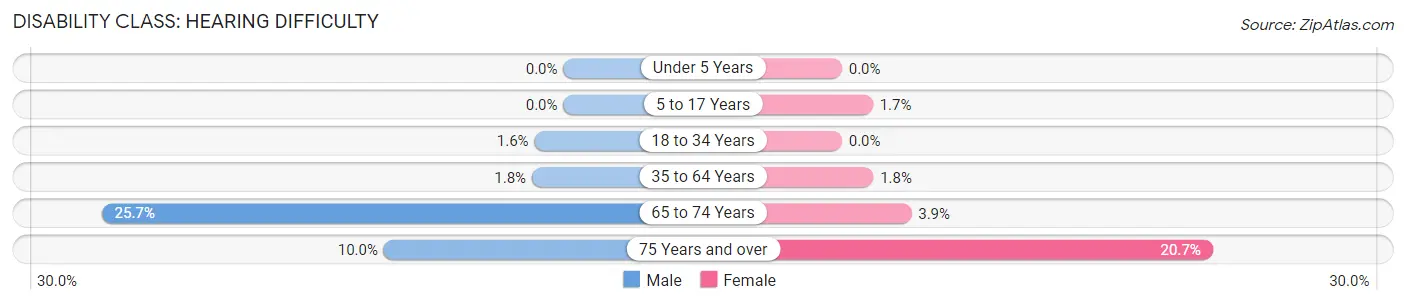
| Age Bracket | Male | Female |
| Under 5 Years | 0 (0.0%) | 0 (0.0%) |
| 5 to 17 Years | 0 (0.0%) | 4 (1.7%) |
| 18 to 34 Years | 6 (1.6%) | 0 (0.0%) |
| 35 to 64 Years | 6 (1.8%) | 8 (1.8%) |
| 65 to 74 Years | 54 (25.7%) | 7 (3.9%) |
| 75 Years and over | 5 (10.0%) | 19 (20.6%) |
Disability Class: Vision Difficulty
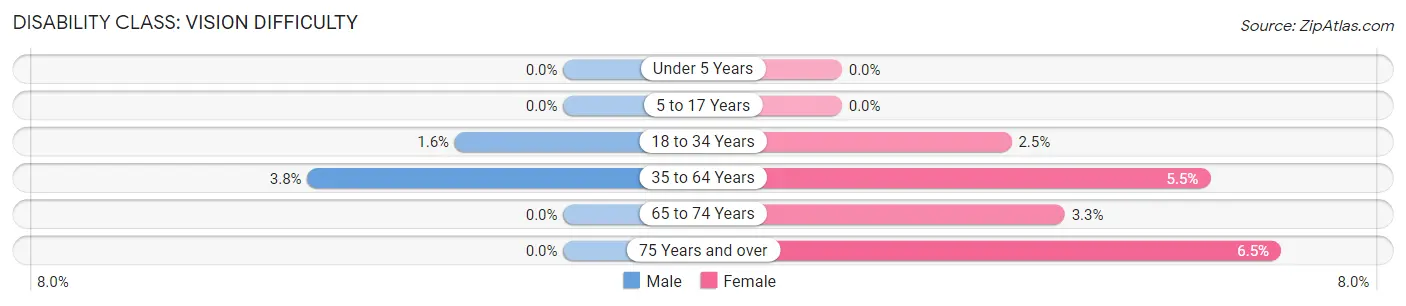
| Age Bracket | Male | Female |
| Under 5 Years | 0 (0.0%) | 0 (0.0%) |
| 5 to 17 Years | 0 (0.0%) | 0 (0.0%) |
| 18 to 34 Years | 6 (1.6%) | 7 (2.5%) |
| 35 to 64 Years | 13 (3.8%) | 25 (5.5%) |
| 65 to 74 Years | 0 (0.0%) | 6 (3.3%) |
| 75 Years and over | 0 (0.0%) | 6 (6.5%) |
Disability Class: Cognitive Difficulty
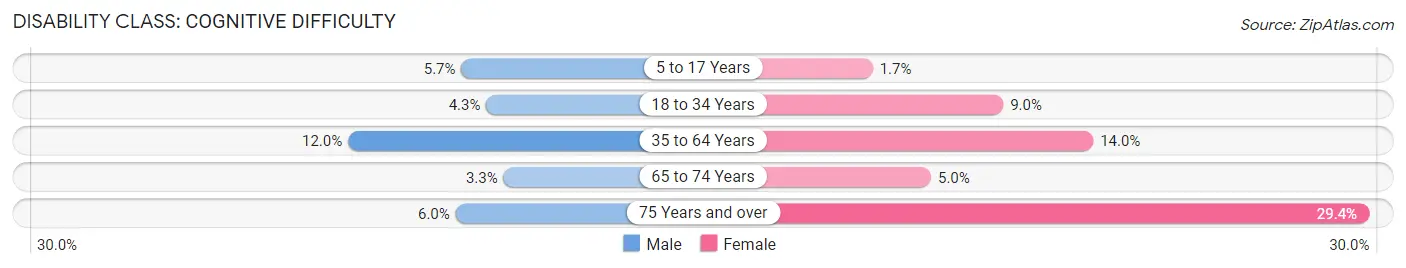
| Age Bracket | Male | Female |
| 5 to 17 Years | 10 (5.7%) | 4 (1.7%) |
| 18 to 34 Years | 16 (4.3%) | 25 (9.0%) |
| 35 to 64 Years | 41 (12.0%) | 64 (14.0%) |
| 65 to 74 Years | 7 (3.3%) | 9 (5.0%) |
| 75 Years and over | 3 (6.0%) | 27 (29.3%) |
Disability Class: Ambulatory Difficulty
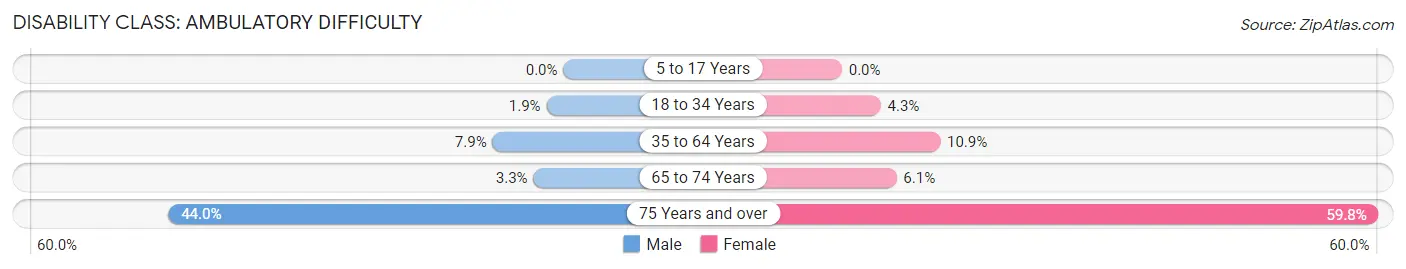
| Age Bracket | Male | Female |
| 5 to 17 Years | 0 (0.0%) | 0 (0.0%) |
| 18 to 34 Years | 7 (1.9%) | 12 (4.3%) |
| 35 to 64 Years | 27 (7.9%) | 50 (10.9%) |
| 65 to 74 Years | 7 (3.3%) | 11 (6.1%) |
| 75 Years and over | 22 (44.0%) | 55 (59.8%) |
Disability Class: Self-Care Difficulty
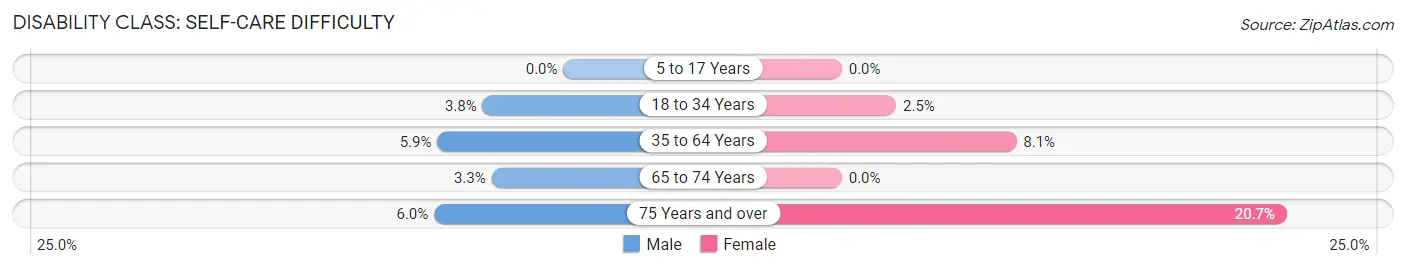
| Age Bracket | Male | Female |
| 5 to 17 Years | 0 (0.0%) | 0 (0.0%) |
| 18 to 34 Years | 14 (3.7%) | 7 (2.5%) |
| 35 to 64 Years | 20 (5.9%) | 37 (8.1%) |
| 65 to 74 Years | 7 (3.3%) | 0 (0.0%) |
| 75 Years and over | 3 (6.0%) | 19 (20.6%) |
Technology Access in Girard
Computing Device Access in Girard
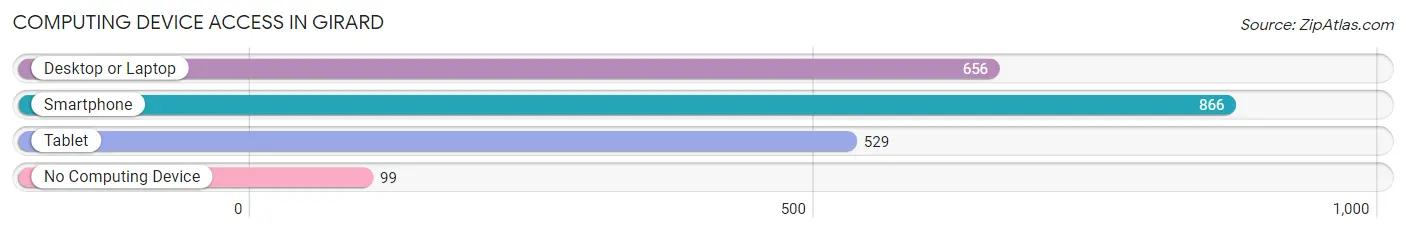
| Device Type | # Households | % Households |
| Desktop or Laptop | 656 | 63.8% |
| Smartphone | 866 | 84.2% |
| Tablet | 529 | 51.5% |
| No Computing Device | 99 | 9.6% |
| Total | 1,028 | 100.0% |
Internet Access in Girard
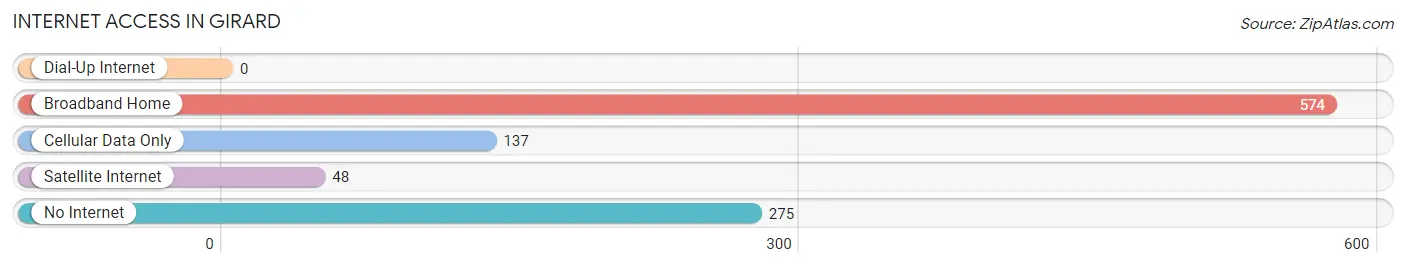
| Internet Type | # Households | % Households |
| Dial-Up Internet | 0 | 0.0% |
| Broadband Home | 574 | 55.8% |
| Cellular Data Only | 137 | 13.3% |
| Satellite Internet | 48 | 4.7% |
| No Internet | 275 | 26.8% |
| Total | 1,028 | 100.0% |
Girard Summary
Girard, Kansas is a small city located in the southeast corner of the state, in Crawford County. It is situated on the banks of the Marais des Cygnes River, and is surrounded by rolling hills and farmland. The city has a population of approximately 2,500 people, and is the county seat of Crawford County.
Girard was founded in 1868 by a group of settlers from Ohio, led by William H. and Mary Ann (Girard) Smith. The city was named after Mary Ann's maiden name. The Smiths were among the first settlers in the area, and they established a trading post and a ferry service across the Marais des Cygnes River.
Girard was incorporated in 1872, and the city quickly grew and prospered. The city was home to a variety of businesses, including a flour mill, a sawmill, a brickyard, a creamery, and a canning factory. The city also had a number of churches, schools, and other civic organizations.
Girard's economy is largely based on agriculture. The city is home to a number of farms, and the surrounding area is known for its production of corn, soybeans, wheat, and other crops. The city also has a number of businesses, including a grocery store, a hardware store, a bank, and a variety of restaurants.
Girard is served by the Crawford County Unified School District, which includes two elementary schools, a middle school, and a high school. The city also has a number of private schools, including a Catholic school and a Christian school.
Girard is home to a number of parks and recreational facilities, including a public swimming pool, a golf course, and a number of parks and trails. The city also has a number of cultural attractions, including the Crawford County Historical Museum, the Girard Opera House, and the Girard Arts Center.
Girard is a diverse city, with a population that is made up of a variety of ethnic and racial backgrounds. The city has a median household income of $37,000, and the median age is 38. The city has a low unemployment rate, and the cost of living is relatively low.
Girard is a small city with a rich history and a bright future. The city is home to a variety of businesses, parks, and cultural attractions, and is a great place to live and work.
Common Questions
What is Per Capita Income in Girard?
Per Capita income in Girard is $24,141.
What is the Median Family Income in Girard?
Median Family Income in Girard is $41,354.
What is the Median Household income in Girard?
Median Household Income in Girard is $38,824.
What is Income or Wage Gap in Girard?
Income or Wage Gap in Girard is 23.7%.
Women in Girard earn 76.3 cents for every dollar earned by a man.
What is Inequality or Gini Index in Girard?
Inequality or Gini Index in Girard is 0.42.
What is the Total Population of Girard?
Total Population of Girard is 2,639.
What is the Total Male Population of Girard?
Total Male Population of Girard is 1,280.
What is the Total Female Population of Girard?
Total Female Population of Girard is 1,359.
What is the Ratio of Males per 100 Females in Girard?
There are 94.19 Males per 100 Females in Girard.
What is the Ratio of Females per 100 Males in Girard?
There are 106.17 Females per 100 Males in Girard.
What is the Median Population Age in Girard?
Median Population Age in Girard is 38.6 Years.
What is the Average Family Size in Girard
Average Family Size in Girard is 3.3 People.
What is the Average Household Size in Girard
Average Household Size in Girard is 2.4 People.
How Large is the Labor Force in Girard?
There are 1,248 People in the Labor Forcein in Girard.
What is the Percentage of People in the Labor Force in Girard?
56.9% of People are in the Labor Force in Girard.
What is the Unemployment Rate in Girard?
Unemployment Rate in Girard is 3.8%.