Galena, KS Map & Demographics
Galena Map
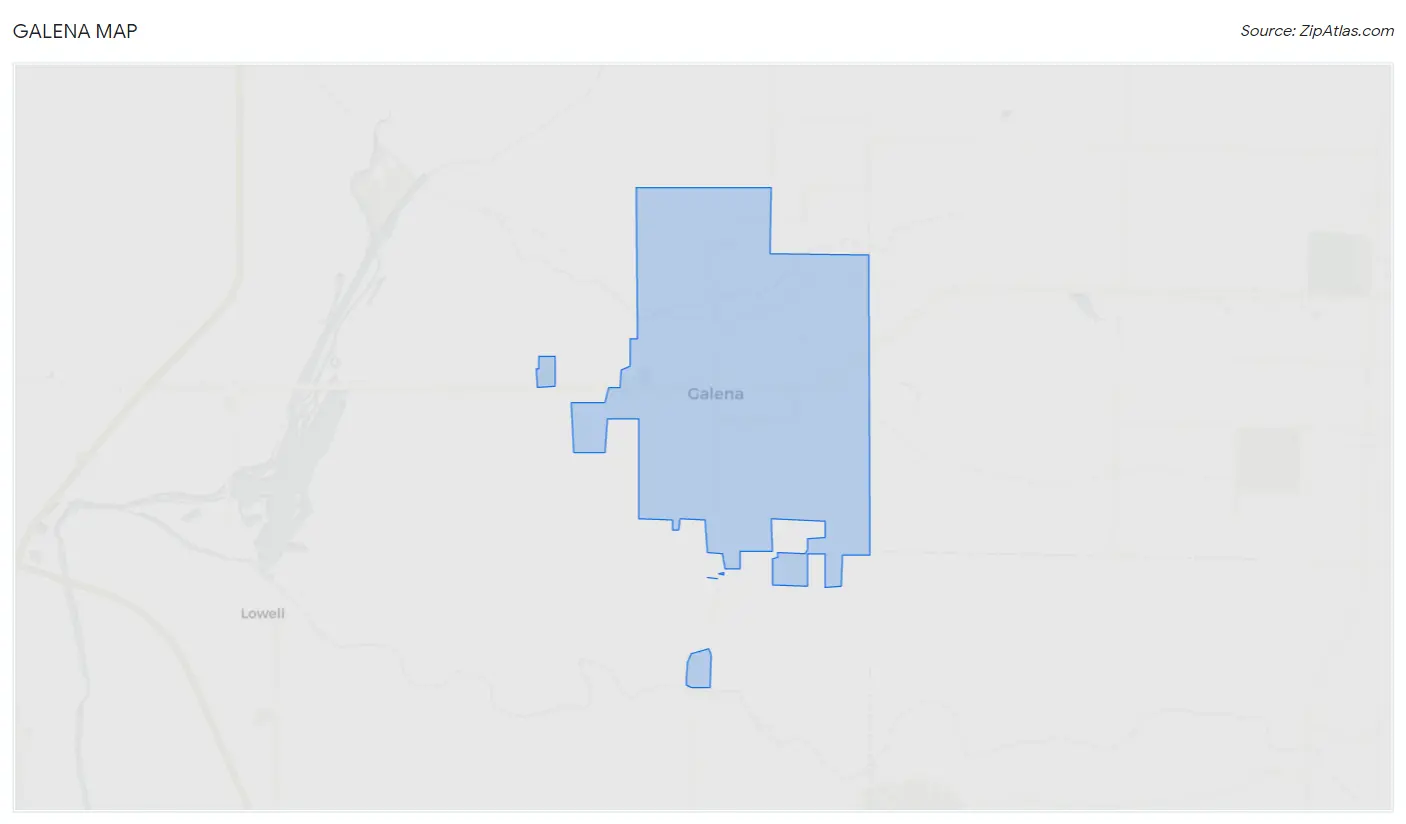
Galena Overview
$23,352
PER CAPITA INCOME
$57,417
AVG FAMILY INCOME
$36,467
AVG HOUSEHOLD INCOME
7.9%
WAGE / INCOME GAP [ % ]
92.1¢/ $1
WAGE / INCOME GAP [ $ ]
0.45
INEQUALITY / GINI INDEX
2,764
TOTAL POPULATION
1,195
MALE POPULATION
1,569
FEMALE POPULATION
76.16
MALES / 100 FEMALES
131.30
FEMALES / 100 MALES
49.8
MEDIAN AGE
3.1
AVG FAMILY SIZE
2.2
AVG HOUSEHOLD SIZE
1,235
LABOR FORCE [ PEOPLE ]
53.1%
PERCENT IN LABOR FORCE
Galena Zip Codes
Galena Area Codes
Income in Galena
Income Overview in Galena
Per Capita Income in Galena is $23,352, while median incomes of families and households are $57,417 and $36,467 respectively.
| Characteristic | Number | Measure |
| Per Capita Income | 2,764 | $23,352 |
| Median Family Income | 665 | $57,417 |
| Mean Family Income | 665 | $61,921 |
| Median Household Income | 1,209 | $36,467 |
| Mean Household Income | 1,209 | $46,718 |
| Income Deficit | 665 | $0 |
| Wage / Income Gap (%) | 2,764 | 7.93% |
| Wage / Income Gap ($) | 2,764 | 92.07¢ per $1 |
| Gini / Inequality Index | 2,764 | 0.45 |
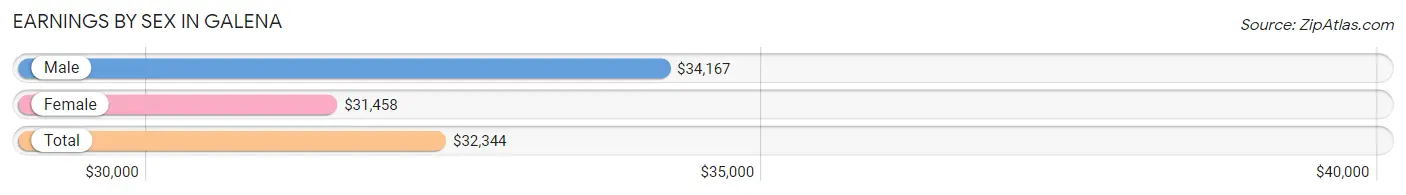
Earnings by Sex in Galena
Average Earnings in Galena are $32,344, $34,167 for men and $31,458 for women, a difference of 7.9%.
| Sex | Number | Average Earnings |
| Male | 622 (45.9%) | $34,167 |
| Female | 732 (54.1%) | $31,458 |
| Total | 1,354 (100.0%) | $32,344 |
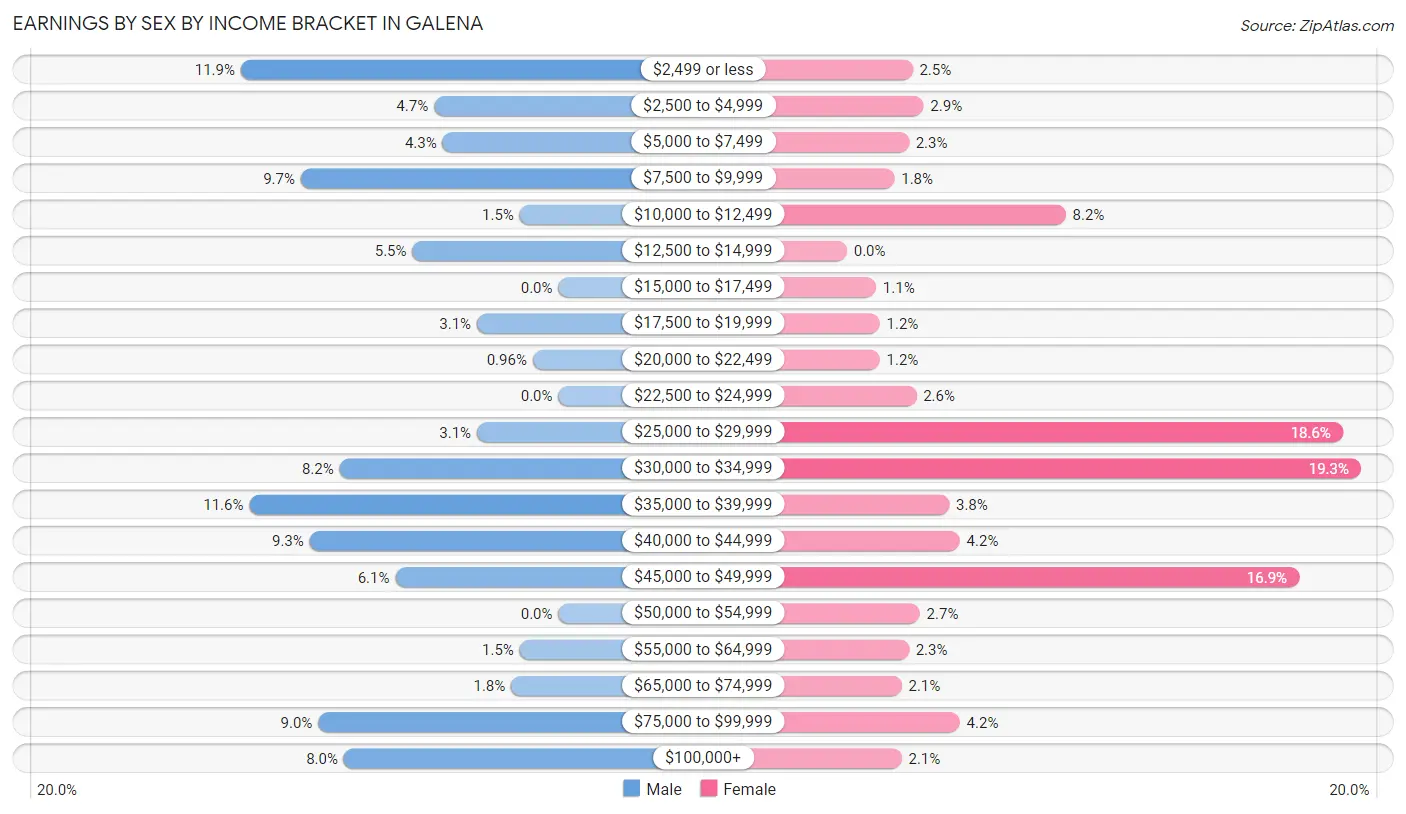
Earnings by Sex by Income Bracket in Galena
The most common earnings brackets in Galena are $2,499 or less for men (74 | 11.9%) and $30,000 to $34,999 for women (141 | 19.3%).
| Income | Male | Female |
| $2,499 or less | 74 (11.9%) | 18 (2.5%) |
| $2,500 to $4,999 | 29 (4.7%) | 21 (2.9%) |
| $5,000 to $7,499 | 27 (4.3%) | 17 (2.3%) |
| $7,500 to $9,999 | 60 (9.7%) | 13 (1.8%) |
| $10,000 to $12,499 | 9 (1.5%) | 60 (8.2%) |
| $12,500 to $14,999 | 34 (5.5%) | 0 (0.0%) |
| $15,000 to $17,499 | 0 (0.0%) | 8 (1.1%) |
| $17,500 to $19,999 | 19 (3.0%) | 9 (1.2%) |
| $20,000 to $22,499 | 6 (1.0%) | 9 (1.2%) |
| $22,500 to $24,999 | 0 (0.0%) | 19 (2.6%) |
| $25,000 to $29,999 | 19 (3.0%) | 136 (18.6%) |
| $30,000 to $34,999 | 51 (8.2%) | 141 (19.3%) |
| $35,000 to $39,999 | 72 (11.6%) | 28 (3.8%) |
| $40,000 to $44,999 | 58 (9.3%) | 31 (4.2%) |
| $45,000 to $49,999 | 38 (6.1%) | 124 (16.9%) |
| $50,000 to $54,999 | 0 (0.0%) | 20 (2.7%) |
| $55,000 to $64,999 | 9 (1.5%) | 17 (2.3%) |
| $65,000 to $74,999 | 11 (1.8%) | 15 (2.1%) |
| $75,000 to $99,999 | 56 (9.0%) | 31 (4.2%) |
| $100,000+ | 50 (8.0%) | 15 (2.1%) |
| Total | 622 (100.0%) | 732 (100.0%) |
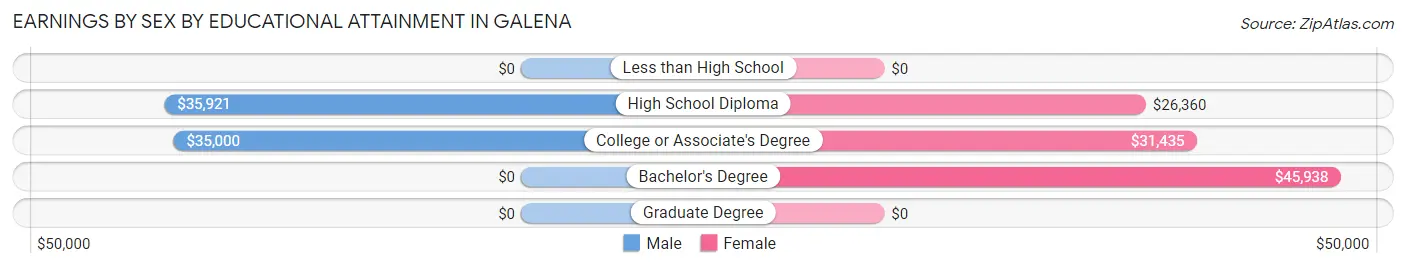
Earnings by Sex by Educational Attainment in Galena
Average earnings in Galena are $37,537 for men and $31,836 for women, a difference of 15.2%. Men with an educational attainment of high school diploma enjoy the highest average annual earnings of $35,921, while those with college or associate's degree education earn the least with $35,000. Women with an educational attainment of bachelor's degree earn the most with the average annual earnings of $45,938, while those with high school diploma education have the smallest earnings of $26,360.
| Educational Attainment | Male Income | Female Income |
| Less than High School | - | - |
| High School Diploma | $35,921 | $26,360 |
| College or Associate's Degree | $35,000 | $31,435 |
| Bachelor's Degree | - | - |
| Graduate Degree | - | - |
| Total | $37,537 | $31,836 |
Family Income in Galena
Family Income Brackets in Galena
According to the Galena family income data, there are 204 families falling into the $50,000 to $74,999 income range, which is the most common income bracket and makes up 30.7% of all families. Conversely, the $200,000+ income bracket is the least frequent group with only 9 families (1.3%) belonging to this category.
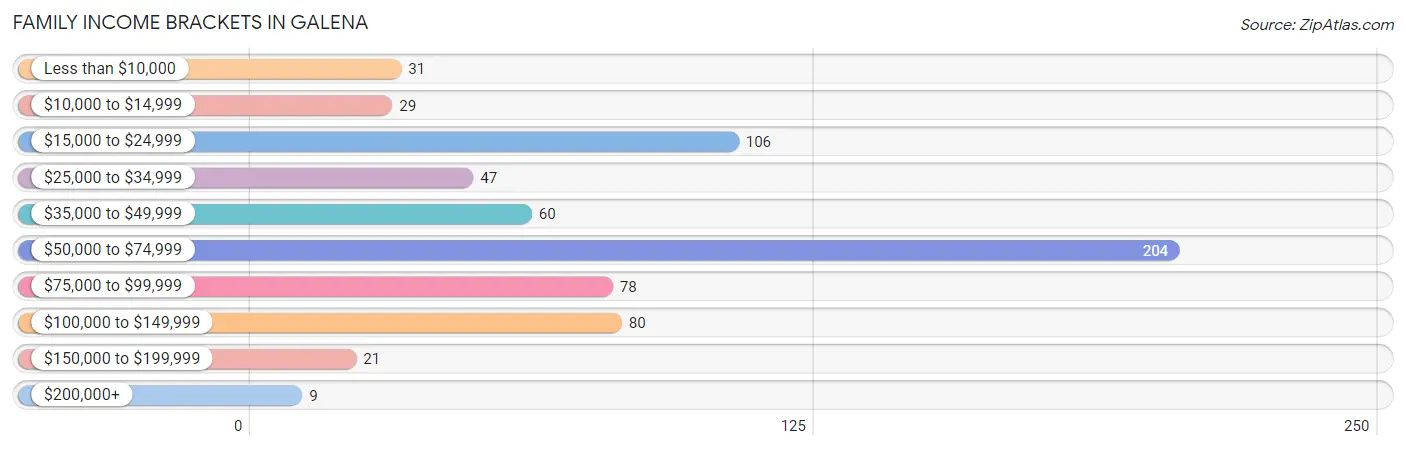
| Income Bracket | # Families | % Families |
| Less than $10,000 | 31 | 4.7% |
| $10,000 to $14,999 | 29 | 4.4% |
| $15,000 to $24,999 | 106 | 15.9% |
| $25,000 to $34,999 | 47 | 7.1% |
| $35,000 to $49,999 | 60 | 9.0% |
| $50,000 to $74,999 | 204 | 30.7% |
| $75,000 to $99,999 | 78 | 11.7% |
| $100,000 to $149,999 | 80 | 12.0% |
| $150,000 to $199,999 | 21 | 3.2% |
| $200,000+ | 9 | 1.4% |
Family Income by Famaliy Size in Galena
4-person families (140 | 21.0%) account for the highest median family income in Galena with $75,063 per family, while 2-person families (363 | 54.6%) have the highest median income of $27,356 per family member.
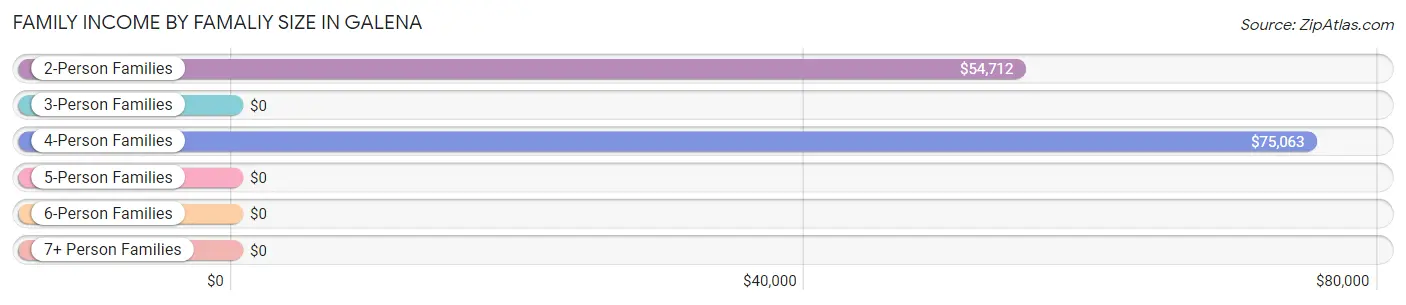
| Income Bracket | # Families | Median Income |
| 2-Person Families | 363 (54.6%) | $54,712 |
| 3-Person Families | 88 (13.2%) | $0 |
| 4-Person Families | 140 (21.0%) | $75,063 |
| 5-Person Families | 60 (9.0%) | $0 |
| 6-Person Families | 14 (2.1%) | $0 |
| 7+ Person Families | 0 (0.0%) | $0 |
| Total | 665 (100.0%) | $57,417 |
Family Income by Number of Earners in Galena
The median family income in Galena is $57,417, with families comprising 3+ earners (56) having the highest median family income of $140,242, while families with 1 earner (253) have the lowest median family income of $38,346, accounting for 8.4% and 38.1% of families, respectively.
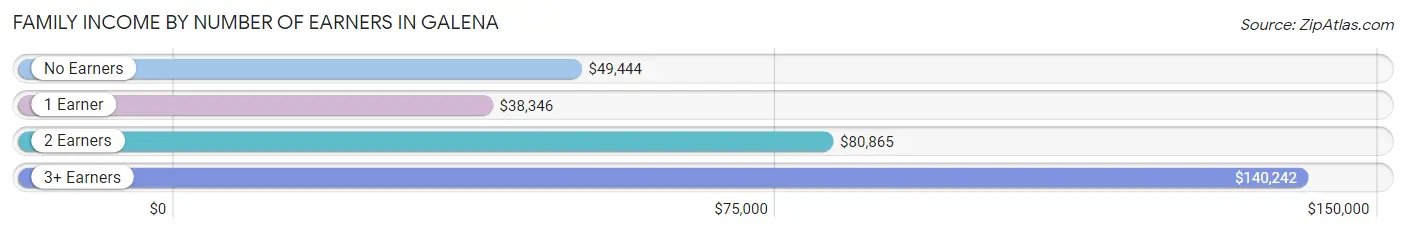
| Number of Earners | # Families | Median Income |
| No Earners | 160 (24.1%) | $49,444 |
| 1 Earner | 253 (38.1%) | $38,346 |
| 2 Earners | 196 (29.5%) | $80,865 |
| 3+ Earners | 56 (8.4%) | $140,242 |
| Total | 665 (100.0%) | $57,417 |
Household Income in Galena
Household Income Brackets in Galena
With 241 households falling in the category, the $35,000 to $49,999 income range is the most frequent in Galena, accounting for 19.9% of all households. In contrast, only 8 households (0.7%) fall into the $200,000+ income bracket, making it the least populous group.
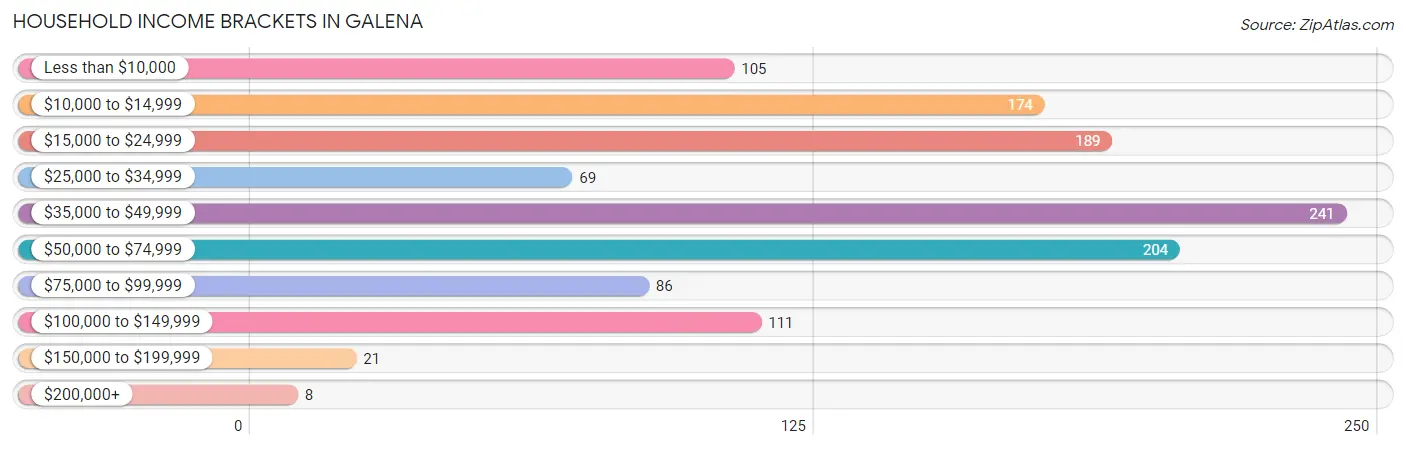
| Income Bracket | # Households | % Households |
| Less than $10,000 | 105 | 8.7% |
| $10,000 to $14,999 | 174 | 14.4% |
| $15,000 to $24,999 | 189 | 15.6% |
| $25,000 to $34,999 | 69 | 5.7% |
| $35,000 to $49,999 | 241 | 19.9% |
| $50,000 to $74,999 | 204 | 16.9% |
| $75,000 to $99,999 | 86 | 7.1% |
| $100,000 to $149,999 | 111 | 9.2% |
| $150,000 to $199,999 | 21 | 1.7% |
| $200,000+ | 8 | 0.7% |
Household Income by Householder Age in Galena
The median household income in Galena is $36,467, with the highest median household income of $49,306 found in the 65+ years age bracket for the primary householder. A total of 393 households (32.5%) fall into this category. Meanwhile, the 45 to 64 years age bracket for the primary householder has the lowest median household income of $21,397, with 399 households (33.0%) in this group.
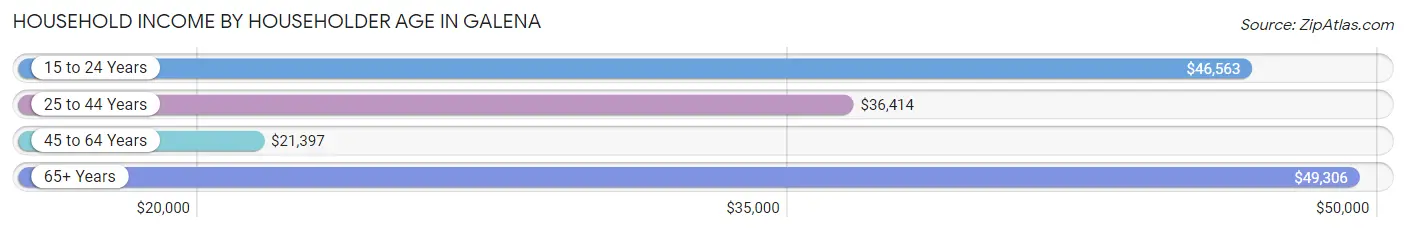
| Income Bracket | # Households | Median Income |
| 15 to 24 Years | 22 (1.8%) | $46,563 |
| 25 to 44 Years | 395 (32.7%) | $36,414 |
| 45 to 64 Years | 399 (33.0%) | $21,397 |
| 65+ Years | 393 (32.5%) | $49,306 |
| Total | 1,209 (100.0%) | $36,467 |
Poverty in Galena
Income Below Poverty by Sex and Age in Galena
With 22.1% poverty level for males and 25.5% for females among the residents of Galena, 6 to 11 year old males and 5 year old females are the most vulnerable to poverty, with 28 males (38.9%) and 11 females (100.0%) in their respective age groups living below the poverty level.
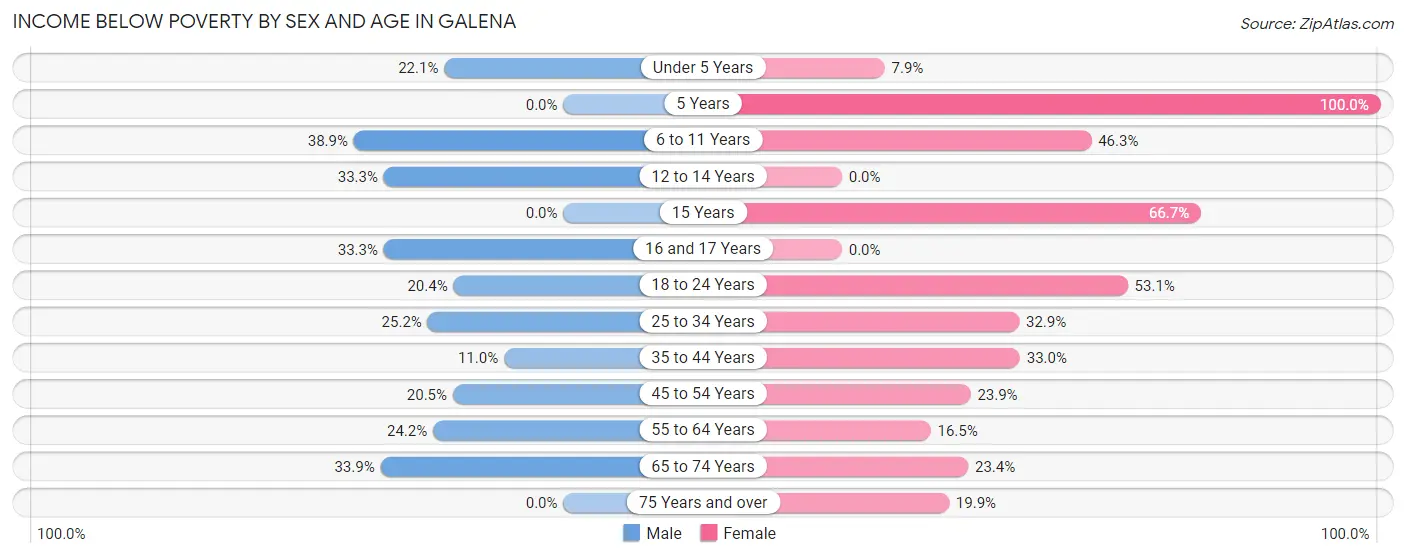
| Age Bracket | Male | Female |
| Under 5 Years | 21 (22.1%) | 10 (7.9%) |
| 5 Years | 0 (0.0%) | 11 (100.0%) |
| 6 to 11 Years | 28 (38.9%) | 25 (46.3%) |
| 12 to 14 Years | 11 (33.3%) | 0 (0.0%) |
| 15 Years | 0 (0.0%) | 12 (66.7%) |
| 16 and 17 Years | 13 (33.3%) | 0 (0.0%) |
| 18 to 24 Years | 21 (20.4%) | 26 (53.1%) |
| 25 to 34 Years | 34 (25.2%) | 76 (32.9%) |
| 35 to 44 Years | 14 (11.0%) | 37 (33.0%) |
| 45 to 54 Years | 40 (20.5%) | 96 (23.9%) |
| 55 to 64 Years | 45 (24.2%) | 30 (16.5%) |
| 65 to 74 Years | 37 (33.9%) | 30 (23.4%) |
| 75 Years and over | 0 (0.0%) | 33 (19.9%) |
| Total | 264 (22.1%) | 386 (25.5%) |
Income Above Poverty by Sex and Age in Galena
According to the poverty statistics in Galena, males aged 75 years and over and females aged 12 to 14 years are the age groups that are most secure financially, with 100.0% of males and 100.0% of females in these age groups living above the poverty line.
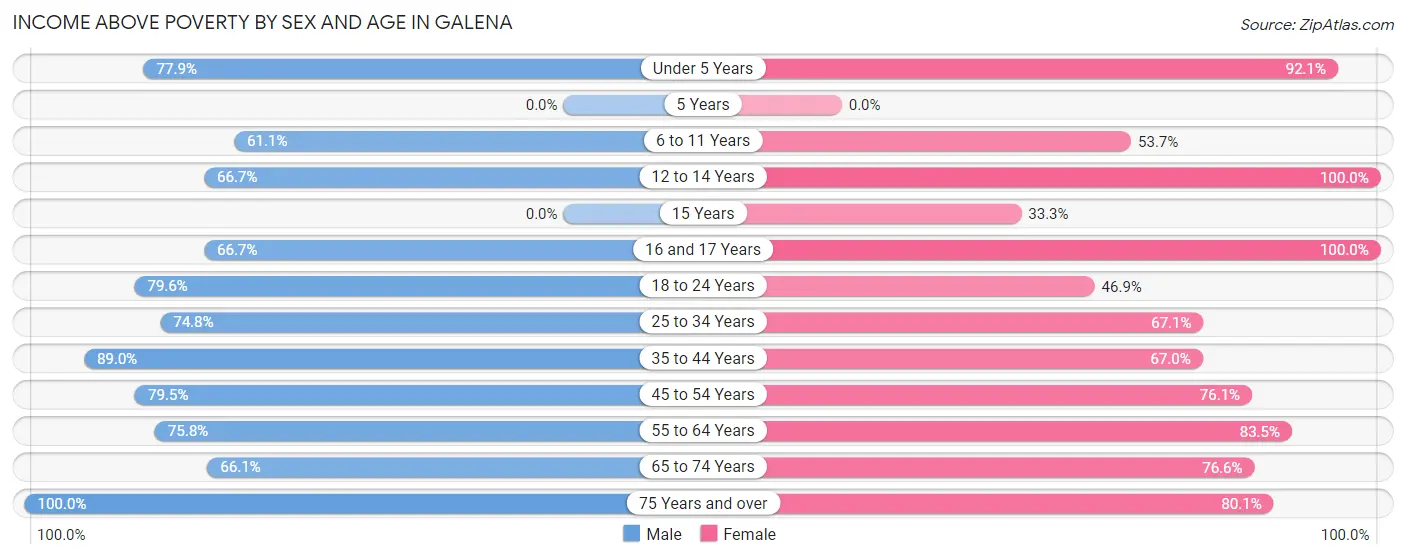
| Age Bracket | Male | Female |
| Under 5 Years | 74 (77.9%) | 116 (92.1%) |
| 5 Years | 0 (0.0%) | 0 (0.0%) |
| 6 to 11 Years | 44 (61.1%) | 29 (53.7%) |
| 12 to 14 Years | 22 (66.7%) | 29 (100.0%) |
| 15 Years | 0 (0.0%) | 6 (33.3%) |
| 16 and 17 Years | 26 (66.7%) | 6 (100.0%) |
| 18 to 24 Years | 82 (79.6%) | 23 (46.9%) |
| 25 to 34 Years | 101 (74.8%) | 155 (67.1%) |
| 35 to 44 Years | 113 (89.0%) | 75 (67.0%) |
| 45 to 54 Years | 155 (79.5%) | 306 (76.1%) |
| 55 to 64 Years | 141 (75.8%) | 152 (83.5%) |
| 65 to 74 Years | 72 (66.1%) | 98 (76.6%) |
| 75 Years and over | 101 (100.0%) | 133 (80.1%) |
| Total | 931 (77.9%) | 1,128 (74.5%) |
Income Below Poverty Among Married-Couple Families in Galena
The poverty statistics for married-couple families in Galena show that 12.1% or 48 of the total 398 families live below the poverty line. Families with 3 or 4 children have the highest poverty rate of 100.0%, comprising of 14 families. On the other hand, families with 1 or 2 children have the lowest poverty rate of 3.4%, which includes 6 families.
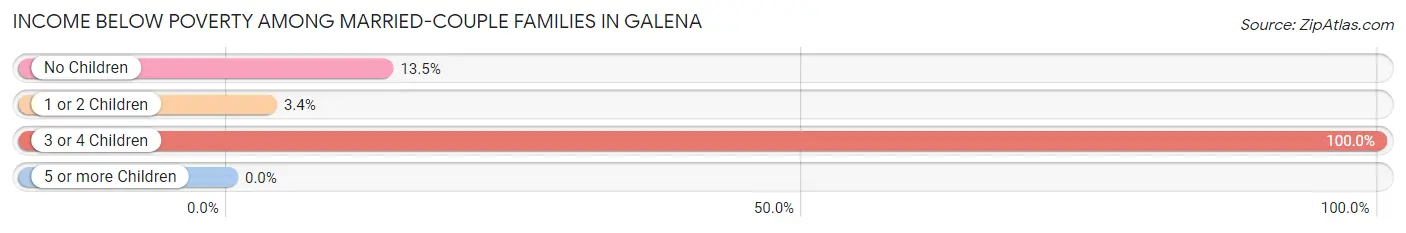
| Children | Above Poverty | Below Poverty |
| No Children | 179 (86.5%) | 28 (13.5%) |
| 1 or 2 Children | 171 (96.6%) | 6 (3.4%) |
| 3 or 4 Children | 0 (0.0%) | 14 (100.0%) |
| 5 or more Children | 0 (0.0%) | 0 (0.0%) |
| Total | 350 (87.9%) | 48 (12.1%) |
Income Below Poverty Among Single-Parent Households in Galena
According to the poverty data in Galena, 29.8% or 31 single-father households and 34.4% or 56 single-mother households are living below the poverty line. Among single-father households, those with 1 or 2 children have the highest poverty rate, with 10 households (100.0%) experiencing poverty. Likewise, among single-mother households, those with 1 or 2 children have the highest poverty rate, with 41 households (50.0%) falling below the poverty line.
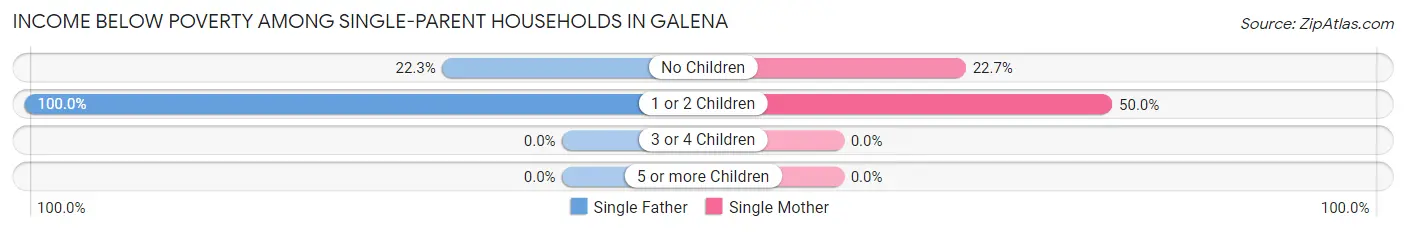
| Children | Single Father | Single Mother |
| No Children | 21 (22.3%) | 15 (22.7%) |
| 1 or 2 Children | 10 (100.0%) | 41 (50.0%) |
| 3 or 4 Children | 0 (0.0%) | 0 (0.0%) |
| 5 or more Children | 0 (0.0%) | 0 (0.0%) |
| Total | 31 (29.8%) | 56 (34.4%) |
Income Below Poverty Among Married-Couple vs Single-Parent Households in Galena
The poverty data for Galena shows that 48 of the married-couple family households (12.1%) and 87 of the single-parent households (32.6%) are living below the poverty level. Within the married-couple family households, those with 3 or 4 children have the highest poverty rate, with 14 households (100.0%) falling below the poverty line. Among the single-parent households, those with 1 or 2 children have the highest poverty rate, with 51 household (55.4%) living below poverty.
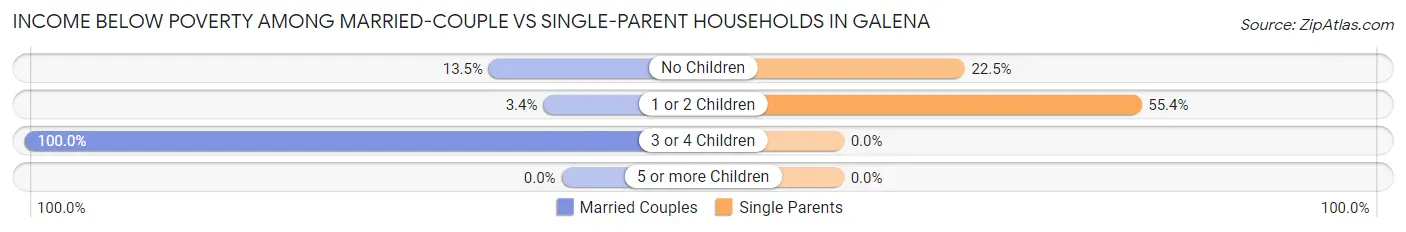
| Children | Married-Couple Families | Single-Parent Households |
| No Children | 28 (13.5%) | 36 (22.5%) |
| 1 or 2 Children | 6 (3.4%) | 51 (55.4%) |
| 3 or 4 Children | 14 (100.0%) | 0 (0.0%) |
| 5 or more Children | 0 (0.0%) | 0 (0.0%) |
| Total | 48 (12.1%) | 87 (32.6%) |
Race in Galena
The most populous races in Galena are White / Caucasian (2,322 | 84.0%), Two or more Races (337 | 12.2%), and Native / Alaskan (105 | 3.8%).
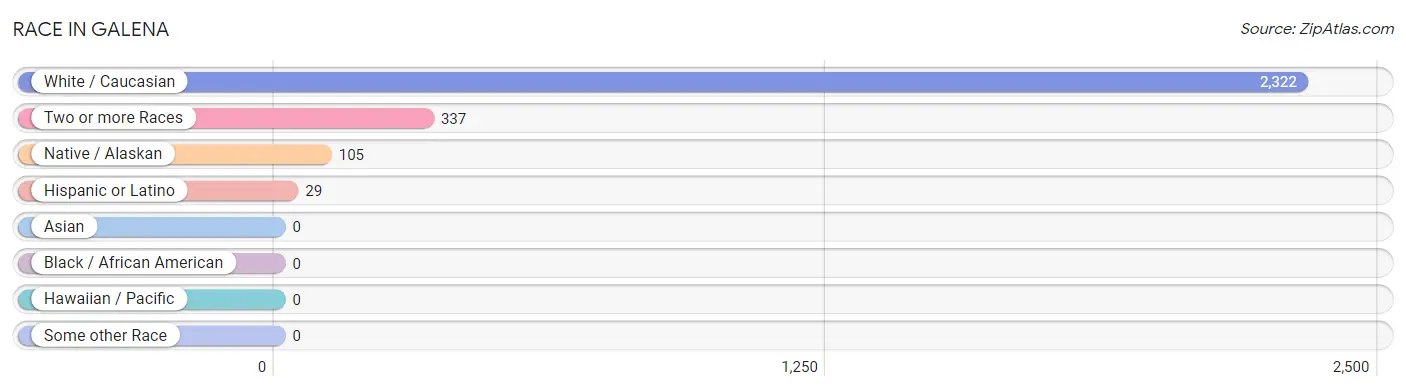
| Race | # Population | % Population |
| Asian | 0 | 0.0% |
| Black / African American | 0 | 0.0% |
| Hawaiian / Pacific | 0 | 0.0% |
| Hispanic or Latino | 29 | 1.1% |
| Native / Alaskan | 105 | 3.8% |
| White / Caucasian | 2,322 | 84.0% |
| Two or more Races | 337 | 12.2% |
| Some other Race | 0 | 0.0% |
| Total | 2,764 | 100.0% |
Ancestry in Galena
The most populous ancestries reported in Galena are German (596 | 21.6%), Irish (579 | 20.9%), American (499 | 18.0%), Cherokee (149 | 5.4%), and English (100 | 3.6%), together accounting for 69.6% of all Galena residents.
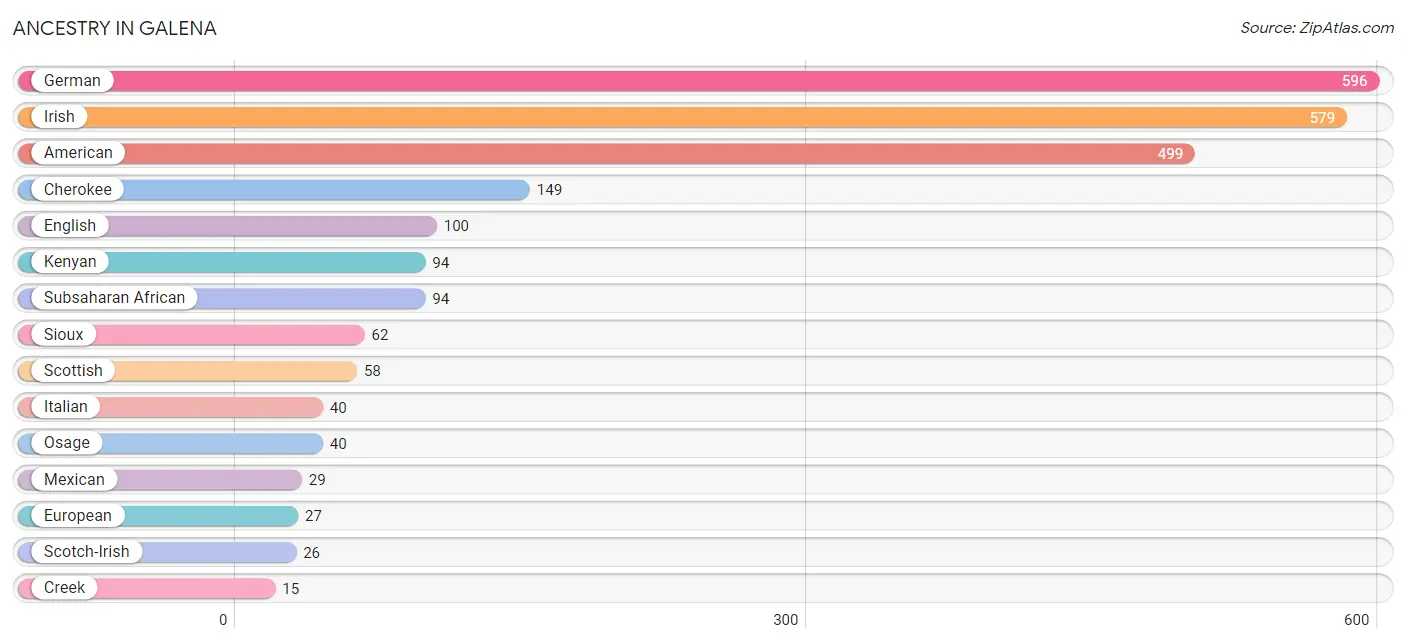
| Ancestry | # Population | % Population |
| Alsatian | 10 | 0.4% |
| American | 499 | 18.0% |
| British | 10 | 0.4% |
| Cherokee | 149 | 5.4% |
| Choctaw | 13 | 0.5% |
| Creek | 15 | 0.5% |
| Dutch | 10 | 0.4% |
| English | 100 | 3.6% |
| European | 27 | 1.0% |
| French | 15 | 0.5% |
| German | 596 | 21.6% |
| Irish | 579 | 20.9% |
| Italian | 40 | 1.5% |
| Kenyan | 94 | 3.4% |
| Mexican | 29 | 1.1% |
| Norwegian | 10 | 0.4% |
| Osage | 40 | 1.5% |
| Scotch-Irish | 26 | 0.9% |
| Scottish | 58 | 2.1% |
| Sioux | 62 | 2.2% |
| Subsaharan African | 94 | 3.4% |
| Swedish | 10 | 0.4% |
| Tlingit-Haida | 15 | 0.5% |
| Welsh | 12 | 0.4% | View All 24 Rows |
Immigrants in Galena
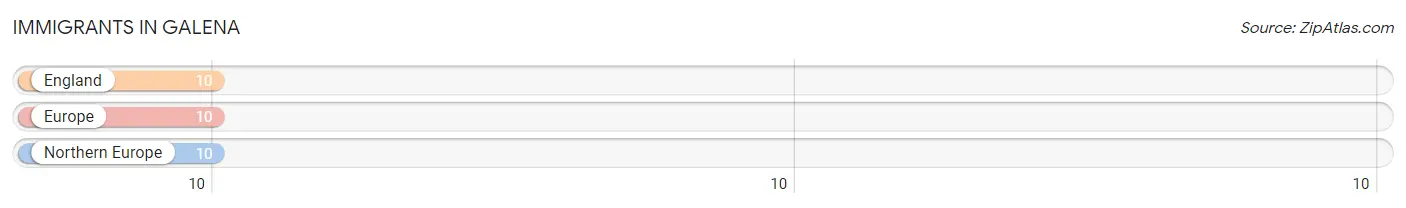
The most numerous immigrant groups reported in Galena came from England (10 | 0.4%), Europe (10 | 0.4%), and Northern Europe (10 | 0.4%), together accounting for 1.1% of all Galena residents.
| Immigration Origin | # Population | % Population |
| England | 10 | 0.4% |
| Europe | 10 | 0.4% |
| Northern Europe | 10 | 0.4% | View All 3 Rows |
Sex and Age in Galena
Sex and Age in Galena
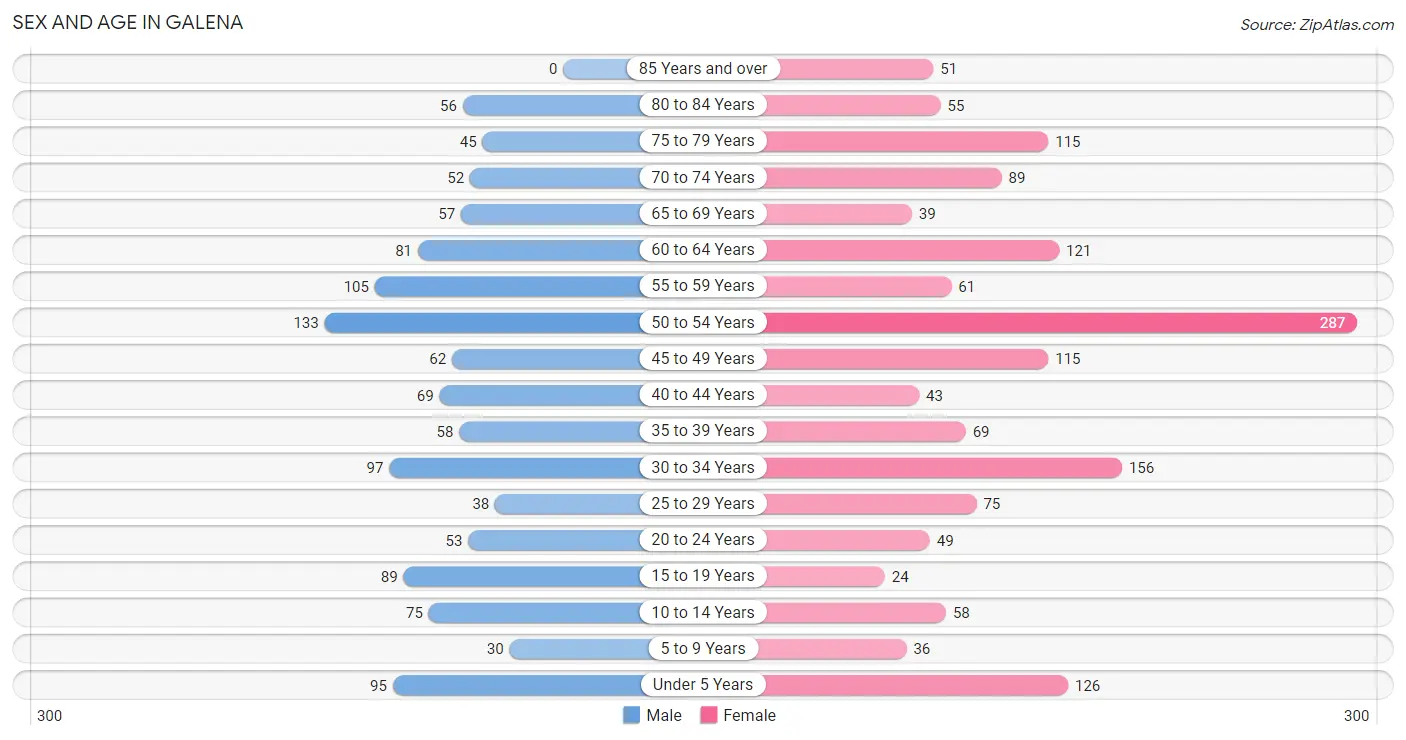
The most populous age groups in Galena are 50 to 54 Years (133 | 11.1%) for men and 50 to 54 Years (287 | 18.3%) for women.
| Age Bracket | Male | Female |
| Under 5 Years | 95 (8.0%) | 126 (8.0%) |
| 5 to 9 Years | 30 (2.5%) | 36 (2.3%) |
| 10 to 14 Years | 75 (6.3%) | 58 (3.7%) |
| 15 to 19 Years | 89 (7.4%) | 24 (1.5%) |
| 20 to 24 Years | 53 (4.4%) | 49 (3.1%) |
| 25 to 29 Years | 38 (3.2%) | 75 (4.8%) |
| 30 to 34 Years | 97 (8.1%) | 156 (9.9%) |
| 35 to 39 Years | 58 (4.9%) | 69 (4.4%) |
| 40 to 44 Years | 69 (5.8%) | 43 (2.7%) |
| 45 to 49 Years | 62 (5.2%) | 115 (7.3%) |
| 50 to 54 Years | 133 (11.1%) | 287 (18.3%) |
| 55 to 59 Years | 105 (8.8%) | 61 (3.9%) |
| 60 to 64 Years | 81 (6.8%) | 121 (7.7%) |
| 65 to 69 Years | 57 (4.8%) | 39 (2.5%) |
| 70 to 74 Years | 52 (4.3%) | 89 (5.7%) |
| 75 to 79 Years | 45 (3.8%) | 115 (7.3%) |
| 80 to 84 Years | 56 (4.7%) | 55 (3.5%) |
| 85 Years and over | 0 (0.0%) | 51 (3.3%) |
| Total | 1,195 (100.0%) | 1,569 (100.0%) |
Families and Households in Galena
Median Family Size in Galena
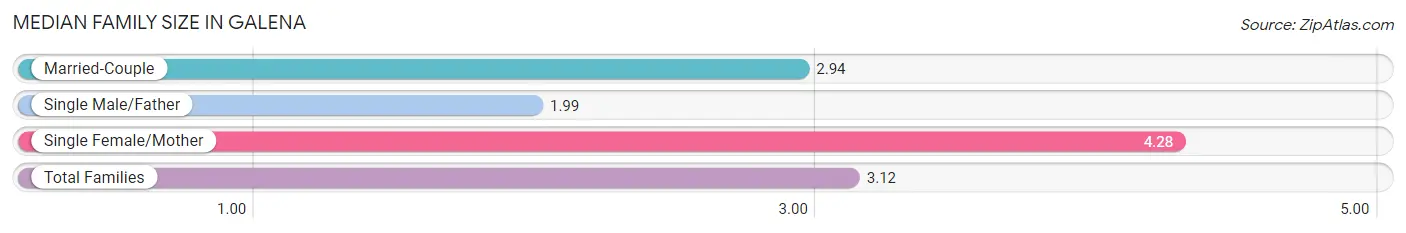
The median family size in Galena is 3.12 persons per family, with single female/mother families (163 | 24.5%) accounting for the largest median family size of 4.28 persons per family. On the other hand, single male/father families (104 | 15.6%) represent the smallest median family size with 1.99 persons per family.
| Family Type | # Families | Family Size |
| Married-Couple | 398 (59.9%) | 2.94 |
| Single Male/Father | 104 (15.6%) | 1.99 |
| Single Female/Mother | 163 (24.5%) | 4.28 |
| Total Families | 665 (100.0%) | 3.12 |
Median Household Size in Galena
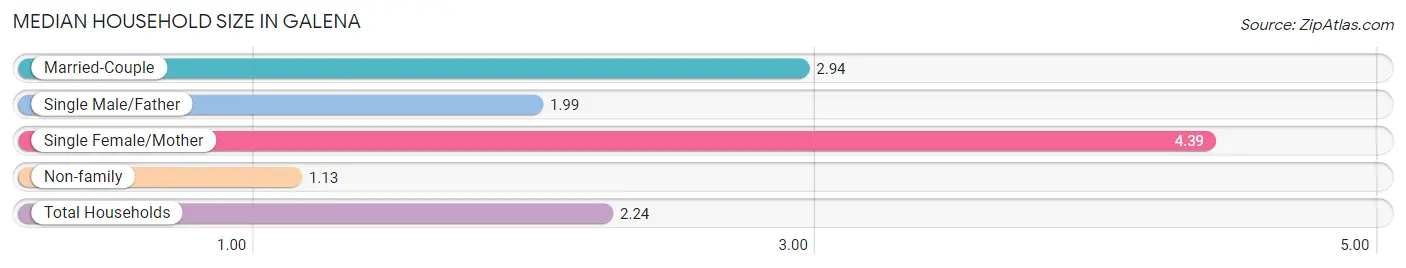
The median household size in Galena is 2.24 persons per household, with single female/mother households (163 | 13.5%) accounting for the largest median household size of 4.39 persons per household. non-family households (544 | 45.0%) represent the smallest median household size with 1.13 persons per household.
| Household Type | # Households | Household Size |
| Married-Couple | 398 (32.9%) | 2.94 |
| Single Male/Father | 104 (8.6%) | 1.99 |
| Single Female/Mother | 163 (13.5%) | 4.39 |
| Non-family | 544 (45.0%) | 1.13 |
| Total Households | 1,209 (100.0%) | 2.24 |
Household Size by Marriage Status in Galena
Out of a total of 1,209 households in Galena, 665 (55.0%) are family households, while 544 (45.0%) are nonfamily households. The most numerous type of family households are 2-person households, comprising 347, and the most common type of nonfamily households are 1-person households, comprising 470.
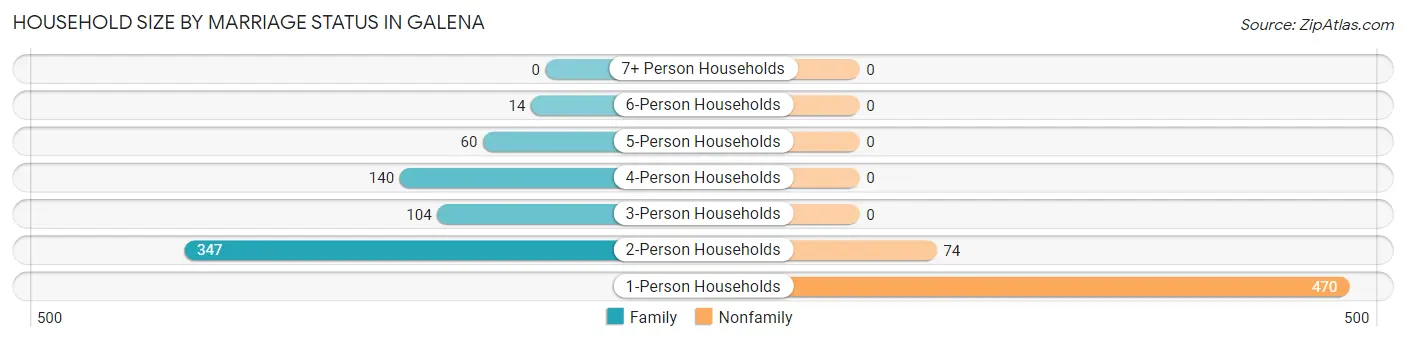
| Household Size | Family Households | Nonfamily Households |
| 1-Person Households | - | 470 (38.9%) |
| 2-Person Households | 347 (28.7%) | 74 (6.1%) |
| 3-Person Households | 104 (8.6%) | 0 (0.0%) |
| 4-Person Households | 140 (11.6%) | 0 (0.0%) |
| 5-Person Households | 60 (5.0%) | 0 (0.0%) |
| 6-Person Households | 14 (1.2%) | 0 (0.0%) |
| 7+ Person Households | 0 (0.0%) | 0 (0.0%) |
| Total | 665 (55.0%) | 544 (45.0%) |
Female Fertility in Galena
Fertility by Age in Galena
Average fertility rate in Galena is 16.0 births per 1,000 women. Women in the age bracket of 20 to 34 years have the highest fertility rate with 36.0 births per 1,000 women. Women in the age bracket of 20 to 34 years acount for 100.0% of all women with births.
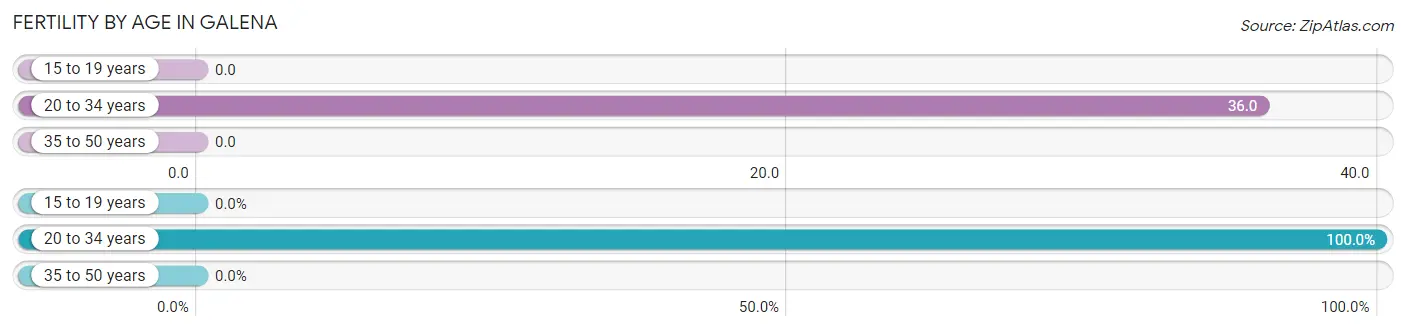
| Age Bracket | Women with Births | Births / 1,000 Women |
| 15 to 19 years | 0 (0.0%) | 0.0 |
| 20 to 34 years | 10 (100.0%) | 36.0 |
| 35 to 50 years | 0 (0.0%) | 0.0 |
| Total | 10 (100.0%) | 16.0 |
Fertility by Age by Marriage Status in Galena
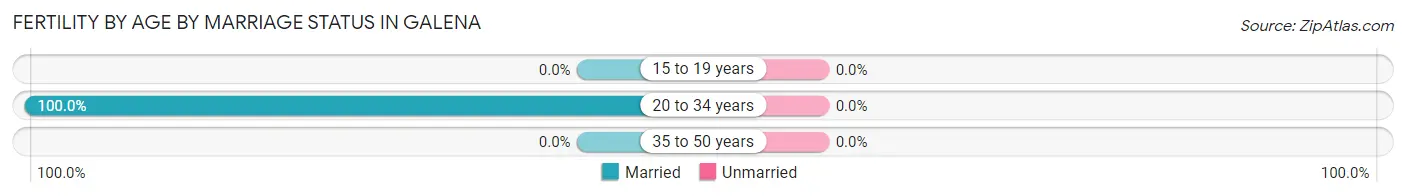
| Age Bracket | Married | Unmarried |
| 15 to 19 years | 0 (0.0%) | 0 (0.0%) |
| 20 to 34 years | 10 (100.0%) | 0 (0.0%) |
| 35 to 50 years | 0 (0.0%) | 0 (0.0%) |
| Total | 10 (100.0%) | 0 (0.0%) |
Fertility by Education in Galena
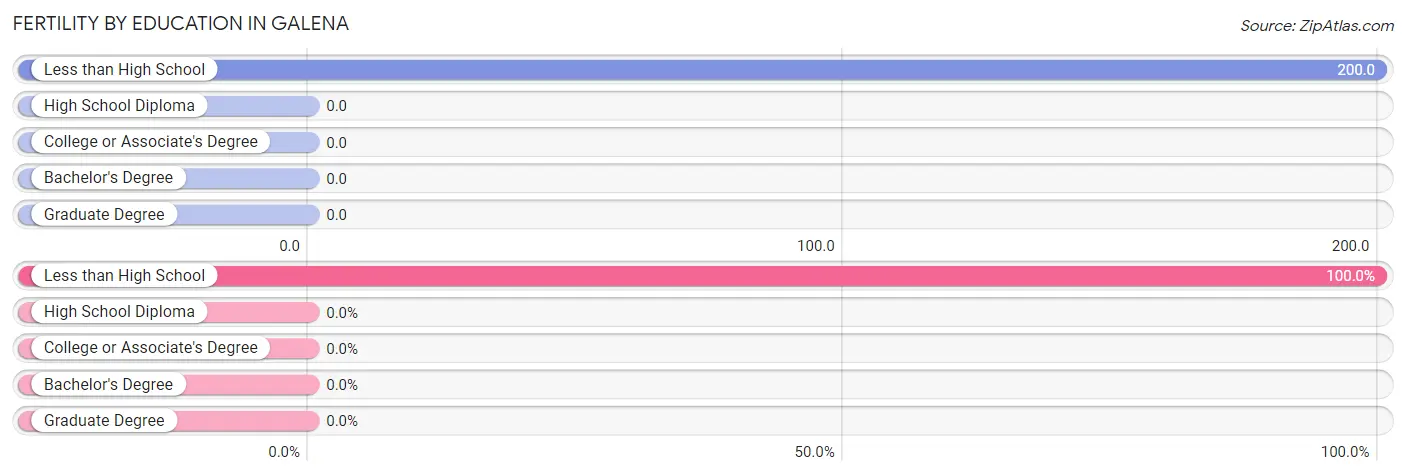
| Educational Attainment | Women with Births | Births / 1,000 Women |
| Less than High School | 10 (100.0%) | 200.0 |
| High School Diploma | 0 (0.0%) | 0.0 |
| College or Associate's Degree | 0 (0.0%) | 0.0 |
| Bachelor's Degree | 0 (0.0%) | 0.0 |
| Graduate Degree | 0 (0.0%) | 0.0 |
| Total | 10 (100.0%) | 16.0 |
Fertility by Education by Marriage Status in Galena
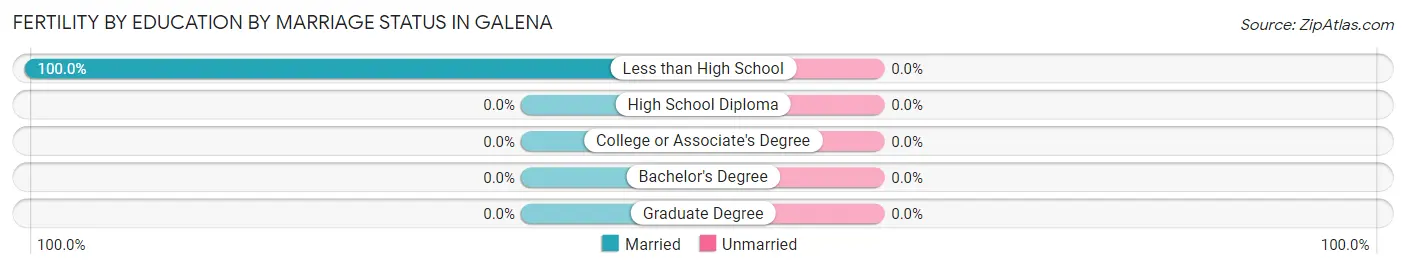
| Educational Attainment | Married | Unmarried |
| Less than High School | 10 (100.0%) | 0 (0.0%) |
| High School Diploma | 0 (0.0%) | 0 (0.0%) |
| College or Associate's Degree | 0 (0.0%) | 0 (0.0%) |
| Bachelor's Degree | 0 (0.0%) | 0 (0.0%) |
| Graduate Degree | 0 (0.0%) | 0 (0.0%) |
| Total | 10 (100.0%) | 0 (0.0%) |
Employment Characteristics in Galena
Employment by Class of Employer in Galena
Among the 1,225 employed individuals in Galena, private company employees (959 | 78.3%), local government employees (114 | 9.3%), and self-employed (not incorporated) (89 | 7.3%) make up the most common classes of employment.
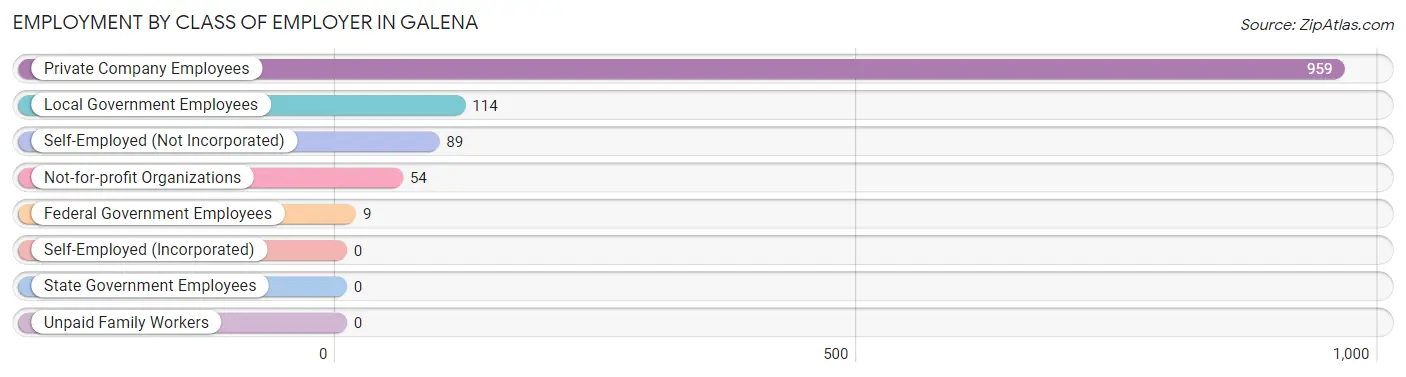
| Employer Class | # Employees | % Employees |
| Private Company Employees | 959 | 78.3% |
| Self-Employed (Incorporated) | 0 | 0.0% |
| Self-Employed (Not Incorporated) | 89 | 7.3% |
| Not-for-profit Organizations | 54 | 4.4% |
| Local Government Employees | 114 | 9.3% |
| State Government Employees | 0 | 0.0% |
| Federal Government Employees | 9 | 0.7% |
| Unpaid Family Workers | 0 | 0.0% |
| Total | 1,225 | 100.0% |
Employment Status by Age in Galena
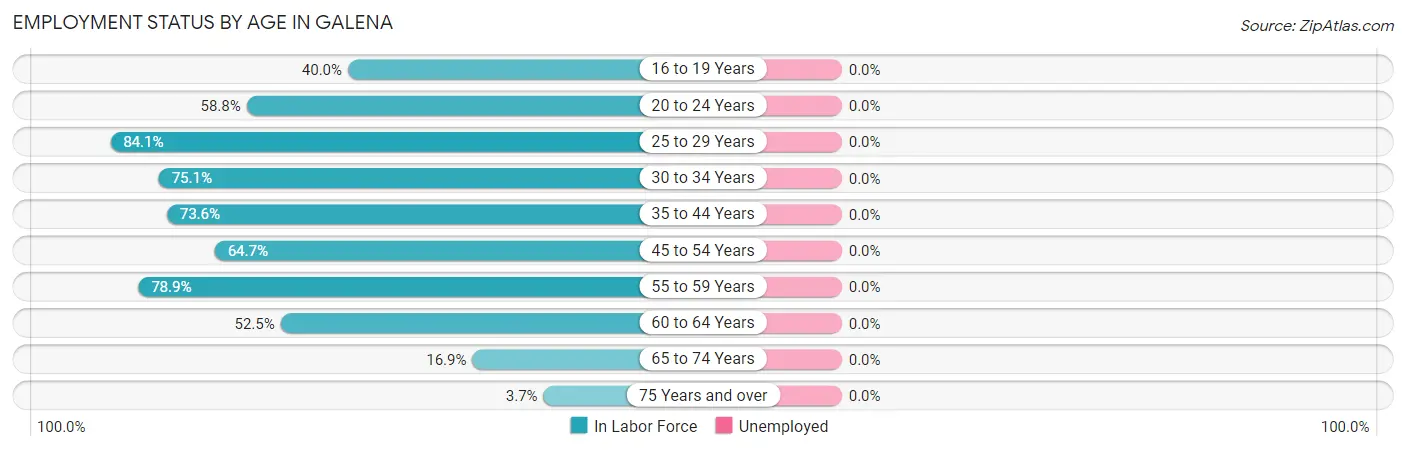
| Age Bracket | In Labor Force | Unemployed |
| 16 to 19 Years | 38 (40.0%) | 0 (0.0%) |
| 20 to 24 Years | 60 (58.8%) | 0 (0.0%) |
| 25 to 29 Years | 95 (84.1%) | 0 (0.0%) |
| 30 to 34 Years | 190 (75.1%) | 0 (0.0%) |
| 35 to 44 Years | 176 (73.6%) | 0 (0.0%) |
| 45 to 54 Years | 386 (64.7%) | 0 (0.0%) |
| 55 to 59 Years | 131 (78.9%) | 0 (0.0%) |
| 60 to 64 Years | 106 (52.5%) | 0 (0.0%) |
| 65 to 74 Years | 40 (16.9%) | 0 (0.0%) |
| 75 Years and over | 12 (3.7%) | 0 (0.0%) |
| Total | 1,235 (53.1%) | 0 (0.0%) |
Employment Status by Educational Attainment in Galena
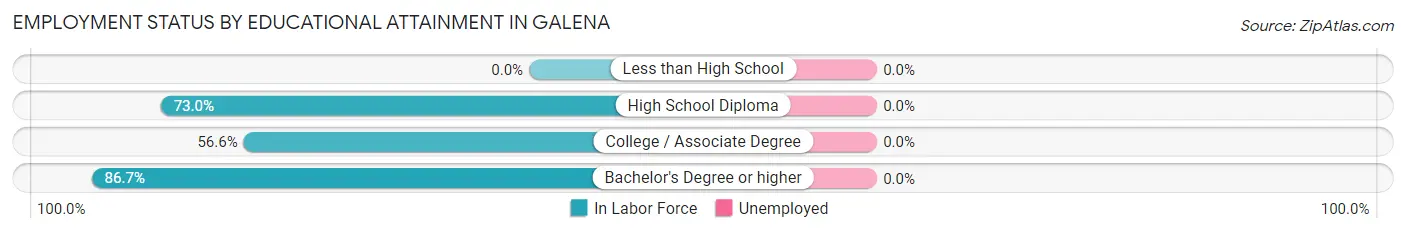
| Educational Attainment | In Labor Force | Unemployed |
| Less than High School | 0 (0.0%) | 0 (0.0%) |
| High School Diploma | 596 (73.0%) | 0 (0.0%) |
| College / Associate Degree | 220 (56.6%) | 0 (0.0%) |
| Bachelor's Degree or higher | 268 (86.7%) | 0 (0.0%) |
| Total | 1,083 (69.0%) | 0 (0.0%) |
Employment Occupations by Sex in Galena
Management, Business, Science and Arts Occupations
The most common Management, Business, Science and Arts occupations in Galena are Management (68 | 5.5%), Community & Social Service (49 | 4.0%), Education Instruction & Library (41 | 3.3%), Health Diagnosing & Treating (41 | 3.3%), and Computers, Engineering & Science (15 | 1.2%).
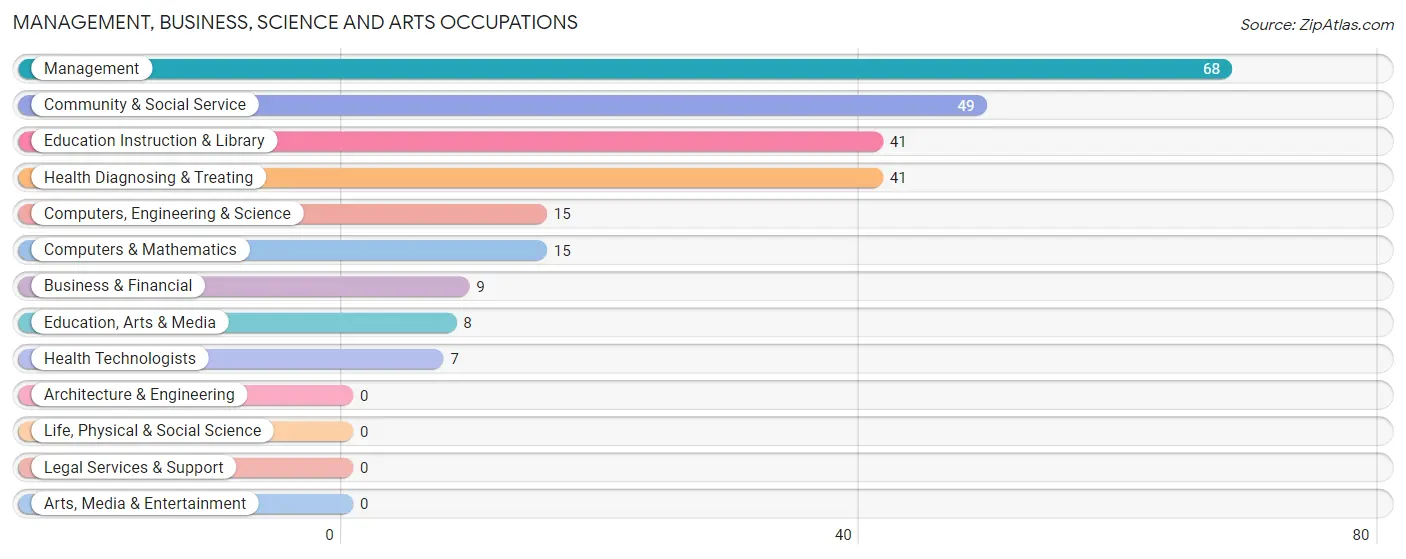
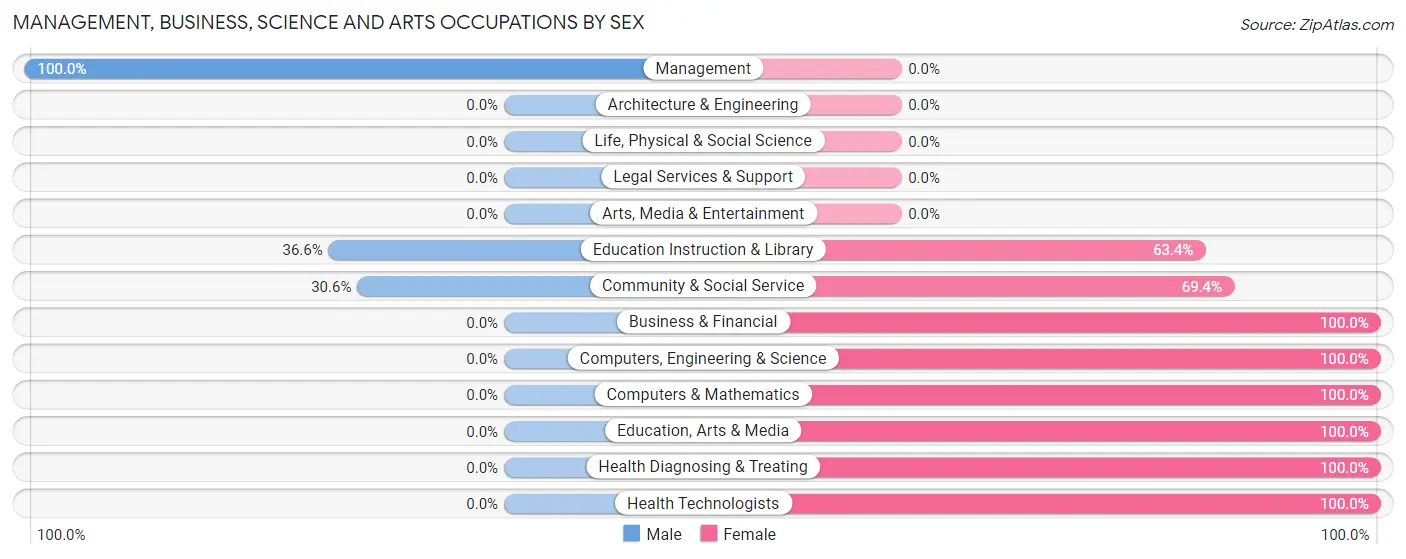
Management, Business, Science and Arts Occupations by Sex
Within the Management, Business, Science and Arts occupations in Galena, the most male-oriented occupations are Management (100.0%), Education Instruction & Library (36.6%), and Community & Social Service (30.6%), while the most female-oriented occupations are Business & Financial (100.0%), Computers, Engineering & Science (100.0%), and Computers & Mathematics (100.0%).
| Occupation | Male | Female |
| Management | 68 (100.0%) | 0 (0.0%) |
| Business & Financial | 0 (0.0%) | 9 (100.0%) |
| Computers, Engineering & Science | 0 (0.0%) | 15 (100.0%) |
| Computers & Mathematics | 0 (0.0%) | 15 (100.0%) |
| Architecture & Engineering | 0 (0.0%) | 0 (0.0%) |
| Life, Physical & Social Science | 0 (0.0%) | 0 (0.0%) |
| Community & Social Service | 15 (30.6%) | 34 (69.4%) |
| Education, Arts & Media | 0 (0.0%) | 8 (100.0%) |
| Legal Services & Support | 0 (0.0%) | 0 (0.0%) |
| Education Instruction & Library | 15 (36.6%) | 26 (63.4%) |
| Arts, Media & Entertainment | 0 (0.0%) | 0 (0.0%) |
| Health Diagnosing & Treating | 0 (0.0%) | 41 (100.0%) |
| Health Technologists | 0 (0.0%) | 7 (100.0%) |
| Total (Category) | 83 (45.6%) | 99 (54.4%) |
| Total (Overall) | 551 (44.7%) | 683 (55.3%) |
Services Occupations
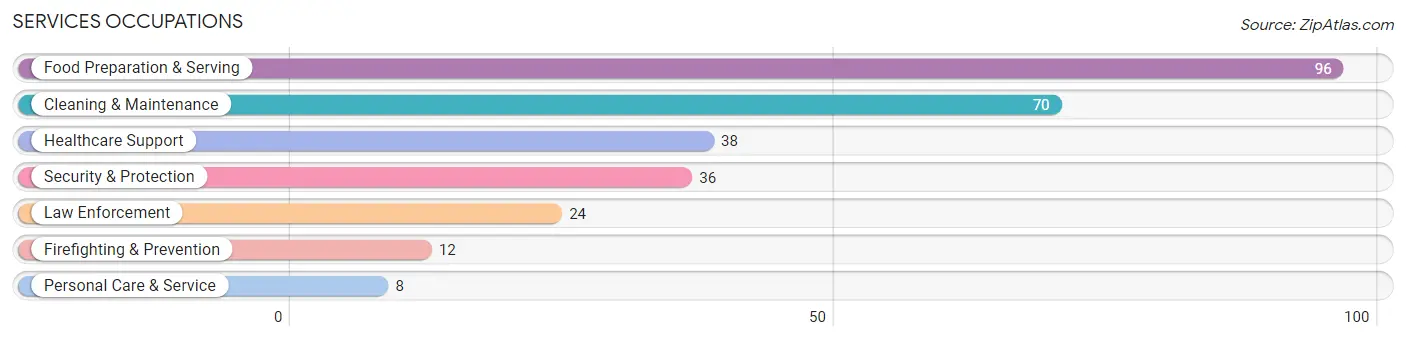
The most common Services occupations in Galena are Food Preparation & Serving (96 | 7.8%), Cleaning & Maintenance (70 | 5.7%), Healthcare Support (38 | 3.1%), Security & Protection (36 | 2.9%), and Law Enforcement (24 | 1.9%).
Services Occupations by Sex
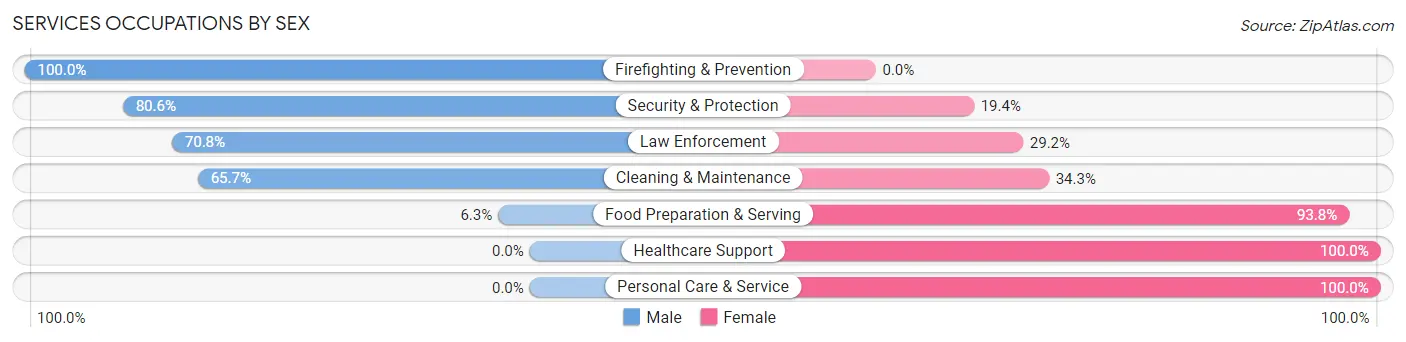
Within the Services occupations in Galena, the most male-oriented occupations are Firefighting & Prevention (100.0%), Security & Protection (80.6%), and Law Enforcement (70.8%), while the most female-oriented occupations are Healthcare Support (100.0%), Personal Care & Service (100.0%), and Food Preparation & Serving (93.8%).
| Occupation | Male | Female |
| Healthcare Support | 0 (0.0%) | 38 (100.0%) |
| Security & Protection | 29 (80.6%) | 7 (19.4%) |
| Firefighting & Prevention | 12 (100.0%) | 0 (0.0%) |
| Law Enforcement | 17 (70.8%) | 7 (29.2%) |
| Food Preparation & Serving | 6 (6.2%) | 90 (93.8%) |
| Cleaning & Maintenance | 46 (65.7%) | 24 (34.3%) |
| Personal Care & Service | 0 (0.0%) | 8 (100.0%) |
| Total (Category) | 81 (32.7%) | 167 (67.3%) |
| Total (Overall) | 551 (44.7%) | 683 (55.3%) |
Sales and Office Occupations
The most common Sales and Office occupations in Galena are Office & Administration (394 | 31.9%), and Sales & Related (55 | 4.5%).
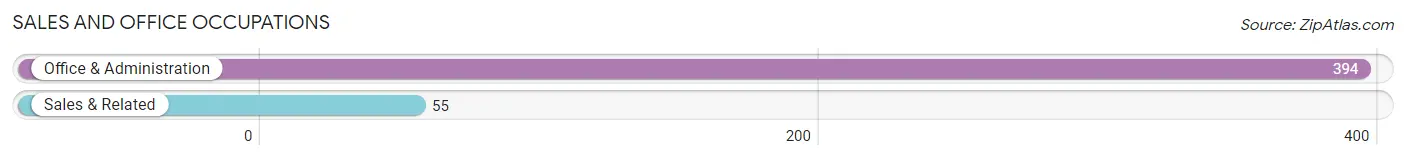
Sales and Office Occupations by Sex

| Occupation | Male | Female |
| Sales & Related | 41 (74.6%) | 14 (25.5%) |
| Office & Administration | 72 (18.3%) | 322 (81.7%) |
| Total (Category) | 113 (25.2%) | 336 (74.8%) |
| Total (Overall) | 551 (44.7%) | 683 (55.3%) |
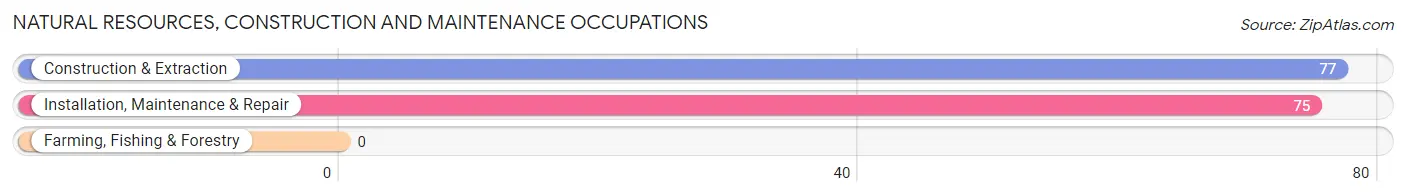
Natural Resources, Construction and Maintenance Occupations
The most common Natural Resources, Construction and Maintenance occupations in Galena are Construction & Extraction (77 | 6.2%), and Installation, Maintenance & Repair (75 | 6.1%).
Natural Resources, Construction and Maintenance Occupations by Sex
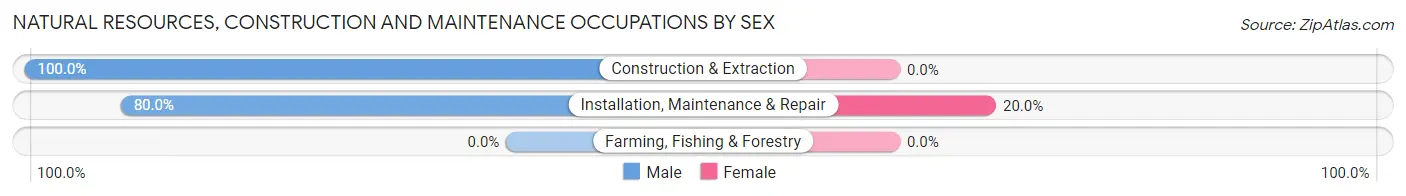
| Occupation | Male | Female |
| Farming, Fishing & Forestry | 0 (0.0%) | 0 (0.0%) |
| Construction & Extraction | 77 (100.0%) | 0 (0.0%) |
| Installation, Maintenance & Repair | 60 (80.0%) | 15 (20.0%) |
| Total (Category) | 137 (90.1%) | 15 (9.9%) |
| Total (Overall) | 551 (44.7%) | 683 (55.3%) |
Production, Transportation and Moving Occupations
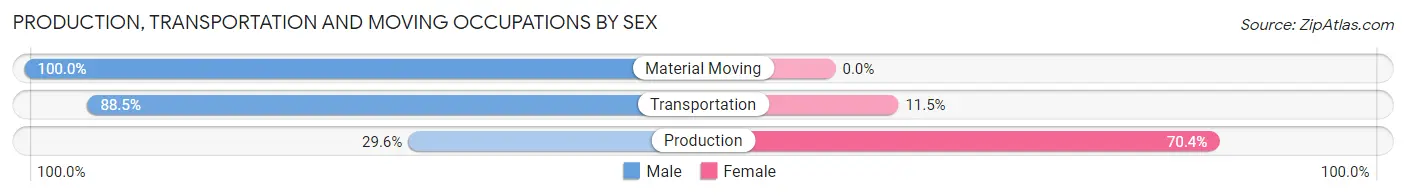
The most common Production, Transportation and Moving occupations in Galena are Production (81 | 6.6%), Transportation (78 | 6.3%), and Material Moving (44 | 3.6%).
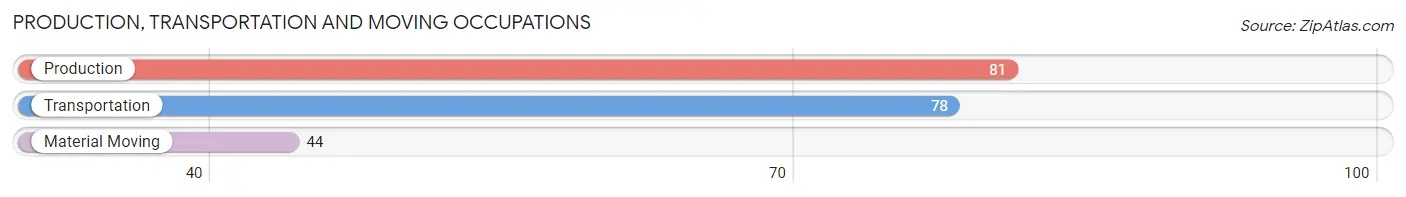
Production, Transportation and Moving Occupations by Sex
| Occupation | Male | Female |
| Production | 24 (29.6%) | 57 (70.4%) |
| Transportation | 69 (88.5%) | 9 (11.5%) |
| Material Moving | 44 (100.0%) | 0 (0.0%) |
| Total (Category) | 137 (67.5%) | 66 (32.5%) |
| Total (Overall) | 551 (44.7%) | 683 (55.3%) |
Employment Industries by Sex in Galena
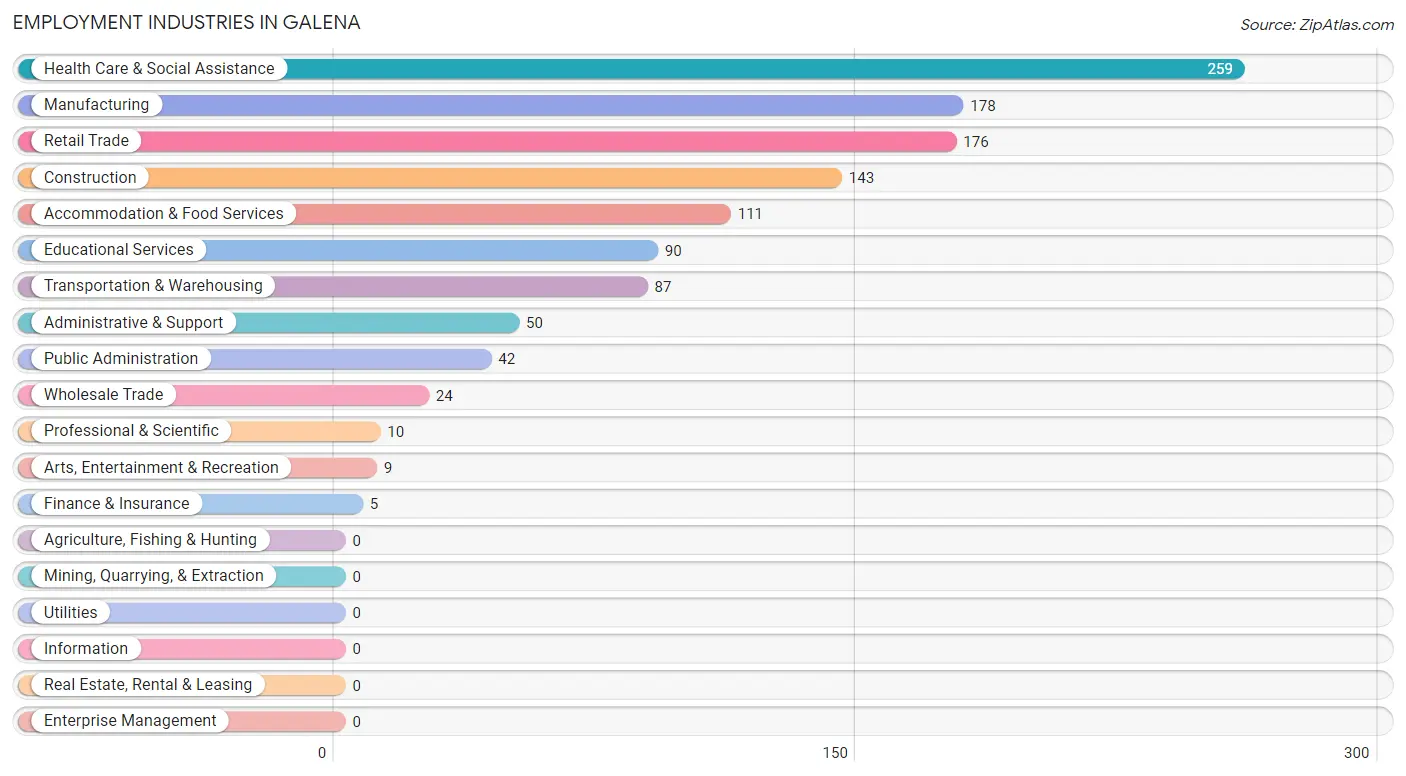
Employment Industries in Galena
The major employment industries in Galena include Health Care & Social Assistance (259 | 21.0%), Manufacturing (178 | 14.4%), Retail Trade (176 | 14.3%), Construction (143 | 11.6%), and Accommodation & Food Services (111 | 9.0%).
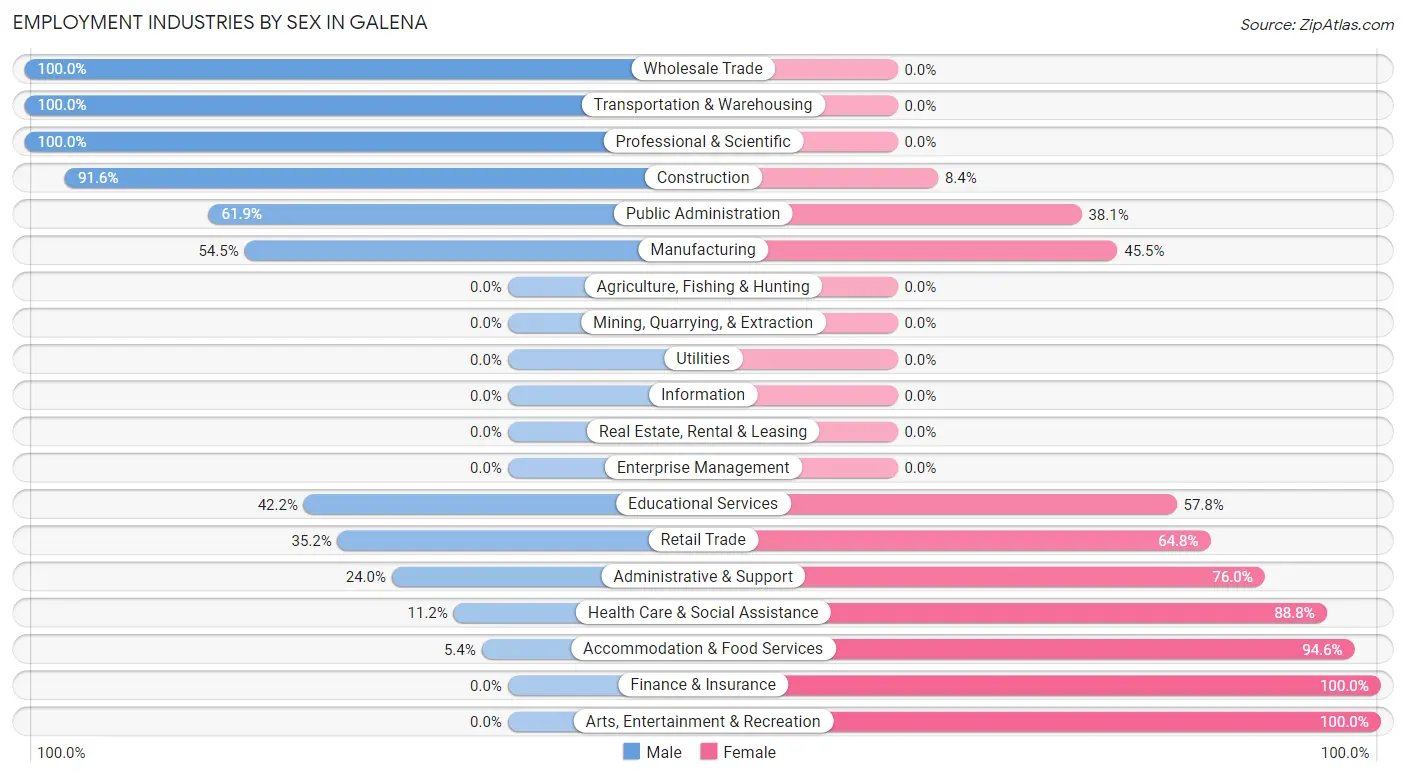
Employment Industries by Sex in Galena
The Galena industries that see more men than women are Wholesale Trade (100.0%), Transportation & Warehousing (100.0%), and Professional & Scientific (100.0%), whereas the industries that tend to have a higher number of women are Finance & Insurance (100.0%), Arts, Entertainment & Recreation (100.0%), and Accommodation & Food Services (94.6%).
| Industry | Male | Female |
| Agriculture, Fishing & Hunting | 0 (0.0%) | 0 (0.0%) |
| Mining, Quarrying, & Extraction | 0 (0.0%) | 0 (0.0%) |
| Construction | 131 (91.6%) | 12 (8.4%) |
| Manufacturing | 97 (54.5%) | 81 (45.5%) |
| Wholesale Trade | 24 (100.0%) | 0 (0.0%) |
| Retail Trade | 62 (35.2%) | 114 (64.8%) |
| Transportation & Warehousing | 87 (100.0%) | 0 (0.0%) |
| Utilities | 0 (0.0%) | 0 (0.0%) |
| Information | 0 (0.0%) | 0 (0.0%) |
| Finance & Insurance | 0 (0.0%) | 5 (100.0%) |
| Real Estate, Rental & Leasing | 0 (0.0%) | 0 (0.0%) |
| Professional & Scientific | 10 (100.0%) | 0 (0.0%) |
| Enterprise Management | 0 (0.0%) | 0 (0.0%) |
| Administrative & Support | 12 (24.0%) | 38 (76.0%) |
| Educational Services | 38 (42.2%) | 52 (57.8%) |
| Health Care & Social Assistance | 29 (11.2%) | 230 (88.8%) |
| Arts, Entertainment & Recreation | 0 (0.0%) | 9 (100.0%) |
| Accommodation & Food Services | 6 (5.4%) | 105 (94.6%) |
| Public Administration | 26 (61.9%) | 16 (38.1%) |
| Total | 551 (44.7%) | 683 (55.3%) |
Education in Galena
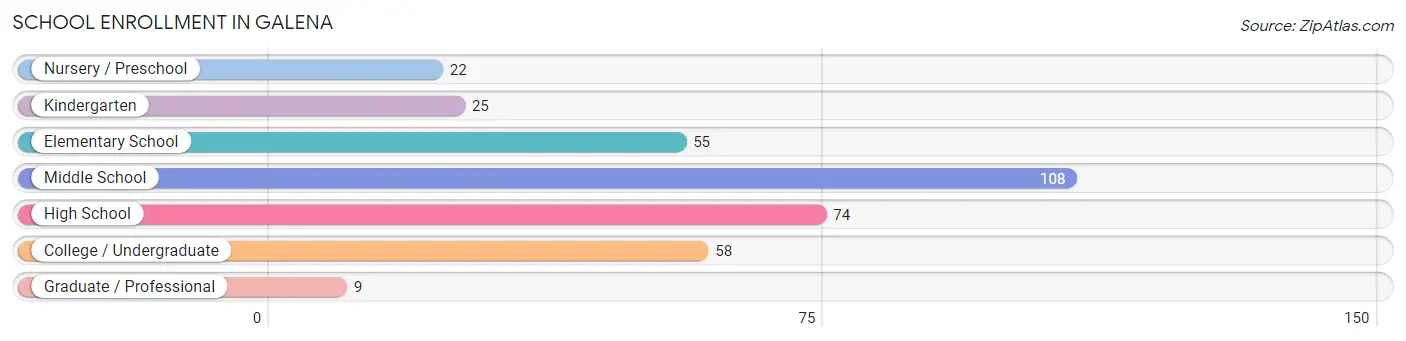
School Enrollment in Galena
The most common levels of schooling among the 351 students in Galena are middle school (108 | 30.8%), high school (74 | 21.1%), and college / undergraduate (58 | 16.5%).
| School Level | # Students | % Students |
| Nursery / Preschool | 22 | 6.3% |
| Kindergarten | 25 | 7.1% |
| Elementary School | 55 | 15.7% |
| Middle School | 108 | 30.8% |
| High School | 74 | 21.1% |
| College / Undergraduate | 58 | 16.5% |
| Graduate / Professional | 9 | 2.6% |
| Total | 351 | 100.0% |
School Enrollment by Age by Funding Source in Galena
Out of a total of 351 students who are enrolled in schools in Galena, 13 (3.7%) attend a private institution, while the remaining 338 (96.3%) are enrolled in public schools. The age group of 15 to 17 year olds has the highest likelihood of being enrolled in private schools, with 13 (20.6% in the age bracket) enrolled. Conversely, the age group of 3 to 4 year olds has the lowest likelihood of being enrolled in a private school, with 22 (100.0% in the age bracket) attending a public institution.
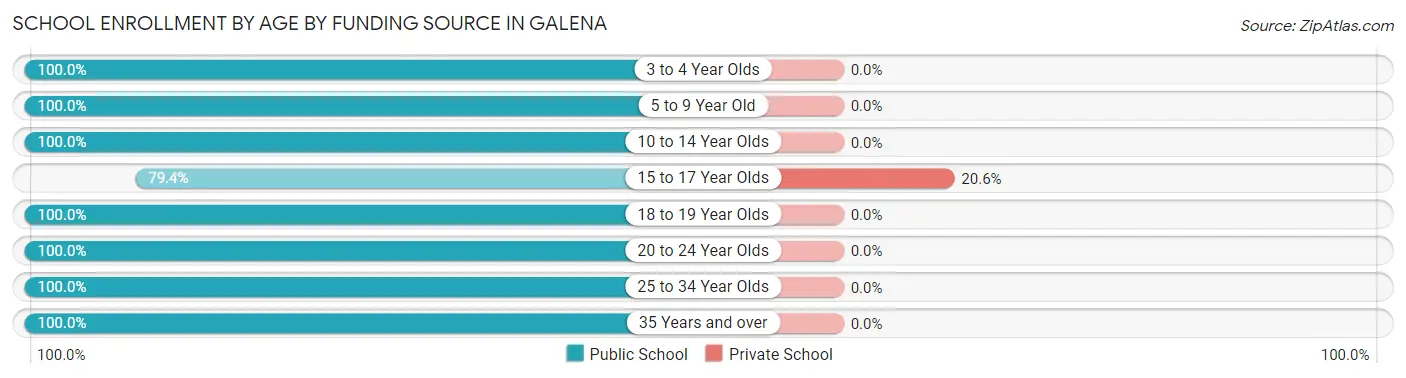
| Age Bracket | Public School | Private School |
| 3 to 4 Year Olds | 22 (100.0%) | 0 (0.0%) |
| 5 to 9 Year Old | 66 (100.0%) | 0 (0.0%) |
| 10 to 14 Year Olds | 133 (100.0%) | 0 (0.0%) |
| 15 to 17 Year Olds | 50 (79.4%) | 13 (20.6%) |
| 18 to 19 Year Olds | 26 (100.0%) | 0 (0.0%) |
| 20 to 24 Year Olds | 23 (100.0%) | 0 (0.0%) |
| 25 to 34 Year Olds | 9 (100.0%) | 0 (0.0%) |
| 35 Years and over | 9 (100.0%) | 0 (0.0%) |
| Total | 338 (96.3%) | 13 (3.7%) |
Educational Attainment by Field of Study in Galena
Education (177 | 47.2%), business (50 | 13.3%), arts & humanities (43 | 11.5%), social sciences (34 | 9.1%), and communications (14 | 3.7%) are the most common fields of study among 375 individuals in Galena who have obtained a bachelor's degree or higher.
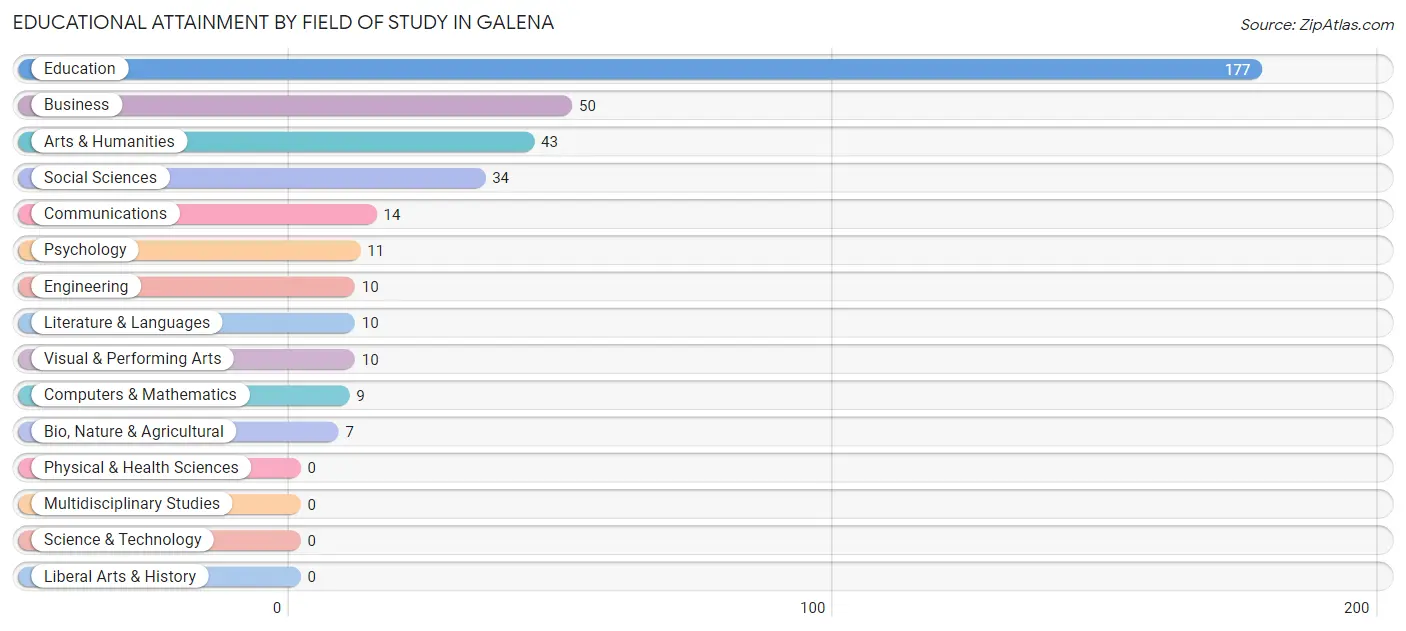
| Field of Study | # Graduates | % Graduates |
| Computers & Mathematics | 9 | 2.4% |
| Bio, Nature & Agricultural | 7 | 1.9% |
| Physical & Health Sciences | 0 | 0.0% |
| Psychology | 11 | 2.9% |
| Social Sciences | 34 | 9.1% |
| Engineering | 10 | 2.7% |
| Multidisciplinary Studies | 0 | 0.0% |
| Science & Technology | 0 | 0.0% |
| Business | 50 | 13.3% |
| Education | 177 | 47.2% |
| Literature & Languages | 10 | 2.7% |
| Liberal Arts & History | 0 | 0.0% |
| Visual & Performing Arts | 10 | 2.7% |
| Communications | 14 | 3.7% |
| Arts & Humanities | 43 | 11.5% |
| Total | 375 | 100.0% |
Transportation & Commute in Galena
Vehicle Availability by Sex in Galena
The most prevalent vehicle ownership categories in Galena are males with 1 vehicle (200, accounting for 36.3%) and females with 1 vehicle (197, making up 29.7%).
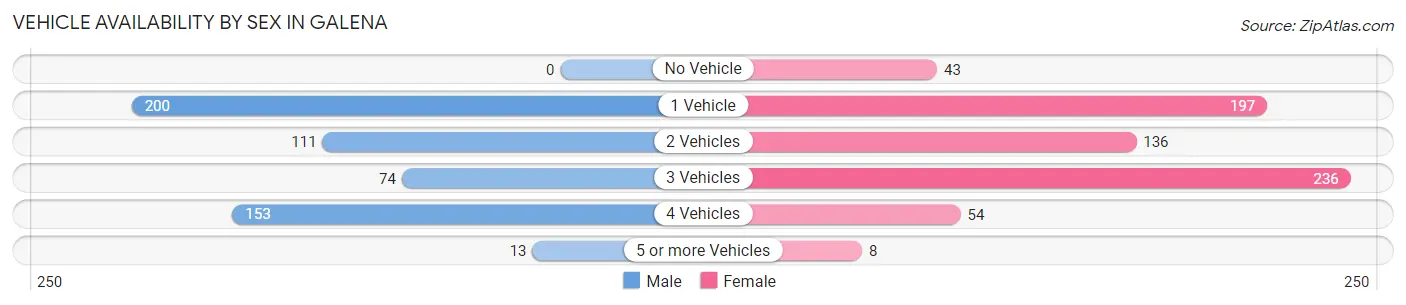
| Vehicles Available | Male | Female |
| No Vehicle | 0 (0.0%) | 43 (6.4%) |
| 1 Vehicle | 200 (36.3%) | 197 (29.2%) |
| 2 Vehicles | 111 (20.2%) | 136 (20.2%) |
| 3 Vehicles | 74 (13.4%) | 236 (35.0%) |
| 4 Vehicles | 153 (27.8%) | 54 (8.0%) |
| 5 or more Vehicles | 13 (2.4%) | 8 (1.2%) |
| Total | 551 (100.0%) | 674 (100.0%) |
Commute Time in Galena
The most frequently occuring commute durations in Galena are 10 to 14 minutes (281 commuters, 24.0%), less than 5 minutes (271 commuters, 23.1%), and 20 to 24 minutes (190 commuters, 16.2%).
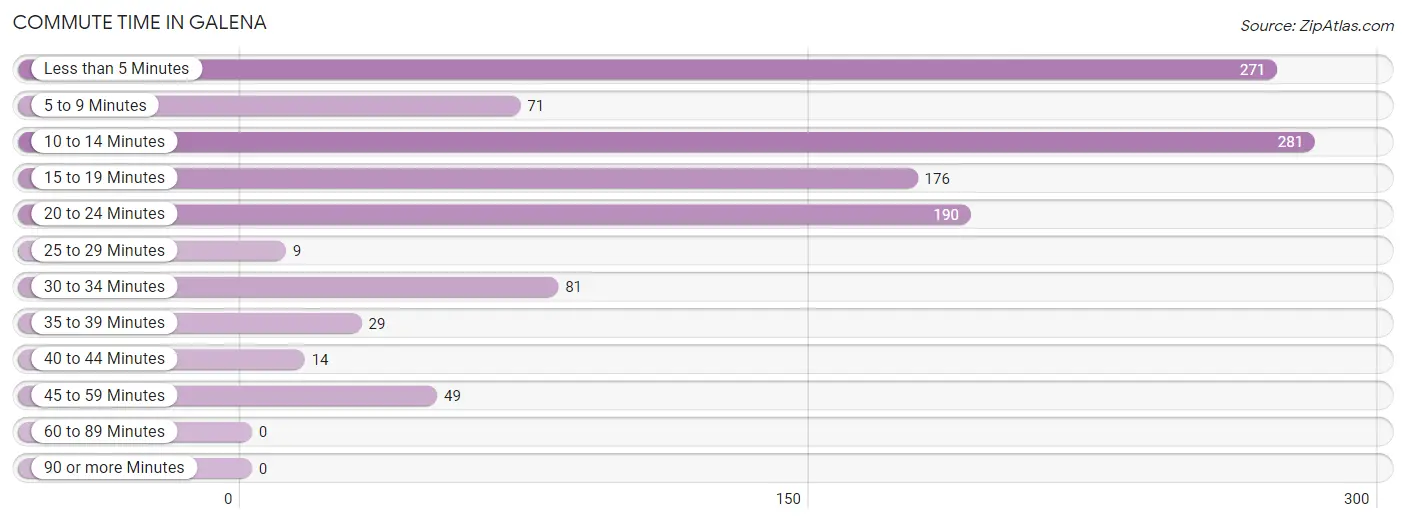
| Commute Time | # Commuters | % Commuters |
| Less than 5 Minutes | 271 | 23.1% |
| 5 to 9 Minutes | 71 | 6.1% |
| 10 to 14 Minutes | 281 | 24.0% |
| 15 to 19 Minutes | 176 | 15.0% |
| 20 to 24 Minutes | 190 | 16.2% |
| 25 to 29 Minutes | 9 | 0.8% |
| 30 to 34 Minutes | 81 | 6.9% |
| 35 to 39 Minutes | 29 | 2.5% |
| 40 to 44 Minutes | 14 | 1.2% |
| 45 to 59 Minutes | 49 | 4.2% |
| 60 to 89 Minutes | 0 | 0.0% |
| 90 or more Minutes | 0 | 0.0% |
Commute Time by Sex in Galena
The most common commute times in Galena are 10 to 14 minutes (144 commuters, 29.0%) for males and less than 5 minutes (247 commuters, 36.6%) for females.
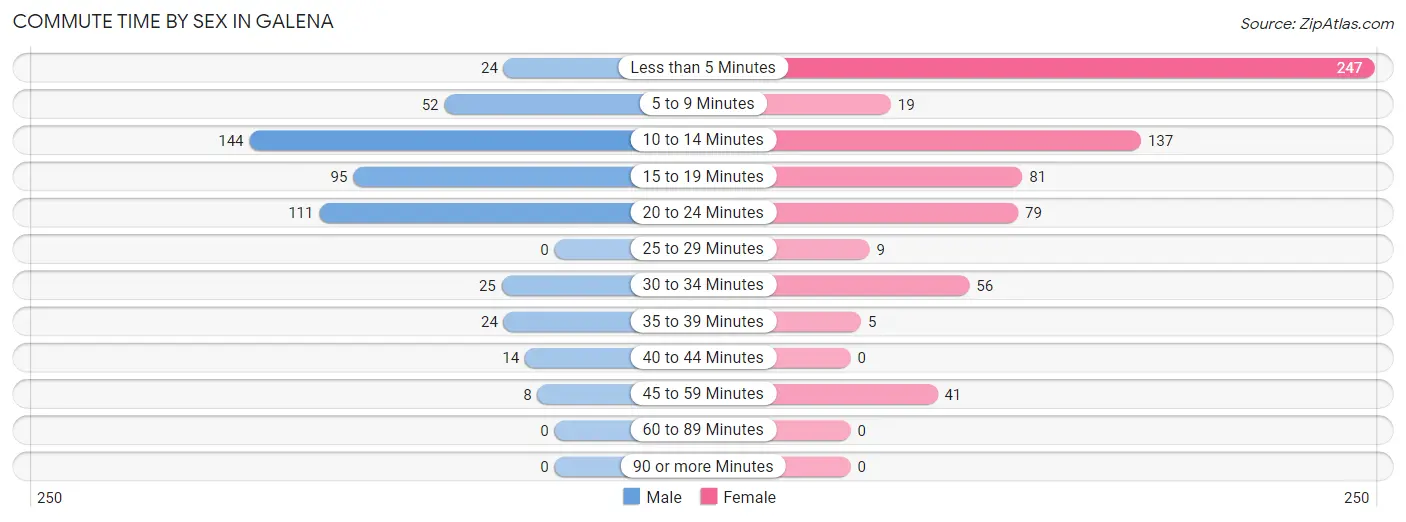
| Commute Time | Male | Female |
| Less than 5 Minutes | 24 (4.8%) | 247 (36.6%) |
| 5 to 9 Minutes | 52 (10.5%) | 19 (2.8%) |
| 10 to 14 Minutes | 144 (29.0%) | 137 (20.3%) |
| 15 to 19 Minutes | 95 (19.1%) | 81 (12.0%) |
| 20 to 24 Minutes | 111 (22.3%) | 79 (11.7%) |
| 25 to 29 Minutes | 0 (0.0%) | 9 (1.3%) |
| 30 to 34 Minutes | 25 (5.0%) | 56 (8.3%) |
| 35 to 39 Minutes | 24 (4.8%) | 5 (0.7%) |
| 40 to 44 Minutes | 14 (2.8%) | 0 (0.0%) |
| 45 to 59 Minutes | 8 (1.6%) | 41 (6.1%) |
| 60 to 89 Minutes | 0 (0.0%) | 0 (0.0%) |
| 90 or more Minutes | 0 (0.0%) | 0 (0.0%) |
Time of Departure to Work by Sex in Galena
The most frequent times of departure to work in Galena are 5:00 AM to 5:29 AM (101, 20.3%) for males and 6:30 AM to 6:59 AM (148, 22.0%) for females.
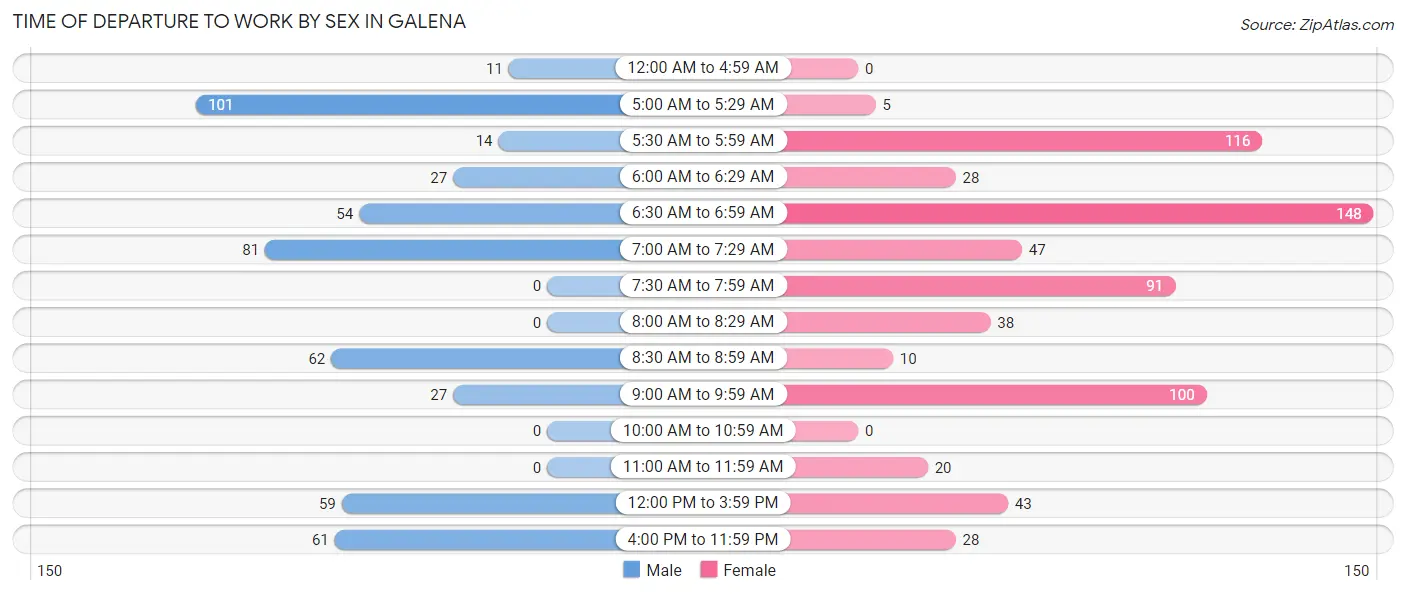
| Time of Departure | Male | Female |
| 12:00 AM to 4:59 AM | 11 (2.2%) | 0 (0.0%) |
| 5:00 AM to 5:29 AM | 101 (20.3%) | 5 (0.7%) |
| 5:30 AM to 5:59 AM | 14 (2.8%) | 116 (17.2%) |
| 6:00 AM to 6:29 AM | 27 (5.4%) | 28 (4.2%) |
| 6:30 AM to 6:59 AM | 54 (10.9%) | 148 (22.0%) |
| 7:00 AM to 7:29 AM | 81 (16.3%) | 47 (7.0%) |
| 7:30 AM to 7:59 AM | 0 (0.0%) | 91 (13.5%) |
| 8:00 AM to 8:29 AM | 0 (0.0%) | 38 (5.6%) |
| 8:30 AM to 8:59 AM | 62 (12.5%) | 10 (1.5%) |
| 9:00 AM to 9:59 AM | 27 (5.4%) | 100 (14.8%) |
| 10:00 AM to 10:59 AM | 0 (0.0%) | 0 (0.0%) |
| 11:00 AM to 11:59 AM | 0 (0.0%) | 20 (3.0%) |
| 12:00 PM to 3:59 PM | 59 (11.9%) | 43 (6.4%) |
| 4:00 PM to 11:59 PM | 61 (12.3%) | 28 (4.2%) |
| Total | 497 (100.0%) | 674 (100.0%) |
Housing Occupancy in Galena
Occupancy by Ownership in Galena
Of the total 1,209 dwellings in Galena, owner-occupied units account for 755 (62.5%), while renter-occupied units make up 454 (37.6%).
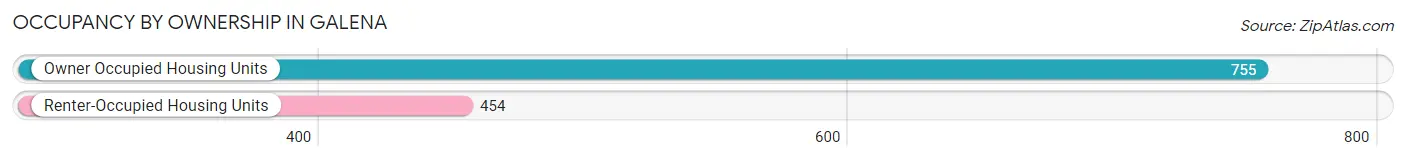
| Occupancy | # Housing Units | % Housing Units |
| Owner Occupied Housing Units | 755 | 62.5% |
| Renter-Occupied Housing Units | 454 | 37.6% |
| Total Occupied Housing Units | 1,209 | 100.0% |
Occupancy by Household Size in Galena
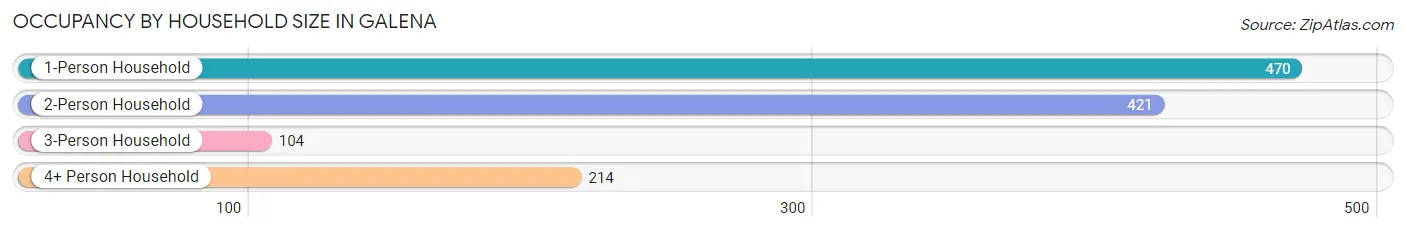
| Household Size | # Housing Units | % Housing Units |
| 1-Person Household | 470 | 38.9% |
| 2-Person Household | 421 | 34.8% |
| 3-Person Household | 104 | 8.6% |
| 4+ Person Household | 214 | 17.7% |
| Total Housing Units | 1,209 | 100.0% |
Occupancy by Ownership by Household Size in Galena
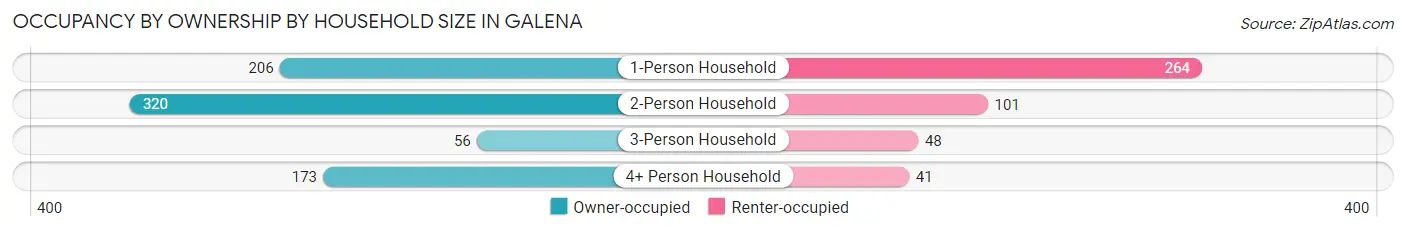
| Household Size | Owner-occupied | Renter-occupied |
| 1-Person Household | 206 (43.8%) | 264 (56.2%) |
| 2-Person Household | 320 (76.0%) | 101 (24.0%) |
| 3-Person Household | 56 (53.8%) | 48 (46.2%) |
| 4+ Person Household | 173 (80.8%) | 41 (19.2%) |
| Total Housing Units | 755 (62.5%) | 454 (37.6%) |
Occupancy by Educational Attainment in Galena
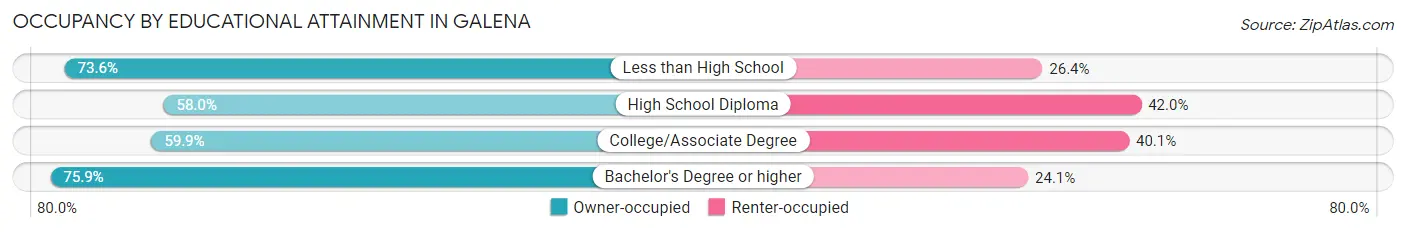
| Household Size | Owner-occupied | Renter-occupied |
| Less than High School | 81 (73.6%) | 29 (26.4%) |
| High School Diploma | 324 (58.0%) | 235 (42.0%) |
| College/Associate Degree | 224 (59.9%) | 150 (40.1%) |
| Bachelor's Degree or higher | 126 (75.9%) | 40 (24.1%) |
Occupancy by Age of Householder in Galena
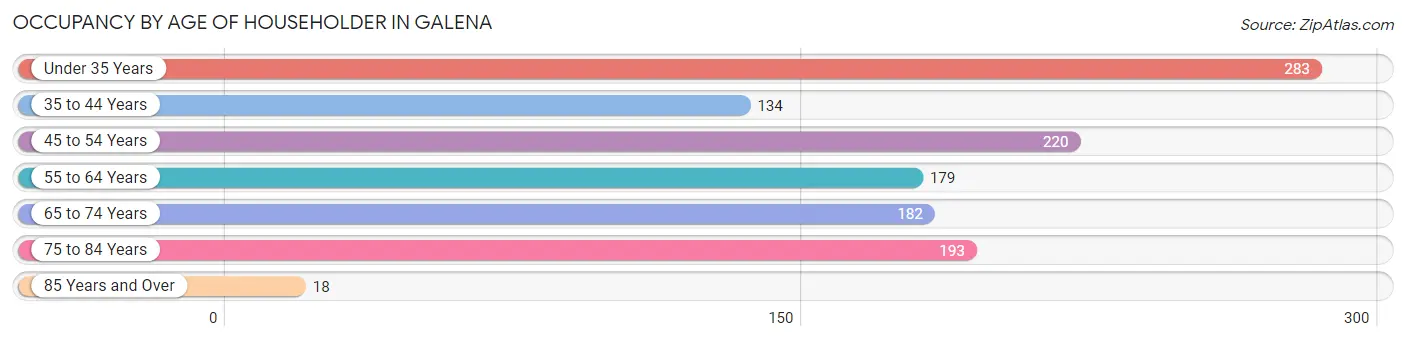
| Age Bracket | # Households | % Households |
| Under 35 Years | 283 | 23.4% |
| 35 to 44 Years | 134 | 11.1% |
| 45 to 54 Years | 220 | 18.2% |
| 55 to 64 Years | 179 | 14.8% |
| 65 to 74 Years | 182 | 15.0% |
| 75 to 84 Years | 193 | 16.0% |
| 85 Years and Over | 18 | 1.5% |
| Total | 1,209 | 100.0% |
Housing Finances in Galena
Median Income by Occupancy in Galena
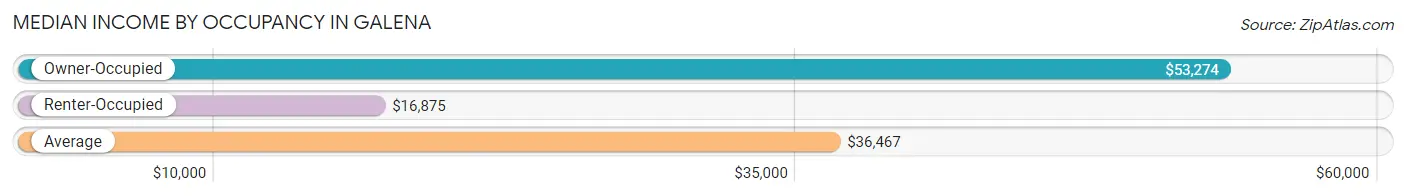
| Occupancy Type | # Households | Median Income |
| Owner-Occupied | 755 (62.5%) | $53,274 |
| Renter-Occupied | 454 (37.6%) | $16,875 |
| Average | 1,209 (100.0%) | $36,467 |
Occupancy by Householder Income Bracket in Galena
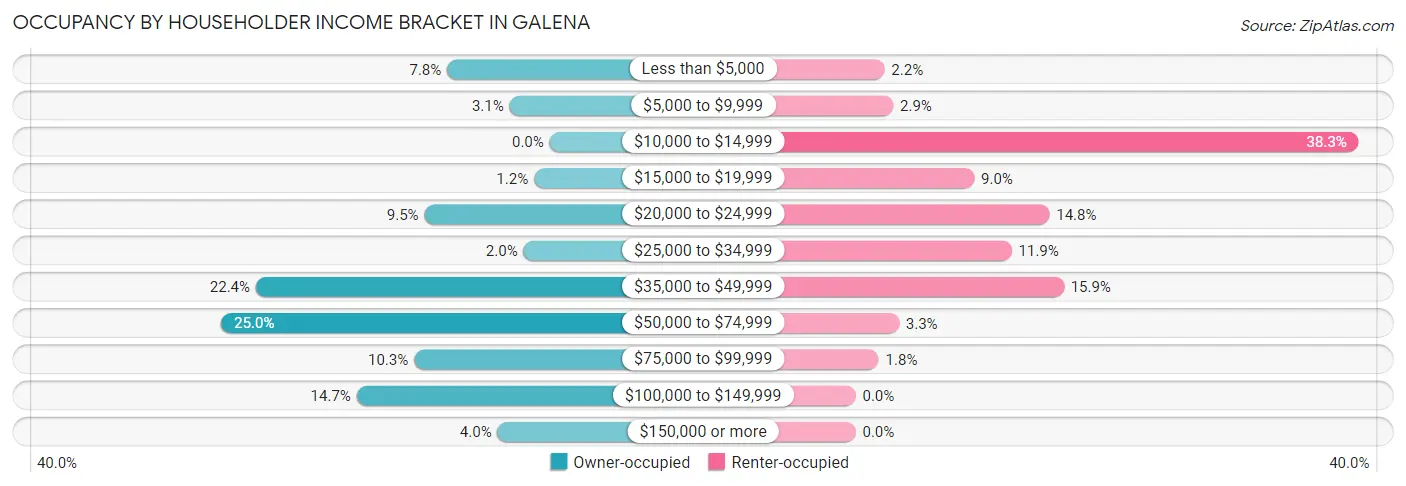
| Income Bracket | Owner-occupied | Renter-occupied |
| Less than $5,000 | 59 (7.8%) | 10 (2.2%) |
| $5,000 to $9,999 | 23 (3.0%) | 13 (2.9%) |
| $10,000 to $14,999 | 0 (0.0%) | 174 (38.3%) |
| $15,000 to $19,999 | 9 (1.2%) | 41 (9.0%) |
| $20,000 to $24,999 | 72 (9.5%) | 67 (14.8%) |
| $25,000 to $34,999 | 15 (2.0%) | 54 (11.9%) |
| $35,000 to $49,999 | 169 (22.4%) | 72 (15.9%) |
| $50,000 to $74,999 | 189 (25.0%) | 15 (3.3%) |
| $75,000 to $99,999 | 78 (10.3%) | 8 (1.8%) |
| $100,000 to $149,999 | 111 (14.7%) | 0 (0.0%) |
| $150,000 or more | 30 (4.0%) | 0 (0.0%) |
| Total | 755 (100.0%) | 454 (100.0%) |
Monthly Housing Cost Tiers in Galena
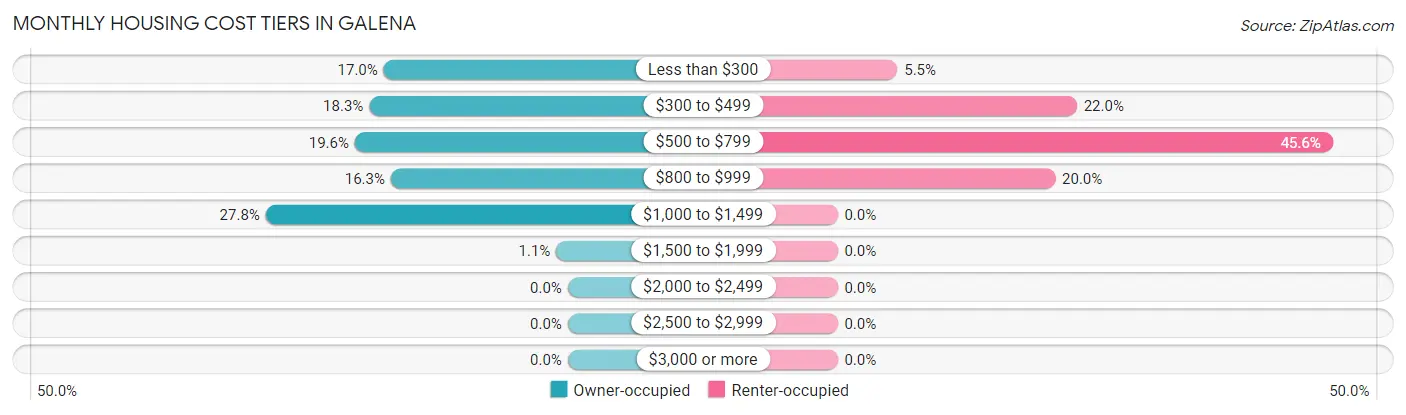
| Monthly Cost | Owner-occupied | Renter-occupied |
| Less than $300 | 128 (17.0%) | 25 (5.5%) |
| $300 to $499 | 138 (18.3%) | 100 (22.0%) |
| $500 to $799 | 148 (19.6%) | 207 (45.6%) |
| $800 to $999 | 123 (16.3%) | 91 (20.0%) |
| $1,000 to $1,499 | 210 (27.8%) | 0 (0.0%) |
| $1,500 to $1,999 | 8 (1.1%) | 0 (0.0%) |
| $2,000 to $2,499 | 0 (0.0%) | 0 (0.0%) |
| $2,500 to $2,999 | 0 (0.0%) | 0 (0.0%) |
| $3,000 or more | 0 (0.0%) | 0 (0.0%) |
| Total | 755 (100.0%) | 454 (100.0%) |
Physical Housing Characteristics in Galena
Housing Structures in Galena
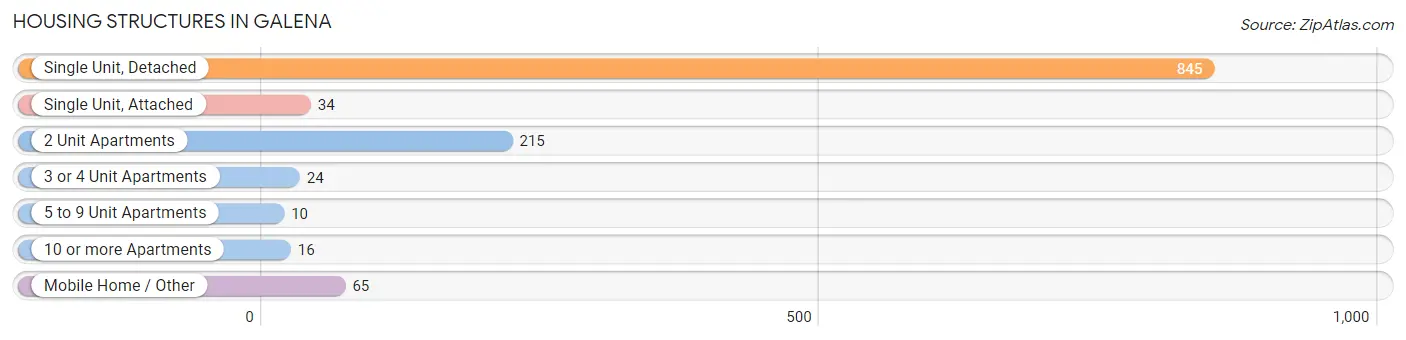
| Structure Type | # Housing Units | % Housing Units |
| Single Unit, Detached | 845 | 69.9% |
| Single Unit, Attached | 34 | 2.8% |
| 2 Unit Apartments | 215 | 17.8% |
| 3 or 4 Unit Apartments | 24 | 2.0% |
| 5 to 9 Unit Apartments | 10 | 0.8% |
| 10 or more Apartments | 16 | 1.3% |
| Mobile Home / Other | 65 | 5.4% |
| Total | 1,209 | 100.0% |
Housing Structures by Occupancy in Galena
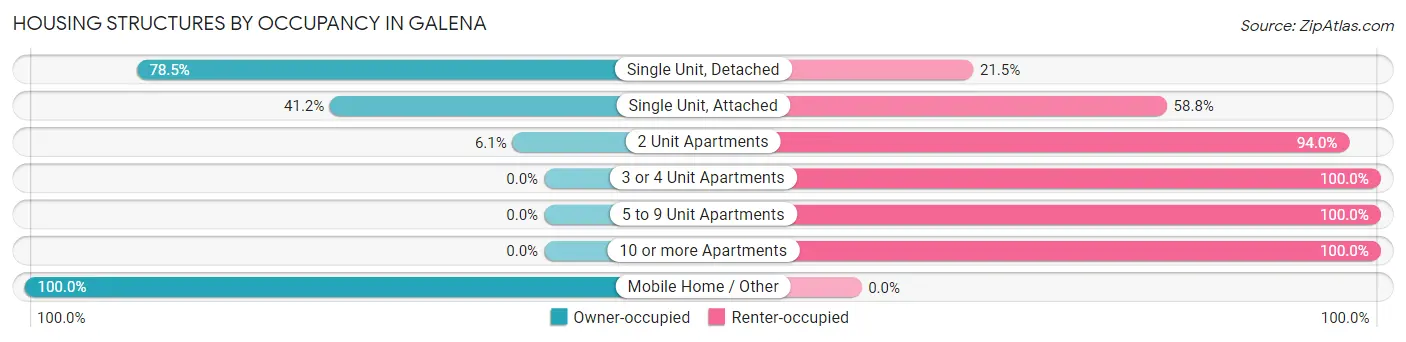
| Structure Type | Owner-occupied | Renter-occupied |
| Single Unit, Detached | 663 (78.5%) | 182 (21.5%) |
| Single Unit, Attached | 14 (41.2%) | 20 (58.8%) |
| 2 Unit Apartments | 13 (6.0%) | 202 (94.0%) |
| 3 or 4 Unit Apartments | 0 (0.0%) | 24 (100.0%) |
| 5 to 9 Unit Apartments | 0 (0.0%) | 10 (100.0%) |
| 10 or more Apartments | 0 (0.0%) | 16 (100.0%) |
| Mobile Home / Other | 65 (100.0%) | 0 (0.0%) |
| Total | 755 (62.5%) | 454 (37.6%) |
Housing Structures by Number of Rooms in Galena
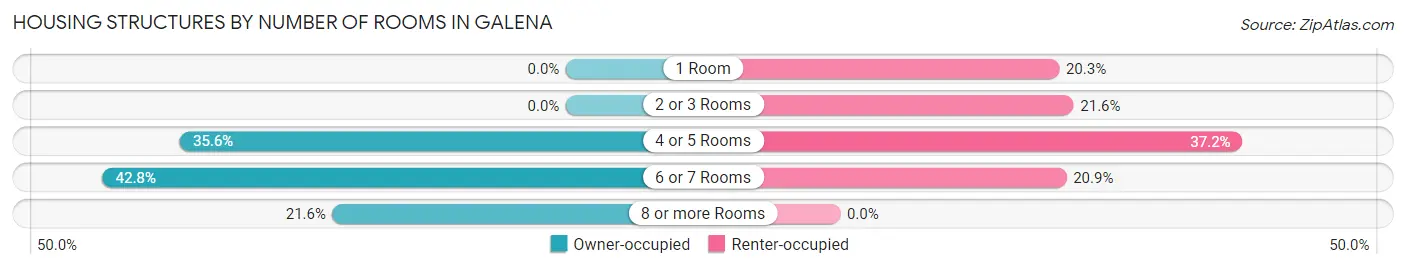
| Number of Rooms | Owner-occupied | Renter-occupied |
| 1 Room | 0 (0.0%) | 92 (20.3%) |
| 2 or 3 Rooms | 0 (0.0%) | 98 (21.6%) |
| 4 or 5 Rooms | 269 (35.6%) | 169 (37.2%) |
| 6 or 7 Rooms | 323 (42.8%) | 95 (20.9%) |
| 8 or more Rooms | 163 (21.6%) | 0 (0.0%) |
| Total | 755 (100.0%) | 454 (100.0%) |
Housing Structure by Heating Type in Galena
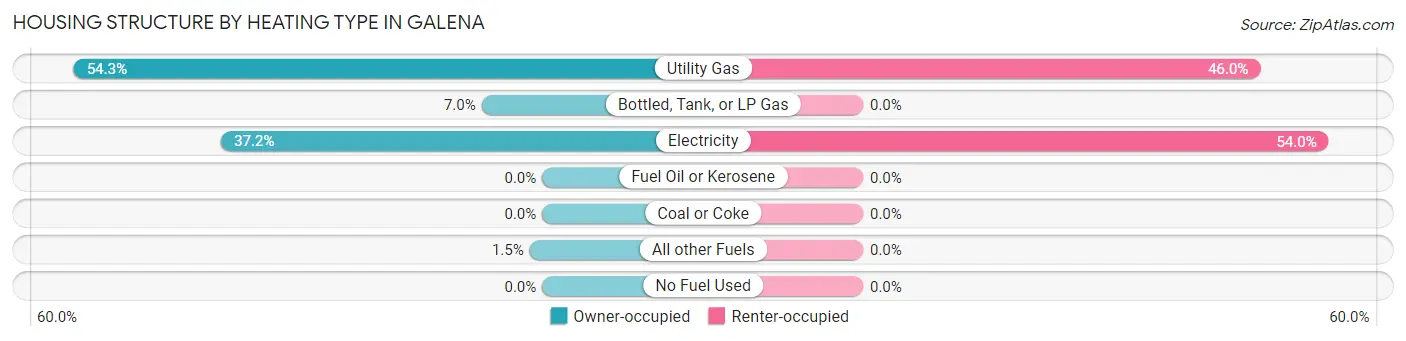
| Heating Type | Owner-occupied | Renter-occupied |
| Utility Gas | 410 (54.3%) | 209 (46.0%) |
| Bottled, Tank, or LP Gas | 53 (7.0%) | 0 (0.0%) |
| Electricity | 281 (37.2%) | 245 (54.0%) |
| Fuel Oil or Kerosene | 0 (0.0%) | 0 (0.0%) |
| Coal or Coke | 0 (0.0%) | 0 (0.0%) |
| All other Fuels | 11 (1.5%) | 0 (0.0%) |
| No Fuel Used | 0 (0.0%) | 0 (0.0%) |
| Total | 755 (100.0%) | 454 (100.0%) |
Household Vehicle Usage in Galena
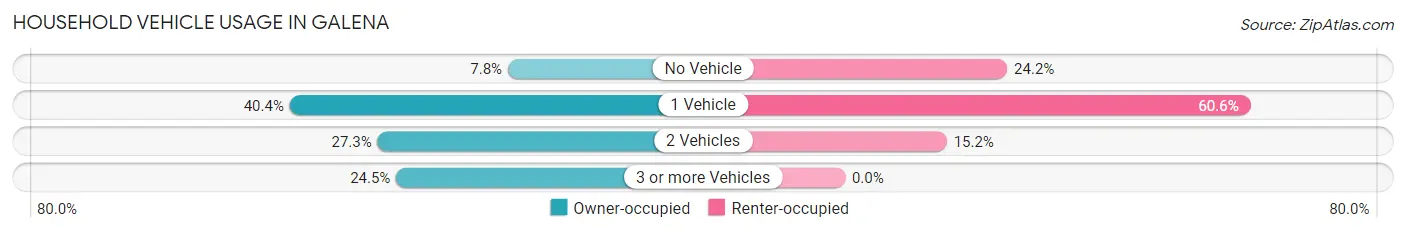
| Vehicles per Household | Owner-occupied | Renter-occupied |
| No Vehicle | 59 (7.8%) | 110 (24.2%) |
| 1 Vehicle | 305 (40.4%) | 275 (60.6%) |
| 2 Vehicles | 206 (27.3%) | 69 (15.2%) |
| 3 or more Vehicles | 185 (24.5%) | 0 (0.0%) |
| Total | 755 (100.0%) | 454 (100.0%) |
Real Estate & Mortgages in Galena
Real Estate and Mortgage Overview in Galena
| Characteristic | Without Mortgage | With Mortgage |
| Housing Units | 369 | 386 |
| Median Property Value | $47,600 | $96,500 |
| Median Household Income | $55,917 | $14 |
| Monthly Housing Costs | $394 | $0 |
| Real Estate Taxes | $868 | $34 |
Property Value by Mortgage Status in Galena
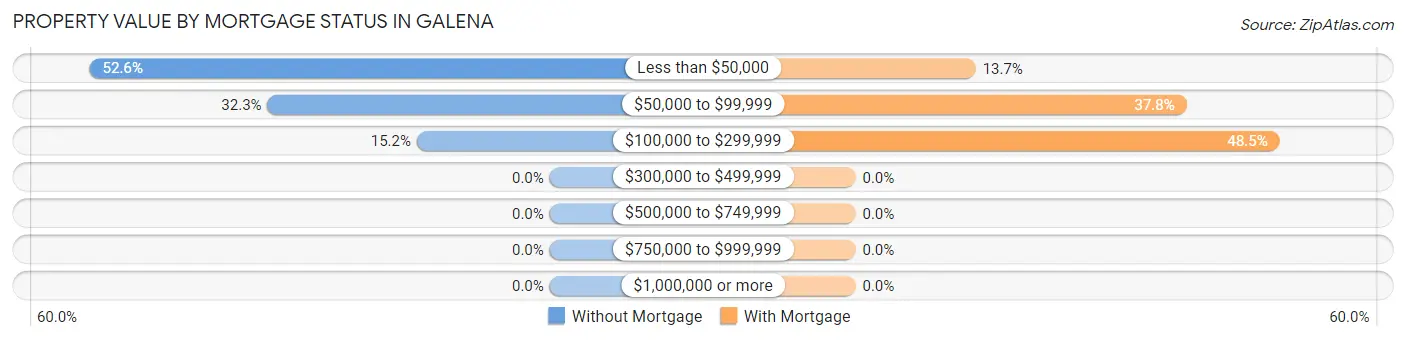
| Property Value | Without Mortgage | With Mortgage |
| Less than $50,000 | 194 (52.6%) | 53 (13.7%) |
| $50,000 to $99,999 | 119 (32.3%) | 146 (37.8%) |
| $100,000 to $299,999 | 56 (15.2%) | 187 (48.4%) |
| $300,000 to $499,999 | 0 (0.0%) | 0 (0.0%) |
| $500,000 to $749,999 | 0 (0.0%) | 0 (0.0%) |
| $750,000 to $999,999 | 0 (0.0%) | 0 (0.0%) |
| $1,000,000 or more | 0 (0.0%) | 0 (0.0%) |
| Total | 369 (100.0%) | 386 (100.0%) |
Household Income by Mortgage Status in Galena
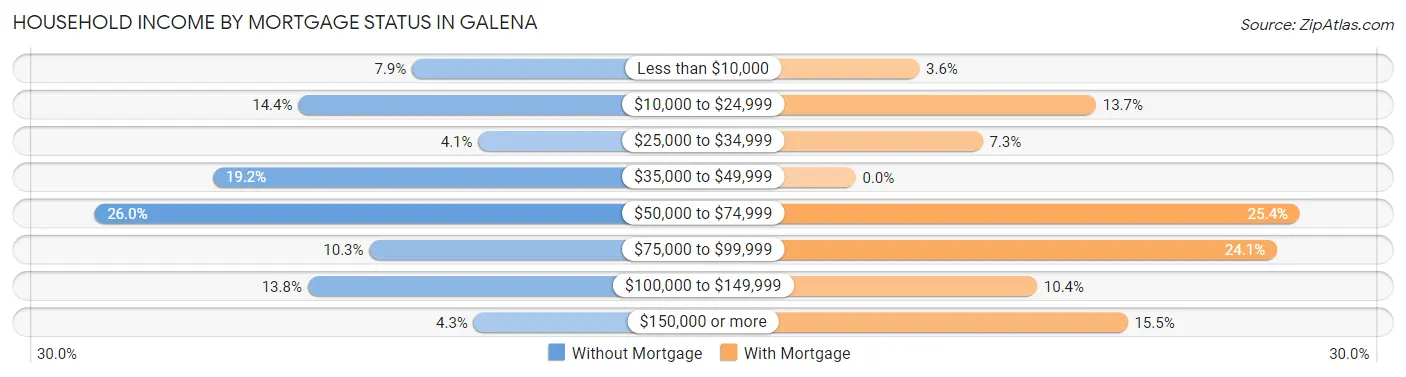
| Household Income | Without Mortgage | With Mortgage |
| Less than $10,000 | 29 (7.9%) | 14 (3.6%) |
| $10,000 to $24,999 | 53 (14.4%) | 53 (13.7%) |
| $25,000 to $34,999 | 15 (4.1%) | 28 (7.2%) |
| $35,000 to $49,999 | 71 (19.2%) | 0 (0.0%) |
| $50,000 to $74,999 | 96 (26.0%) | 98 (25.4%) |
| $75,000 to $99,999 | 38 (10.3%) | 93 (24.1%) |
| $100,000 to $149,999 | 51 (13.8%) | 40 (10.4%) |
| $150,000 or more | 16 (4.3%) | 60 (15.5%) |
| Total | 369 (100.0%) | 386 (100.0%) |
Property Value to Household Income Ratio in Galena
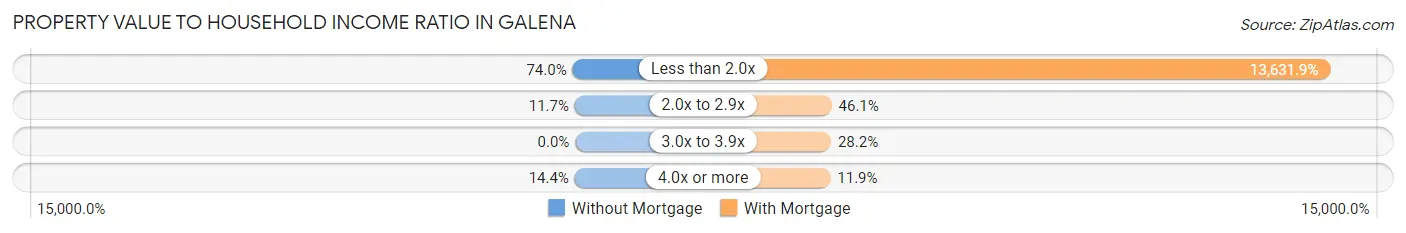
| Value-to-Income Ratio | Without Mortgage | With Mortgage |
| Less than 2.0x | 273 (74.0%) | 52,619 (13,631.9%) |
| 2.0x to 2.9x | 43 (11.7%) | 178 (46.1%) |
| 3.0x to 3.9x | 0 (0.0%) | 109 (28.2%) |
| 4.0x or more | 53 (14.4%) | 46 (11.9%) |
| Total | 369 (100.0%) | 386 (100.0%) |
Real Estate Taxes by Mortgage Status in Galena
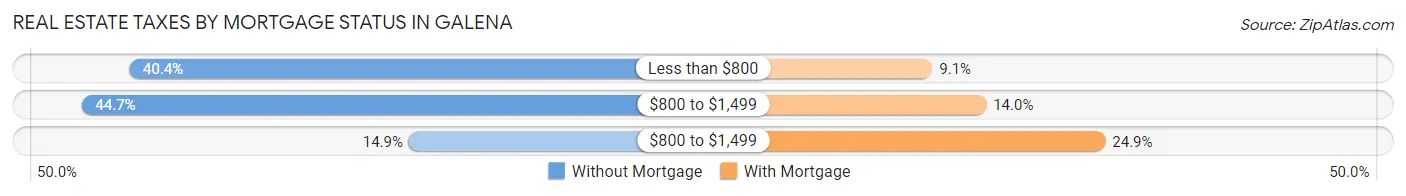
| Property Taxes | Without Mortgage | With Mortgage |
| Less than $800 | 149 (40.4%) | 35 (9.1%) |
| $800 to $1,499 | 165 (44.7%) | 54 (14.0%) |
| $800 to $1,499 | 55 (14.9%) | 96 (24.9%) |
| Total | 369 (100.0%) | 386 (100.0%) |
Health & Disability in Galena
Health Insurance Coverage by Age in Galena
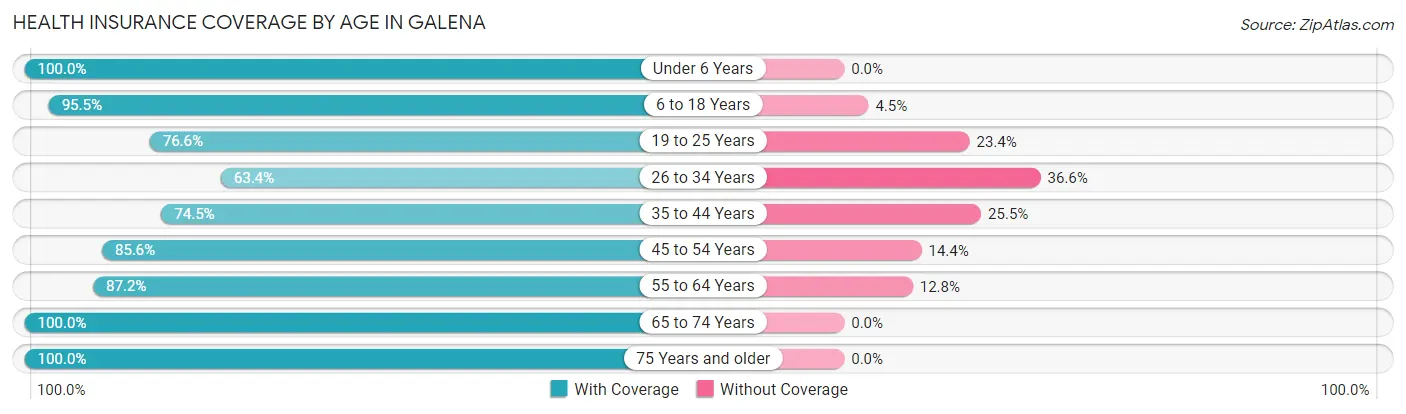
| Age Bracket | With Coverage | Without Coverage |
| Under 6 Years | 232 (100.0%) | 0 (0.0%) |
| 6 to 18 Years | 254 (95.5%) | 12 (4.5%) |
| 19 to 25 Years | 105 (76.6%) | 32 (23.4%) |
| 26 to 34 Years | 232 (63.4%) | 134 (36.6%) |
| 35 to 44 Years | 178 (74.5%) | 61 (25.5%) |
| 45 to 54 Years | 511 (85.6%) | 86 (14.4%) |
| 55 to 64 Years | 321 (87.2%) | 47 (12.8%) |
| 65 to 74 Years | 237 (100.0%) | 0 (0.0%) |
| 75 Years and older | 267 (100.0%) | 0 (0.0%) |
| Total | 2,337 (86.3%) | 372 (13.7%) |
Health Insurance Coverage by Citizenship Status in Galena
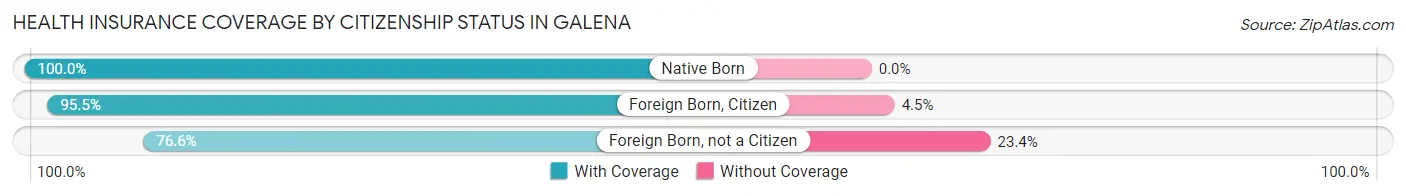
| Citizenship Status | With Coverage | Without Coverage |
| Native Born | 232 (100.0%) | 0 (0.0%) |
| Foreign Born, Citizen | 254 (95.5%) | 12 (4.5%) |
| Foreign Born, not a Citizen | 105 (76.6%) | 32 (23.4%) |
Health Insurance Coverage by Household Income in Galena
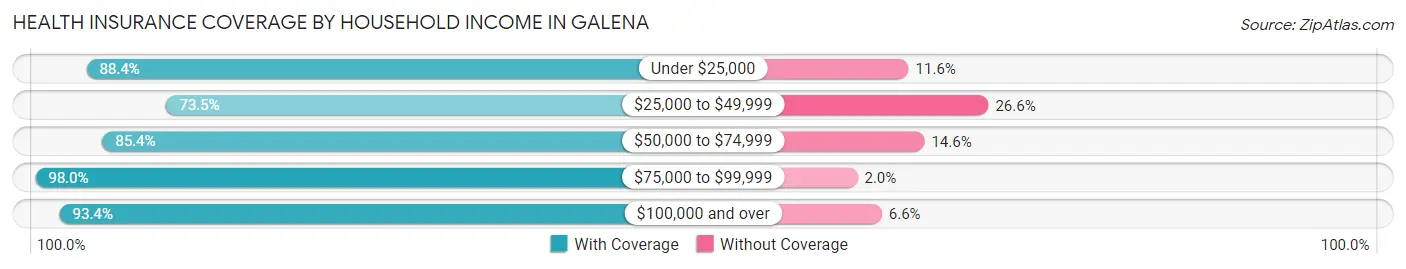
| Household Income | With Coverage | Without Coverage |
| Under $25,000 | 641 (88.4%) | 84 (11.6%) |
| $25,000 to $49,999 | 509 (73.5%) | 184 (26.6%) |
| $50,000 to $74,999 | 399 (85.4%) | 68 (14.6%) |
| $75,000 to $99,999 | 390 (98.0%) | 8 (2.0%) |
| $100,000 and over | 398 (93.4%) | 28 (6.6%) |
Public vs Private Health Insurance Coverage by Age in Galena
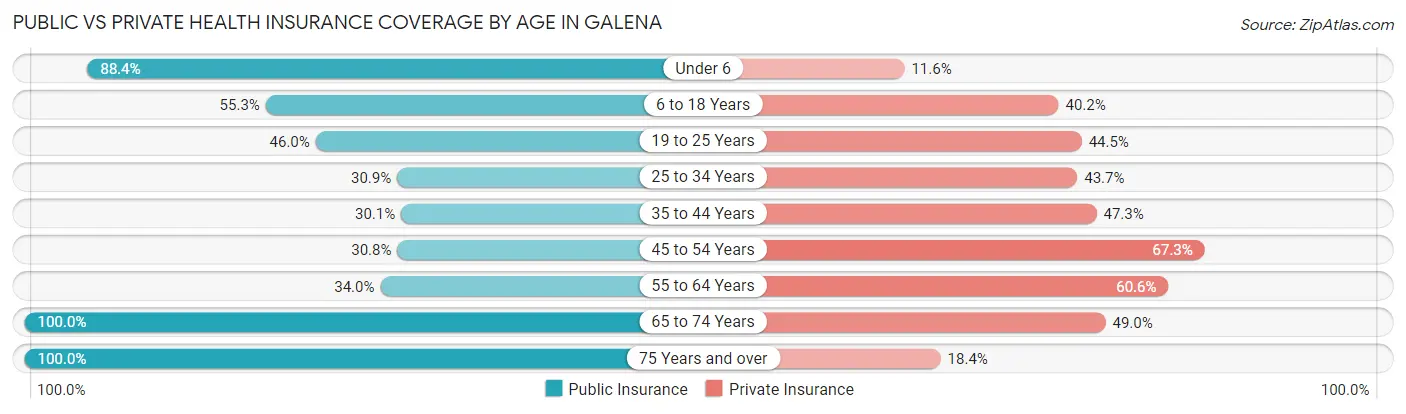
| Age Bracket | Public Insurance | Private Insurance |
| Under 6 | 205 (88.4%) | 27 (11.6%) |
| 6 to 18 Years | 147 (55.3%) | 107 (40.2%) |
| 19 to 25 Years | 63 (46.0%) | 61 (44.5%) |
| 25 to 34 Years | 113 (30.9%) | 160 (43.7%) |
| 35 to 44 Years | 72 (30.1%) | 113 (47.3%) |
| 45 to 54 Years | 184 (30.8%) | 402 (67.3%) |
| 55 to 64 Years | 125 (34.0%) | 223 (60.6%) |
| 65 to 74 Years | 237 (100.0%) | 116 (48.9%) |
| 75 Years and over | 267 (100.0%) | 49 (18.3%) |
| Total | 1,413 (52.2%) | 1,258 (46.4%) |
Disability Status by Sex by Age in Galena
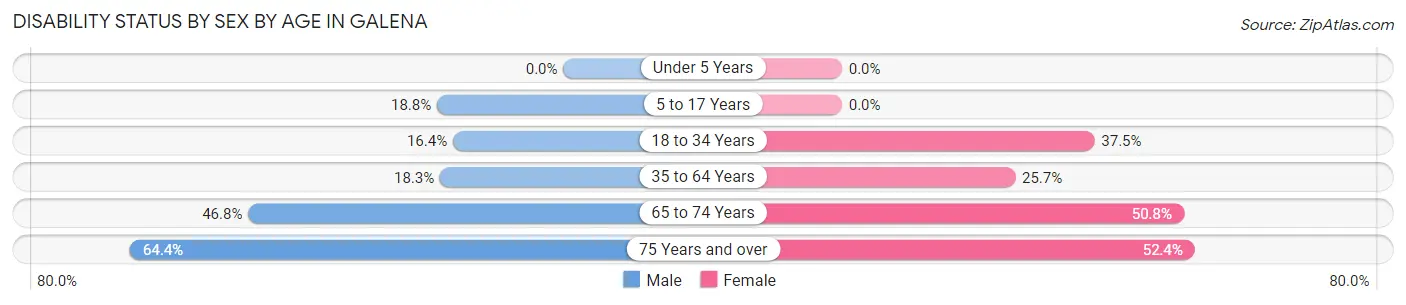
| Age Bracket | Male | Female |
| Under 5 Years | 0 (0.0%) | 0 (0.0%) |
| 5 to 17 Years | 27 (18.8%) | 0 (0.0%) |
| 18 to 34 Years | 39 (16.4%) | 105 (37.5%) |
| 35 to 64 Years | 93 (18.3%) | 179 (25.7%) |
| 65 to 74 Years | 51 (46.8%) | 65 (50.8%) |
| 75 Years and over | 65 (64.4%) | 87 (52.4%) |
Disability Class by Sex by Age in Galena
Disability Class: Hearing Difficulty
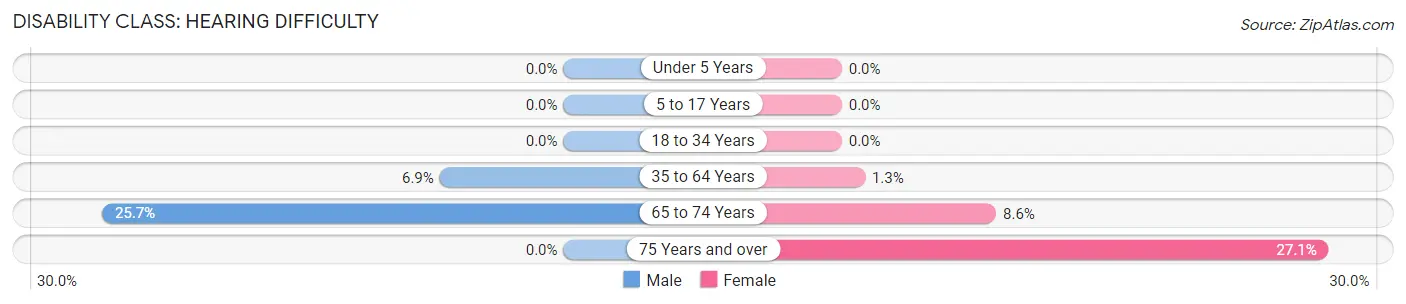
| Age Bracket | Male | Female |
| Under 5 Years | 0 (0.0%) | 0 (0.0%) |
| 5 to 17 Years | 0 (0.0%) | 0 (0.0%) |
| 18 to 34 Years | 0 (0.0%) | 0 (0.0%) |
| 35 to 64 Years | 35 (6.9%) | 9 (1.3%) |
| 65 to 74 Years | 28 (25.7%) | 11 (8.6%) |
| 75 Years and over | 0 (0.0%) | 45 (27.1%) |
Disability Class: Vision Difficulty
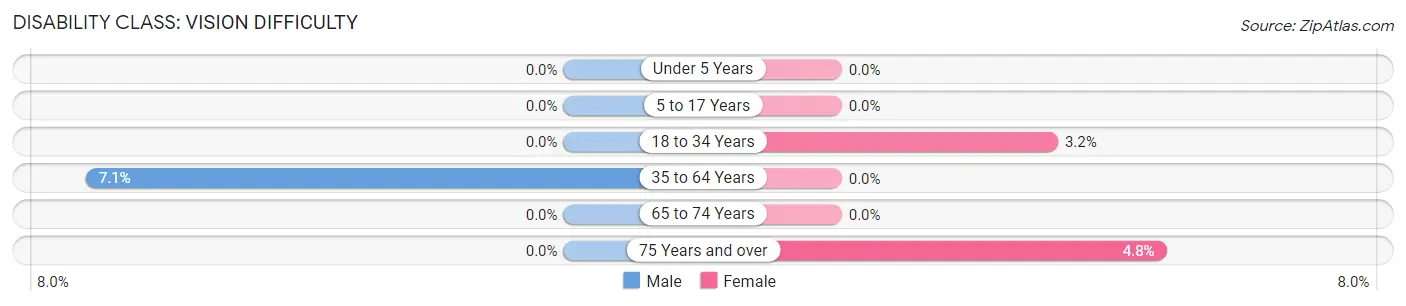
| Age Bracket | Male | Female |
| Under 5 Years | 0 (0.0%) | 0 (0.0%) |
| 5 to 17 Years | 0 (0.0%) | 0 (0.0%) |
| 18 to 34 Years | 0 (0.0%) | 9 (3.2%) |
| 35 to 64 Years | 36 (7.1%) | 0 (0.0%) |
| 65 to 74 Years | 0 (0.0%) | 0 (0.0%) |
| 75 Years and over | 0 (0.0%) | 8 (4.8%) |
Disability Class: Cognitive Difficulty
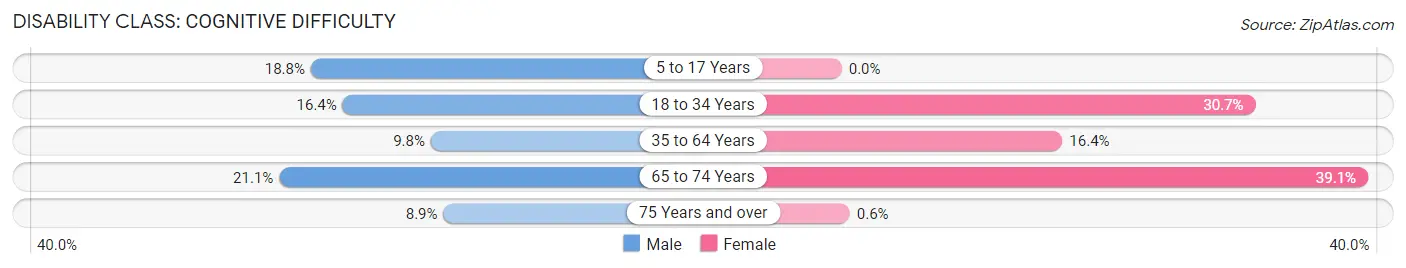
| Age Bracket | Male | Female |
| 5 to 17 Years | 27 (18.8%) | 0 (0.0%) |
| 18 to 34 Years | 39 (16.4%) | 86 (30.7%) |
| 35 to 64 Years | 50 (9.8%) | 114 (16.4%) |
| 65 to 74 Years | 23 (21.1%) | 50 (39.1%) |
| 75 Years and over | 9 (8.9%) | 1 (0.6%) |
Disability Class: Ambulatory Difficulty
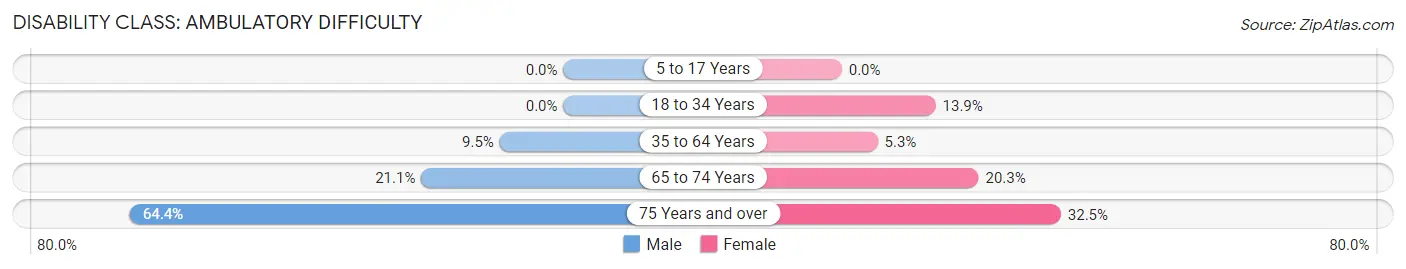
| Age Bracket | Male | Female |
| 5 to 17 Years | 0 (0.0%) | 0 (0.0%) |
| 18 to 34 Years | 0 (0.0%) | 39 (13.9%) |
| 35 to 64 Years | 48 (9.5%) | 37 (5.3%) |
| 65 to 74 Years | 23 (21.1%) | 26 (20.3%) |
| 75 Years and over | 65 (64.4%) | 54 (32.5%) |
Disability Class: Self-Care Difficulty
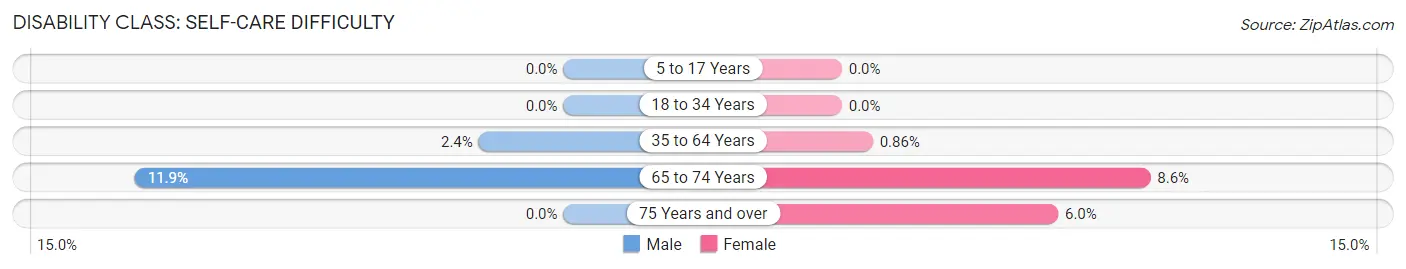
| Age Bracket | Male | Female |
| 5 to 17 Years | 0 (0.0%) | 0 (0.0%) |
| 18 to 34 Years | 0 (0.0%) | 0 (0.0%) |
| 35 to 64 Years | 12 (2.4%) | 6 (0.9%) |
| 65 to 74 Years | 13 (11.9%) | 11 (8.6%) |
| 75 Years and over | 0 (0.0%) | 10 (6.0%) |
Technology Access in Galena
Computing Device Access in Galena
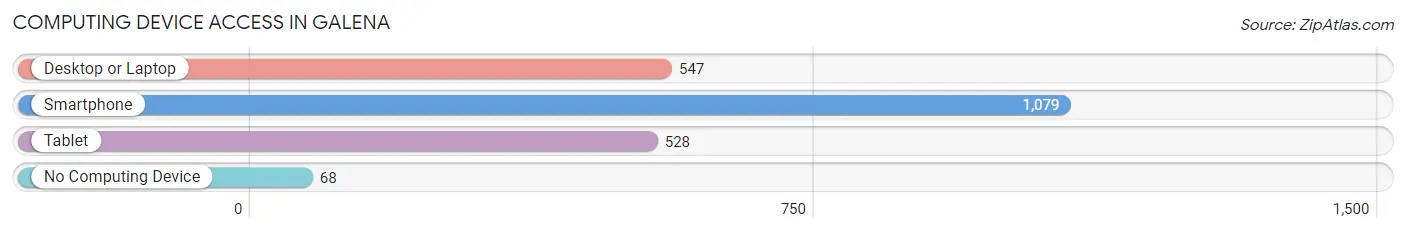
| Device Type | # Households | % Households |
| Desktop or Laptop | 547 | 45.2% |
| Smartphone | 1,079 | 89.2% |
| Tablet | 528 | 43.7% |
| No Computing Device | 68 | 5.6% |
| Total | 1,209 | 100.0% |
Internet Access in Galena
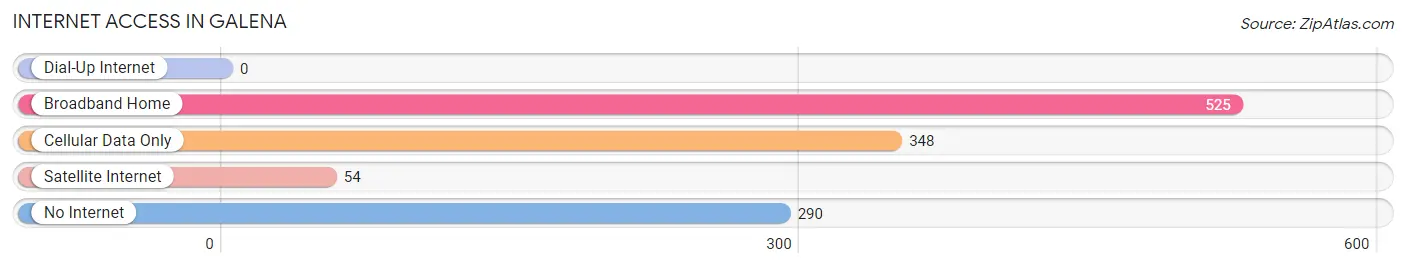
| Internet Type | # Households | % Households |
| Dial-Up Internet | 0 | 0.0% |
| Broadband Home | 525 | 43.4% |
| Cellular Data Only | 348 | 28.8% |
| Satellite Internet | 54 | 4.5% |
| No Internet | 290 | 24.0% |
| Total | 1,209 | 100.0% |
Galena Summary
Galena, Kansas is a small city located in Cherokee County, Kansas. It is situated on the banks of the Spring River, and is the county seat of Cherokee County. The city has a population of approximately 3,000 people, and is located about 30 miles south of Joplin, Missouri.
History
The area that is now Galena was first settled in the late 1840s by a group of settlers from the Cherokee Nation. The town was originally called Cherokee City, and was the first permanent settlement in the county. In 1867, the town was renamed Galena, after the lead ore that was mined in the area.
The city was incorporated in 1872, and the first mayor was elected in 1873. The city quickly grew, and by the early 1900s, it had become a major center for lead and zinc mining. The city was also home to several large manufacturing plants, including a glass factory and a brick factory.
In the early 1900s, the city was also home to a large number of saloons and gambling halls. This led to a period of lawlessness and violence, and the city was known as the "wickedest city in Kansas". This reputation led to the city being nicknamed "Sin City".
In the 1920s, the city began to clean up its act, and the saloons and gambling halls were closed down. The city also began to diversify its economy, and by the 1950s, it had become a major center for manufacturing and agriculture.
Geography
Galena is located in the southeastern corner of Cherokee County, Kansas. It is situated on the banks of the Spring River, and is about 30 miles south of Joplin, Missouri. The city is located in the Ozark Plateau region of the state, and is surrounded by rolling hills and wooded areas.
The city has a total area of 4.2 square miles, all of which is land. The city has a humid subtropical climate, with hot, humid summers and mild winters. The average annual temperature is around 60 degrees Fahrenheit, and the average annual precipitation is around 40 inches.
Economy
Galena's economy is largely based on manufacturing and agriculture. The city is home to several large manufacturing plants, including a glass factory and a brick factory. The city is also home to several large agricultural operations, including cattle and hog farms.
The city is also home to several small businesses, including restaurants, retail stores, and service providers. The city is also home to a large number of tourist attractions, including the Galena Mining Museum and the Galena Historical Society.
Demographics
As of the 2010 census, the population of Galena was 3,085. The racial makeup of the city was 94.3% White, 0.7% African American, 0.3% Native American, 0.2% Asian, 0.1% Pacific Islander, 0.7% from other races, and 3.0% from two or more races. Hispanic or Latino of any race were 2.2% of the population.
The median income for a household in the city was $35,938, and the median income for a family was $41,250. The per capita income for the city was $17,845. About 11.3% of families and 14.2% of the population were below the poverty line, including 19.2% of those under age 18 and 8.2% of those age 65 or over.
Common Questions
What is Per Capita Income in Galena?
Per Capita income in Galena is $23,352.
What is the Median Family Income in Galena?
Median Family Income in Galena is $57,417.
What is the Median Household income in Galena?
Median Household Income in Galena is $36,467.
What is Income or Wage Gap in Galena?
Income or Wage Gap in Galena is 7.9%.
Women in Galena earn 92.1 cents for every dollar earned by a man.
What is Inequality or Gini Index in Galena?
Inequality or Gini Index in Galena is 0.45.
What is the Total Population of Galena?
Total Population of Galena is 2,764.
What is the Total Male Population of Galena?
Total Male Population of Galena is 1,195.
What is the Total Female Population of Galena?
Total Female Population of Galena is 1,569.
What is the Ratio of Males per 100 Females in Galena?
There are 76.16 Males per 100 Females in Galena.
What is the Ratio of Females per 100 Males in Galena?
There are 131.30 Females per 100 Males in Galena.
What is the Median Population Age in Galena?
Median Population Age in Galena is 49.8 Years.
What is the Average Family Size in Galena
Average Family Size in Galena is 3.1 People.
What is the Average Household Size in Galena
Average Household Size in Galena is 2.2 People.
How Large is the Labor Force in Galena?
There are 1,235 People in the Labor Forcein in Galena.
What is the Percentage of People in the Labor Force in Galena?
53.1% of People are in the Labor Force in Galena.