El Dorado, KS Map & Demographics
El Dorado Map
El Dorado Overview
$28,044
PER CAPITA INCOME
$74,214
AVG FAMILY INCOME
$52,921
AVG HOUSEHOLD INCOME
35.7%
WAGE / INCOME GAP [ % ]
64.3¢/ $1
WAGE / INCOME GAP [ $ ]
$16,015
FAMILY INCOME DEFICIT
0.39
INEQUALITY / GINI INDEX
12,882
TOTAL POPULATION
6,332
MALE POPULATION
6,550
FEMALE POPULATION
96.67
MALES / 100 FEMALES
103.44
FEMALES / 100 MALES
34.3
MEDIAN AGE
2.8
AVG FAMILY SIZE
2.3
AVG HOUSEHOLD SIZE
6,618
LABOR FORCE [ PEOPLE ]
65.9%
PERCENT IN LABOR FORCE
3.4%
UNEMPLOYMENT RATE
El Dorado Zip Codes
El Dorado Area Codes
Income in El Dorado
Income Overview in El Dorado
Per Capita Income in El Dorado is $28,044, while median incomes of families and households are $74,214 and $52,921 respectively.
| Characteristic | Number | Measure |
| Per Capita Income | 12,882 | $28,044 |
| Median Family Income | 3,300 | $74,214 |
| Mean Family Income | 3,300 | $79,210 |
| Median Household Income | 5,350 | $52,921 |
| Mean Household Income | 5,350 | $65,930 |
| Income Deficit | 3,300 | $16,015 |
| Wage / Income Gap (%) | 12,882 | 35.73% |
| Wage / Income Gap ($) | 12,882 | 64.27¢ per $1 |
| Gini / Inequality Index | 12,882 | 0.39 |
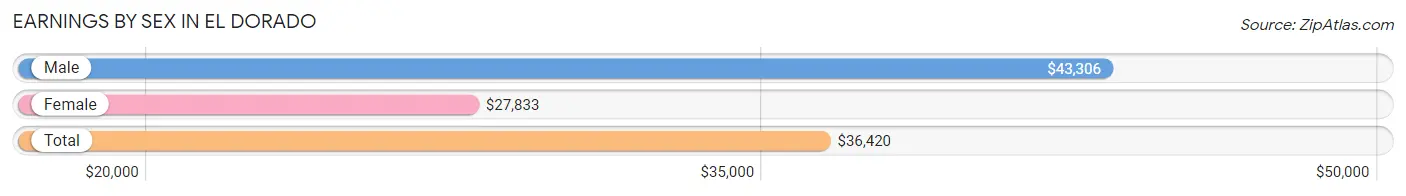
Earnings by Sex in El Dorado
Average Earnings in El Dorado are $36,420, $43,306 for men and $27,833 for women, a difference of 35.7%.
| Sex | Number | Average Earnings |
| Male | 3,283 (47.5%) | $43,306 |
| Female | 3,622 (52.4%) | $27,833 |
| Total | 6,905 (100.0%) | $36,420 |
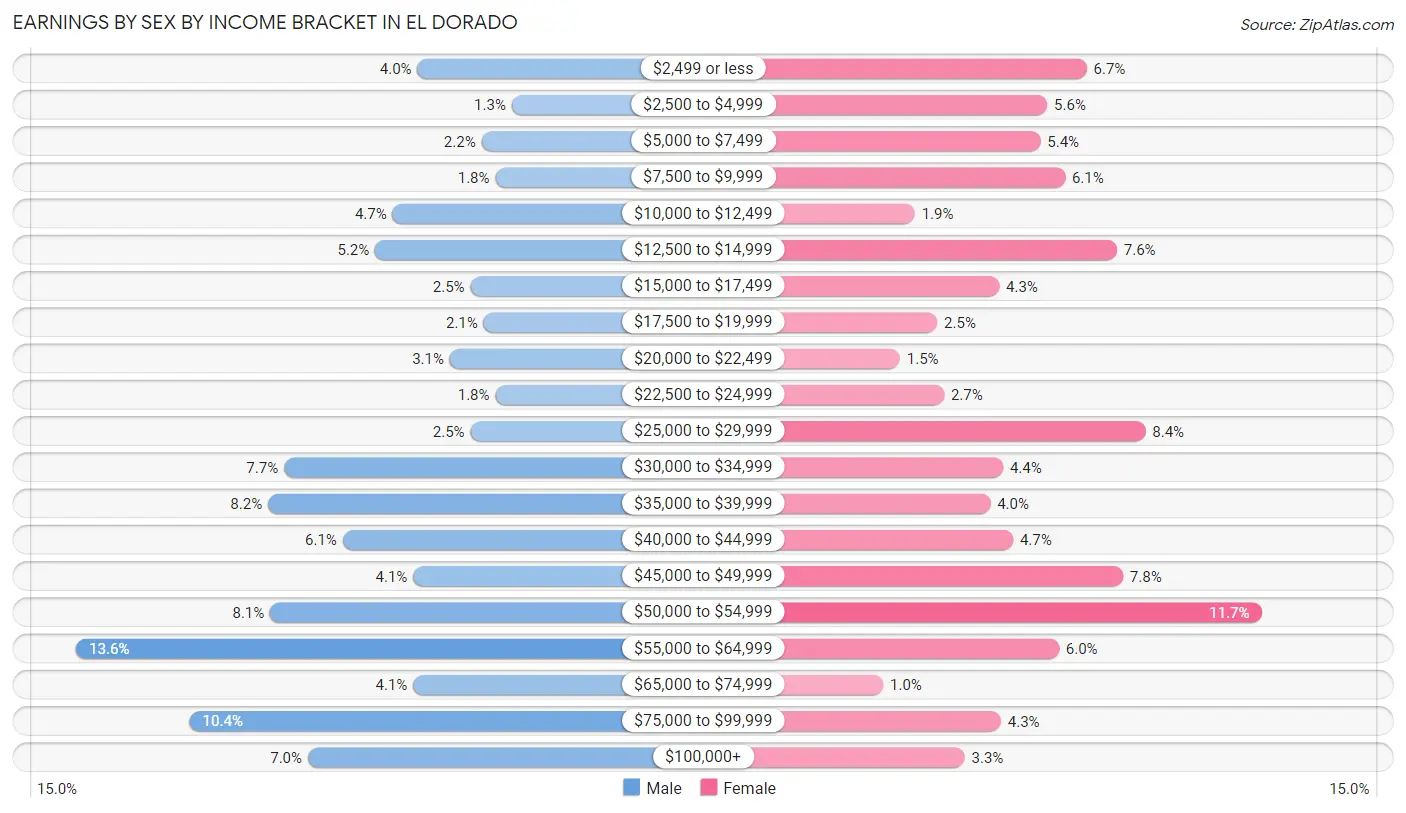
Earnings by Sex by Income Bracket in El Dorado
The most common earnings brackets in El Dorado are $55,000 to $64,999 for men (445 | 13.6%) and $50,000 to $54,999 for women (422 | 11.7%).
| Income | Male | Female |
| $2,499 or less | 130 (4.0%) | 244 (6.7%) |
| $2,500 to $4,999 | 43 (1.3%) | 204 (5.6%) |
| $5,000 to $7,499 | 71 (2.2%) | 197 (5.4%) |
| $7,500 to $9,999 | 58 (1.8%) | 222 (6.1%) |
| $10,000 to $12,499 | 153 (4.7%) | 69 (1.9%) |
| $12,500 to $14,999 | 169 (5.1%) | 275 (7.6%) |
| $15,000 to $17,499 | 81 (2.5%) | 155 (4.3%) |
| $17,500 to $19,999 | 69 (2.1%) | 92 (2.5%) |
| $20,000 to $22,499 | 100 (3.0%) | 54 (1.5%) |
| $22,500 to $24,999 | 58 (1.8%) | 99 (2.7%) |
| $25,000 to $29,999 | 81 (2.5%) | 304 (8.4%) |
| $30,000 to $34,999 | 253 (7.7%) | 159 (4.4%) |
| $35,000 to $39,999 | 268 (8.2%) | 146 (4.0%) |
| $40,000 to $44,999 | 199 (6.1%) | 169 (4.7%) |
| $45,000 to $49,999 | 134 (4.1%) | 281 (7.8%) |
| $50,000 to $54,999 | 266 (8.1%) | 422 (11.7%) |
| $55,000 to $64,999 | 445 (13.6%) | 216 (6.0%) |
| $65,000 to $74,999 | 134 (4.1%) | 37 (1.0%) |
| $75,000 to $99,999 | 340 (10.4%) | 157 (4.3%) |
| $100,000+ | 231 (7.0%) | 120 (3.3%) |
| Total | 3,283 (100.0%) | 3,622 (100.0%) |
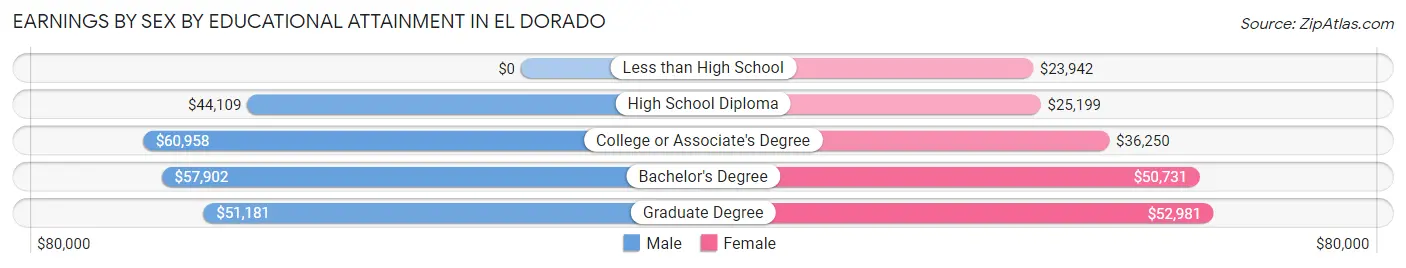
Earnings by Sex by Educational Attainment in El Dorado
Average earnings in El Dorado are $52,484 for men and $40,104 for women, a difference of 23.6%. Men with an educational attainment of college or associate's degree enjoy the highest average annual earnings of $60,958, while those with high school diploma education earn the least with $44,109. Women with an educational attainment of graduate degree earn the most with the average annual earnings of $52,981, while those with less than high school education have the smallest earnings of $23,942.
| Educational Attainment | Male Income | Female Income |
| Less than High School | - | - |
| High School Diploma | $44,109 | $25,199 |
| College or Associate's Degree | $60,958 | $36,250 |
| Bachelor's Degree | $57,902 | $50,731 |
| Graduate Degree | $51,181 | $52,981 |
| Total | $52,484 | $40,104 |
Family Income in El Dorado
Family Income Brackets in El Dorado
According to the El Dorado family income data, there are 805 families falling into the $100,000 to $149,999 income range, which is the most common income bracket and makes up 24.4% of all families. Conversely, the $10,000 to $14,999 income bracket is the least frequent group with only 56 families (1.7%) belonging to this category.
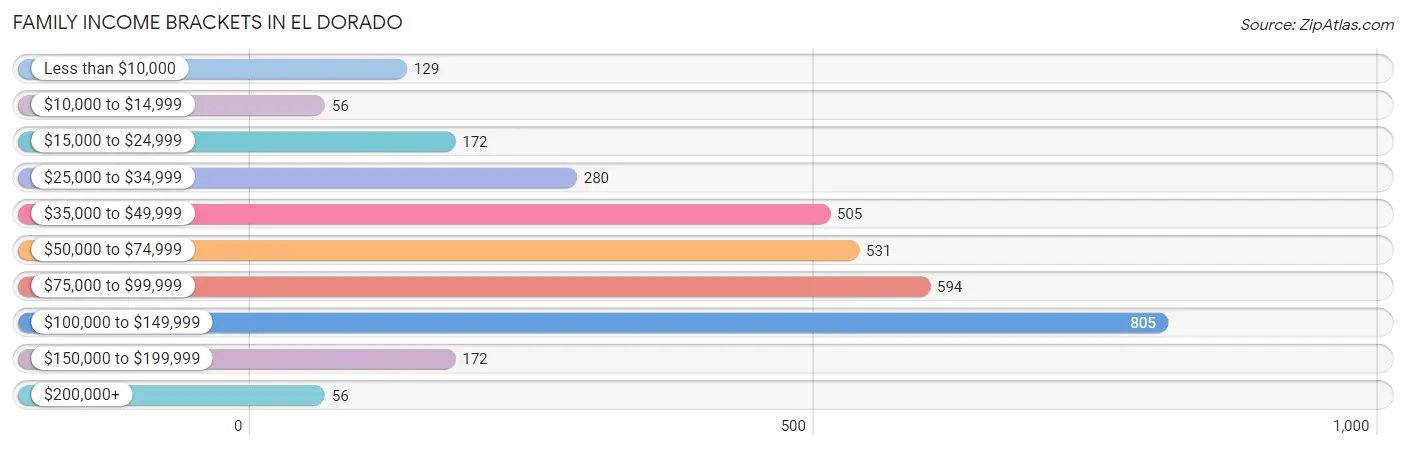
| Income Bracket | # Families | % Families |
| Less than $10,000 | 129 | 3.9% |
| $10,000 to $14,999 | 56 | 1.7% |
| $15,000 to $24,999 | 172 | 5.2% |
| $25,000 to $34,999 | 280 | 8.5% |
| $35,000 to $49,999 | 505 | 15.3% |
| $50,000 to $74,999 | 531 | 16.1% |
| $75,000 to $99,999 | 594 | 18.0% |
| $100,000 to $149,999 | 805 | 24.4% |
| $150,000 to $199,999 | 172 | 5.2% |
| $200,000+ | 56 | 1.7% |
Family Income by Famaliy Size in El Dorado
4-person families (666 | 20.2%) account for the highest median family income in El Dorado with $103,314 per family, while 2-person families (1,533 | 46.5%) have the highest median income of $29,961 per family member.
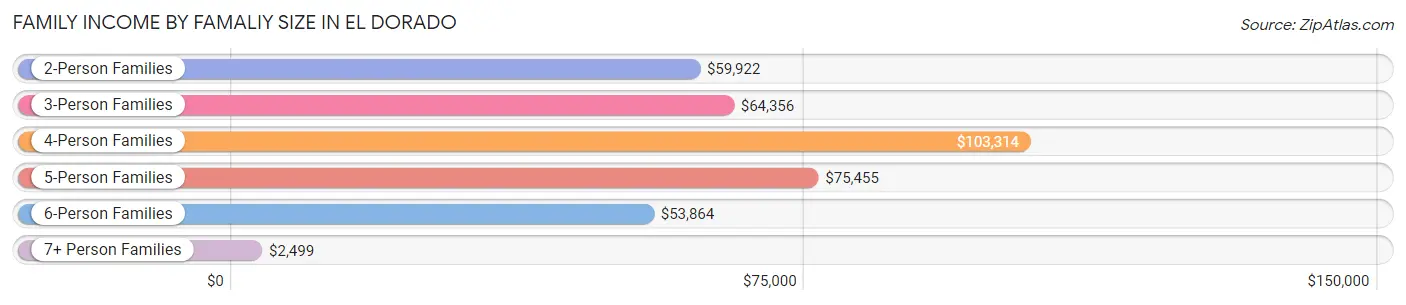
| Income Bracket | # Families | Median Income |
| 2-Person Families | 1,533 (46.5%) | $59,922 |
| 3-Person Families | 755 (22.9%) | $64,356 |
| 4-Person Families | 666 (20.2%) | $103,314 |
| 5-Person Families | 192 (5.8%) | $75,455 |
| 6-Person Families | 66 (2.0%) | $53,864 |
| 7+ Person Families | 88 (2.7%) | $2,499 |
| Total | 3,300 (100.0%) | $74,214 |
Family Income by Number of Earners in El Dorado
The median family income in El Dorado is $74,214, with families comprising 3+ earners (202) having the highest median family income of $129,375, while families with no earners (577) have the lowest median family income of $42,994, accounting for 6.1% and 17.5% of families, respectively.
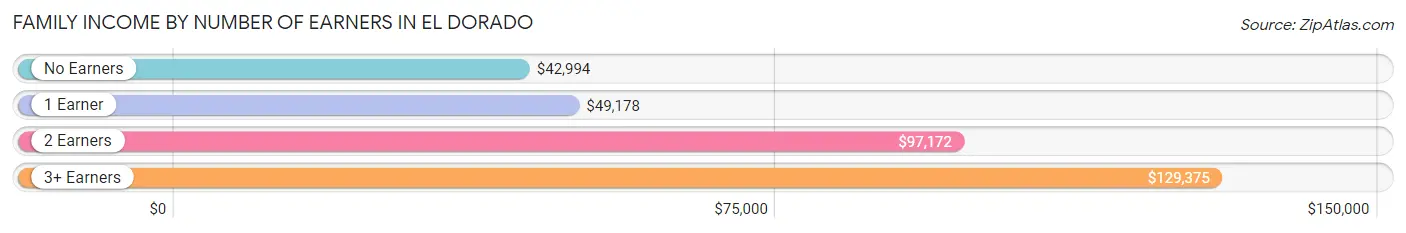
| Number of Earners | # Families | Median Income |
| No Earners | 577 (17.5%) | $42,994 |
| 1 Earner | 979 (29.7%) | $49,178 |
| 2 Earners | 1,542 (46.7%) | $97,172 |
| 3+ Earners | 202 (6.1%) | $129,375 |
| Total | 3,300 (100.0%) | $74,214 |
Household Income in El Dorado
Household Income Brackets in El Dorado
With 1,054 households falling in the category, the $35,000 to $49,999 income range is the most frequent in El Dorado, accounting for 19.7% of all households. In contrast, only 54 households (1.0%) fall into the $200,000+ income bracket, making it the least populous group.
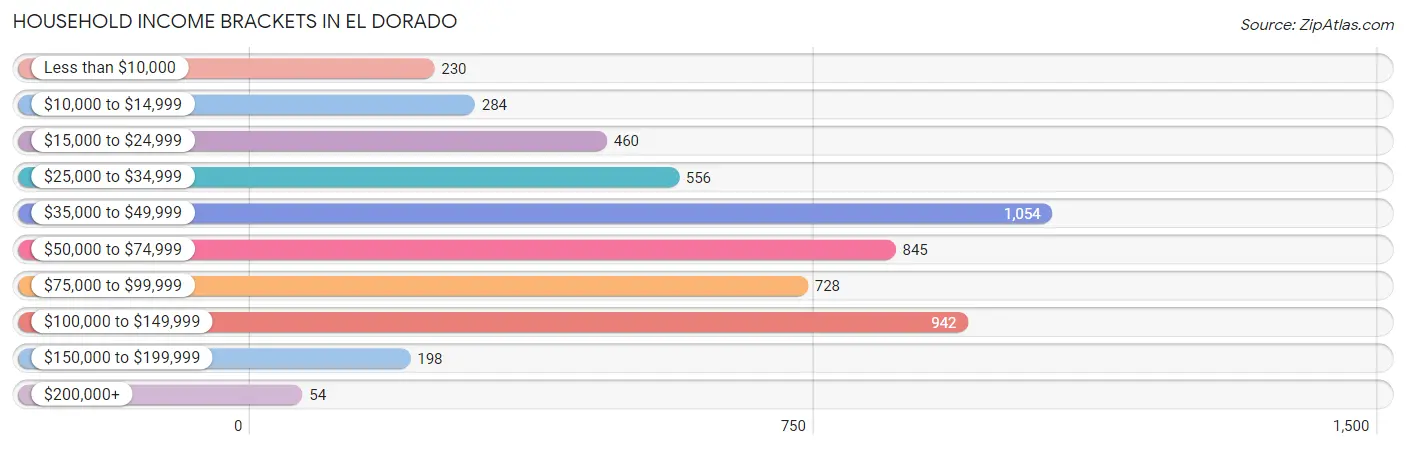
| Income Bracket | # Households | % Households |
| Less than $10,000 | 230 | 4.3% |
| $10,000 to $14,999 | 284 | 5.3% |
| $15,000 to $24,999 | 460 | 8.6% |
| $25,000 to $34,999 | 556 | 10.4% |
| $35,000 to $49,999 | 1,054 | 19.7% |
| $50,000 to $74,999 | 845 | 15.8% |
| $75,000 to $99,999 | 728 | 13.6% |
| $100,000 to $149,999 | 942 | 17.6% |
| $150,000 to $199,999 | 198 | 3.7% |
| $200,000+ | 54 | 1.0% |
Household Income by Householder Age in El Dorado
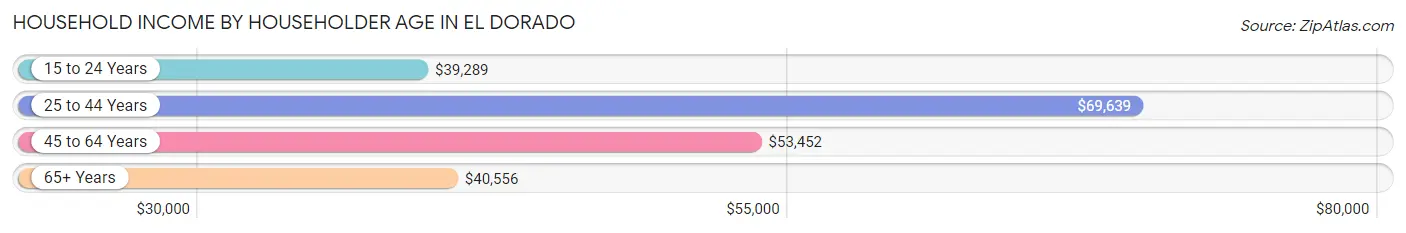
The median household income in El Dorado is $52,921, with the highest median household income of $69,639 found in the 25 to 44 years age bracket for the primary householder. A total of 1,641 households (30.7%) fall into this category. Meanwhile, the 15 to 24 years age bracket for the primary householder has the lowest median household income of $39,289, with 616 households (11.5%) in this group.
| Income Bracket | # Households | Median Income |
| 15 to 24 Years | 616 (11.5%) | $39,289 |
| 25 to 44 Years | 1,641 (30.7%) | $69,639 |
| 45 to 64 Years | 1,715 (32.1%) | $53,452 |
| 65+ Years | 1,378 (25.8%) | $40,556 |
| Total | 5,350 (100.0%) | $52,921 |
Poverty in El Dorado
Income Below Poverty by Sex and Age in El Dorado
With 15.3% poverty level for males and 14.8% for females among the residents of El Dorado, 16 and 17 year old males and 5 year old females are the most vulnerable to poverty, with 46 males (31.3%) and 11 females (100.0%) in their respective age groups living below the poverty level.
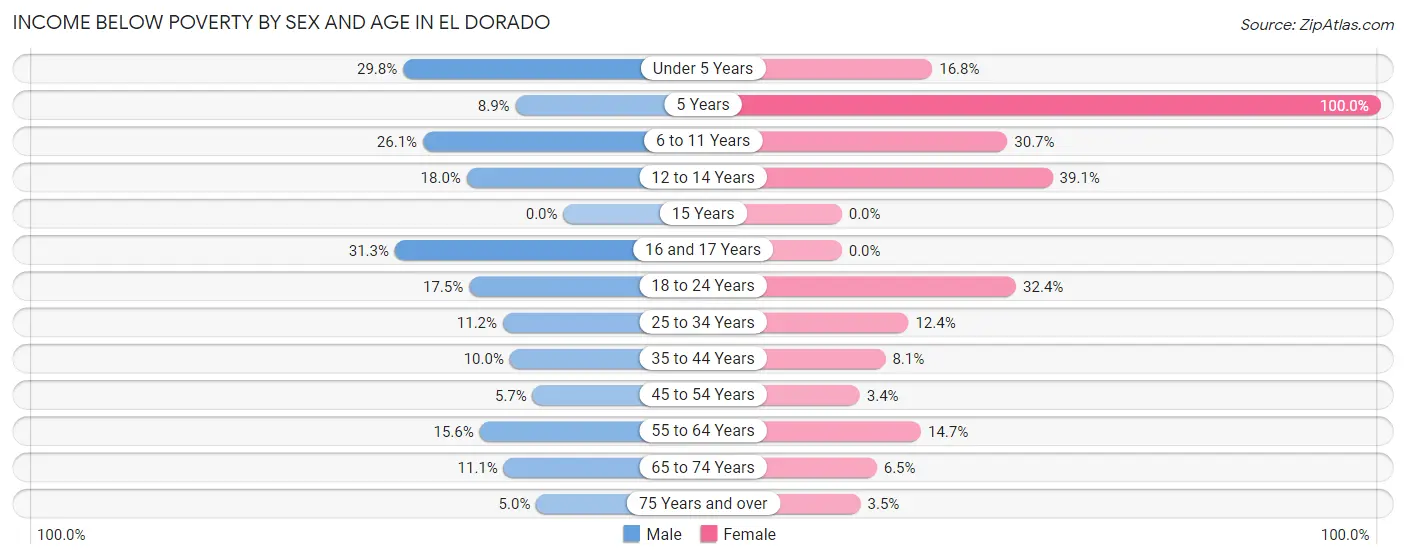
| Age Bracket | Male | Female |
| Under 5 Years | 186 (29.8%) | 65 (16.8%) |
| 5 Years | 8 (8.9%) | 11 (100.0%) |
| 6 to 11 Years | 134 (26.1%) | 122 (30.7%) |
| 12 to 14 Years | 56 (17.9%) | 119 (39.1%) |
| 15 Years | 0 (0.0%) | 0 (0.0%) |
| 16 and 17 Years | 46 (31.3%) | 0 (0.0%) |
| 18 to 24 Years | 124 (17.5%) | 210 (32.4%) |
| 25 to 34 Years | 71 (11.2%) | 117 (12.4%) |
| 35 to 44 Years | 75 (10.0%) | 45 (8.1%) |
| 45 to 54 Years | 34 (5.7%) | 22 (3.4%) |
| 55 to 64 Years | 113 (15.6%) | 135 (14.7%) |
| 65 to 74 Years | 50 (11.1%) | 43 (6.5%) |
| 75 Years and over | 19 (5.0%) | 15 (3.5%) |
| Total | 916 (15.3%) | 904 (14.8%) |
Income Above Poverty by Sex and Age in El Dorado
According to the poverty statistics in El Dorado, males aged 15 years and females aged 15 years are the age groups that are most secure financially, with 100.0% of males and 100.0% of females in these age groups living above the poverty line.
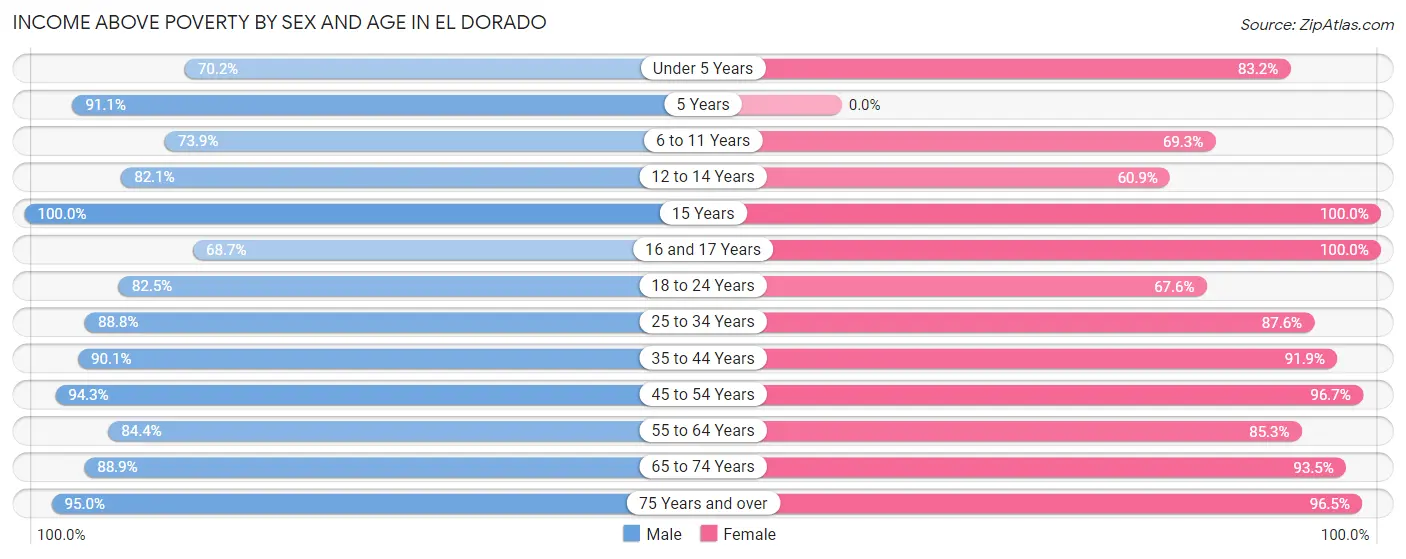
| Age Bracket | Male | Female |
| Under 5 Years | 439 (70.2%) | 322 (83.2%) |
| 5 Years | 82 (91.1%) | 0 (0.0%) |
| 6 to 11 Years | 380 (73.9%) | 275 (69.3%) |
| 12 to 14 Years | 256 (82.1%) | 185 (60.9%) |
| 15 Years | 60 (100.0%) | 41 (100.0%) |
| 16 and 17 Years | 101 (68.7%) | 150 (100.0%) |
| 18 to 24 Years | 584 (82.5%) | 439 (67.6%) |
| 25 to 34 Years | 561 (88.8%) | 828 (87.6%) |
| 35 to 44 Years | 679 (90.0%) | 510 (91.9%) |
| 45 to 54 Years | 563 (94.3%) | 635 (96.7%) |
| 55 to 64 Years | 613 (84.4%) | 783 (85.3%) |
| 65 to 74 Years | 401 (88.9%) | 620 (93.5%) |
| 75 Years and over | 359 (95.0%) | 415 (96.5%) |
| Total | 5,078 (84.7%) | 5,203 (85.2%) |
Income Below Poverty Among Married-Couple Families in El Dorado
The poverty statistics for married-couple families in El Dorado show that 2.8% or 69 of the total 2,464 families live below the poverty line. Families with 5 or more children have the highest poverty rate of 100.0%, comprising of 29 families. On the other hand, families with 3 or 4 children have the lowest poverty rate of 0.0%, which includes 0 families.
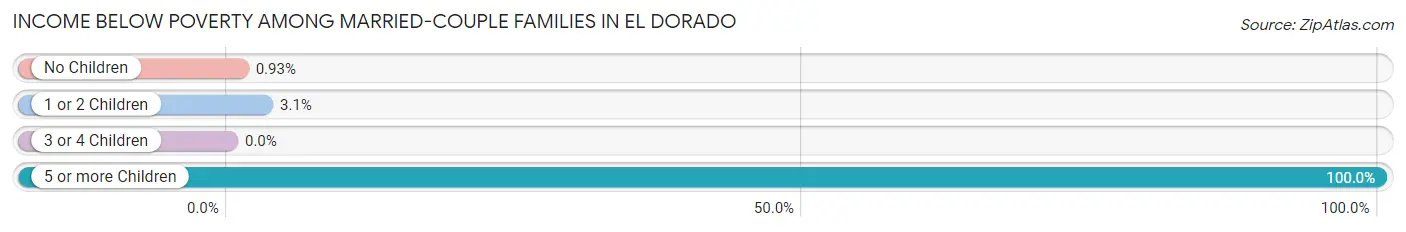
| Children | Above Poverty | Below Poverty |
| No Children | 1,278 (99.1%) | 12 (0.9%) |
| 1 or 2 Children | 891 (97.0%) | 28 (3.0%) |
| 3 or 4 Children | 226 (100.0%) | 0 (0.0%) |
| 5 or more Children | 0 (0.0%) | 29 (100.0%) |
| Total | 2,395 (97.2%) | 69 (2.8%) |
Income Below Poverty Among Single-Parent Households in El Dorado
According to the poverty data in El Dorado, 39.7% or 98 single-father households and 24.1% or 142 single-mother households are living below the poverty line. Among single-father households, those with 3 or 4 children have the highest poverty rate, with 32 households (68.1%) experiencing poverty. Likewise, among single-mother households, those with 5 or more children have the highest poverty rate, with 33 households (100.0%) falling below the poverty line.
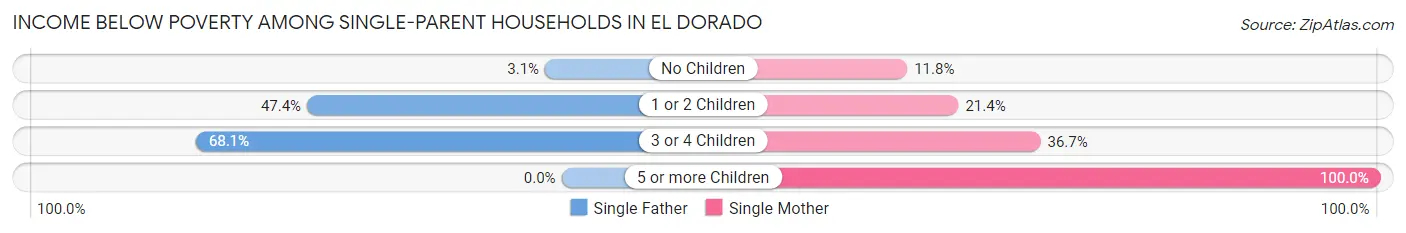
| Children | Single Father | Single Mother |
| No Children | 2 (3.1%) | 18 (11.8%) |
| 1 or 2 Children | 64 (47.4%) | 80 (21.4%) |
| 3 or 4 Children | 32 (68.1%) | 11 (36.7%) |
| 5 or more Children | 0 (0.0%) | 33 (100.0%) |
| Total | 98 (39.7%) | 142 (24.1%) |
Income Below Poverty Among Married-Couple vs Single-Parent Households in El Dorado
The poverty data for El Dorado shows that 69 of the married-couple family households (2.8%) and 240 of the single-parent households (28.7%) are living below the poverty level. Within the married-couple family households, those with 5 or more children have the highest poverty rate, with 29 households (100.0%) falling below the poverty line. Among the single-parent households, those with 5 or more children have the highest poverty rate, with 33 household (100.0%) living below poverty.
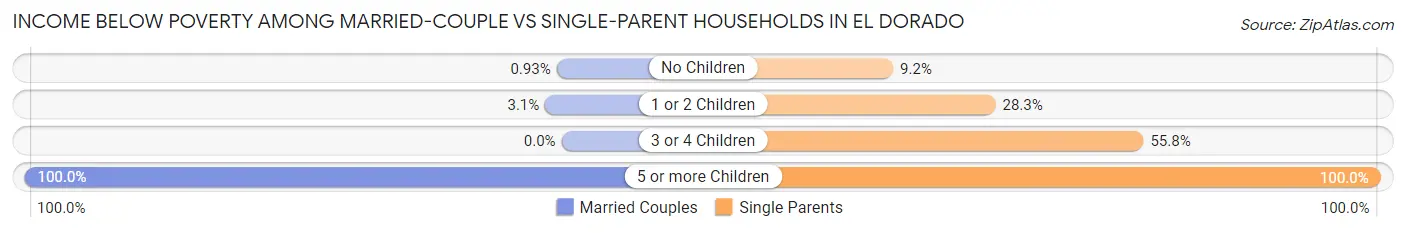
| Children | Married-Couple Families | Single-Parent Households |
| No Children | 12 (0.9%) | 20 (9.2%) |
| 1 or 2 Children | 28 (3.0%) | 144 (28.3%) |
| 3 or 4 Children | 0 (0.0%) | 43 (55.8%) |
| 5 or more Children | 29 (100.0%) | 33 (100.0%) |
| Total | 69 (2.8%) | 240 (28.7%) |
Race in El Dorado
The most populous races in El Dorado are White / Caucasian (11,408 | 88.6%), Two or more Races (763 | 5.9%), and Hispanic or Latino (576 | 4.5%).
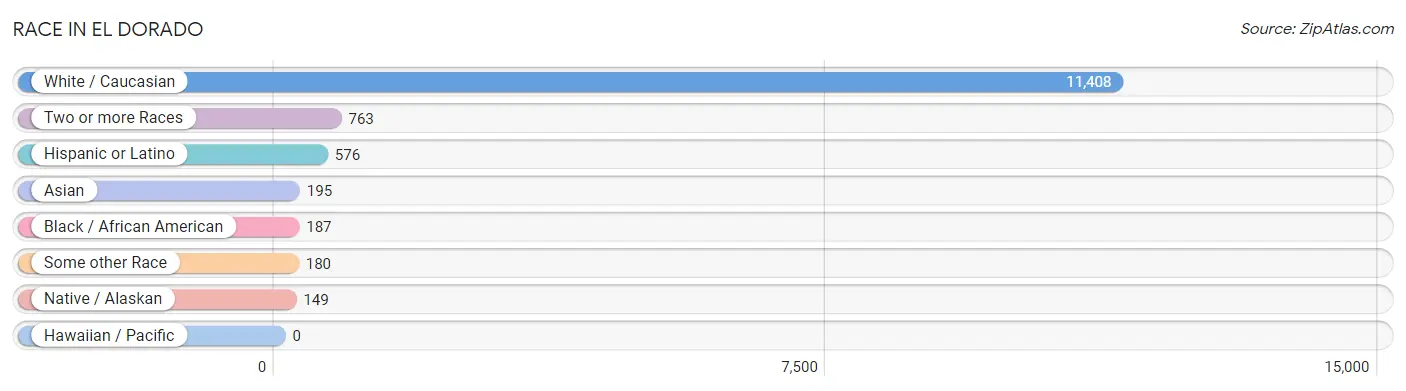
| Race | # Population | % Population |
| Asian | 195 | 1.5% |
| Black / African American | 187 | 1.5% |
| Hawaiian / Pacific | 0 | 0.0% |
| Hispanic or Latino | 576 | 4.5% |
| Native / Alaskan | 149 | 1.2% |
| White / Caucasian | 11,408 | 88.6% |
| Two or more Races | 763 | 5.9% |
| Some other Race | 180 | 1.4% |
| Total | 12,882 | 100.0% |
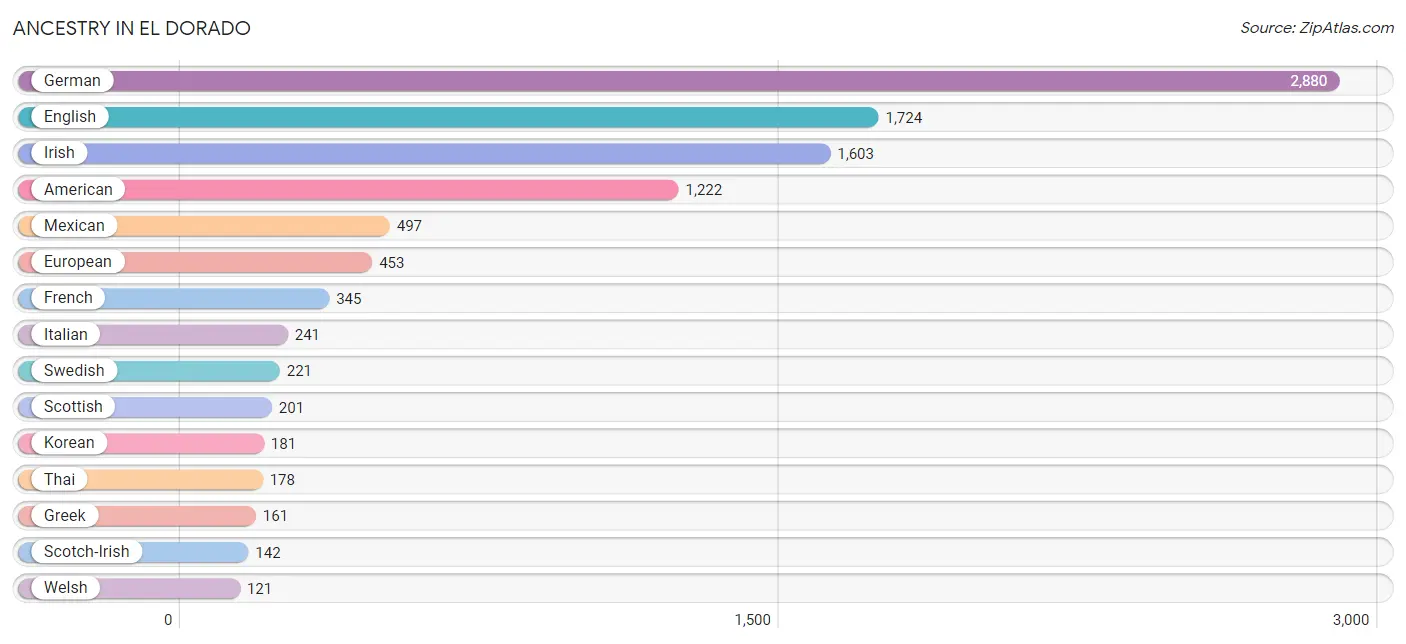
Ancestry in El Dorado
The most populous ancestries reported in El Dorado are German (2,880 | 22.4%), English (1,724 | 13.4%), Irish (1,603 | 12.4%), American (1,222 | 9.5%), and Mexican (497 | 3.9%), together accounting for 61.5% of all El Dorado residents.
| Ancestry | # Population | % Population |
| American | 1,222 | 9.5% |
| Arab | 15 | 0.1% |
| Armenian | 2 | 0.0% |
| Austrian | 6 | 0.1% |
| Bhutanese | 10 | 0.1% |
| British | 26 | 0.2% |
| Canadian | 10 | 0.1% |
| Central American | 45 | 0.4% |
| Cherokee | 47 | 0.4% |
| Chickasaw | 46 | 0.4% |
| Choctaw | 60 | 0.5% |
| Cuban | 24 | 0.2% |
| Czech | 23 | 0.2% |
| Czechoslovakian | 53 | 0.4% |
| Danish | 61 | 0.5% |
| Dutch | 51 | 0.4% |
| English | 1,724 | 13.4% |
| European | 453 | 3.5% |
| Finnish | 36 | 0.3% |
| French | 345 | 2.7% |
| French American Indian | 6 | 0.1% |
| French Canadian | 57 | 0.4% |
| German | 2,880 | 22.4% |
| Greek | 161 | 1.3% |
| Guatemalan | 29 | 0.2% |
| Irish | 1,603 | 12.4% |
| Iroquois | 2 | 0.0% |
| Italian | 241 | 1.9% |
| Korean | 181 | 1.4% |
| Latvian | 9 | 0.1% |
| Lithuanian | 22 | 0.2% |
| Mexican | 497 | 3.9% |
| Native Hawaiian | 11 | 0.1% |
| Northern European | 23 | 0.2% |
| Norwegian | 88 | 0.7% |
| Pennsylvania German | 29 | 0.2% |
| Polish | 21 | 0.2% |
| Portuguese | 18 | 0.1% |
| Russian | 78 | 0.6% |
| Salvadoran | 16 | 0.1% |
| Scandinavian | 44 | 0.3% |
| Scotch-Irish | 142 | 1.1% |
| Scottish | 201 | 1.6% |
| Sioux | 4 | 0.0% |
| Slovak | 7 | 0.1% |
| Slovene | 14 | 0.1% |
| Spanish | 2 | 0.0% |
| Sri Lankan | 9 | 0.1% |
| Swedish | 221 | 1.7% |
| Thai | 178 | 1.4% |
| Welsh | 121 | 0.9% | View All 51 Rows |
Immigrants in El Dorado
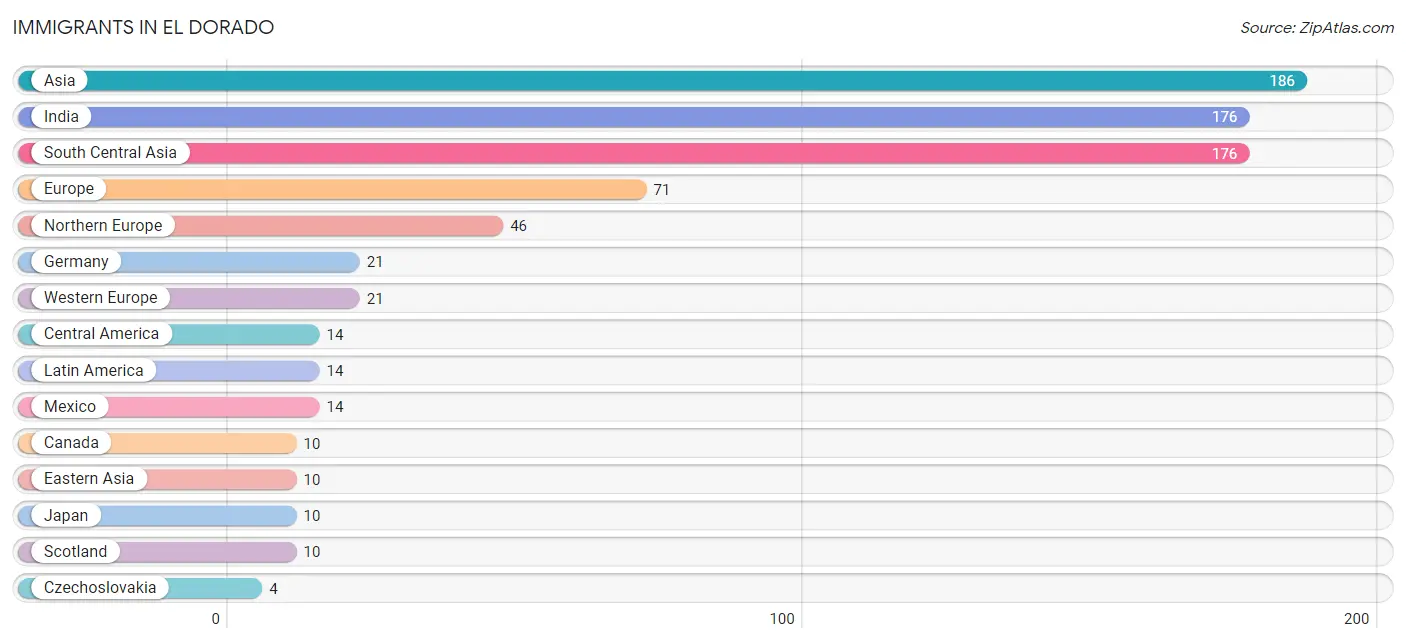
The most numerous immigrant groups reported in El Dorado came from Asia (186 | 1.4%), India (176 | 1.4%), South Central Asia (176 | 1.4%), Europe (71 | 0.5%), and Northern Europe (46 | 0.4%), together accounting for 5.1% of all El Dorado residents.
| Immigration Origin | # Population | % Population |
| Asia | 186 | 1.4% |
| Canada | 10 | 0.1% |
| Central America | 14 | 0.1% |
| Czechoslovakia | 4 | 0.0% |
| Eastern Asia | 10 | 0.1% |
| Eastern Europe | 4 | 0.0% |
| Europe | 71 | 0.5% |
| Germany | 21 | 0.2% |
| India | 176 | 1.4% |
| Japan | 10 | 0.1% |
| Latin America | 14 | 0.1% |
| Mexico | 14 | 0.1% |
| Northern Europe | 46 | 0.4% |
| Scotland | 10 | 0.1% |
| South Central Asia | 176 | 1.4% |
| Western Europe | 21 | 0.2% | View All 16 Rows |
Sex and Age in El Dorado
Sex and Age in El Dorado
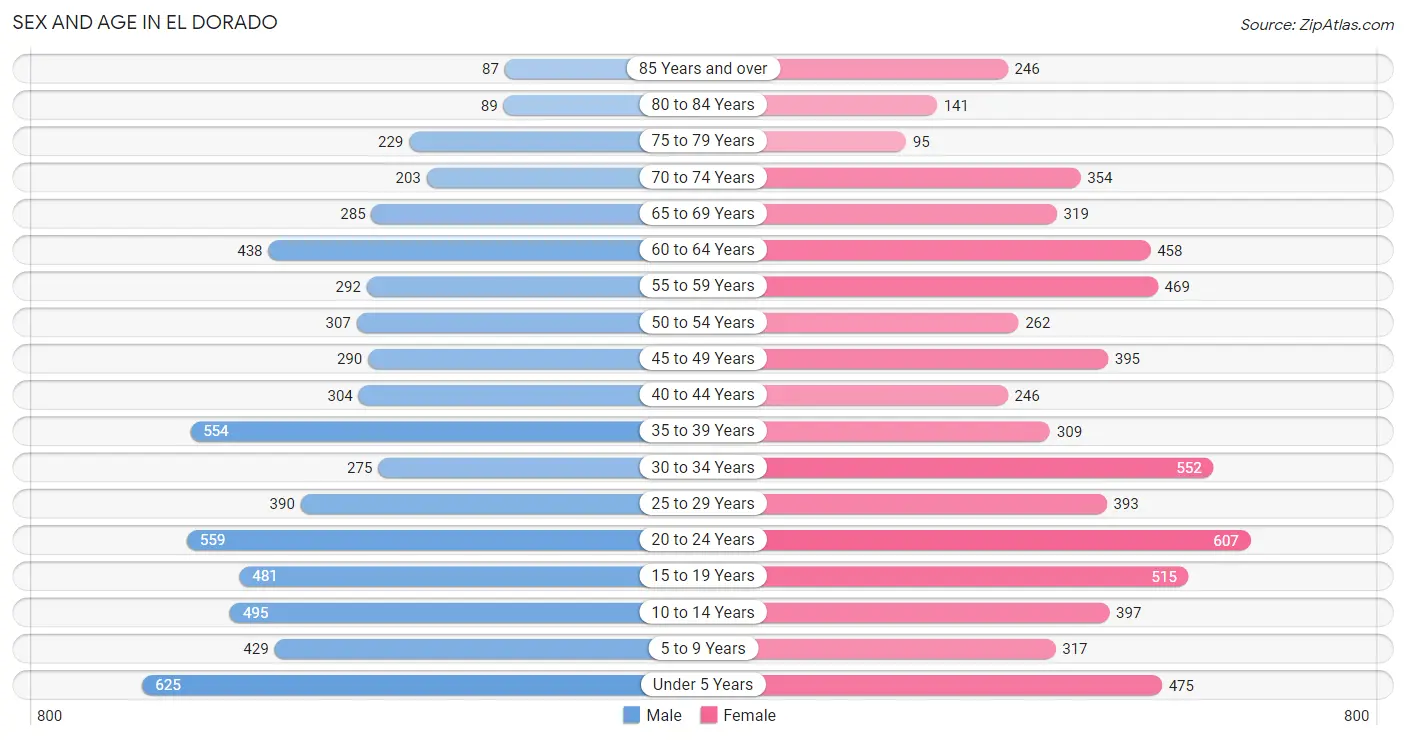
The most populous age groups in El Dorado are Under 5 Years (625 | 9.9%) for men and 20 to 24 Years (607 | 9.3%) for women.
| Age Bracket | Male | Female |
| Under 5 Years | 625 (9.9%) | 475 (7.2%) |
| 5 to 9 Years | 429 (6.8%) | 317 (4.8%) |
| 10 to 14 Years | 495 (7.8%) | 397 (6.1%) |
| 15 to 19 Years | 481 (7.6%) | 515 (7.9%) |
| 20 to 24 Years | 559 (8.8%) | 607 (9.3%) |
| 25 to 29 Years | 390 (6.2%) | 393 (6.0%) |
| 30 to 34 Years | 275 (4.3%) | 552 (8.4%) |
| 35 to 39 Years | 554 (8.7%) | 309 (4.7%) |
| 40 to 44 Years | 304 (4.8%) | 246 (3.8%) |
| 45 to 49 Years | 290 (4.6%) | 395 (6.0%) |
| 50 to 54 Years | 307 (4.9%) | 262 (4.0%) |
| 55 to 59 Years | 292 (4.6%) | 469 (7.2%) |
| 60 to 64 Years | 438 (6.9%) | 458 (7.0%) |
| 65 to 69 Years | 285 (4.5%) | 319 (4.9%) |
| 70 to 74 Years | 203 (3.2%) | 354 (5.4%) |
| 75 to 79 Years | 229 (3.6%) | 95 (1.5%) |
| 80 to 84 Years | 89 (1.4%) | 141 (2.1%) |
| 85 Years and over | 87 (1.4%) | 246 (3.8%) |
| Total | 6,332 (100.0%) | 6,550 (100.0%) |
Families and Households in El Dorado
Median Family Size in El Dorado
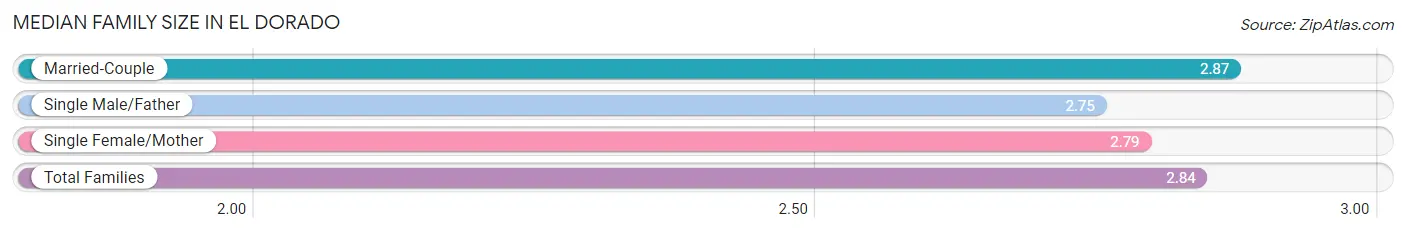
The median family size in El Dorado is 2.84 persons per family, with married-couple families (2,464 | 74.7%) accounting for the largest median family size of 2.87 persons per family. On the other hand, single male/father families (247 | 7.5%) represent the smallest median family size with 2.75 persons per family.
| Family Type | # Families | Family Size |
| Married-Couple | 2,464 (74.7%) | 2.87 |
| Single Male/Father | 247 (7.5%) | 2.75 |
| Single Female/Mother | 589 (17.8%) | 2.79 |
| Total Families | 3,300 (100.0%) | 2.84 |
Median Household Size in El Dorado
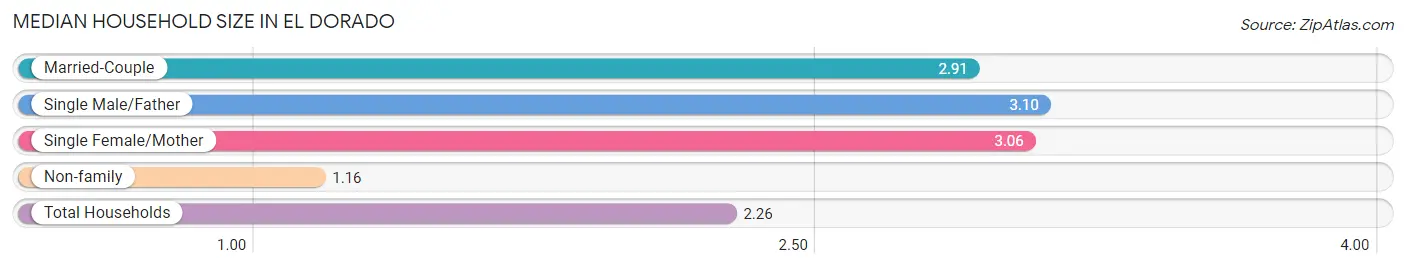
The median household size in El Dorado is 2.26 persons per household, with single male/father households (247 | 4.6%) accounting for the largest median household size of 3.1 persons per household. non-family households (2,050 | 38.3%) represent the smallest median household size with 1.16 persons per household.
| Household Type | # Households | Household Size |
| Married-Couple | 2,464 (46.1%) | 2.91 |
| Single Male/Father | 247 (4.6%) | 3.10 |
| Single Female/Mother | 589 (11.0%) | 3.06 |
| Non-family | 2,050 (38.3%) | 1.16 |
| Total Households | 5,350 (100.0%) | 2.26 |
Household Size by Marriage Status in El Dorado
Out of a total of 5,350 households in El Dorado, 3,300 (61.7%) are family households, while 2,050 (38.3%) are nonfamily households. The most numerous type of family households are 2-person households, comprising 1,406, and the most common type of nonfamily households are 1-person households, comprising 1,796.
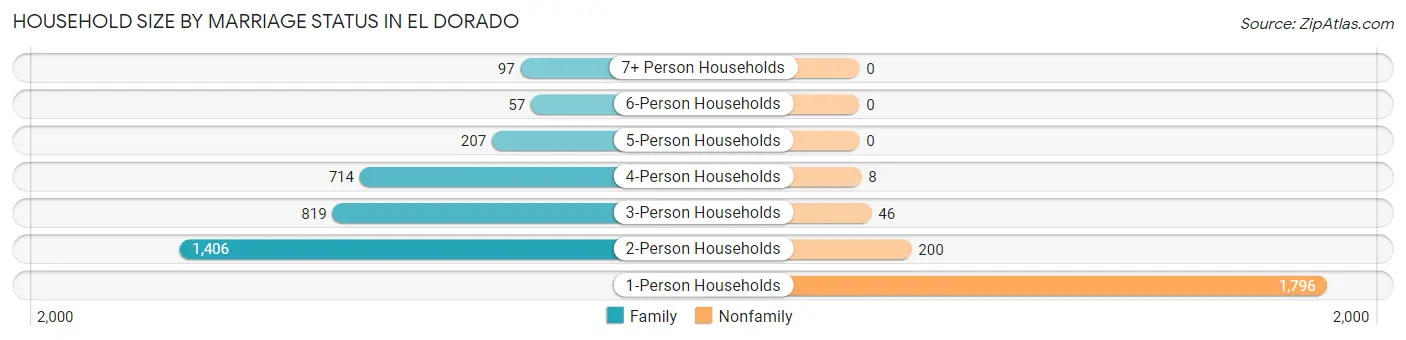
| Household Size | Family Households | Nonfamily Households |
| 1-Person Households | - | 1,796 (33.6%) |
| 2-Person Households | 1,406 (26.3%) | 200 (3.7%) |
| 3-Person Households | 819 (15.3%) | 46 (0.9%) |
| 4-Person Households | 714 (13.4%) | 8 (0.2%) |
| 5-Person Households | 207 (3.9%) | 0 (0.0%) |
| 6-Person Households | 57 (1.1%) | 0 (0.0%) |
| 7+ Person Households | 97 (1.8%) | 0 (0.0%) |
| Total | 3,300 (61.7%) | 2,050 (38.3%) |
Female Fertility in El Dorado
Fertility by Age in El Dorado
Average fertility rate in El Dorado is 127.0 births per 1,000 women. Women in the age bracket of 20 to 34 years have the highest fertility rate with 243.0 births per 1,000 women. Women in the age bracket of 20 to 34 years acount for 95.4% of all women with births.
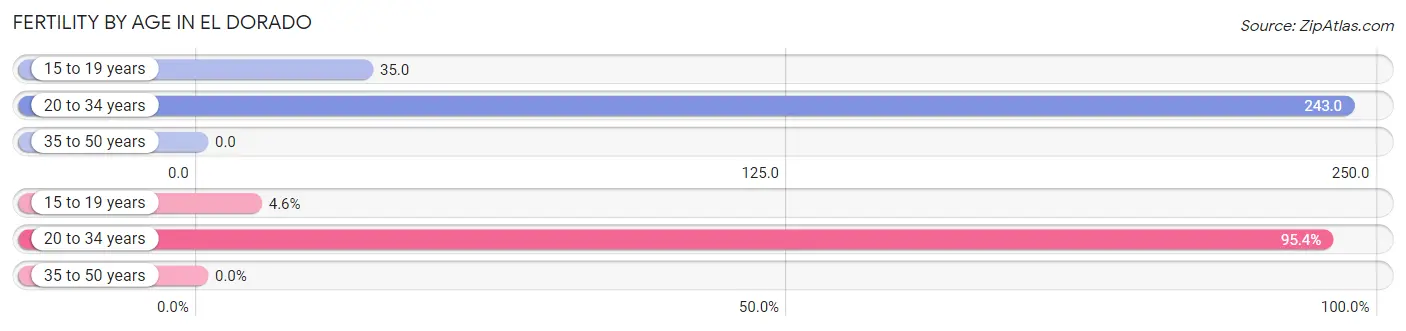
| Age Bracket | Women with Births | Births / 1,000 Women |
| 15 to 19 years | 18 (4.6%) | 35.0 |
| 20 to 34 years | 377 (95.4%) | 243.0 |
| 35 to 50 years | 0 (0.0%) | 0.0 |
| Total | 395 (100.0%) | 127.0 |
Fertility by Age by Marriage Status in El Dorado
84.1% of women with births (395) in El Dorado are married. The highest percentage of unmarried women with births falls into 15 to 19 years age bracket with 100.0% of them unmarried at the time of birth, while the lowest percentage of unmarried women with births belong to 20 to 34 years age bracket with 11.9% of them unmarried.
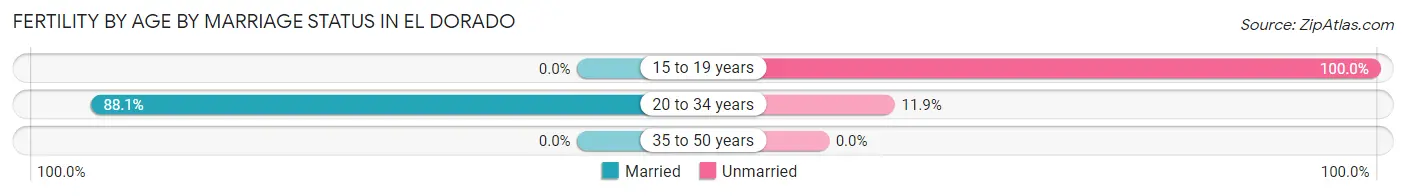
| Age Bracket | Married | Unmarried |
| 15 to 19 years | 0 (0.0%) | 18 (100.0%) |
| 20 to 34 years | 332 (88.1%) | 45 (11.9%) |
| 35 to 50 years | 0 (0.0%) | 0 (0.0%) |
| Total | 332 (84.1%) | 63 (16.0%) |
Fertility by Education in El Dorado
Average fertility rate in El Dorado is 127.0 births per 1,000 women. Women with the education attainment of bachelor's degree have the highest fertility rate of 396.0 births per 1,000 women, while women with the education attainment of college or associate's degree have the lowest fertility at 36.0 births per 1,000 women. Women with the education attainment of bachelor's degree represent 50.4% of all women with births.
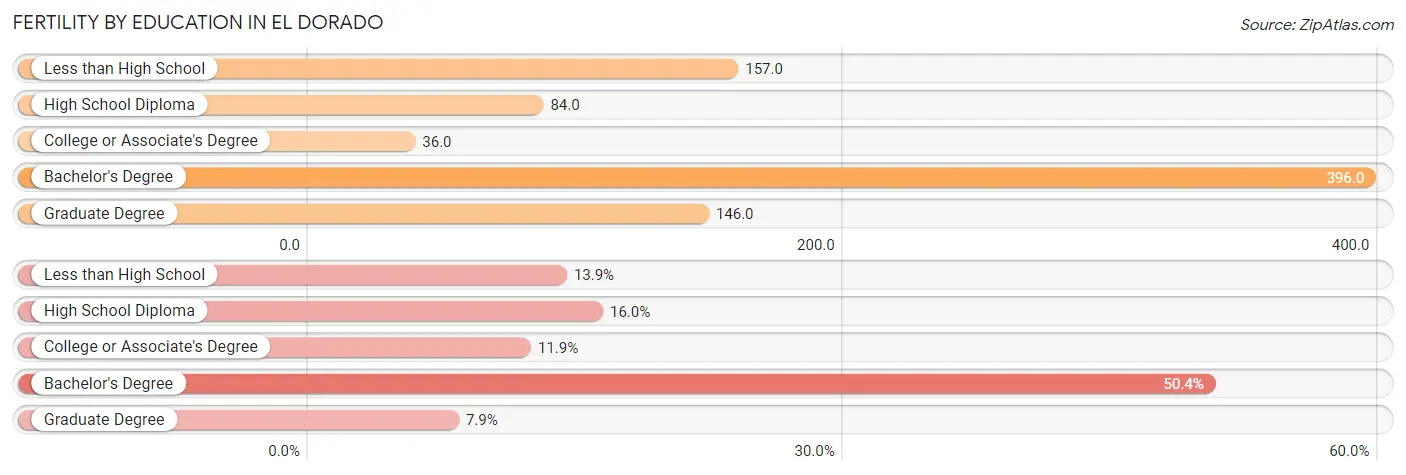
| Educational Attainment | Women with Births | Births / 1,000 Women |
| Less than High School | 55 (13.9%) | 157.0 |
| High School Diploma | 63 (16.0%) | 84.0 |
| College or Associate's Degree | 47 (11.9%) | 36.0 |
| Bachelor's Degree | 199 (50.4%) | 396.0 |
| Graduate Degree | 31 (7.9%) | 146.0 |
| Total | 395 (100.0%) | 127.0 |
Fertility by Education by Marriage Status in El Dorado
16.0% of women with births in El Dorado are unmarried. Women with the educational attainment of college or associate's degree are most likely to be married with 100.0% of them married at childbirth, while women with the educational attainment of high school diploma are least likely to be married with 58.7% of them unmarried at childbirth.
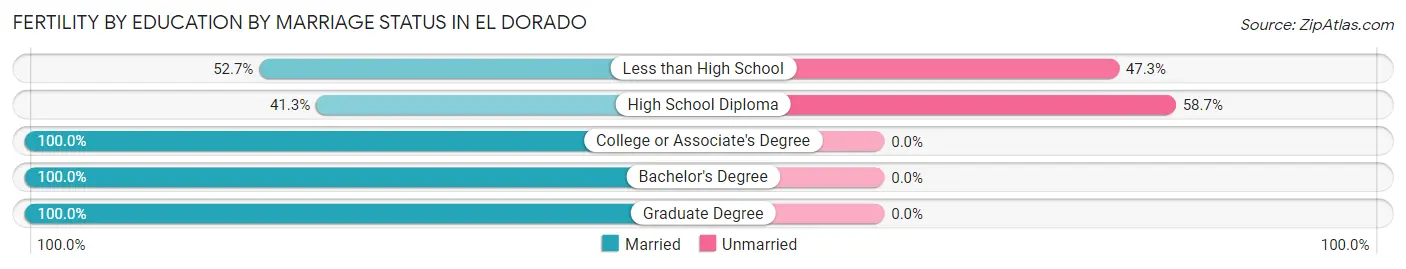
| Educational Attainment | Married | Unmarried |
| Less than High School | 29 (52.7%) | 26 (47.3%) |
| High School Diploma | 26 (41.3%) | 37 (58.7%) |
| College or Associate's Degree | 47 (100.0%) | 0 (0.0%) |
| Bachelor's Degree | 199 (100.0%) | 0 (0.0%) |
| Graduate Degree | 31 (100.0%) | 0 (0.0%) |
| Total | 332 (84.1%) | 63 (16.0%) |
Employment Characteristics in El Dorado
Employment by Class of Employer in El Dorado
Among the 6,330 employed individuals in El Dorado, private company employees (3,833 | 60.6%), local government employees (981 | 15.5%), and not-for-profit organizations (570 | 9.0%) make up the most common classes of employment.
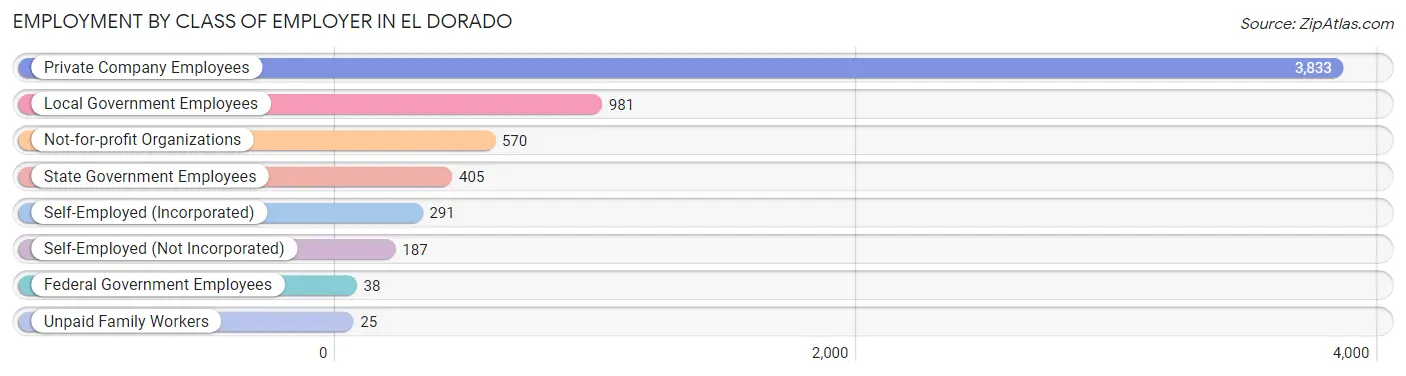
| Employer Class | # Employees | % Employees |
| Private Company Employees | 3,833 | 60.6% |
| Self-Employed (Incorporated) | 291 | 4.6% |
| Self-Employed (Not Incorporated) | 187 | 2.9% |
| Not-for-profit Organizations | 570 | 9.0% |
| Local Government Employees | 981 | 15.5% |
| State Government Employees | 405 | 6.4% |
| Federal Government Employees | 38 | 0.6% |
| Unpaid Family Workers | 25 | 0.4% |
| Total | 6,330 | 100.0% |
Employment Status by Age in El Dorado
According to the labor force statistics for El Dorado, out of the total population over 16 years of age (10,043), 65.9% or 6,618 individuals are in the labor force, with 3.4% or 225 of them unemployed. The age group with the highest labor force participation rate is 20 to 24 years, with 87.1% or 1,016 individuals in the labor force. Within the labor force, the 16 to 19 years age range has the highest percentage of unemployed individuals, with 7.0% or 37 of them being unemployed.
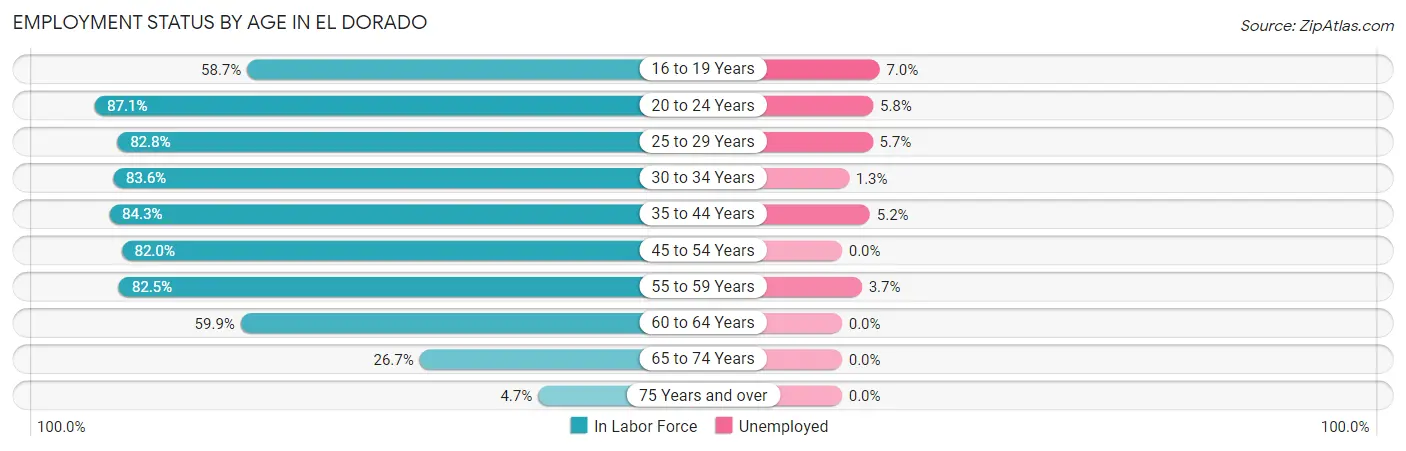
| Age Bracket | In Labor Force | Unemployed |
| 16 to 19 Years | 525 (58.7%) | 37 (7.0%) |
| 20 to 24 Years | 1,016 (87.1%) | 59 (5.8%) |
| 25 to 29 Years | 648 (82.8%) | 37 (5.7%) |
| 30 to 34 Years | 691 (83.6%) | 9 (1.3%) |
| 35 to 44 Years | 1,191 (84.3%) | 62 (5.2%) |
| 45 to 54 Years | 1,028 (82.0%) | 0 (0.0%) |
| 55 to 59 Years | 628 (82.5%) | 23 (3.7%) |
| 60 to 64 Years | 537 (59.9%) | 0 (0.0%) |
| 65 to 74 Years | 310 (26.7%) | 0 (0.0%) |
| 75 Years and over | 42 (4.7%) | 0 (0.0%) |
| Total | 6,618 (65.9%) | 225 (3.4%) |
Employment Status by Educational Attainment in El Dorado
According to labor force statistics for El Dorado, 79.6% of individuals (4,723) out of the total population between 25 and 64 years of age (5,934) are in the labor force, with 2.8% or 132 of them being unemployed. The group with the highest labor force participation rate are those with the educational attainment of bachelor's degree or higher, with 93.3% or 1,610 individuals in the labor force. Within the labor force, individuals with bachelor's degree or higher education have the highest percentage of unemployment, with 4.3% or 69 of them being unemployed.
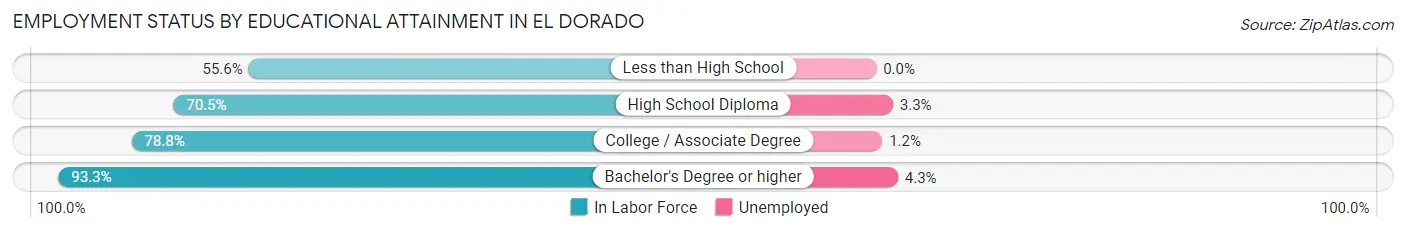
| Educational Attainment | In Labor Force | Unemployed |
| Less than High School | 145 (55.6%) | 0 (0.0%) |
| High School Diploma | 1,218 (70.5%) | 57 (3.3%) |
| College / Associate Degree | 1,749 (78.8%) | 27 (1.2%) |
| Bachelor's Degree or higher | 1,610 (93.3%) | 74 (4.3%) |
| Total | 4,723 (79.6%) | 166 (2.8%) |
Employment Occupations by Sex in El Dorado
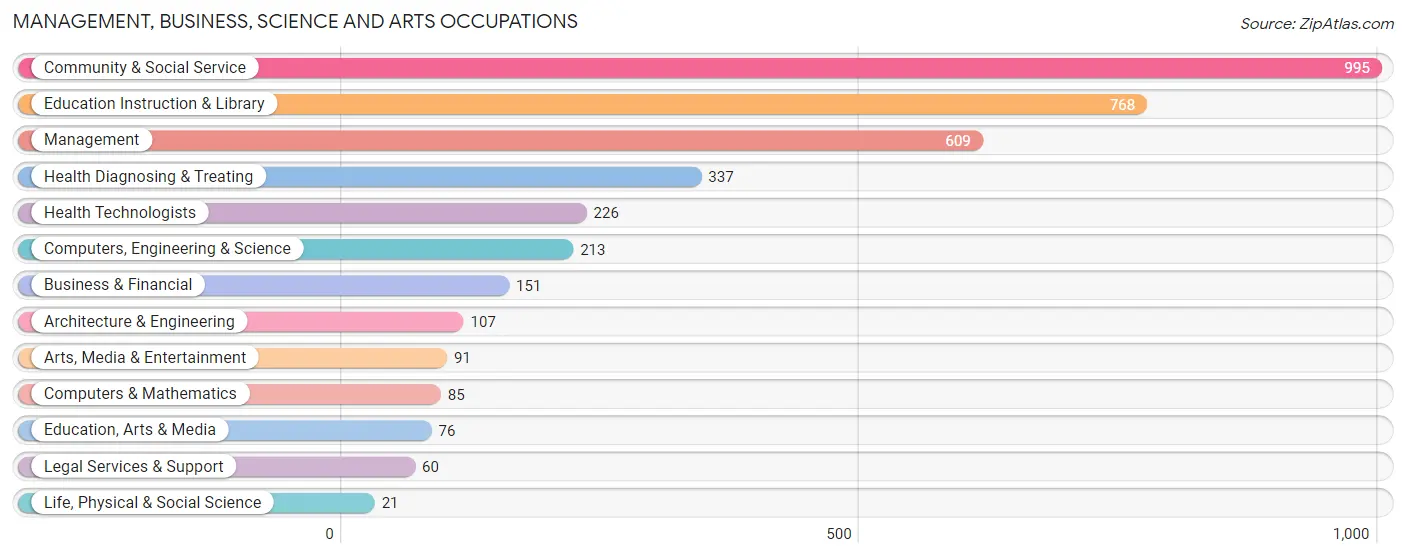
Management, Business, Science and Arts Occupations
The most common Management, Business, Science and Arts occupations in El Dorado are Community & Social Service (995 | 15.6%), Education Instruction & Library (768 | 12.0%), Management (609 | 9.5%), Health Diagnosing & Treating (337 | 5.3%), and Health Technologists (226 | 3.5%).
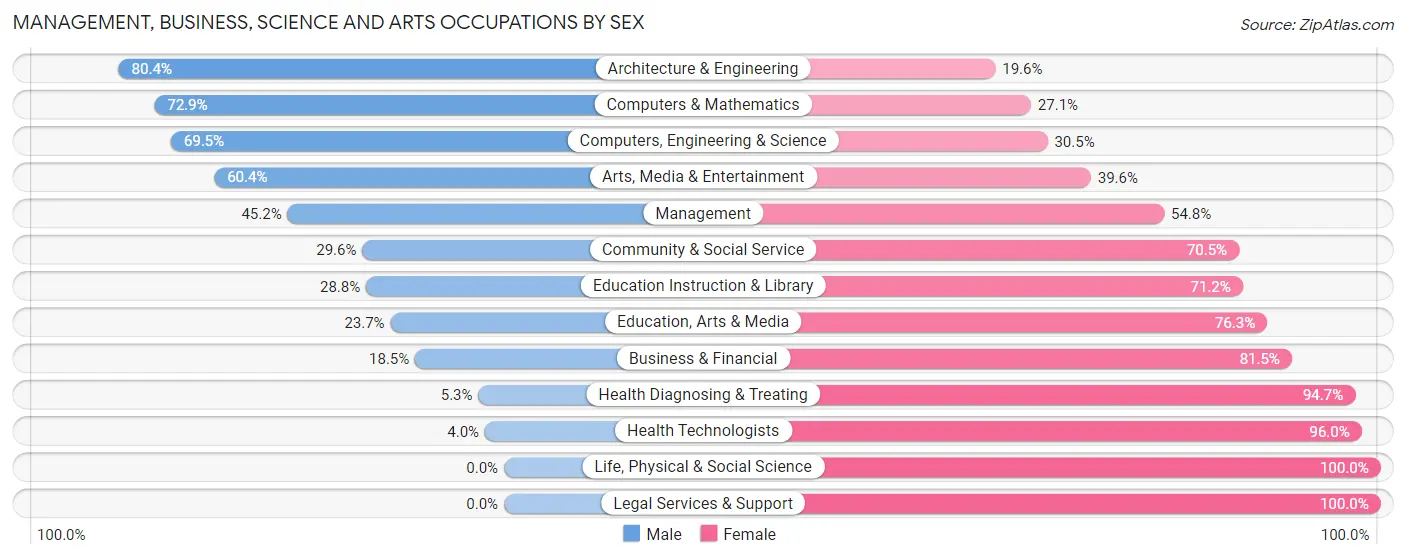
Management, Business, Science and Arts Occupations by Sex
Within the Management, Business, Science and Arts occupations in El Dorado, the most male-oriented occupations are Architecture & Engineering (80.4%), Computers & Mathematics (72.9%), and Computers, Engineering & Science (69.5%), while the most female-oriented occupations are Life, Physical & Social Science (100.0%), Legal Services & Support (100.0%), and Health Technologists (96.0%).
| Occupation | Male | Female |
| Management | 275 (45.2%) | 334 (54.8%) |
| Business & Financial | 28 (18.5%) | 123 (81.5%) |
| Computers, Engineering & Science | 148 (69.5%) | 65 (30.5%) |
| Computers & Mathematics | 62 (72.9%) | 23 (27.1%) |
| Architecture & Engineering | 86 (80.4%) | 21 (19.6%) |
| Life, Physical & Social Science | 0 (0.0%) | 21 (100.0%) |
| Community & Social Service | 294 (29.5%) | 701 (70.5%) |
| Education, Arts & Media | 18 (23.7%) | 58 (76.3%) |
| Legal Services & Support | 0 (0.0%) | 60 (100.0%) |
| Education Instruction & Library | 221 (28.8%) | 547 (71.2%) |
| Arts, Media & Entertainment | 55 (60.4%) | 36 (39.6%) |
| Health Diagnosing & Treating | 18 (5.3%) | 319 (94.7%) |
| Health Technologists | 9 (4.0%) | 217 (96.0%) |
| Total (Category) | 763 (33.1%) | 1,542 (66.9%) |
| Total (Overall) | 3,064 (48.0%) | 3,325 (52.0%) |
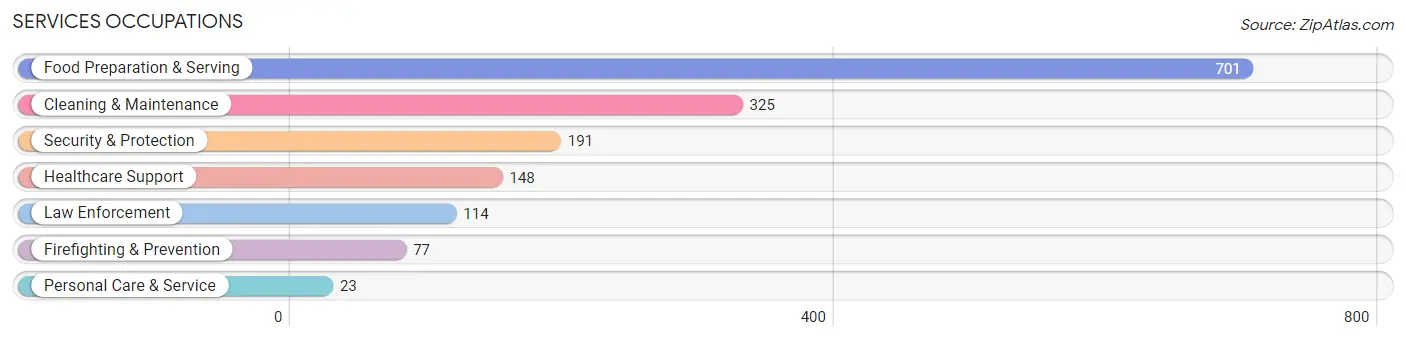
Services Occupations
The most common Services occupations in El Dorado are Food Preparation & Serving (701 | 11.0%), Cleaning & Maintenance (325 | 5.1%), Security & Protection (191 | 3.0%), Healthcare Support (148 | 2.3%), and Law Enforcement (114 | 1.8%).
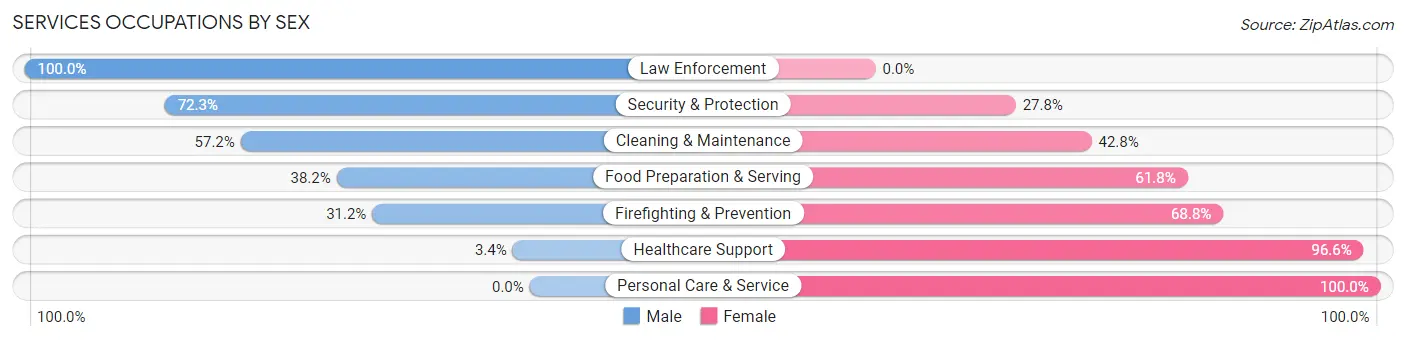
Services Occupations by Sex
Within the Services occupations in El Dorado, the most male-oriented occupations are Law Enforcement (100.0%), Security & Protection (72.3%), and Cleaning & Maintenance (57.2%), while the most female-oriented occupations are Personal Care & Service (100.0%), Healthcare Support (96.6%), and Firefighting & Prevention (68.8%).
| Occupation | Male | Female |
| Healthcare Support | 5 (3.4%) | 143 (96.6%) |
| Security & Protection | 138 (72.3%) | 53 (27.8%) |
| Firefighting & Prevention | 24 (31.2%) | 53 (68.8%) |
| Law Enforcement | 114 (100.0%) | 0 (0.0%) |
| Food Preparation & Serving | 268 (38.2%) | 433 (61.8%) |
| Cleaning & Maintenance | 186 (57.2%) | 139 (42.8%) |
| Personal Care & Service | 0 (0.0%) | 23 (100.0%) |
| Total (Category) | 597 (43.0%) | 791 (57.0%) |
| Total (Overall) | 3,064 (48.0%) | 3,325 (52.0%) |
Sales and Office Occupations
The most common Sales and Office occupations in El Dorado are Office & Administration (799 | 12.5%), and Sales & Related (460 | 7.2%).
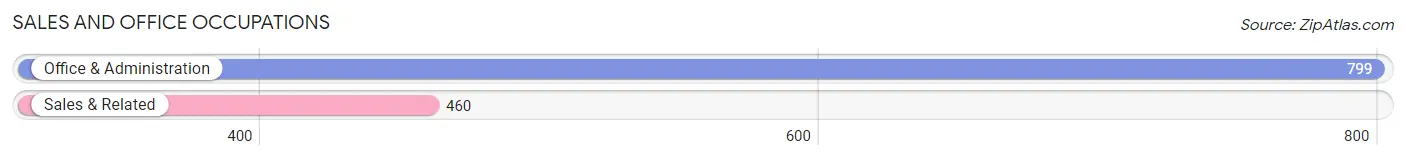
Sales and Office Occupations by Sex
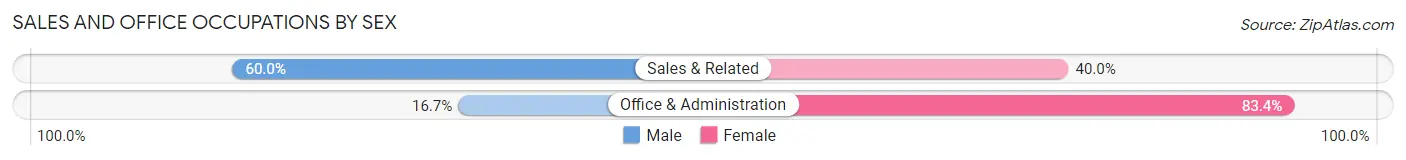
| Occupation | Male | Female |
| Sales & Related | 276 (60.0%) | 184 (40.0%) |
| Office & Administration | 133 (16.7%) | 666 (83.4%) |
| Total (Category) | 409 (32.5%) | 850 (67.5%) |
| Total (Overall) | 3,064 (48.0%) | 3,325 (52.0%) |
Natural Resources, Construction and Maintenance Occupations
The most common Natural Resources, Construction and Maintenance occupations in El Dorado are Construction & Extraction (275 | 4.3%), Installation, Maintenance & Repair (243 | 3.8%), and Farming, Fishing & Forestry (14 | 0.2%).
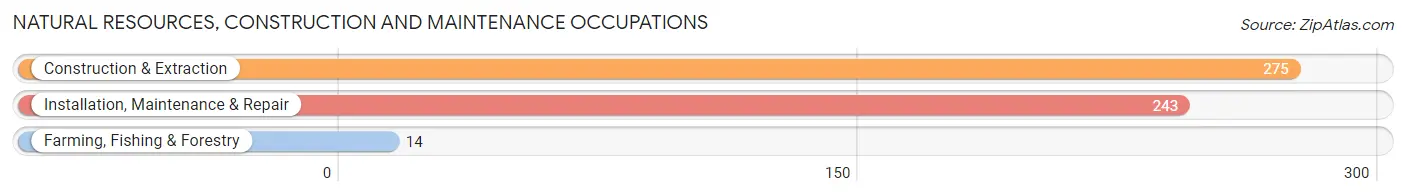
Natural Resources, Construction and Maintenance Occupations by Sex
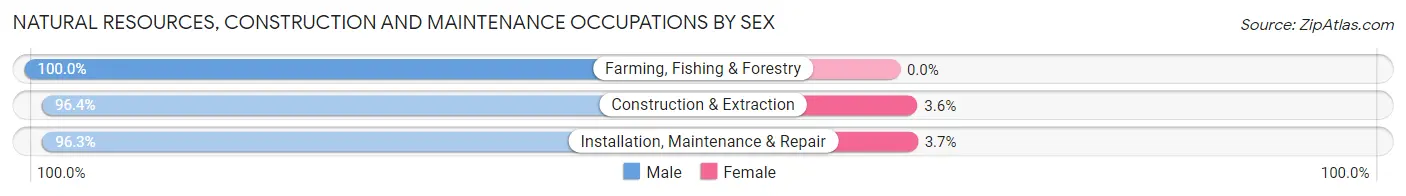
| Occupation | Male | Female |
| Farming, Fishing & Forestry | 14 (100.0%) | 0 (0.0%) |
| Construction & Extraction | 265 (96.4%) | 10 (3.6%) |
| Installation, Maintenance & Repair | 234 (96.3%) | 9 (3.7%) |
| Total (Category) | 513 (96.4%) | 19 (3.6%) |
| Total (Overall) | 3,064 (48.0%) | 3,325 (52.0%) |
Production, Transportation and Moving Occupations
The most common Production, Transportation and Moving occupations in El Dorado are Production (490 | 7.7%), Material Moving (225 | 3.5%), and Transportation (190 | 3.0%).
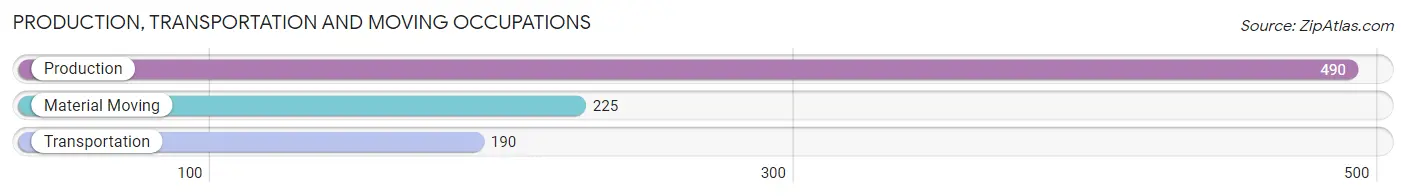
Production, Transportation and Moving Occupations by Sex
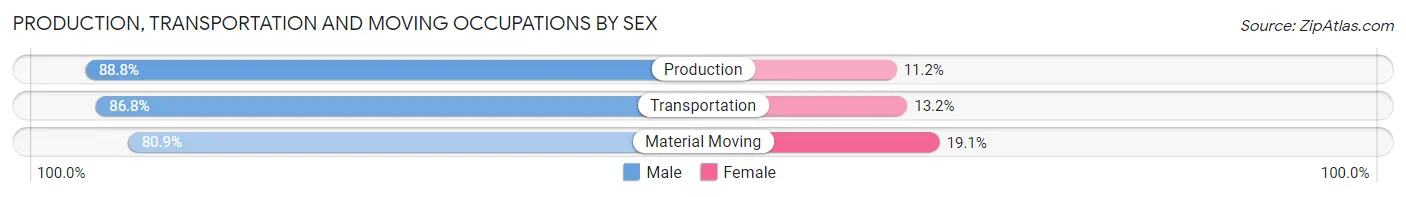
| Occupation | Male | Female |
| Production | 435 (88.8%) | 55 (11.2%) |
| Transportation | 165 (86.8%) | 25 (13.2%) |
| Material Moving | 182 (80.9%) | 43 (19.1%) |
| Total (Category) | 782 (86.4%) | 123 (13.6%) |
| Total (Overall) | 3,064 (48.0%) | 3,325 (52.0%) |
Employment Industries by Sex in El Dorado
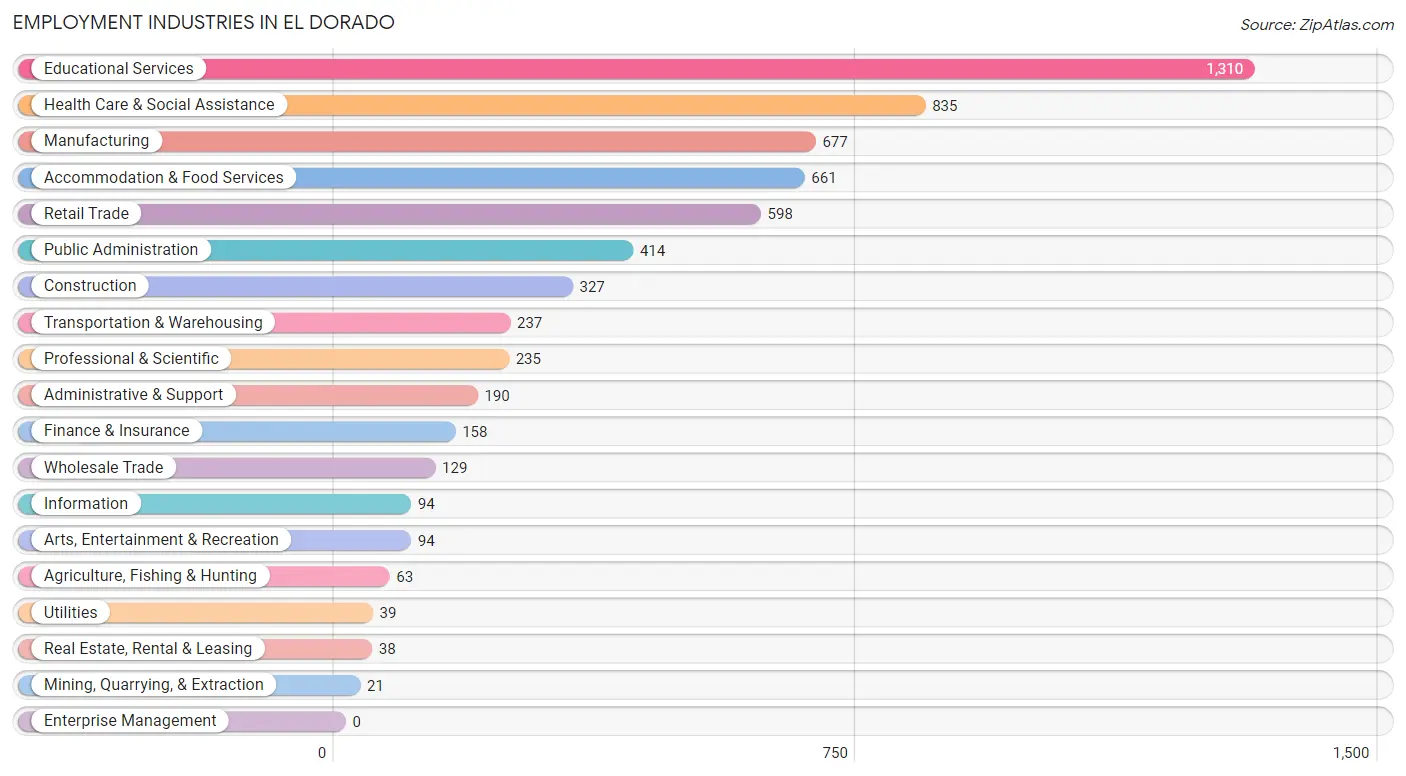
Employment Industries in El Dorado
The major employment industries in El Dorado include Educational Services (1,310 | 20.5%), Health Care & Social Assistance (835 | 13.1%), Manufacturing (677 | 10.6%), Accommodation & Food Services (661 | 10.3%), and Retail Trade (598 | 9.4%).
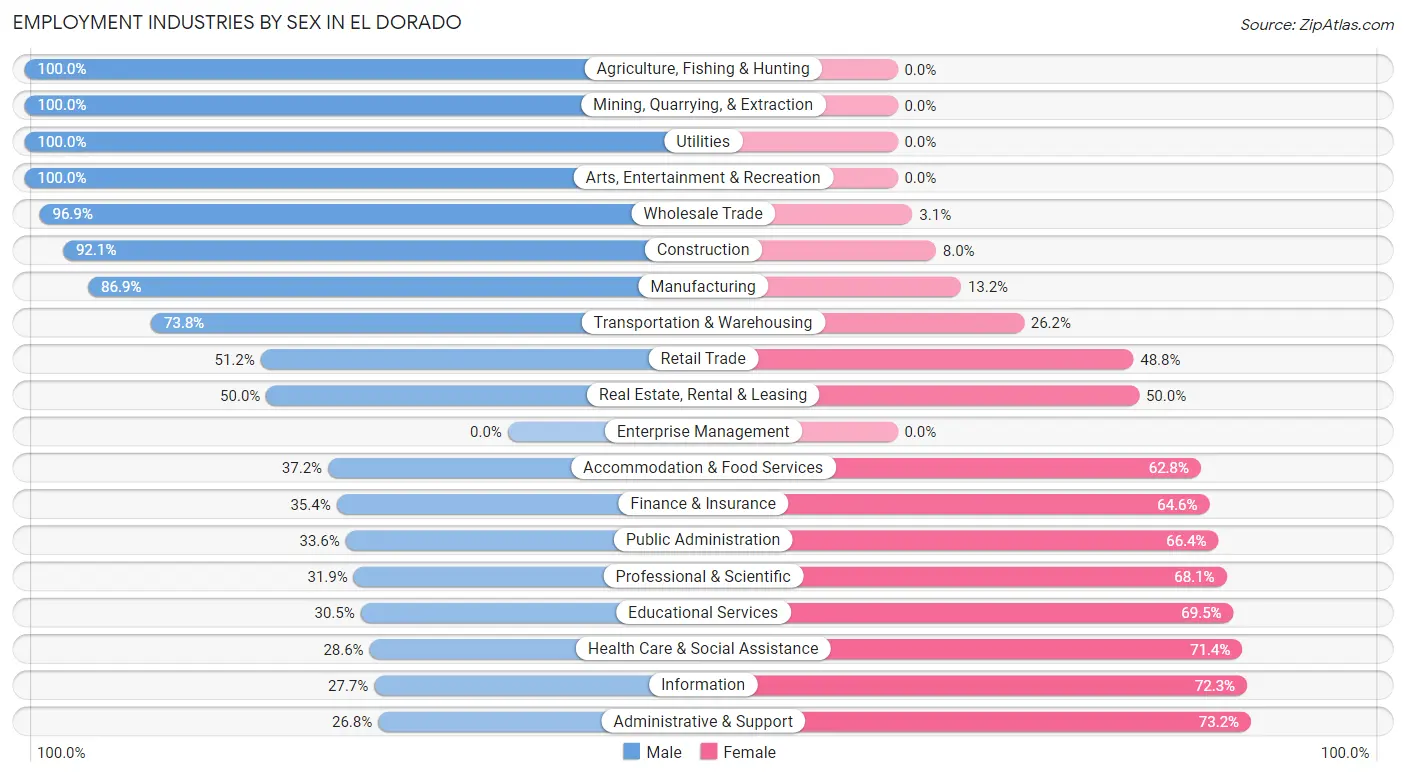
Employment Industries by Sex in El Dorado
The El Dorado industries that see more men than women are Agriculture, Fishing & Hunting (100.0%), Mining, Quarrying, & Extraction (100.0%), and Utilities (100.0%), whereas the industries that tend to have a higher number of women are Administrative & Support (73.2%), Information (72.3%), and Health Care & Social Assistance (71.4%).
| Industry | Male | Female |
| Agriculture, Fishing & Hunting | 63 (100.0%) | 0 (0.0%) |
| Mining, Quarrying, & Extraction | 21 (100.0%) | 0 (0.0%) |
| Construction | 301 (92.0%) | 26 (8.0%) |
| Manufacturing | 588 (86.9%) | 89 (13.2%) |
| Wholesale Trade | 125 (96.9%) | 4 (3.1%) |
| Retail Trade | 306 (51.2%) | 292 (48.8%) |
| Transportation & Warehousing | 175 (73.8%) | 62 (26.2%) |
| Utilities | 39 (100.0%) | 0 (0.0%) |
| Information | 26 (27.7%) | 68 (72.3%) |
| Finance & Insurance | 56 (35.4%) | 102 (64.6%) |
| Real Estate, Rental & Leasing | 19 (50.0%) | 19 (50.0%) |
| Professional & Scientific | 75 (31.9%) | 160 (68.1%) |
| Enterprise Management | 0 (0.0%) | 0 (0.0%) |
| Administrative & Support | 51 (26.8%) | 139 (73.2%) |
| Educational Services | 399 (30.5%) | 911 (69.5%) |
| Health Care & Social Assistance | 239 (28.6%) | 596 (71.4%) |
| Arts, Entertainment & Recreation | 94 (100.0%) | 0 (0.0%) |
| Accommodation & Food Services | 246 (37.2%) | 415 (62.8%) |
| Public Administration | 139 (33.6%) | 275 (66.4%) |
| Total | 3,064 (48.0%) | 3,325 (52.0%) |
Education in El Dorado
School Enrollment in El Dorado
The most common levels of schooling among the 3,376 students in El Dorado are college / undergraduate (1,024 | 30.3%), elementary school (792 | 23.5%), and middle school (698 | 20.7%).
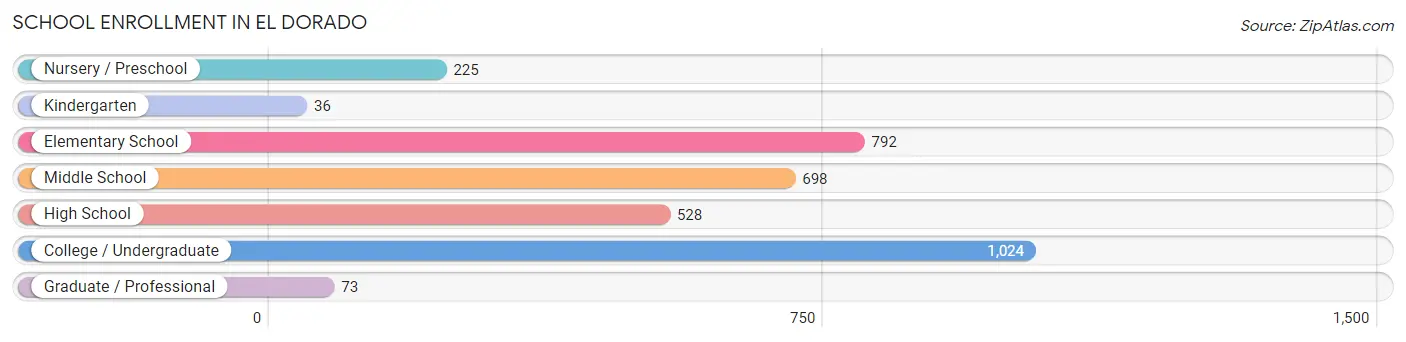
| School Level | # Students | % Students |
| Nursery / Preschool | 225 | 6.7% |
| Kindergarten | 36 | 1.1% |
| Elementary School | 792 | 23.5% |
| Middle School | 698 | 20.7% |
| High School | 528 | 15.6% |
| College / Undergraduate | 1,024 | 30.3% |
| Graduate / Professional | 73 | 2.2% |
| Total | 3,376 | 100.0% |
School Enrollment by Age by Funding Source in El Dorado
Out of a total of 3,376 students who are enrolled in schools in El Dorado, 287 (8.5%) attend a private institution, while the remaining 3,089 (91.5%) are enrolled in public schools. The age group of 25 to 34 year olds has the highest likelihood of being enrolled in private schools, with 85 (47.7% in the age bracket) enrolled. Conversely, the age group of 35 years and over has the lowest likelihood of being enrolled in a private school, with 91 (100.0% in the age bracket) attending a public institution.
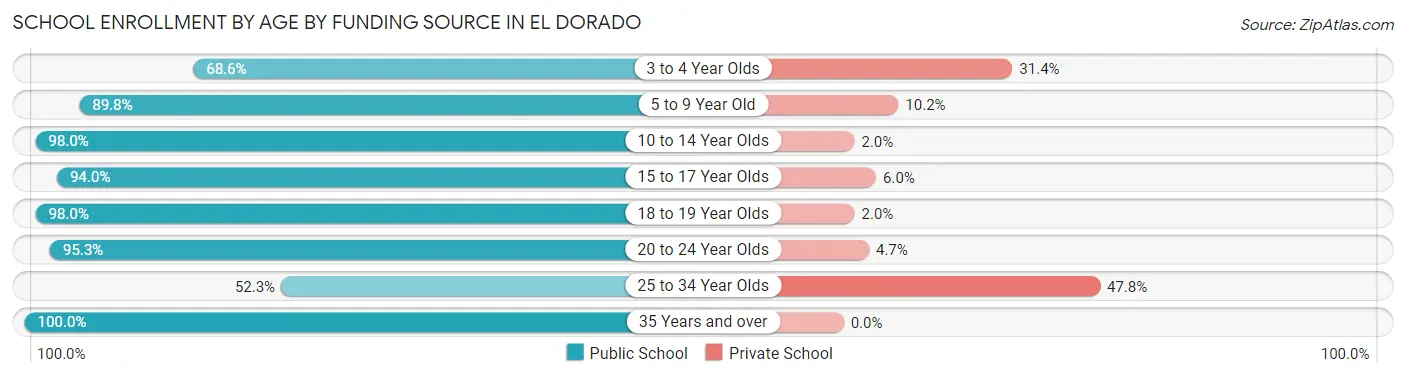
| Age Bracket | Public School | Private School |
| 3 to 4 Year Olds | 120 (68.6%) | 55 (31.4%) |
| 5 to 9 Year Old | 670 (89.8%) | 76 (10.2%) |
| 10 to 14 Year Olds | 874 (98.0%) | 18 (2.0%) |
| 15 to 17 Year Olds | 342 (94.0%) | 22 (6.0%) |
| 18 to 19 Year Olds | 434 (98.0%) | 9 (2.0%) |
| 20 to 24 Year Olds | 464 (95.3%) | 23 (4.7%) |
| 25 to 34 Year Olds | 93 (52.2%) | 85 (47.7%) |
| 35 Years and over | 91 (100.0%) | 0 (0.0%) |
| Total | 3,089 (91.5%) | 287 (8.5%) |
Educational Attainment by Field of Study in El Dorado
Education (796 | 34.7%), business (468 | 20.4%), science & technology (196 | 8.5%), social sciences (129 | 5.6%), and engineering (127 | 5.5%) are the most common fields of study among 2,296 individuals in El Dorado who have obtained a bachelor's degree or higher.
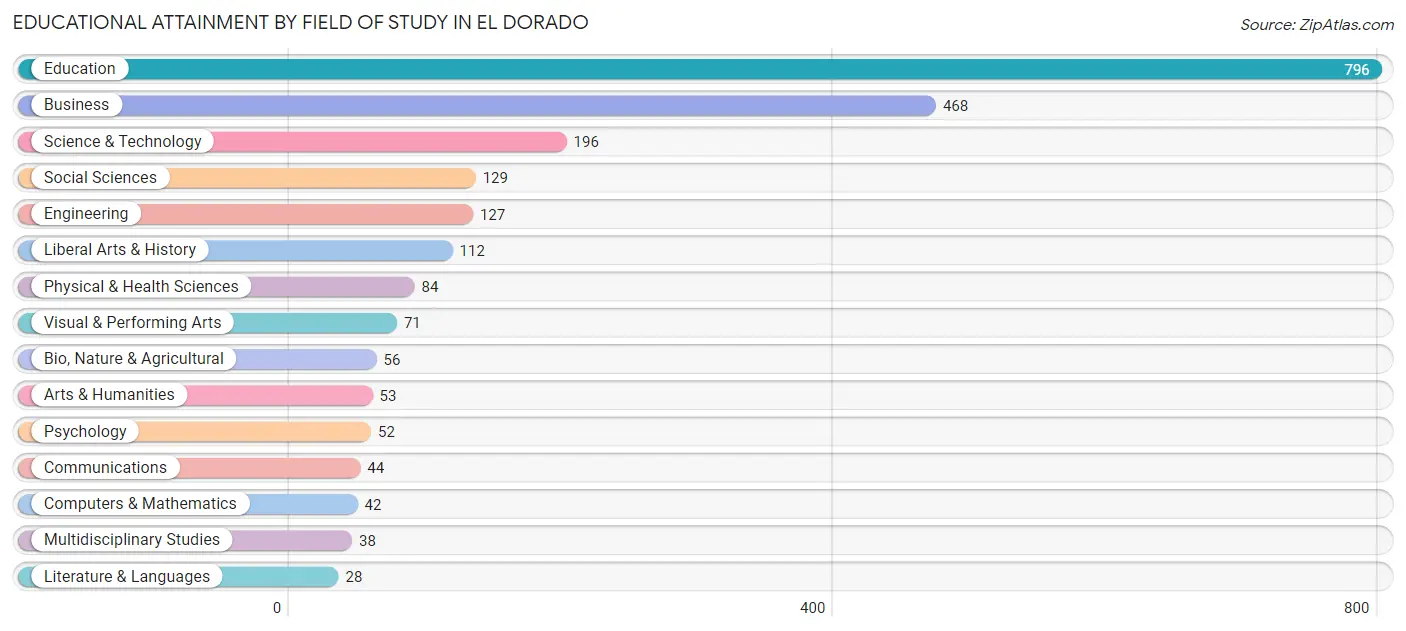
| Field of Study | # Graduates | % Graduates |
| Computers & Mathematics | 42 | 1.8% |
| Bio, Nature & Agricultural | 56 | 2.4% |
| Physical & Health Sciences | 84 | 3.7% |
| Psychology | 52 | 2.3% |
| Social Sciences | 129 | 5.6% |
| Engineering | 127 | 5.5% |
| Multidisciplinary Studies | 38 | 1.7% |
| Science & Technology | 196 | 8.5% |
| Business | 468 | 20.4% |
| Education | 796 | 34.7% |
| Literature & Languages | 28 | 1.2% |
| Liberal Arts & History | 112 | 4.9% |
| Visual & Performing Arts | 71 | 3.1% |
| Communications | 44 | 1.9% |
| Arts & Humanities | 53 | 2.3% |
| Total | 2,296 | 100.0% |
Transportation & Commute in El Dorado
Vehicle Availability by Sex in El Dorado
The most prevalent vehicle ownership categories in El Dorado are males with 2 vehicles (1,292, accounting for 43.6%) and females with 2 vehicles (1,457, making up 40.9%).
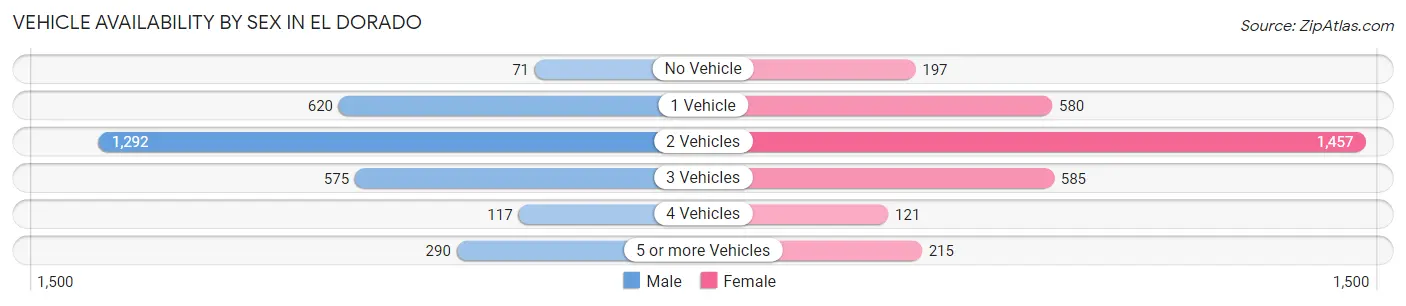
| Vehicles Available | Male | Female |
| No Vehicle | 71 (2.4%) | 197 (6.2%) |
| 1 Vehicle | 620 (20.9%) | 580 (18.4%) |
| 2 Vehicles | 1,292 (43.6%) | 1,457 (46.2%) |
| 3 Vehicles | 575 (19.4%) | 585 (18.5%) |
| 4 Vehicles | 117 (4.0%) | 121 (3.8%) |
| 5 or more Vehicles | 290 (9.8%) | 215 (6.8%) |
| Total | 2,965 (100.0%) | 3,155 (100.0%) |
Commute Time in El Dorado
The most frequently occuring commute durations in El Dorado are 5 to 9 minutes (2,225 commuters, 35.9%), 10 to 14 minutes (870 commuters, 14.0%), and 30 to 34 minutes (649 commuters, 10.5%).
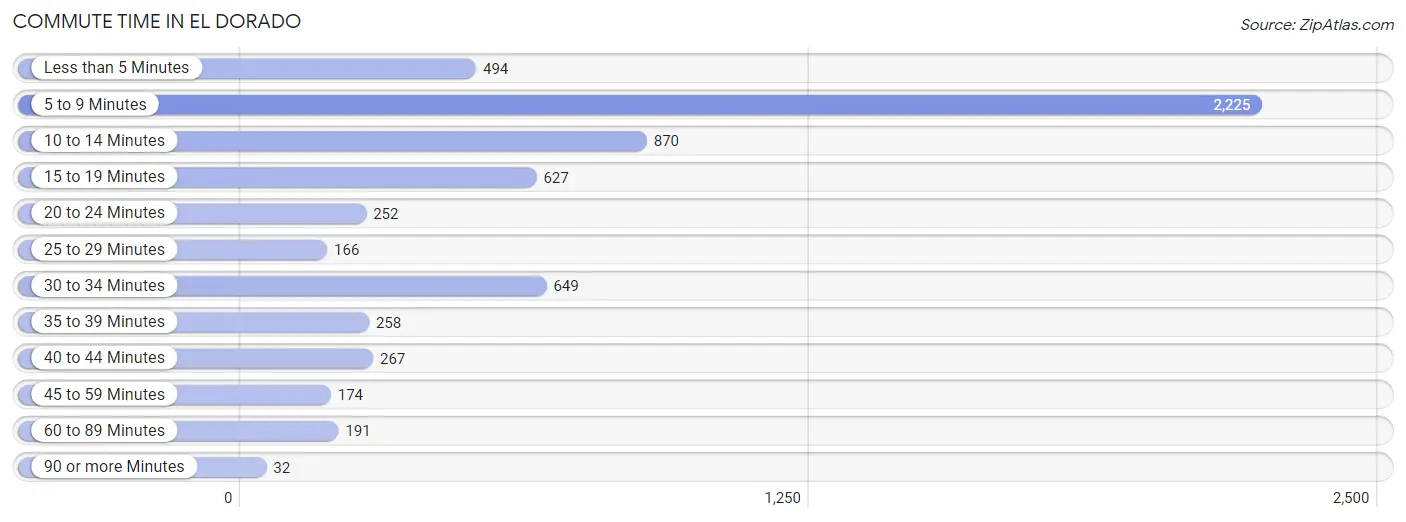
| Commute Time | # Commuters | % Commuters |
| Less than 5 Minutes | 494 | 8.0% |
| 5 to 9 Minutes | 2,225 | 35.9% |
| 10 to 14 Minutes | 870 | 14.0% |
| 15 to 19 Minutes | 627 | 10.1% |
| 20 to 24 Minutes | 252 | 4.1% |
| 25 to 29 Minutes | 166 | 2.7% |
| 30 to 34 Minutes | 649 | 10.5% |
| 35 to 39 Minutes | 258 | 4.2% |
| 40 to 44 Minutes | 267 | 4.3% |
| 45 to 59 Minutes | 174 | 2.8% |
| 60 to 89 Minutes | 191 | 3.1% |
| 90 or more Minutes | 32 | 0.5% |
Commute Time by Sex in El Dorado
The most common commute times in El Dorado are 5 to 9 minutes (1,002 commuters, 33.9%) for males and 5 to 9 minutes (1,223 commuters, 37.6%) for females.
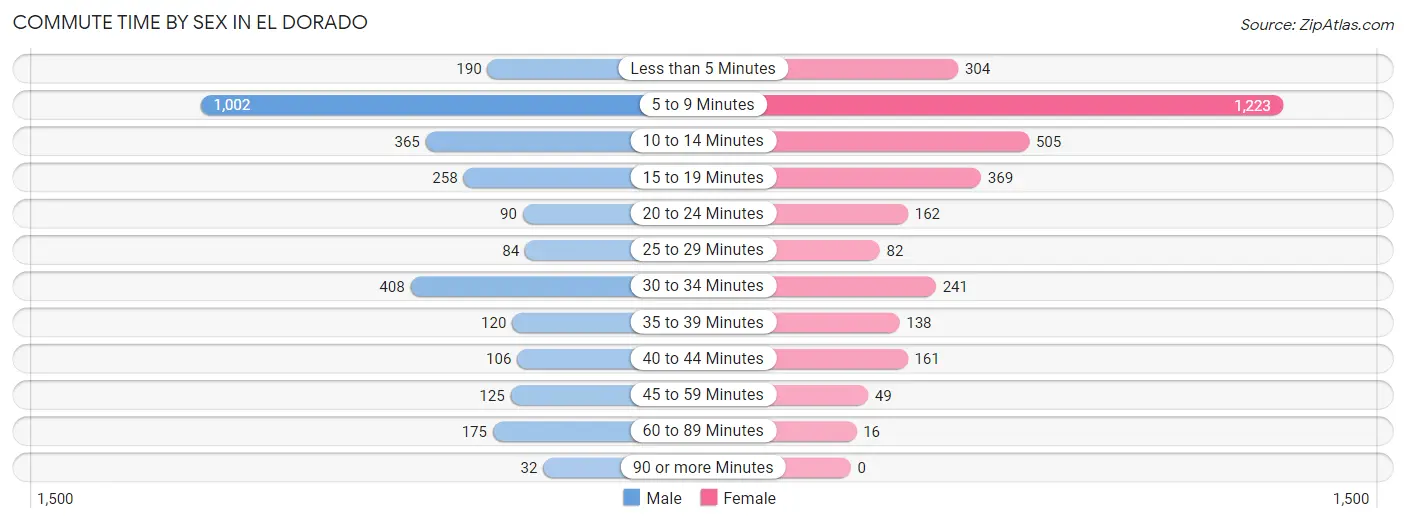
| Commute Time | Male | Female |
| Less than 5 Minutes | 190 (6.4%) | 304 (9.3%) |
| 5 to 9 Minutes | 1,002 (33.9%) | 1,223 (37.6%) |
| 10 to 14 Minutes | 365 (12.3%) | 505 (15.5%) |
| 15 to 19 Minutes | 258 (8.7%) | 369 (11.4%) |
| 20 to 24 Minutes | 90 (3.0%) | 162 (5.0%) |
| 25 to 29 Minutes | 84 (2.8%) | 82 (2.5%) |
| 30 to 34 Minutes | 408 (13.8%) | 241 (7.4%) |
| 35 to 39 Minutes | 120 (4.1%) | 138 (4.3%) |
| 40 to 44 Minutes | 106 (3.6%) | 161 (5.0%) |
| 45 to 59 Minutes | 125 (4.2%) | 49 (1.5%) |
| 60 to 89 Minutes | 175 (5.9%) | 16 (0.5%) |
| 90 or more Minutes | 32 (1.1%) | 0 (0.0%) |
Time of Departure to Work by Sex in El Dorado
The most frequent times of departure to work in El Dorado are 7:00 AM to 7:29 AM (444, 15.0%) for males and 7:00 AM to 7:29 AM (694, 21.3%) for females.
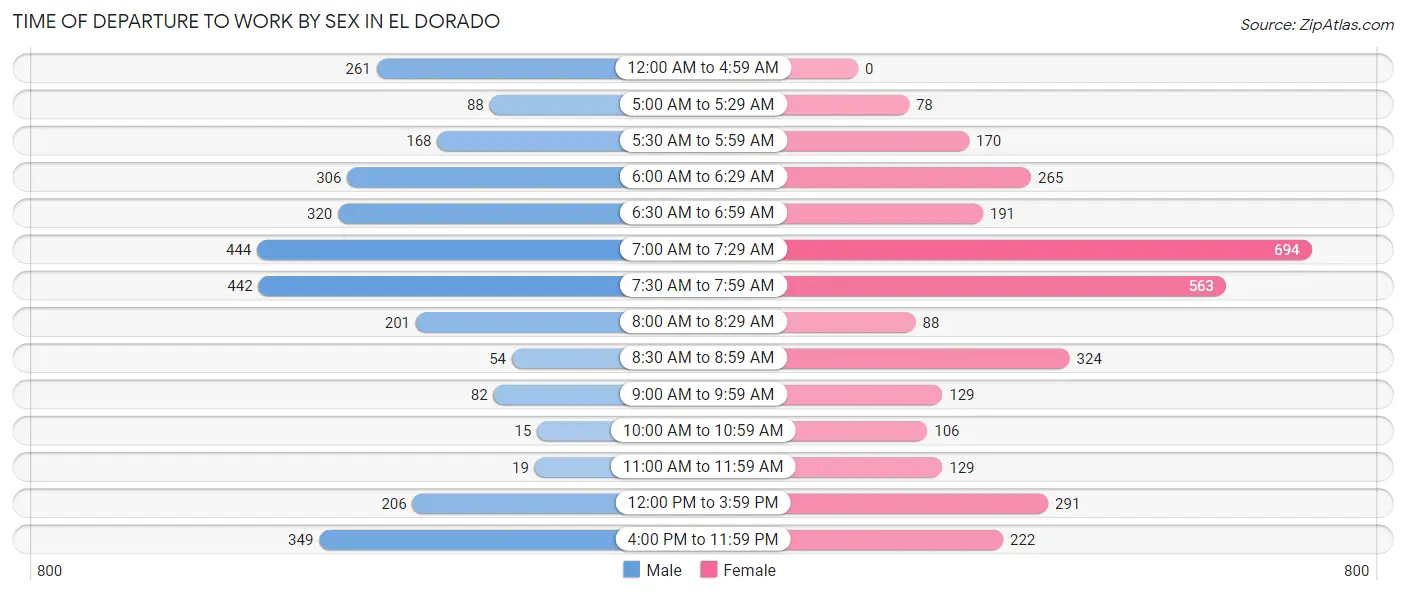
| Time of Departure | Male | Female |
| 12:00 AM to 4:59 AM | 261 (8.8%) | 0 (0.0%) |
| 5:00 AM to 5:29 AM | 88 (3.0%) | 78 (2.4%) |
| 5:30 AM to 5:59 AM | 168 (5.7%) | 170 (5.2%) |
| 6:00 AM to 6:29 AM | 306 (10.4%) | 265 (8.2%) |
| 6:30 AM to 6:59 AM | 320 (10.8%) | 191 (5.9%) |
| 7:00 AM to 7:29 AM | 444 (15.0%) | 694 (21.3%) |
| 7:30 AM to 7:59 AM | 442 (15.0%) | 563 (17.3%) |
| 8:00 AM to 8:29 AM | 201 (6.8%) | 88 (2.7%) |
| 8:30 AM to 8:59 AM | 54 (1.8%) | 324 (10.0%) |
| 9:00 AM to 9:59 AM | 82 (2.8%) | 129 (4.0%) |
| 10:00 AM to 10:59 AM | 15 (0.5%) | 106 (3.3%) |
| 11:00 AM to 11:59 AM | 19 (0.6%) | 129 (4.0%) |
| 12:00 PM to 3:59 PM | 206 (7.0%) | 291 (8.9%) |
| 4:00 PM to 11:59 PM | 349 (11.8%) | 222 (6.8%) |
| Total | 2,955 (100.0%) | 3,250 (100.0%) |
Housing Occupancy in El Dorado
Occupancy by Ownership in El Dorado
Of the total 5,350 dwellings in El Dorado, owner-occupied units account for 3,273 (61.2%), while renter-occupied units make up 2,077 (38.8%).
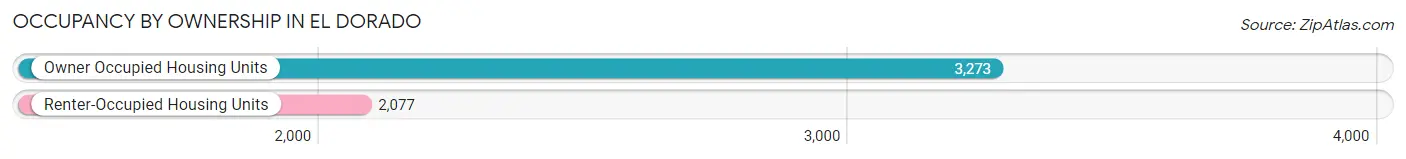
| Occupancy | # Housing Units | % Housing Units |
| Owner Occupied Housing Units | 3,273 | 61.2% |
| Renter-Occupied Housing Units | 2,077 | 38.8% |
| Total Occupied Housing Units | 5,350 | 100.0% |
Occupancy by Household Size in El Dorado
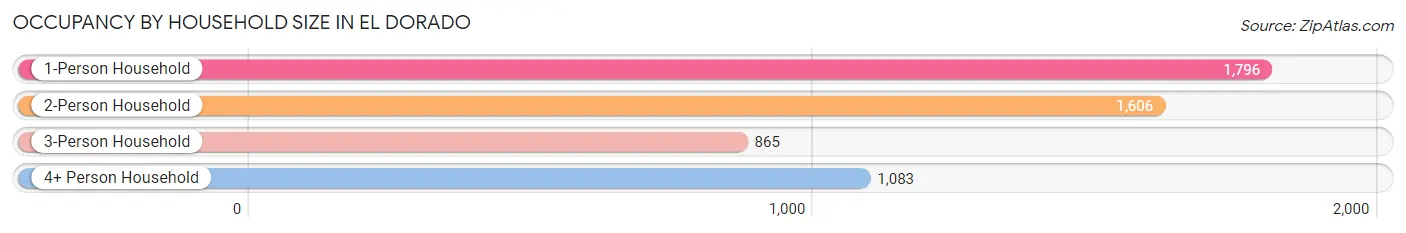
| Household Size | # Housing Units | % Housing Units |
| 1-Person Household | 1,796 | 33.6% |
| 2-Person Household | 1,606 | 30.0% |
| 3-Person Household | 865 | 16.2% |
| 4+ Person Household | 1,083 | 20.2% |
| Total Housing Units | 5,350 | 100.0% |
Occupancy by Ownership by Household Size in El Dorado
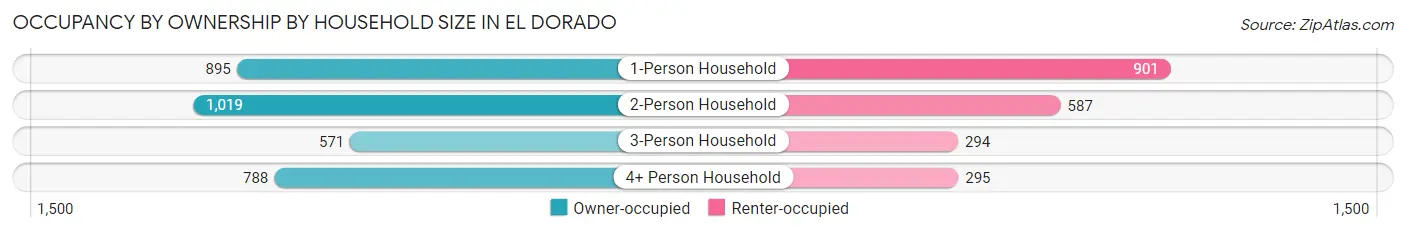
| Household Size | Owner-occupied | Renter-occupied |
| 1-Person Household | 895 (49.8%) | 901 (50.2%) |
| 2-Person Household | 1,019 (63.4%) | 587 (36.5%) |
| 3-Person Household | 571 (66.0%) | 294 (34.0%) |
| 4+ Person Household | 788 (72.8%) | 295 (27.2%) |
| Total Housing Units | 3,273 (61.2%) | 2,077 (38.8%) |
Occupancy by Educational Attainment in El Dorado
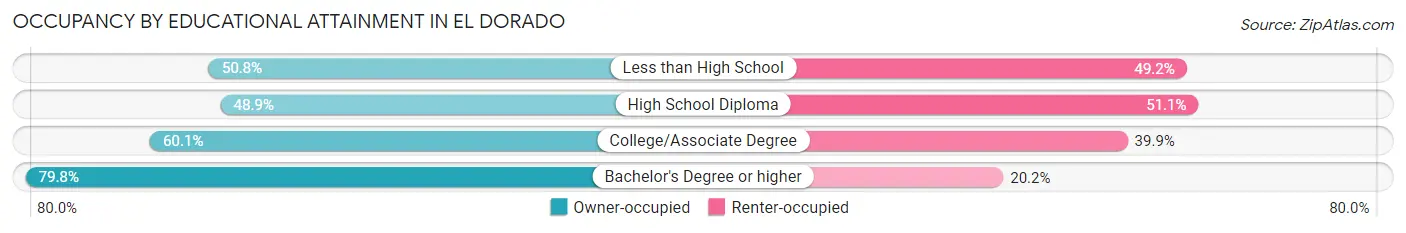
| Household Size | Owner-occupied | Renter-occupied |
| Less than High School | 131 (50.8%) | 127 (49.2%) |
| High School Diploma | 764 (48.9%) | 798 (51.1%) |
| College/Associate Degree | 1,341 (60.1%) | 890 (39.9%) |
| Bachelor's Degree or higher | 1,037 (79.8%) | 262 (20.2%) |
Occupancy by Age of Householder in El Dorado
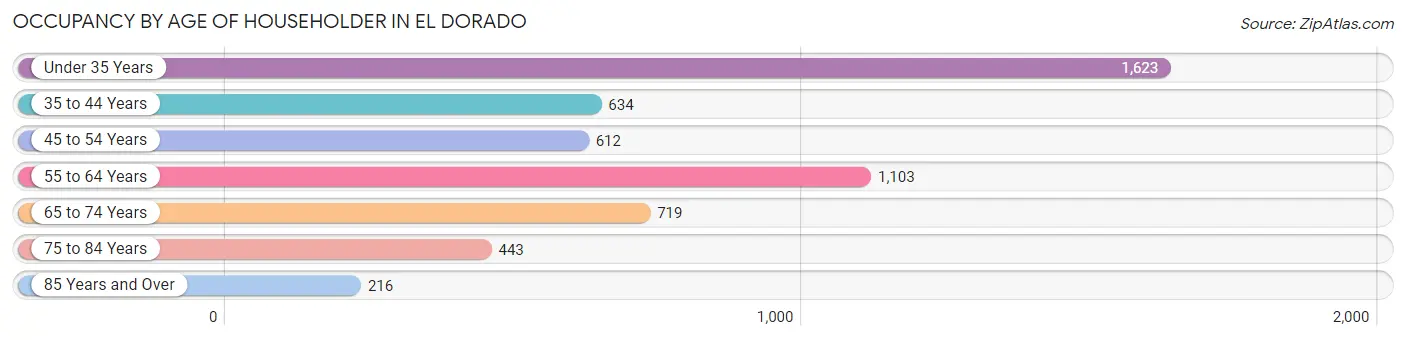
| Age Bracket | # Households | % Households |
| Under 35 Years | 1,623 | 30.3% |
| 35 to 44 Years | 634 | 11.8% |
| 45 to 54 Years | 612 | 11.4% |
| 55 to 64 Years | 1,103 | 20.6% |
| 65 to 74 Years | 719 | 13.4% |
| 75 to 84 Years | 443 | 8.3% |
| 85 Years and Over | 216 | 4.0% |
| Total | 5,350 | 100.0% |
Housing Finances in El Dorado
Median Income by Occupancy in El Dorado
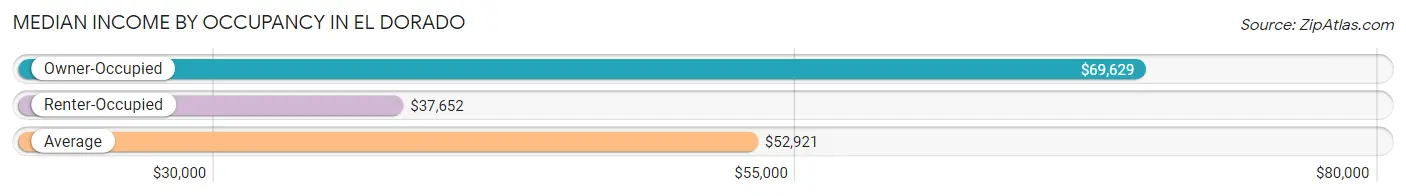
| Occupancy Type | # Households | Median Income |
| Owner-Occupied | 3,273 (61.2%) | $69,629 |
| Renter-Occupied | 2,077 (38.8%) | $37,652 |
| Average | 5,350 (100.0%) | $52,921 |
Occupancy by Householder Income Bracket in El Dorado
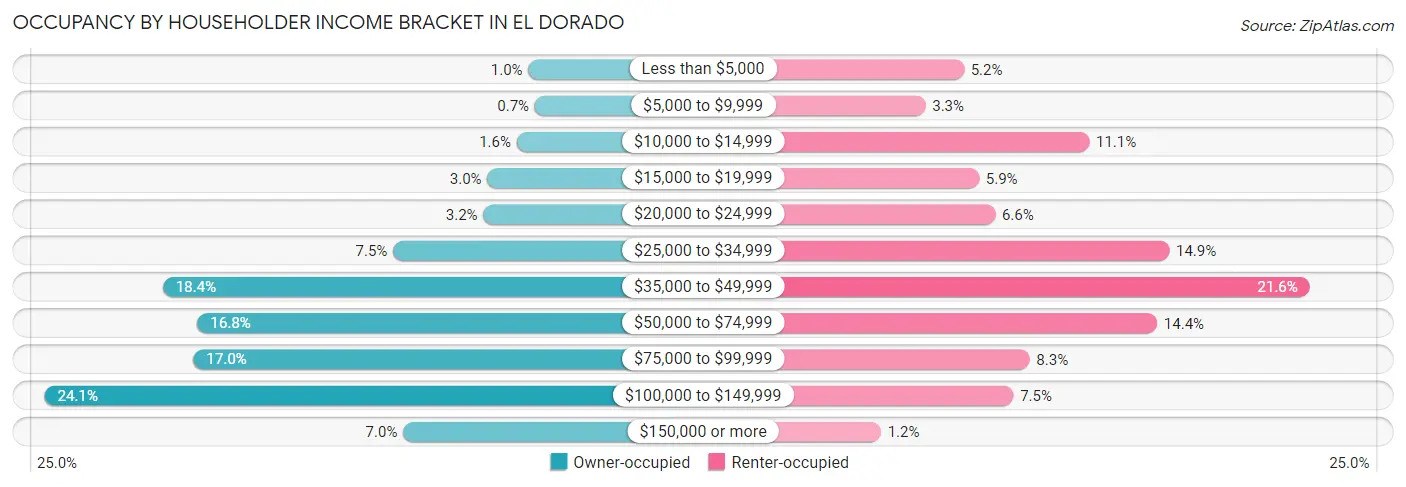
| Income Bracket | Owner-occupied | Renter-occupied |
| Less than $5,000 | 33 (1.0%) | 107 (5.1%) |
| $5,000 to $9,999 | 23 (0.7%) | 69 (3.3%) |
| $10,000 to $14,999 | 51 (1.6%) | 231 (11.1%) |
| $15,000 to $19,999 | 97 (3.0%) | 122 (5.9%) |
| $20,000 to $24,999 | 103 (3.2%) | 138 (6.6%) |
| $25,000 to $34,999 | 244 (7.4%) | 310 (14.9%) |
| $35,000 to $49,999 | 603 (18.4%) | 449 (21.6%) |
| $50,000 to $74,999 | 549 (16.8%) | 298 (14.3%) |
| $75,000 to $99,999 | 555 (17.0%) | 172 (8.3%) |
| $100,000 to $149,999 | 787 (24.0%) | 156 (7.5%) |
| $150,000 or more | 228 (7.0%) | 25 (1.2%) |
| Total | 3,273 (100.0%) | 2,077 (100.0%) |
Monthly Housing Cost Tiers in El Dorado
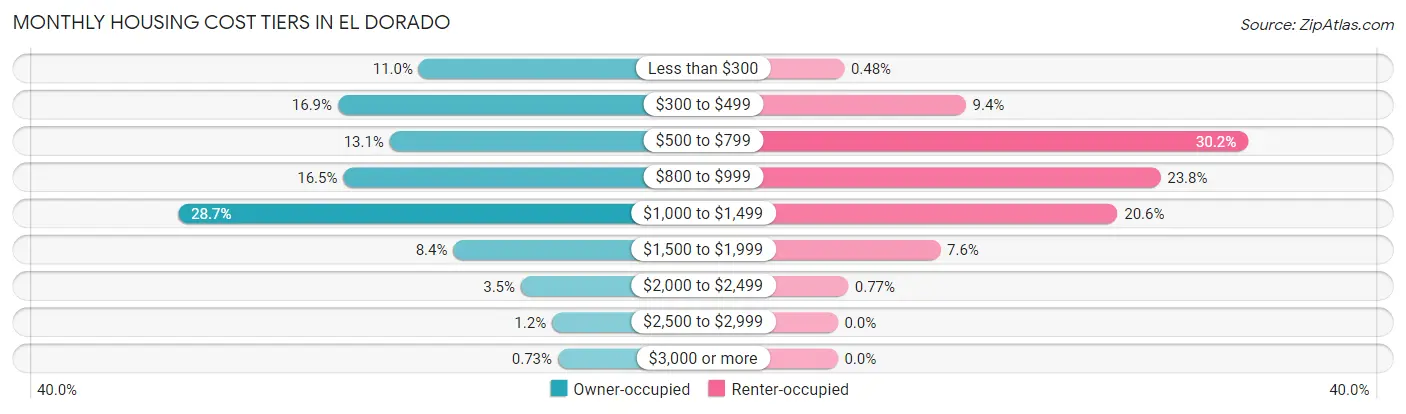
| Monthly Cost | Owner-occupied | Renter-occupied |
| Less than $300 | 359 (11.0%) | 10 (0.5%) |
| $300 to $499 | 554 (16.9%) | 196 (9.4%) |
| $500 to $799 | 429 (13.1%) | 628 (30.2%) |
| $800 to $999 | 541 (16.5%) | 494 (23.8%) |
| $1,000 to $1,499 | 939 (28.7%) | 428 (20.6%) |
| $1,500 to $1,999 | 276 (8.4%) | 157 (7.6%) |
| $2,000 to $2,499 | 113 (3.5%) | 16 (0.8%) |
| $2,500 to $2,999 | 38 (1.2%) | 0 (0.0%) |
| $3,000 or more | 24 (0.7%) | 0 (0.0%) |
| Total | 3,273 (100.0%) | 2,077 (100.0%) |
Physical Housing Characteristics in El Dorado
Housing Structures in El Dorado
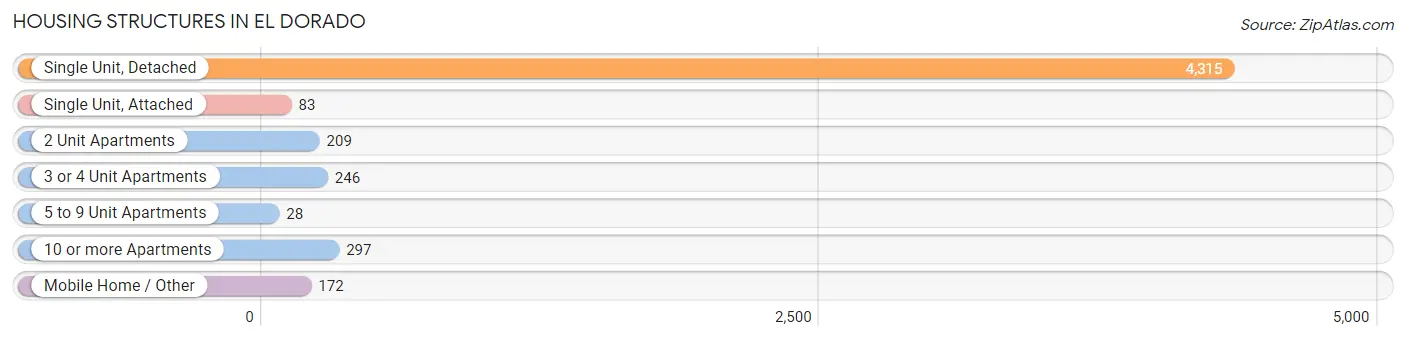
| Structure Type | # Housing Units | % Housing Units |
| Single Unit, Detached | 4,315 | 80.6% |
| Single Unit, Attached | 83 | 1.5% |
| 2 Unit Apartments | 209 | 3.9% |
| 3 or 4 Unit Apartments | 246 | 4.6% |
| 5 to 9 Unit Apartments | 28 | 0.5% |
| 10 or more Apartments | 297 | 5.6% |
| Mobile Home / Other | 172 | 3.2% |
| Total | 5,350 | 100.0% |
Housing Structures by Occupancy in El Dorado
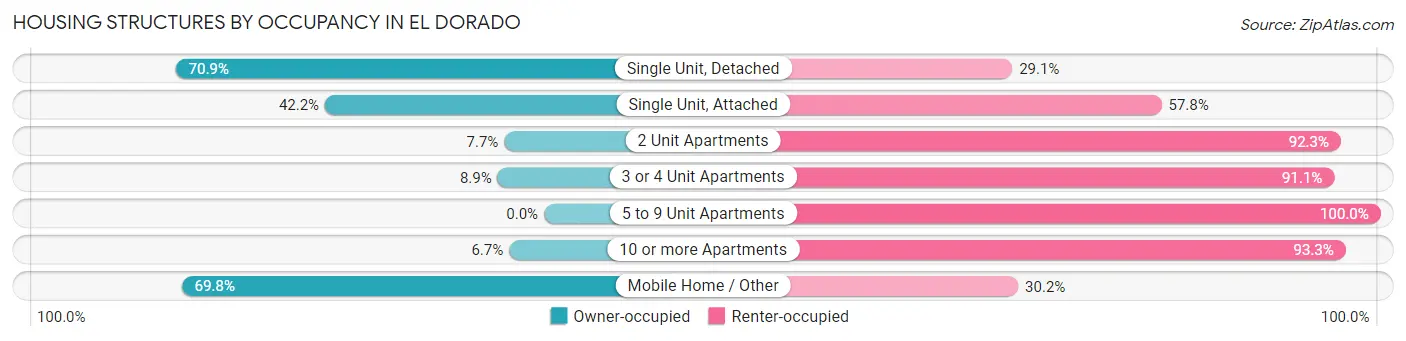
| Structure Type | Owner-occupied | Renter-occupied |
| Single Unit, Detached | 3,060 (70.9%) | 1,255 (29.1%) |
| Single Unit, Attached | 35 (42.2%) | 48 (57.8%) |
| 2 Unit Apartments | 16 (7.7%) | 193 (92.3%) |
| 3 or 4 Unit Apartments | 22 (8.9%) | 224 (91.1%) |
| 5 to 9 Unit Apartments | 0 (0.0%) | 28 (100.0%) |
| 10 or more Apartments | 20 (6.7%) | 277 (93.3%) |
| Mobile Home / Other | 120 (69.8%) | 52 (30.2%) |
| Total | 3,273 (61.2%) | 2,077 (38.8%) |
Housing Structures by Number of Rooms in El Dorado

| Number of Rooms | Owner-occupied | Renter-occupied |
| 1 Room | 9 (0.3%) | 0 (0.0%) |
| 2 or 3 Rooms | 4 (0.1%) | 401 (19.3%) |
| 4 or 5 Rooms | 933 (28.5%) | 888 (42.7%) |
| 6 or 7 Rooms | 1,430 (43.7%) | 559 (26.9%) |
| 8 or more Rooms | 897 (27.4%) | 229 (11.0%) |
| Total | 3,273 (100.0%) | 2,077 (100.0%) |
Housing Structure by Heating Type in El Dorado
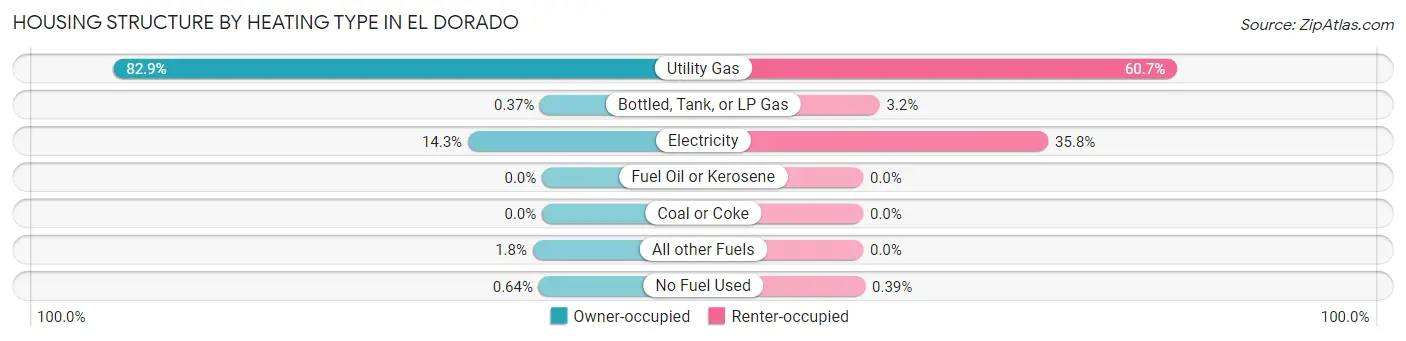
| Heating Type | Owner-occupied | Renter-occupied |
| Utility Gas | 2,712 (82.9%) | 1,260 (60.7%) |
| Bottled, Tank, or LP Gas | 12 (0.4%) | 66 (3.2%) |
| Electricity | 469 (14.3%) | 743 (35.8%) |
| Fuel Oil or Kerosene | 0 (0.0%) | 0 (0.0%) |
| Coal or Coke | 0 (0.0%) | 0 (0.0%) |
| All other Fuels | 59 (1.8%) | 0 (0.0%) |
| No Fuel Used | 21 (0.6%) | 8 (0.4%) |
| Total | 3,273 (100.0%) | 2,077 (100.0%) |
Household Vehicle Usage in El Dorado
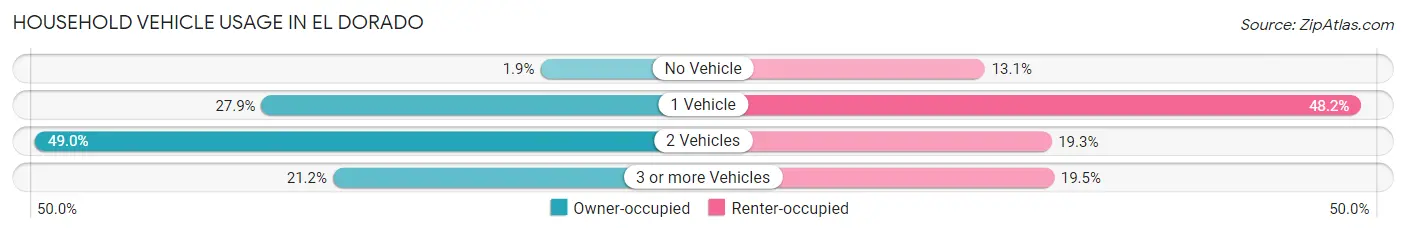
| Vehicles per Household | Owner-occupied | Renter-occupied |
| No Vehicle | 61 (1.9%) | 271 (13.1%) |
| 1 Vehicle | 913 (27.9%) | 1,001 (48.2%) |
| 2 Vehicles | 1,604 (49.0%) | 400 (19.3%) |
| 3 or more Vehicles | 695 (21.2%) | 405 (19.5%) |
| Total | 3,273 (100.0%) | 2,077 (100.0%) |
Real Estate & Mortgages in El Dorado
Real Estate and Mortgage Overview in El Dorado
| Characteristic | Without Mortgage | With Mortgage |
| Housing Units | 1,360 | 1,913 |
| Median Property Value | $79,600 | $123,600 |
| Median Household Income | $45,595 | $166 |
| Monthly Housing Costs | $433 | $24 |
| Real Estate Taxes | $1,631 | $0 |
Property Value by Mortgage Status in El Dorado
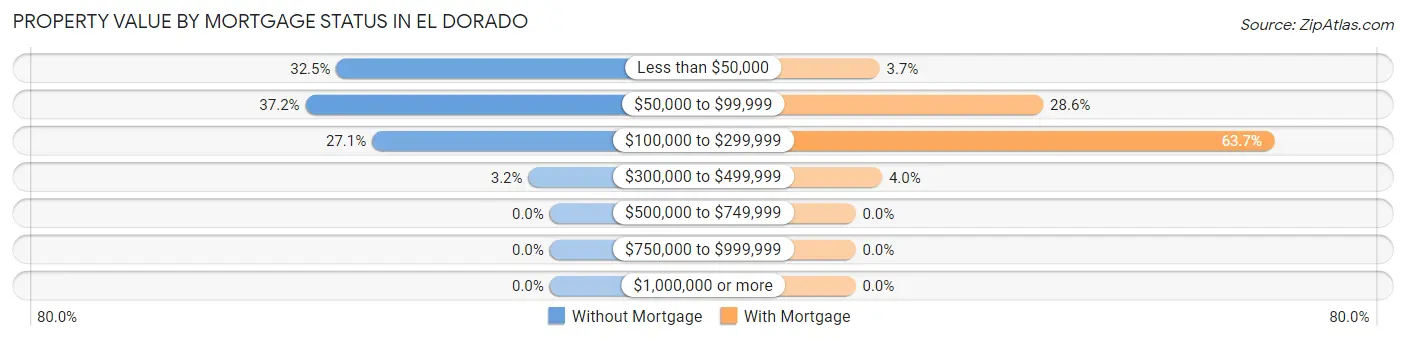
| Property Value | Without Mortgage | With Mortgage |
| Less than $50,000 | 442 (32.5%) | 70 (3.7%) |
| $50,000 to $99,999 | 506 (37.2%) | 547 (28.6%) |
| $100,000 to $299,999 | 368 (27.1%) | 1,219 (63.7%) |
| $300,000 to $499,999 | 44 (3.2%) | 77 (4.0%) |
| $500,000 to $749,999 | 0 (0.0%) | 0 (0.0%) |
| $750,000 to $999,999 | 0 (0.0%) | 0 (0.0%) |
| $1,000,000 or more | 0 (0.0%) | 0 (0.0%) |
| Total | 1,360 (100.0%) | 1,913 (100.0%) |
Household Income by Mortgage Status in El Dorado
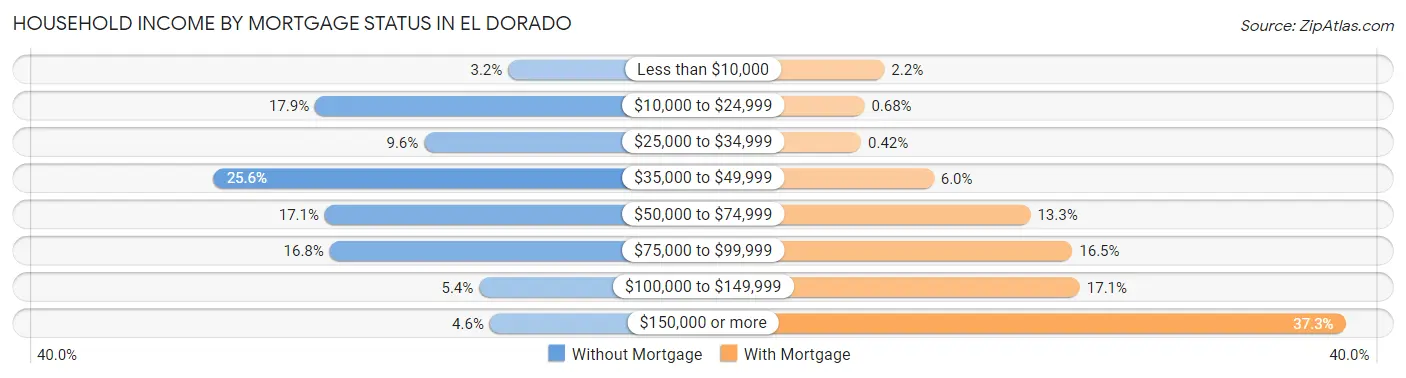
| Household Income | Without Mortgage | With Mortgage |
| Less than $10,000 | 43 (3.2%) | 42 (2.2%) |
| $10,000 to $24,999 | 243 (17.9%) | 13 (0.7%) |
| $25,000 to $34,999 | 130 (9.6%) | 8 (0.4%) |
| $35,000 to $49,999 | 348 (25.6%) | 114 (6.0%) |
| $50,000 to $74,999 | 233 (17.1%) | 255 (13.3%) |
| $75,000 to $99,999 | 228 (16.8%) | 316 (16.5%) |
| $100,000 to $149,999 | 73 (5.4%) | 327 (17.1%) |
| $150,000 or more | 62 (4.6%) | 714 (37.3%) |
| Total | 1,360 (100.0%) | 1,913 (100.0%) |
Property Value to Household Income Ratio in El Dorado
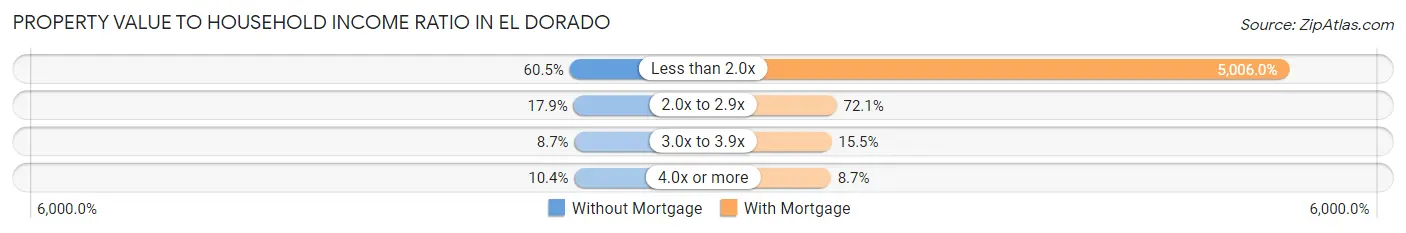
| Value-to-Income Ratio | Without Mortgage | With Mortgage |
| Less than 2.0x | 823 (60.5%) | 95,764 (5,006.0%) |
| 2.0x to 2.9x | 244 (17.9%) | 1,379 (72.1%) |
| 3.0x to 3.9x | 118 (8.7%) | 297 (15.5%) |
| 4.0x or more | 142 (10.4%) | 167 (8.7%) |
| Total | 1,360 (100.0%) | 1,913 (100.0%) |
Real Estate Taxes by Mortgage Status in El Dorado
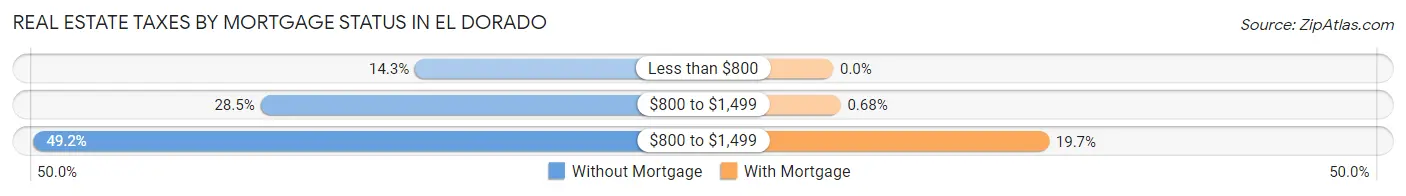
| Property Taxes | Without Mortgage | With Mortgage |
| Less than $800 | 195 (14.3%) | 0 (0.0%) |
| $800 to $1,499 | 387 (28.5%) | 13 (0.7%) |
| $800 to $1,499 | 669 (49.2%) | 377 (19.7%) |
| Total | 1,360 (100.0%) | 1,913 (100.0%) |
Health & Disability in El Dorado
Health Insurance Coverage by Age in El Dorado
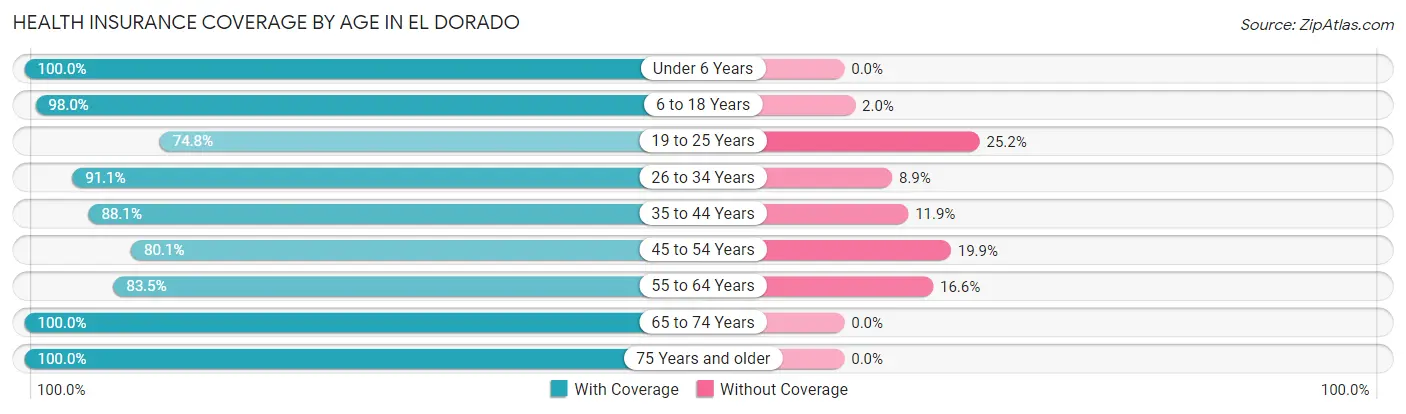
| Age Bracket | With Coverage | Without Coverage |
| Under 6 Years | 1,201 (100.0%) | 0 (0.0%) |
| 6 to 18 Years | 2,180 (98.0%) | 45 (2.0%) |
| 19 to 25 Years | 1,171 (74.8%) | 395 (25.2%) |
| 26 to 34 Years | 1,351 (91.1%) | 132 (8.9%) |
| 35 to 44 Years | 1,153 (88.1%) | 156 (11.9%) |
| 45 to 54 Years | 1,005 (80.1%) | 249 (19.9%) |
| 55 to 64 Years | 1,372 (83.5%) | 272 (16.6%) |
| 65 to 74 Years | 1,114 (100.0%) | 0 (0.0%) |
| 75 Years and older | 808 (100.0%) | 0 (0.0%) |
| Total | 11,355 (90.1%) | 1,249 (9.9%) |
Health Insurance Coverage by Citizenship Status in El Dorado
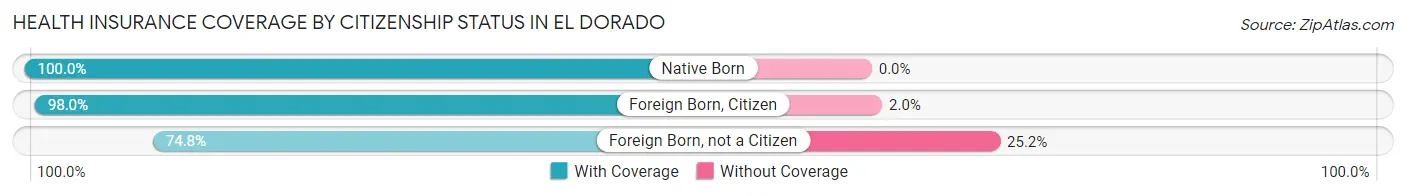
| Citizenship Status | With Coverage | Without Coverage |
| Native Born | 1,201 (100.0%) | 0 (0.0%) |
| Foreign Born, Citizen | 2,180 (98.0%) | 45 (2.0%) |
| Foreign Born, not a Citizen | 1,171 (74.8%) | 395 (25.2%) |
Health Insurance Coverage by Household Income in El Dorado
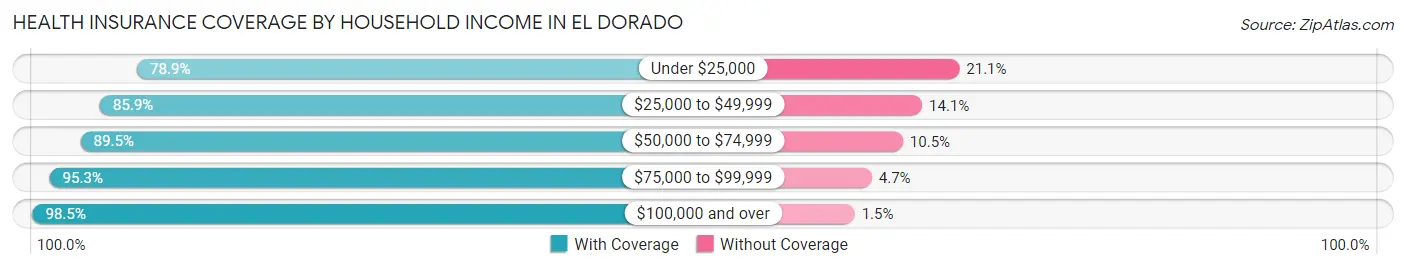
| Household Income | With Coverage | Without Coverage |
| Under $25,000 | 1,411 (78.9%) | 377 (21.1%) |
| $25,000 to $49,999 | 2,713 (85.9%) | 446 (14.1%) |
| $50,000 to $74,999 | 1,600 (89.5%) | 188 (10.5%) |
| $75,000 to $99,999 | 1,909 (95.3%) | 94 (4.7%) |
| $100,000 and over | 3,320 (98.5%) | 50 (1.5%) |
Public vs Private Health Insurance Coverage by Age in El Dorado
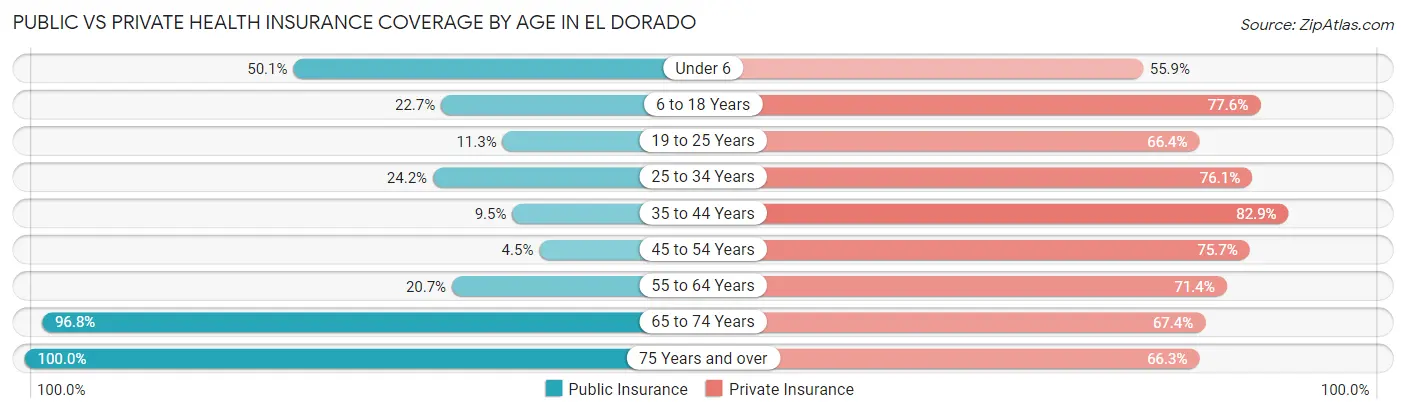
| Age Bracket | Public Insurance | Private Insurance |
| Under 6 | 602 (50.1%) | 671 (55.9%) |
| 6 to 18 Years | 505 (22.7%) | 1,727 (77.6%) |
| 19 to 25 Years | 177 (11.3%) | 1,039 (66.3%) |
| 25 to 34 Years | 359 (24.2%) | 1,129 (76.1%) |
| 35 to 44 Years | 124 (9.5%) | 1,085 (82.9%) |
| 45 to 54 Years | 56 (4.5%) | 949 (75.7%) |
| 55 to 64 Years | 340 (20.7%) | 1,174 (71.4%) |
| 65 to 74 Years | 1,078 (96.8%) | 751 (67.4%) |
| 75 Years and over | 808 (100.0%) | 536 (66.3%) |
| Total | 4,049 (32.1%) | 9,061 (71.9%) |
Disability Status by Sex by Age in El Dorado
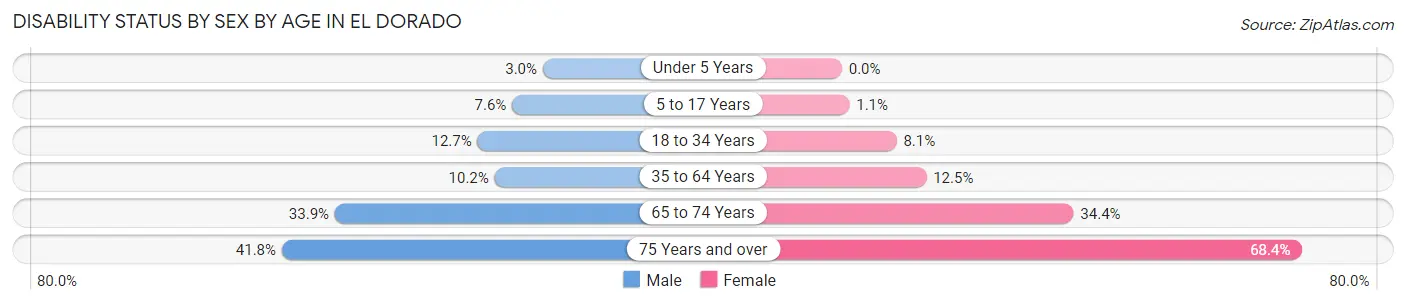
| Age Bracket | Male | Female |
| Under 5 Years | 19 (3.0%) | 0 (0.0%) |
| 5 to 17 Years | 86 (7.6%) | 10 (1.1%) |
| 18 to 34 Years | 187 (12.7%) | 152 (8.1%) |
| 35 to 64 Years | 212 (10.2%) | 267 (12.5%) |
| 65 to 74 Years | 153 (33.9%) | 228 (34.4%) |
| 75 Years and over | 158 (41.8%) | 294 (68.4%) |
Disability Class by Sex by Age in El Dorado
Disability Class: Hearing Difficulty

| Age Bracket | Male | Female |
| Under 5 Years | 19 (3.0%) | 0 (0.0%) |
| 5 to 17 Years | 0 (0.0%) | 0 (0.0%) |
| 18 to 34 Years | 18 (1.2%) | 62 (3.3%) |
| 35 to 64 Years | 103 (5.0%) | 70 (3.3%) |
| 65 to 74 Years | 74 (16.4%) | 94 (14.2%) |
| 75 Years and over | 40 (10.6%) | 89 (20.7%) |
Disability Class: Vision Difficulty
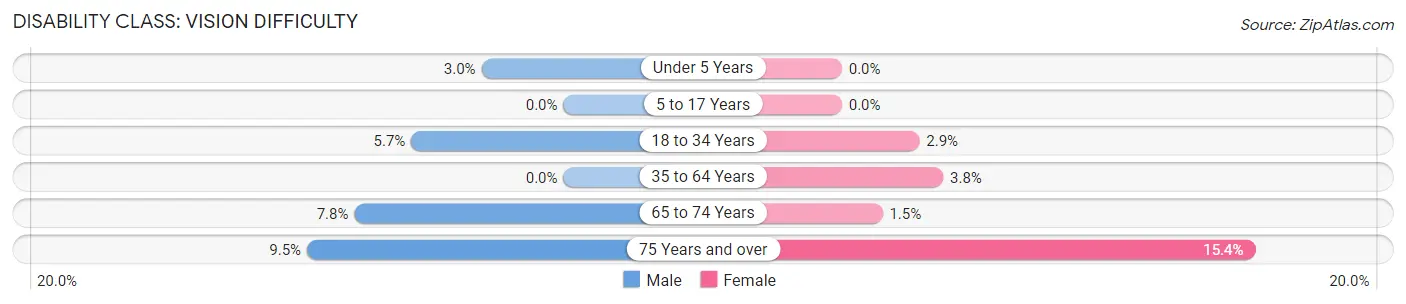
| Age Bracket | Male | Female |
| Under 5 Years | 19 (3.0%) | 0 (0.0%) |
| 5 to 17 Years | 0 (0.0%) | 0 (0.0%) |
| 18 to 34 Years | 83 (5.7%) | 54 (2.9%) |
| 35 to 64 Years | 0 (0.0%) | 80 (3.8%) |
| 65 to 74 Years | 35 (7.8%) | 10 (1.5%) |
| 75 Years and over | 36 (9.5%) | 66 (15.3%) |
Disability Class: Cognitive Difficulty
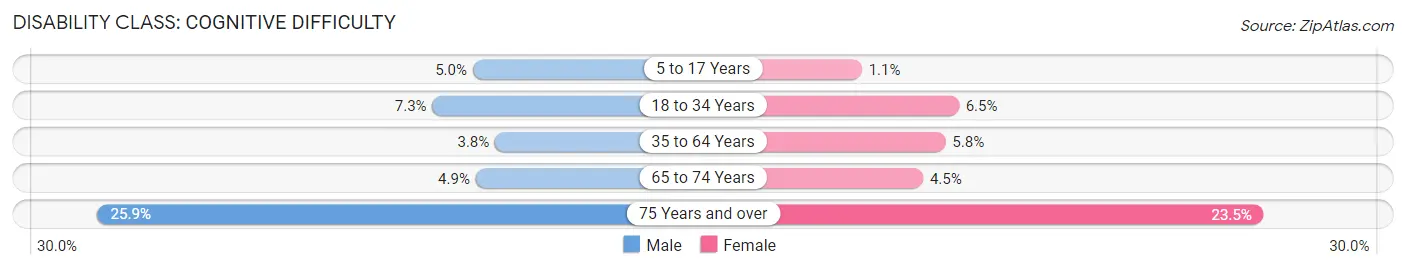
| Age Bracket | Male | Female |
| 5 to 17 Years | 57 (5.0%) | 10 (1.1%) |
| 18 to 34 Years | 107 (7.3%) | 122 (6.5%) |
| 35 to 64 Years | 79 (3.8%) | 123 (5.8%) |
| 65 to 74 Years | 22 (4.9%) | 30 (4.5%) |
| 75 Years and over | 98 (25.9%) | 101 (23.5%) |
Disability Class: Ambulatory Difficulty
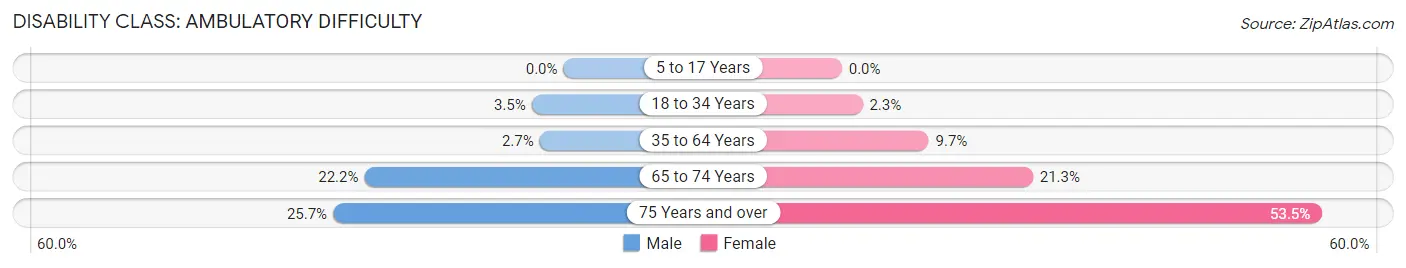
| Age Bracket | Male | Female |
| 5 to 17 Years | 0 (0.0%) | 0 (0.0%) |
| 18 to 34 Years | 52 (3.5%) | 43 (2.3%) |
| 35 to 64 Years | 55 (2.6%) | 206 (9.7%) |
| 65 to 74 Years | 100 (22.2%) | 141 (21.3%) |
| 75 Years and over | 97 (25.7%) | 230 (53.5%) |
Disability Class: Self-Care Difficulty
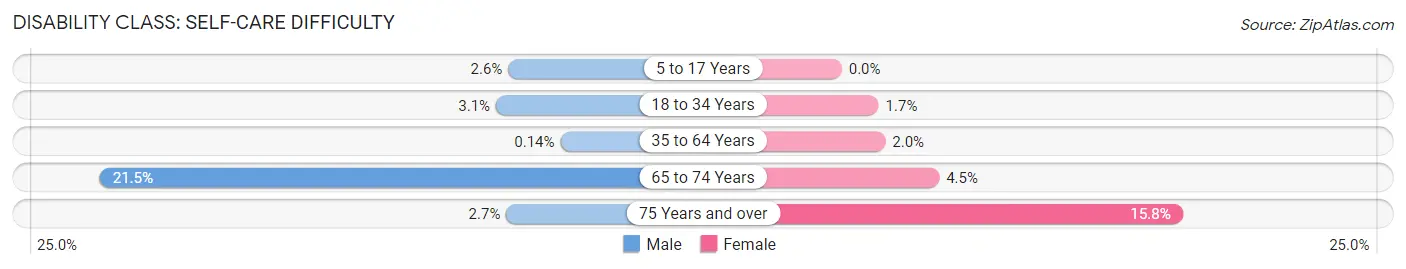
| Age Bracket | Male | Female |
| 5 to 17 Years | 29 (2.6%) | 0 (0.0%) |
| 18 to 34 Years | 46 (3.1%) | 32 (1.7%) |
| 35 to 64 Years | 3 (0.1%) | 43 (2.0%) |
| 65 to 74 Years | 97 (21.5%) | 30 (4.5%) |
| 75 Years and over | 10 (2.6%) | 68 (15.8%) |
Technology Access in El Dorado
Computing Device Access in El Dorado
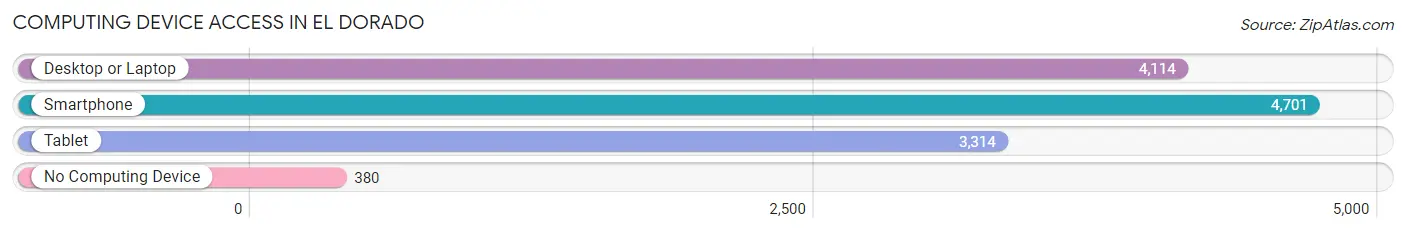
| Device Type | # Households | % Households |
| Desktop or Laptop | 4,114 | 76.9% |
| Smartphone | 4,701 | 87.9% |
| Tablet | 3,314 | 61.9% |
| No Computing Device | 380 | 7.1% |
| Total | 5,350 | 100.0% |
Internet Access in El Dorado
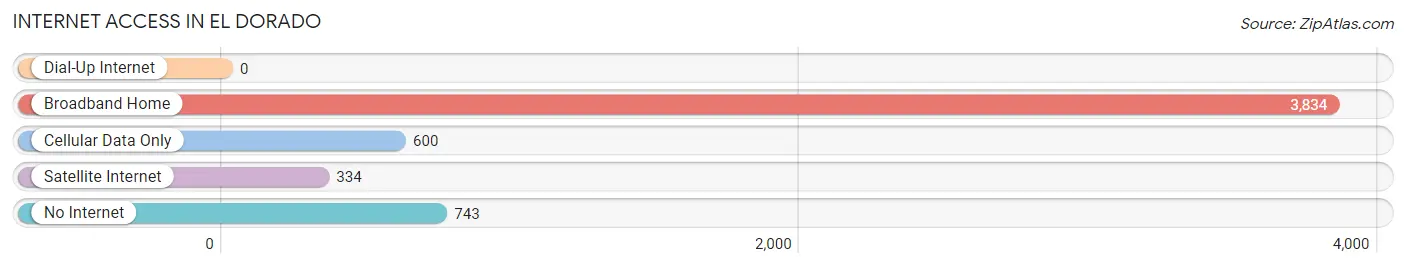
| Internet Type | # Households | % Households |
| Dial-Up Internet | 0 | 0.0% |
| Broadband Home | 3,834 | 71.7% |
| Cellular Data Only | 600 | 11.2% |
| Satellite Internet | 334 | 6.2% |
| No Internet | 743 | 13.9% |
| Total | 5,350 | 100.0% |
El Dorado Summary
El Dorado, Kansas is a city located in Butler County, Kansas, United States. It is the county seat of Butler County and is located along the Walnut River. As of the 2010 census, the city population was 13,021.
History
El Dorado was founded in 1868 by the El Dorado Town Company, which was formed by a group of settlers from Ohio. The town was named after the mythical city of El Dorado, which was said to be a city of gold. The town was originally intended to be a stop on the Atchison, Topeka and Santa Fe Railway, but the railroad bypassed the town and it was instead settled by farmers and ranchers.
In 1873, the first school was built in El Dorado and the town was incorporated in 1875. The town grew rapidly in the late 19th century, and by 1900, it had a population of 1,845.
In the early 20th century, El Dorado became a center for oil production. The first oil well was drilled in 1915 and by the 1920s, El Dorado was the largest oil-producing city in Kansas. The oil boom led to a population boom, and by 1930, the city had a population of 8,845.
The oil industry declined in the mid-20th century, but El Dorado continued to grow. In the late 20th century, the city became a center for manufacturing and distribution.
Geography
El Dorado is located at (37.827, -96.867). According to the United States Census Bureau, the city has a total area of 8.3 square miles (21.5 km2), of which 8.2 square miles (21.3 km2) is land and 0.1 square miles (0.2 km2) is water.
Economy
El Dorado’s economy is largely based on manufacturing and distribution. The city is home to several large manufacturing companies, including John Deere, Cessna, and Goodyear. The city is also home to several distribution centers, including Walmart, Target, and Amazon.
The city is also home to several oil and gas companies including ConocoPhillips and Marathon Oil
Demographics
As of the 2010 census, there were 13,021 people, 5,093 households, and 3,092 families residing in the city. The population density was 1,578.3 people per square mile (608.7/km2). There were 5,619 housing units at an average density of 684.3 per square mile (264.2/km2). The racial makeup of the city was 87.2% White, 5.3% African American, 0.7% Native American, 0.7% Asian, 0.1% Pacific Islander, 4.2% from other races, and 2.0% from two or more races. Hispanic or Latino of any race were 8.7% of the population.
There were 5,093 households, out of which 28.7% had children under the age of 18 living with them, 44.2% were married couples living together, 12.7% had a female householder with no husband present, and 38.2% were non-families. 32.3% of all households were made up of individuals, and 14.2% had someone living alone who was 65 years of age or older. The average household size was 2.41 and the average family size was 3.04.
In the city, the population was spread out, with 25.2% under the age of 18, 8.7% from 18 to 24, 26.2% from 25 to 44, 22.2% from 45 to 64, and 17.7% who were 65 years of age or older. The median age was 37 years. For every 100 females, there were 91.2 males. For every 100 females age 18 and over, there were 87.2 males.
The median income for a household in the city was $35,945, and the median income for a family was $45,945. Males had a median income of $31,945 versus $22,945 for females. The per capita income for the city was $19,945. About 8.7% of families and 11.2% of the population were below the poverty line, including 15.2% of those under age 18 and 8.7% of those age 65 or over.
Common Questions
What is Per Capita Income in El Dorado?
Per Capita income in El Dorado is $28,044.
What is the Median Family Income in El Dorado?
Median Family Income in El Dorado is $74,214.
What is the Median Household income in El Dorado?
Median Household Income in El Dorado is $52,921.
What is Income or Wage Gap in El Dorado?
Income or Wage Gap in El Dorado is 35.7%.
Women in El Dorado earn 64.3 cents for every dollar earned by a man.
What is Family Income Deficit in El Dorado?
Family Income Deficit in El Dorado is $16,015.
Families that are below poverty line in El Dorado earn $16,015 less on average than the poverty threshold level.
What is Inequality or Gini Index in El Dorado?
Inequality or Gini Index in El Dorado is 0.39.
What is the Total Population of El Dorado?
Total Population of El Dorado is 12,882.
What is the Total Male Population of El Dorado?
Total Male Population of El Dorado is 6,332.
What is the Total Female Population of El Dorado?
Total Female Population of El Dorado is 6,550.
What is the Ratio of Males per 100 Females in El Dorado?
There are 96.67 Males per 100 Females in El Dorado.
What is the Ratio of Females per 100 Males in El Dorado?
There are 103.44 Females per 100 Males in El Dorado.
What is the Median Population Age in El Dorado?
Median Population Age in El Dorado is 34.3 Years.
What is the Average Family Size in El Dorado
Average Family Size in El Dorado is 2.8 People.
What is the Average Household Size in El Dorado
Average Household Size in El Dorado is 2.3 People.
How Large is the Labor Force in El Dorado?
There are 6,618 People in the Labor Forcein in El Dorado.
What is the Percentage of People in the Labor Force in El Dorado?
65.9% of People are in the Labor Force in El Dorado.
What is the Unemployment Rate in El Dorado?
Unemployment Rate in El Dorado is 3.4%.