Council Grove, KS Map & Demographics
Council Grove Map
Council Grove Overview
$28,308
PER CAPITA INCOME
$71,898
AVG FAMILY INCOME
$52,326
AVG HOUSEHOLD INCOME
9.4%
WAGE / INCOME GAP [ % ]
90.6¢/ $1
WAGE / INCOME GAP [ $ ]
0.45
INEQUALITY / GINI INDEX
2,452
TOTAL POPULATION
1,261
MALE POPULATION
1,191
FEMALE POPULATION
105.88
MALES / 100 FEMALES
94.45
FEMALES / 100 MALES
38.5
MEDIAN AGE
3.7
AVG FAMILY SIZE
2.6
AVG HOUSEHOLD SIZE
1,168
LABOR FORCE [ PEOPLE ]
64.3%
PERCENT IN LABOR FORCE
3.7%
UNEMPLOYMENT RATE
Council Grove Zip Codes
Income in Council Grove
Income Overview in Council Grove
Per Capita Income in Council Grove is $28,308, while median incomes of families and households are $71,898 and $52,326 respectively.
| Characteristic | Number | Measure |
| Per Capita Income | 2,452 | $28,308 |
| Median Family Income | 523 | $71,898 |
| Mean Family Income | 523 | $91,424 |
| Median Household Income | 915 | $52,326 |
| Mean Household Income | 915 | $70,025 |
| Income Deficit | 523 | $0 |
| Wage / Income Gap (%) | 2,452 | 9.35% |
| Wage / Income Gap ($) | 2,452 | 90.65¢ per $1 |
| Gini / Inequality Index | 2,452 | 0.45 |
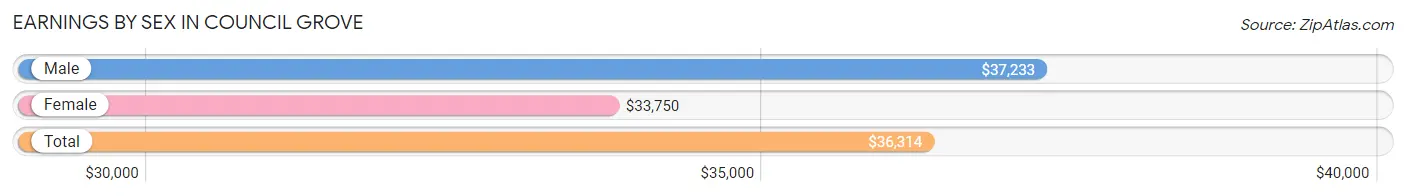
Earnings by Sex in Council Grove
Average Earnings in Council Grove are $36,314, $37,233 for men and $33,750 for women, a difference of 9.3%.
| Sex | Number | Average Earnings |
| Male | 627 (50.9%) | $37,233 |
| Female | 605 (49.1%) | $33,750 |
| Total | 1,232 (100.0%) | $36,314 |
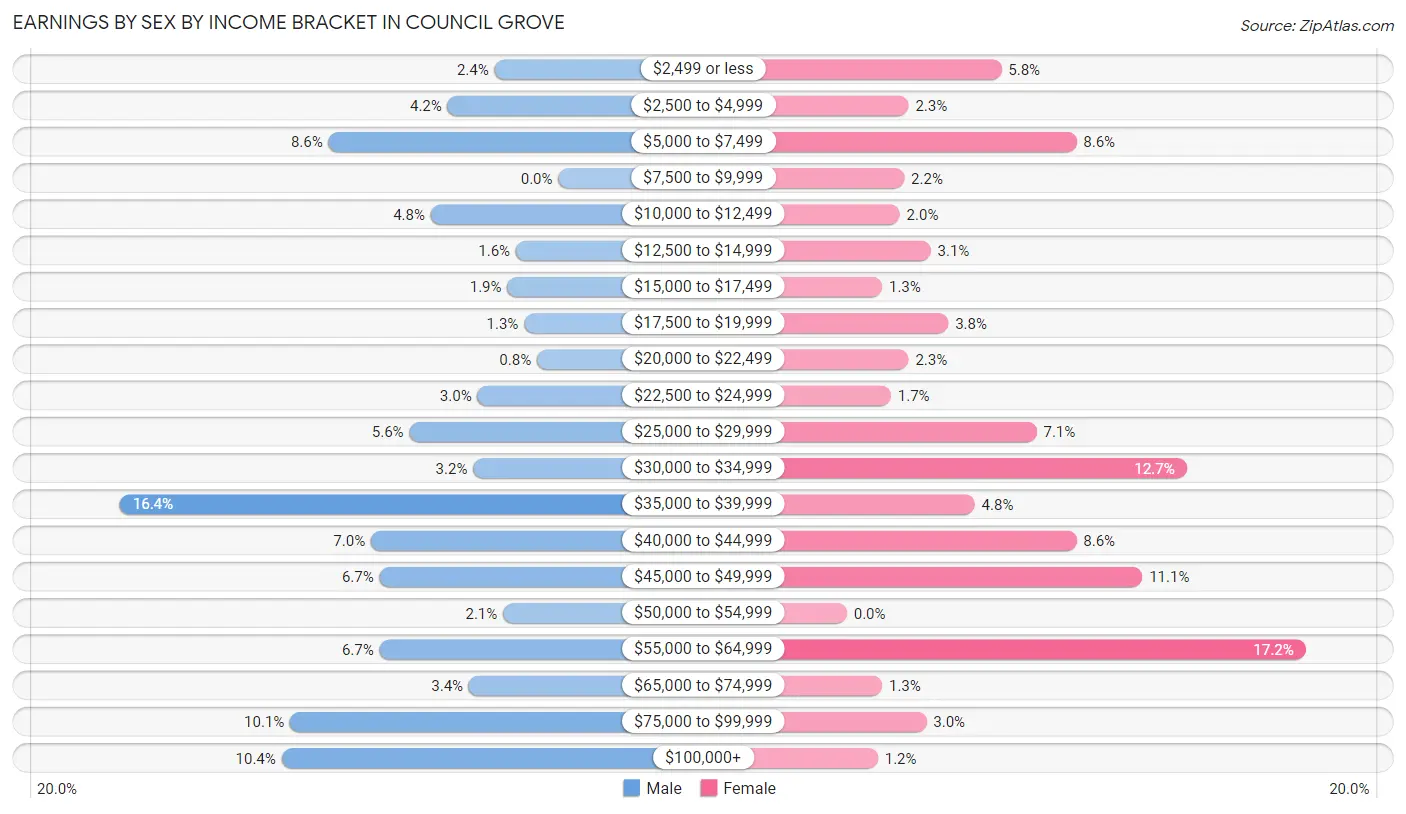
Earnings by Sex by Income Bracket in Council Grove
The most common earnings brackets in Council Grove are $35,000 to $39,999 for men (103 | 16.4%) and $55,000 to $64,999 for women (104 | 17.2%).
| Income | Male | Female |
| $2,499 or less | 15 (2.4%) | 35 (5.8%) |
| $2,500 to $4,999 | 26 (4.2%) | 14 (2.3%) |
| $5,000 to $7,499 | 54 (8.6%) | 52 (8.6%) |
| $7,500 to $9,999 | 0 (0.0%) | 13 (2.1%) |
| $10,000 to $12,499 | 30 (4.8%) | 12 (2.0%) |
| $12,500 to $14,999 | 10 (1.6%) | 19 (3.1%) |
| $15,000 to $17,499 | 12 (1.9%) | 8 (1.3%) |
| $17,500 to $19,999 | 8 (1.3%) | 23 (3.8%) |
| $20,000 to $22,499 | 5 (0.8%) | 14 (2.3%) |
| $22,500 to $24,999 | 19 (3.0%) | 10 (1.7%) |
| $25,000 to $29,999 | 35 (5.6%) | 43 (7.1%) |
| $30,000 to $34,999 | 20 (3.2%) | 77 (12.7%) |
| $35,000 to $39,999 | 103 (16.4%) | 29 (4.8%) |
| $40,000 to $44,999 | 44 (7.0%) | 52 (8.6%) |
| $45,000 to $49,999 | 42 (6.7%) | 67 (11.1%) |
| $50,000 to $54,999 | 13 (2.1%) | 0 (0.0%) |
| $55,000 to $64,999 | 42 (6.7%) | 104 (17.2%) |
| $65,000 to $74,999 | 21 (3.4%) | 8 (1.3%) |
| $75,000 to $99,999 | 63 (10.1%) | 18 (3.0%) |
| $100,000+ | 65 (10.4%) | 7 (1.2%) |
| Total | 627 (100.0%) | 605 (100.0%) |
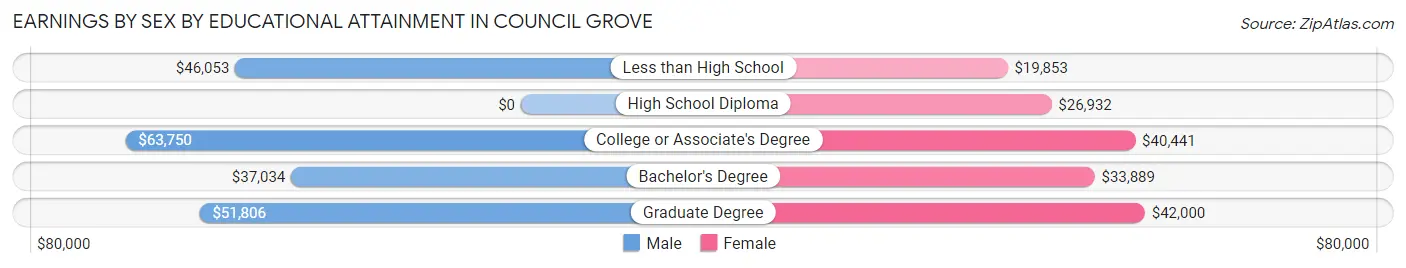
Earnings by Sex by Educational Attainment in Council Grove
Average earnings in Council Grove are $41,108 for men and $35,345 for women, a difference of 14.0%. Men with an educational attainment of college or associate's degree enjoy the highest average annual earnings of $63,750, while those with bachelor's degree education earn the least with $37,034. Women with an educational attainment of graduate degree earn the most with the average annual earnings of $42,000, while those with less than high school education have the smallest earnings of $19,853.
| Educational Attainment | Male Income | Female Income |
| Less than High School | $46,053 | $19,853 |
| High School Diploma | - | - |
| College or Associate's Degree | $63,750 | $40,441 |
| Bachelor's Degree | $37,034 | $33,889 |
| Graduate Degree | $51,806 | $42,000 |
| Total | $41,108 | $35,345 |
Family Income in Council Grove
Family Income Brackets in Council Grove
According to the Council Grove family income data, there are 130 families falling into the $50,000 to $74,999 income range, which is the most common income bracket and makes up 24.9% of all families. Conversely, the $10,000 to $14,999 income bracket is the least frequent group with only 5 families (1.0%) belonging to this category.
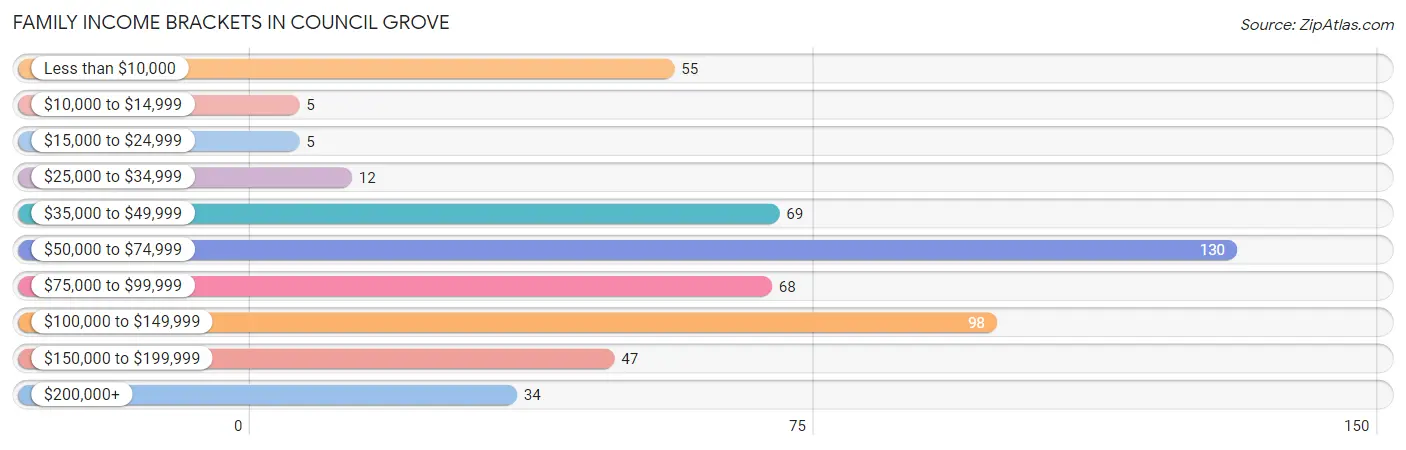
| Income Bracket | # Families | % Families |
| Less than $10,000 | 55 | 10.5% |
| $10,000 to $14,999 | 5 | 1.0% |
| $15,000 to $24,999 | 5 | 1.0% |
| $25,000 to $34,999 | 12 | 2.3% |
| $35,000 to $49,999 | 69 | 13.2% |
| $50,000 to $74,999 | 130 | 24.9% |
| $75,000 to $99,999 | 68 | 13.0% |
| $100,000 to $149,999 | 98 | 18.7% |
| $150,000 to $199,999 | 47 | 9.0% |
| $200,000+ | 34 | 6.5% |
Family Income by Famaliy Size in Council Grove
5-person families (55 | 10.5%) account for the highest median family income in Council Grove with $131,875 per family, while 2-person families (262 | 50.1%) have the highest median income of $35,000 per family member.
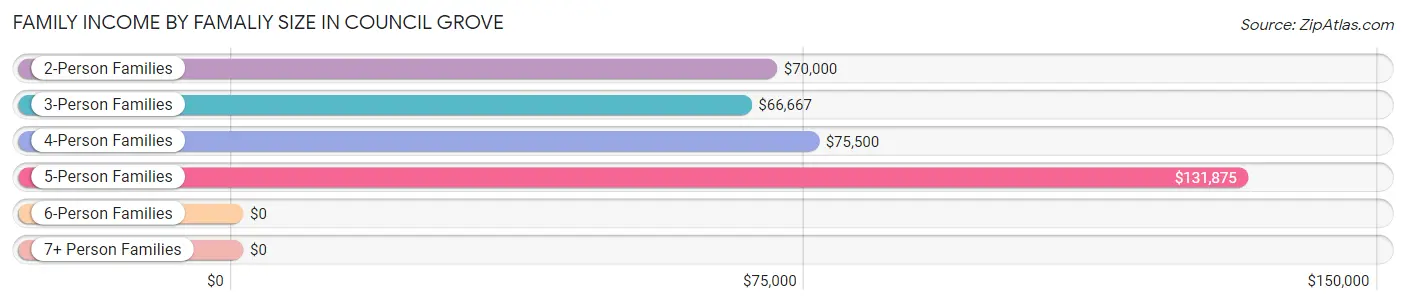
| Income Bracket | # Families | Median Income |
| 2-Person Families | 262 (50.1%) | $70,000 |
| 3-Person Families | 108 (20.6%) | $66,667 |
| 4-Person Families | 80 (15.3%) | $75,500 |
| 5-Person Families | 55 (10.5%) | $131,875 |
| 6-Person Families | 12 (2.3%) | $0 |
| 7+ Person Families | 6 (1.1%) | $0 |
| Total | 523 (100.0%) | $71,898 |
Family Income by Number of Earners in Council Grove
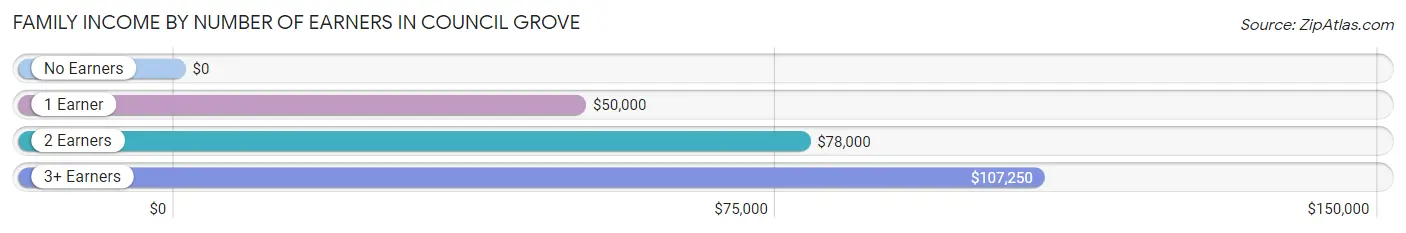
| Number of Earners | # Families | Median Income |
| No Earners | 80 (15.3%) | $0 |
| 1 Earner | 96 (18.4%) | $50,000 |
| 2 Earners | 294 (56.2%) | $78,000 |
| 3+ Earners | 53 (10.1%) | $107,250 |
| Total | 523 (100.0%) | $71,898 |
Household Income in Council Grove
Household Income Brackets in Council Grove
With 207 households falling in the category, the $50,000 to $74,999 income range is the most frequent in Council Grove, accounting for 22.6% of all households. In contrast, only 34 households (3.7%) fall into the $200,000+ income bracket, making it the least populous group.
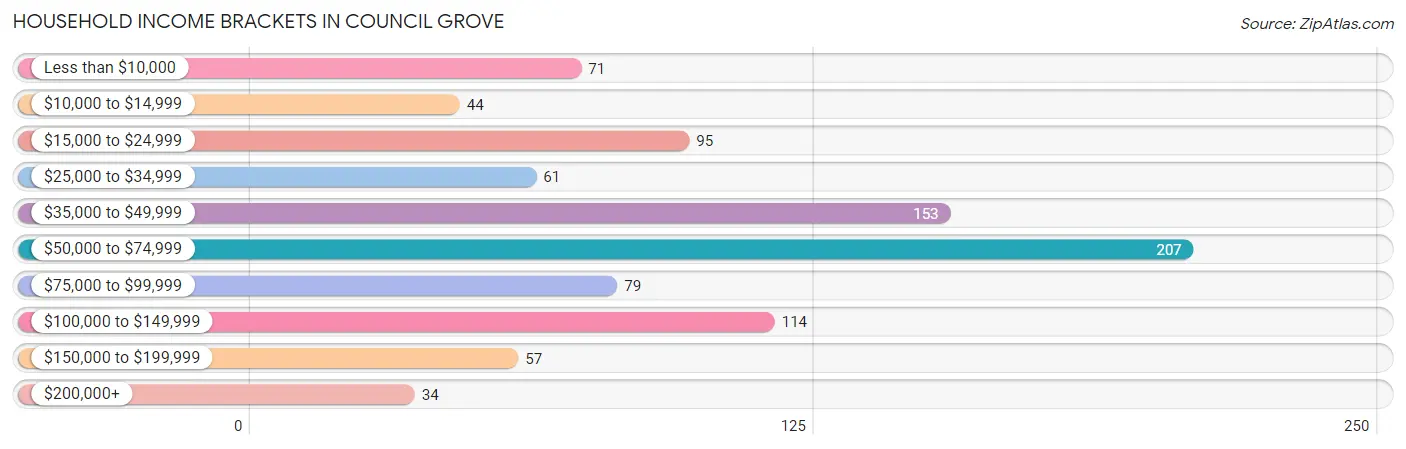
| Income Bracket | # Households | % Households |
| Less than $10,000 | 71 | 7.8% |
| $10,000 to $14,999 | 44 | 4.8% |
| $15,000 to $24,999 | 95 | 10.4% |
| $25,000 to $34,999 | 61 | 6.7% |
| $35,000 to $49,999 | 153 | 16.7% |
| $50,000 to $74,999 | 207 | 22.6% |
| $75,000 to $99,999 | 79 | 8.6% |
| $100,000 to $149,999 | 114 | 12.5% |
| $150,000 to $199,999 | 57 | 6.2% |
| $200,000+ | 34 | 3.7% |
Household Income by Householder Age in Council Grove
The median household income in Council Grove is $52,326, with the highest median household income of $68,977 found in the 45 to 64 years age bracket for the primary householder. A total of 355 households (38.8%) fall into this category. Meanwhile, the 15 to 24 years age bracket for the primary householder has the lowest median household income of $24,453, with 31 households (3.4%) in this group.
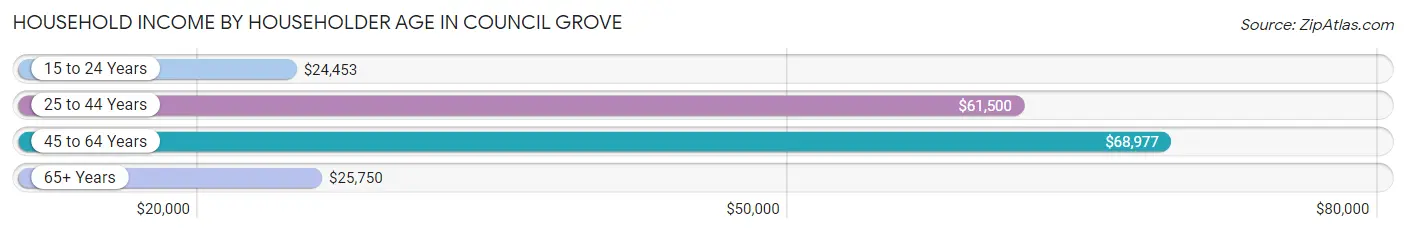
| Income Bracket | # Households | Median Income |
| 15 to 24 Years | 31 (3.4%) | $24,453 |
| 25 to 44 Years | 228 (24.9%) | $61,500 |
| 45 to 64 Years | 355 (38.8%) | $68,977 |
| 65+ Years | 301 (32.9%) | $25,750 |
| Total | 915 (100.0%) | $52,326 |
Poverty in Council Grove
Income Below Poverty by Sex and Age in Council Grove
With 10.7% poverty level for males and 15.2% for females among the residents of Council Grove, under 5 year old males and 5 year old females are the most vulnerable to poverty, with 14 males (50.0%) and 9 females (60.0%) in their respective age groups living below the poverty level.
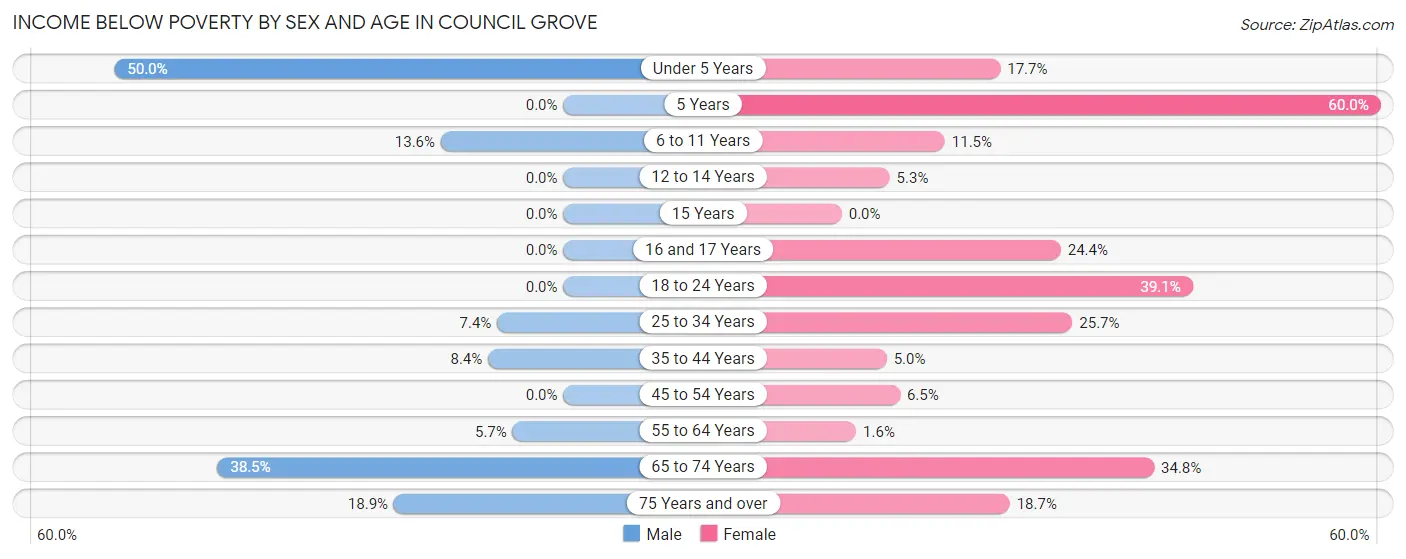
| Age Bracket | Male | Female |
| Under 5 Years | 14 (50.0%) | 9 (17.6%) |
| 5 Years | 0 (0.0%) | 9 (60.0%) |
| 6 to 11 Years | 36 (13.6%) | 7 (11.5%) |
| 12 to 14 Years | 0 (0.0%) | 4 (5.3%) |
| 15 Years | 0 (0.0%) | 0 (0.0%) |
| 16 and 17 Years | 0 (0.0%) | 10 (24.4%) |
| 18 to 24 Years | 0 (0.0%) | 25 (39.1%) |
| 25 to 34 Years | 7 (7.4%) | 19 (25.7%) |
| 35 to 44 Years | 16 (8.4%) | 9 (5.0%) |
| 45 to 54 Years | 0 (0.0%) | 7 (6.5%) |
| 55 to 64 Years | 7 (5.7%) | 3 (1.6%) |
| 65 to 74 Years | 42 (38.5%) | 48 (34.8%) |
| 75 Years and over | 10 (18.9%) | 23 (18.7%) |
| Total | 132 (10.7%) | 173 (15.2%) |
Income Above Poverty by Sex and Age in Council Grove
According to the poverty statistics in Council Grove, males aged 5 years and females aged 15 years are the age groups that are most secure financially, with 100.0% of males and 100.0% of females in these age groups living above the poverty line.
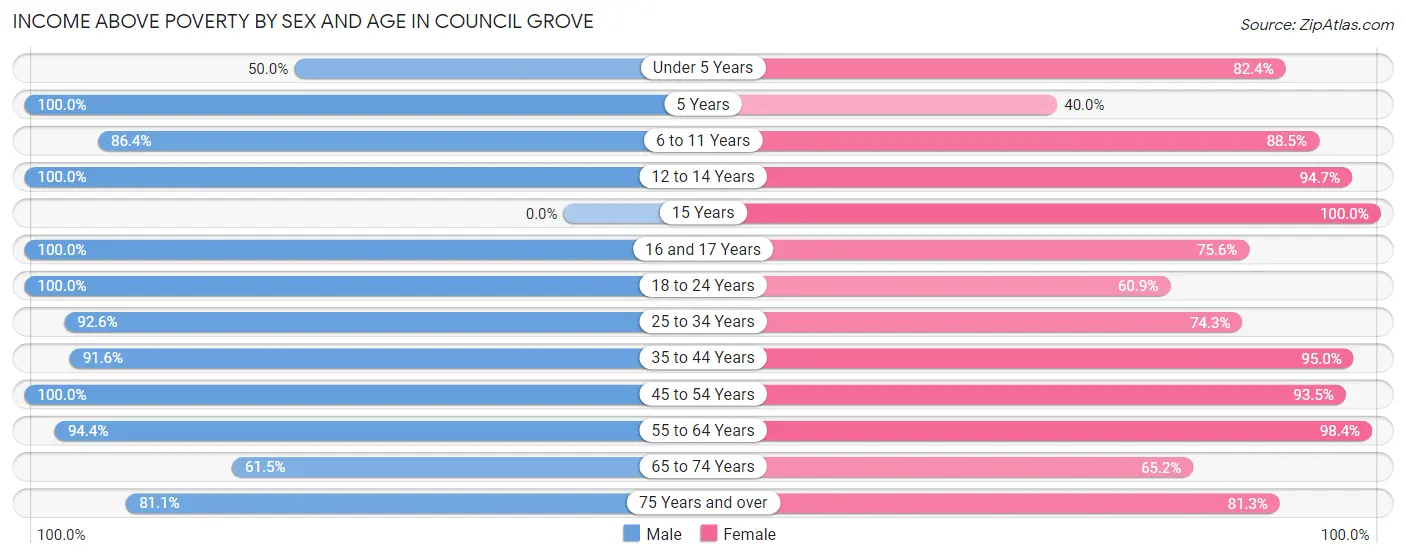
| Age Bracket | Male | Female |
| Under 5 Years | 14 (50.0%) | 42 (82.4%) |
| 5 Years | 33 (100.0%) | 6 (40.0%) |
| 6 to 11 Years | 228 (86.4%) | 54 (88.5%) |
| 12 to 14 Years | 86 (100.0%) | 71 (94.7%) |
| 15 Years | 0 (0.0%) | 23 (100.0%) |
| 16 and 17 Years | 24 (100.0%) | 31 (75.6%) |
| 18 to 24 Years | 93 (100.0%) | 39 (60.9%) |
| 25 to 34 Years | 88 (92.6%) | 55 (74.3%) |
| 35 to 44 Years | 175 (91.6%) | 171 (95.0%) |
| 45 to 54 Years | 132 (100.0%) | 101 (93.5%) |
| 55 to 64 Years | 117 (94.4%) | 185 (98.4%) |
| 65 to 74 Years | 67 (61.5%) | 90 (65.2%) |
| 75 Years and over | 43 (81.1%) | 100 (81.3%) |
| Total | 1,100 (89.3%) | 968 (84.8%) |
Income Below Poverty Among Married-Couple Families in Council Grove
The poverty statistics for married-couple families in Council Grove show that 13.0% or 53 of the total 408 families live below the poverty line. Families with 5 or more children have the highest poverty rate of 100.0%, comprising of 6 families. On the other hand, families with 1 or 2 children have the lowest poverty rate of 0.0%, which includes 0 families.
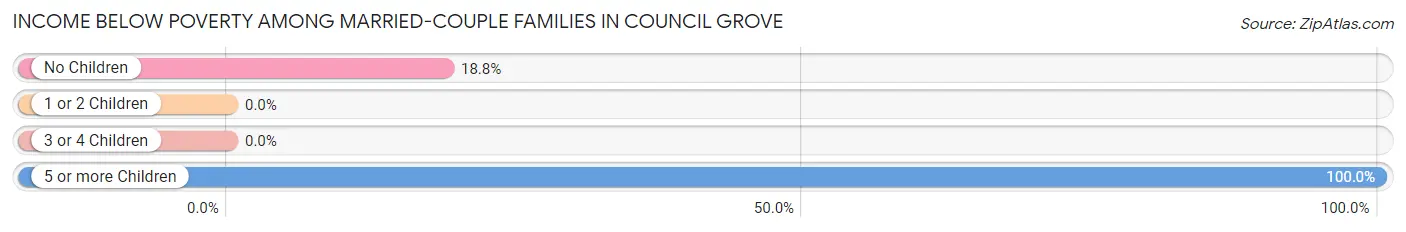
| Children | Above Poverty | Below Poverty |
| No Children | 203 (81.2%) | 47 (18.8%) |
| 1 or 2 Children | 93 (100.0%) | 0 (0.0%) |
| 3 or 4 Children | 59 (100.0%) | 0 (0.0%) |
| 5 or more Children | 0 (0.0%) | 6 (100.0%) |
| Total | 355 (87.0%) | 53 (13.0%) |
Income Below Poverty Among Single-Parent Households in Council Grove
According to the poverty data in Council Grove, 22.2% or 4 single-father households and 13.4% or 13 single-mother households are living below the poverty line. Among single-father households, those with 1 or 2 children have the highest poverty rate, with 4 households (26.7%) experiencing poverty. Likewise, among single-mother households, those with 3 or 4 children have the highest poverty rate, with 13 households (100.0%) falling below the poverty line.
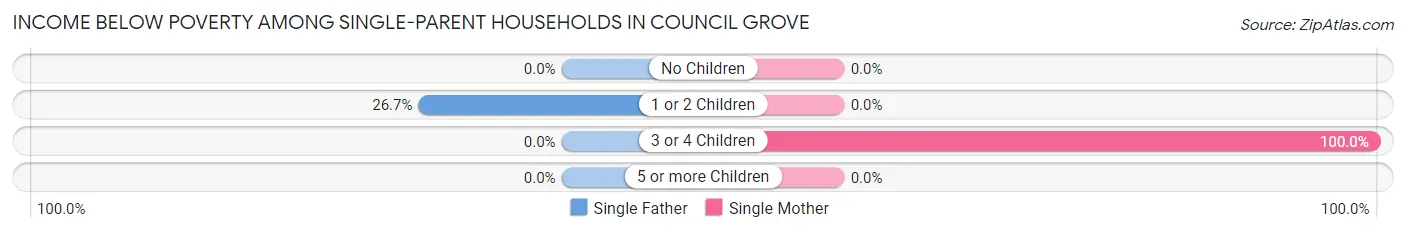
| Children | Single Father | Single Mother |
| No Children | 0 (0.0%) | 0 (0.0%) |
| 1 or 2 Children | 4 (26.7%) | 0 (0.0%) |
| 3 or 4 Children | 0 (0.0%) | 13 (100.0%) |
| 5 or more Children | 0 (0.0%) | 0 (0.0%) |
| Total | 4 (22.2%) | 13 (13.4%) |
Income Below Poverty Among Married-Couple vs Single-Parent Households in Council Grove
The poverty data for Council Grove shows that 53 of the married-couple family households (13.0%) and 17 of the single-parent households (14.8%) are living below the poverty level. Within the married-couple family households, those with 5 or more children have the highest poverty rate, with 6 households (100.0%) falling below the poverty line. Among the single-parent households, those with 3 or 4 children have the highest poverty rate, with 13 household (100.0%) living below poverty.
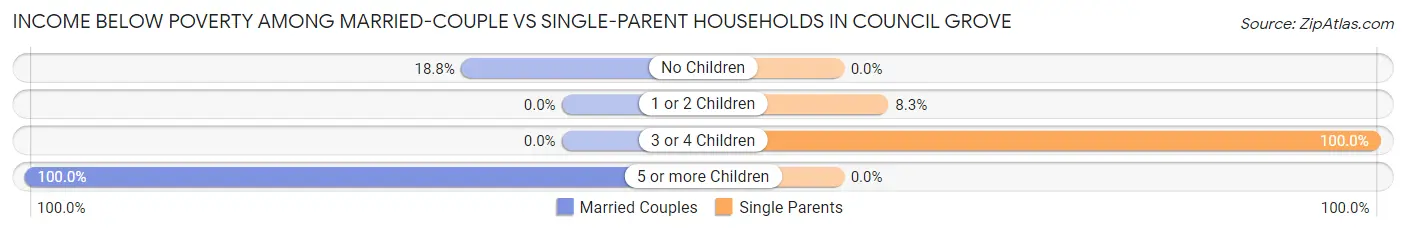
| Children | Married-Couple Families | Single-Parent Households |
| No Children | 47 (18.8%) | 0 (0.0%) |
| 1 or 2 Children | 0 (0.0%) | 4 (8.3%) |
| 3 or 4 Children | 0 (0.0%) | 13 (100.0%) |
| 5 or more Children | 6 (100.0%) | 0 (0.0%) |
| Total | 53 (13.0%) | 17 (14.8%) |
Race in Council Grove
The most populous races in Council Grove are White / Caucasian (2,273 | 92.7%), Hispanic or Latino (259 | 10.6%), and Two or more Races (150 | 6.1%).
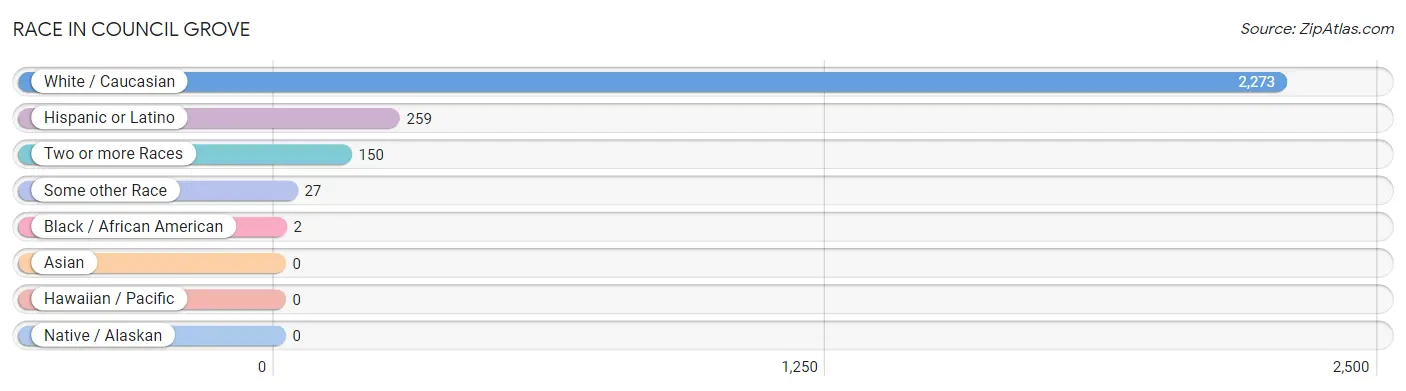
| Race | # Population | % Population |
| Asian | 0 | 0.0% |
| Black / African American | 2 | 0.1% |
| Hawaiian / Pacific | 0 | 0.0% |
| Hispanic or Latino | 259 | 10.6% |
| Native / Alaskan | 0 | 0.0% |
| White / Caucasian | 2,273 | 92.7% |
| Two or more Races | 150 | 6.1% |
| Some other Race | 27 | 1.1% |
| Total | 2,452 | 100.0% |
Ancestry in Council Grove
The most populous ancestries reported in Council Grove are German (567 | 23.1%), American (318 | 13.0%), English (301 | 12.3%), Mexican (258 | 10.5%), and Irish (193 | 7.9%), together accounting for 66.8% of all Council Grove residents.
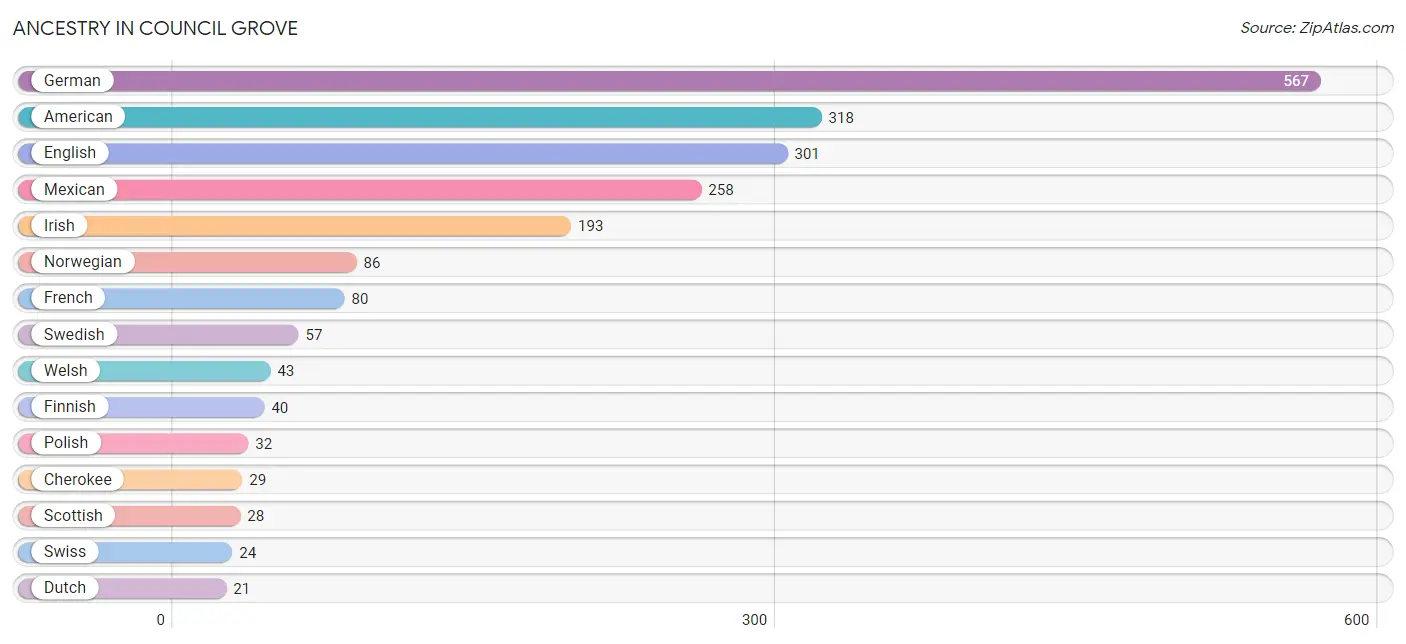
| Ancestry | # Population | % Population |
| African | 1 | 0.0% |
| American | 318 | 13.0% |
| Blackfeet | 18 | 0.7% |
| Cherokee | 29 | 1.2% |
| Croatian | 6 | 0.2% |
| Czech | 11 | 0.4% |
| Dutch | 21 | 0.9% |
| English | 301 | 12.3% |
| European | 20 | 0.8% |
| Finnish | 40 | 1.6% |
| French | 80 | 3.3% |
| French Canadian | 13 | 0.5% |
| German | 567 | 23.1% |
| German Russian | 6 | 0.2% |
| Irish | 193 | 7.9% |
| Italian | 18 | 0.7% |
| Mexican | 258 | 10.5% |
| Navajo | 16 | 0.6% |
| Northern European | 6 | 0.2% |
| Norwegian | 86 | 3.5% |
| Polish | 32 | 1.3% |
| Portuguese | 5 | 0.2% |
| Puerto Rican | 1 | 0.0% |
| Scotch-Irish | 21 | 0.9% |
| Scottish | 28 | 1.1% |
| Subsaharan African | 1 | 0.0% |
| Swedish | 57 | 2.3% |
| Swiss | 24 | 1.0% |
| Welsh | 43 | 1.8% | View All 29 Rows |
Immigrants in Council Grove
The most numerous immigrant groups reported in Council Grove came from Central America (25 | 1.0%), Latin America (25 | 1.0%), Mexico (25 | 1.0%), Europe (16 | 0.6%), and Germany (16 | 0.6%), together accounting for 4.4% of all Council Grove residents.
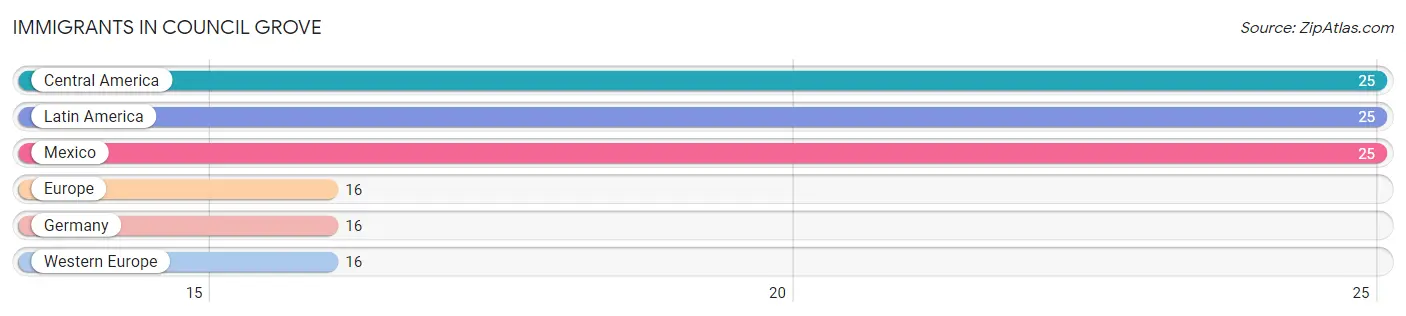
| Immigration Origin | # Population | % Population |
| Central America | 25 | 1.0% |
| Europe | 16 | 0.6% |
| Germany | 16 | 0.6% |
| Latin America | 25 | 1.0% |
| Mexico | 25 | 1.0% |
| Western Europe | 16 | 0.6% | View All 6 Rows |
Sex and Age in Council Grove
Sex and Age in Council Grove
The most populous age groups in Council Grove are 5 to 9 Years (232 | 18.4%) for men and 60 to 64 Years (122 | 10.2%) for women.
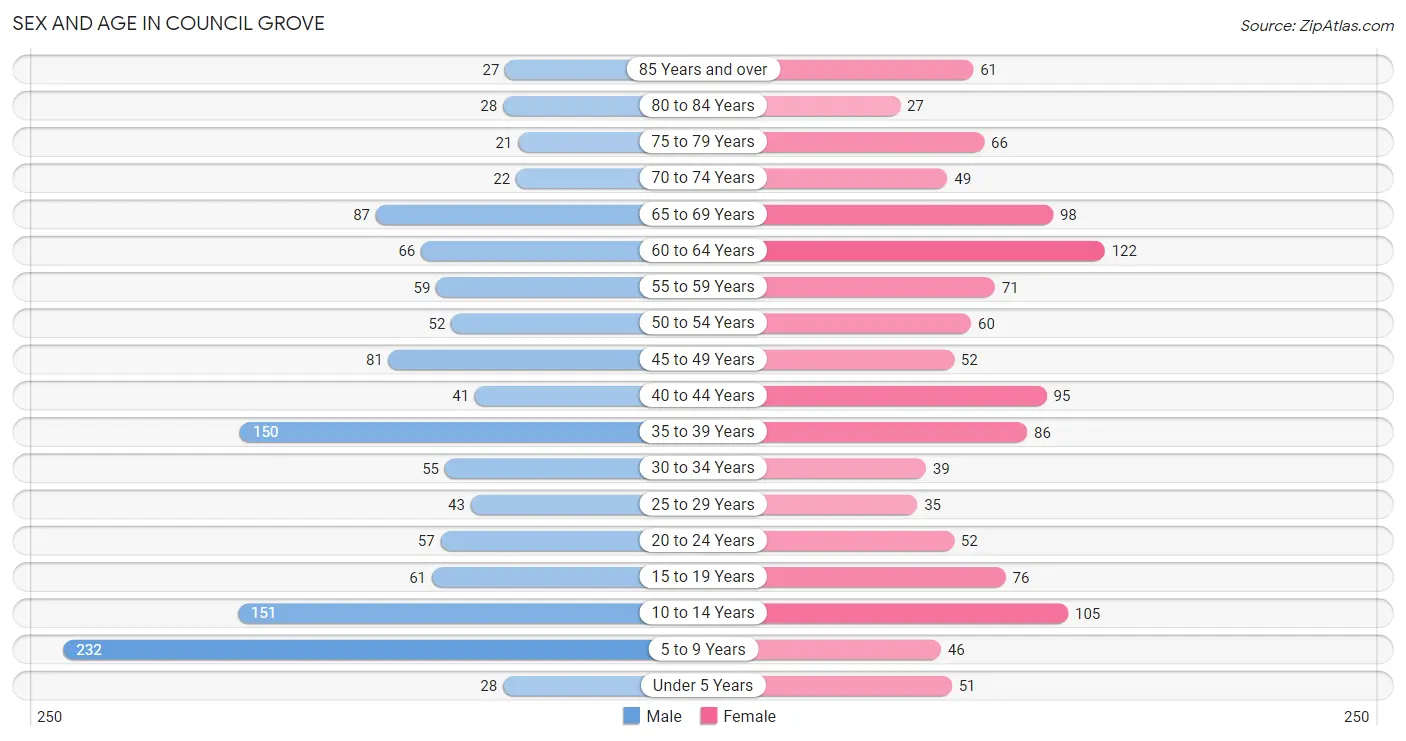
| Age Bracket | Male | Female |
| Under 5 Years | 28 (2.2%) | 51 (4.3%) |
| 5 to 9 Years | 232 (18.4%) | 46 (3.9%) |
| 10 to 14 Years | 151 (12.0%) | 105 (8.8%) |
| 15 to 19 Years | 61 (4.8%) | 76 (6.4%) |
| 20 to 24 Years | 57 (4.5%) | 52 (4.4%) |
| 25 to 29 Years | 43 (3.4%) | 35 (2.9%) |
| 30 to 34 Years | 55 (4.4%) | 39 (3.3%) |
| 35 to 39 Years | 150 (11.9%) | 86 (7.2%) |
| 40 to 44 Years | 41 (3.3%) | 95 (8.0%) |
| 45 to 49 Years | 81 (6.4%) | 52 (4.4%) |
| 50 to 54 Years | 52 (4.1%) | 60 (5.0%) |
| 55 to 59 Years | 59 (4.7%) | 71 (6.0%) |
| 60 to 64 Years | 66 (5.2%) | 122 (10.2%) |
| 65 to 69 Years | 87 (6.9%) | 98 (8.2%) |
| 70 to 74 Years | 22 (1.7%) | 49 (4.1%) |
| 75 to 79 Years | 21 (1.7%) | 66 (5.5%) |
| 80 to 84 Years | 28 (2.2%) | 27 (2.3%) |
| 85 Years and over | 27 (2.1%) | 61 (5.1%) |
| Total | 1,261 (100.0%) | 1,191 (100.0%) |
Families and Households in Council Grove
Median Family Size in Council Grove
The median family size in Council Grove is 3.66 persons per family, with single male/father families (18 | 3.4%) accounting for the largest median family size of 13.22 persons per family. On the other hand, single female/mother families (97 | 18.5%) represent the smallest median family size with 2.74 persons per family.
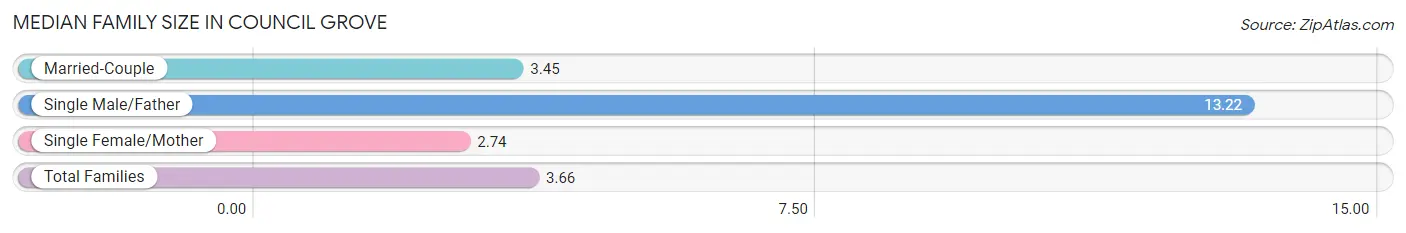
| Family Type | # Families | Family Size |
| Married-Couple | 408 (78.0%) | 3.45 |
| Single Male/Father | 18 (3.4%) | 13.22 |
| Single Female/Mother | 97 (18.5%) | 2.74 |
| Total Families | 523 (100.0%) | 3.66 |
Median Household Size in Council Grove
The median household size in Council Grove is 2.59 persons per household, with single male/father households (18 | 2.0%) accounting for the largest median household size of 14.17 persons per household. non-family households (392 | 42.8%) represent the smallest median household size with 1.08 persons per household.
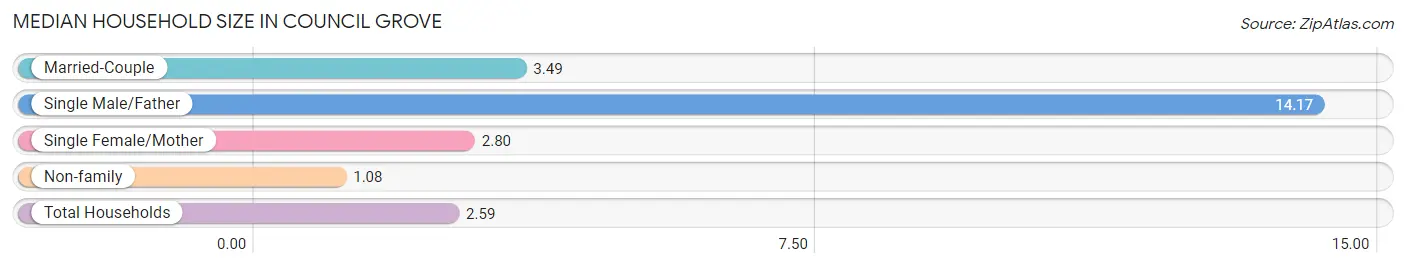
| Household Type | # Households | Household Size |
| Married-Couple | 408 (44.6%) | 3.49 |
| Single Male/Father | 18 (2.0%) | 14.17 |
| Single Female/Mother | 97 (10.6%) | 2.80 |
| Non-family | 392 (42.8%) | 1.08 |
| Total Households | 915 (100.0%) | 2.59 |
Household Size by Marriage Status in Council Grove
Out of a total of 915 households in Council Grove, 523 (57.2%) are family households, while 392 (42.8%) are nonfamily households. The most numerous type of family households are 2-person households, comprising 255, and the most common type of nonfamily households are 1-person households, comprising 368.
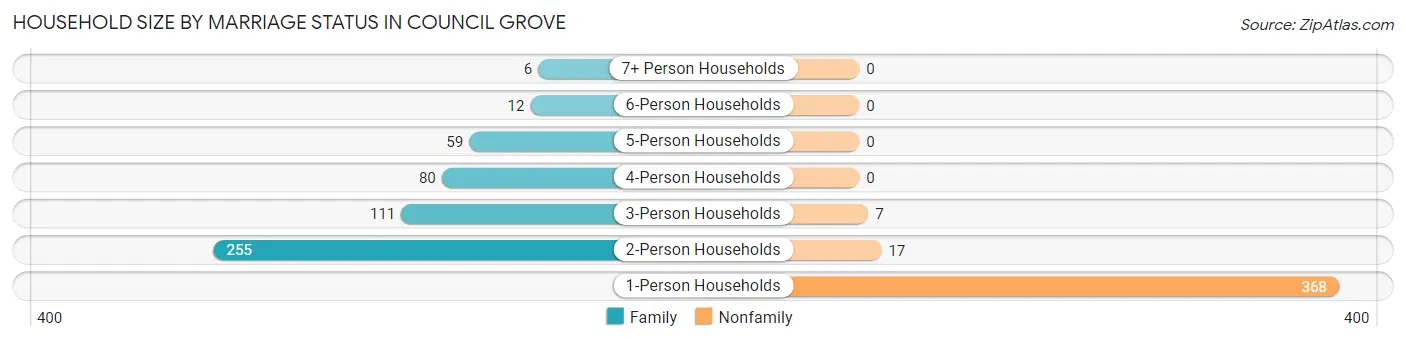
| Household Size | Family Households | Nonfamily Households |
| 1-Person Households | - | 368 (40.2%) |
| 2-Person Households | 255 (27.9%) | 17 (1.9%) |
| 3-Person Households | 111 (12.1%) | 7 (0.8%) |
| 4-Person Households | 80 (8.7%) | 0 (0.0%) |
| 5-Person Households | 59 (6.5%) | 0 (0.0%) |
| 6-Person Households | 12 (1.3%) | 0 (0.0%) |
| 7+ Person Households | 6 (0.7%) | 0 (0.0%) |
| Total | 523 (57.2%) | 392 (42.8%) |
Female Fertility in Council Grove
Fertility by Age in Council Grove
Average fertility rate in Council Grove is 20.0 births per 1,000 women. Women in the age bracket of 35 to 50 years have the highest fertility rate with 36.0 births per 1,000 women. Women in the age bracket of 35 to 50 years acount for 100.0% of all women with births.
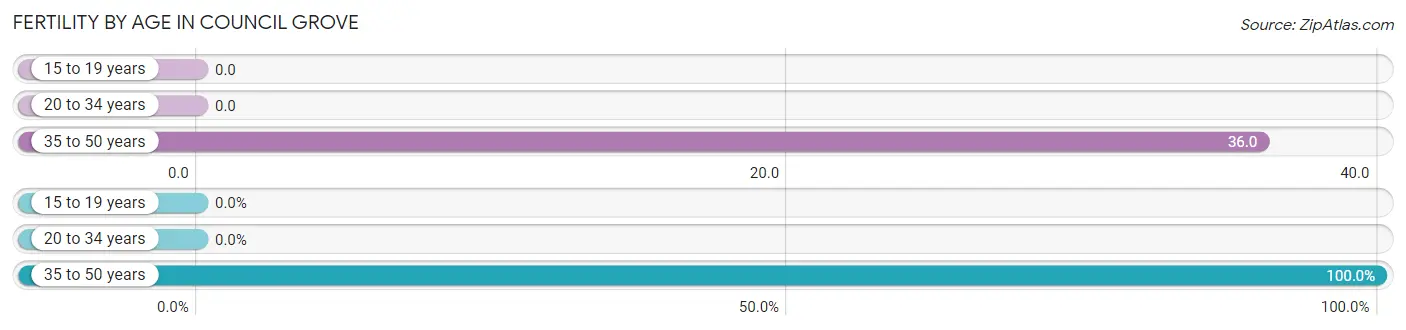
| Age Bracket | Women with Births | Births / 1,000 Women |
| 15 to 19 years | 0 (0.0%) | 0.0 |
| 20 to 34 years | 0 (0.0%) | 0.0 |
| 35 to 50 years | 9 (100.0%) | 36.0 |
| Total | 9 (100.0%) | 20.0 |
Fertility by Age by Marriage Status in Council Grove
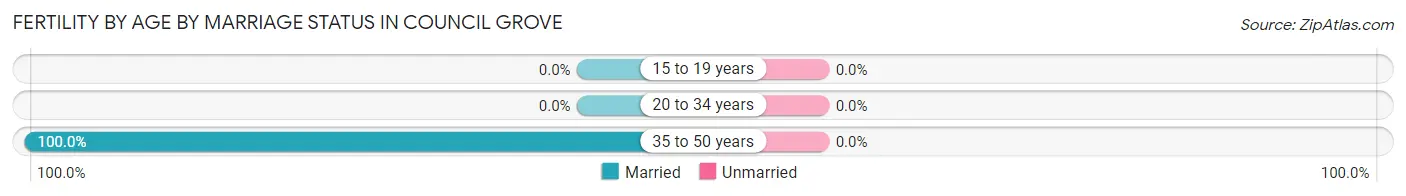
| Age Bracket | Married | Unmarried |
| 15 to 19 years | 0 (0.0%) | 0 (0.0%) |
| 20 to 34 years | 0 (0.0%) | 0 (0.0%) |
| 35 to 50 years | 9 (100.0%) | 0 (0.0%) |
| Total | 9 (100.0%) | 0 (0.0%) |
Fertility by Education in Council Grove
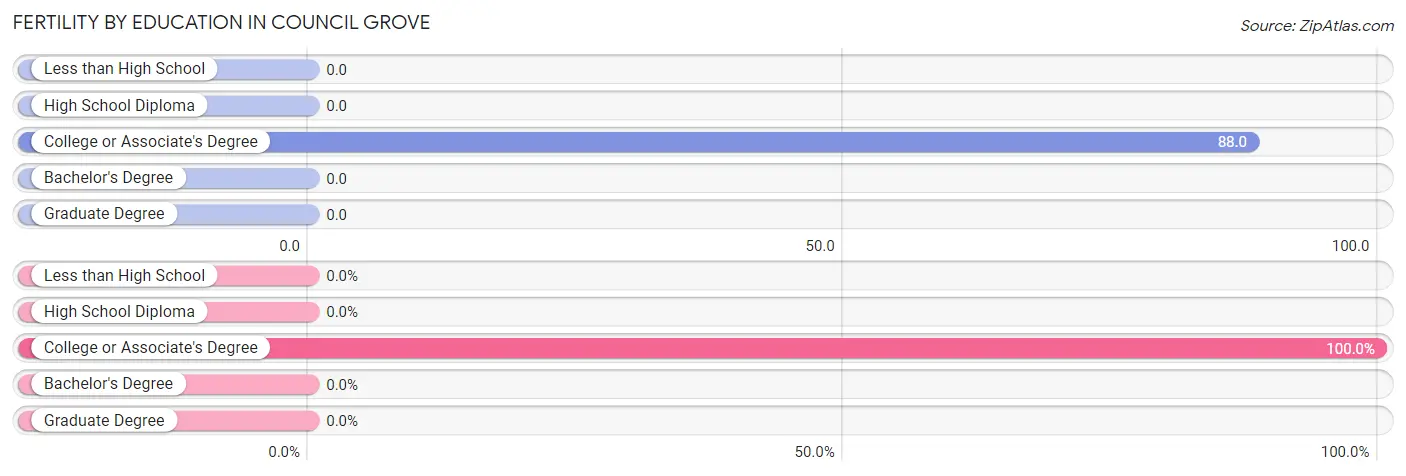
| Educational Attainment | Women with Births | Births / 1,000 Women |
| Less than High School | 0 (0.0%) | 0.0 |
| High School Diploma | 0 (0.0%) | 0.0 |
| College or Associate's Degree | 9 (100.0%) | 88.0 |
| Bachelor's Degree | 0 (0.0%) | 0.0 |
| Graduate Degree | 0 (0.0%) | 0.0 |
| Total | 9 (100.0%) | 20.0 |
Fertility by Education by Marriage Status in Council Grove
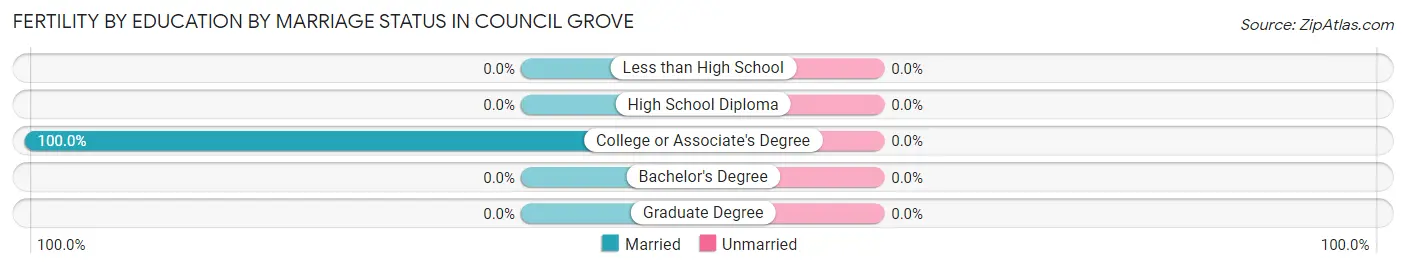
| Educational Attainment | Married | Unmarried |
| Less than High School | 0 (0.0%) | 0 (0.0%) |
| High School Diploma | 0 (0.0%) | 0 (0.0%) |
| College or Associate's Degree | 9 (100.0%) | 0 (0.0%) |
| Bachelor's Degree | 0 (0.0%) | 0 (0.0%) |
| Graduate Degree | 0 (0.0%) | 0 (0.0%) |
| Total | 9 (100.0%) | 0 (0.0%) |
Employment Characteristics in Council Grove
Employment by Class of Employer in Council Grove
Among the 1,097 employed individuals in Council Grove, private company employees (655 | 59.7%), local government employees (144 | 13.1%), and not-for-profit organizations (98 | 8.9%) make up the most common classes of employment.
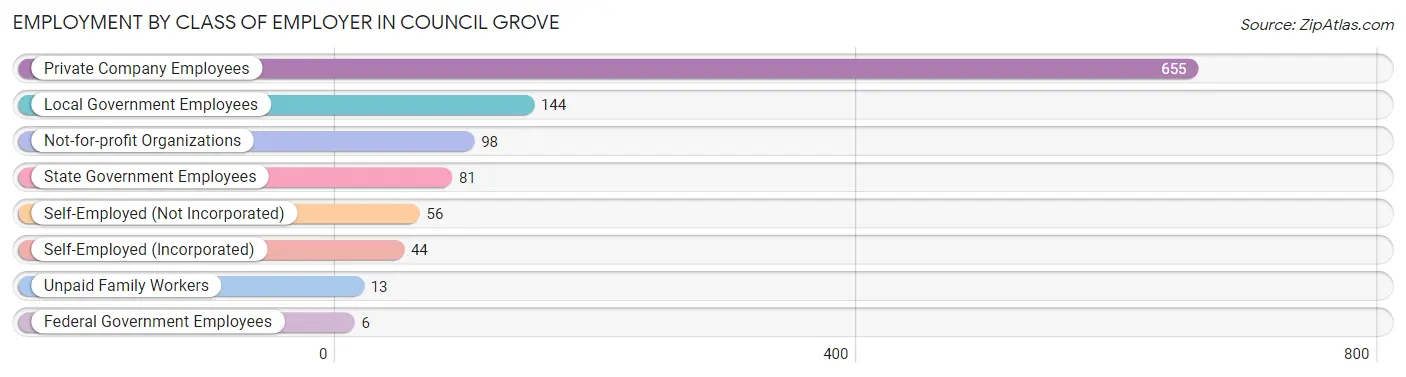
| Employer Class | # Employees | % Employees |
| Private Company Employees | 655 | 59.7% |
| Self-Employed (Incorporated) | 44 | 4.0% |
| Self-Employed (Not Incorporated) | 56 | 5.1% |
| Not-for-profit Organizations | 98 | 8.9% |
| Local Government Employees | 144 | 13.1% |
| State Government Employees | 81 | 7.4% |
| Federal Government Employees | 6 | 0.5% |
| Unpaid Family Workers | 13 | 1.2% |
| Total | 1,097 | 100.0% |
Employment Status by Age in Council Grove
According to the labor force statistics for Council Grove, out of the total population over 16 years of age (1,816), 64.3% or 1,168 individuals are in the labor force, with 3.7% or 43 of them unemployed. The age group with the highest labor force participation rate is 25 to 29 years, with 98.7% or 77 individuals in the labor force. Within the labor force, the 16 to 19 years age range has the highest percentage of unemployed individuals, with 32.2% or 19 of them being unemployed.
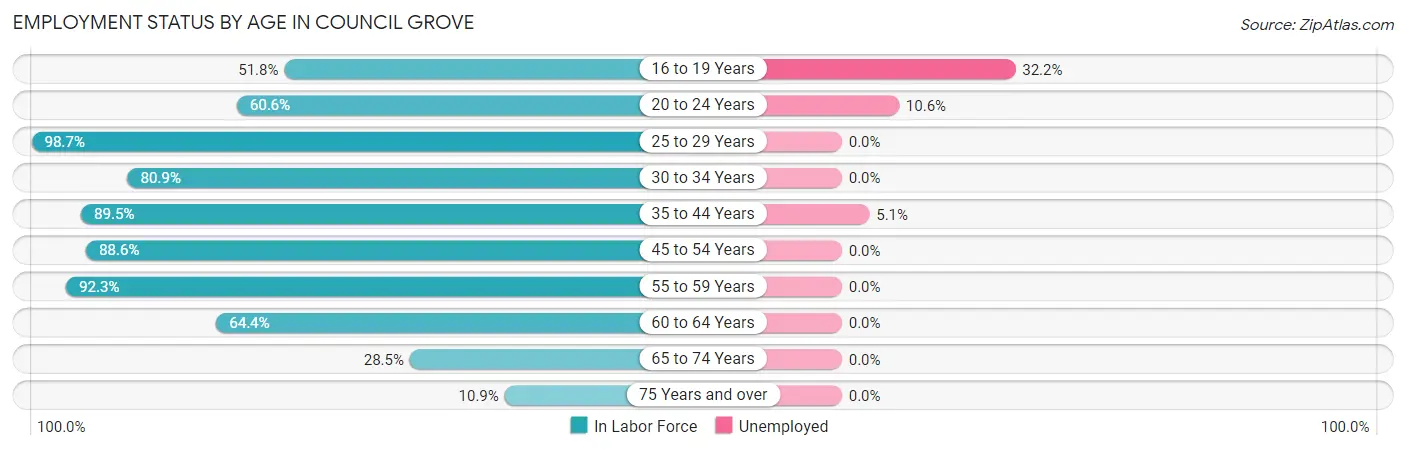
| Age Bracket | In Labor Force | Unemployed |
| 16 to 19 Years | 59 (51.8%) | 19 (32.2%) |
| 20 to 24 Years | 66 (60.6%) | 7 (10.6%) |
| 25 to 29 Years | 77 (98.7%) | 0 (0.0%) |
| 30 to 34 Years | 76 (80.9%) | 0 (0.0%) |
| 35 to 44 Years | 333 (89.5%) | 17 (5.1%) |
| 45 to 54 Years | 217 (88.6%) | 0 (0.0%) |
| 55 to 59 Years | 120 (92.3%) | 0 (0.0%) |
| 60 to 64 Years | 121 (64.4%) | 0 (0.0%) |
| 65 to 74 Years | 73 (28.5%) | 0 (0.0%) |
| 75 Years and over | 25 (10.9%) | 0 (0.0%) |
| Total | 1,168 (64.3%) | 43 (3.7%) |
Employment Status by Educational Attainment in Council Grove
According to labor force statistics for Council Grove, 85.3% of individuals (944) out of the total population between 25 and 64 years of age (1,107) are in the labor force, with 1.8% or 17 of them being unemployed. The group with the highest labor force participation rate are those with the educational attainment of bachelor's degree or higher, with 93.4% or 309 individuals in the labor force. Within the labor force, individuals with high school diploma education have the highest percentage of unemployment, with 6.5% or 17 of them being unemployed.
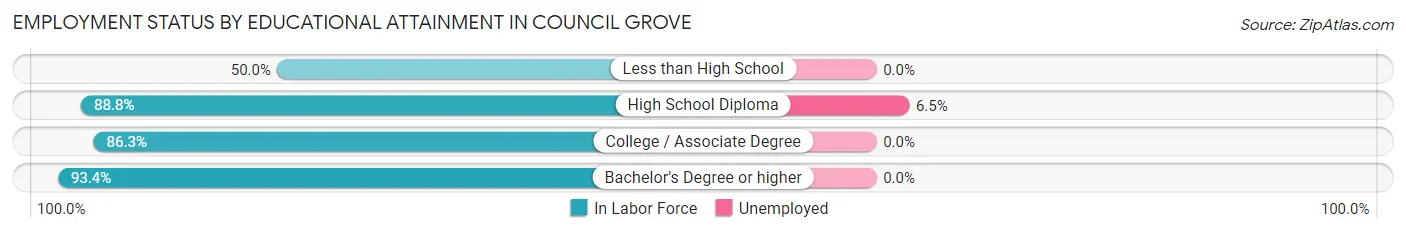
| Educational Attainment | In Labor Force | Unemployed |
| Less than High School | 58 (50.0%) | 0 (0.0%) |
| High School Diploma | 261 (88.8%) | 19 (6.5%) |
| College / Associate Degree | 316 (86.3%) | 0 (0.0%) |
| Bachelor's Degree or higher | 309 (93.4%) | 0 (0.0%) |
| Total | 944 (85.3%) | 20 (1.8%) |
Employment Occupations by Sex in Council Grove
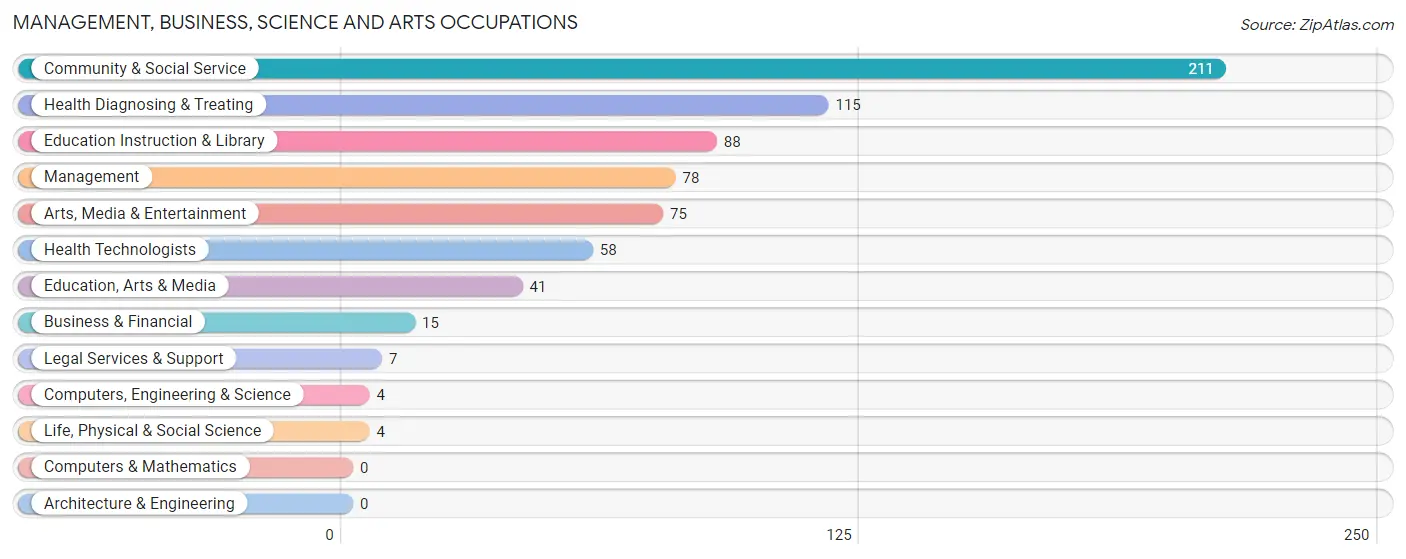
Management, Business, Science and Arts Occupations
The most common Management, Business, Science and Arts occupations in Council Grove are Community & Social Service (211 | 18.8%), Health Diagnosing & Treating (115 | 10.2%), Education Instruction & Library (88 | 7.8%), Management (78 | 6.9%), and Arts, Media & Entertainment (75 | 6.7%).
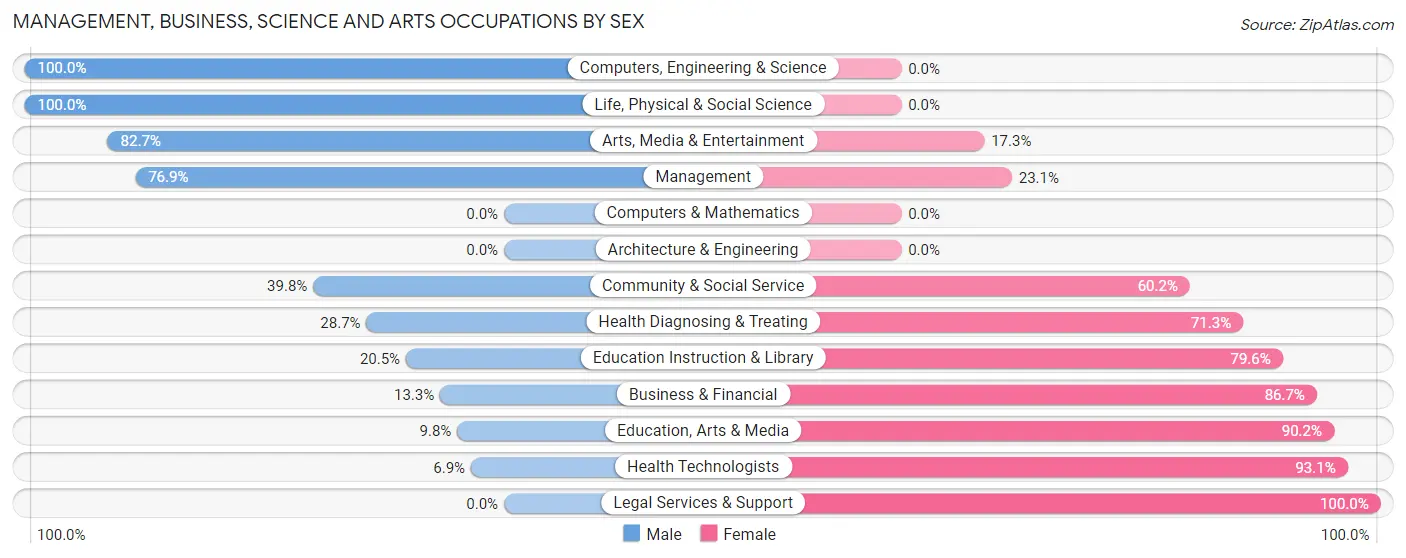
Management, Business, Science and Arts Occupations by Sex
Within the Management, Business, Science and Arts occupations in Council Grove, the most male-oriented occupations are Computers, Engineering & Science (100.0%), Life, Physical & Social Science (100.0%), and Arts, Media & Entertainment (82.7%), while the most female-oriented occupations are Legal Services & Support (100.0%), Health Technologists (93.1%), and Education, Arts & Media (90.2%).
| Occupation | Male | Female |
| Management | 60 (76.9%) | 18 (23.1%) |
| Business & Financial | 2 (13.3%) | 13 (86.7%) |
| Computers, Engineering & Science | 4 (100.0%) | 0 (0.0%) |
| Computers & Mathematics | 0 (0.0%) | 0 (0.0%) |
| Architecture & Engineering | 0 (0.0%) | 0 (0.0%) |
| Life, Physical & Social Science | 4 (100.0%) | 0 (0.0%) |
| Community & Social Service | 84 (39.8%) | 127 (60.2%) |
| Education, Arts & Media | 4 (9.8%) | 37 (90.2%) |
| Legal Services & Support | 0 (0.0%) | 7 (100.0%) |
| Education Instruction & Library | 18 (20.4%) | 70 (79.5%) |
| Arts, Media & Entertainment | 62 (82.7%) | 13 (17.3%) |
| Health Diagnosing & Treating | 33 (28.7%) | 82 (71.3%) |
| Health Technologists | 4 (6.9%) | 54 (93.1%) |
| Total (Category) | 183 (43.3%) | 240 (56.7%) |
| Total (Overall) | 581 (51.7%) | 543 (48.3%) |
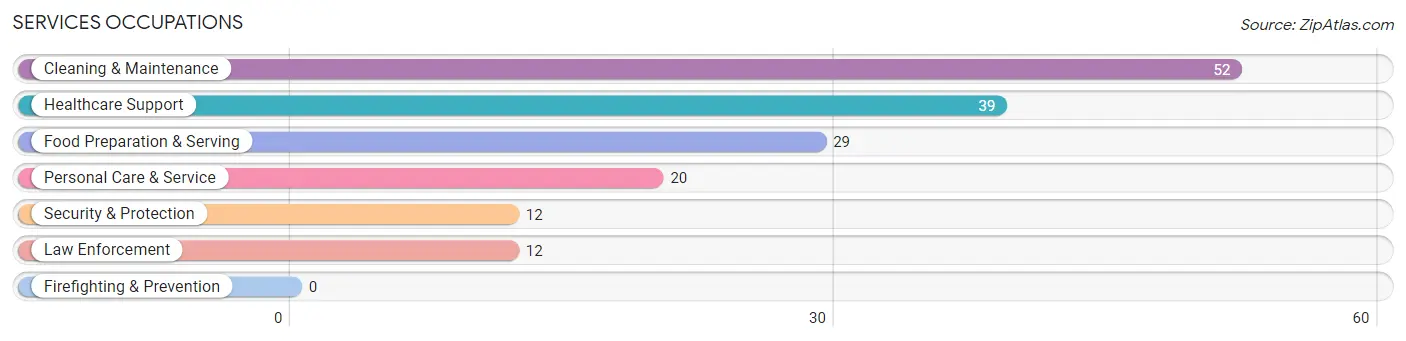
Services Occupations
The most common Services occupations in Council Grove are Cleaning & Maintenance (52 | 4.6%), Healthcare Support (39 | 3.5%), Food Preparation & Serving (29 | 2.6%), Personal Care & Service (20 | 1.8%), and Security & Protection (12 | 1.1%).
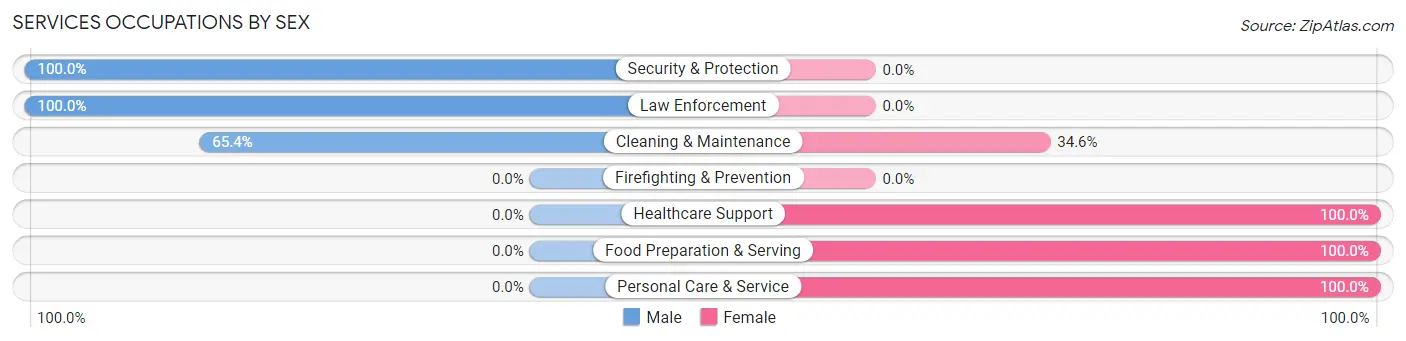
Services Occupations by Sex
Within the Services occupations in Council Grove, the most male-oriented occupations are Security & Protection (100.0%), Law Enforcement (100.0%), and Cleaning & Maintenance (65.4%), while the most female-oriented occupations are Healthcare Support (100.0%), Food Preparation & Serving (100.0%), and Personal Care & Service (100.0%).
| Occupation | Male | Female |
| Healthcare Support | 0 (0.0%) | 39 (100.0%) |
| Security & Protection | 12 (100.0%) | 0 (0.0%) |
| Firefighting & Prevention | 0 (0.0%) | 0 (0.0%) |
| Law Enforcement | 12 (100.0%) | 0 (0.0%) |
| Food Preparation & Serving | 0 (0.0%) | 29 (100.0%) |
| Cleaning & Maintenance | 34 (65.4%) | 18 (34.6%) |
| Personal Care & Service | 0 (0.0%) | 20 (100.0%) |
| Total (Category) | 46 (30.3%) | 106 (69.7%) |
| Total (Overall) | 581 (51.7%) | 543 (48.3%) |
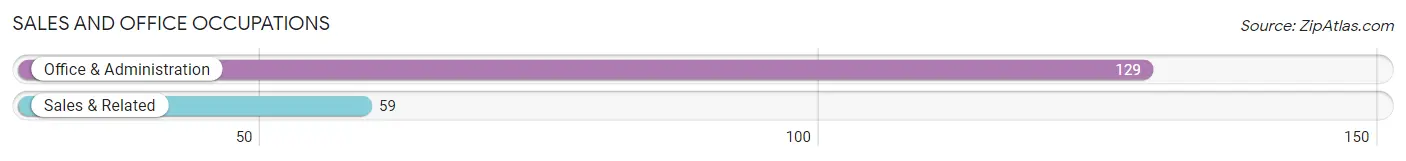
Sales and Office Occupations
The most common Sales and Office occupations in Council Grove are Office & Administration (129 | 11.5%), and Sales & Related (59 | 5.2%).
Sales and Office Occupations by Sex
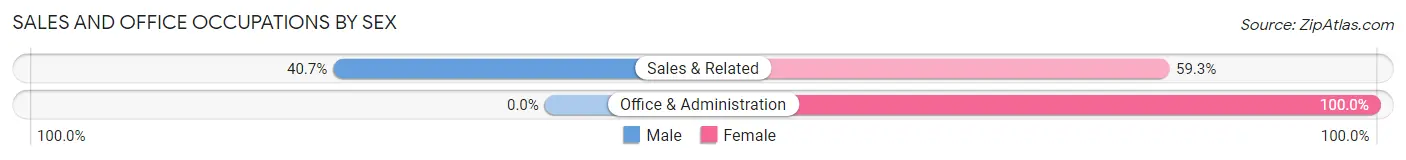
| Occupation | Male | Female |
| Sales & Related | 24 (40.7%) | 35 (59.3%) |
| Office & Administration | 0 (0.0%) | 129 (100.0%) |
| Total (Category) | 24 (12.8%) | 164 (87.2%) |
| Total (Overall) | 581 (51.7%) | 543 (48.3%) |
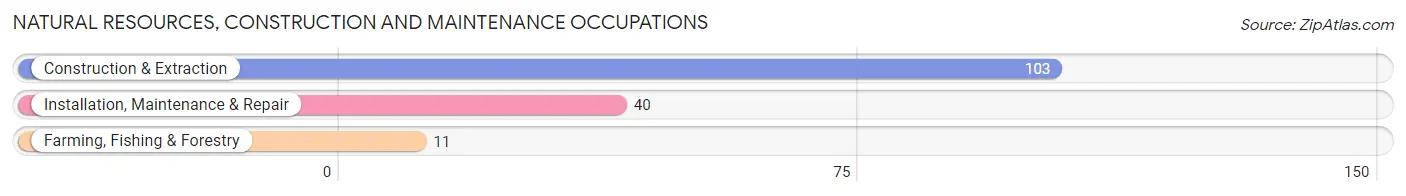
Natural Resources, Construction and Maintenance Occupations
The most common Natural Resources, Construction and Maintenance occupations in Council Grove are Construction & Extraction (103 | 9.2%), Installation, Maintenance & Repair (40 | 3.6%), and Farming, Fishing & Forestry (11 | 1.0%).
Natural Resources, Construction and Maintenance Occupations by Sex
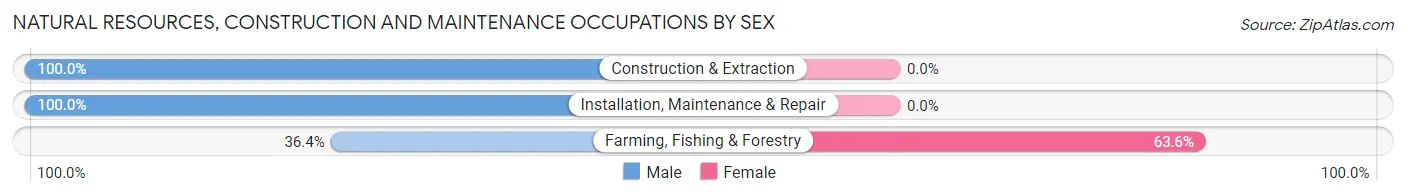
| Occupation | Male | Female |
| Farming, Fishing & Forestry | 4 (36.4%) | 7 (63.6%) |
| Construction & Extraction | 103 (100.0%) | 0 (0.0%) |
| Installation, Maintenance & Repair | 40 (100.0%) | 0 (0.0%) |
| Total (Category) | 147 (95.5%) | 7 (4.5%) |
| Total (Overall) | 581 (51.7%) | 543 (48.3%) |
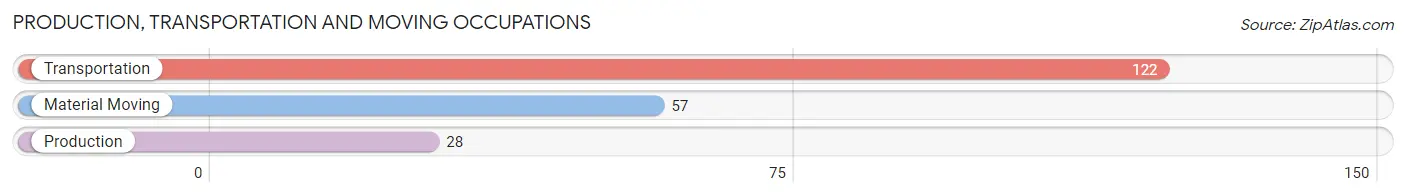
Production, Transportation and Moving Occupations
The most common Production, Transportation and Moving occupations in Council Grove are Transportation (122 | 10.8%), Material Moving (57 | 5.1%), and Production (28 | 2.5%).
Production, Transportation and Moving Occupations by Sex
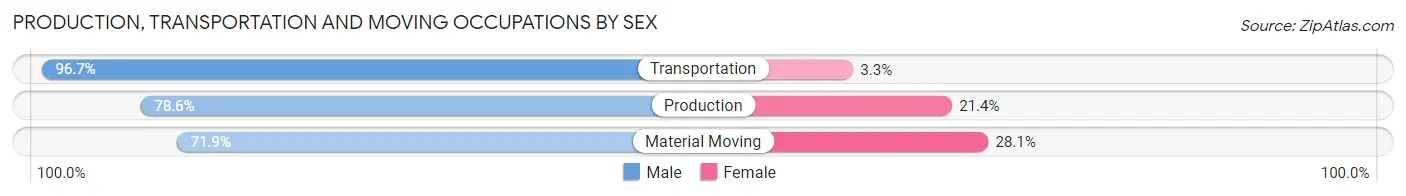
| Occupation | Male | Female |
| Production | 22 (78.6%) | 6 (21.4%) |
| Transportation | 118 (96.7%) | 4 (3.3%) |
| Material Moving | 41 (71.9%) | 16 (28.1%) |
| Total (Category) | 181 (87.4%) | 26 (12.6%) |
| Total (Overall) | 581 (51.7%) | 543 (48.3%) |
Employment Industries by Sex in Council Grove
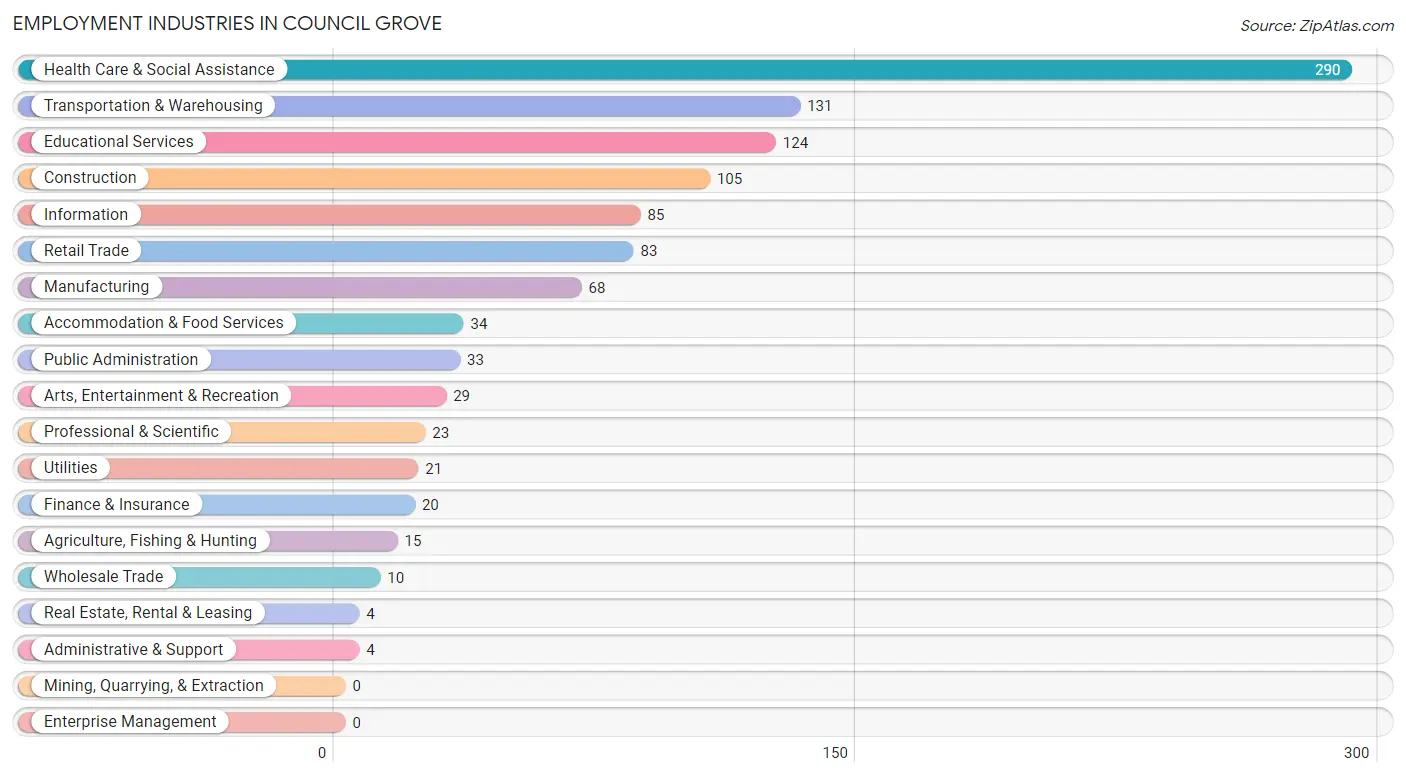
Employment Industries in Council Grove
The major employment industries in Council Grove include Health Care & Social Assistance (290 | 25.8%), Transportation & Warehousing (131 | 11.7%), Educational Services (124 | 11.0%), Construction (105 | 9.3%), and Information (85 | 7.6%).
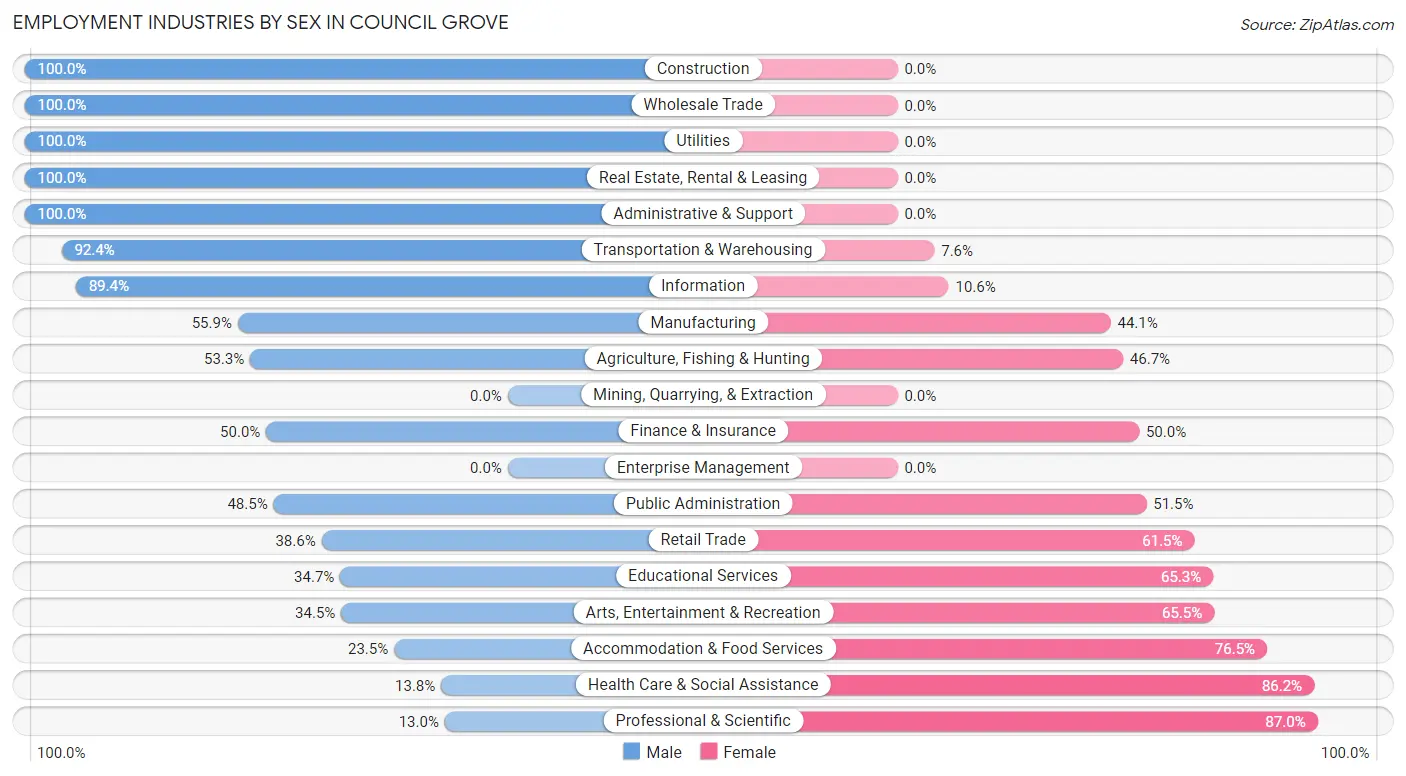
Employment Industries by Sex in Council Grove
The Council Grove industries that see more men than women are Construction (100.0%), Wholesale Trade (100.0%), and Utilities (100.0%), whereas the industries that tend to have a higher number of women are Professional & Scientific (87.0%), Health Care & Social Assistance (86.2%), and Accommodation & Food Services (76.5%).
| Industry | Male | Female |
| Agriculture, Fishing & Hunting | 8 (53.3%) | 7 (46.7%) |
| Mining, Quarrying, & Extraction | 0 (0.0%) | 0 (0.0%) |
| Construction | 105 (100.0%) | 0 (0.0%) |
| Manufacturing | 38 (55.9%) | 30 (44.1%) |
| Wholesale Trade | 10 (100.0%) | 0 (0.0%) |
| Retail Trade | 32 (38.6%) | 51 (61.5%) |
| Transportation & Warehousing | 121 (92.4%) | 10 (7.6%) |
| Utilities | 21 (100.0%) | 0 (0.0%) |
| Information | 76 (89.4%) | 9 (10.6%) |
| Finance & Insurance | 10 (50.0%) | 10 (50.0%) |
| Real Estate, Rental & Leasing | 4 (100.0%) | 0 (0.0%) |
| Professional & Scientific | 3 (13.0%) | 20 (87.0%) |
| Enterprise Management | 0 (0.0%) | 0 (0.0%) |
| Administrative & Support | 4 (100.0%) | 0 (0.0%) |
| Educational Services | 43 (34.7%) | 81 (65.3%) |
| Health Care & Social Assistance | 40 (13.8%) | 250 (86.2%) |
| Arts, Entertainment & Recreation | 10 (34.5%) | 19 (65.5%) |
| Accommodation & Food Services | 8 (23.5%) | 26 (76.5%) |
| Public Administration | 16 (48.5%) | 17 (51.5%) |
| Total | 581 (51.7%) | 543 (48.3%) |
Education in Council Grove
School Enrollment in Council Grove
The most common levels of schooling among the 721 students in Council Grove are elementary school (226 | 31.4%), middle school (205 | 28.4%), and high school (128 | 17.7%).
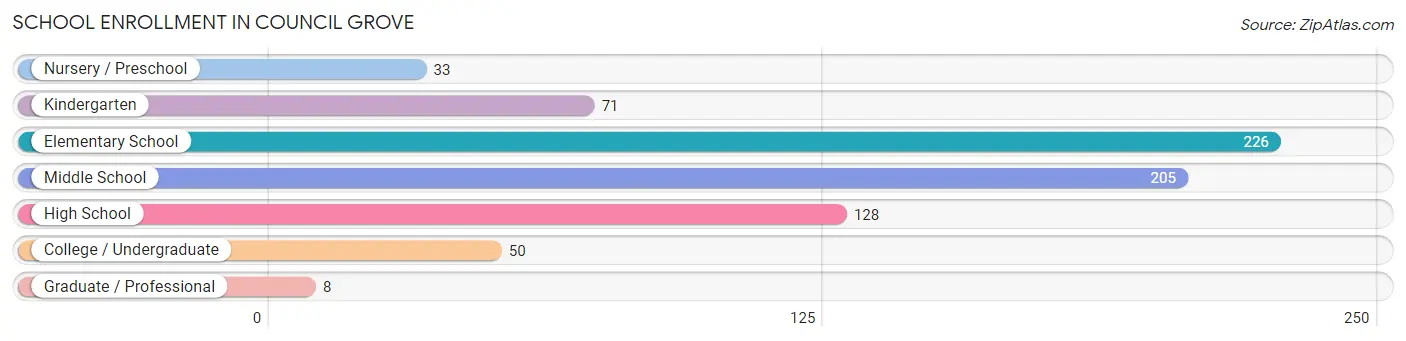
| School Level | # Students | % Students |
| Nursery / Preschool | 33 | 4.6% |
| Kindergarten | 71 | 9.9% |
| Elementary School | 226 | 31.4% |
| Middle School | 205 | 28.4% |
| High School | 128 | 17.7% |
| College / Undergraduate | 50 | 6.9% |
| Graduate / Professional | 8 | 1.1% |
| Total | 721 | 100.0% |
School Enrollment by Age by Funding Source in Council Grove
Out of a total of 721 students who are enrolled in schools in Council Grove, 34 (4.7%) attend a private institution, while the remaining 687 (95.3%) are enrolled in public schools. The age group of 35 years and over has the highest likelihood of being enrolled in private schools, with 4 (50.0% in the age bracket) enrolled. Conversely, the age group of 3 to 4 year olds has the lowest likelihood of being enrolled in a private school, with 28 (100.0% in the age bracket) attending a public institution.
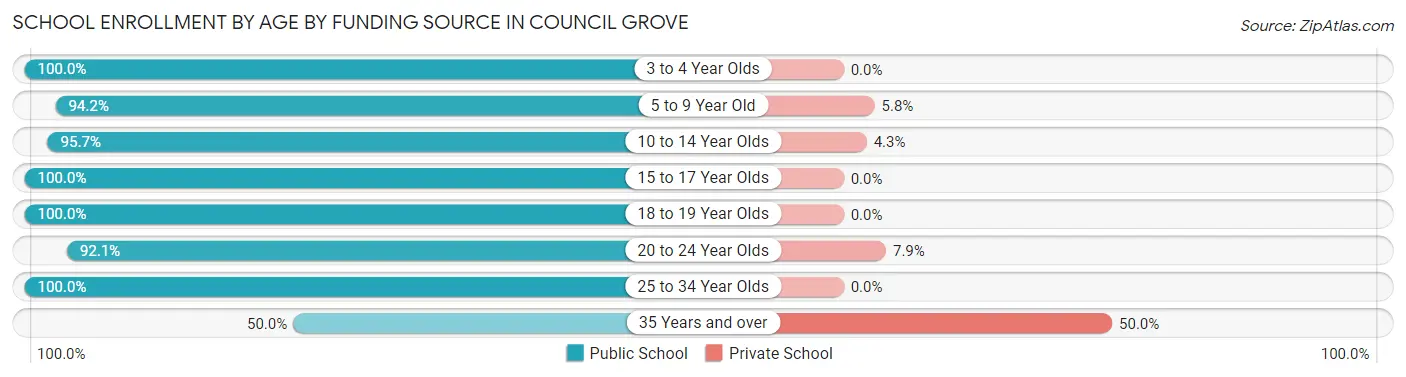
| Age Bracket | Public School | Private School |
| 3 to 4 Year Olds | 28 (100.0%) | 0 (0.0%) |
| 5 to 9 Year Old | 262 (94.2%) | 16 (5.8%) |
| 10 to 14 Year Olds | 245 (95.7%) | 11 (4.3%) |
| 15 to 17 Year Olds | 78 (100.0%) | 0 (0.0%) |
| 18 to 19 Year Olds | 27 (100.0%) | 0 (0.0%) |
| 20 to 24 Year Olds | 35 (92.1%) | 3 (7.9%) |
| 25 to 34 Year Olds | 8 (100.0%) | 0 (0.0%) |
| 35 Years and over | 4 (50.0%) | 4 (50.0%) |
| Total | 687 (95.3%) | 34 (4.7%) |
Educational Attainment by Field of Study in Council Grove
Education (105 | 23.2%), bio, nature & agricultural (74 | 16.4%), literature & languages (58 | 12.8%), business (57 | 12.6%), and physical & health sciences (36 | 8.0%) are the most common fields of study among 452 individuals in Council Grove who have obtained a bachelor's degree or higher.
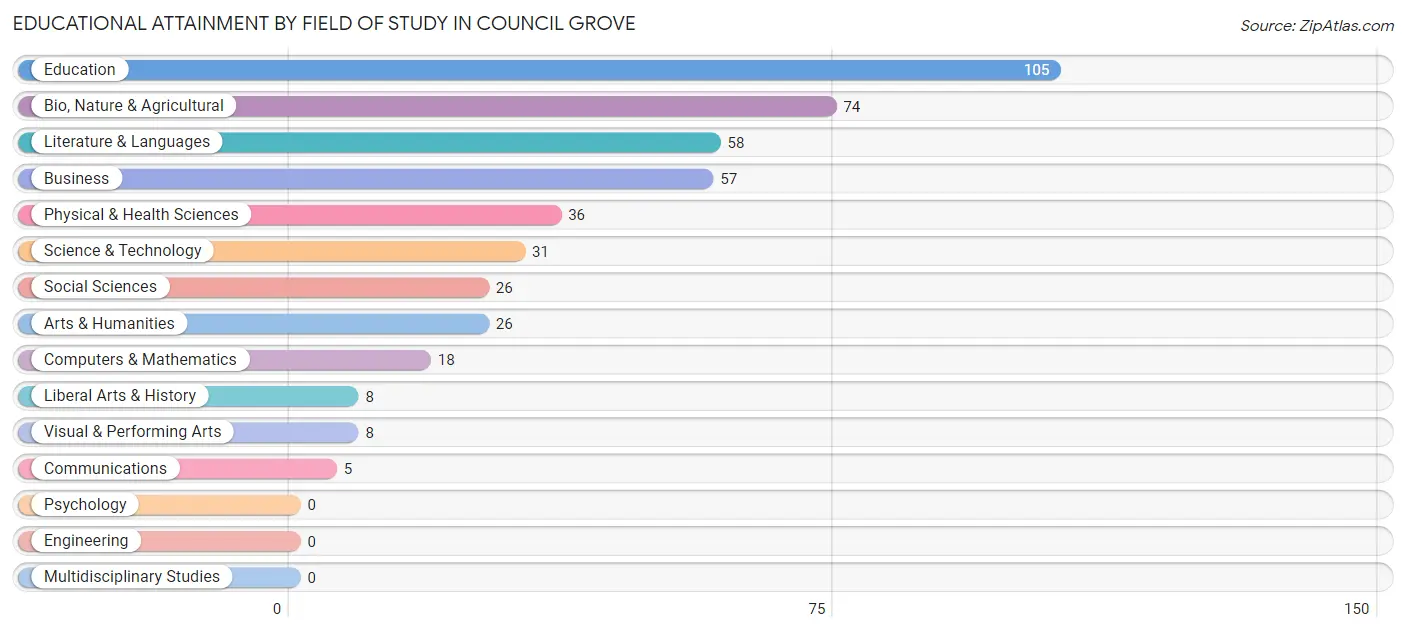
| Field of Study | # Graduates | % Graduates |
| Computers & Mathematics | 18 | 4.0% |
| Bio, Nature & Agricultural | 74 | 16.4% |
| Physical & Health Sciences | 36 | 8.0% |
| Psychology | 0 | 0.0% |
| Social Sciences | 26 | 5.8% |
| Engineering | 0 | 0.0% |
| Multidisciplinary Studies | 0 | 0.0% |
| Science & Technology | 31 | 6.9% |
| Business | 57 | 12.6% |
| Education | 105 | 23.2% |
| Literature & Languages | 58 | 12.8% |
| Liberal Arts & History | 8 | 1.8% |
| Visual & Performing Arts | 8 | 1.8% |
| Communications | 5 | 1.1% |
| Arts & Humanities | 26 | 5.8% |
| Total | 452 | 100.0% |
Transportation & Commute in Council Grove
Vehicle Availability by Sex in Council Grove
The most prevalent vehicle ownership categories in Council Grove are males with 2 vehicles (277, accounting for 48.9%) and females with 2 vehicles (285, making up 52.2%).
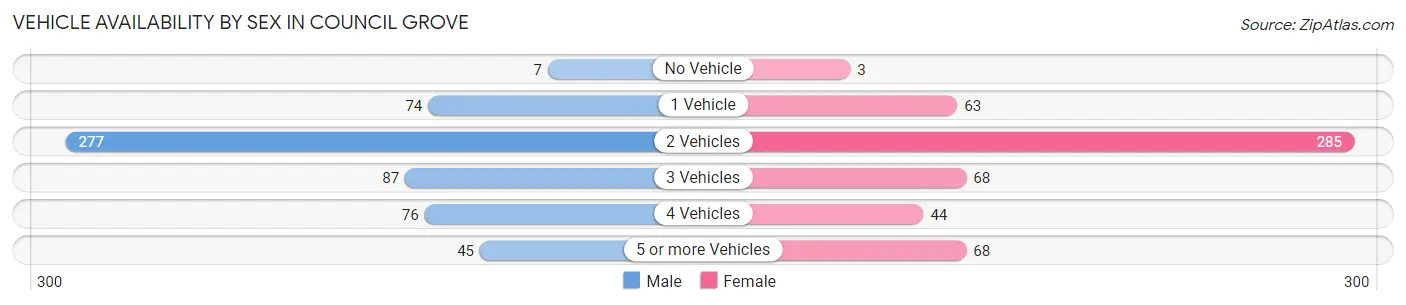
| Vehicles Available | Male | Female |
| No Vehicle | 7 (1.2%) | 3 (0.6%) |
| 1 Vehicle | 74 (13.1%) | 63 (11.9%) |
| 2 Vehicles | 277 (48.9%) | 285 (53.7%) |
| 3 Vehicles | 87 (15.4%) | 68 (12.8%) |
| 4 Vehicles | 76 (13.4%) | 44 (8.3%) |
| 5 or more Vehicles | 45 (8.0%) | 68 (12.8%) |
| Total | 566 (100.0%) | 531 (100.0%) |
Commute Time in Council Grove
The most frequently occuring commute durations in Council Grove are 5 to 9 minutes (248 commuters, 24.1%), 45 to 59 minutes (243 commuters, 23.6%), and 10 to 14 minutes (204 commuters, 19.8%).
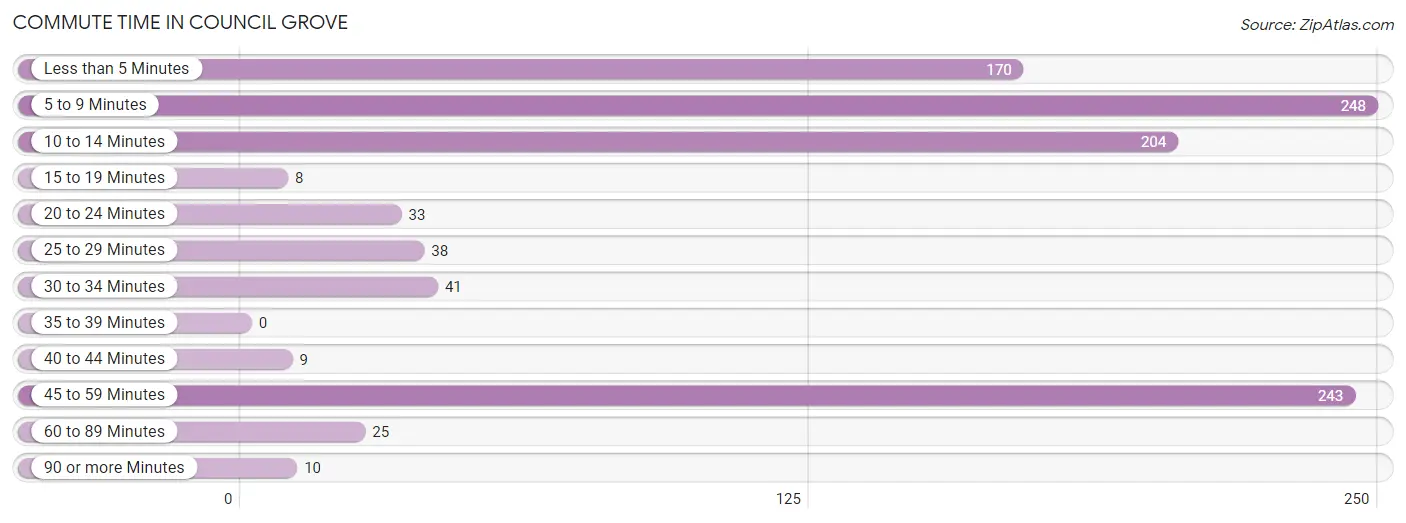
| Commute Time | # Commuters | % Commuters |
| Less than 5 Minutes | 170 | 16.5% |
| 5 to 9 Minutes | 248 | 24.1% |
| 10 to 14 Minutes | 204 | 19.8% |
| 15 to 19 Minutes | 8 | 0.8% |
| 20 to 24 Minutes | 33 | 3.2% |
| 25 to 29 Minutes | 38 | 3.7% |
| 30 to 34 Minutes | 41 | 4.0% |
| 35 to 39 Minutes | 0 | 0.0% |
| 40 to 44 Minutes | 9 | 0.9% |
| 45 to 59 Minutes | 243 | 23.6% |
| 60 to 89 Minutes | 25 | 2.4% |
| 90 or more Minutes | 10 | 1.0% |
Commute Time by Sex in Council Grove
The most common commute times in Council Grove are 45 to 59 minutes (138 commuters, 24.6%) for males and 5 to 9 minutes (113 commuters, 24.2%) for females.
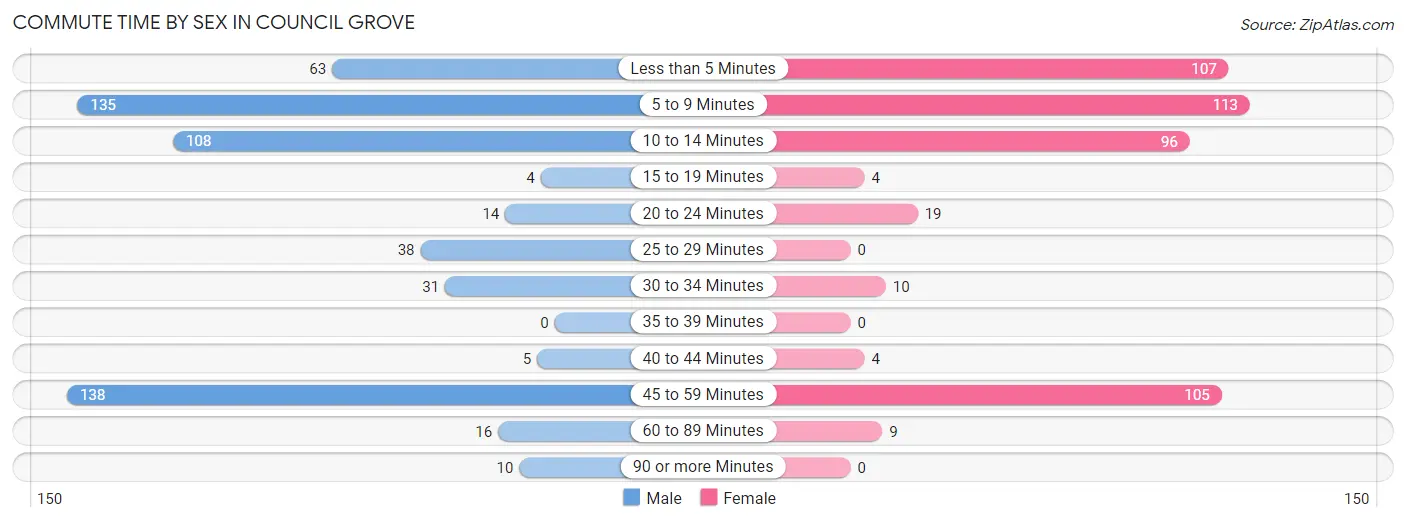
| Commute Time | Male | Female |
| Less than 5 Minutes | 63 (11.2%) | 107 (22.9%) |
| 5 to 9 Minutes | 135 (24.0%) | 113 (24.2%) |
| 10 to 14 Minutes | 108 (19.2%) | 96 (20.6%) |
| 15 to 19 Minutes | 4 (0.7%) | 4 (0.9%) |
| 20 to 24 Minutes | 14 (2.5%) | 19 (4.1%) |
| 25 to 29 Minutes | 38 (6.8%) | 0 (0.0%) |
| 30 to 34 Minutes | 31 (5.5%) | 10 (2.1%) |
| 35 to 39 Minutes | 0 (0.0%) | 0 (0.0%) |
| 40 to 44 Minutes | 5 (0.9%) | 4 (0.9%) |
| 45 to 59 Minutes | 138 (24.6%) | 105 (22.5%) |
| 60 to 89 Minutes | 16 (2.9%) | 9 (1.9%) |
| 90 or more Minutes | 10 (1.8%) | 0 (0.0%) |
Time of Departure to Work by Sex in Council Grove
The most frequent times of departure to work in Council Grove are 6:00 AM to 6:29 AM (167, 29.7%) for males and 7:30 AM to 7:59 AM (119, 25.5%) for females.
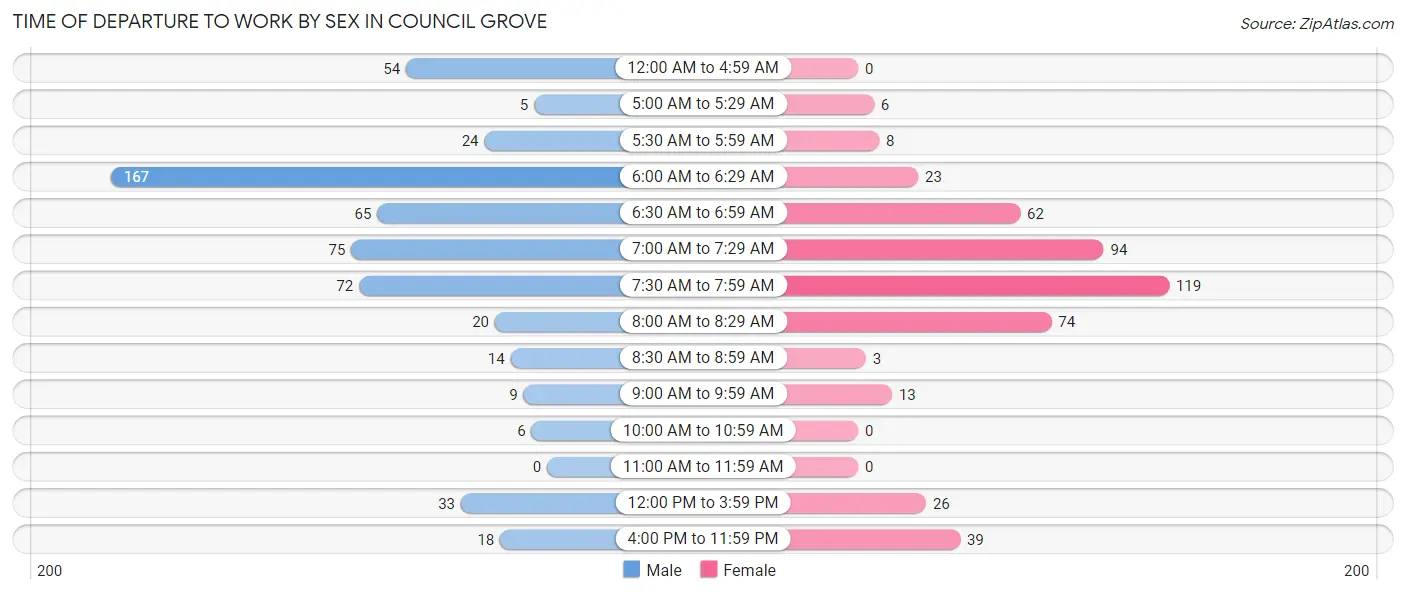
| Time of Departure | Male | Female |
| 12:00 AM to 4:59 AM | 54 (9.6%) | 0 (0.0%) |
| 5:00 AM to 5:29 AM | 5 (0.9%) | 6 (1.3%) |
| 5:30 AM to 5:59 AM | 24 (4.3%) | 8 (1.7%) |
| 6:00 AM to 6:29 AM | 167 (29.7%) | 23 (4.9%) |
| 6:30 AM to 6:59 AM | 65 (11.6%) | 62 (13.3%) |
| 7:00 AM to 7:29 AM | 75 (13.4%) | 94 (20.1%) |
| 7:30 AM to 7:59 AM | 72 (12.8%) | 119 (25.5%) |
| 8:00 AM to 8:29 AM | 20 (3.6%) | 74 (15.9%) |
| 8:30 AM to 8:59 AM | 14 (2.5%) | 3 (0.6%) |
| 9:00 AM to 9:59 AM | 9 (1.6%) | 13 (2.8%) |
| 10:00 AM to 10:59 AM | 6 (1.1%) | 0 (0.0%) |
| 11:00 AM to 11:59 AM | 0 (0.0%) | 0 (0.0%) |
| 12:00 PM to 3:59 PM | 33 (5.9%) | 26 (5.6%) |
| 4:00 PM to 11:59 PM | 18 (3.2%) | 39 (8.4%) |
| Total | 562 (100.0%) | 467 (100.0%) |
Housing Occupancy in Council Grove
Occupancy by Ownership in Council Grove
Of the total 915 dwellings in Council Grove, owner-occupied units account for 645 (70.5%), while renter-occupied units make up 270 (29.5%).
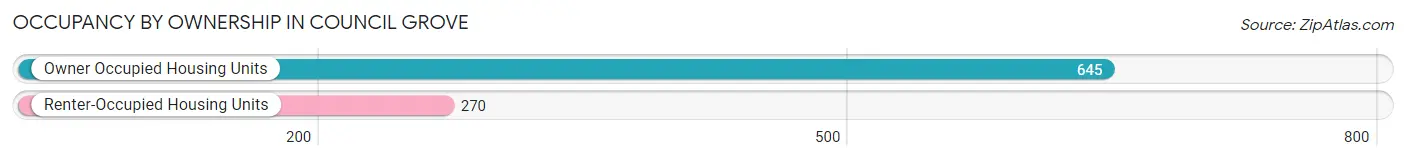
| Occupancy | # Housing Units | % Housing Units |
| Owner Occupied Housing Units | 645 | 70.5% |
| Renter-Occupied Housing Units | 270 | 29.5% |
| Total Occupied Housing Units | 915 | 100.0% |
Occupancy by Household Size in Council Grove
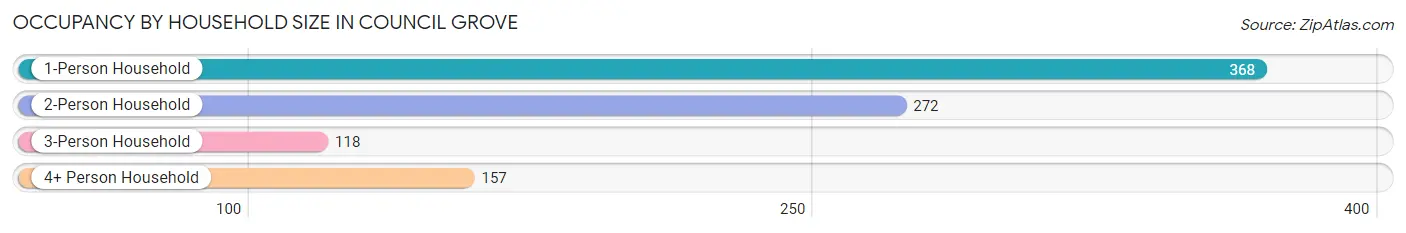
| Household Size | # Housing Units | % Housing Units |
| 1-Person Household | 368 | 40.2% |
| 2-Person Household | 272 | 29.7% |
| 3-Person Household | 118 | 12.9% |
| 4+ Person Household | 157 | 17.2% |
| Total Housing Units | 915 | 100.0% |
Occupancy by Ownership by Household Size in Council Grove
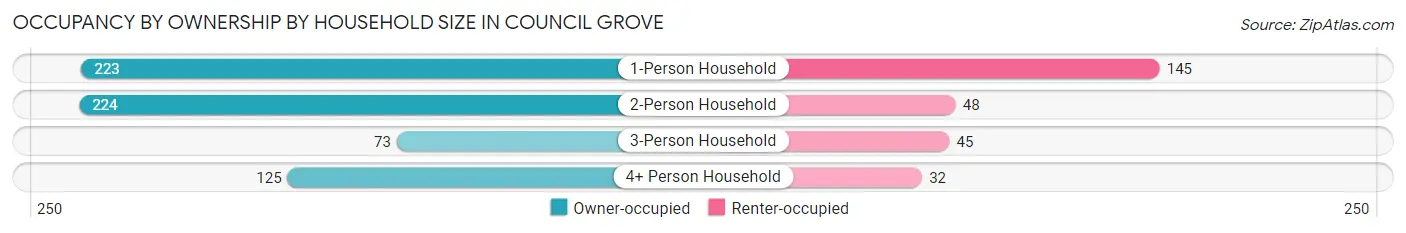
| Household Size | Owner-occupied | Renter-occupied |
| 1-Person Household | 223 (60.6%) | 145 (39.4%) |
| 2-Person Household | 224 (82.4%) | 48 (17.6%) |
| 3-Person Household | 73 (61.9%) | 45 (38.1%) |
| 4+ Person Household | 125 (79.6%) | 32 (20.4%) |
| Total Housing Units | 645 (70.5%) | 270 (29.5%) |
Occupancy by Educational Attainment in Council Grove
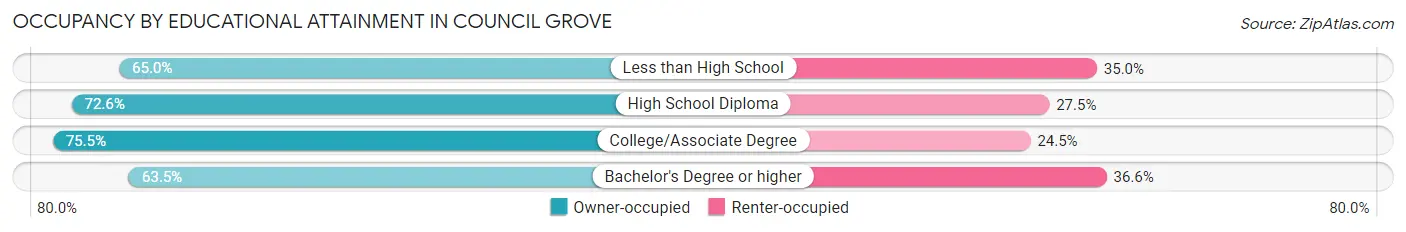
| Household Size | Owner-occupied | Renter-occupied |
| Less than High School | 52 (65.0%) | 28 (35.0%) |
| High School Diploma | 185 (72.6%) | 70 (27.5%) |
| College/Associate Degree | 250 (75.5%) | 81 (24.5%) |
| Bachelor's Degree or higher | 158 (63.4%) | 91 (36.5%) |
Occupancy by Age of Householder in Council Grove
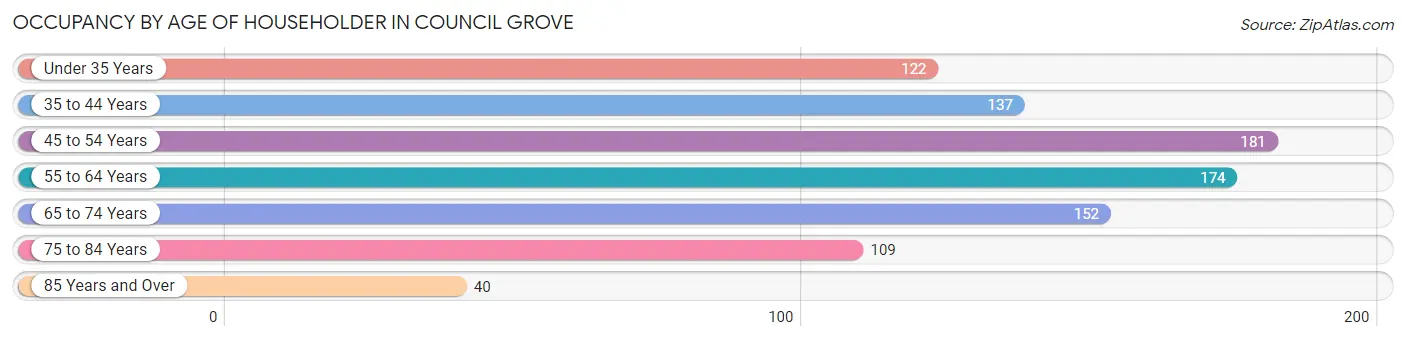
| Age Bracket | # Households | % Households |
| Under 35 Years | 122 | 13.3% |
| 35 to 44 Years | 137 | 15.0% |
| 45 to 54 Years | 181 | 19.8% |
| 55 to 64 Years | 174 | 19.0% |
| 65 to 74 Years | 152 | 16.6% |
| 75 to 84 Years | 109 | 11.9% |
| 85 Years and Over | 40 | 4.4% |
| Total | 915 | 100.0% |
Housing Finances in Council Grove
Median Income by Occupancy in Council Grove
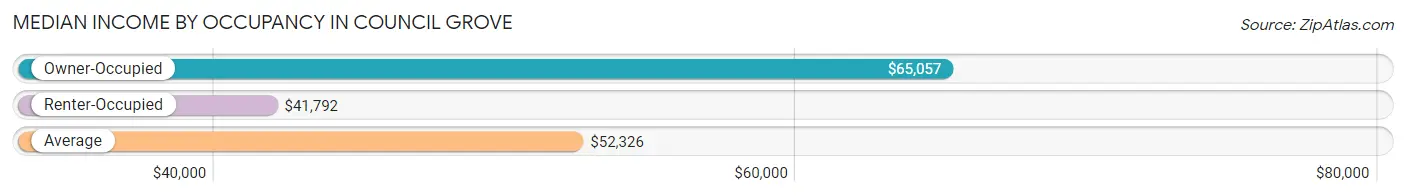
| Occupancy Type | # Households | Median Income |
| Owner-Occupied | 645 (70.5%) | $65,057 |
| Renter-Occupied | 270 (29.5%) | $41,792 |
| Average | 915 (100.0%) | $52,326 |
Occupancy by Householder Income Bracket in Council Grove
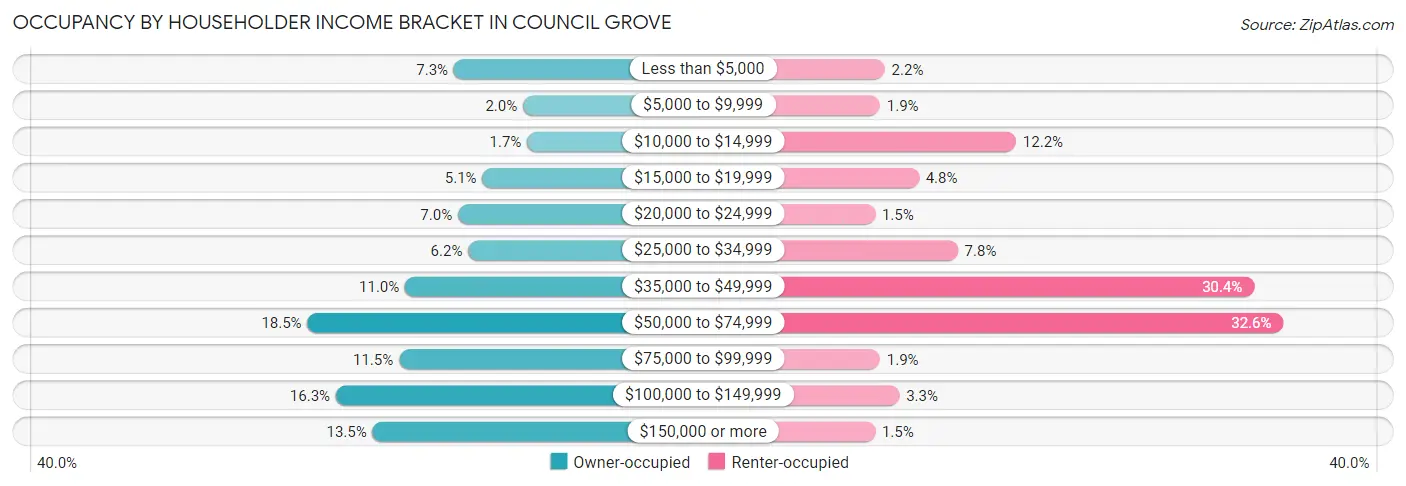
| Income Bracket | Owner-occupied | Renter-occupied |
| Less than $5,000 | 47 (7.3%) | 6 (2.2%) |
| $5,000 to $9,999 | 13 (2.0%) | 5 (1.8%) |
| $10,000 to $14,999 | 11 (1.7%) | 33 (12.2%) |
| $15,000 to $19,999 | 33 (5.1%) | 13 (4.8%) |
| $20,000 to $24,999 | 45 (7.0%) | 4 (1.5%) |
| $25,000 to $34,999 | 40 (6.2%) | 21 (7.8%) |
| $35,000 to $49,999 | 71 (11.0%) | 82 (30.4%) |
| $50,000 to $74,999 | 119 (18.4%) | 88 (32.6%) |
| $75,000 to $99,999 | 74 (11.5%) | 5 (1.8%) |
| $100,000 to $149,999 | 105 (16.3%) | 9 (3.3%) |
| $150,000 or more | 87 (13.5%) | 4 (1.5%) |
| Total | 645 (100.0%) | 270 (100.0%) |
Monthly Housing Cost Tiers in Council Grove
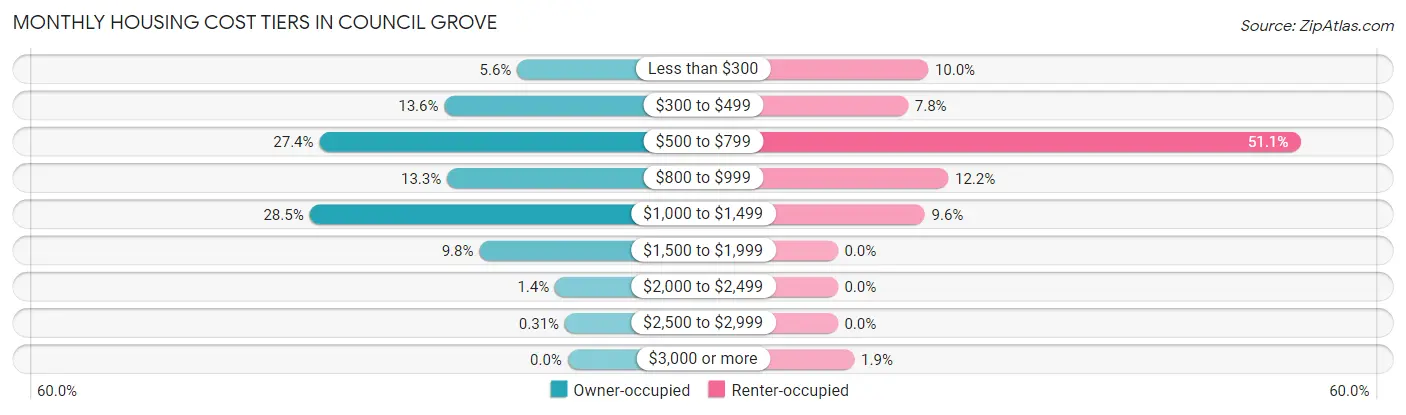
| Monthly Cost | Owner-occupied | Renter-occupied |
| Less than $300 | 36 (5.6%) | 27 (10.0%) |
| $300 to $499 | 88 (13.6%) | 21 (7.8%) |
| $500 to $799 | 177 (27.4%) | 138 (51.1%) |
| $800 to $999 | 86 (13.3%) | 33 (12.2%) |
| $1,000 to $1,499 | 184 (28.5%) | 26 (9.6%) |
| $1,500 to $1,999 | 63 (9.8%) | 0 (0.0%) |
| $2,000 to $2,499 | 9 (1.4%) | 0 (0.0%) |
| $2,500 to $2,999 | 2 (0.3%) | 0 (0.0%) |
| $3,000 or more | 0 (0.0%) | 5 (1.8%) |
| Total | 645 (100.0%) | 270 (100.0%) |
Physical Housing Characteristics in Council Grove
Housing Structures in Council Grove
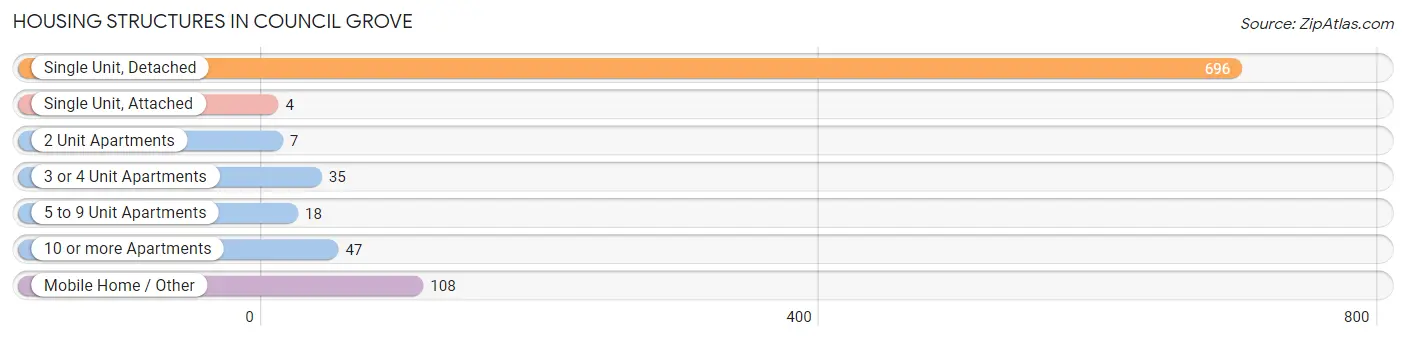
| Structure Type | # Housing Units | % Housing Units |
| Single Unit, Detached | 696 | 76.1% |
| Single Unit, Attached | 4 | 0.4% |
| 2 Unit Apartments | 7 | 0.8% |
| 3 or 4 Unit Apartments | 35 | 3.8% |
| 5 to 9 Unit Apartments | 18 | 2.0% |
| 10 or more Apartments | 47 | 5.1% |
| Mobile Home / Other | 108 | 11.8% |
| Total | 915 | 100.0% |
Housing Structures by Occupancy in Council Grove
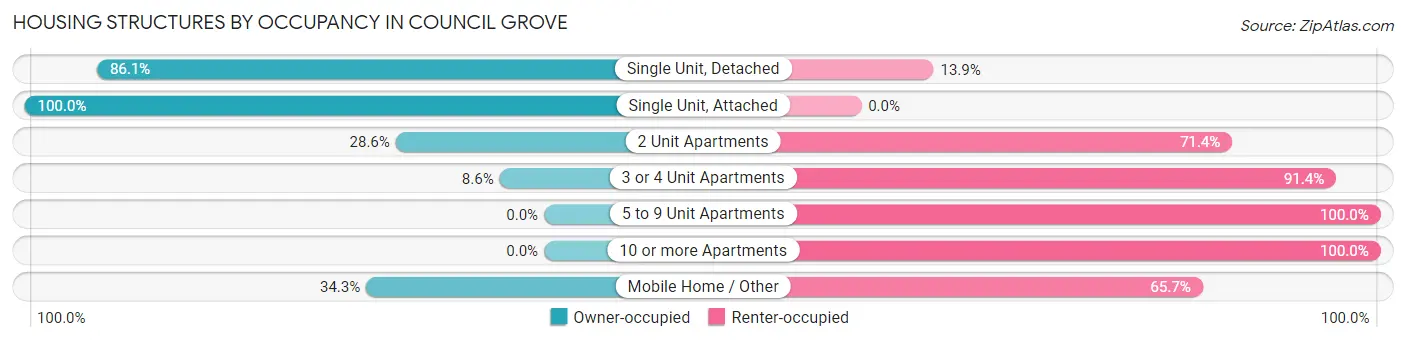
| Structure Type | Owner-occupied | Renter-occupied |
| Single Unit, Detached | 599 (86.1%) | 97 (13.9%) |
| Single Unit, Attached | 4 (100.0%) | 0 (0.0%) |
| 2 Unit Apartments | 2 (28.6%) | 5 (71.4%) |
| 3 or 4 Unit Apartments | 3 (8.6%) | 32 (91.4%) |
| 5 to 9 Unit Apartments | 0 (0.0%) | 18 (100.0%) |
| 10 or more Apartments | 0 (0.0%) | 47 (100.0%) |
| Mobile Home / Other | 37 (34.3%) | 71 (65.7%) |
| Total | 645 (70.5%) | 270 (29.5%) |
Housing Structures by Number of Rooms in Council Grove
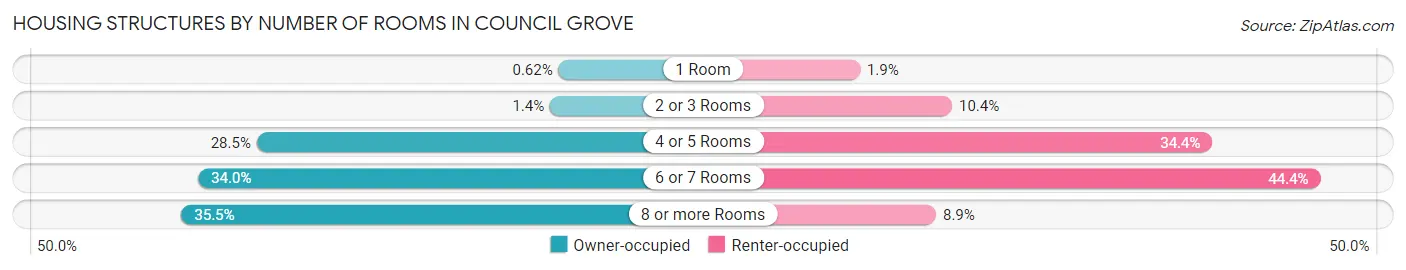
| Number of Rooms | Owner-occupied | Renter-occupied |
| 1 Room | 4 (0.6%) | 5 (1.8%) |
| 2 or 3 Rooms | 9 (1.4%) | 28 (10.4%) |
| 4 or 5 Rooms | 184 (28.5%) | 93 (34.4%) |
| 6 or 7 Rooms | 219 (34.0%) | 120 (44.4%) |
| 8 or more Rooms | 229 (35.5%) | 24 (8.9%) |
| Total | 645 (100.0%) | 270 (100.0%) |
Housing Structure by Heating Type in Council Grove
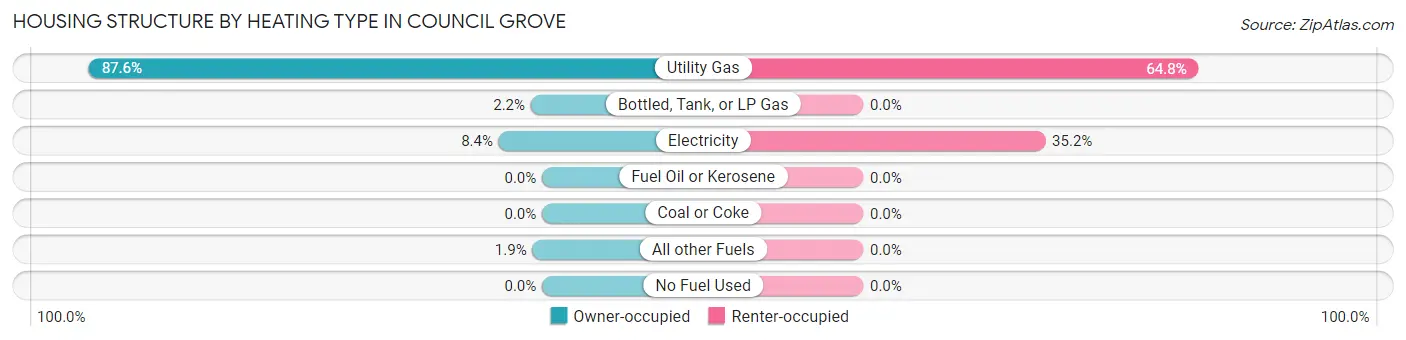
| Heating Type | Owner-occupied | Renter-occupied |
| Utility Gas | 565 (87.6%) | 175 (64.8%) |
| Bottled, Tank, or LP Gas | 14 (2.2%) | 0 (0.0%) |
| Electricity | 54 (8.4%) | 95 (35.2%) |
| Fuel Oil or Kerosene | 0 (0.0%) | 0 (0.0%) |
| Coal or Coke | 0 (0.0%) | 0 (0.0%) |
| All other Fuels | 12 (1.9%) | 0 (0.0%) |
| No Fuel Used | 0 (0.0%) | 0 (0.0%) |
| Total | 645 (100.0%) | 270 (100.0%) |
Household Vehicle Usage in Council Grove
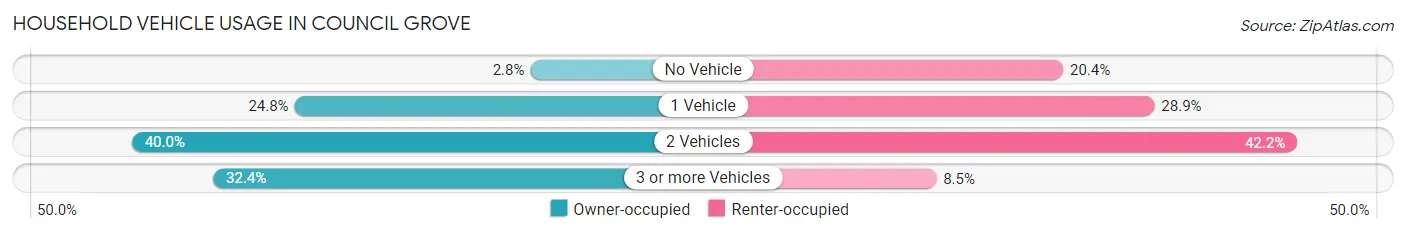
| Vehicles per Household | Owner-occupied | Renter-occupied |
| No Vehicle | 18 (2.8%) | 55 (20.4%) |
| 1 Vehicle | 160 (24.8%) | 78 (28.9%) |
| 2 Vehicles | 258 (40.0%) | 114 (42.2%) |
| 3 or more Vehicles | 209 (32.4%) | 23 (8.5%) |
| Total | 645 (100.0%) | 270 (100.0%) |
Real Estate & Mortgages in Council Grove
Real Estate and Mortgage Overview in Council Grove
| Characteristic | Without Mortgage | With Mortgage |
| Housing Units | 273 | 372 |
| Median Property Value | $102,700 | $132,100 |
| Median Household Income | $42,292 | $73 |
| Monthly Housing Costs | $536 | $0 |
| Real Estate Taxes | $2,118 | $11 |
Property Value by Mortgage Status in Council Grove
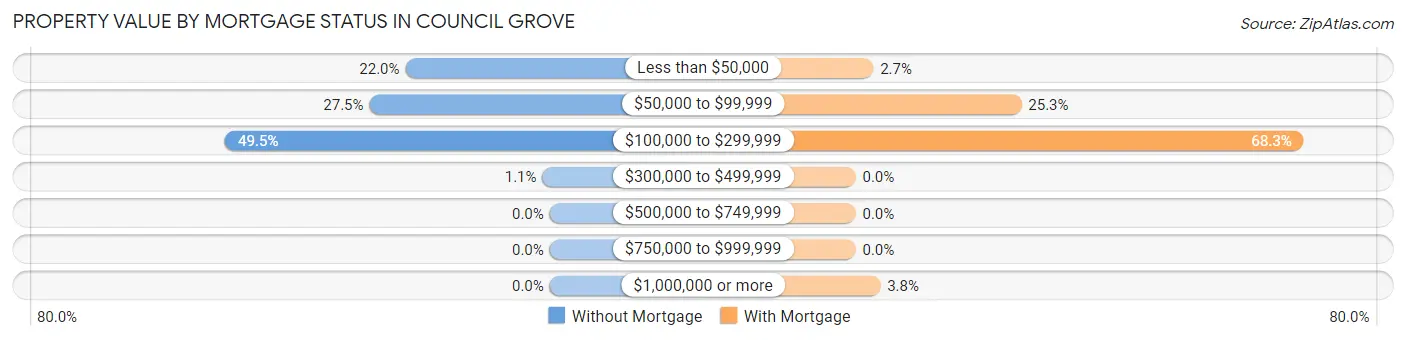
| Property Value | Without Mortgage | With Mortgage |
| Less than $50,000 | 60 (22.0%) | 10 (2.7%) |
| $50,000 to $99,999 | 75 (27.5%) | 94 (25.3%) |
| $100,000 to $299,999 | 135 (49.4%) | 254 (68.3%) |
| $300,000 to $499,999 | 3 (1.1%) | 0 (0.0%) |
| $500,000 to $749,999 | 0 (0.0%) | 0 (0.0%) |
| $750,000 to $999,999 | 0 (0.0%) | 0 (0.0%) |
| $1,000,000 or more | 0 (0.0%) | 14 (3.8%) |
| Total | 273 (100.0%) | 372 (100.0%) |
Household Income by Mortgage Status in Council Grove
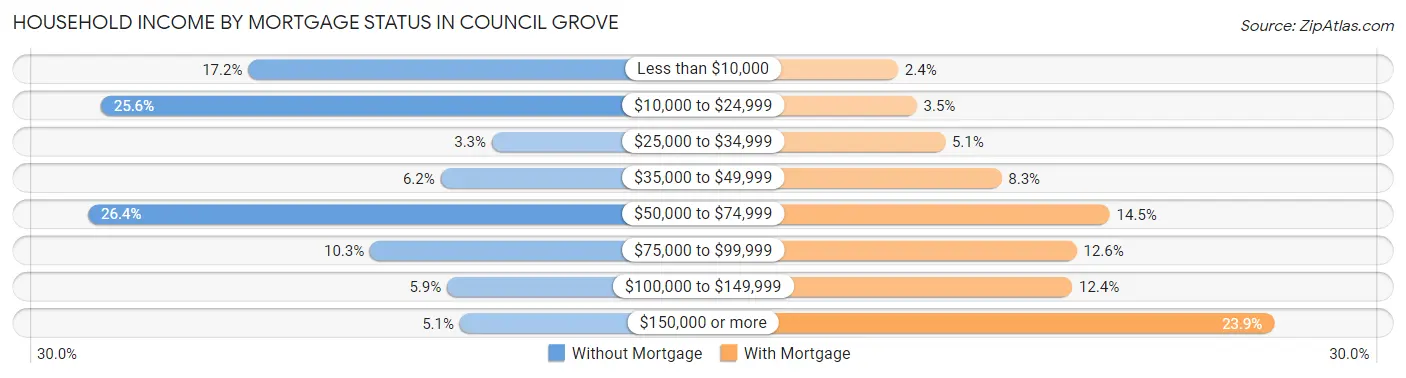
| Household Income | Without Mortgage | With Mortgage |
| Less than $10,000 | 47 (17.2%) | 9 (2.4%) |
| $10,000 to $24,999 | 70 (25.6%) | 13 (3.5%) |
| $25,000 to $34,999 | 9 (3.3%) | 19 (5.1%) |
| $35,000 to $49,999 | 17 (6.2%) | 31 (8.3%) |
| $50,000 to $74,999 | 72 (26.4%) | 54 (14.5%) |
| $75,000 to $99,999 | 28 (10.3%) | 47 (12.6%) |
| $100,000 to $149,999 | 16 (5.9%) | 46 (12.4%) |
| $150,000 or more | 14 (5.1%) | 89 (23.9%) |
| Total | 273 (100.0%) | 372 (100.0%) |
Property Value to Household Income Ratio in Council Grove
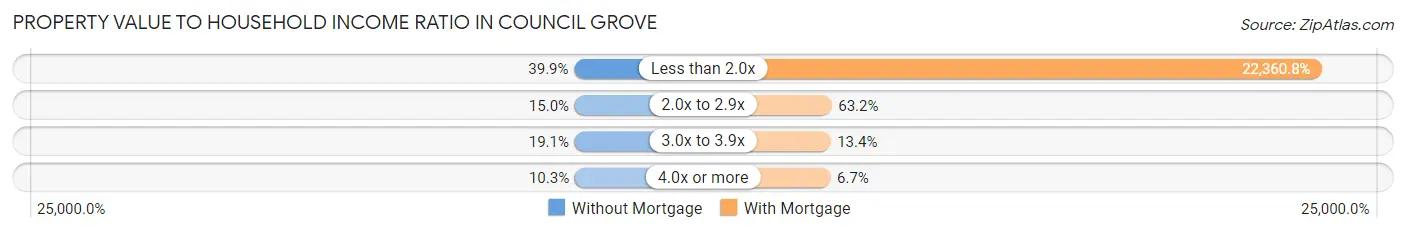
| Value-to-Income Ratio | Without Mortgage | With Mortgage |
| Less than 2.0x | 109 (39.9%) | 83,182 (22,360.7%) |
| 2.0x to 2.9x | 41 (15.0%) | 235 (63.2%) |
| 3.0x to 3.9x | 52 (19.1%) | 50 (13.4%) |
| 4.0x or more | 28 (10.3%) | 25 (6.7%) |
| Total | 273 (100.0%) | 372 (100.0%) |
Real Estate Taxes by Mortgage Status in Council Grove
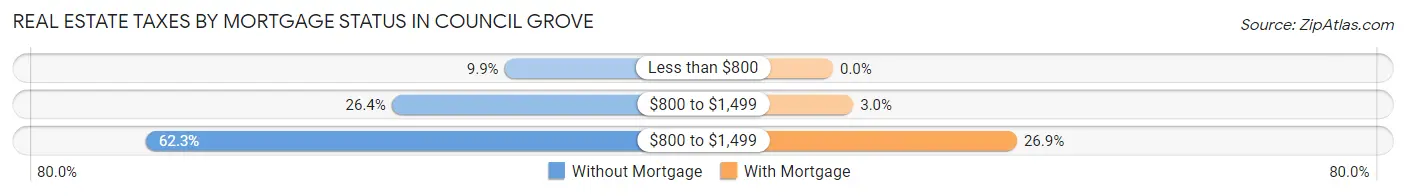
| Property Taxes | Without Mortgage | With Mortgage |
| Less than $800 | 27 (9.9%) | 0 (0.0%) |
| $800 to $1,499 | 72 (26.4%) | 11 (3.0%) |
| $800 to $1,499 | 170 (62.3%) | 100 (26.9%) |
| Total | 273 (100.0%) | 372 (100.0%) |
Health & Disability in Council Grove
Health Insurance Coverage by Age in Council Grove
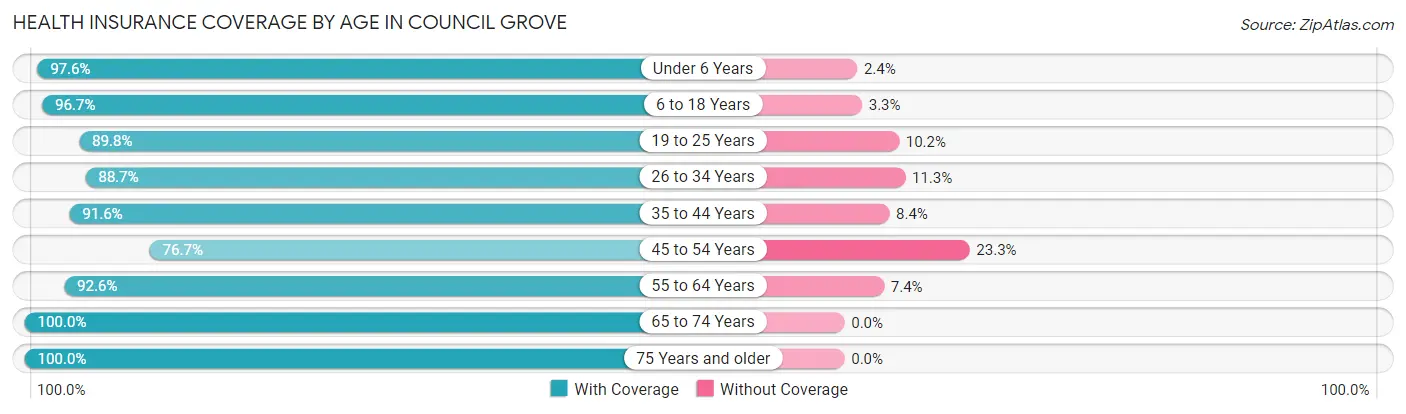
| Age Bracket | With Coverage | Without Coverage |
| Under 6 Years | 124 (97.6%) | 3 (2.4%) |
| 6 to 18 Years | 593 (96.7%) | 20 (3.3%) |
| 19 to 25 Years | 115 (89.8%) | 13 (10.2%) |
| 26 to 34 Years | 141 (88.7%) | 18 (11.3%) |
| 35 to 44 Years | 340 (91.6%) | 31 (8.4%) |
| 45 to 54 Years | 184 (76.7%) | 56 (23.3%) |
| 55 to 64 Years | 289 (92.6%) | 23 (7.4%) |
| 65 to 74 Years | 247 (100.0%) | 0 (0.0%) |
| 75 Years and older | 176 (100.0%) | 0 (0.0%) |
| Total | 2,209 (93.1%) | 164 (6.9%) |
Health Insurance Coverage by Citizenship Status in Council Grove
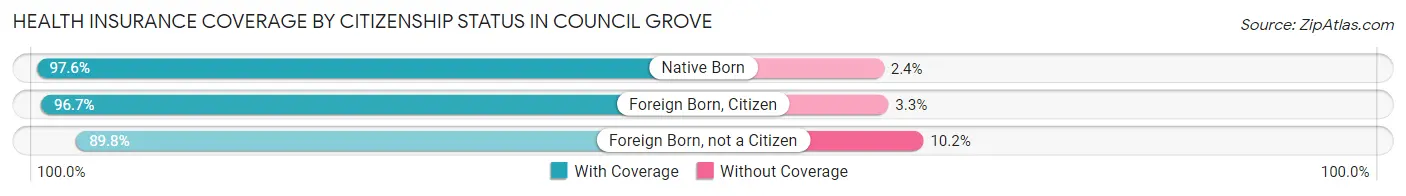
| Citizenship Status | With Coverage | Without Coverage |
| Native Born | 124 (97.6%) | 3 (2.4%) |
| Foreign Born, Citizen | 593 (96.7%) | 20 (3.3%) |
| Foreign Born, not a Citizen | 115 (89.8%) | 13 (10.2%) |
Health Insurance Coverage by Household Income in Council Grove
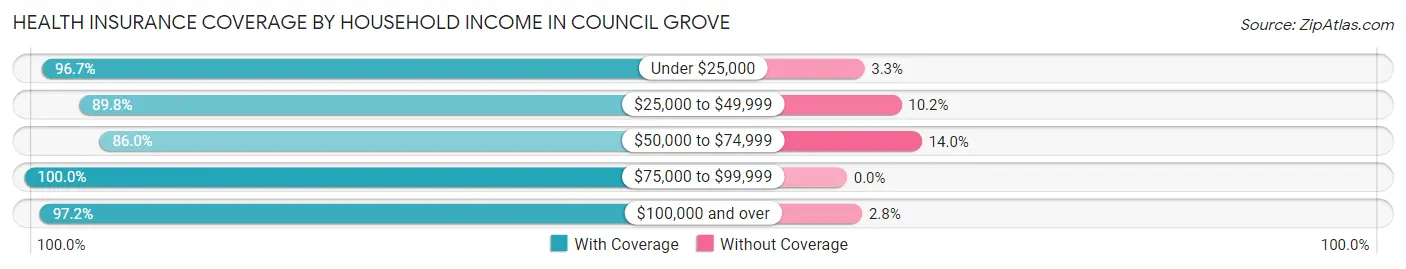
| Household Income | With Coverage | Without Coverage |
| Under $25,000 | 295 (96.7%) | 10 (3.3%) |
| $25,000 to $49,999 | 545 (89.8%) | 62 (10.2%) |
| $50,000 to $74,999 | 435 (86.0%) | 71 (14.0%) |
| $75,000 to $99,999 | 216 (100.0%) | 0 (0.0%) |
| $100,000 and over | 718 (97.2%) | 21 (2.8%) |
Public vs Private Health Insurance Coverage by Age in Council Grove
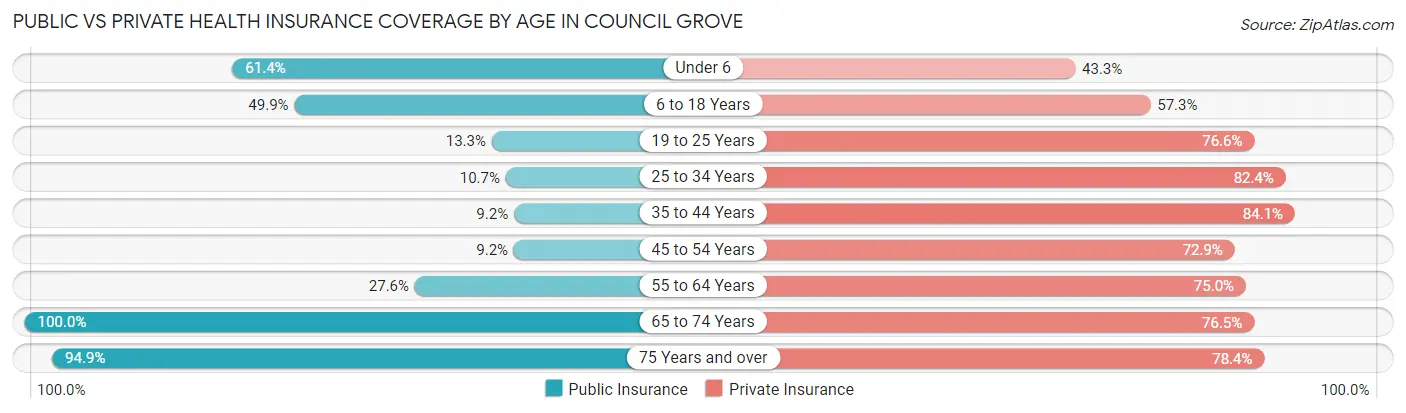
| Age Bracket | Public Insurance | Private Insurance |
| Under 6 | 78 (61.4%) | 55 (43.3%) |
| 6 to 18 Years | 306 (49.9%) | 351 (57.3%) |
| 19 to 25 Years | 17 (13.3%) | 98 (76.6%) |
| 25 to 34 Years | 17 (10.7%) | 131 (82.4%) |
| 35 to 44 Years | 34 (9.2%) | 312 (84.1%) |
| 45 to 54 Years | 22 (9.2%) | 175 (72.9%) |
| 55 to 64 Years | 86 (27.6%) | 234 (75.0%) |
| 65 to 74 Years | 247 (100.0%) | 189 (76.5%) |
| 75 Years and over | 167 (94.9%) | 138 (78.4%) |
| Total | 974 (41.0%) | 1,683 (70.9%) |
Disability Status by Sex by Age in Council Grove
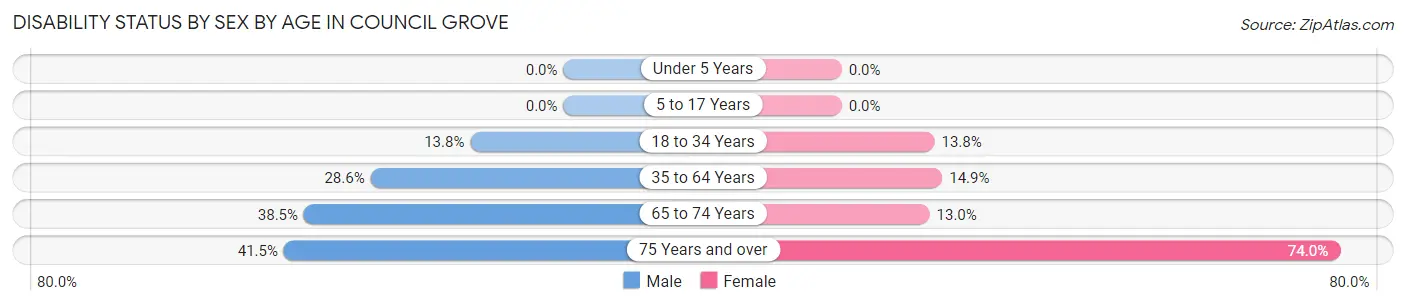
| Age Bracket | Male | Female |
| Under 5 Years | 0 (0.0%) | 0 (0.0%) |
| 5 to 17 Years | 0 (0.0%) | 0 (0.0%) |
| 18 to 34 Years | 26 (13.8%) | 19 (13.8%) |
| 35 to 64 Years | 128 (28.6%) | 71 (14.9%) |
| 65 to 74 Years | 42 (38.5%) | 18 (13.0%) |
| 75 Years and over | 22 (41.5%) | 91 (74.0%) |
Disability Class by Sex by Age in Council Grove
Disability Class: Hearing Difficulty
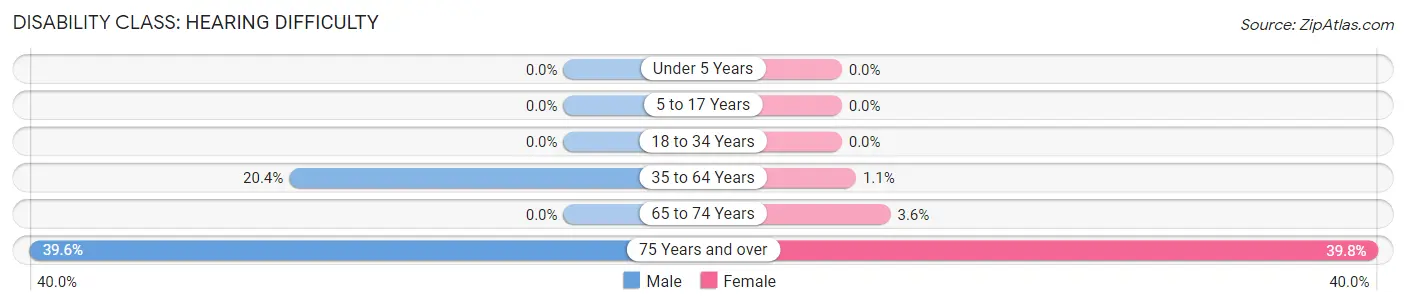
| Age Bracket | Male | Female |
| Under 5 Years | 0 (0.0%) | 0 (0.0%) |
| 5 to 17 Years | 0 (0.0%) | 0 (0.0%) |
| 18 to 34 Years | 0 (0.0%) | 0 (0.0%) |
| 35 to 64 Years | 91 (20.4%) | 5 (1.1%) |
| 65 to 74 Years | 0 (0.0%) | 5 (3.6%) |
| 75 Years and over | 21 (39.6%) | 49 (39.8%) |
Disability Class: Vision Difficulty
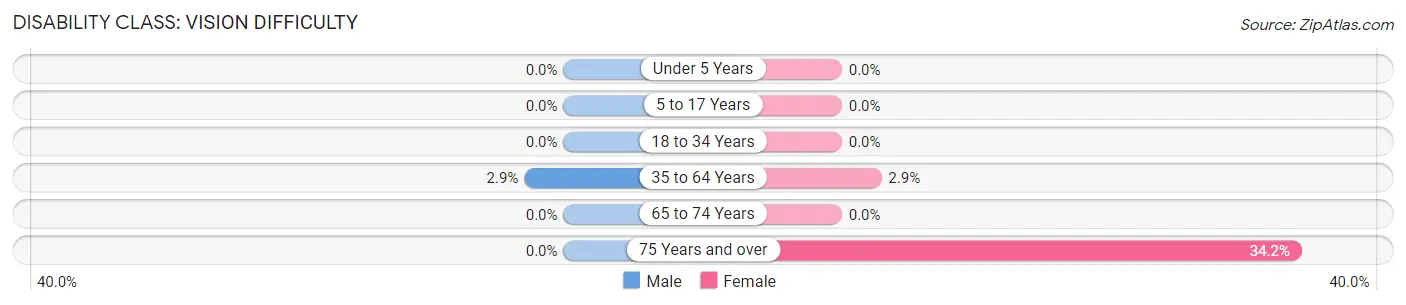
| Age Bracket | Male | Female |
| Under 5 Years | 0 (0.0%) | 0 (0.0%) |
| 5 to 17 Years | 0 (0.0%) | 0 (0.0%) |
| 18 to 34 Years | 0 (0.0%) | 0 (0.0%) |
| 35 to 64 Years | 13 (2.9%) | 14 (2.9%) |
| 65 to 74 Years | 0 (0.0%) | 0 (0.0%) |
| 75 Years and over | 0 (0.0%) | 42 (34.2%) |
Disability Class: Cognitive Difficulty
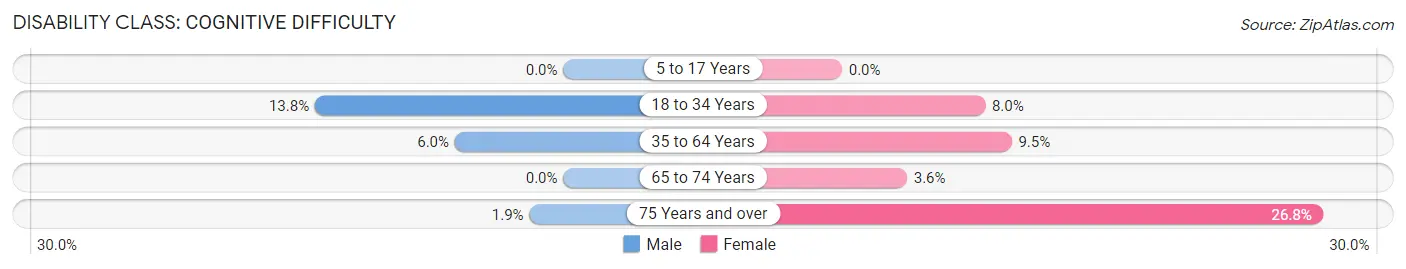
| Age Bracket | Male | Female |
| 5 to 17 Years | 0 (0.0%) | 0 (0.0%) |
| 18 to 34 Years | 26 (13.8%) | 11 (8.0%) |
| 35 to 64 Years | 27 (6.0%) | 45 (9.5%) |
| 65 to 74 Years | 0 (0.0%) | 5 (3.6%) |
| 75 Years and over | 1 (1.9%) | 33 (26.8%) |
Disability Class: Ambulatory Difficulty
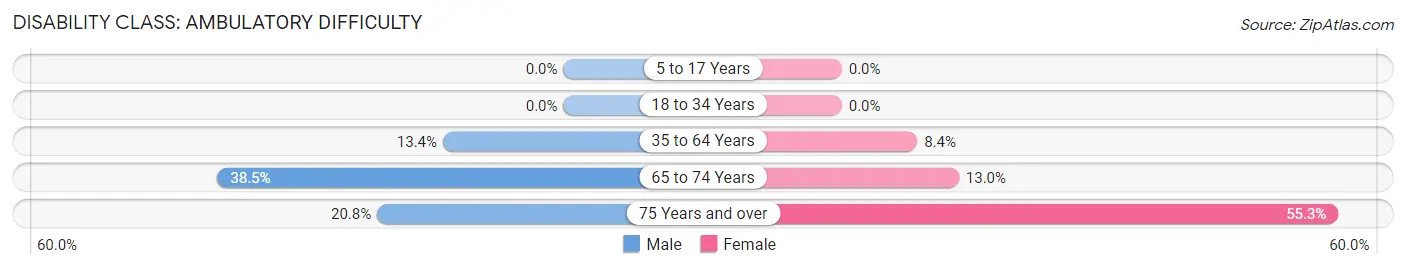
| Age Bracket | Male | Female |
| 5 to 17 Years | 0 (0.0%) | 0 (0.0%) |
| 18 to 34 Years | 0 (0.0%) | 0 (0.0%) |
| 35 to 64 Years | 60 (13.4%) | 40 (8.4%) |
| 65 to 74 Years | 42 (38.5%) | 18 (13.0%) |
| 75 Years and over | 11 (20.7%) | 68 (55.3%) |
Disability Class: Self-Care Difficulty
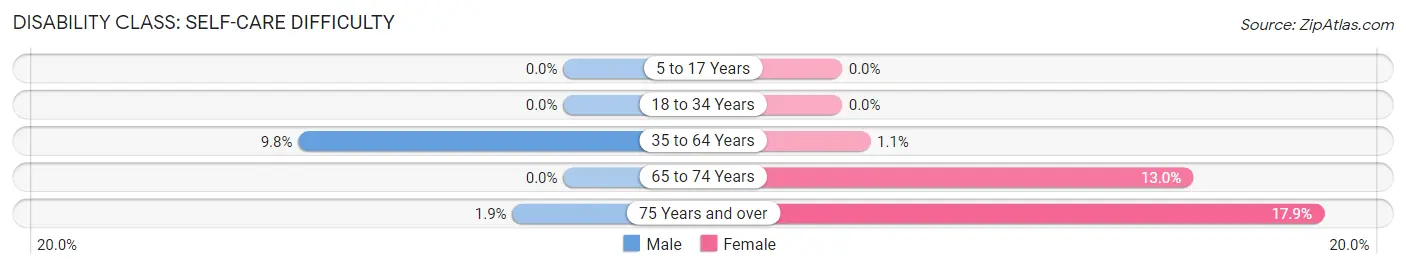
| Age Bracket | Male | Female |
| 5 to 17 Years | 0 (0.0%) | 0 (0.0%) |
| 18 to 34 Years | 0 (0.0%) | 0 (0.0%) |
| 35 to 64 Years | 44 (9.8%) | 5 (1.1%) |
| 65 to 74 Years | 0 (0.0%) | 18 (13.0%) |
| 75 Years and over | 1 (1.9%) | 22 (17.9%) |
Technology Access in Council Grove
Computing Device Access in Council Grove
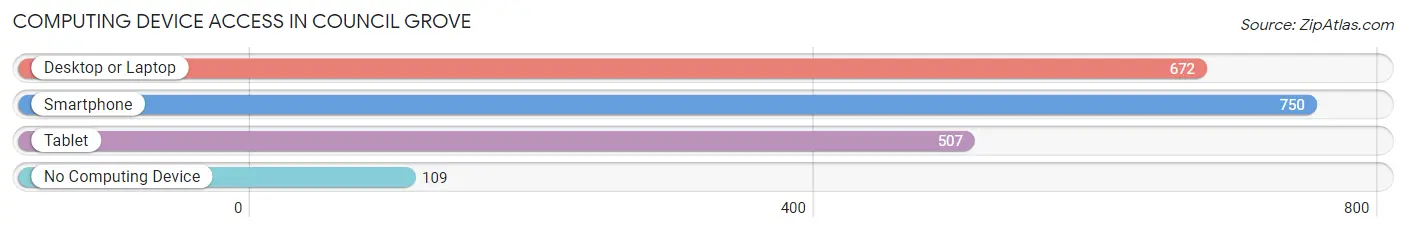
| Device Type | # Households | % Households |
| Desktop or Laptop | 672 | 73.4% |
| Smartphone | 750 | 82.0% |
| Tablet | 507 | 55.4% |
| No Computing Device | 109 | 11.9% |
| Total | 915 | 100.0% |
Internet Access in Council Grove
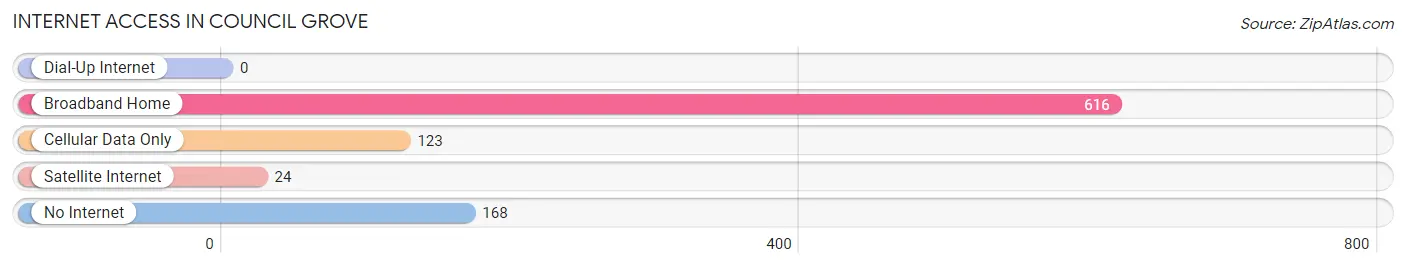
| Internet Type | # Households | % Households |
| Dial-Up Internet | 0 | 0.0% |
| Broadband Home | 616 | 67.3% |
| Cellular Data Only | 123 | 13.4% |
| Satellite Internet | 24 | 2.6% |
| No Internet | 168 | 18.4% |
| Total | 915 | 100.0% |
Council Grove Summary
History
Council Grove, Kansas is a small city located in Morris County, Kansas. It was founded in 1857 and is the county seat of Morris County. The city was named after a grove of trees that served as a council meeting place for the Native Americans and early settlers. The city was a major stop on the Santa Fe Trail, and it was also the site of the last council between the United States government and the Native Americans.
Council Grove was an important stop on the Santa Fe Trail, which was a major trade route between Missouri and New Mexico. The city was also the site of the last council between the United States government and the Native Americans. The council was held in 1825 and resulted in the Treaty of Council Grove, which allowed the United States to build a road through the area.
The city was officially incorporated in 1858 and was the county seat of Morris County. The city was a major stop on the Santa Fe Trail and was also the site of the last council between the United States government and the Native Americans.
The city was an important stop on the Santa Fe Trail and was also the site of the last council between the United States government and the Native Americans. The council was held in 1825 and resulted in the Treaty of Council Grove, which allowed the United States to build a road through the area.
The city was also the site of the first post office in Morris County, which was established in 1858. The city was also the site of the first school in Morris County, which was established in 1859.
The city was also the site of the first newspaper in Morris County, which was established in 1867. The newspaper was called the Council Grove Republican and was published until 1871.
The city was also the site of the first bank in Morris County, which was established in 1871. The bank was called the Council Grove Bank and was in operation until 1876.
The city was also the site of the first telephone exchange in Morris County, which was established in 1883. The exchange was called the Council Grove Telephone Exchange and was in operation until 1891.
The city was also the site of the first electric light plant in Morris County, which was established in 1891. The plant was called the Council Grove Electric Light and Power Company and was in operation until 1901.
Geography
Council Grove is located in the Flint Hills region of Kansas. The city is situated on the Neosho River and is surrounded by rolling hills and prairies. The city is located approximately 50 miles south of Topeka and approximately 70 miles north of Wichita.
The city has a total area of 2.2 square miles, all of which is land. The city has a humid continental climate, with hot summers and cold winters. The average temperature in the summer is around 80 degrees Fahrenheit, and the average temperature in the winter is around 30 degrees Fahrenheit.
Economy
The economy of Council Grove is largely based on agriculture and tourism. The city is home to several farms and ranches, and the surrounding area is known for its cattle and horse ranches. The city is also home to several tourist attractions, including the Santa Fe Trail, the Council Grove Lake, and the Council Grove State Park.
The city is also home to several businesses, including restaurants, retail stores, and service providers. The city is also home to several manufacturing companies, including a furniture manufacturer and a plastics manufacturer.
Demographics
As of the 2010 census, the population of Council Grove was 1,717. The racial makeup of the city was 95.3% White, 0.7% African American, 0.3% Native American, 0.3% Asian, 0.1% Pacific Islander, 1.2% from other races, and 2.3% from two or more races. Hispanic or Latino of any race were 3.2% of the population.
The median income for a household in the city was $37,500, and the median income for a family was $45,000. The per capita income for the city was $19,845. About 11.2% of families and 14.2% of the population were below the poverty line, including 19.2% of those under age 18 and 8.3% of those age 65 or over.
Common Questions
What is Per Capita Income in Council Grove?
Per Capita income in Council Grove is $28,308.
What is the Median Family Income in Council Grove?
Median Family Income in Council Grove is $71,898.
What is the Median Household income in Council Grove?
Median Household Income in Council Grove is $52,326.
What is Income or Wage Gap in Council Grove?
Income or Wage Gap in Council Grove is 9.4%.
Women in Council Grove earn 90.6 cents for every dollar earned by a man.
What is Inequality or Gini Index in Council Grove?
Inequality or Gini Index in Council Grove is 0.45.
What is the Total Population of Council Grove?
Total Population of Council Grove is 2,452.
What is the Total Male Population of Council Grove?
Total Male Population of Council Grove is 1,261.
What is the Total Female Population of Council Grove?
Total Female Population of Council Grove is 1,191.
What is the Ratio of Males per 100 Females in Council Grove?
There are 105.88 Males per 100 Females in Council Grove.
What is the Ratio of Females per 100 Males in Council Grove?
There are 94.45 Females per 100 Males in Council Grove.
What is the Median Population Age in Council Grove?
Median Population Age in Council Grove is 38.5 Years.
What is the Average Family Size in Council Grove
Average Family Size in Council Grove is 3.7 People.
What is the Average Household Size in Council Grove
Average Household Size in Council Grove is 2.6 People.
How Large is the Labor Force in Council Grove?
There are 1,168 People in the Labor Forcein in Council Grove.
What is the Percentage of People in the Labor Force in Council Grove?
64.3% of People are in the Labor Force in Council Grove.
What is the Unemployment Rate in Council Grove?
Unemployment Rate in Council Grove is 3.7%.