Copeland, KS Map & Demographics
Copeland Map
Copeland Overview
$27,921
PER CAPITA INCOME
$76,023
AVG FAMILY INCOME
$43,750
AVG HOUSEHOLD INCOME
0.40
INEQUALITY / GINI INDEX
452
TOTAL POPULATION
245
MALE POPULATION
207
FEMALE POPULATION
118.36
MALES / 100 FEMALES
84.49
FEMALES / 100 MALES
31.5
MEDIAN AGE
3.4
AVG FAMILY SIZE
2.4
AVG HOUSEHOLD SIZE
189
LABOR FORCE [ PEOPLE ]
50.9%
PERCENT IN LABOR FORCE
3.2%
UNEMPLOYMENT RATE
Copeland Zip Codes
Copeland Area Codes
Income in Copeland
Income Overview in Copeland
Per Capita Income in Copeland is $27,921, while median incomes of families and households are $76,023 and $43,750 respectively.
| Characteristic | Number | Measure |
| Per Capita Income | 452 | $27,921 |
| Median Family Income | 104 | $76,023 |
| Mean Family Income | 104 | $86,879 |
| Median Household Income | 189 | $43,750 |
| Mean Household Income | 189 | $65,058 |
| Income Deficit | 104 | $0 |
| Wage / Income Gap (%) | 452 | 0.00% |
| Wage / Income Gap ($) | 452 | 100.00¢ per $1 |
| Gini / Inequality Index | 452 | 0.40 |
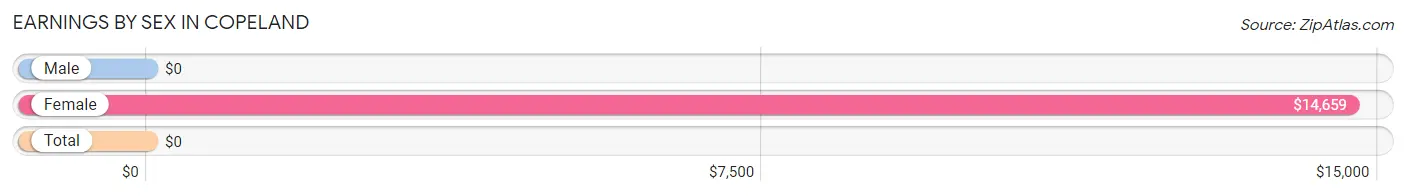
Earnings by Sex in Copeland
| Sex | Number | Average Earnings |
| Male | 184 (74.2%) | $0 |
| Female | 64 (25.8%) | $14,659 |
| Total | 248 (100.0%) | $0 |
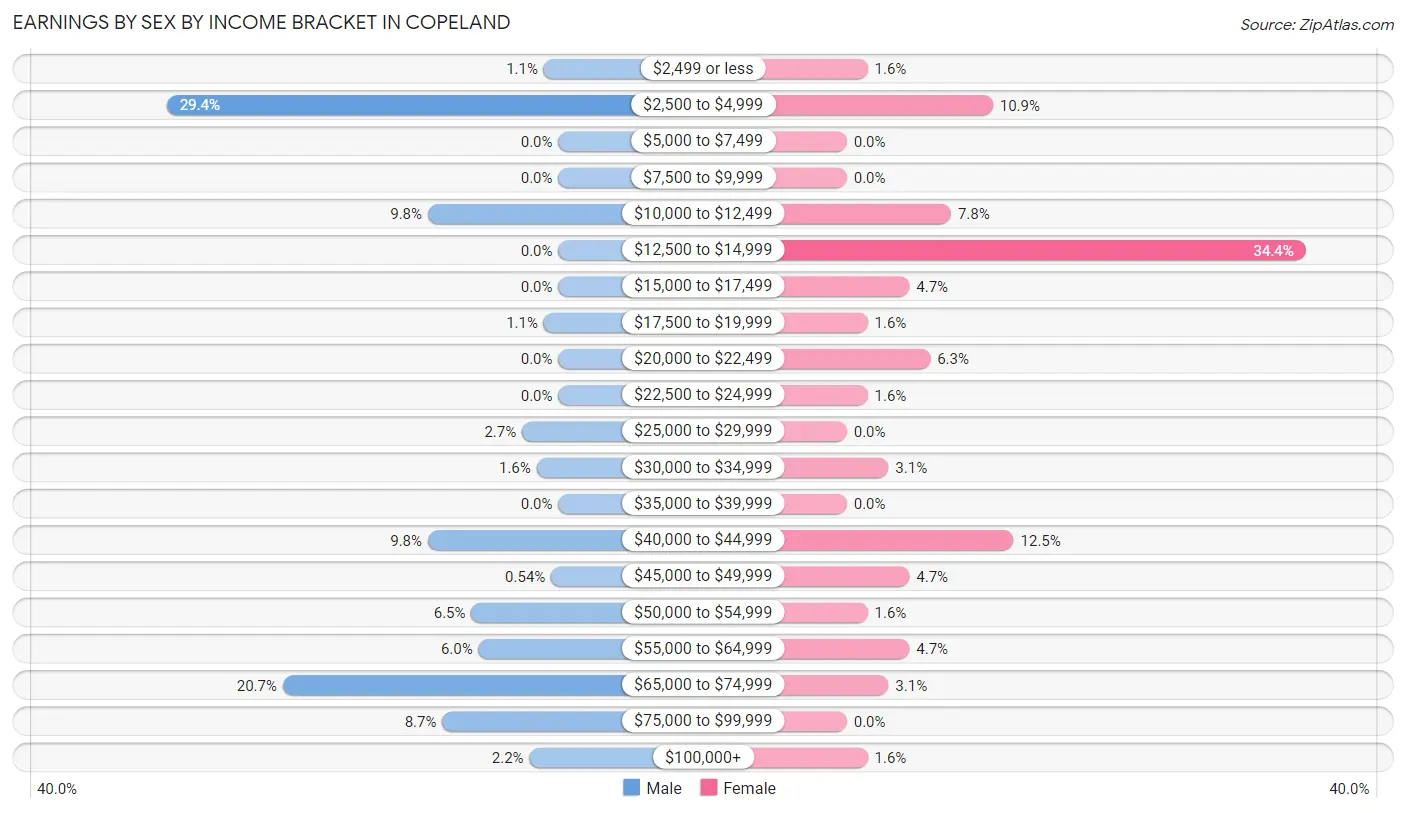
Earnings by Sex by Income Bracket in Copeland
The most common earnings brackets in Copeland are $2,500 to $4,999 for men (54 | 29.3%) and $12,500 to $14,999 for women (22 | 34.4%).
| Income | Male | Female |
| $2,499 or less | 2 (1.1%) | 1 (1.6%) |
| $2,500 to $4,999 | 54 (29.3%) | 7 (10.9%) |
| $5,000 to $7,499 | 0 (0.0%) | 0 (0.0%) |
| $7,500 to $9,999 | 0 (0.0%) | 0 (0.0%) |
| $10,000 to $12,499 | 18 (9.8%) | 5 (7.8%) |
| $12,500 to $14,999 | 0 (0.0%) | 22 (34.4%) |
| $15,000 to $17,499 | 0 (0.0%) | 3 (4.7%) |
| $17,500 to $19,999 | 2 (1.1%) | 1 (1.6%) |
| $20,000 to $22,499 | 0 (0.0%) | 4 (6.2%) |
| $22,500 to $24,999 | 0 (0.0%) | 1 (1.6%) |
| $25,000 to $29,999 | 5 (2.7%) | 0 (0.0%) |
| $30,000 to $34,999 | 3 (1.6%) | 2 (3.1%) |
| $35,000 to $39,999 | 0 (0.0%) | 0 (0.0%) |
| $40,000 to $44,999 | 18 (9.8%) | 8 (12.5%) |
| $45,000 to $49,999 | 1 (0.5%) | 3 (4.7%) |
| $50,000 to $54,999 | 12 (6.5%) | 1 (1.6%) |
| $55,000 to $64,999 | 11 (6.0%) | 3 (4.7%) |
| $65,000 to $74,999 | 38 (20.6%) | 2 (3.1%) |
| $75,000 to $99,999 | 16 (8.7%) | 0 (0.0%) |
| $100,000+ | 4 (2.2%) | 1 (1.6%) |
| Total | 184 (100.0%) | 64 (100.0%) |
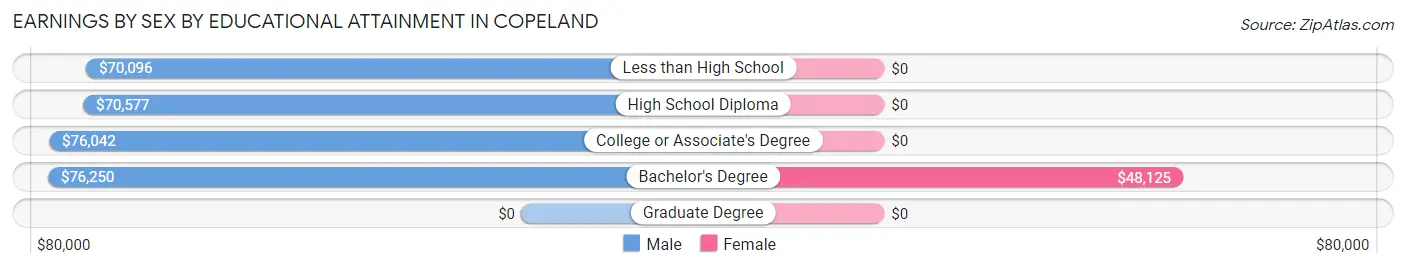
Earnings by Sex by Educational Attainment in Copeland
Average earnings in Copeland are $70,848 for men and $14,489 for women, a difference of 79.5%. Men with an educational attainment of bachelor's degree enjoy the highest average annual earnings of $76,250, while those with less than high school education earn the least with $70,096. Women with an educational attainment of bachelor's degree earn the most with the average annual earnings of $48,125, while those with bachelor's degree education have the smallest earnings of $48,125.
| Educational Attainment | Male Income | Female Income |
| Less than High School | $70,096 | $0 |
| High School Diploma | $70,577 | $0 |
| College or Associate's Degree | $76,042 | $0 |
| Bachelor's Degree | $76,250 | $48,125 |
| Graduate Degree | - | - |
| Total | $70,848 | $14,489 |
Family Income in Copeland
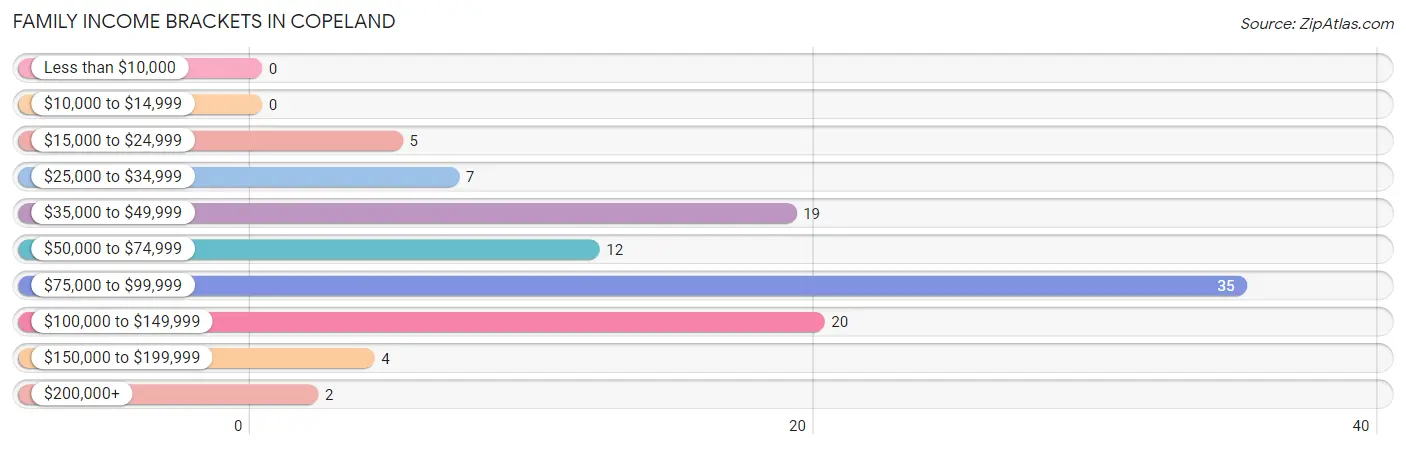
Family Income Brackets in Copeland
According to the Copeland family income data, there are 35 families falling into the $75,000 to $99,999 income range, which is the most common income bracket and makes up 33.7% of all families.
| Income Bracket | # Families | % Families |
| Less than $10,000 | 0 | 0.0% |
| $10,000 to $14,999 | 0 | 0.0% |
| $15,000 to $24,999 | 5 | 4.8% |
| $25,000 to $34,999 | 7 | 6.7% |
| $35,000 to $49,999 | 19 | 18.3% |
| $50,000 to $74,999 | 12 | 11.5% |
| $75,000 to $99,999 | 35 | 33.7% |
| $100,000 to $149,999 | 20 | 19.2% |
| $150,000 to $199,999 | 4 | 3.8% |
| $200,000+ | 2 | 1.9% |
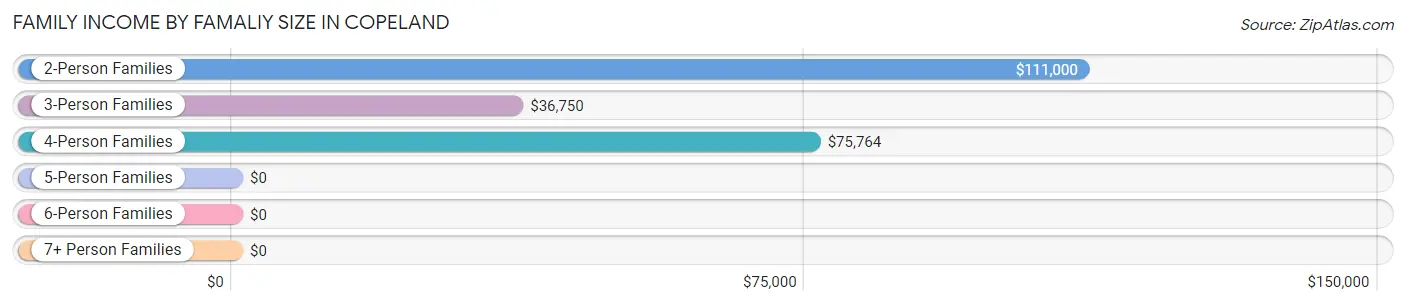
Family Income by Famaliy Size in Copeland
2-person families (36 | 34.6%) account for the highest median family income in Copeland with $111,000 per family, while 2-person families (36 | 34.6%) have the highest median income of $55,500 per family member.
| Income Bracket | # Families | Median Income |
| 2-Person Families | 36 (34.6%) | $111,000 |
| 3-Person Families | 35 (33.7%) | $36,750 |
| 4-Person Families | 25 (24.0%) | $75,764 |
| 5-Person Families | 5 (4.8%) | $0 |
| 6-Person Families | 0 (0.0%) | $0 |
| 7+ Person Families | 3 (2.9%) | $0 |
| Total | 104 (100.0%) | $76,023 |
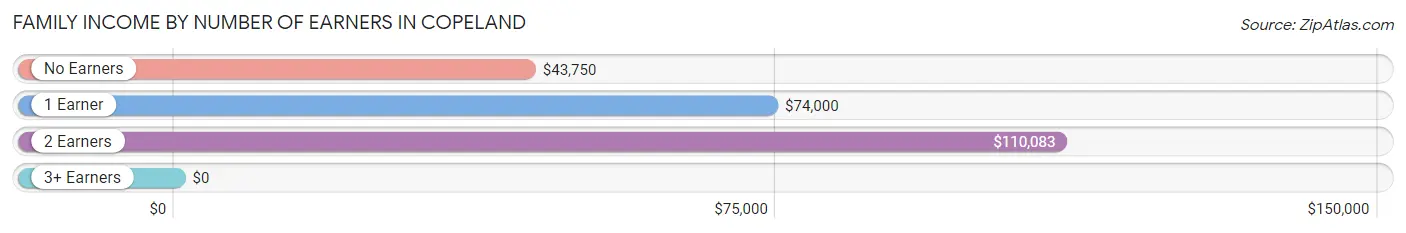
Family Income by Number of Earners in Copeland
| Number of Earners | # Families | Median Income |
| No Earners | 6 (5.8%) | $43,750 |
| 1 Earner | 36 (34.6%) | $74,000 |
| 2 Earners | 47 (45.2%) | $110,083 |
| 3+ Earners | 15 (14.4%) | $0 |
| Total | 104 (100.0%) | $76,023 |
Household Income in Copeland
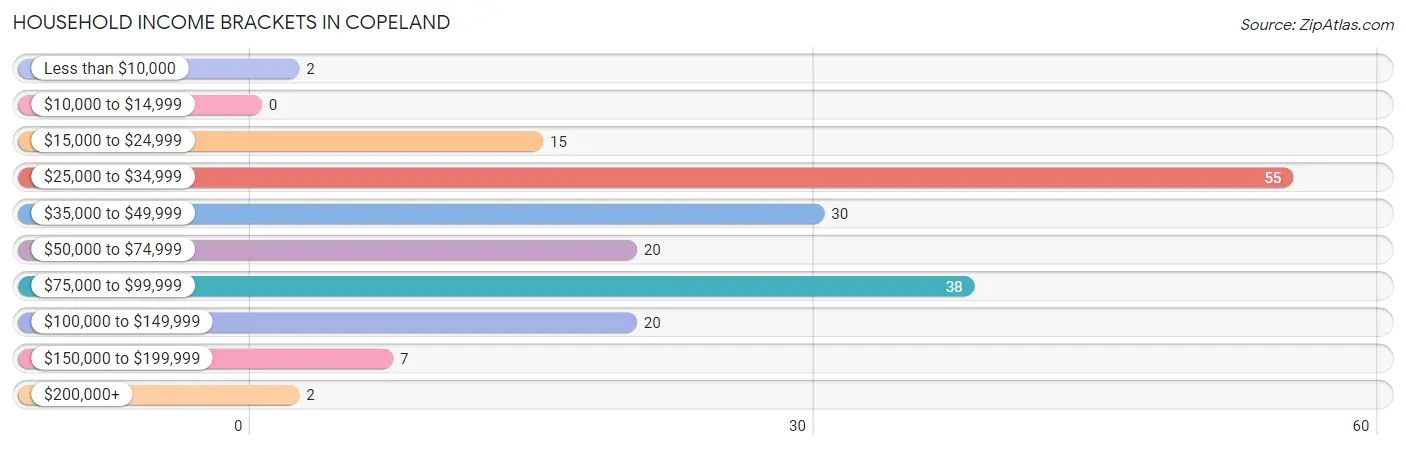
Household Income Brackets in Copeland
With 55 households falling in the category, the $25,000 to $34,999 income range is the most frequent in Copeland, accounting for 29.1% of all households.
| Income Bracket | # Households | % Households |
| Less than $10,000 | 2 | 1.1% |
| $10,000 to $14,999 | 0 | 0.0% |
| $15,000 to $24,999 | 15 | 7.9% |
| $25,000 to $34,999 | 55 | 29.1% |
| $35,000 to $49,999 | 30 | 15.9% |
| $50,000 to $74,999 | 20 | 10.6% |
| $75,000 to $99,999 | 38 | 20.1% |
| $100,000 to $149,999 | 20 | 10.6% |
| $150,000 to $199,999 | 7 | 3.7% |
| $200,000+ | 2 | 1.1% |
Household Income by Householder Age in Copeland
The median household income in Copeland is $43,750, with the highest median household income of $76,071 found in the 45 to 64 years age bracket for the primary householder. A total of 70 households (37.0%) fall into this category. Meanwhile, the 15 to 24 years age bracket for the primary householder has the lowest median household income of $0, with 6 households (3.2%) in this group.
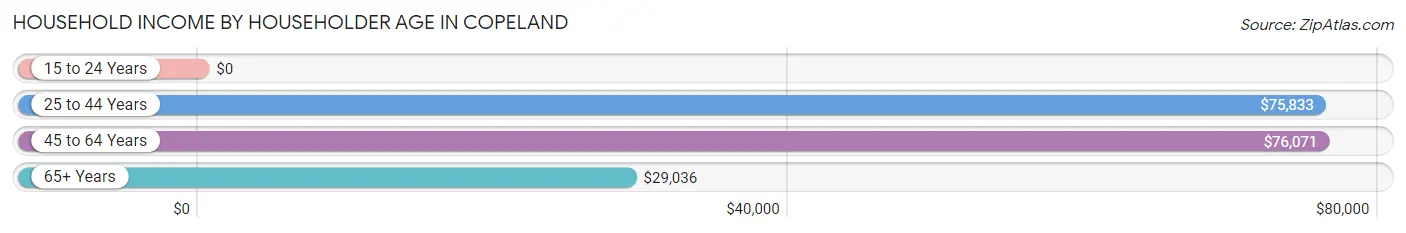
| Income Bracket | # Households | Median Income |
| 15 to 24 Years | 6 (3.2%) | $0 |
| 25 to 44 Years | 30 (15.9%) | $75,833 |
| 45 to 64 Years | 70 (37.0%) | $76,071 |
| 65+ Years | 83 (43.9%) | $29,036 |
| Total | 189 (100.0%) | $43,750 |
Poverty in Copeland
Income Below Poverty by Sex and Age in Copeland
With 1.6% poverty level for males and 4.3% for females among the residents of Copeland, 75 year old and over males and 12 to 14 year old females are the most vulnerable to poverty, with 2 males (33.3%) and 1 females (20.0%) in their respective age groups living below the poverty level.
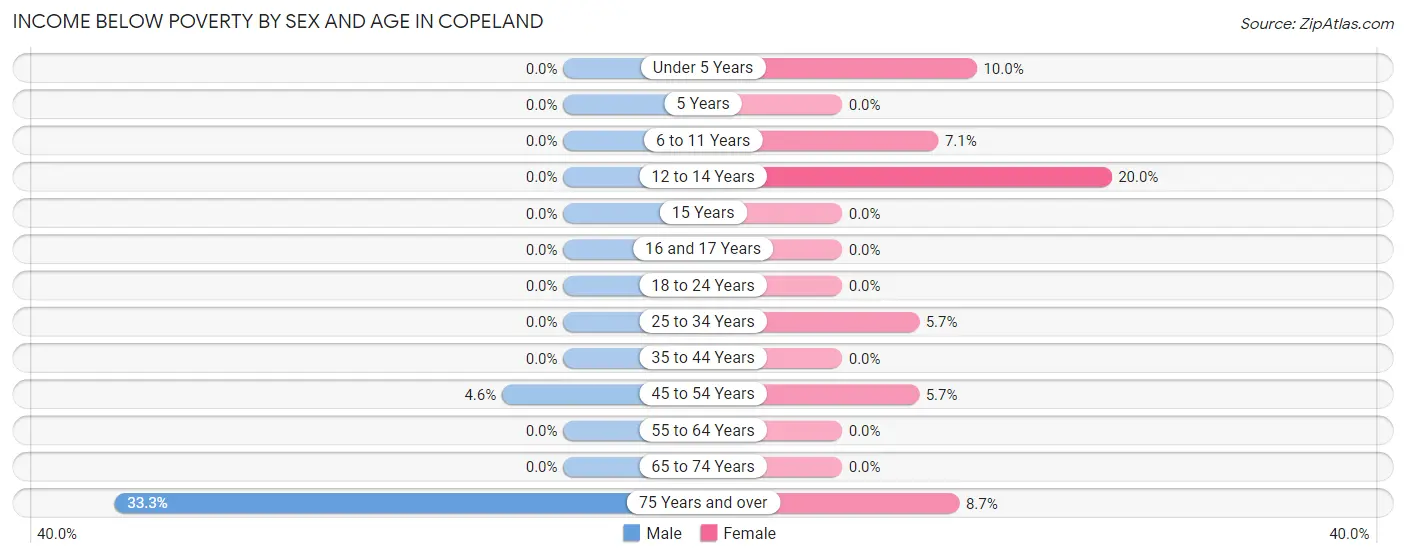
| Age Bracket | Male | Female |
| Under 5 Years | 0 (0.0%) | 1 (10.0%) |
| 5 Years | 0 (0.0%) | 0 (0.0%) |
| 6 to 11 Years | 0 (0.0%) | 1 (7.1%) |
| 12 to 14 Years | 0 (0.0%) | 1 (20.0%) |
| 15 Years | 0 (0.0%) | 0 (0.0%) |
| 16 and 17 Years | 0 (0.0%) | 0 (0.0%) |
| 18 to 24 Years | 0 (0.0%) | 0 (0.0%) |
| 25 to 34 Years | 0 (0.0%) | 2 (5.7%) |
| 35 to 44 Years | 0 (0.0%) | 0 (0.0%) |
| 45 to 54 Years | 2 (4.5%) | 2 (5.7%) |
| 55 to 64 Years | 0 (0.0%) | 0 (0.0%) |
| 65 to 74 Years | 0 (0.0%) | 0 (0.0%) |
| 75 Years and over | 2 (33.3%) | 2 (8.7%) |
| Total | 4 (1.6%) | 9 (4.3%) |
Income Above Poverty by Sex and Age in Copeland
According to the poverty statistics in Copeland, males aged under 5 years and females aged 15 years are the age groups that are most secure financially, with 100.0% of males and 100.0% of females in these age groups living above the poverty line.
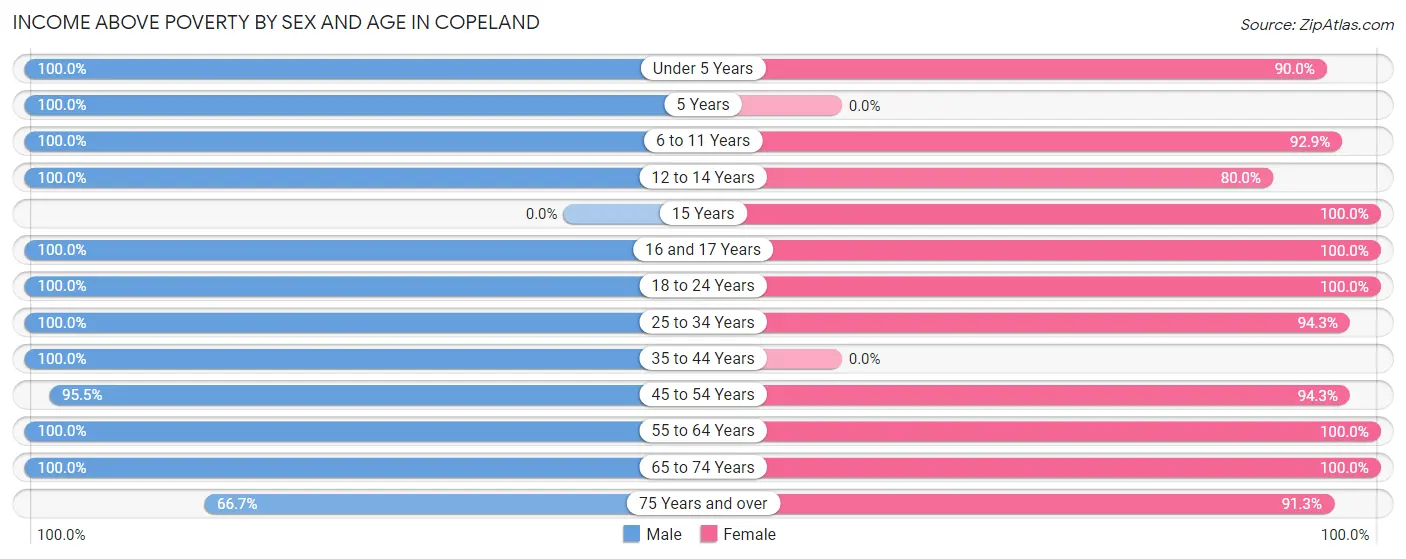
| Age Bracket | Male | Female |
| Under 5 Years | 4 (100.0%) | 9 (90.0%) |
| 5 Years | 15 (100.0%) | 0 (0.0%) |
| 6 to 11 Years | 21 (100.0%) | 13 (92.9%) |
| 12 to 14 Years | 4 (100.0%) | 4 (80.0%) |
| 15 Years | 0 (0.0%) | 8 (100.0%) |
| 16 and 17 Years | 54 (100.0%) | 2 (100.0%) |
| 18 to 24 Years | 43 (100.0%) | 6 (100.0%) |
| 25 to 34 Years | 27 (100.0%) | 33 (94.3%) |
| 35 to 44 Years | 7 (100.0%) | 0 (0.0%) |
| 45 to 54 Years | 42 (95.5%) | 33 (94.3%) |
| 55 to 64 Years | 11 (100.0%) | 13 (100.0%) |
| 65 to 74 Years | 9 (100.0%) | 56 (100.0%) |
| 75 Years and over | 4 (66.7%) | 21 (91.3%) |
| Total | 241 (98.4%) | 198 (95.7%) |
Income Below Poverty Among Married-Couple Families in Copeland
The poverty statistics for married-couple families in Copeland show that 3.1% or 2 of the total 64 families live below the poverty line. Families with no children have the highest poverty rate of 8.0%, comprising of 2 families. On the other hand, families with 1 or 2 children have the lowest poverty rate of 0.0%, which includes 0 families.
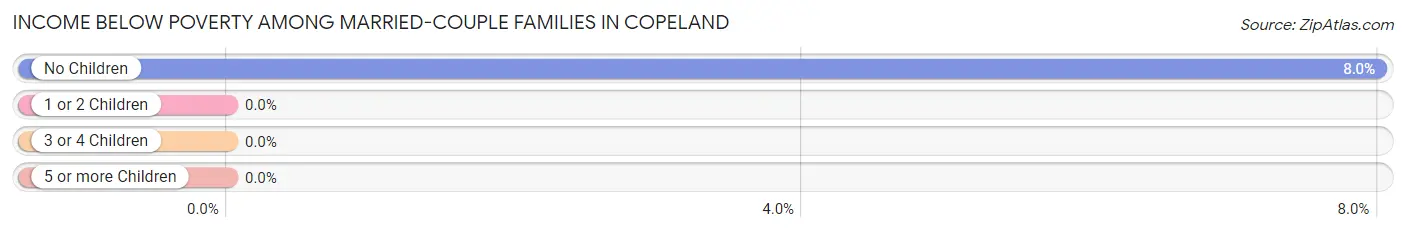
| Children | Above Poverty | Below Poverty |
| No Children | 23 (92.0%) | 2 (8.0%) |
| 1 or 2 Children | 31 (100.0%) | 0 (0.0%) |
| 3 or 4 Children | 5 (100.0%) | 0 (0.0%) |
| 5 or more Children | 3 (100.0%) | 0 (0.0%) |
| Total | 62 (96.9%) | 2 (3.1%) |
Income Below Poverty Among Single-Parent Households in Copeland
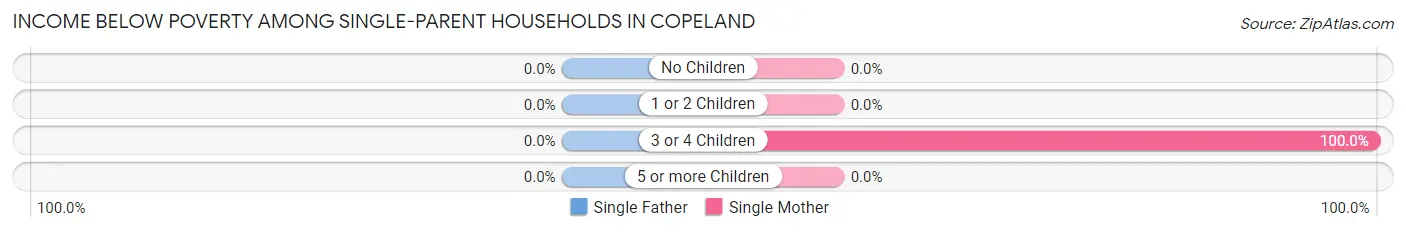
| Children | Single Father | Single Mother |
| No Children | 0 (0.0%) | 0 (0.0%) |
| 1 or 2 Children | 0 (0.0%) | 0 (0.0%) |
| 3 or 4 Children | 0 (0.0%) | 2 (100.0%) |
| 5 or more Children | 0 (0.0%) | 0 (0.0%) |
| Total | 0 (0.0%) | 2 (10.5%) |
Income Below Poverty Among Married-Couple vs Single-Parent Households in Copeland
The poverty data for Copeland shows that 2 of the married-couple family households (3.1%) and 2 of the single-parent households (5.0%) are living below the poverty level. Within the married-couple family households, those with no children have the highest poverty rate, with 2 households (8.0%) falling below the poverty line. Among the single-parent households, those with 3 or 4 children have the highest poverty rate, with 2 household (100.0%) living below poverty.
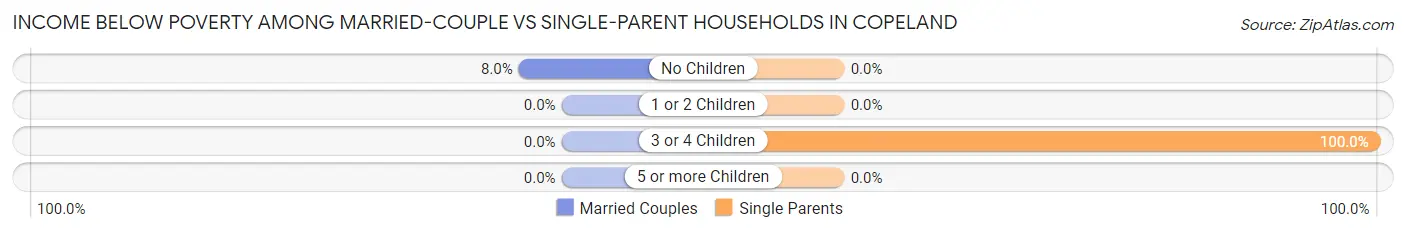
| Children | Married-Couple Families | Single-Parent Households |
| No Children | 2 (8.0%) | 0 (0.0%) |
| 1 or 2 Children | 0 (0.0%) | 0 (0.0%) |
| 3 or 4 Children | 0 (0.0%) | 2 (100.0%) |
| 5 or more Children | 0 (0.0%) | 0 (0.0%) |
| Total | 2 (3.1%) | 2 (5.0%) |
Race in Copeland
The most populous races in Copeland are White / Caucasian (350 | 77.4%), Hispanic or Latino (136 | 30.1%), and Two or more Races (99 | 21.9%).
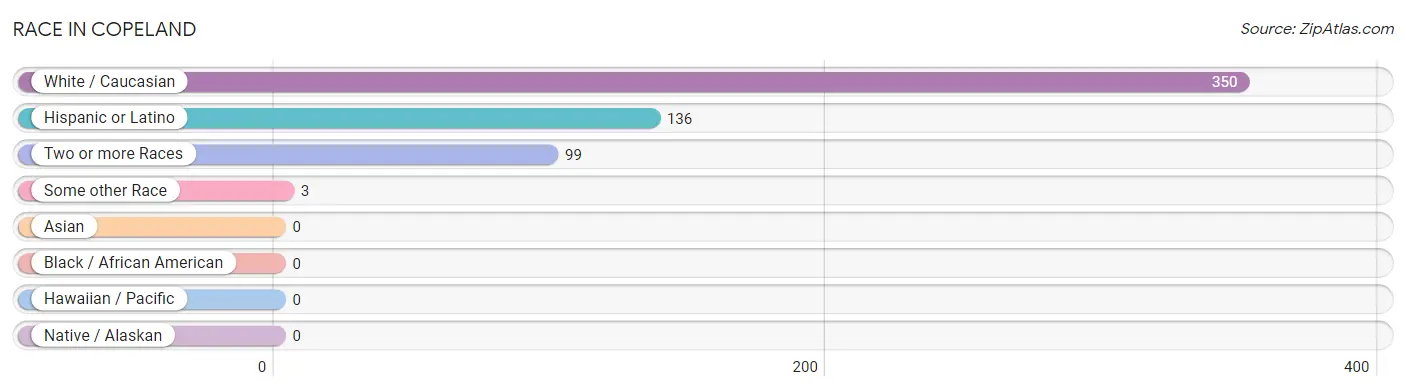
| Race | # Population | % Population |
| Asian | 0 | 0.0% |
| Black / African American | 0 | 0.0% |
| Hawaiian / Pacific | 0 | 0.0% |
| Hispanic or Latino | 136 | 30.1% |
| Native / Alaskan | 0 | 0.0% |
| White / Caucasian | 350 | 77.4% |
| Two or more Races | 99 | 21.9% |
| Some other Race | 3 | 0.7% |
| Total | 452 | 100.0% |
Ancestry in Copeland
The most populous ancestries reported in Copeland are German (157 | 34.7%), Mexican (135 | 29.9%), Irish (25 | 5.5%), Russian (24 | 5.3%), and English (12 | 2.6%), together accounting for 78.1% of all Copeland residents.
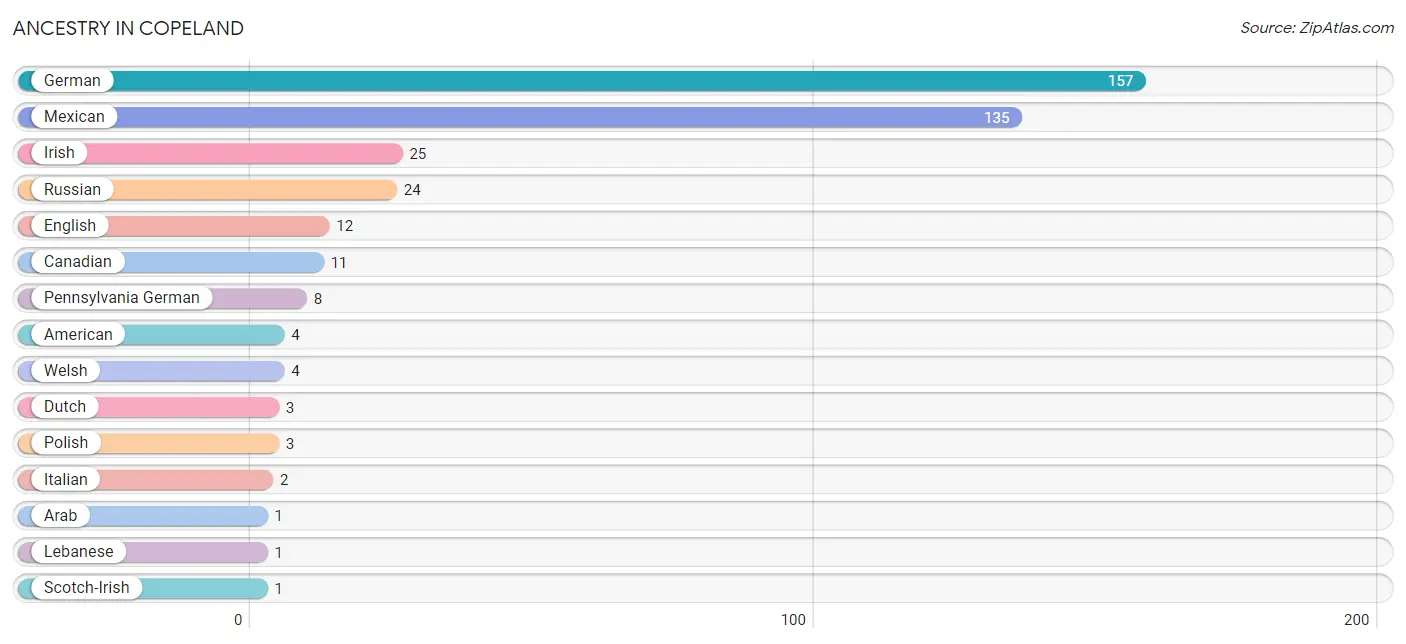
| Ancestry | # Population | % Population |
| American | 4 | 0.9% |
| Arab | 1 | 0.2% |
| Canadian | 11 | 2.4% |
| Dutch | 3 | 0.7% |
| English | 12 | 2.6% |
| German | 157 | 34.7% |
| Irish | 25 | 5.5% |
| Italian | 2 | 0.4% |
| Lebanese | 1 | 0.2% |
| Mexican | 135 | 29.9% |
| Pennsylvania German | 8 | 1.8% |
| Polish | 3 | 0.7% |
| Russian | 24 | 5.3% |
| Scotch-Irish | 1 | 0.2% |
| Scottish | 1 | 0.2% |
| Spanish | 1 | 0.2% |
| Welsh | 4 | 0.9% | View All 17 Rows |
Immigrants in Copeland
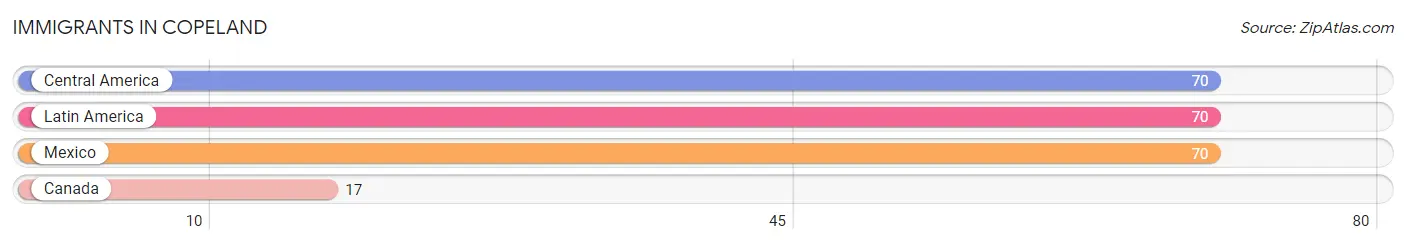
The most numerous immigrant groups reported in Copeland came from Central America (70 | 15.5%), Latin America (70 | 15.5%), Mexico (70 | 15.5%), and Canada (17 | 3.8%), together accounting for 50.2% of all Copeland residents.
| Immigration Origin | # Population | % Population |
| Canada | 17 | 3.8% |
| Central America | 70 | 15.5% |
| Latin America | 70 | 15.5% |
| Mexico | 70 | 15.5% | View All 4 Rows |
Sex and Age in Copeland
Sex and Age in Copeland
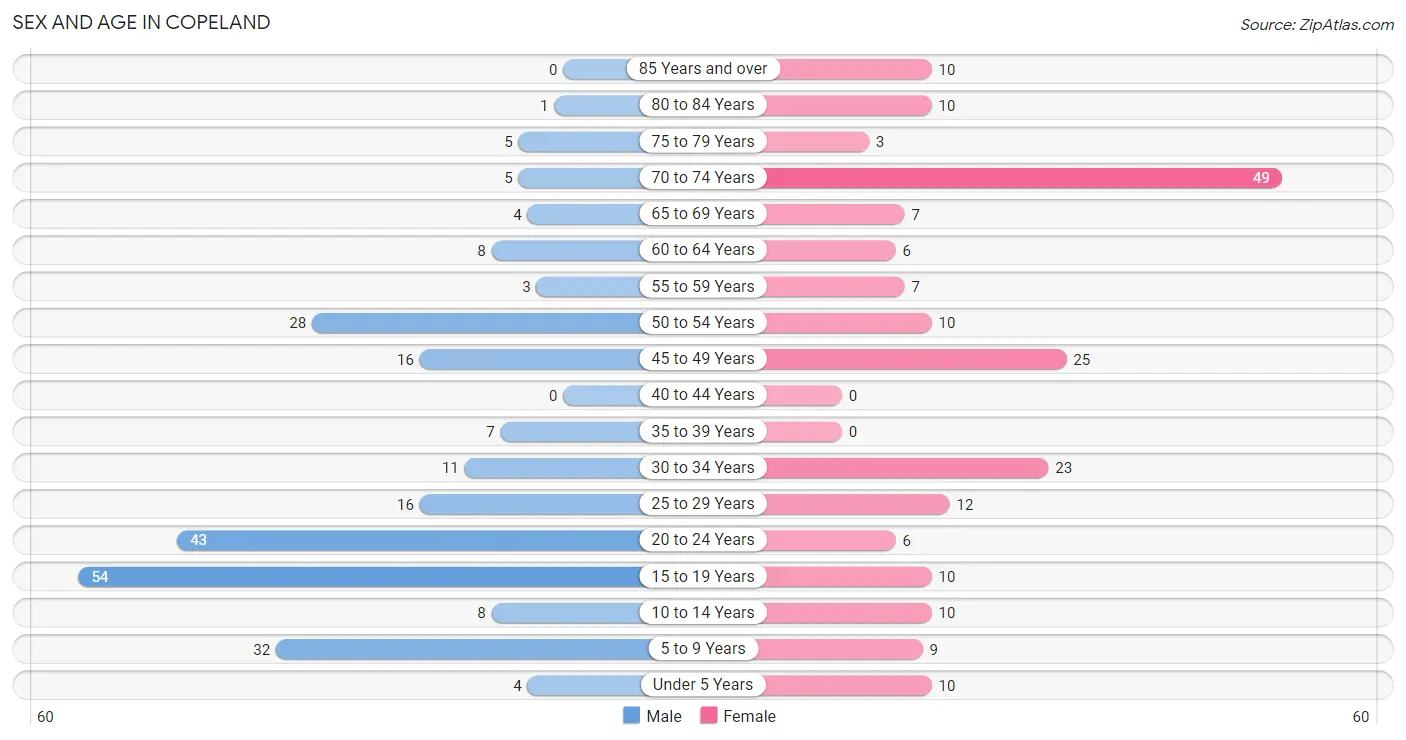
The most populous age groups in Copeland are 15 to 19 Years (54 | 22.0%) for men and 70 to 74 Years (49 | 23.7%) for women.
| Age Bracket | Male | Female |
| Under 5 Years | 4 (1.6%) | 10 (4.8%) |
| 5 to 9 Years | 32 (13.1%) | 9 (4.3%) |
| 10 to 14 Years | 8 (3.3%) | 10 (4.8%) |
| 15 to 19 Years | 54 (22.0%) | 10 (4.8%) |
| 20 to 24 Years | 43 (17.5%) | 6 (2.9%) |
| 25 to 29 Years | 16 (6.5%) | 12 (5.8%) |
| 30 to 34 Years | 11 (4.5%) | 23 (11.1%) |
| 35 to 39 Years | 7 (2.9%) | 0 (0.0%) |
| 40 to 44 Years | 0 (0.0%) | 0 (0.0%) |
| 45 to 49 Years | 16 (6.5%) | 25 (12.1%) |
| 50 to 54 Years | 28 (11.4%) | 10 (4.8%) |
| 55 to 59 Years | 3 (1.2%) | 7 (3.4%) |
| 60 to 64 Years | 8 (3.3%) | 6 (2.9%) |
| 65 to 69 Years | 4 (1.6%) | 7 (3.4%) |
| 70 to 74 Years | 5 (2.0%) | 49 (23.7%) |
| 75 to 79 Years | 5 (2.0%) | 3 (1.5%) |
| 80 to 84 Years | 1 (0.4%) | 10 (4.8%) |
| 85 Years and over | 0 (0.0%) | 10 (4.8%) |
| Total | 245 (100.0%) | 207 (100.0%) |
Families and Households in Copeland
Median Family Size in Copeland
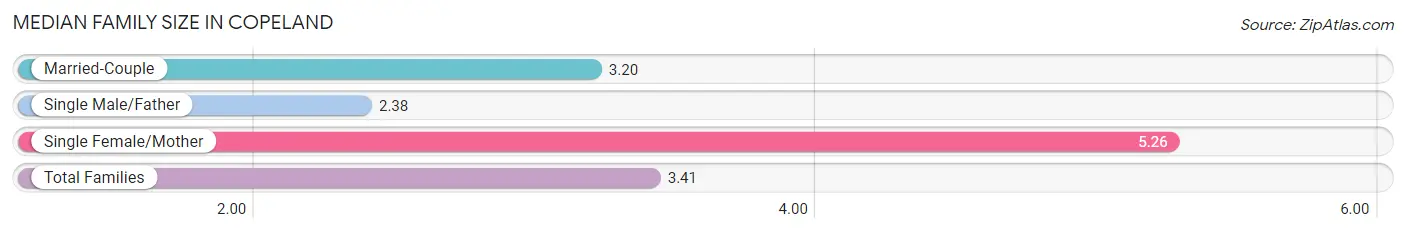
The median family size in Copeland is 3.41 persons per family, with single female/mother families (19 | 18.3%) accounting for the largest median family size of 5.26 persons per family. On the other hand, single male/father families (21 | 20.2%) represent the smallest median family size with 2.38 persons per family.
| Family Type | # Families | Family Size |
| Married-Couple | 64 (61.5%) | 3.20 |
| Single Male/Father | 21 (20.2%) | 2.38 |
| Single Female/Mother | 19 (18.3%) | 5.26 |
| Total Families | 104 (100.0%) | 3.41 |
Median Household Size in Copeland
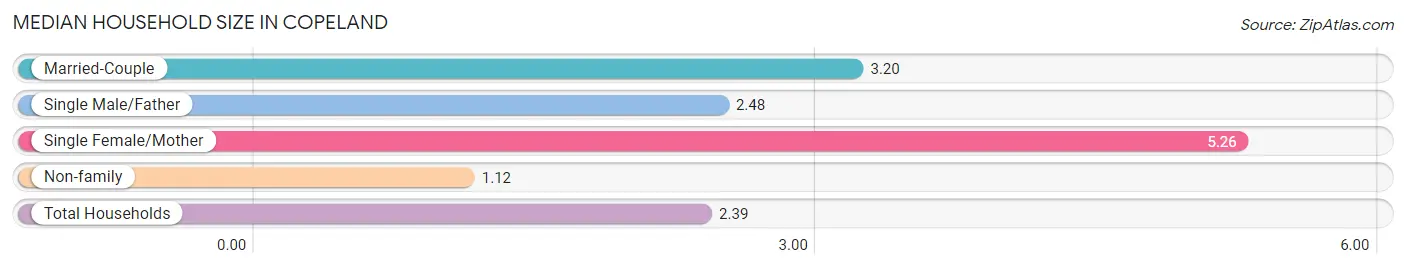
The median household size in Copeland is 2.39 persons per household, with single female/mother households (19 | 10.1%) accounting for the largest median household size of 5.26 persons per household. non-family households (85 | 45.0%) represent the smallest median household size with 1.12 persons per household.
| Household Type | # Households | Household Size |
| Married-Couple | 64 (33.9%) | 3.20 |
| Single Male/Father | 21 (11.1%) | 2.48 |
| Single Female/Mother | 19 (10.1%) | 5.26 |
| Non-family | 85 (45.0%) | 1.12 |
| Total Households | 189 (100.0%) | 2.39 |
Household Size by Marriage Status in Copeland
Out of a total of 189 households in Copeland, 104 (55.0%) are family households, while 85 (45.0%) are nonfamily households. The most numerous type of family households are 2-person households, comprising 36, and the most common type of nonfamily households are 1-person households, comprising 80.
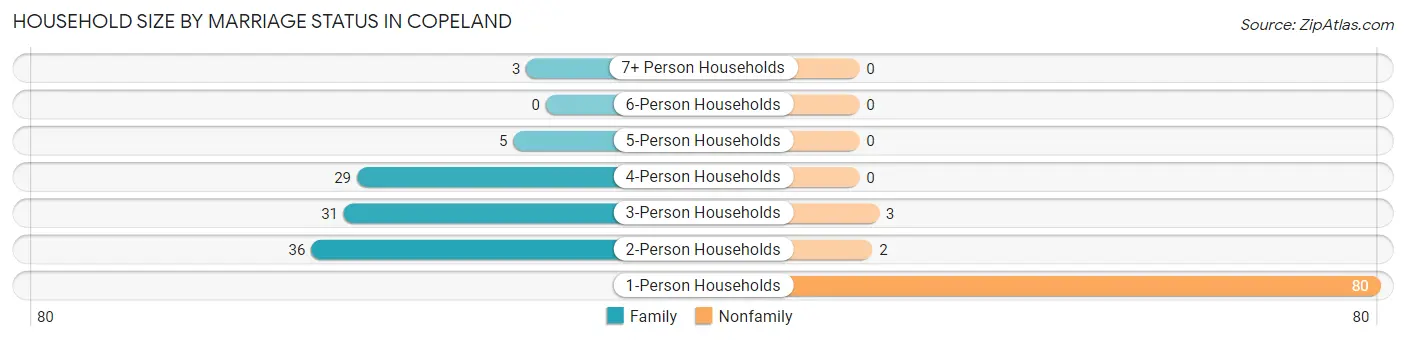
| Household Size | Family Households | Nonfamily Households |
| 1-Person Households | - | 80 (42.3%) |
| 2-Person Households | 36 (19.1%) | 2 (1.1%) |
| 3-Person Households | 31 (16.4%) | 3 (1.6%) |
| 4-Person Households | 29 (15.3%) | 0 (0.0%) |
| 5-Person Households | 5 (2.6%) | 0 (0.0%) |
| 6-Person Households | 0 (0.0%) | 0 (0.0%) |
| 7+ Person Households | 3 (1.6%) | 0 (0.0%) |
| Total | 104 (55.0%) | 85 (45.0%) |
Female Fertility in Copeland
Fertility by Age in Copeland
Average fertility rate in Copeland is 38.0 births per 1,000 women. Women in the age bracket of 20 to 34 years have the highest fertility rate with 73.0 births per 1,000 women. Women in the age bracket of 20 to 34 years acount for 100.0% of all women with births.
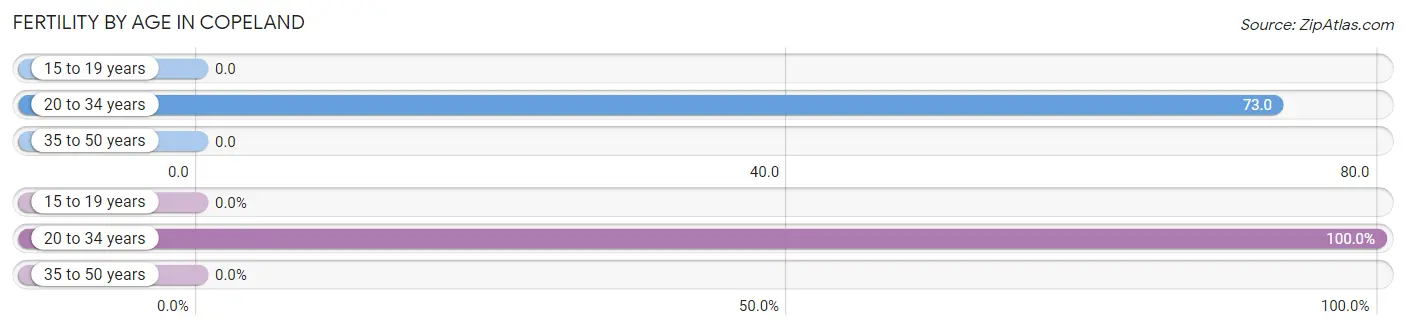
| Age Bracket | Women with Births | Births / 1,000 Women |
| 15 to 19 years | 0 (0.0%) | 0.0 |
| 20 to 34 years | 3 (100.0%) | 73.0 |
| 35 to 50 years | 0 (0.0%) | 0.0 |
| Total | 3 (100.0%) | 38.0 |
Fertility by Age by Marriage Status in Copeland
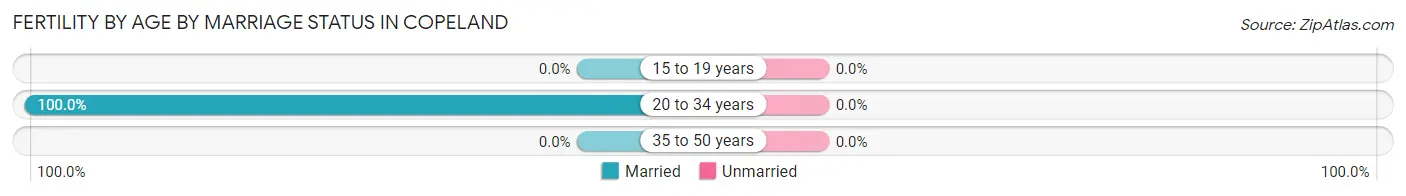
| Age Bracket | Married | Unmarried |
| 15 to 19 years | 0 (0.0%) | 0 (0.0%) |
| 20 to 34 years | 3 (100.0%) | 0 (0.0%) |
| 35 to 50 years | 0 (0.0%) | 0 (0.0%) |
| Total | 3 (100.0%) | 0 (0.0%) |
Fertility by Education in Copeland
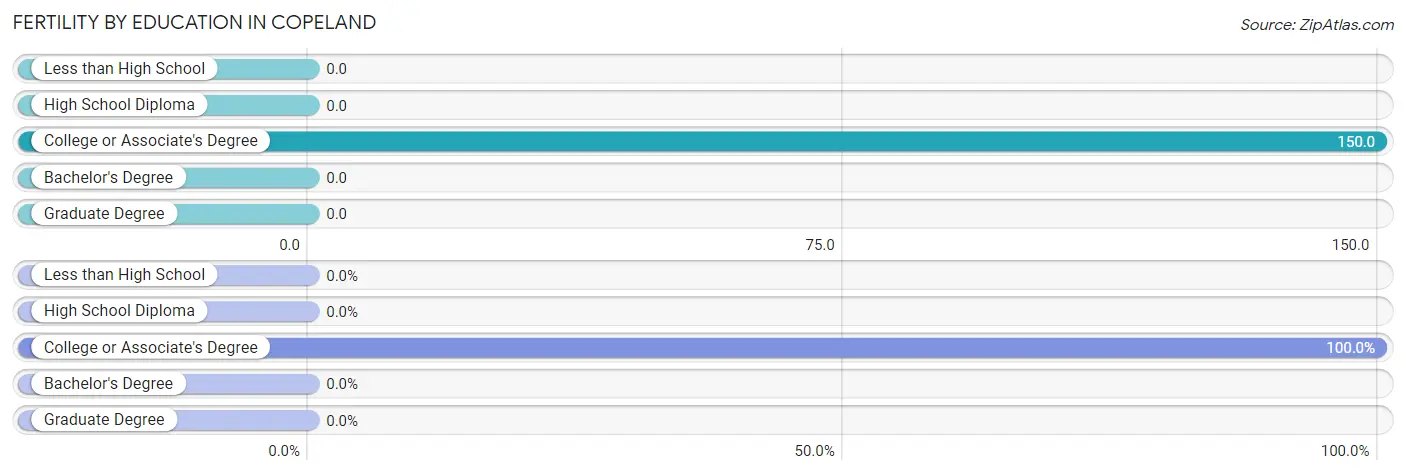
| Educational Attainment | Women with Births | Births / 1,000 Women |
| Less than High School | 0 (0.0%) | 0.0 |
| High School Diploma | 0 (0.0%) | 0.0 |
| College or Associate's Degree | 3 (100.0%) | 150.0 |
| Bachelor's Degree | 0 (0.0%) | 0.0 |
| Graduate Degree | 0 (0.0%) | 0.0 |
| Total | 3 (100.0%) | 38.0 |
Fertility by Education by Marriage Status in Copeland
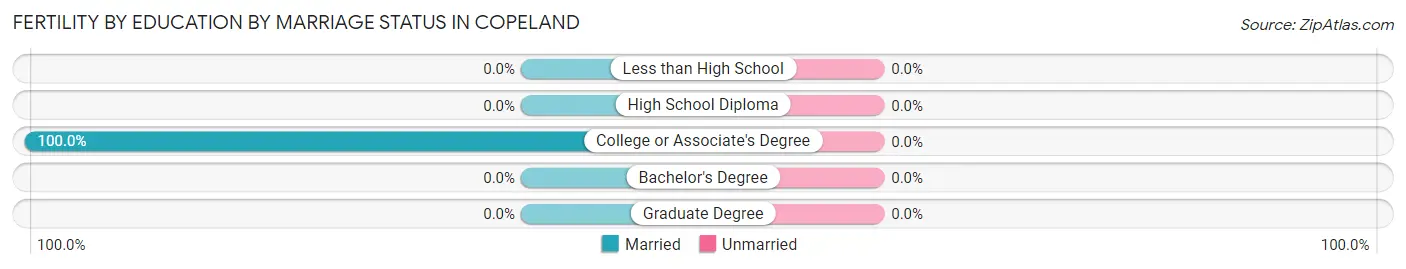
| Educational Attainment | Married | Unmarried |
| Less than High School | 0 (0.0%) | 0 (0.0%) |
| High School Diploma | 0 (0.0%) | 0 (0.0%) |
| College or Associate's Degree | 3 (100.0%) | 0 (0.0%) |
| Bachelor's Degree | 0 (0.0%) | 0 (0.0%) |
| Graduate Degree | 0 (0.0%) | 0 (0.0%) |
| Total | 3 (100.0%) | 0 (0.0%) |
Employment Characteristics in Copeland
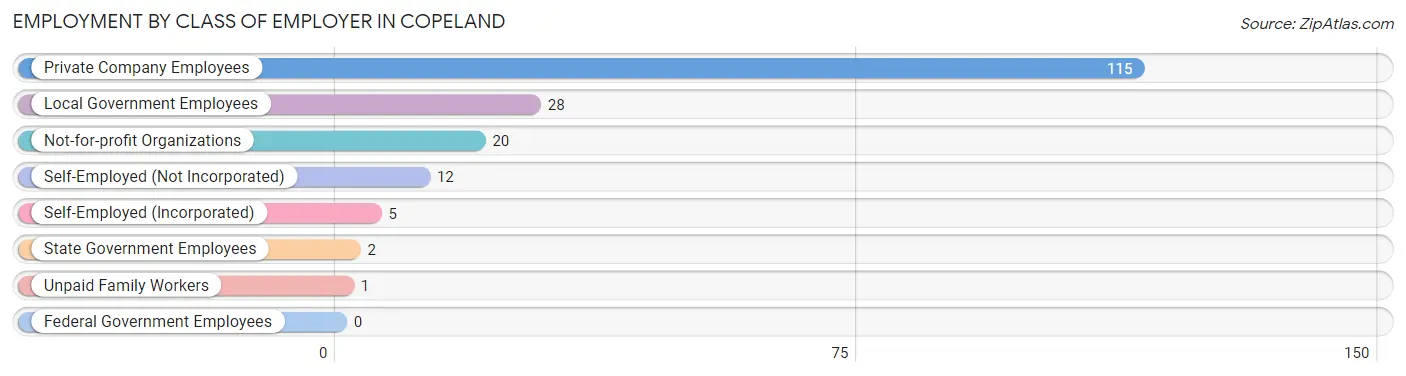
Employment by Class of Employer in Copeland
Among the 183 employed individuals in Copeland, private company employees (115 | 62.8%), local government employees (28 | 15.3%), and not-for-profit organizations (20 | 10.9%) make up the most common classes of employment.
| Employer Class | # Employees | % Employees |
| Private Company Employees | 115 | 62.8% |
| Self-Employed (Incorporated) | 5 | 2.7% |
| Self-Employed (Not Incorporated) | 12 | 6.6% |
| Not-for-profit Organizations | 20 | 10.9% |
| Local Government Employees | 28 | 15.3% |
| State Government Employees | 2 | 1.1% |
| Federal Government Employees | 0 | 0.0% |
| Unpaid Family Workers | 1 | 0.5% |
| Total | 183 | 100.0% |
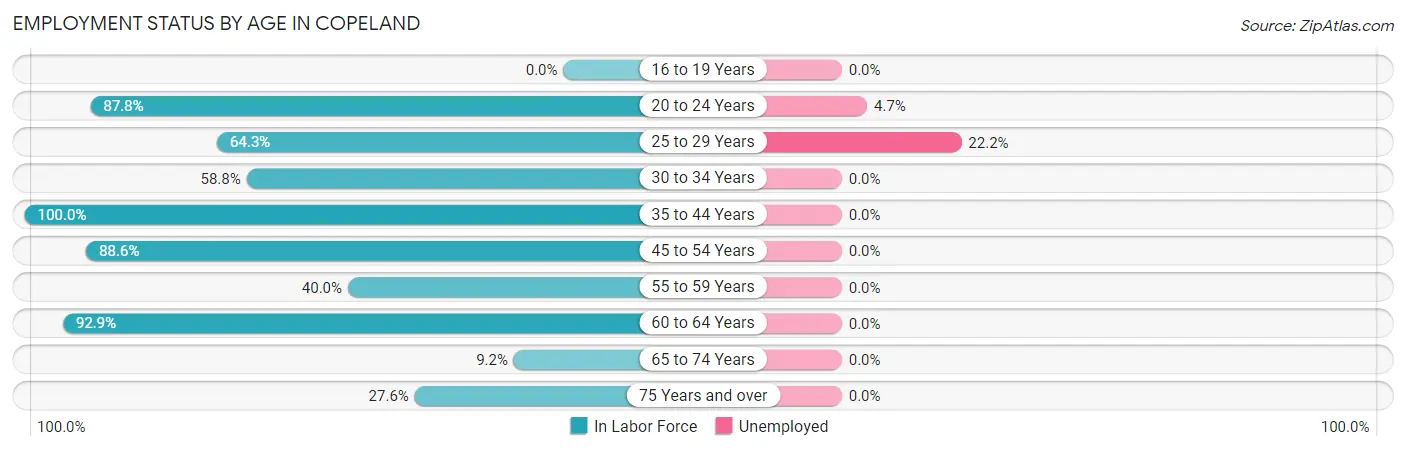
Employment Status by Age in Copeland
According to the labor force statistics for Copeland, out of the total population over 16 years of age (371), 50.9% or 189 individuals are in the labor force, with 3.2% or 6 of them unemployed. The age group with the highest labor force participation rate is 35 to 44 years, with 100.0% or 7 individuals in the labor force. Within the labor force, the 25 to 29 years age range has the highest percentage of unemployed individuals, with 22.2% or 4 of them being unemployed.
| Age Bracket | In Labor Force | Unemployed |
| 16 to 19 Years | 0 (0.0%) | 0 (0.0%) |
| 20 to 24 Years | 43 (87.8%) | 2 (4.7%) |
| 25 to 29 Years | 18 (64.3%) | 4 (22.2%) |
| 30 to 34 Years | 20 (58.8%) | 0 (0.0%) |
| 35 to 44 Years | 7 (100.0%) | 0 (0.0%) |
| 45 to 54 Years | 70 (88.6%) | 0 (0.0%) |
| 55 to 59 Years | 4 (40.0%) | 0 (0.0%) |
| 60 to 64 Years | 13 (92.9%) | 0 (0.0%) |
| 65 to 74 Years | 6 (9.2%) | 0 (0.0%) |
| 75 Years and over | 8 (27.6%) | 0 (0.0%) |
| Total | 189 (50.9%) | 6 (3.2%) |
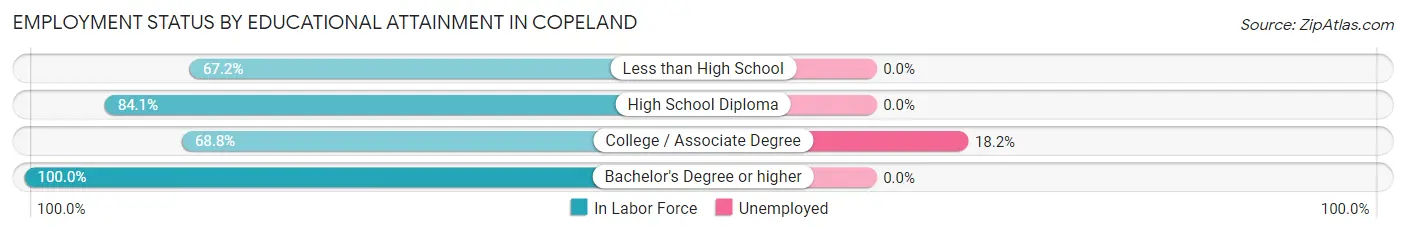
Employment Status by Educational Attainment in Copeland
According to labor force statistics for Copeland, 76.7% of individuals (132) out of the total population between 25 and 64 years of age (172) are in the labor force, with 3.0% or 4 of them being unemployed. The group with the highest labor force participation rate are those with the educational attainment of bachelor's degree or higher, with 100.0% or 16 individuals in the labor force. Within the labor force, individuals with college / associate degree education have the highest percentage of unemployment, with 18.2% or 4 of them being unemployed.
| Educational Attainment | In Labor Force | Unemployed |
| Less than High School | 41 (67.2%) | 0 (0.0%) |
| High School Diploma | 53 (84.1%) | 0 (0.0%) |
| College / Associate Degree | 22 (68.8%) | 6 (18.2%) |
| Bachelor's Degree or higher | 16 (100.0%) | 0 (0.0%) |
| Total | 132 (76.7%) | 5 (3.0%) |
Employment Occupations by Sex in Copeland
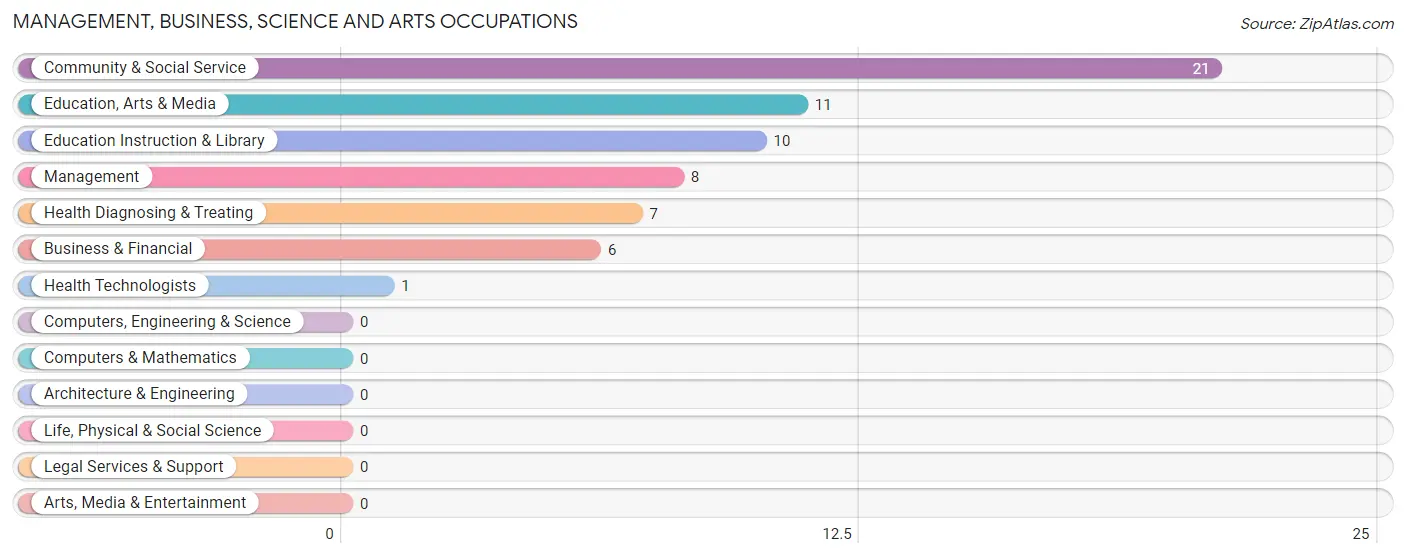
Management, Business, Science and Arts Occupations
The most common Management, Business, Science and Arts occupations in Copeland are Community & Social Service (21 | 11.5%), Education, Arts & Media (11 | 6.0%), Education Instruction & Library (10 | 5.5%), Management (8 | 4.4%), and Health Diagnosing & Treating (7 | 3.8%).
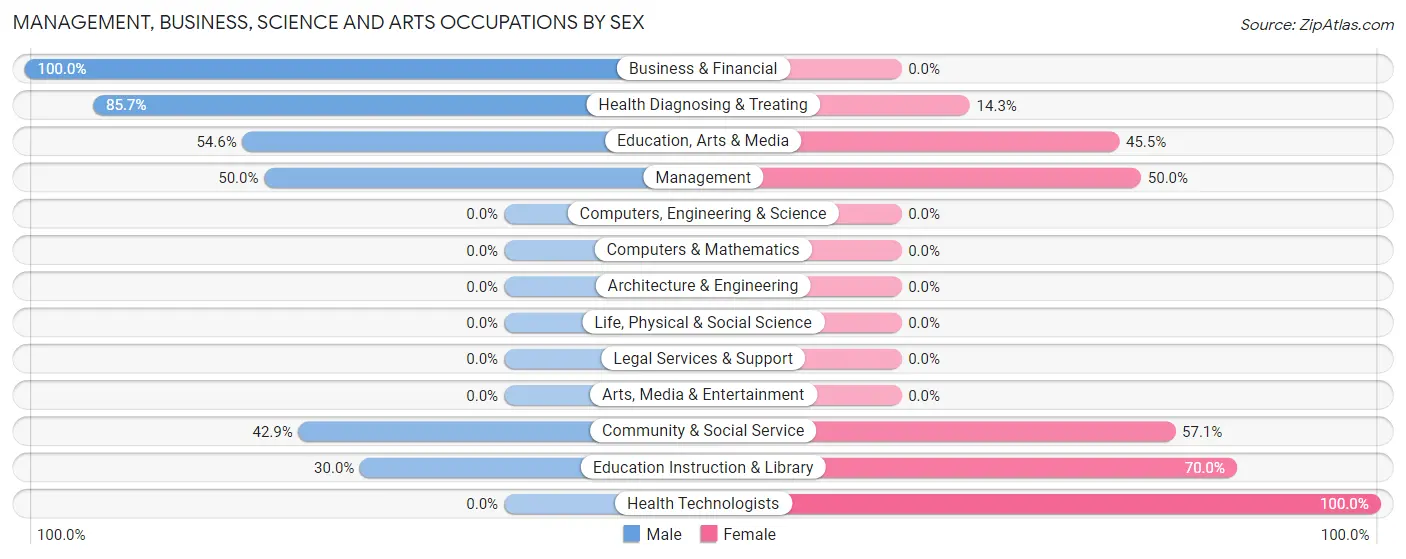
Management, Business, Science and Arts Occupations by Sex
Within the Management, Business, Science and Arts occupations in Copeland, the most male-oriented occupations are Business & Financial (100.0%), Health Diagnosing & Treating (85.7%), and Education, Arts & Media (54.5%), while the most female-oriented occupations are Health Technologists (100.0%), Education Instruction & Library (70.0%), and Community & Social Service (57.1%).
| Occupation | Male | Female |
| Management | 4 (50.0%) | 4 (50.0%) |
| Business & Financial | 6 (100.0%) | 0 (0.0%) |
| Computers, Engineering & Science | 0 (0.0%) | 0 (0.0%) |
| Computers & Mathematics | 0 (0.0%) | 0 (0.0%) |
| Architecture & Engineering | 0 (0.0%) | 0 (0.0%) |
| Life, Physical & Social Science | 0 (0.0%) | 0 (0.0%) |
| Community & Social Service | 9 (42.9%) | 12 (57.1%) |
| Education, Arts & Media | 6 (54.5%) | 5 (45.5%) |
| Legal Services & Support | 0 (0.0%) | 0 (0.0%) |
| Education Instruction & Library | 3 (30.0%) | 7 (70.0%) |
| Arts, Media & Entertainment | 0 (0.0%) | 0 (0.0%) |
| Health Diagnosing & Treating | 6 (85.7%) | 1 (14.3%) |
| Health Technologists | 0 (0.0%) | 1 (100.0%) |
| Total (Category) | 25 (59.5%) | 17 (40.5%) |
| Total (Overall) | 127 (69.4%) | 56 (30.6%) |
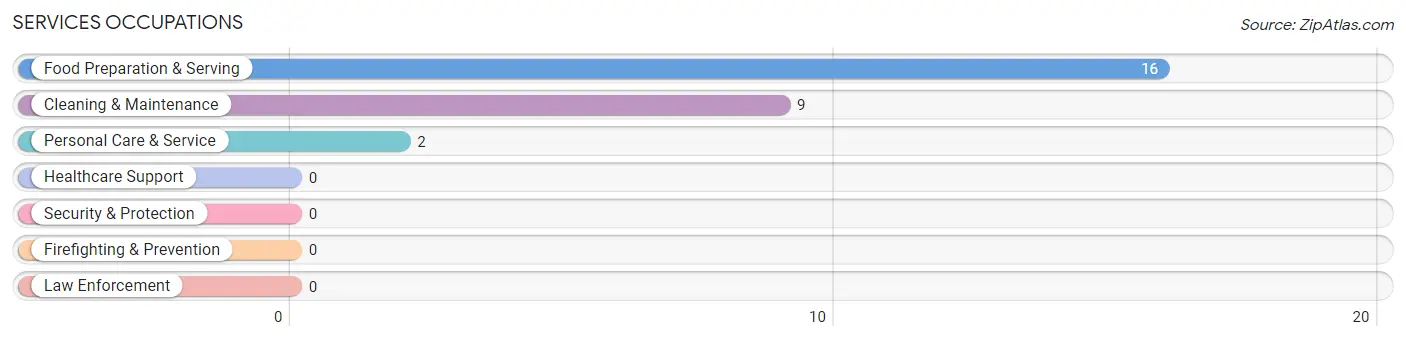
Services Occupations
The most common Services occupations in Copeland are Food Preparation & Serving (16 | 8.7%), Cleaning & Maintenance (9 | 4.9%), and Personal Care & Service (2 | 1.1%).
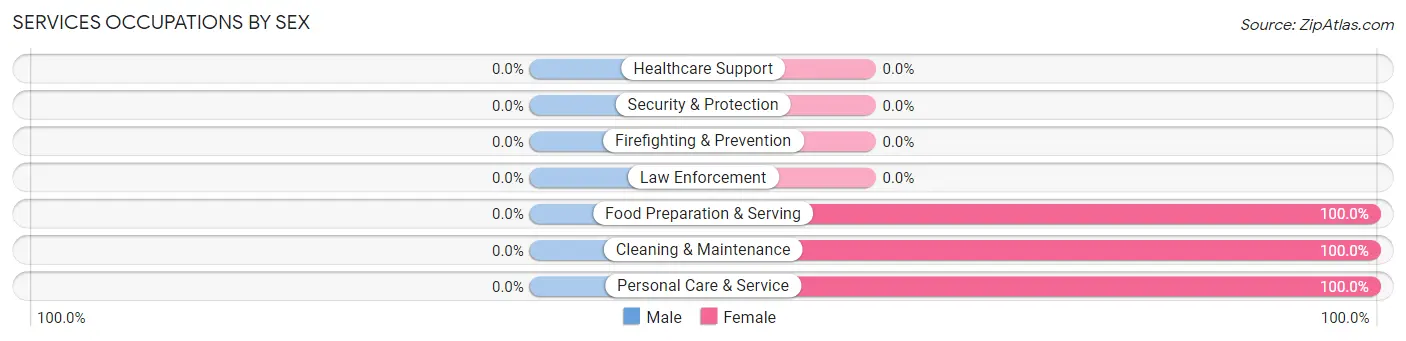
Services Occupations by Sex
| Occupation | Male | Female |
| Healthcare Support | 0 (0.0%) | 0 (0.0%) |
| Security & Protection | 0 (0.0%) | 0 (0.0%) |
| Firefighting & Prevention | 0 (0.0%) | 0 (0.0%) |
| Law Enforcement | 0 (0.0%) | 0 (0.0%) |
| Food Preparation & Serving | 0 (0.0%) | 16 (100.0%) |
| Cleaning & Maintenance | 0 (0.0%) | 9 (100.0%) |
| Personal Care & Service | 0 (0.0%) | 2 (100.0%) |
| Total (Category) | 0 (0.0%) | 27 (100.0%) |
| Total (Overall) | 127 (69.4%) | 56 (30.6%) |
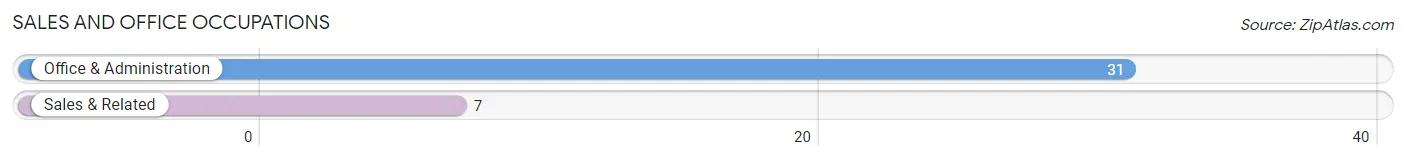
Sales and Office Occupations
The most common Sales and Office occupations in Copeland are Office & Administration (31 | 16.9%), and Sales & Related (7 | 3.8%).
Sales and Office Occupations by Sex
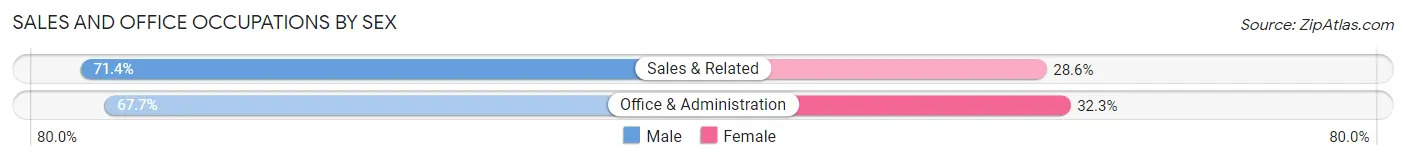
| Occupation | Male | Female |
| Sales & Related | 5 (71.4%) | 2 (28.6%) |
| Office & Administration | 21 (67.7%) | 10 (32.3%) |
| Total (Category) | 26 (68.4%) | 12 (31.6%) |
| Total (Overall) | 127 (69.4%) | 56 (30.6%) |
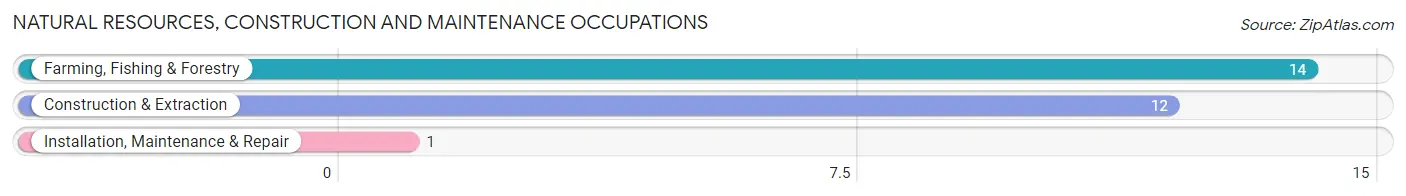
Natural Resources, Construction and Maintenance Occupations
The most common Natural Resources, Construction and Maintenance occupations in Copeland are Farming, Fishing & Forestry (14 | 7.6%), Construction & Extraction (12 | 6.6%), and Installation, Maintenance & Repair (1 | 0.5%).
Natural Resources, Construction and Maintenance Occupations by Sex
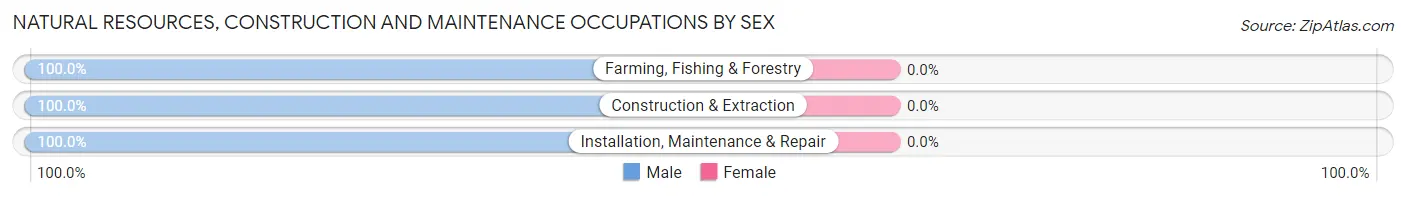
| Occupation | Male | Female |
| Farming, Fishing & Forestry | 14 (100.0%) | 0 (0.0%) |
| Construction & Extraction | 12 (100.0%) | 0 (0.0%) |
| Installation, Maintenance & Repair | 1 (100.0%) | 0 (0.0%) |
| Total (Category) | 27 (100.0%) | 0 (0.0%) |
| Total (Overall) | 127 (69.4%) | 56 (30.6%) |
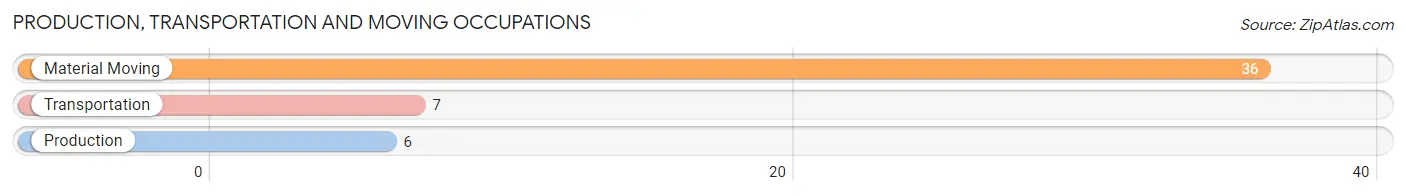
Production, Transportation and Moving Occupations
The most common Production, Transportation and Moving occupations in Copeland are Material Moving (36 | 19.7%), Transportation (7 | 3.8%), and Production (6 | 3.3%).
Production, Transportation and Moving Occupations by Sex
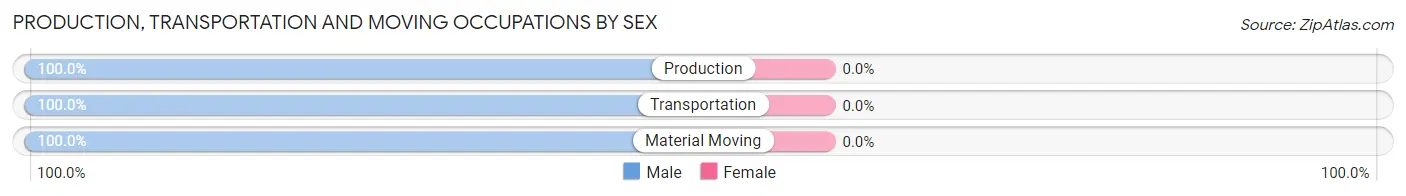
| Occupation | Male | Female |
| Production | 6 (100.0%) | 0 (0.0%) |
| Transportation | 7 (100.0%) | 0 (0.0%) |
| Material Moving | 36 (100.0%) | 0 (0.0%) |
| Total (Category) | 49 (100.0%) | 0 (0.0%) |
| Total (Overall) | 127 (69.4%) | 56 (30.6%) |
Employment Industries by Sex in Copeland
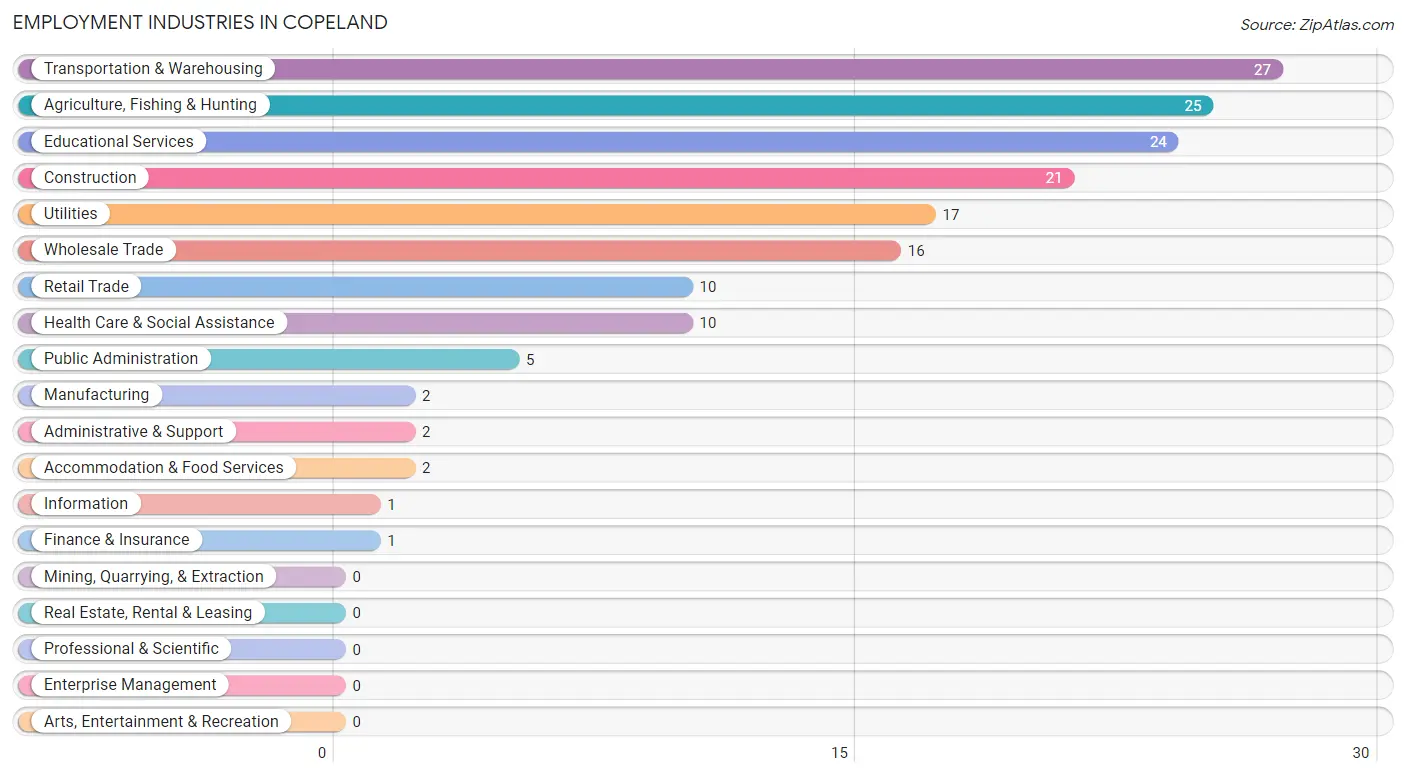
Employment Industries in Copeland
The major employment industries in Copeland include Transportation & Warehousing (27 | 14.7%), Agriculture, Fishing & Hunting (25 | 13.7%), Educational Services (24 | 13.1%), Construction (21 | 11.5%), and Utilities (17 | 9.3%).
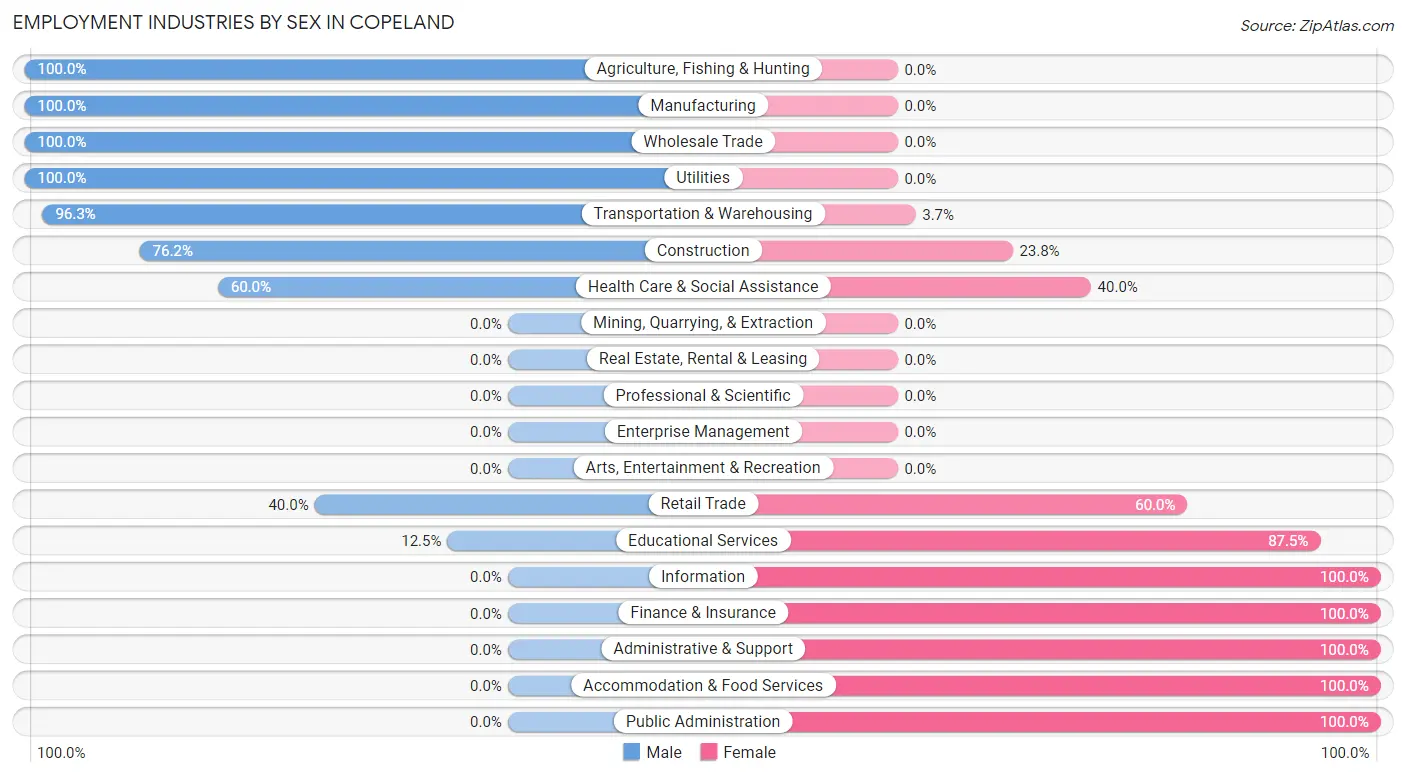
Employment Industries by Sex in Copeland
The Copeland industries that see more men than women are Agriculture, Fishing & Hunting (100.0%), Manufacturing (100.0%), and Wholesale Trade (100.0%), whereas the industries that tend to have a higher number of women are Information (100.0%), Finance & Insurance (100.0%), and Administrative & Support (100.0%).
| Industry | Male | Female |
| Agriculture, Fishing & Hunting | 25 (100.0%) | 0 (0.0%) |
| Mining, Quarrying, & Extraction | 0 (0.0%) | 0 (0.0%) |
| Construction | 16 (76.2%) | 5 (23.8%) |
| Manufacturing | 2 (100.0%) | 0 (0.0%) |
| Wholesale Trade | 16 (100.0%) | 0 (0.0%) |
| Retail Trade | 4 (40.0%) | 6 (60.0%) |
| Transportation & Warehousing | 26 (96.3%) | 1 (3.7%) |
| Utilities | 17 (100.0%) | 0 (0.0%) |
| Information | 0 (0.0%) | 1 (100.0%) |
| Finance & Insurance | 0 (0.0%) | 1 (100.0%) |
| Real Estate, Rental & Leasing | 0 (0.0%) | 0 (0.0%) |
| Professional & Scientific | 0 (0.0%) | 0 (0.0%) |
| Enterprise Management | 0 (0.0%) | 0 (0.0%) |
| Administrative & Support | 0 (0.0%) | 2 (100.0%) |
| Educational Services | 3 (12.5%) | 21 (87.5%) |
| Health Care & Social Assistance | 6 (60.0%) | 4 (40.0%) |
| Arts, Entertainment & Recreation | 0 (0.0%) | 0 (0.0%) |
| Accommodation & Food Services | 0 (0.0%) | 2 (100.0%) |
| Public Administration | 0 (0.0%) | 5 (100.0%) |
| Total | 127 (69.4%) | 56 (30.6%) |
Education in Copeland
School Enrollment in Copeland
The most common levels of schooling among the 111 students in Copeland are high school (65 | 58.6%), elementary school (17 | 15.3%), and kindergarten (13 | 11.7%).
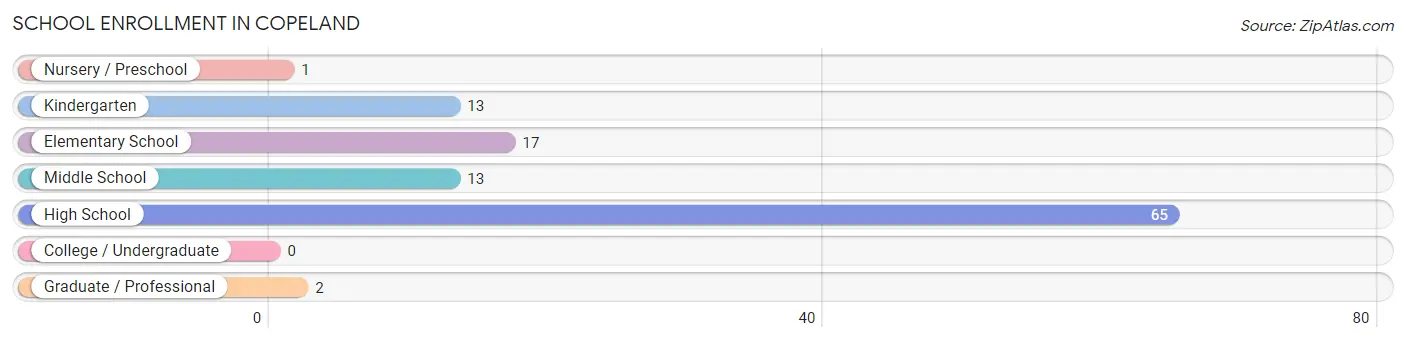
| School Level | # Students | % Students |
| Nursery / Preschool | 1 | 0.9% |
| Kindergarten | 13 | 11.7% |
| Elementary School | 17 | 15.3% |
| Middle School | 13 | 11.7% |
| High School | 65 | 58.6% |
| College / Undergraduate | 0 | 0.0% |
| Graduate / Professional | 2 | 1.8% |
| Total | 111 | 100.0% |
School Enrollment by Age by Funding Source in Copeland
Out of a total of 111 students who are enrolled in schools in Copeland, 18 (16.2%) attend a private institution, while the remaining 93 (83.8%) are enrolled in public schools. The age group of 5 to 9 year old has the highest likelihood of being enrolled in private schools, with 12 (46.2% in the age bracket) enrolled. Conversely, the age group of 3 to 4 year olds has the lowest likelihood of being enrolled in a private school, with 1 (100.0% in the age bracket) attending a public institution.
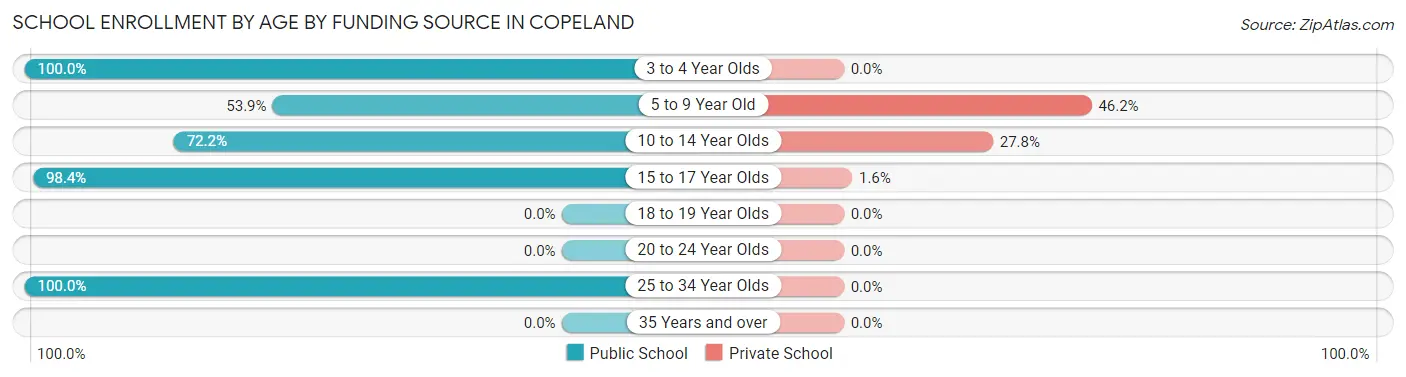
| Age Bracket | Public School | Private School |
| 3 to 4 Year Olds | 1 (100.0%) | 0 (0.0%) |
| 5 to 9 Year Old | 14 (53.8%) | 12 (46.2%) |
| 10 to 14 Year Olds | 13 (72.2%) | 5 (27.8%) |
| 15 to 17 Year Olds | 63 (98.4%) | 1 (1.6%) |
| 18 to 19 Year Olds | 0 (0.0%) | 0 (0.0%) |
| 20 to 24 Year Olds | 0 (0.0%) | 0 (0.0%) |
| 25 to 34 Year Olds | 2 (100.0%) | 0 (0.0%) |
| 35 Years and over | 0 (0.0%) | 0 (0.0%) |
| Total | 93 (83.8%) | 18 (16.2%) |
Educational Attainment by Field of Study in Copeland
Education (9 | 39.1%), bio, nature & agricultural (6 | 26.1%), business (4 | 17.4%), science & technology (2 | 8.7%), and social sciences (1 | 4.3%) are the most common fields of study among 23 individuals in Copeland who have obtained a bachelor's degree or higher.
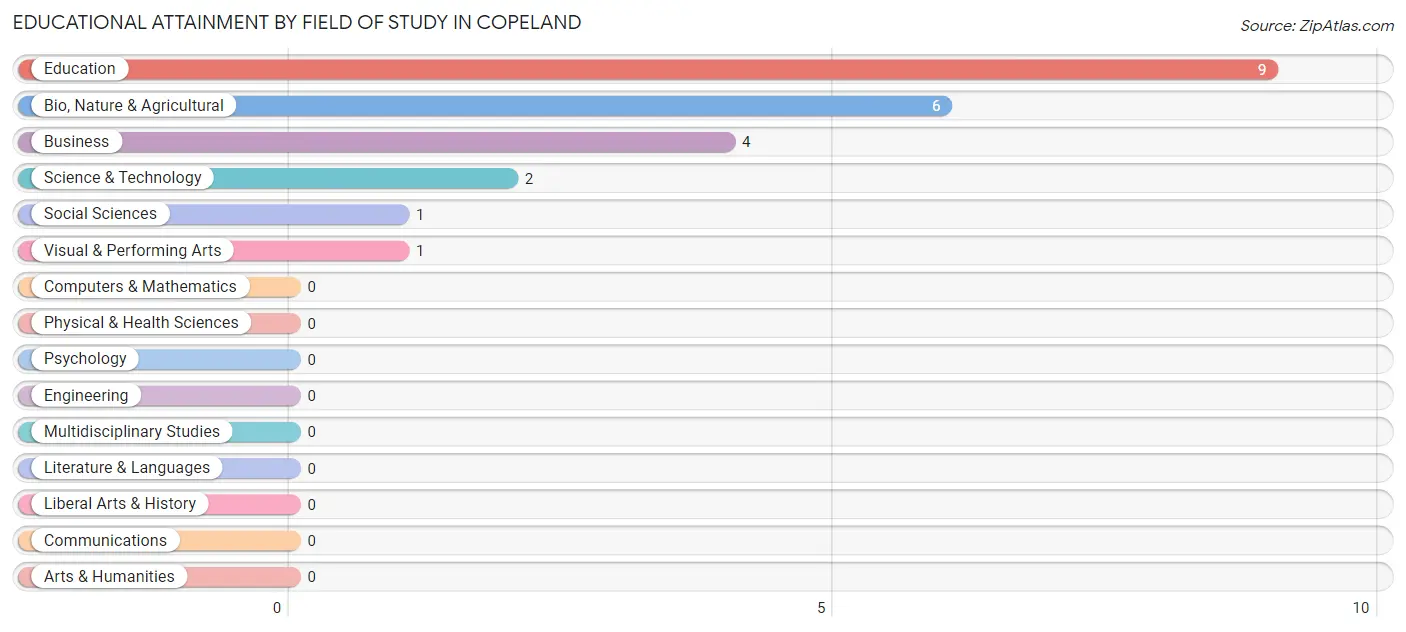
| Field of Study | # Graduates | % Graduates |
| Computers & Mathematics | 0 | 0.0% |
| Bio, Nature & Agricultural | 6 | 26.1% |
| Physical & Health Sciences | 0 | 0.0% |
| Psychology | 0 | 0.0% |
| Social Sciences | 1 | 4.3% |
| Engineering | 0 | 0.0% |
| Multidisciplinary Studies | 0 | 0.0% |
| Science & Technology | 2 | 8.7% |
| Business | 4 | 17.4% |
| Education | 9 | 39.1% |
| Literature & Languages | 0 | 0.0% |
| Liberal Arts & History | 0 | 0.0% |
| Visual & Performing Arts | 1 | 4.3% |
| Communications | 0 | 0.0% |
| Arts & Humanities | 0 | 0.0% |
| Total | 23 | 100.0% |
Transportation & Commute in Copeland
Vehicle Availability by Sex in Copeland
The most prevalent vehicle ownership categories in Copeland are males with 4 vehicles (66, accounting for 52.0%) and females with 4 vehicles (26, making up 117.9%).
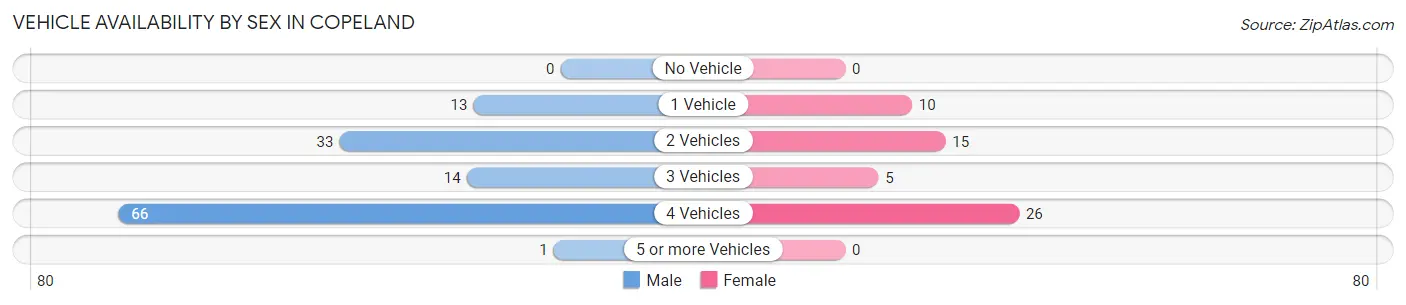
| Vehicles Available | Male | Female |
| No Vehicle | 0 (0.0%) | 0 (0.0%) |
| 1 Vehicle | 13 (10.2%) | 10 (17.9%) |
| 2 Vehicles | 33 (26.0%) | 15 (26.8%) |
| 3 Vehicles | 14 (11.0%) | 5 (8.9%) |
| 4 Vehicles | 66 (52.0%) | 26 (46.4%) |
| 5 or more Vehicles | 1 (0.8%) | 0 (0.0%) |
| Total | 127 (100.0%) | 56 (100.0%) |
Commute Time in Copeland
The most frequently occuring commute durations in Copeland are less than 5 minutes (59 commuters, 33.5%), 20 to 24 minutes (33 commuters, 18.8%), and 5 to 9 minutes (30 commuters, 17.1%).
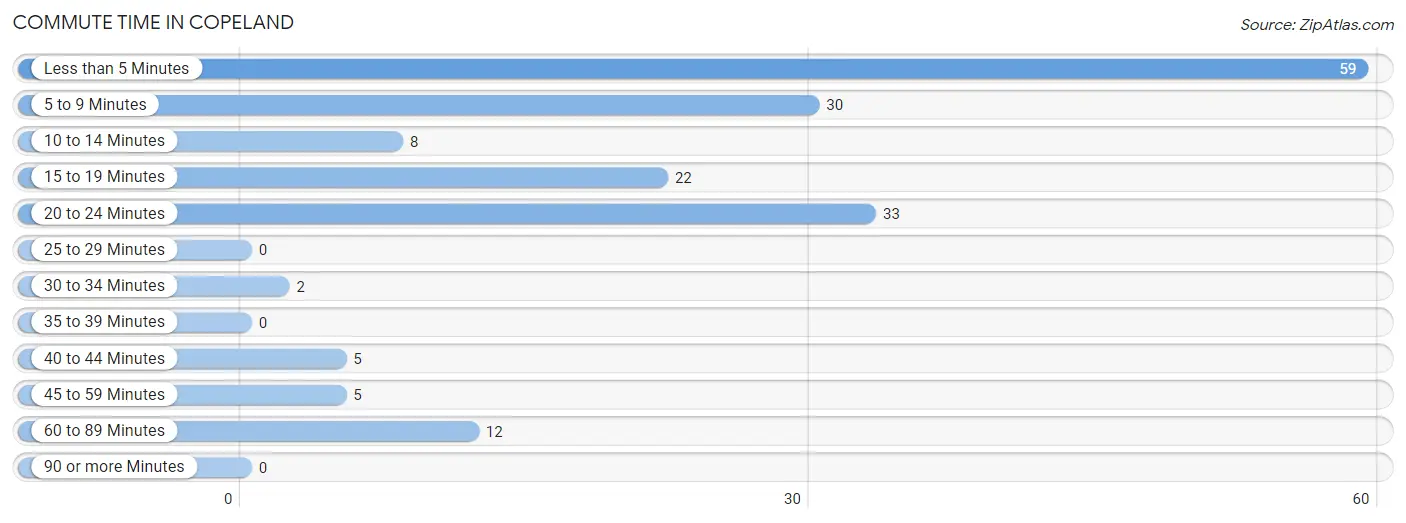
| Commute Time | # Commuters | % Commuters |
| Less than 5 Minutes | 59 | 33.5% |
| 5 to 9 Minutes | 30 | 17.1% |
| 10 to 14 Minutes | 8 | 4.5% |
| 15 to 19 Minutes | 22 | 12.5% |
| 20 to 24 Minutes | 33 | 18.8% |
| 25 to 29 Minutes | 0 | 0.0% |
| 30 to 34 Minutes | 2 | 1.1% |
| 35 to 39 Minutes | 0 | 0.0% |
| 40 to 44 Minutes | 5 | 2.8% |
| 45 to 59 Minutes | 5 | 2.8% |
| 60 to 89 Minutes | 12 | 6.8% |
| 90 or more Minutes | 0 | 0.0% |
Commute Time by Sex in Copeland
The most common commute times in Copeland are 20 to 24 minutes (33 commuters, 26.2%) for males and less than 5 minutes (29 commuters, 58.0%) for females.
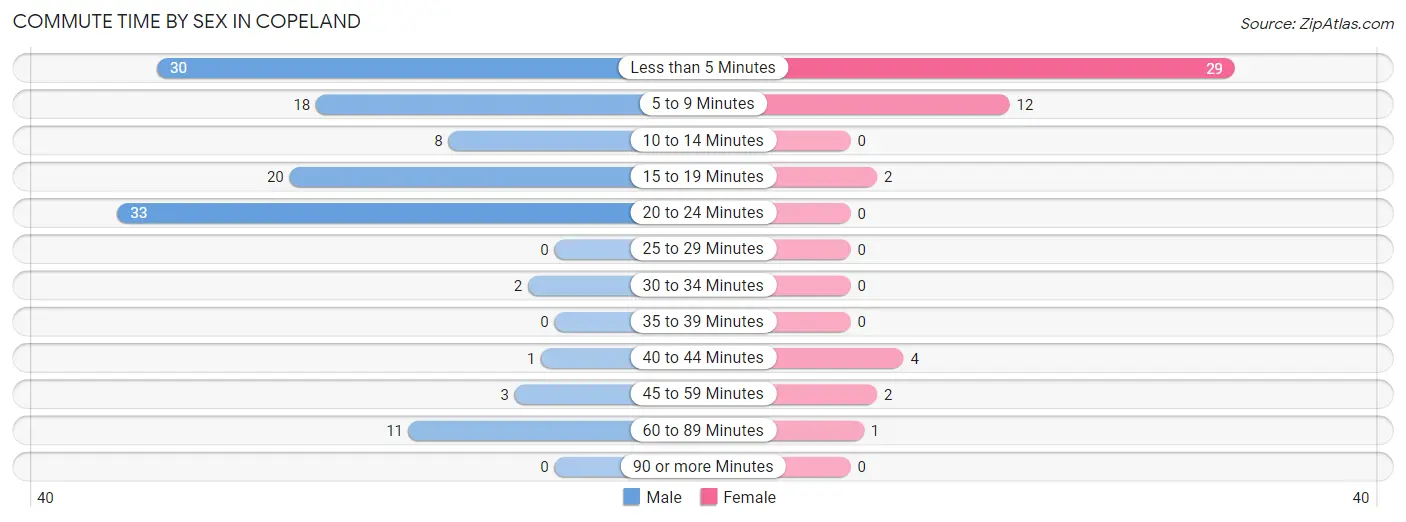
| Commute Time | Male | Female |
| Less than 5 Minutes | 30 (23.8%) | 29 (58.0%) |
| 5 to 9 Minutes | 18 (14.3%) | 12 (24.0%) |
| 10 to 14 Minutes | 8 (6.4%) | 0 (0.0%) |
| 15 to 19 Minutes | 20 (15.9%) | 2 (4.0%) |
| 20 to 24 Minutes | 33 (26.2%) | 0 (0.0%) |
| 25 to 29 Minutes | 0 (0.0%) | 0 (0.0%) |
| 30 to 34 Minutes | 2 (1.6%) | 0 (0.0%) |
| 35 to 39 Minutes | 0 (0.0%) | 0 (0.0%) |
| 40 to 44 Minutes | 1 (0.8%) | 4 (8.0%) |
| 45 to 59 Minutes | 3 (2.4%) | 2 (4.0%) |
| 60 to 89 Minutes | 11 (8.7%) | 1 (2.0%) |
| 90 or more Minutes | 0 (0.0%) | 0 (0.0%) |
Time of Departure to Work by Sex in Copeland
The most frequent times of departure to work in Copeland are 7:30 AM to 7:59 AM (46, 36.5%) for males and 6:30 AM to 6:59 AM (23, 46.0%) for females.
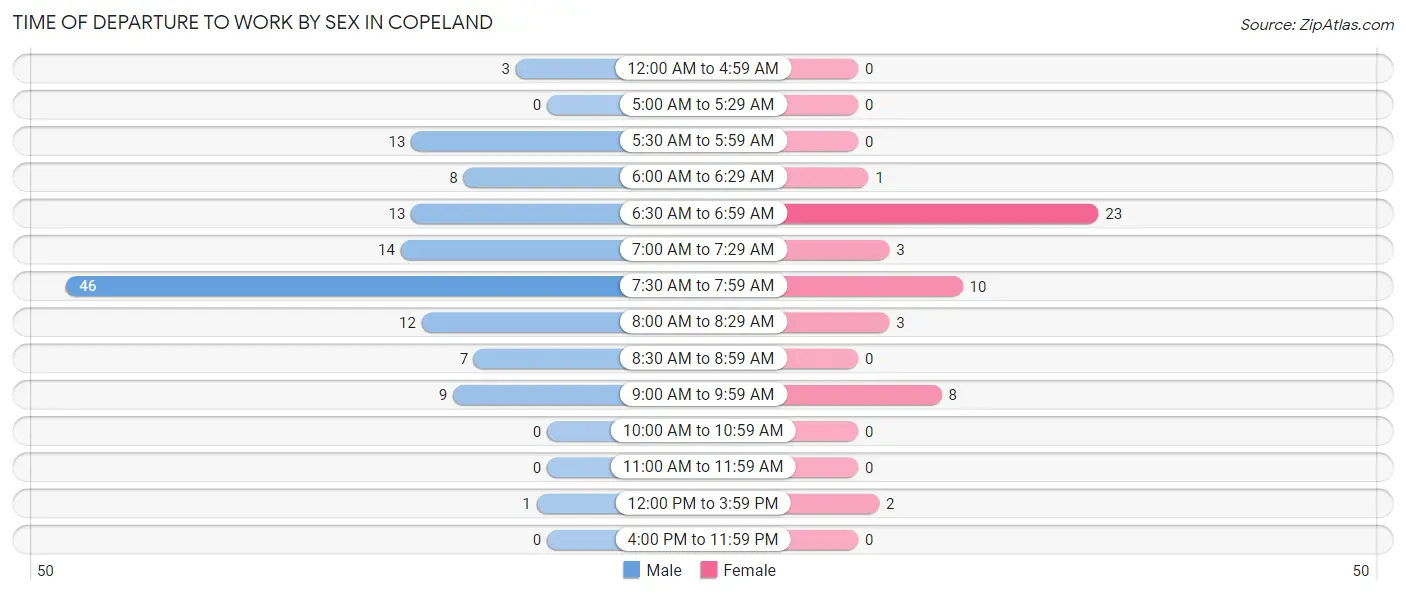
| Time of Departure | Male | Female |
| 12:00 AM to 4:59 AM | 3 (2.4%) | 0 (0.0%) |
| 5:00 AM to 5:29 AM | 0 (0.0%) | 0 (0.0%) |
| 5:30 AM to 5:59 AM | 13 (10.3%) | 0 (0.0%) |
| 6:00 AM to 6:29 AM | 8 (6.4%) | 1 (2.0%) |
| 6:30 AM to 6:59 AM | 13 (10.3%) | 23 (46.0%) |
| 7:00 AM to 7:29 AM | 14 (11.1%) | 3 (6.0%) |
| 7:30 AM to 7:59 AM | 46 (36.5%) | 10 (20.0%) |
| 8:00 AM to 8:29 AM | 12 (9.5%) | 3 (6.0%) |
| 8:30 AM to 8:59 AM | 7 (5.6%) | 0 (0.0%) |
| 9:00 AM to 9:59 AM | 9 (7.1%) | 8 (16.0%) |
| 10:00 AM to 10:59 AM | 0 (0.0%) | 0 (0.0%) |
| 11:00 AM to 11:59 AM | 0 (0.0%) | 0 (0.0%) |
| 12:00 PM to 3:59 PM | 1 (0.8%) | 2 (4.0%) |
| 4:00 PM to 11:59 PM | 0 (0.0%) | 0 (0.0%) |
| Total | 126 (100.0%) | 50 (100.0%) |
Housing Occupancy in Copeland
Occupancy by Ownership in Copeland
Of the total 189 dwellings in Copeland, owner-occupied units account for 171 (90.5%), while renter-occupied units make up 18 (9.5%).
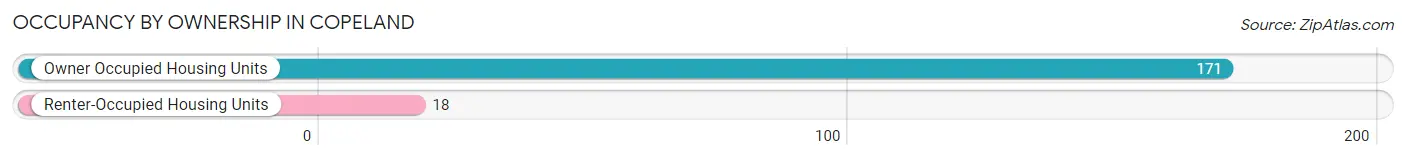
| Occupancy | # Housing Units | % Housing Units |
| Owner Occupied Housing Units | 171 | 90.5% |
| Renter-Occupied Housing Units | 18 | 9.5% |
| Total Occupied Housing Units | 189 | 100.0% |
Occupancy by Household Size in Copeland
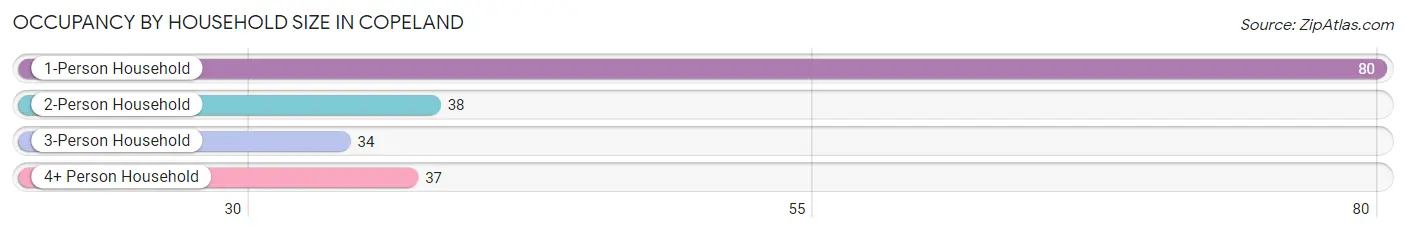
| Household Size | # Housing Units | % Housing Units |
| 1-Person Household | 80 | 42.3% |
| 2-Person Household | 38 | 20.1% |
| 3-Person Household | 34 | 18.0% |
| 4+ Person Household | 37 | 19.6% |
| Total Housing Units | 189 | 100.0% |
Occupancy by Ownership by Household Size in Copeland
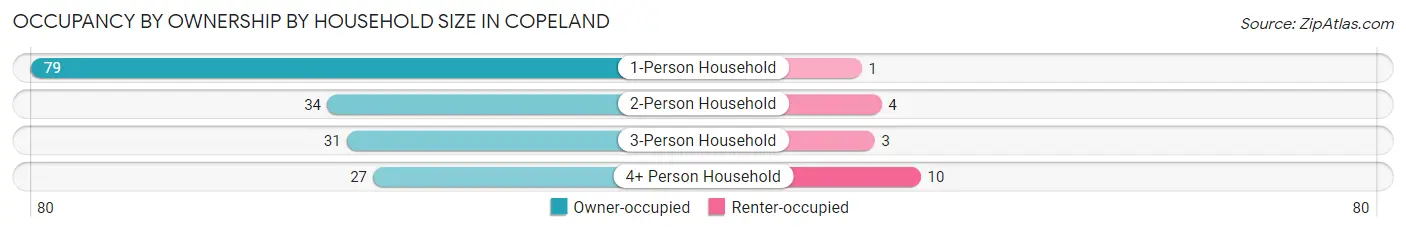
| Household Size | Owner-occupied | Renter-occupied |
| 1-Person Household | 79 (98.8%) | 1 (1.3%) |
| 2-Person Household | 34 (89.5%) | 4 (10.5%) |
| 3-Person Household | 31 (91.2%) | 3 (8.8%) |
| 4+ Person Household | 27 (73.0%) | 10 (27.0%) |
| Total Housing Units | 171 (90.5%) | 18 (9.5%) |
Occupancy by Educational Attainment in Copeland
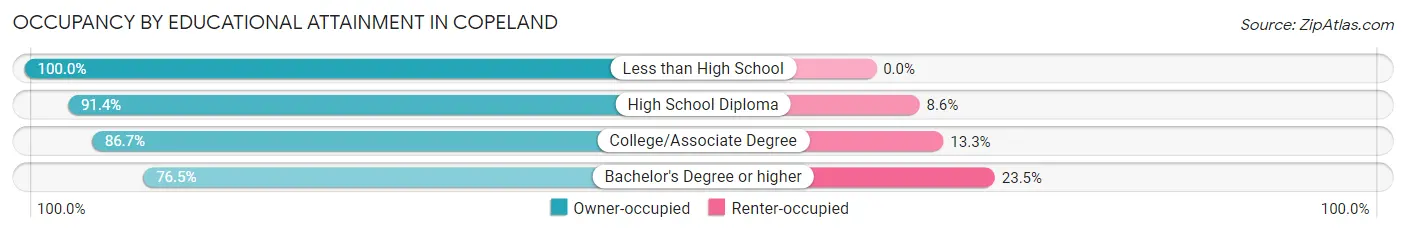
| Household Size | Owner-occupied | Renter-occupied |
| Less than High School | 34 (100.0%) | 0 (0.0%) |
| High School Diploma | 85 (91.4%) | 8 (8.6%) |
| College/Associate Degree | 39 (86.7%) | 6 (13.3%) |
| Bachelor's Degree or higher | 13 (76.5%) | 4 (23.5%) |
Occupancy by Age of Householder in Copeland
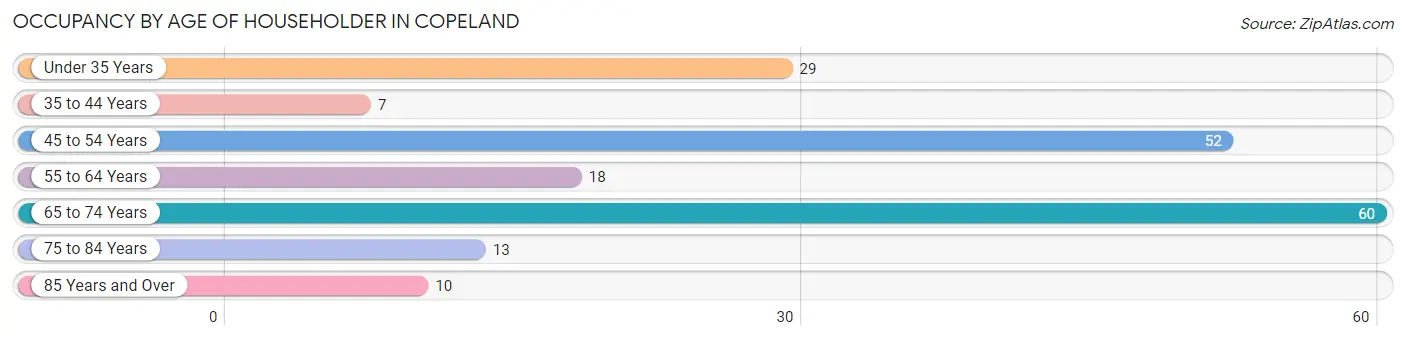
| Age Bracket | # Households | % Households |
| Under 35 Years | 29 | 15.3% |
| 35 to 44 Years | 7 | 3.7% |
| 45 to 54 Years | 52 | 27.5% |
| 55 to 64 Years | 18 | 9.5% |
| 65 to 74 Years | 60 | 31.8% |
| 75 to 84 Years | 13 | 6.9% |
| 85 Years and Over | 10 | 5.3% |
| Total | 189 | 100.0% |
Housing Finances in Copeland
Median Income by Occupancy in Copeland
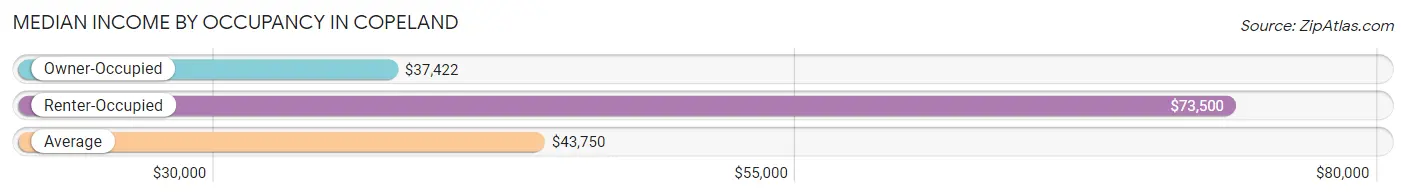
| Occupancy Type | # Households | Median Income |
| Owner-Occupied | 171 (90.5%) | $37,422 |
| Renter-Occupied | 18 (9.5%) | $73,500 |
| Average | 189 (100.0%) | $43,750 |
Occupancy by Householder Income Bracket in Copeland
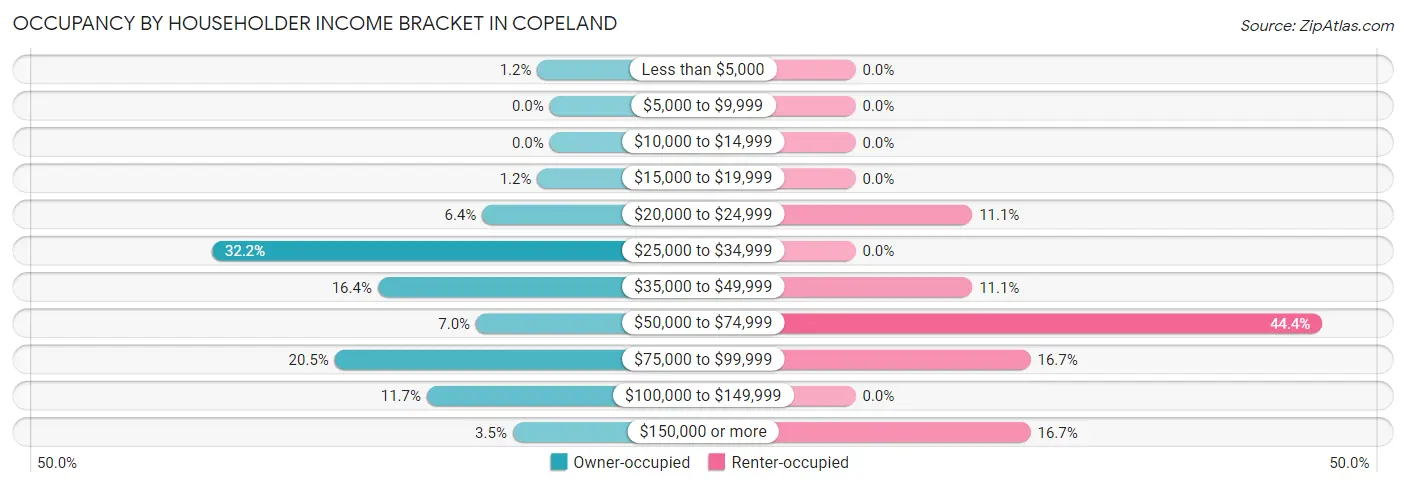
| Income Bracket | Owner-occupied | Renter-occupied |
| Less than $5,000 | 2 (1.2%) | 0 (0.0%) |
| $5,000 to $9,999 | 0 (0.0%) | 0 (0.0%) |
| $10,000 to $14,999 | 0 (0.0%) | 0 (0.0%) |
| $15,000 to $19,999 | 2 (1.2%) | 0 (0.0%) |
| $20,000 to $24,999 | 11 (6.4%) | 2 (11.1%) |
| $25,000 to $34,999 | 55 (32.2%) | 0 (0.0%) |
| $35,000 to $49,999 | 28 (16.4%) | 2 (11.1%) |
| $50,000 to $74,999 | 12 (7.0%) | 8 (44.4%) |
| $75,000 to $99,999 | 35 (20.5%) | 3 (16.7%) |
| $100,000 to $149,999 | 20 (11.7%) | 0 (0.0%) |
| $150,000 or more | 6 (3.5%) | 3 (16.7%) |
| Total | 171 (100.0%) | 18 (100.0%) |
Monthly Housing Cost Tiers in Copeland
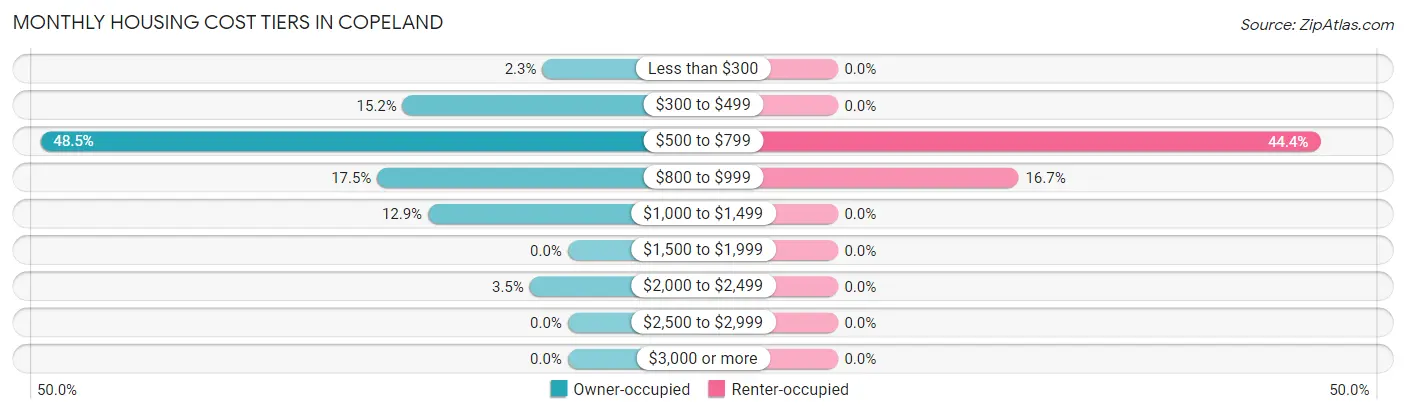
| Monthly Cost | Owner-occupied | Renter-occupied |
| Less than $300 | 4 (2.3%) | 0 (0.0%) |
| $300 to $499 | 26 (15.2%) | 0 (0.0%) |
| $500 to $799 | 83 (48.5%) | 8 (44.4%) |
| $800 to $999 | 30 (17.5%) | 3 (16.7%) |
| $1,000 to $1,499 | 22 (12.9%) | 0 (0.0%) |
| $1,500 to $1,999 | 0 (0.0%) | 0 (0.0%) |
| $2,000 to $2,499 | 6 (3.5%) | 0 (0.0%) |
| $2,500 to $2,999 | 0 (0.0%) | 0 (0.0%) |
| $3,000 or more | 0 (0.0%) | 0 (0.0%) |
| Total | 171 (100.0%) | 18 (100.0%) |
Physical Housing Characteristics in Copeland
Housing Structures in Copeland
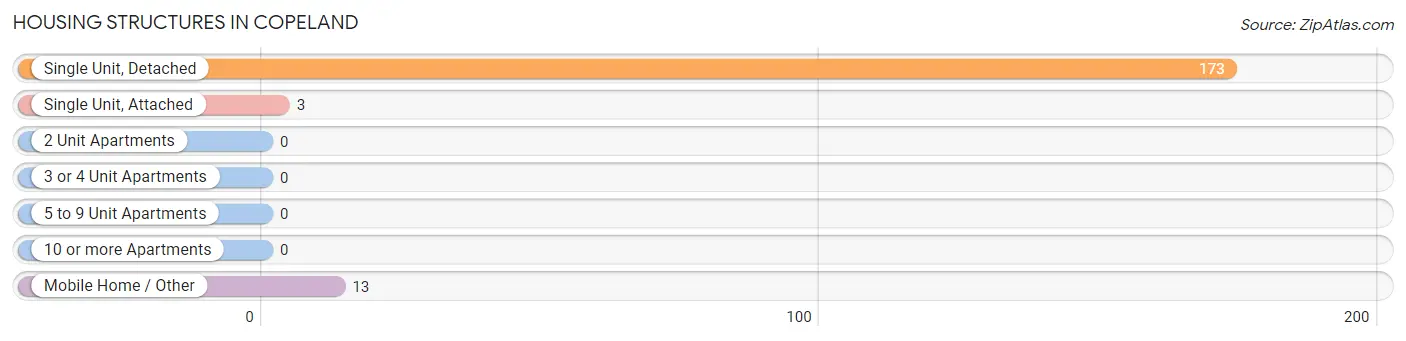
| Structure Type | # Housing Units | % Housing Units |
| Single Unit, Detached | 173 | 91.5% |
| Single Unit, Attached | 3 | 1.6% |
| 2 Unit Apartments | 0 | 0.0% |
| 3 or 4 Unit Apartments | 0 | 0.0% |
| 5 to 9 Unit Apartments | 0 | 0.0% |
| 10 or more Apartments | 0 | 0.0% |
| Mobile Home / Other | 13 | 6.9% |
| Total | 189 | 100.0% |
Housing Structures by Occupancy in Copeland
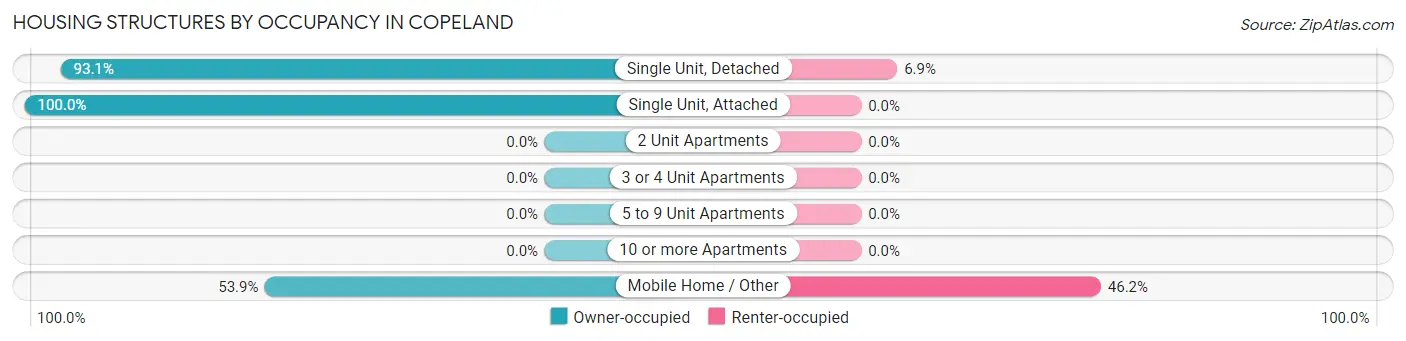
| Structure Type | Owner-occupied | Renter-occupied |
| Single Unit, Detached | 161 (93.1%) | 12 (6.9%) |
| Single Unit, Attached | 3 (100.0%) | 0 (0.0%) |
| 2 Unit Apartments | 0 (0.0%) | 0 (0.0%) |
| 3 or 4 Unit Apartments | 0 (0.0%) | 0 (0.0%) |
| 5 to 9 Unit Apartments | 0 (0.0%) | 0 (0.0%) |
| 10 or more Apartments | 0 (0.0%) | 0 (0.0%) |
| Mobile Home / Other | 7 (53.8%) | 6 (46.2%) |
| Total | 171 (90.5%) | 18 (9.5%) |
Housing Structures by Number of Rooms in Copeland
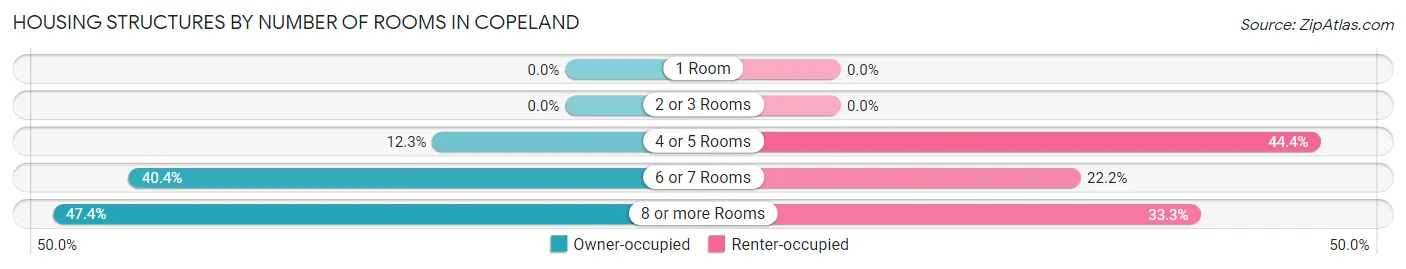
| Number of Rooms | Owner-occupied | Renter-occupied |
| 1 Room | 0 (0.0%) | 0 (0.0%) |
| 2 or 3 Rooms | 0 (0.0%) | 0 (0.0%) |
| 4 or 5 Rooms | 21 (12.3%) | 8 (44.4%) |
| 6 or 7 Rooms | 69 (40.4%) | 4 (22.2%) |
| 8 or more Rooms | 81 (47.4%) | 6 (33.3%) |
| Total | 171 (100.0%) | 18 (100.0%) |
Housing Structure by Heating Type in Copeland
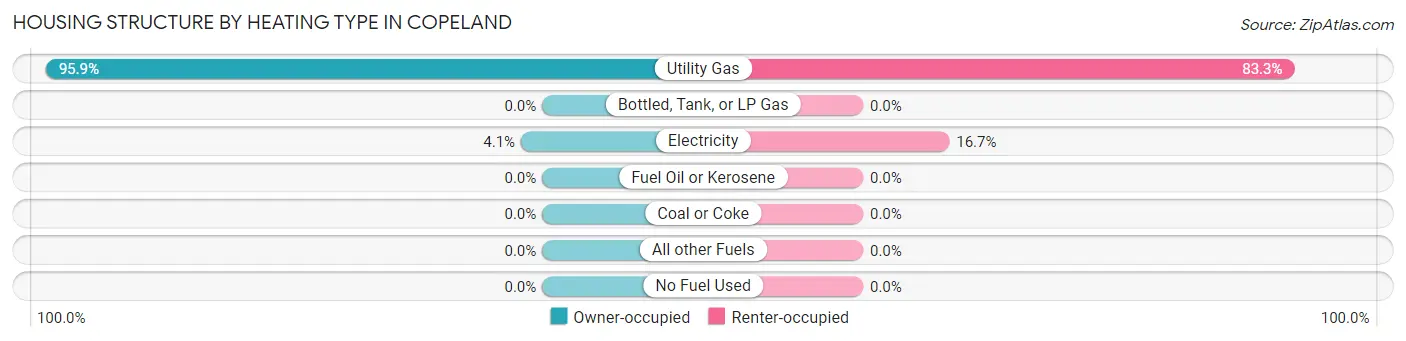
| Heating Type | Owner-occupied | Renter-occupied |
| Utility Gas | 164 (95.9%) | 15 (83.3%) |
| Bottled, Tank, or LP Gas | 0 (0.0%) | 0 (0.0%) |
| Electricity | 7 (4.1%) | 3 (16.7%) |
| Fuel Oil or Kerosene | 0 (0.0%) | 0 (0.0%) |
| Coal or Coke | 0 (0.0%) | 0 (0.0%) |
| All other Fuels | 0 (0.0%) | 0 (0.0%) |
| No Fuel Used | 0 (0.0%) | 0 (0.0%) |
| Total | 171 (100.0%) | 18 (100.0%) |
Household Vehicle Usage in Copeland
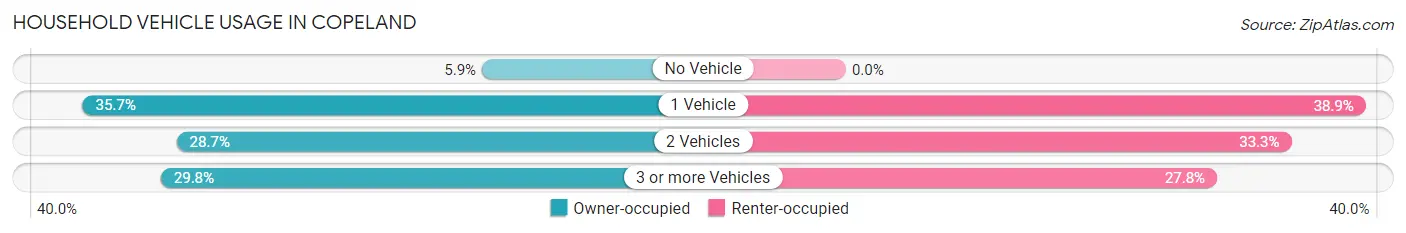
| Vehicles per Household | Owner-occupied | Renter-occupied |
| No Vehicle | 10 (5.9%) | 0 (0.0%) |
| 1 Vehicle | 61 (35.7%) | 7 (38.9%) |
| 2 Vehicles | 49 (28.6%) | 6 (33.3%) |
| 3 or more Vehicles | 51 (29.8%) | 5 (27.8%) |
| Total | 171 (100.0%) | 18 (100.0%) |
Real Estate & Mortgages in Copeland
Real Estate and Mortgage Overview in Copeland
| Characteristic | Without Mortgage | With Mortgage |
| Housing Units | 115 | 56 |
| Median Property Value | - | - |
| Median Household Income | $29,639 | $2 |
| Monthly Housing Costs | $536 | $0 |
| Real Estate Taxes | $3,000 | $0 |
Property Value by Mortgage Status in Copeland
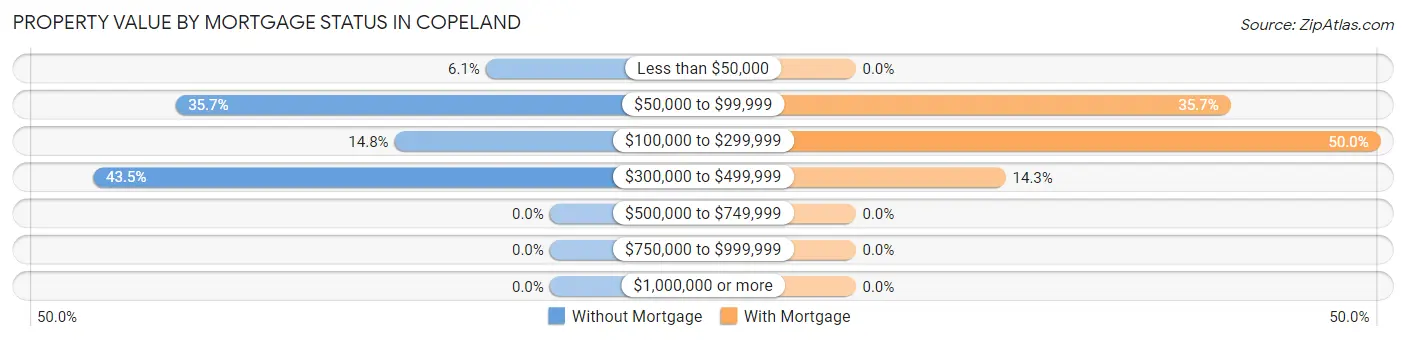
| Property Value | Without Mortgage | With Mortgage |
| Less than $50,000 | 7 (6.1%) | 0 (0.0%) |
| $50,000 to $99,999 | 41 (35.6%) | 20 (35.7%) |
| $100,000 to $299,999 | 17 (14.8%) | 28 (50.0%) |
| $300,000 to $499,999 | 50 (43.5%) | 8 (14.3%) |
| $500,000 to $749,999 | 0 (0.0%) | 0 (0.0%) |
| $750,000 to $999,999 | 0 (0.0%) | 0 (0.0%) |
| $1,000,000 or more | 0 (0.0%) | 0 (0.0%) |
| Total | 115 (100.0%) | 56 (100.0%) |
Household Income by Mortgage Status in Copeland
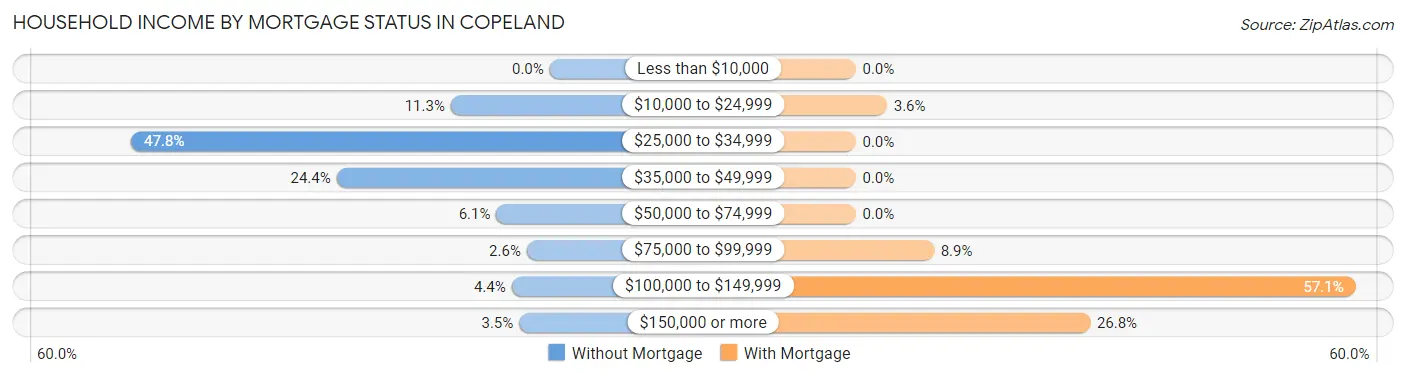
| Household Income | Without Mortgage | With Mortgage |
| Less than $10,000 | 0 (0.0%) | 0 (0.0%) |
| $10,000 to $24,999 | 13 (11.3%) | 2 (3.6%) |
| $25,000 to $34,999 | 55 (47.8%) | 0 (0.0%) |
| $35,000 to $49,999 | 28 (24.3%) | 0 (0.0%) |
| $50,000 to $74,999 | 7 (6.1%) | 0 (0.0%) |
| $75,000 to $99,999 | 3 (2.6%) | 5 (8.9%) |
| $100,000 to $149,999 | 5 (4.3%) | 32 (57.1%) |
| $150,000 or more | 4 (3.5%) | 15 (26.8%) |
| Total | 115 (100.0%) | 56 (100.0%) |
Property Value to Household Income Ratio in Copeland
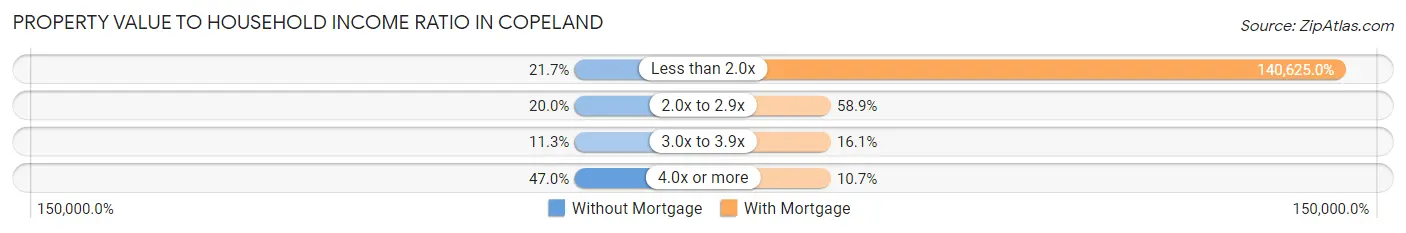
| Value-to-Income Ratio | Without Mortgage | With Mortgage |
| Less than 2.0x | 25 (21.7%) | 78,750 (140,625.0%) |
| 2.0x to 2.9x | 23 (20.0%) | 33 (58.9%) |
| 3.0x to 3.9x | 13 (11.3%) | 9 (16.1%) |
| 4.0x or more | 54 (47.0%) | 6 (10.7%) |
| Total | 115 (100.0%) | 56 (100.0%) |
Real Estate Taxes by Mortgage Status in Copeland
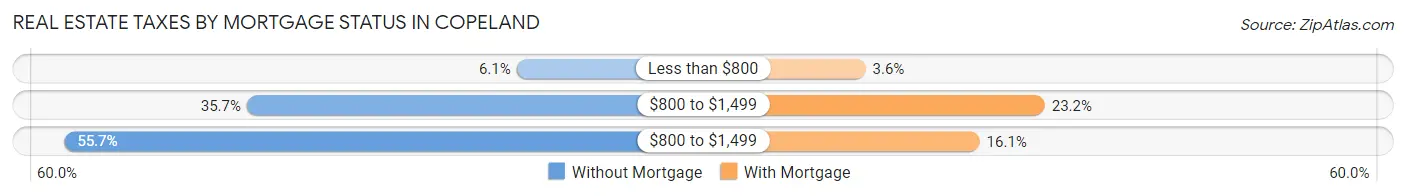
| Property Taxes | Without Mortgage | With Mortgage |
| Less than $800 | 7 (6.1%) | 2 (3.6%) |
| $800 to $1,499 | 41 (35.6%) | 13 (23.2%) |
| $800 to $1,499 | 64 (55.6%) | 9 (16.1%) |
| Total | 115 (100.0%) | 56 (100.0%) |
Health & Disability in Copeland
Health Insurance Coverage by Age in Copeland
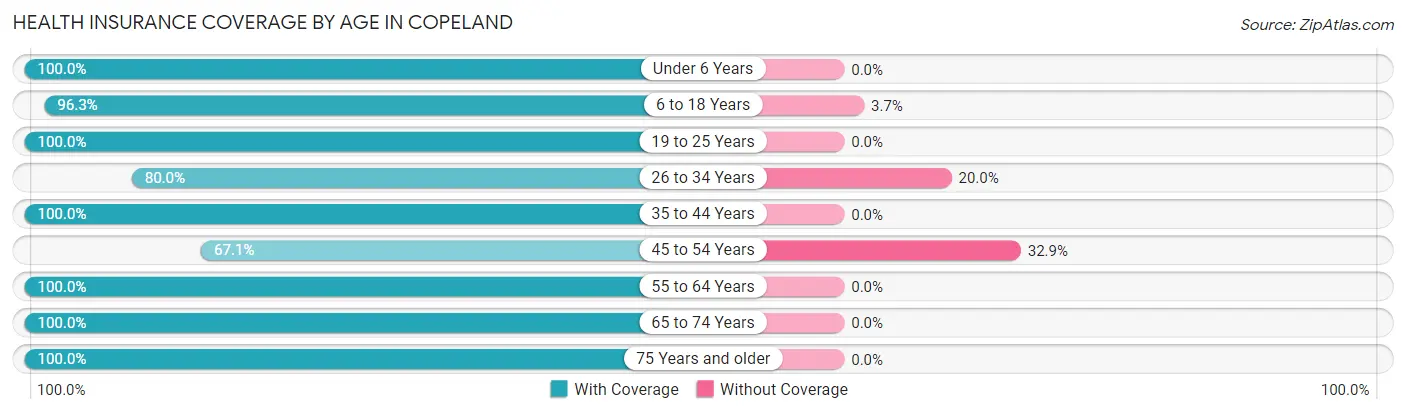
| Age Bracket | With Coverage | Without Coverage |
| Under 6 Years | 29 (100.0%) | 0 (0.0%) |
| 6 to 18 Years | 104 (96.3%) | 4 (3.7%) |
| 19 to 25 Years | 51 (100.0%) | 0 (0.0%) |
| 26 to 34 Years | 48 (80.0%) | 12 (20.0%) |
| 35 to 44 Years | 7 (100.0%) | 0 (0.0%) |
| 45 to 54 Years | 53 (67.1%) | 26 (32.9%) |
| 55 to 64 Years | 24 (100.0%) | 0 (0.0%) |
| 65 to 74 Years | 65 (100.0%) | 0 (0.0%) |
| 75 Years and older | 29 (100.0%) | 0 (0.0%) |
| Total | 410 (90.7%) | 42 (9.3%) |
Health Insurance Coverage by Citizenship Status in Copeland
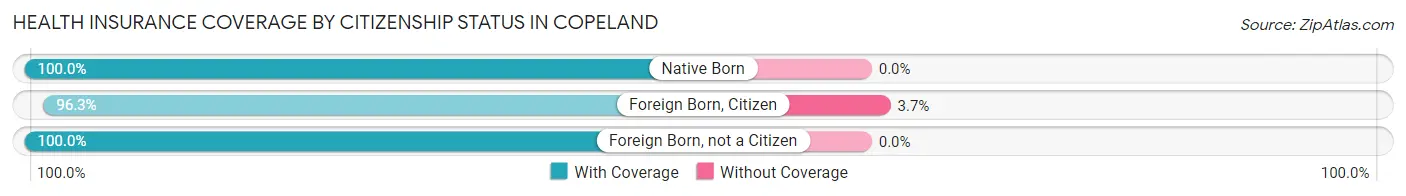
| Citizenship Status | With Coverage | Without Coverage |
| Native Born | 29 (100.0%) | 0 (0.0%) |
| Foreign Born, Citizen | 104 (96.3%) | 4 (3.7%) |
| Foreign Born, not a Citizen | 51 (100.0%) | 0 (0.0%) |
Health Insurance Coverage by Household Income in Copeland
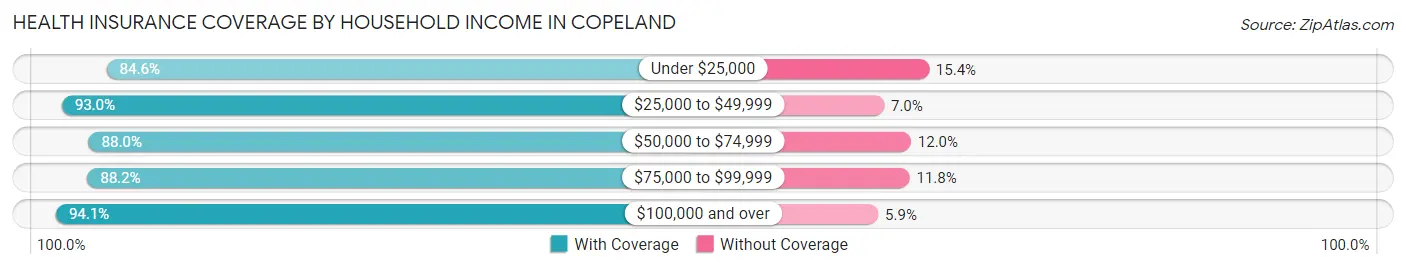
| Household Income | With Coverage | Without Coverage |
| Under $25,000 | 22 (84.6%) | 4 (15.4%) |
| $25,000 to $49,999 | 160 (93.0%) | 12 (7.0%) |
| $50,000 to $74,999 | 44 (88.0%) | 6 (12.0%) |
| $75,000 to $99,999 | 120 (88.2%) | 16 (11.8%) |
| $100,000 and over | 64 (94.1%) | 4 (5.9%) |
Public vs Private Health Insurance Coverage by Age in Copeland
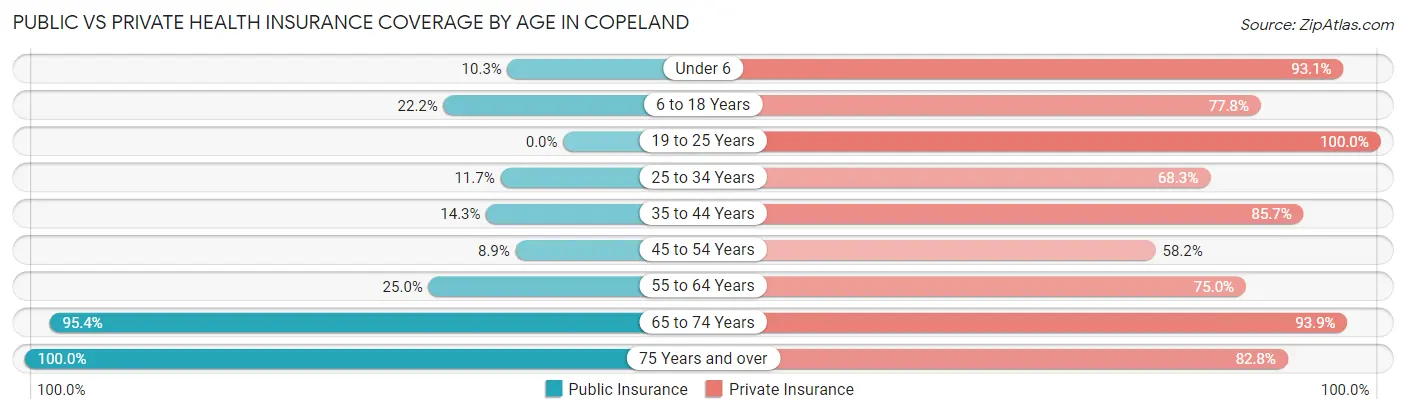
| Age Bracket | Public Insurance | Private Insurance |
| Under 6 | 3 (10.3%) | 27 (93.1%) |
| 6 to 18 Years | 24 (22.2%) | 84 (77.8%) |
| 19 to 25 Years | 0 (0.0%) | 51 (100.0%) |
| 25 to 34 Years | 7 (11.7%) | 41 (68.3%) |
| 35 to 44 Years | 1 (14.3%) | 6 (85.7%) |
| 45 to 54 Years | 7 (8.9%) | 46 (58.2%) |
| 55 to 64 Years | 6 (25.0%) | 18 (75.0%) |
| 65 to 74 Years | 62 (95.4%) | 61 (93.9%) |
| 75 Years and over | 29 (100.0%) | 24 (82.8%) |
| Total | 139 (30.7%) | 358 (79.2%) |
Disability Status by Sex by Age in Copeland
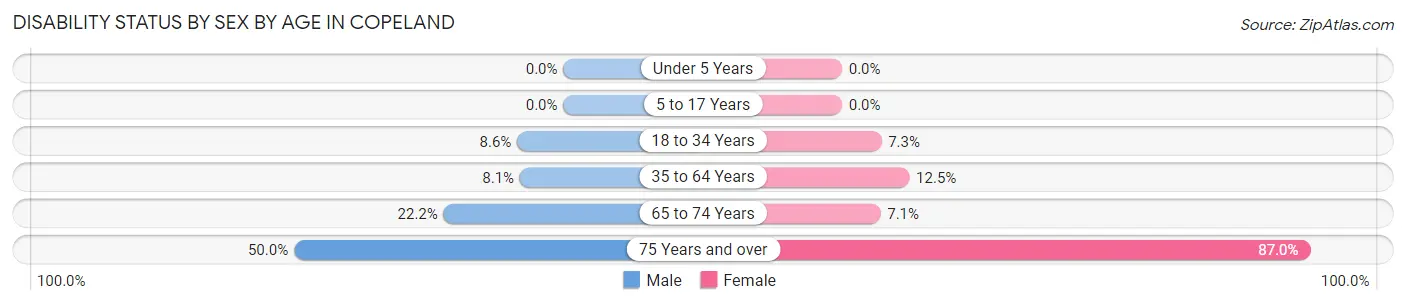
| Age Bracket | Male | Female |
| Under 5 Years | 0 (0.0%) | 0 (0.0%) |
| 5 to 17 Years | 0 (0.0%) | 0 (0.0%) |
| 18 to 34 Years | 6 (8.6%) | 3 (7.3%) |
| 35 to 64 Years | 5 (8.1%) | 6 (12.5%) |
| 65 to 74 Years | 2 (22.2%) | 4 (7.1%) |
| 75 Years and over | 3 (50.0%) | 20 (87.0%) |
Disability Class by Sex by Age in Copeland
Disability Class: Hearing Difficulty
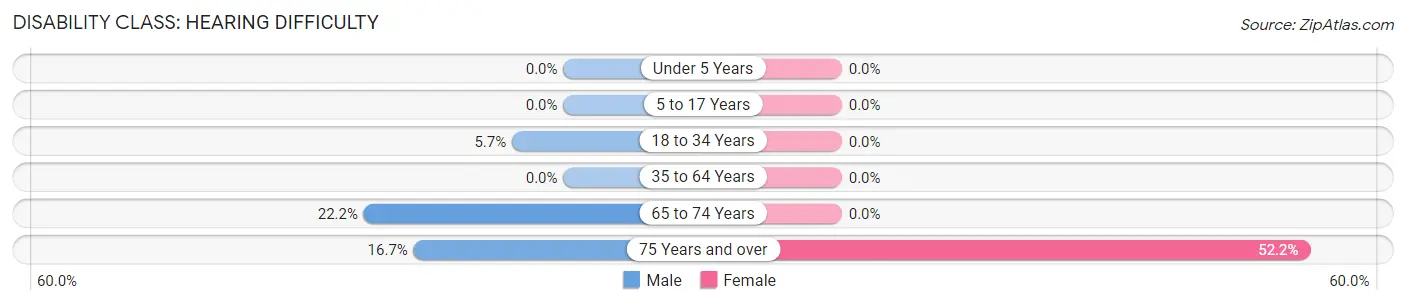
| Age Bracket | Male | Female |
| Under 5 Years | 0 (0.0%) | 0 (0.0%) |
| 5 to 17 Years | 0 (0.0%) | 0 (0.0%) |
| 18 to 34 Years | 4 (5.7%) | 0 (0.0%) |
| 35 to 64 Years | 0 (0.0%) | 0 (0.0%) |
| 65 to 74 Years | 2 (22.2%) | 0 (0.0%) |
| 75 Years and over | 1 (16.7%) | 12 (52.2%) |
Disability Class: Vision Difficulty
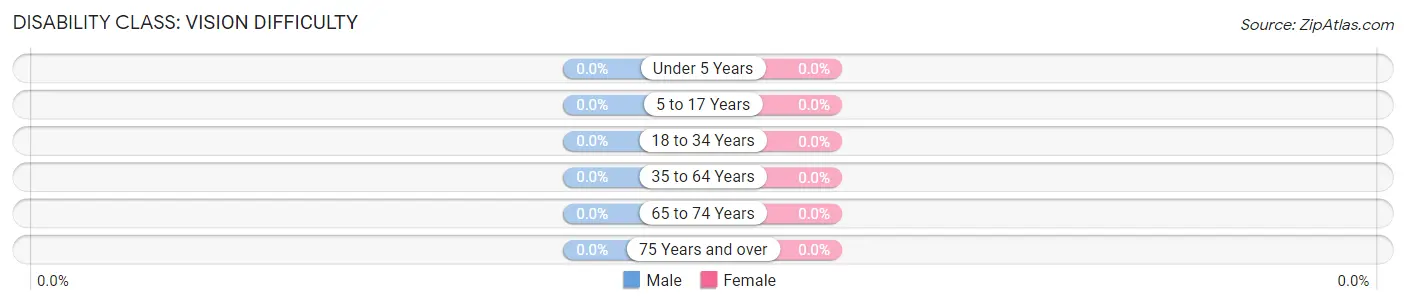
| Age Bracket | Male | Female |
| Under 5 Years | 0 (0.0%) | 0 (0.0%) |
| 5 to 17 Years | 0 (0.0%) | 0 (0.0%) |
| 18 to 34 Years | 0 (0.0%) | 0 (0.0%) |
| 35 to 64 Years | 0 (0.0%) | 0 (0.0%) |
| 65 to 74 Years | 0 (0.0%) | 0 (0.0%) |
| 75 Years and over | 0 (0.0%) | 0 (0.0%) |
Disability Class: Cognitive Difficulty
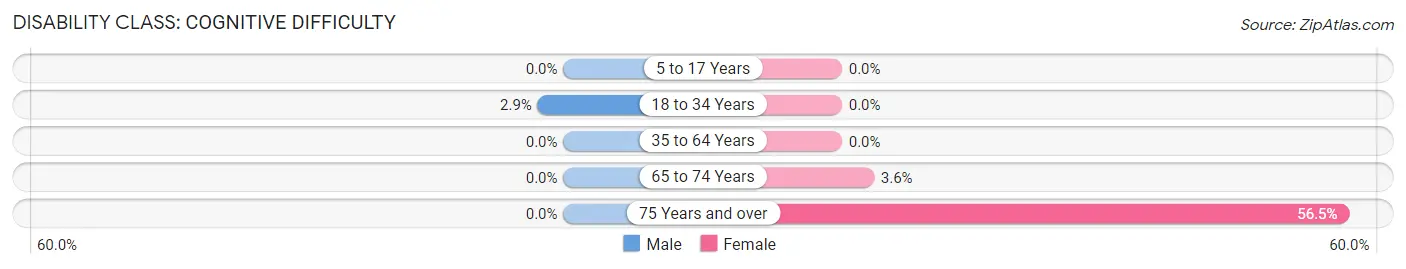
| Age Bracket | Male | Female |
| 5 to 17 Years | 0 (0.0%) | 0 (0.0%) |
| 18 to 34 Years | 2 (2.9%) | 0 (0.0%) |
| 35 to 64 Years | 0 (0.0%) | 0 (0.0%) |
| 65 to 74 Years | 0 (0.0%) | 2 (3.6%) |
| 75 Years and over | 0 (0.0%) | 13 (56.5%) |
Disability Class: Ambulatory Difficulty
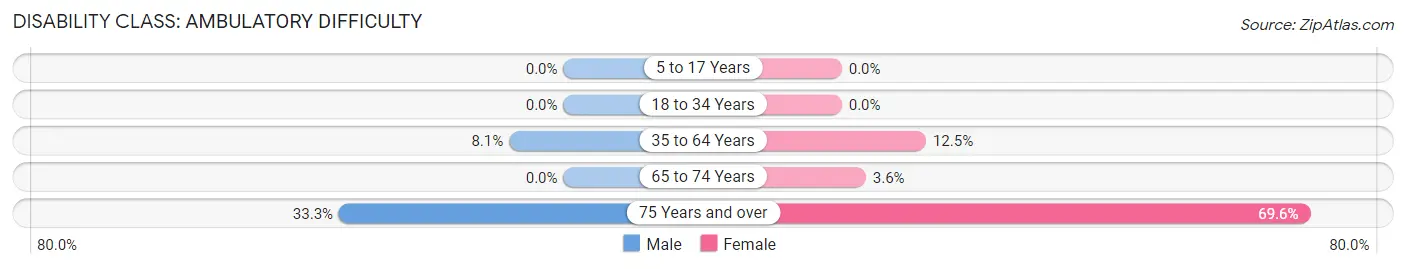
| Age Bracket | Male | Female |
| 5 to 17 Years | 0 (0.0%) | 0 (0.0%) |
| 18 to 34 Years | 0 (0.0%) | 0 (0.0%) |
| 35 to 64 Years | 5 (8.1%) | 6 (12.5%) |
| 65 to 74 Years | 0 (0.0%) | 2 (3.6%) |
| 75 Years and over | 2 (33.3%) | 16 (69.6%) |
Disability Class: Self-Care Difficulty
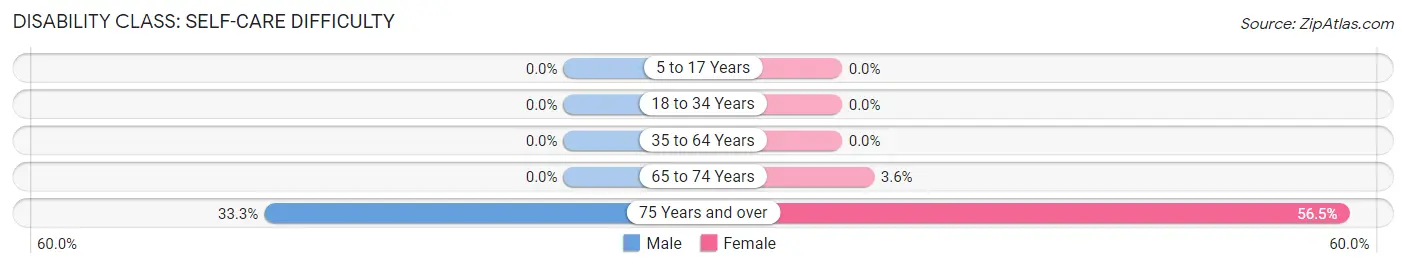
| Age Bracket | Male | Female |
| 5 to 17 Years | 0 (0.0%) | 0 (0.0%) |
| 18 to 34 Years | 0 (0.0%) | 0 (0.0%) |
| 35 to 64 Years | 0 (0.0%) | 0 (0.0%) |
| 65 to 74 Years | 0 (0.0%) | 2 (3.6%) |
| 75 Years and over | 2 (33.3%) | 13 (56.5%) |
Technology Access in Copeland
Computing Device Access in Copeland
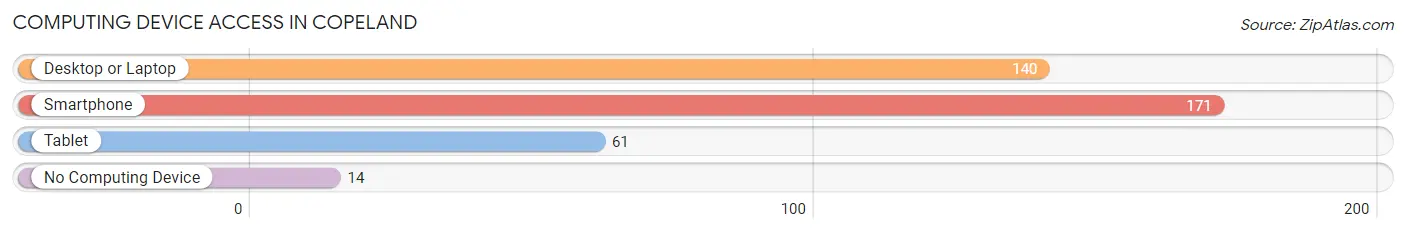
| Device Type | # Households | % Households |
| Desktop or Laptop | 140 | 74.1% |
| Smartphone | 171 | 90.5% |
| Tablet | 61 | 32.3% |
| No Computing Device | 14 | 7.4% |
| Total | 189 | 100.0% |
Internet Access in Copeland
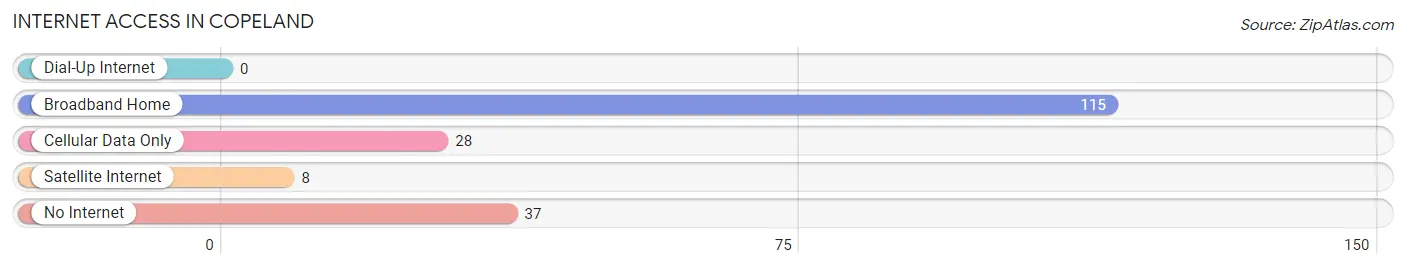
| Internet Type | # Households | % Households |
| Dial-Up Internet | 0 | 0.0% |
| Broadband Home | 115 | 60.9% |
| Cellular Data Only | 28 | 14.8% |
| Satellite Internet | 8 | 4.2% |
| No Internet | 37 | 19.6% |
| Total | 189 | 100.0% |
Copeland Summary
Copeland, Kansas is a small town located in the southwestern corner of the state. It is situated in Gray County, and is part of the Dodge City, Kansas Metropolitan Statistical Area. The town was founded in 1885 and has a population of approximately 200 people.
Geography
Copeland is located in the southwestern corner of Kansas, in Gray County. It is situated at an elevation of 2,845 feet above sea level. The town is located on the western edge of the High Plains, and is surrounded by rolling hills and prairies. The nearest major city is Dodge City, which is located approximately 30 miles to the east.
The climate in Copeland is semi-arid, with hot summers and cold winters. The average annual temperature is 54 degrees Fahrenheit, and the average annual precipitation is 17.5 inches.
Economy
The economy of Copeland is largely based on agriculture. The town is home to several farms, which produce wheat, corn, and other crops. The town also has a small manufacturing sector, which produces a variety of products, including furniture and clothing.
Demographics
As of the 2010 census, the population of Copeland was 200 people. The racial makeup of the town was 97.5% White, 0.5% African American, 0.5% Native American, and 1.5% from other races. The median household income was $37,500, and the median family income was $41,250.
The town is served by the Copeland Unified School District, which consists of one elementary school and one high school. The town also has a public library, which is part of the Southwest Kansas Library System.
History
Copeland was founded in 1885 by a group of settlers from Missouri. The town was named after a local rancher, William Copeland. The town grew slowly, and by the early 1900s, it had a population of around 200 people.
In the early 1900s, the town was home to several businesses, including a general store, a blacksmith shop, and a hotel. The town also had a post office, which was established in 1887.
In the 1920s, the town experienced a period of growth, as the population increased to around 500 people. During this time, the town was home to several businesses, including a bank, a newspaper, and a movie theater.
In the 1950s, the town experienced a period of decline, as the population decreased to around 200 people. The decline was due to the decline of the local agricultural industry, as well as the lack of economic opportunities in the area.
Today, Copeland is a small, rural town with a population of around 200 people. The town is home to several businesses, including a general store, a gas station, and a restaurant. The town also has a post office, a public library, and a school.
Common Questions
What is Per Capita Income in Copeland?
Per Capita income in Copeland is $27,921.
What is the Median Family Income in Copeland?
Median Family Income in Copeland is $76,023.
What is the Median Household income in Copeland?
Median Household Income in Copeland is $43,750.
What is Inequality or Gini Index in Copeland?
Inequality or Gini Index in Copeland is 0.40.
What is the Total Population of Copeland?
Total Population of Copeland is 452.
What is the Total Male Population of Copeland?
Total Male Population of Copeland is 245.
What is the Total Female Population of Copeland?
Total Female Population of Copeland is 207.
What is the Ratio of Males per 100 Females in Copeland?
There are 118.36 Males per 100 Females in Copeland.
What is the Ratio of Females per 100 Males in Copeland?
There are 84.49 Females per 100 Males in Copeland.
What is the Median Population Age in Copeland?
Median Population Age in Copeland is 31.5 Years.
What is the Average Family Size in Copeland
Average Family Size in Copeland is 3.4 People.
What is the Average Household Size in Copeland
Average Household Size in Copeland is 2.4 People.
How Large is the Labor Force in Copeland?
There are 189 People in the Labor Forcein in Copeland.
What is the Percentage of People in the Labor Force in Copeland?
50.9% of People are in the Labor Force in Copeland.
What is the Unemployment Rate in Copeland?
Unemployment Rate in Copeland is 3.2%.