Colby, KS Map & Demographics
Colby Map
Colby Overview
$31,570
PER CAPITA INCOME
$82,212
AVG FAMILY INCOME
$62,937
AVG HOUSEHOLD INCOME
45.0%
WAGE / INCOME GAP [ % ]
55.0¢/ $1
WAGE / INCOME GAP [ $ ]
0.44
INEQUALITY / GINI INDEX
5,403
TOTAL POPULATION
2,741
MALE POPULATION
2,662
FEMALE POPULATION
102.97
MALES / 100 FEMALES
97.12
FEMALES / 100 MALES
32.3
MEDIAN AGE
3.2
AVG FAMILY SIZE
2.4
AVG HOUSEHOLD SIZE
2,771
LABOR FORCE [ PEOPLE ]
67.3%
PERCENT IN LABOR FORCE
0.4%
UNEMPLOYMENT RATE
Colby Zip Codes
Colby Area Codes
Income in Colby
Income Overview in Colby
Per Capita Income in Colby is $31,570, while median incomes of families and households are $82,212 and $62,937 respectively.
| Characteristic | Number | Measure |
| Per Capita Income | 5,403 | $31,570 |
| Median Family Income | 1,217 | $82,212 |
| Mean Family Income | 1,217 | $93,375 |
| Median Household Income | 2,118 | $62,937 |
| Mean Household Income | 2,118 | $77,793 |
| Income Deficit | 1,217 | $0 |
| Wage / Income Gap (%) | 5,403 | 44.99% |
| Wage / Income Gap ($) | 5,403 | 55.01¢ per $1 |
| Gini / Inequality Index | 5,403 | 0.44 |
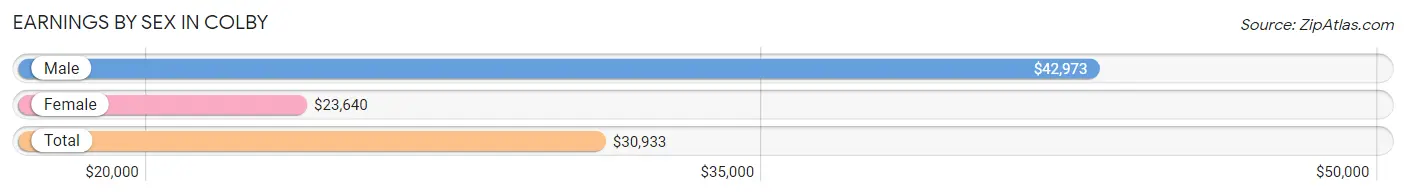
Earnings by Sex in Colby
Average Earnings in Colby are $30,933, $42,973 for men and $23,640 for women, a difference of 45.0%.
| Sex | Number | Average Earnings |
| Male | 1,598 (51.1%) | $42,973 |
| Female | 1,526 (48.8%) | $23,640 |
| Total | 3,124 (100.0%) | $30,933 |
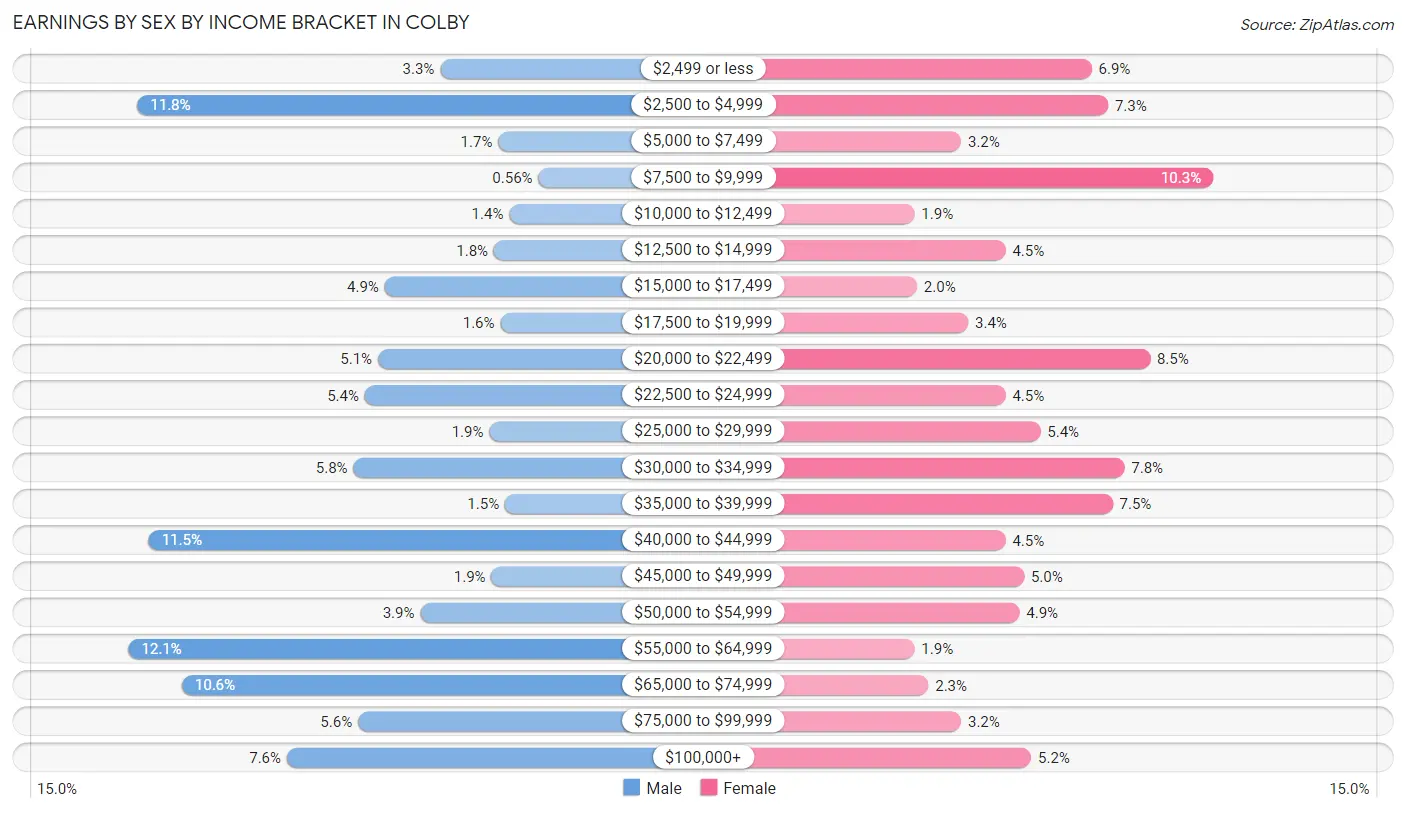
Earnings by Sex by Income Bracket in Colby
The most common earnings brackets in Colby are $55,000 to $64,999 for men (193 | 12.1%) and $7,500 to $9,999 for women (157 | 10.3%).
| Income | Male | Female |
| $2,499 or less | 53 (3.3%) | 105 (6.9%) |
| $2,500 to $4,999 | 189 (11.8%) | 112 (7.3%) |
| $5,000 to $7,499 | 27 (1.7%) | 49 (3.2%) |
| $7,500 to $9,999 | 9 (0.6%) | 157 (10.3%) |
| $10,000 to $12,499 | 22 (1.4%) | 29 (1.9%) |
| $12,500 to $14,999 | 29 (1.8%) | 68 (4.5%) |
| $15,000 to $17,499 | 78 (4.9%) | 30 (2.0%) |
| $17,500 to $19,999 | 26 (1.6%) | 52 (3.4%) |
| $20,000 to $22,499 | 81 (5.1%) | 130 (8.5%) |
| $22,500 to $24,999 | 87 (5.4%) | 68 (4.5%) |
| $25,000 to $29,999 | 31 (1.9%) | 83 (5.4%) |
| $30,000 to $34,999 | 92 (5.8%) | 119 (7.8%) |
| $35,000 to $39,999 | 24 (1.5%) | 114 (7.5%) |
| $40,000 to $44,999 | 184 (11.5%) | 68 (4.5%) |
| $45,000 to $49,999 | 30 (1.9%) | 76 (5.0%) |
| $50,000 to $54,999 | 62 (3.9%) | 74 (4.9%) |
| $55,000 to $64,999 | 193 (12.1%) | 29 (1.9%) |
| $65,000 to $74,999 | 169 (10.6%) | 35 (2.3%) |
| $75,000 to $99,999 | 90 (5.6%) | 49 (3.2%) |
| $100,000+ | 122 (7.6%) | 79 (5.2%) |
| Total | 1,598 (100.0%) | 1,526 (100.0%) |
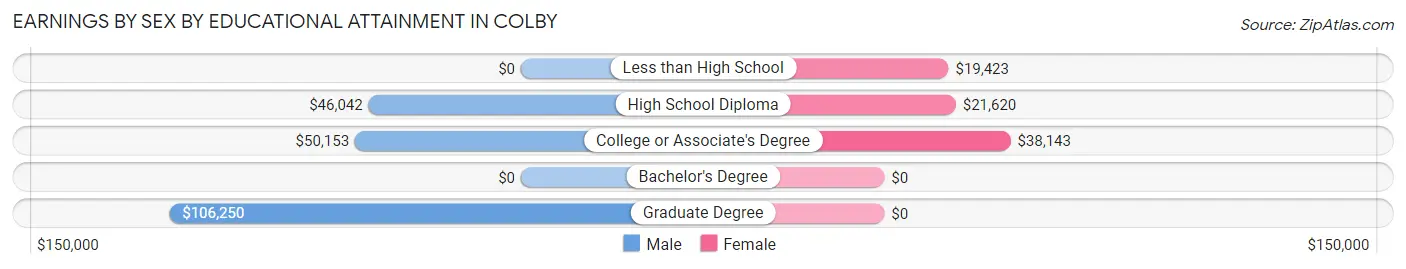
Earnings by Sex by Educational Attainment in Colby
Average earnings in Colby are $47,083 for men and $32,750 for women, a difference of 30.4%. Men with an educational attainment of graduate degree enjoy the highest average annual earnings of $106,250, while those with high school diploma education earn the least with $46,042. Women with an educational attainment of college or associate's degree earn the most with the average annual earnings of $38,143, while those with less than high school education have the smallest earnings of $19,423.
| Educational Attainment | Male Income | Female Income |
| Less than High School | - | - |
| High School Diploma | $46,042 | $21,620 |
| College or Associate's Degree | $50,153 | $38,143 |
| Bachelor's Degree | - | - |
| Graduate Degree | $106,250 | $0 |
| Total | $47,083 | $32,750 |
Family Income in Colby
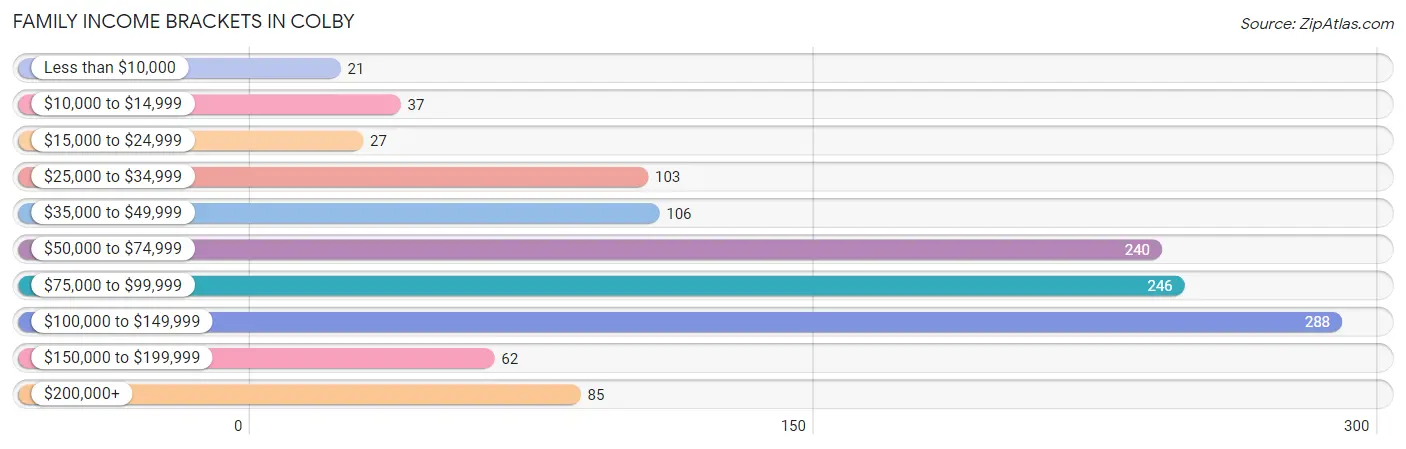
Family Income Brackets in Colby
According to the Colby family income data, there are 288 families falling into the $100,000 to $149,999 income range, which is the most common income bracket and makes up 23.7% of all families. Conversely, the less than $10,000 income bracket is the least frequent group with only 21 families (1.7%) belonging to this category.
| Income Bracket | # Families | % Families |
| Less than $10,000 | 21 | 1.7% |
| $10,000 to $14,999 | 37 | 3.0% |
| $15,000 to $24,999 | 27 | 2.2% |
| $25,000 to $34,999 | 103 | 8.5% |
| $35,000 to $49,999 | 106 | 8.7% |
| $50,000 to $74,999 | 240 | 19.7% |
| $75,000 to $99,999 | 246 | 20.2% |
| $100,000 to $149,999 | 288 | 23.7% |
| $150,000 to $199,999 | 62 | 5.1% |
| $200,000+ | 85 | 7.0% |
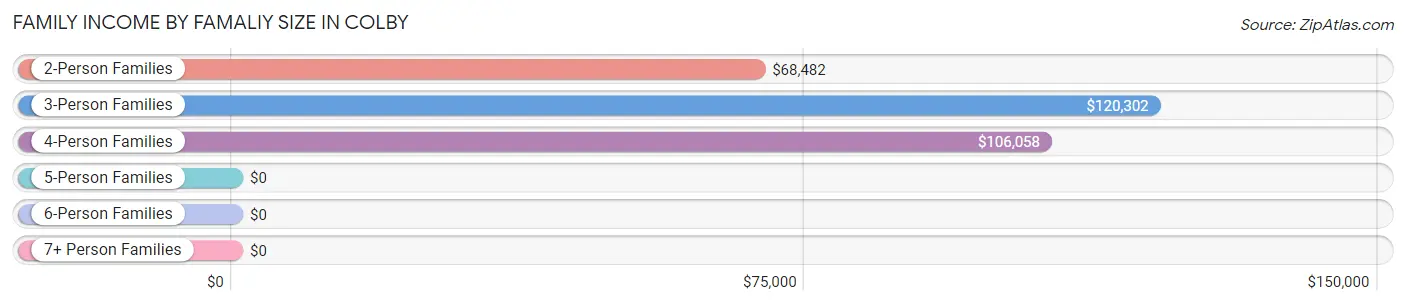
Family Income by Famaliy Size in Colby
3-person families (151 | 12.4%) account for the highest median family income in Colby with $120,302 per family, while 3-person families (151 | 12.4%) have the highest median income of $40,101 per family member.
| Income Bracket | # Families | Median Income |
| 2-Person Families | 721 (59.2%) | $68,482 |
| 3-Person Families | 151 (12.4%) | $120,302 |
| 4-Person Families | 192 (15.8%) | $106,058 |
| 5-Person Families | 117 (9.6%) | $0 |
| 6-Person Families | 16 (1.3%) | $0 |
| 7+ Person Families | 20 (1.6%) | $0 |
| Total | 1,217 (100.0%) | $82,212 |
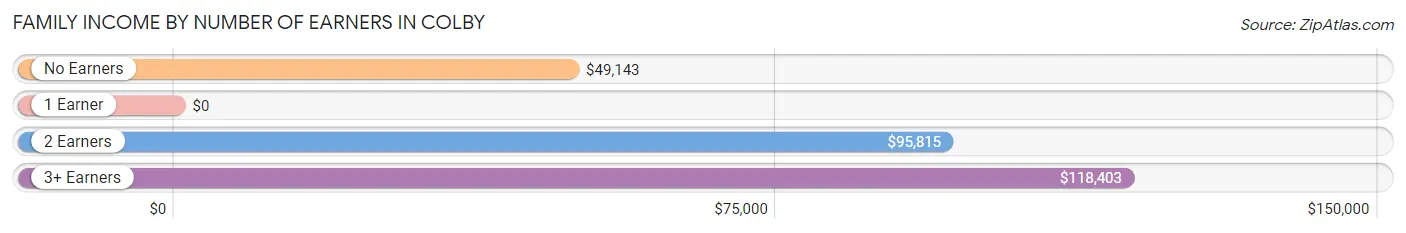
Family Income by Number of Earners in Colby
| Number of Earners | # Families | Median Income |
| No Earners | 244 (20.1%) | $49,143 |
| 1 Earner | 204 (16.8%) | $0 |
| 2 Earners | 698 (57.4%) | $95,815 |
| 3+ Earners | 71 (5.8%) | $118,403 |
| Total | 1,217 (100.0%) | $82,212 |
Household Income in Colby
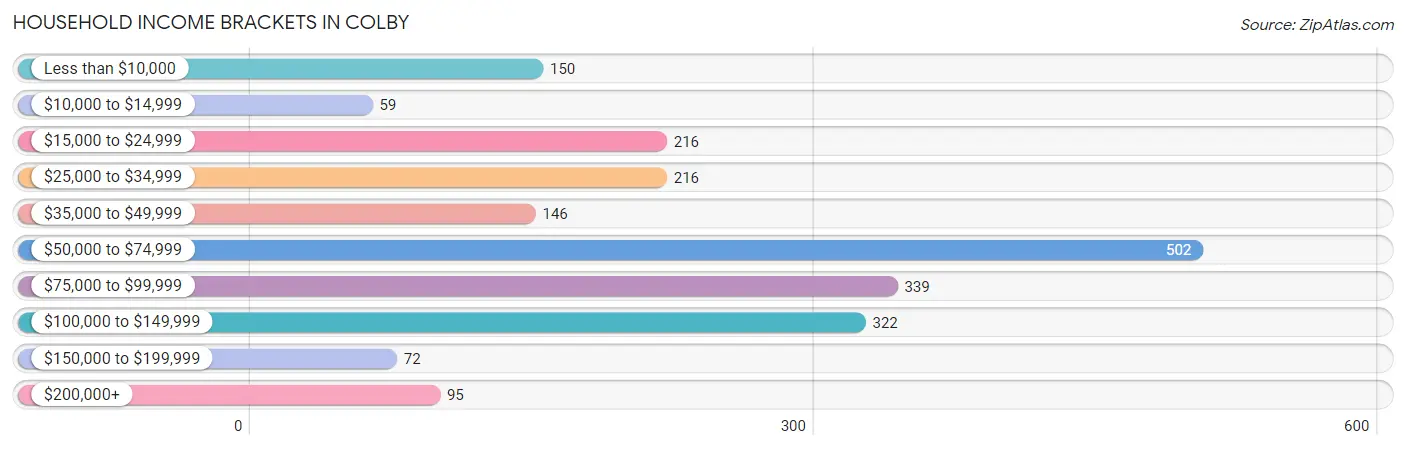
Household Income Brackets in Colby
With 502 households falling in the category, the $50,000 to $74,999 income range is the most frequent in Colby, accounting for 23.7% of all households. In contrast, only 59 households (2.8%) fall into the $10,000 to $14,999 income bracket, making it the least populous group.
| Income Bracket | # Households | % Households |
| Less than $10,000 | 150 | 7.1% |
| $10,000 to $14,999 | 59 | 2.8% |
| $15,000 to $24,999 | 216 | 10.2% |
| $25,000 to $34,999 | 216 | 10.2% |
| $35,000 to $49,999 | 146 | 6.9% |
| $50,000 to $74,999 | 502 | 23.7% |
| $75,000 to $99,999 | 339 | 16.0% |
| $100,000 to $149,999 | 322 | 15.2% |
| $150,000 to $199,999 | 72 | 3.4% |
| $200,000+ | 95 | 4.5% |
Household Income by Householder Age in Colby
The median household income in Colby is $62,937, with the highest median household income of $91,773 found in the 45 to 64 years age bracket for the primary householder. A total of 667 households (31.5%) fall into this category. Meanwhile, the 15 to 24 years age bracket for the primary householder has the lowest median household income of $22,500, with 274 households (12.9%) in this group.
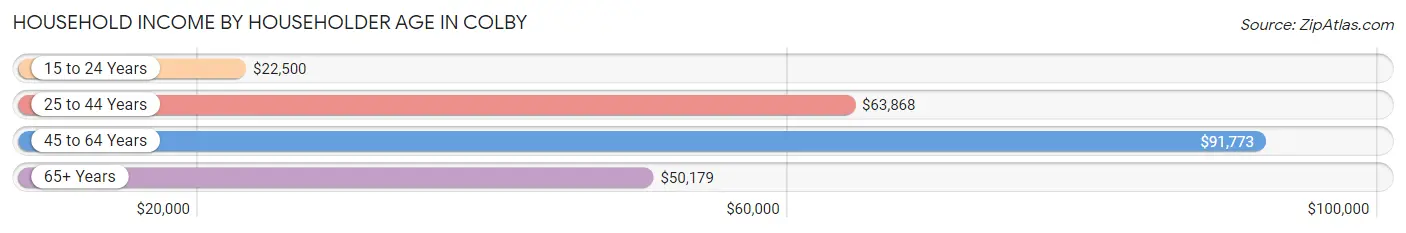
| Income Bracket | # Households | Median Income |
| 15 to 24 Years | 274 (12.9%) | $22,500 |
| 25 to 44 Years | 604 (28.5%) | $63,868 |
| 45 to 64 Years | 667 (31.5%) | $91,773 |
| 65+ Years | 573 (27.1%) | $50,179 |
| Total | 2,118 (100.0%) | $62,937 |
Poverty in Colby
Income Below Poverty by Sex and Age in Colby
With 6.1% poverty level for males and 9.2% for females among the residents of Colby, 25 to 34 year old males and 18 to 24 year old females are the most vulnerable to poverty, with 86 males (23.3%) and 115 females (59.6%) in their respective age groups living below the poverty level.
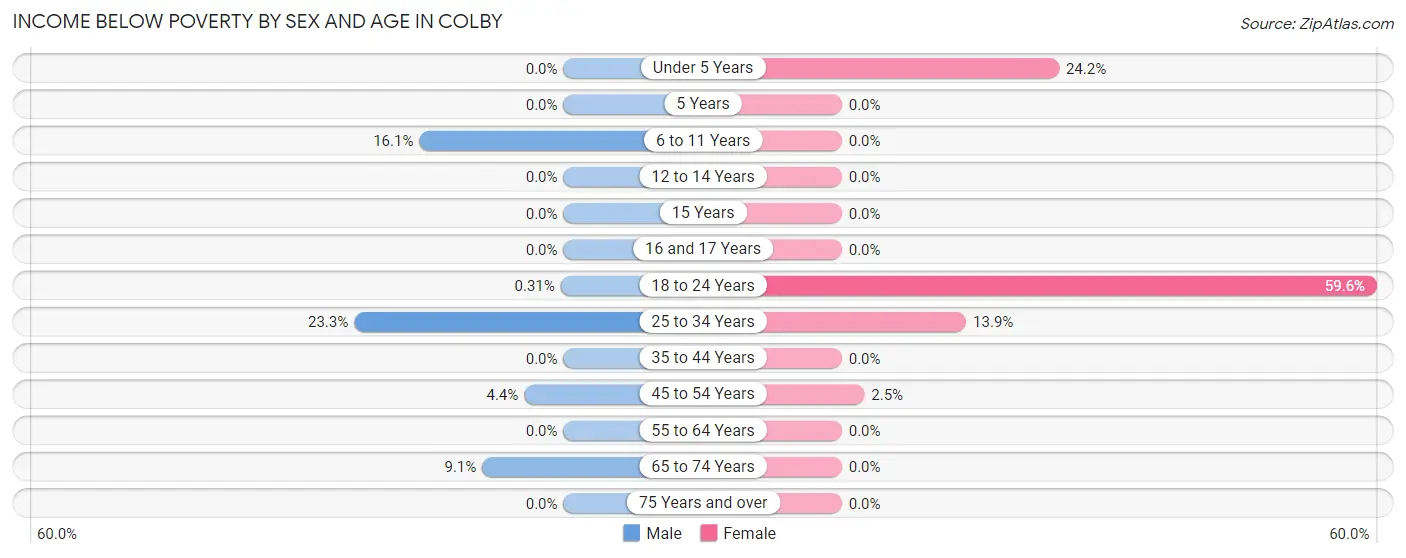
| Age Bracket | Male | Female |
| Under 5 Years | 0 (0.0%) | 45 (24.2%) |
| 5 Years | 0 (0.0%) | 0 (0.0%) |
| 6 to 11 Years | 39 (16.1%) | 0 (0.0%) |
| 12 to 14 Years | 0 (0.0%) | 0 (0.0%) |
| 15 Years | 0 (0.0%) | 0 (0.0%) |
| 16 and 17 Years | 0 (0.0%) | 0 (0.0%) |
| 18 to 24 Years | 1 (0.3%) | 115 (59.6%) |
| 25 to 34 Years | 86 (23.3%) | 54 (13.9%) |
| 35 to 44 Years | 0 (0.0%) | 0 (0.0%) |
| 45 to 54 Years | 9 (4.4%) | 7 (2.5%) |
| 55 to 64 Years | 0 (0.0%) | 0 (0.0%) |
| 65 to 74 Years | 20 (9.0%) | 0 (0.0%) |
| 75 Years and over | 0 (0.0%) | 0 (0.0%) |
| Total | 155 (6.1%) | 221 (9.2%) |
Income Above Poverty by Sex and Age in Colby
According to the poverty statistics in Colby, males aged under 5 years and females aged 5 years are the age groups that are most secure financially, with 100.0% of males and 100.0% of females in these age groups living above the poverty line.
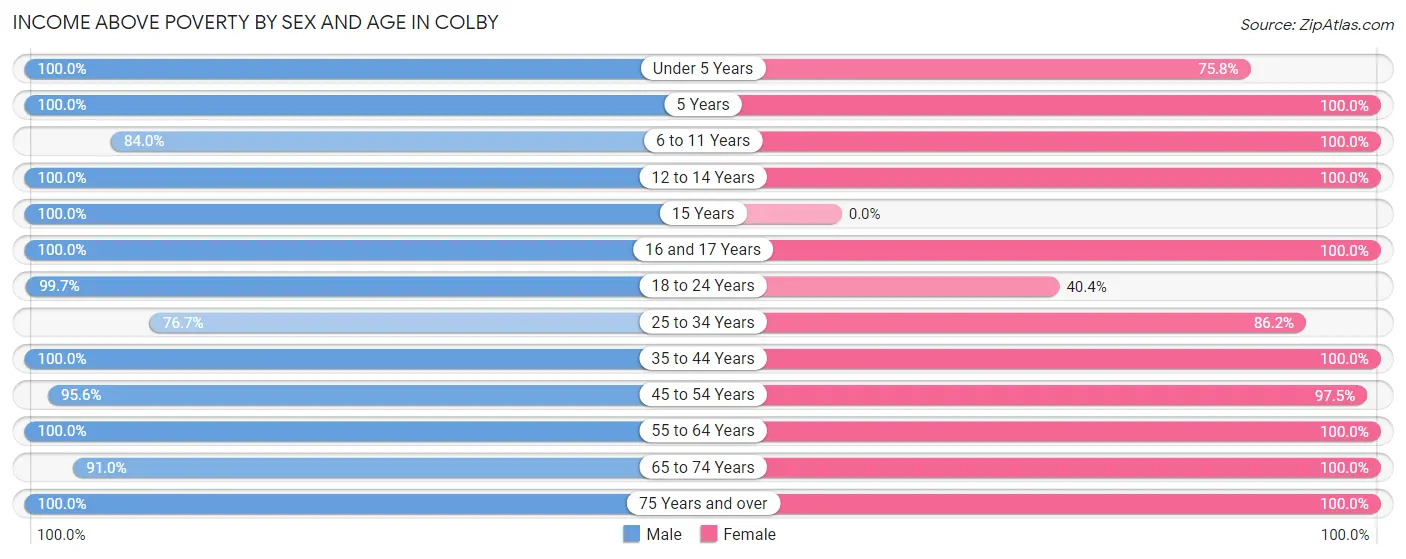
| Age Bracket | Male | Female |
| Under 5 Years | 167 (100.0%) | 141 (75.8%) |
| 5 Years | 91 (100.0%) | 20 (100.0%) |
| 6 to 11 Years | 204 (84.0%) | 247 (100.0%) |
| 12 to 14 Years | 100 (100.0%) | 127 (100.0%) |
| 15 Years | 86 (100.0%) | 0 (0.0%) |
| 16 and 17 Years | 22 (100.0%) | 54 (100.0%) |
| 18 to 24 Years | 322 (99.7%) | 78 (40.4%) |
| 25 to 34 Years | 283 (76.7%) | 336 (86.2%) |
| 35 to 44 Years | 229 (100.0%) | 181 (100.0%) |
| 45 to 54 Years | 197 (95.6%) | 272 (97.5%) |
| 55 to 64 Years | 365 (100.0%) | 312 (100.0%) |
| 65 to 74 Years | 201 (90.9%) | 191 (100.0%) |
| 75 Years and over | 134 (100.0%) | 217 (100.0%) |
| Total | 2,401 (93.9%) | 2,176 (90.8%) |
Income Below Poverty Among Married-Couple Families in Colby
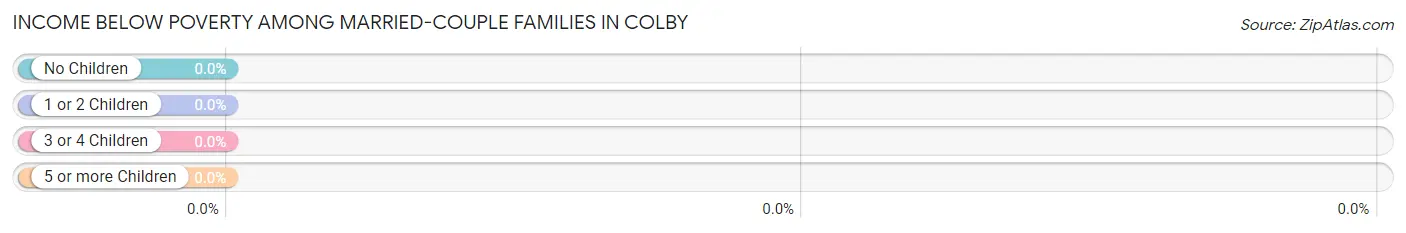
| Children | Above Poverty | Below Poverty |
| No Children | 631 (100.0%) | 0 (0.0%) |
| 1 or 2 Children | 239 (100.0%) | 0 (0.0%) |
| 3 or 4 Children | 128 (100.0%) | 0 (0.0%) |
| 5 or more Children | 20 (100.0%) | 0 (0.0%) |
| Total | 1,018 (100.0%) | 0 (0.0%) |
Income Below Poverty Among Single-Parent Households in Colby
According to the poverty data in Colby, 21.6% or 21 single-father households and 43.1% or 44 single-mother households are living below the poverty line. Among single-father households, those with 1 or 2 children have the highest poverty rate, with 21 households (42.0%) experiencing poverty. Likewise, among single-mother households, those with 1 or 2 children have the highest poverty rate, with 37 households (49.3%) falling below the poverty line.
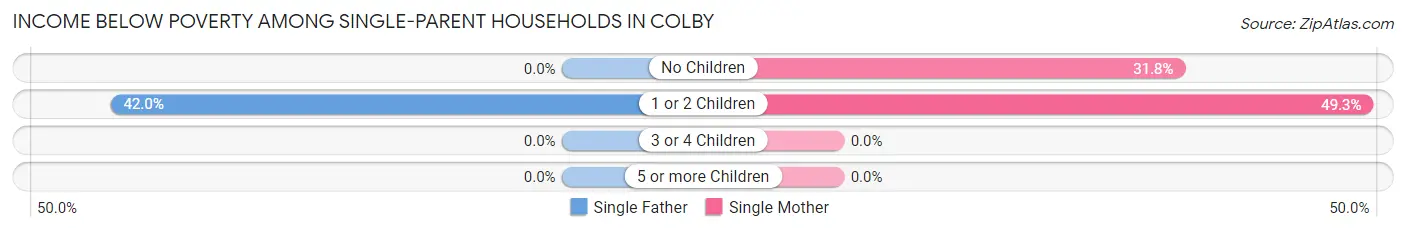
| Children | Single Father | Single Mother |
| No Children | 0 (0.0%) | 7 (31.8%) |
| 1 or 2 Children | 21 (42.0%) | 37 (49.3%) |
| 3 or 4 Children | 0 (0.0%) | 0 (0.0%) |
| 5 or more Children | 0 (0.0%) | 0 (0.0%) |
| Total | 21 (21.6%) | 44 (43.1%) |
Income Below Poverty Among Married-Couple vs Single-Parent Households in Colby
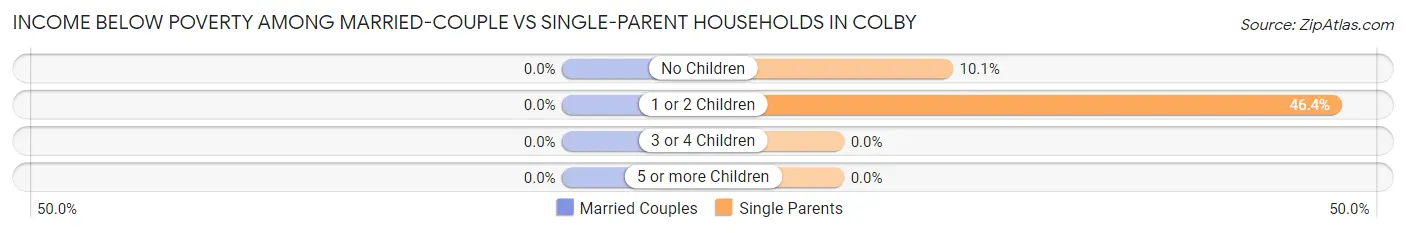
| Children | Married-Couple Families | Single-Parent Households |
| No Children | 0 (0.0%) | 7 (10.1%) |
| 1 or 2 Children | 0 (0.0%) | 58 (46.4%) |
| 3 or 4 Children | 0 (0.0%) | 0 (0.0%) |
| 5 or more Children | 0 (0.0%) | 0 (0.0%) |
| Total | 0 (0.0%) | 65 (32.7%) |
Race in Colby
The most populous races in Colby are White / Caucasian (4,980 | 92.2%), Hispanic or Latino (468 | 8.7%), and Some other Race (200 | 3.7%).
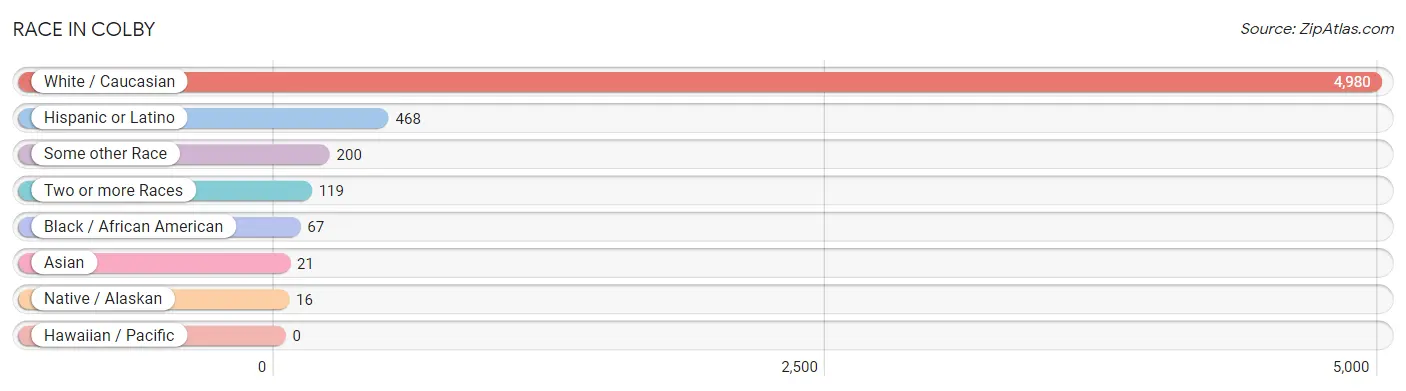
| Race | # Population | % Population |
| Asian | 21 | 0.4% |
| Black / African American | 67 | 1.2% |
| Hawaiian / Pacific | 0 | 0.0% |
| Hispanic or Latino | 468 | 8.7% |
| Native / Alaskan | 16 | 0.3% |
| White / Caucasian | 4,980 | 92.2% |
| Two or more Races | 119 | 2.2% |
| Some other Race | 200 | 3.7% |
| Total | 5,403 | 100.0% |
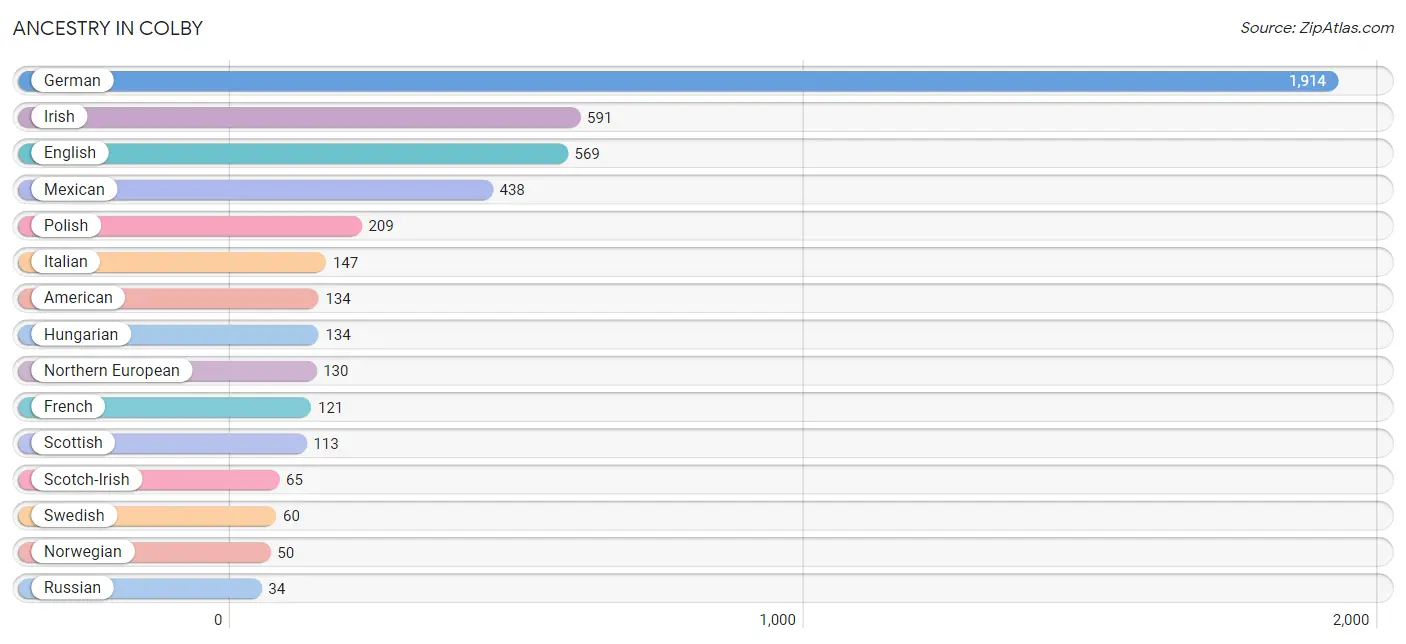
Ancestry in Colby
The most populous ancestries reported in Colby are German (1,914 | 35.4%), Irish (591 | 10.9%), English (569 | 10.5%), Mexican (438 | 8.1%), and Polish (209 | 3.9%), together accounting for 68.9% of all Colby residents.
| Ancestry | # Population | % Population |
| African | 17 | 0.3% |
| Alaska Native | 1 | 0.0% |
| American | 134 | 2.5% |
| Apache | 8 | 0.2% |
| Argentinean | 14 | 0.3% |
| British | 12 | 0.2% |
| Canadian | 31 | 0.6% |
| Choctaw | 5 | 0.1% |
| Czech | 33 | 0.6% |
| Czechoslovakian | 1 | 0.0% |
| Dutch | 8 | 0.2% |
| English | 569 | 10.5% |
| European | 17 | 0.3% |
| French | 121 | 2.2% |
| German | 1,914 | 35.4% |
| German Russian | 13 | 0.2% |
| Greek | 22 | 0.4% |
| Hungarian | 134 | 2.5% |
| Irish | 591 | 10.9% |
| Italian | 147 | 2.7% |
| Korean | 21 | 0.4% |
| Mexican | 438 | 8.1% |
| Mexican American Indian | 7 | 0.1% |
| Navajo | 12 | 0.2% |
| Northern European | 130 | 2.4% |
| Norwegian | 50 | 0.9% |
| Polish | 209 | 3.9% |
| Portuguese | 30 | 0.6% |
| Russian | 34 | 0.6% |
| Scotch-Irish | 65 | 1.2% |
| Scottish | 113 | 2.1% |
| South American | 14 | 0.3% |
| Spanish | 16 | 0.3% |
| Subsaharan African | 17 | 0.3% |
| Swedish | 60 | 1.1% | View All 35 Rows |
Immigrants in Colby
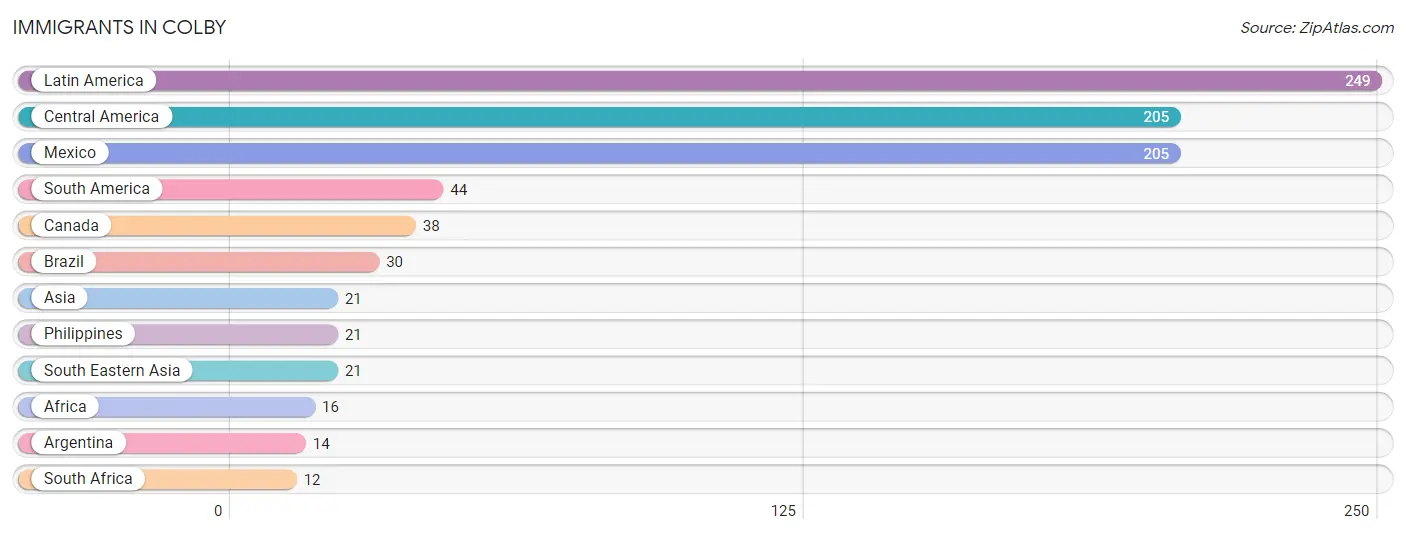
The most numerous immigrant groups reported in Colby came from Latin America (249 | 4.6%), Central America (205 | 3.8%), Mexico (205 | 3.8%), South America (44 | 0.8%), and Canada (38 | 0.7%), together accounting for 13.7% of all Colby residents.
| Immigration Origin | # Population | % Population |
| Africa | 16 | 0.3% |
| Argentina | 14 | 0.3% |
| Asia | 21 | 0.4% |
| Brazil | 30 | 0.6% |
| Canada | 38 | 0.7% |
| Central America | 205 | 3.8% |
| Latin America | 249 | 4.6% |
| Mexico | 205 | 3.8% |
| Philippines | 21 | 0.4% |
| South Africa | 12 | 0.2% |
| South America | 44 | 0.8% |
| South Eastern Asia | 21 | 0.4% | View All 12 Rows |
Sex and Age in Colby
Sex and Age in Colby
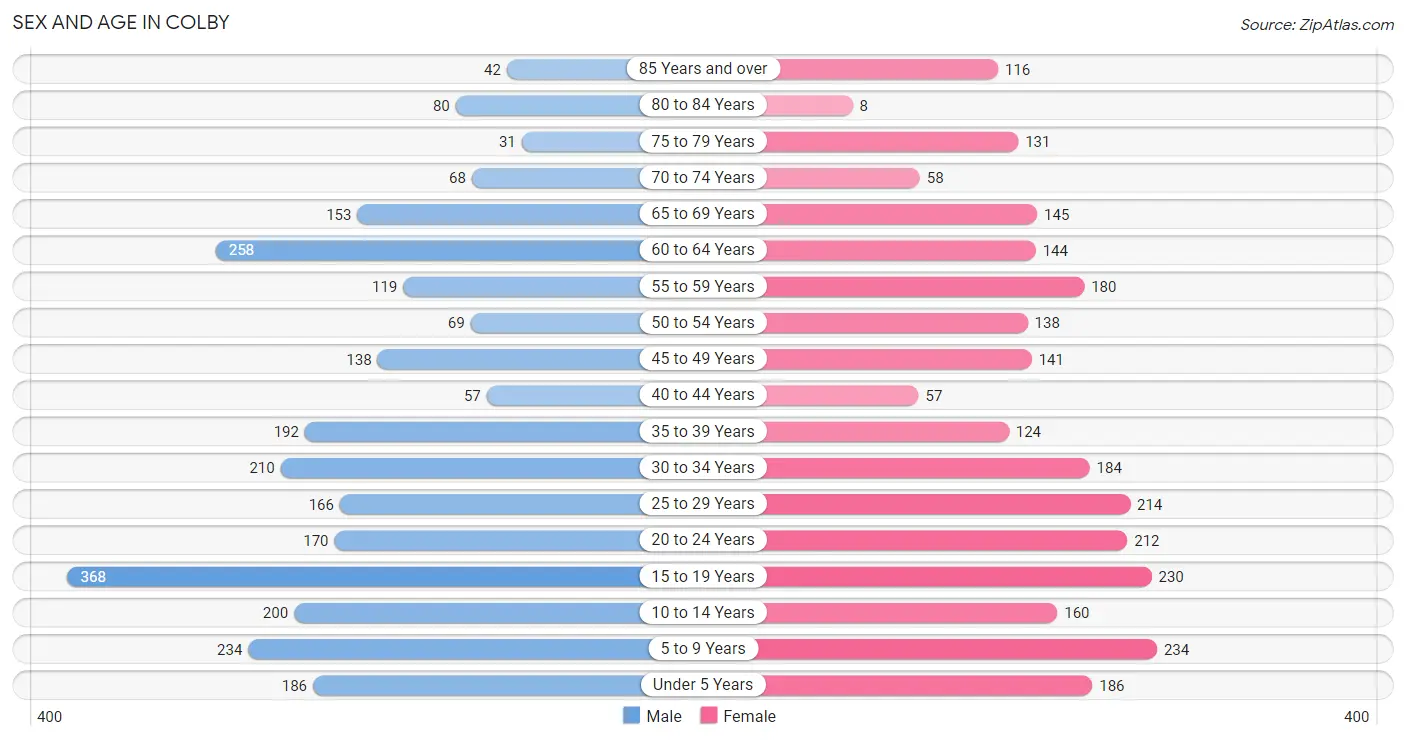
The most populous age groups in Colby are 15 to 19 Years (368 | 13.4%) for men and 5 to 9 Years (234 | 8.8%) for women.
| Age Bracket | Male | Female |
| Under 5 Years | 186 (6.8%) | 186 (7.0%) |
| 5 to 9 Years | 234 (8.5%) | 234 (8.8%) |
| 10 to 14 Years | 200 (7.3%) | 160 (6.0%) |
| 15 to 19 Years | 368 (13.4%) | 230 (8.6%) |
| 20 to 24 Years | 170 (6.2%) | 212 (8.0%) |
| 25 to 29 Years | 166 (6.1%) | 214 (8.0%) |
| 30 to 34 Years | 210 (7.7%) | 184 (6.9%) |
| 35 to 39 Years | 192 (7.0%) | 124 (4.7%) |
| 40 to 44 Years | 57 (2.1%) | 57 (2.1%) |
| 45 to 49 Years | 138 (5.0%) | 141 (5.3%) |
| 50 to 54 Years | 69 (2.5%) | 138 (5.2%) |
| 55 to 59 Years | 119 (4.3%) | 180 (6.8%) |
| 60 to 64 Years | 258 (9.4%) | 144 (5.4%) |
| 65 to 69 Years | 153 (5.6%) | 145 (5.4%) |
| 70 to 74 Years | 68 (2.5%) | 58 (2.2%) |
| 75 to 79 Years | 31 (1.1%) | 131 (4.9%) |
| 80 to 84 Years | 80 (2.9%) | 8 (0.3%) |
| 85 Years and over | 42 (1.5%) | 116 (4.4%) |
| Total | 2,741 (100.0%) | 2,662 (100.0%) |
Families and Households in Colby
Median Family Size in Colby
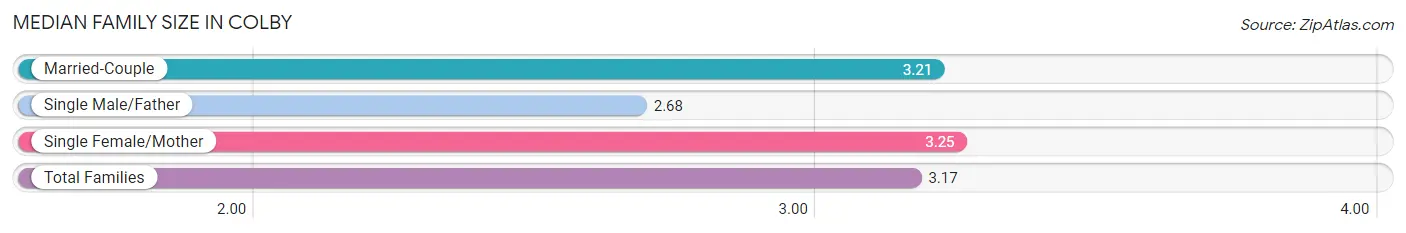
The median family size in Colby is 3.17 persons per family, with single female/mother families (102 | 8.4%) accounting for the largest median family size of 3.25 persons per family. On the other hand, single male/father families (97 | 8.0%) represent the smallest median family size with 2.68 persons per family.
| Family Type | # Families | Family Size |
| Married-Couple | 1,018 (83.7%) | 3.21 |
| Single Male/Father | 97 (8.0%) | 2.68 |
| Single Female/Mother | 102 (8.4%) | 3.25 |
| Total Families | 1,217 (100.0%) | 3.17 |
Median Household Size in Colby
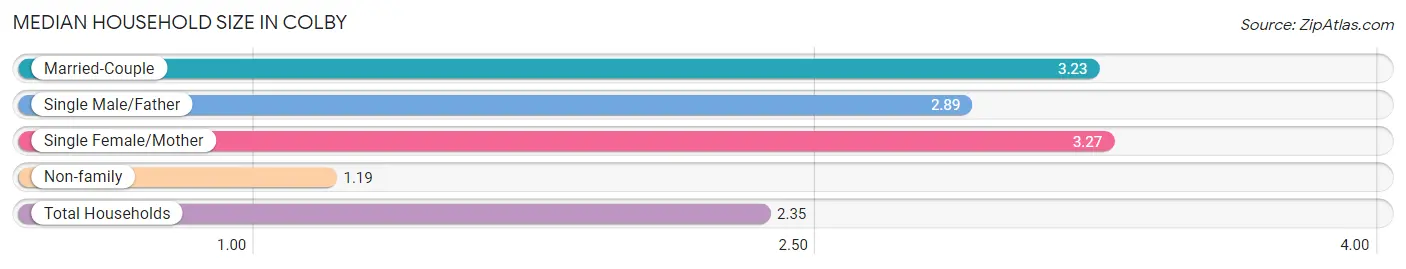
The median household size in Colby is 2.35 persons per household, with single female/mother households (102 | 4.8%) accounting for the largest median household size of 3.27 persons per household. non-family households (901 | 42.5%) represent the smallest median household size with 1.19 persons per household.
| Household Type | # Households | Household Size |
| Married-Couple | 1,018 (48.1%) | 3.23 |
| Single Male/Father | 97 (4.6%) | 2.89 |
| Single Female/Mother | 102 (4.8%) | 3.27 |
| Non-family | 901 (42.5%) | 1.19 |
| Total Households | 2,118 (100.0%) | 2.35 |
Household Size by Marriage Status in Colby
Out of a total of 2,118 households in Colby, 1,217 (57.5%) are family households, while 901 (42.5%) are nonfamily households. The most numerous type of family households are 2-person households, comprising 721, and the most common type of nonfamily households are 1-person households, comprising 735.
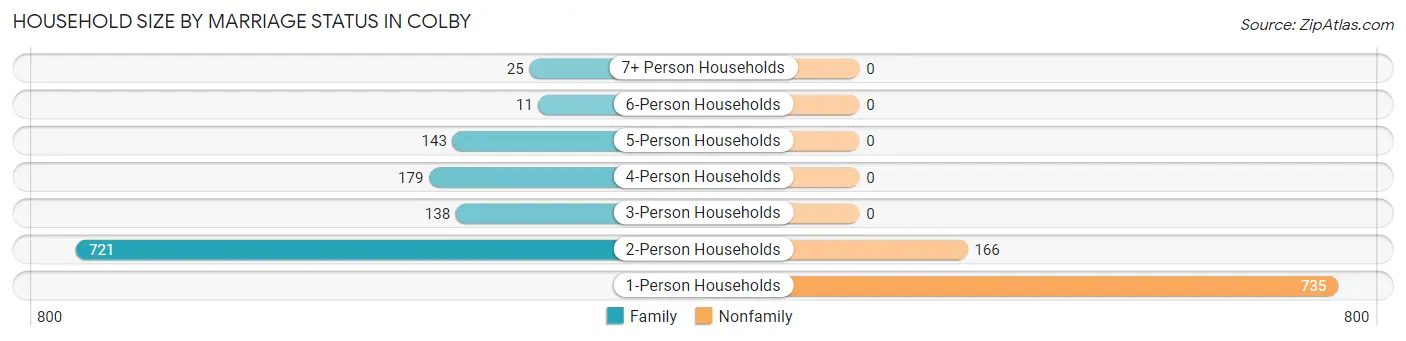
| Household Size | Family Households | Nonfamily Households |
| 1-Person Households | - | 735 (34.7%) |
| 2-Person Households | 721 (34.0%) | 166 (7.8%) |
| 3-Person Households | 138 (6.5%) | 0 (0.0%) |
| 4-Person Households | 179 (8.5%) | 0 (0.0%) |
| 5-Person Households | 143 (6.8%) | 0 (0.0%) |
| 6-Person Households | 11 (0.5%) | 0 (0.0%) |
| 7+ Person Households | 25 (1.2%) | 0 (0.0%) |
| Total | 1,217 (57.5%) | 901 (42.5%) |
Female Fertility in Colby
Fertility by Age in Colby
Average fertility rate in Colby is 62.0 births per 1,000 women. Women in the age bracket of 35 to 50 years have the highest fertility rate with 130.0 births per 1,000 women. Women in the age bracket of 35 to 50 years acount for 58.3% of all women with births.
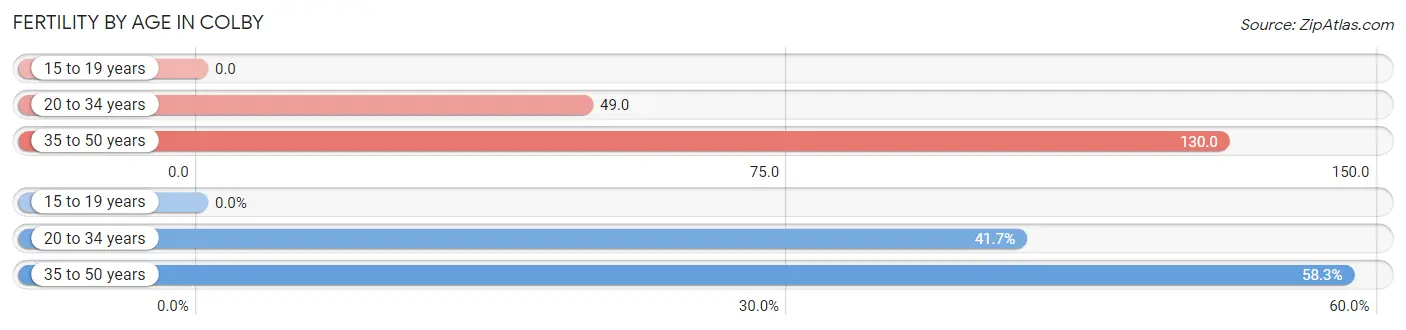
| Age Bracket | Women with Births | Births / 1,000 Women |
| 15 to 19 years | 0 (0.0%) | 0.0 |
| 20 to 34 years | 30 (41.7%) | 49.0 |
| 35 to 50 years | 42 (58.3%) | 130.0 |
| Total | 72 (100.0%) | 62.0 |
Fertility by Age by Marriage Status in Colby
88.9% of women with births (72) in Colby are married. The highest percentage of unmarried women with births falls into 20 to 34 years age bracket with 26.7% of them unmarried at the time of birth, while the lowest percentage of unmarried women with births belong to 35 to 50 years age bracket with 0.0% of them unmarried.
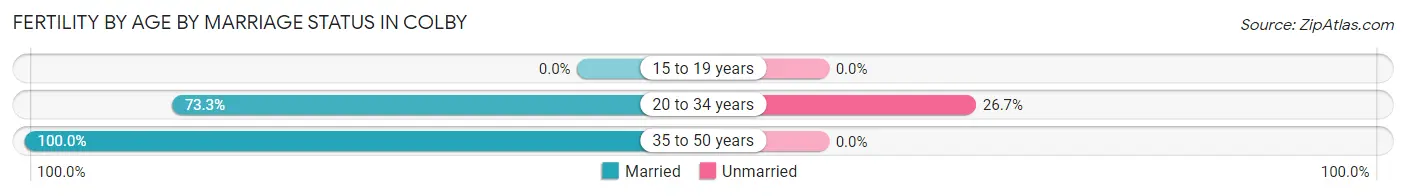
| Age Bracket | Married | Unmarried |
| 15 to 19 years | 0 (0.0%) | 0 (0.0%) |
| 20 to 34 years | 22 (73.3%) | 8 (26.7%) |
| 35 to 50 years | 42 (100.0%) | 0 (0.0%) |
| Total | 64 (88.9%) | 8 (11.1%) |
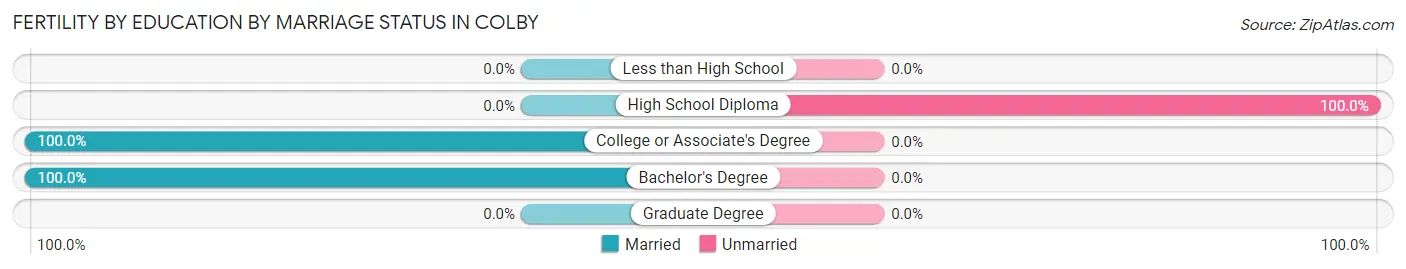
Fertility by Education in Colby
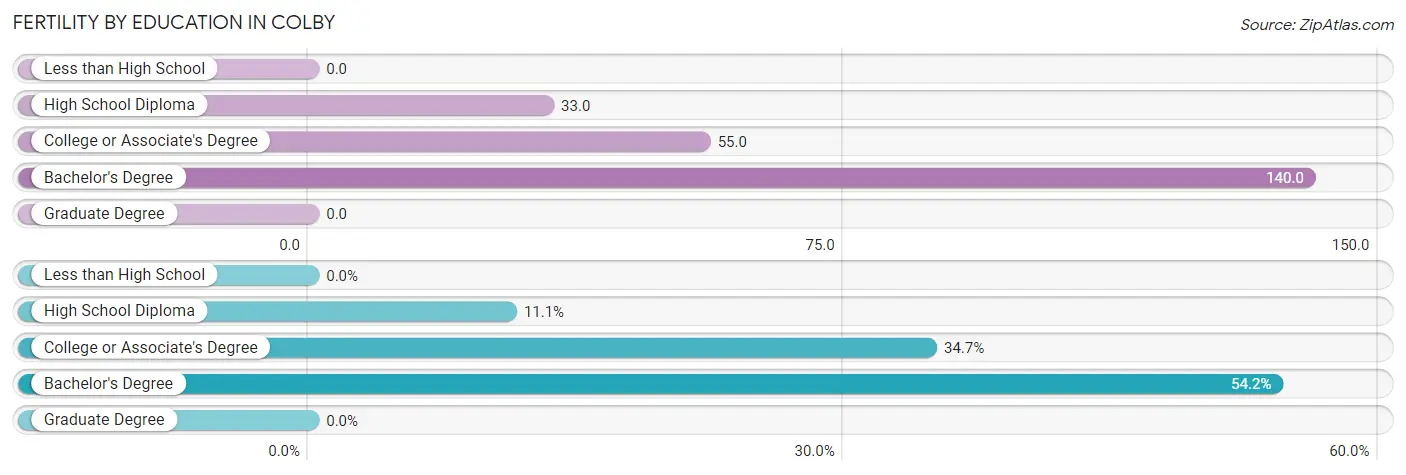
| Educational Attainment | Women with Births | Births / 1,000 Women |
| Less than High School | 0 (0.0%) | 0.0 |
| High School Diploma | 8 (11.1%) | 33.0 |
| College or Associate's Degree | 25 (34.7%) | 55.0 |
| Bachelor's Degree | 39 (54.2%) | 140.0 |
| Graduate Degree | 0 (0.0%) | 0.0 |
| Total | 72 (100.0%) | 62.0 |
Fertility by Education by Marriage Status in Colby
11.1% of women with births in Colby are unmarried. Women with the educational attainment of college or associate's degree are most likely to be married with 100.0% of them married at childbirth, while women with the educational attainment of high school diploma are least likely to be married with 100.0% of them unmarried at childbirth.
| Educational Attainment | Married | Unmarried |
| Less than High School | 0 (0.0%) | 0 (0.0%) |
| High School Diploma | 0 (0.0%) | 8 (100.0%) |
| College or Associate's Degree | 25 (100.0%) | 0 (0.0%) |
| Bachelor's Degree | 39 (100.0%) | 0 (0.0%) |
| Graduate Degree | 0 (0.0%) | 0 (0.0%) |
| Total | 64 (88.9%) | 8 (11.1%) |
Employment Characteristics in Colby
Employment by Class of Employer in Colby
Among the 2,719 employed individuals in Colby, private company employees (1,878 | 69.1%), not-for-profit organizations (262 | 9.6%), and local government employees (218 | 8.0%) make up the most common classes of employment.
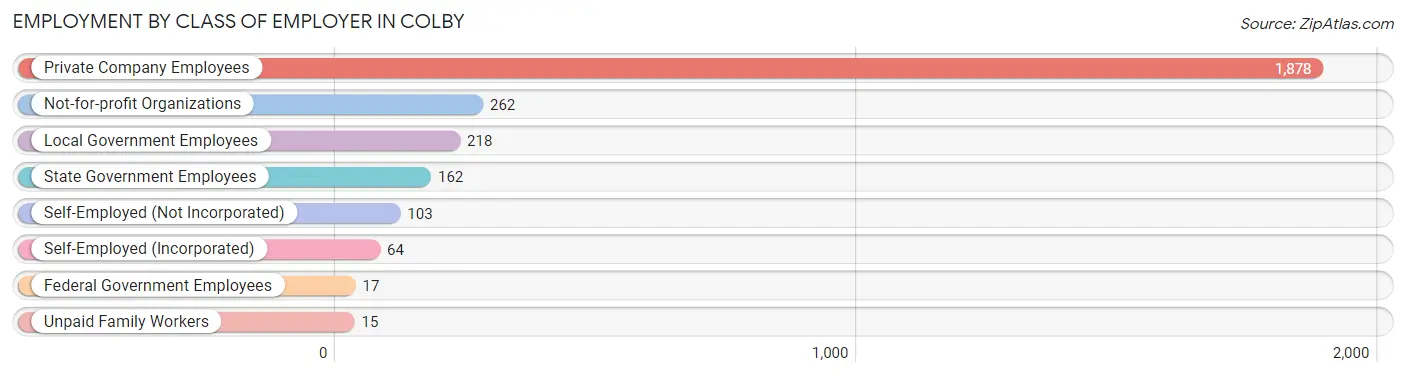
| Employer Class | # Employees | % Employees |
| Private Company Employees | 1,878 | 69.1% |
| Self-Employed (Incorporated) | 64 | 2.4% |
| Self-Employed (Not Incorporated) | 103 | 3.8% |
| Not-for-profit Organizations | 262 | 9.6% |
| Local Government Employees | 218 | 8.0% |
| State Government Employees | 162 | 6.0% |
| Federal Government Employees | 17 | 0.6% |
| Unpaid Family Workers | 15 | 0.5% |
| Total | 2,719 | 100.0% |
Employment Status by Age in Colby
According to the labor force statistics for Colby, out of the total population over 16 years of age (4,117), 67.3% or 2,771 individuals are in the labor force, with 0.4% or 11 of them unemployed. The age group with the highest labor force participation rate is 25 to 29 years, with 98.7% or 375 individuals in the labor force. Within the labor force, the 25 to 29 years age range has the highest percentage of unemployed individuals, with 2.7% or 10 of them being unemployed.
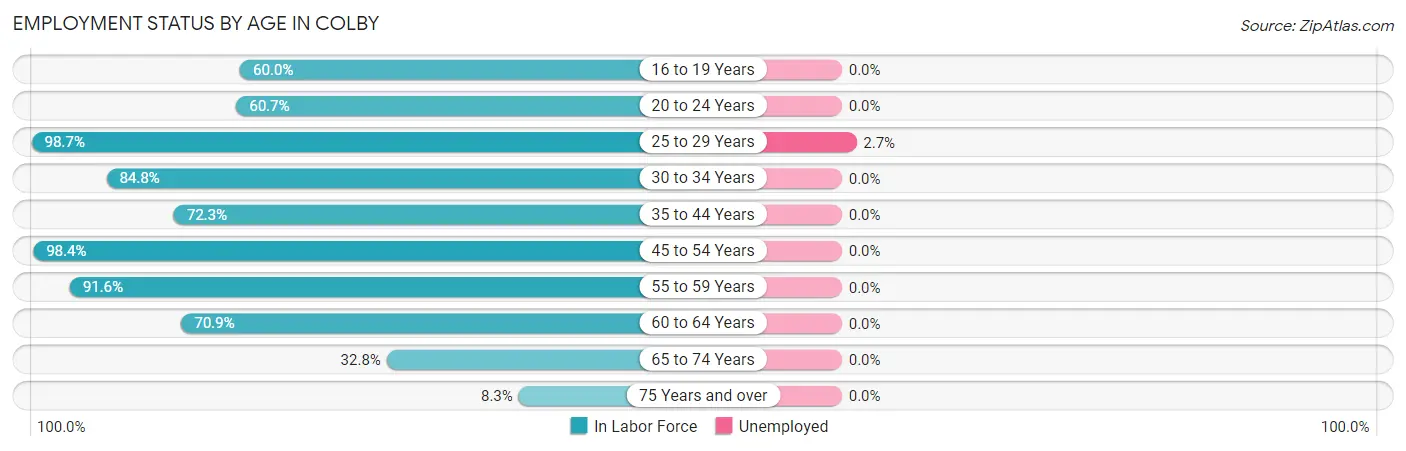
| Age Bracket | In Labor Force | Unemployed |
| 16 to 19 Years | 307 (60.0%) | 0 (0.0%) |
| 20 to 24 Years | 232 (60.7%) | 0 (0.0%) |
| 25 to 29 Years | 375 (98.7%) | 10 (2.7%) |
| 30 to 34 Years | 334 (84.8%) | 0 (0.0%) |
| 35 to 44 Years | 311 (72.3%) | 0 (0.0%) |
| 45 to 54 Years | 478 (98.4%) | 0 (0.0%) |
| 55 to 59 Years | 274 (91.6%) | 0 (0.0%) |
| 60 to 64 Years | 285 (70.9%) | 0 (0.0%) |
| 65 to 74 Years | 139 (32.8%) | 0 (0.0%) |
| 75 Years and over | 34 (8.3%) | 0 (0.0%) |
| Total | 2,771 (67.3%) | 11 (0.4%) |
Employment Status by Educational Attainment in Colby
According to labor force statistics for Colby, 86.0% of individuals (2,056) out of the total population between 25 and 64 years of age (2,391) are in the labor force, with 0.5% or 10 of them being unemployed. The group with the highest labor force participation rate are those with the educational attainment of college / associate degree, with 90.5% or 1,051 individuals in the labor force. Within the labor force, individuals with less than high school education have the highest percentage of unemployment, with 4.6% or 10 of them being unemployed.
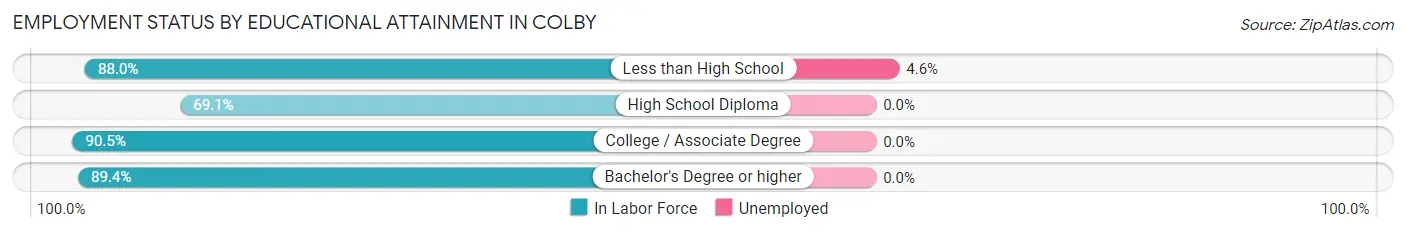
| Educational Attainment | In Labor Force | Unemployed |
| Less than High School | 219 (88.0%) | 11 (4.6%) |
| High School Diploma | 307 (69.1%) | 0 (0.0%) |
| College / Associate Degree | 1,051 (90.5%) | 0 (0.0%) |
| Bachelor's Degree or higher | 480 (89.4%) | 0 (0.0%) |
| Total | 2,056 (86.0%) | 12 (0.5%) |
Employment Occupations by Sex in Colby
Management, Business, Science and Arts Occupations
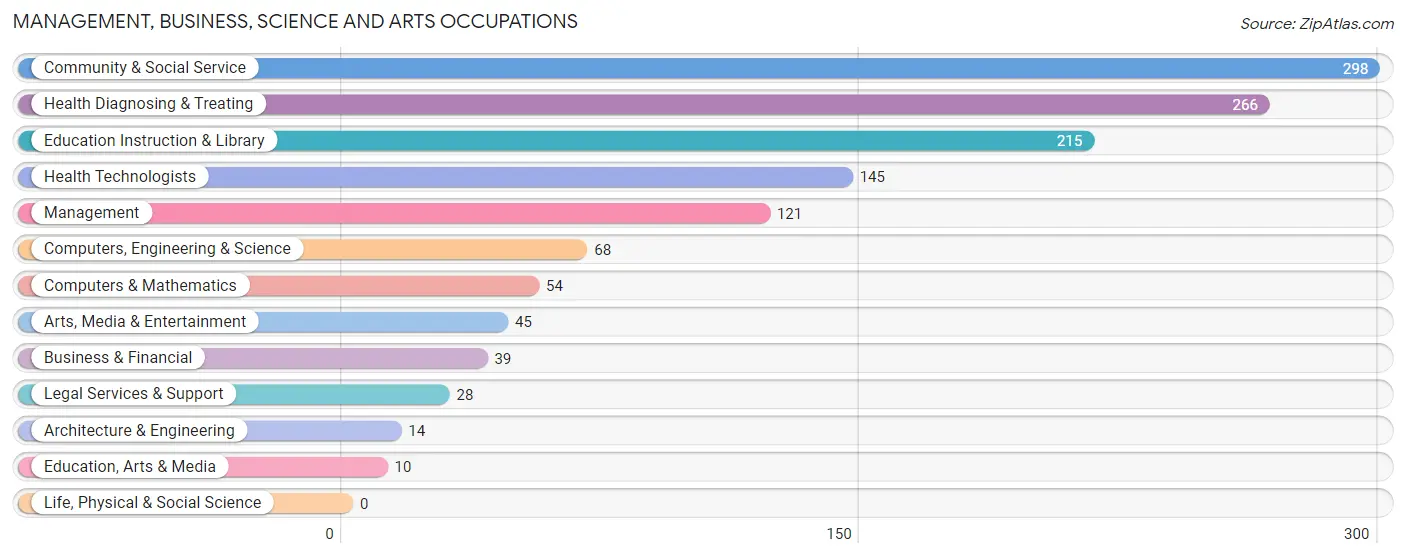
The most common Management, Business, Science and Arts occupations in Colby are Community & Social Service (298 | 10.8%), Health Diagnosing & Treating (266 | 9.6%), Education Instruction & Library (215 | 7.8%), Health Technologists (145 | 5.3%), and Management (121 | 4.4%).
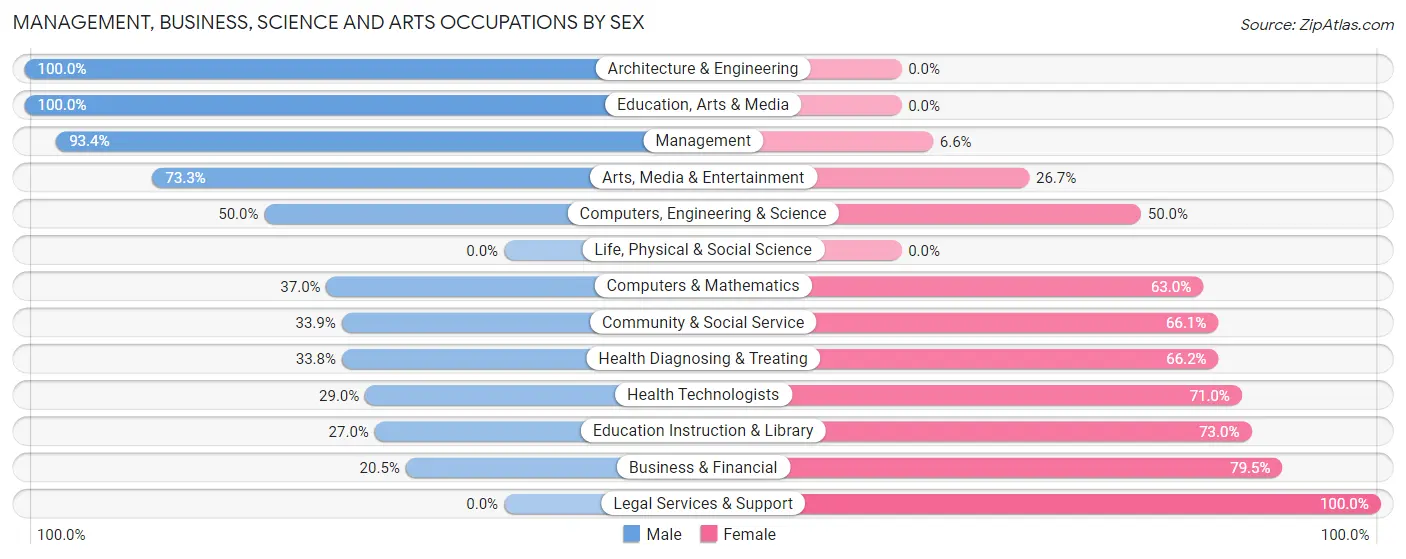
Management, Business, Science and Arts Occupations by Sex
Within the Management, Business, Science and Arts occupations in Colby, the most male-oriented occupations are Architecture & Engineering (100.0%), Education, Arts & Media (100.0%), and Management (93.4%), while the most female-oriented occupations are Legal Services & Support (100.0%), Business & Financial (79.5%), and Education Instruction & Library (73.0%).
| Occupation | Male | Female |
| Management | 113 (93.4%) | 8 (6.6%) |
| Business & Financial | 8 (20.5%) | 31 (79.5%) |
| Computers, Engineering & Science | 34 (50.0%) | 34 (50.0%) |
| Computers & Mathematics | 20 (37.0%) | 34 (63.0%) |
| Architecture & Engineering | 14 (100.0%) | 0 (0.0%) |
| Life, Physical & Social Science | 0 (0.0%) | 0 (0.0%) |
| Community & Social Service | 101 (33.9%) | 197 (66.1%) |
| Education, Arts & Media | 10 (100.0%) | 0 (0.0%) |
| Legal Services & Support | 0 (0.0%) | 28 (100.0%) |
| Education Instruction & Library | 58 (27.0%) | 157 (73.0%) |
| Arts, Media & Entertainment | 33 (73.3%) | 12 (26.7%) |
| Health Diagnosing & Treating | 90 (33.8%) | 176 (66.2%) |
| Health Technologists | 42 (29.0%) | 103 (71.0%) |
| Total (Category) | 346 (43.7%) | 446 (56.3%) |
| Total (Overall) | 1,504 (54.5%) | 1,255 (45.5%) |
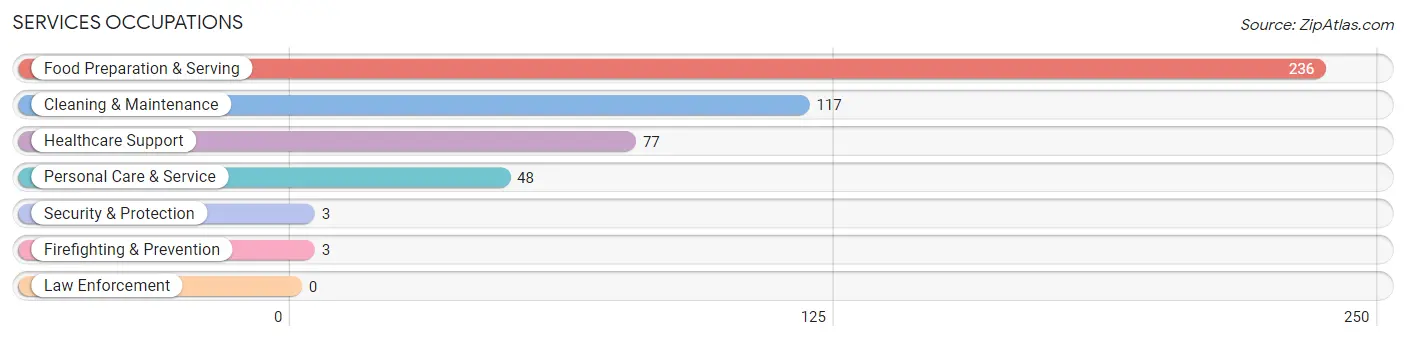
Services Occupations
The most common Services occupations in Colby are Food Preparation & Serving (236 | 8.6%), Cleaning & Maintenance (117 | 4.2%), Healthcare Support (77 | 2.8%), Personal Care & Service (48 | 1.7%), and Security & Protection (3 | 0.1%).
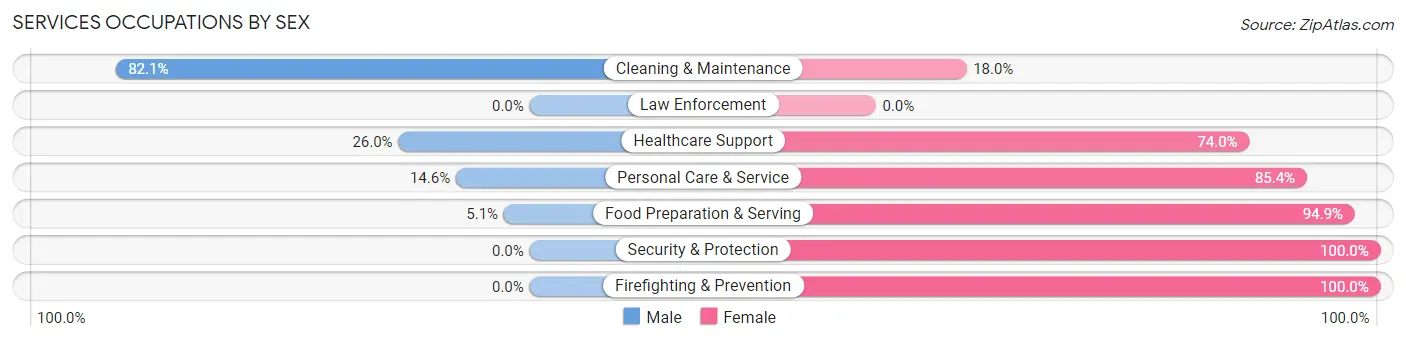
Services Occupations by Sex
Within the Services occupations in Colby, the most male-oriented occupations are Cleaning & Maintenance (82.1%), Healthcare Support (26.0%), and Personal Care & Service (14.6%), while the most female-oriented occupations are Security & Protection (100.0%), Firefighting & Prevention (100.0%), and Food Preparation & Serving (94.9%).
| Occupation | Male | Female |
| Healthcare Support | 20 (26.0%) | 57 (74.0%) |
| Security & Protection | 0 (0.0%) | 3 (100.0%) |
| Firefighting & Prevention | 0 (0.0%) | 3 (100.0%) |
| Law Enforcement | 0 (0.0%) | 0 (0.0%) |
| Food Preparation & Serving | 12 (5.1%) | 224 (94.9%) |
| Cleaning & Maintenance | 96 (82.1%) | 21 (17.9%) |
| Personal Care & Service | 7 (14.6%) | 41 (85.4%) |
| Total (Category) | 135 (28.1%) | 346 (71.9%) |
| Total (Overall) | 1,504 (54.5%) | 1,255 (45.5%) |
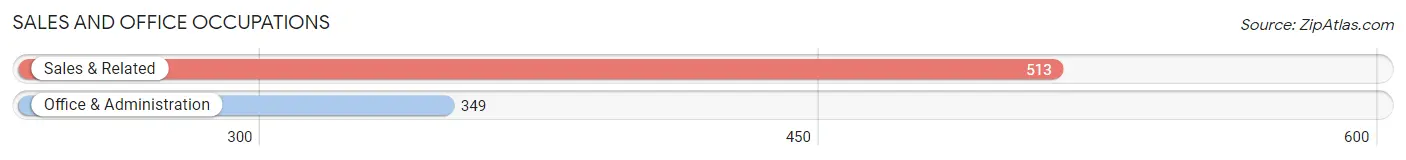
Sales and Office Occupations
The most common Sales and Office occupations in Colby are Sales & Related (513 | 18.6%), and Office & Administration (349 | 12.7%).
Sales and Office Occupations by Sex
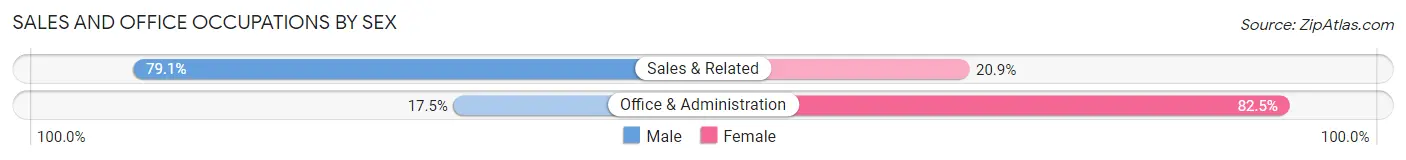
| Occupation | Male | Female |
| Sales & Related | 406 (79.1%) | 107 (20.9%) |
| Office & Administration | 61 (17.5%) | 288 (82.5%) |
| Total (Category) | 467 (54.2%) | 395 (45.8%) |
| Total (Overall) | 1,504 (54.5%) | 1,255 (45.5%) |
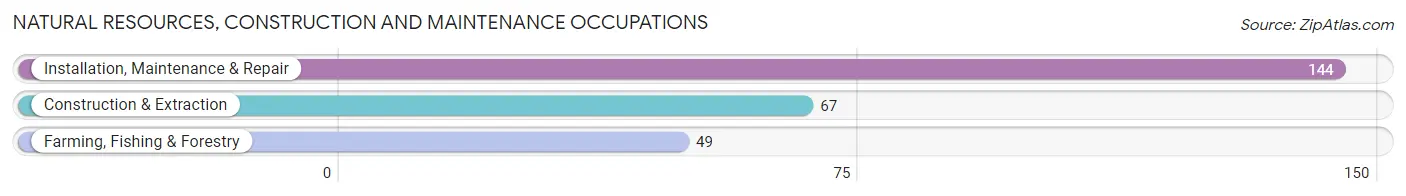
Natural Resources, Construction and Maintenance Occupations
The most common Natural Resources, Construction and Maintenance occupations in Colby are Installation, Maintenance & Repair (144 | 5.2%), Construction & Extraction (67 | 2.4%), and Farming, Fishing & Forestry (49 | 1.8%).
Natural Resources, Construction and Maintenance Occupations by Sex
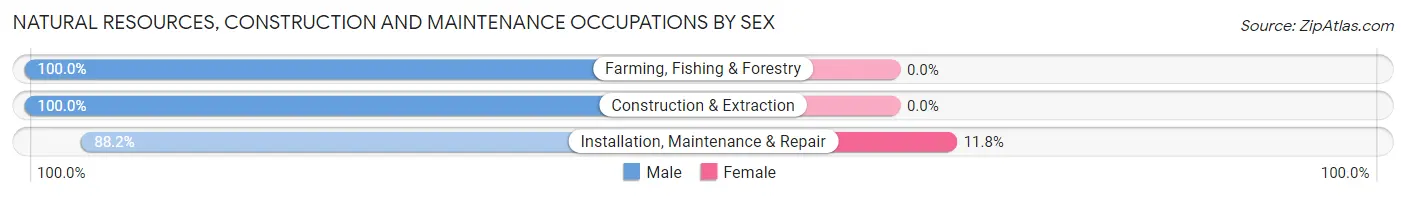
| Occupation | Male | Female |
| Farming, Fishing & Forestry | 49 (100.0%) | 0 (0.0%) |
| Construction & Extraction | 67 (100.0%) | 0 (0.0%) |
| Installation, Maintenance & Repair | 127 (88.2%) | 17 (11.8%) |
| Total (Category) | 243 (93.5%) | 17 (6.5%) |
| Total (Overall) | 1,504 (54.5%) | 1,255 (45.5%) |
Production, Transportation and Moving Occupations
The most common Production, Transportation and Moving occupations in Colby are Production (162 | 5.9%), Material Moving (149 | 5.4%), and Transportation (53 | 1.9%).
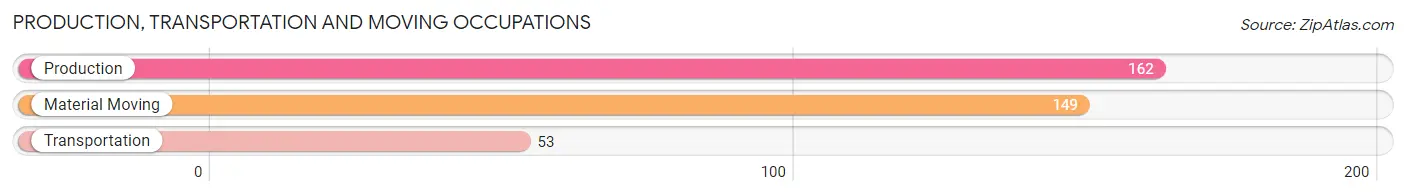
Production, Transportation and Moving Occupations by Sex
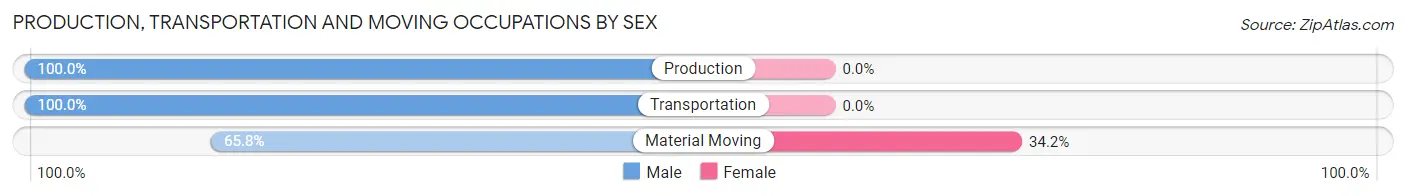
| Occupation | Male | Female |
| Production | 162 (100.0%) | 0 (0.0%) |
| Transportation | 53 (100.0%) | 0 (0.0%) |
| Material Moving | 98 (65.8%) | 51 (34.2%) |
| Total (Category) | 313 (86.0%) | 51 (14.0%) |
| Total (Overall) | 1,504 (54.5%) | 1,255 (45.5%) |
Employment Industries by Sex in Colby
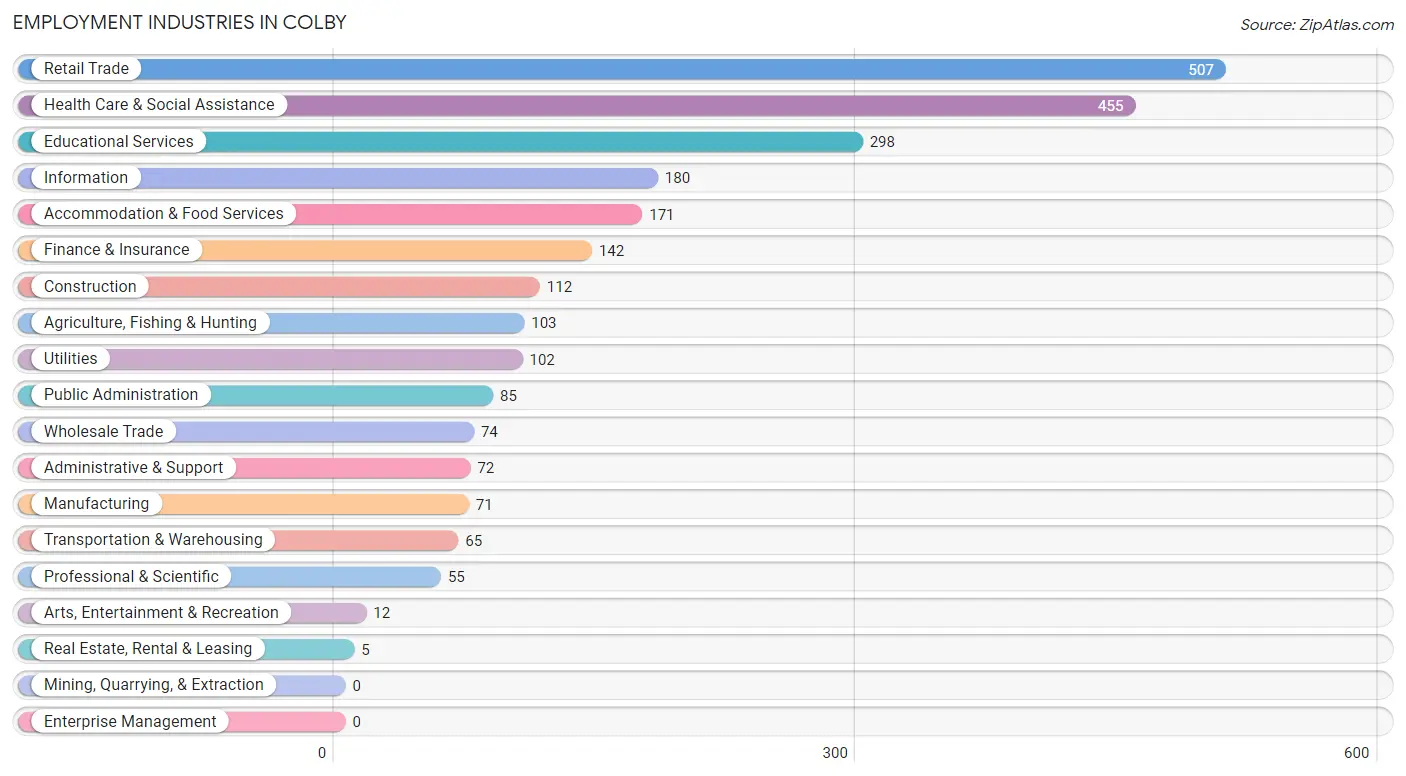
Employment Industries in Colby
The major employment industries in Colby include Retail Trade (507 | 18.4%), Health Care & Social Assistance (455 | 16.5%), Educational Services (298 | 10.8%), Information (180 | 6.5%), and Accommodation & Food Services (171 | 6.2%).
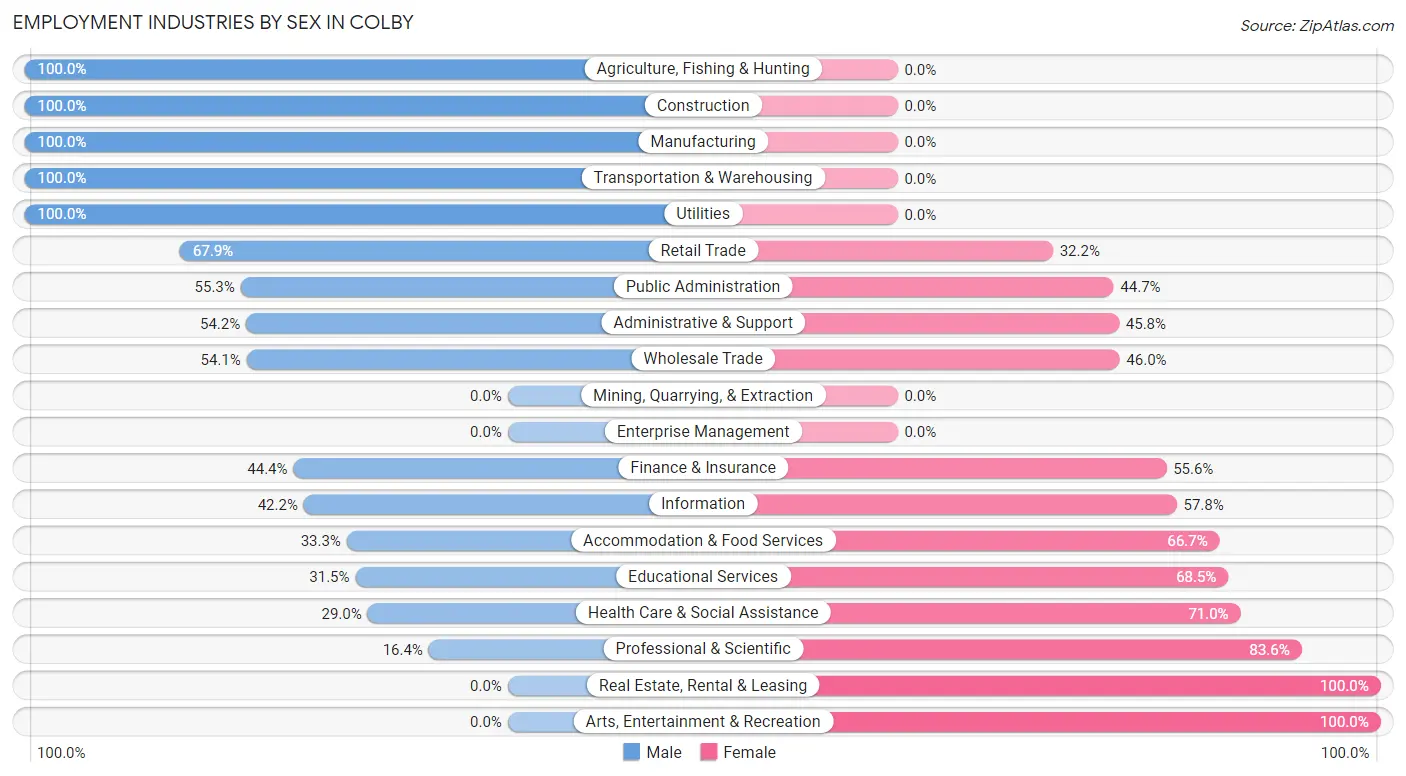
Employment Industries by Sex in Colby
The Colby industries that see more men than women are Agriculture, Fishing & Hunting (100.0%), Construction (100.0%), and Manufacturing (100.0%), whereas the industries that tend to have a higher number of women are Real Estate, Rental & Leasing (100.0%), Arts, Entertainment & Recreation (100.0%), and Professional & Scientific (83.6%).
| Industry | Male | Female |
| Agriculture, Fishing & Hunting | 103 (100.0%) | 0 (0.0%) |
| Mining, Quarrying, & Extraction | 0 (0.0%) | 0 (0.0%) |
| Construction | 112 (100.0%) | 0 (0.0%) |
| Manufacturing | 71 (100.0%) | 0 (0.0%) |
| Wholesale Trade | 40 (54.0%) | 34 (46.0%) |
| Retail Trade | 344 (67.8%) | 163 (32.2%) |
| Transportation & Warehousing | 65 (100.0%) | 0 (0.0%) |
| Utilities | 102 (100.0%) | 0 (0.0%) |
| Information | 76 (42.2%) | 104 (57.8%) |
| Finance & Insurance | 63 (44.4%) | 79 (55.6%) |
| Real Estate, Rental & Leasing | 0 (0.0%) | 5 (100.0%) |
| Professional & Scientific | 9 (16.4%) | 46 (83.6%) |
| Enterprise Management | 0 (0.0%) | 0 (0.0%) |
| Administrative & Support | 39 (54.2%) | 33 (45.8%) |
| Educational Services | 94 (31.5%) | 204 (68.5%) |
| Health Care & Social Assistance | 132 (29.0%) | 323 (71.0%) |
| Arts, Entertainment & Recreation | 0 (0.0%) | 12 (100.0%) |
| Accommodation & Food Services | 57 (33.3%) | 114 (66.7%) |
| Public Administration | 47 (55.3%) | 38 (44.7%) |
| Total | 1,504 (54.5%) | 1,255 (45.5%) |
Education in Colby
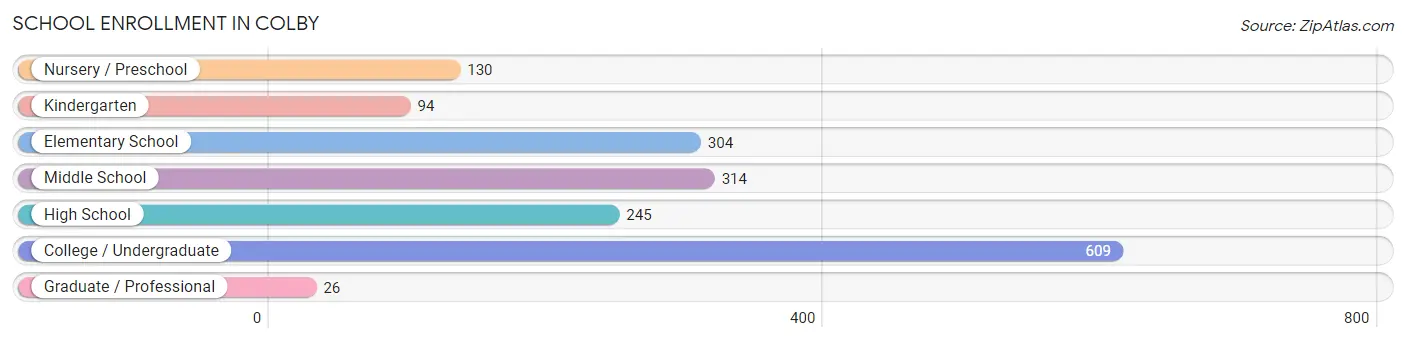
School Enrollment in Colby
The most common levels of schooling among the 1,722 students in Colby are college / undergraduate (609 | 35.4%), middle school (314 | 18.2%), and elementary school (304 | 17.6%).
| School Level | # Students | % Students |
| Nursery / Preschool | 130 | 7.5% |
| Kindergarten | 94 | 5.5% |
| Elementary School | 304 | 17.6% |
| Middle School | 314 | 18.2% |
| High School | 245 | 14.2% |
| College / Undergraduate | 609 | 35.4% |
| Graduate / Professional | 26 | 1.5% |
| Total | 1,722 | 100.0% |
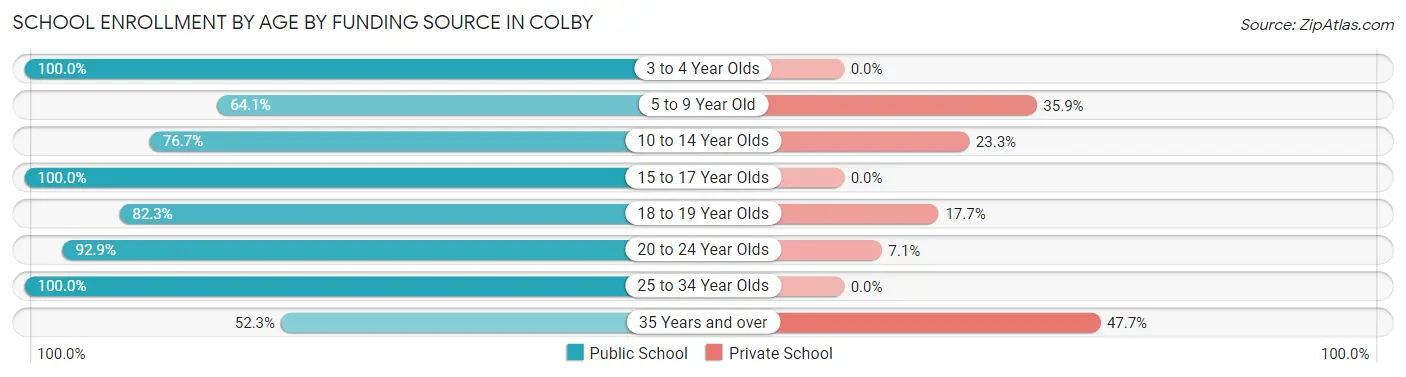
School Enrollment by Age by Funding Source in Colby
Out of a total of 1,722 students who are enrolled in schools in Colby, 375 (21.8%) attend a private institution, while the remaining 1,347 (78.2%) are enrolled in public schools. The age group of 35 years and over has the highest likelihood of being enrolled in private schools, with 42 (47.7% in the age bracket) enrolled. Conversely, the age group of 3 to 4 year olds has the lowest likelihood of being enrolled in a private school, with 45 (100.0% in the age bracket) attending a public institution.
| Age Bracket | Public School | Private School |
| 3 to 4 Year Olds | 45 (100.0%) | 0 (0.0%) |
| 5 to 9 Year Old | 300 (64.1%) | 168 (35.9%) |
| 10 to 14 Year Olds | 276 (76.7%) | 84 (23.3%) |
| 15 to 17 Year Olds | 166 (100.0%) | 0 (0.0%) |
| 18 to 19 Year Olds | 317 (82.3%) | 68 (17.7%) |
| 20 to 24 Year Olds | 171 (92.9%) | 13 (7.1%) |
| 25 to 34 Year Olds | 26 (100.0%) | 0 (0.0%) |
| 35 Years and over | 46 (52.3%) | 42 (47.7%) |
| Total | 1,347 (78.2%) | 375 (21.8%) |
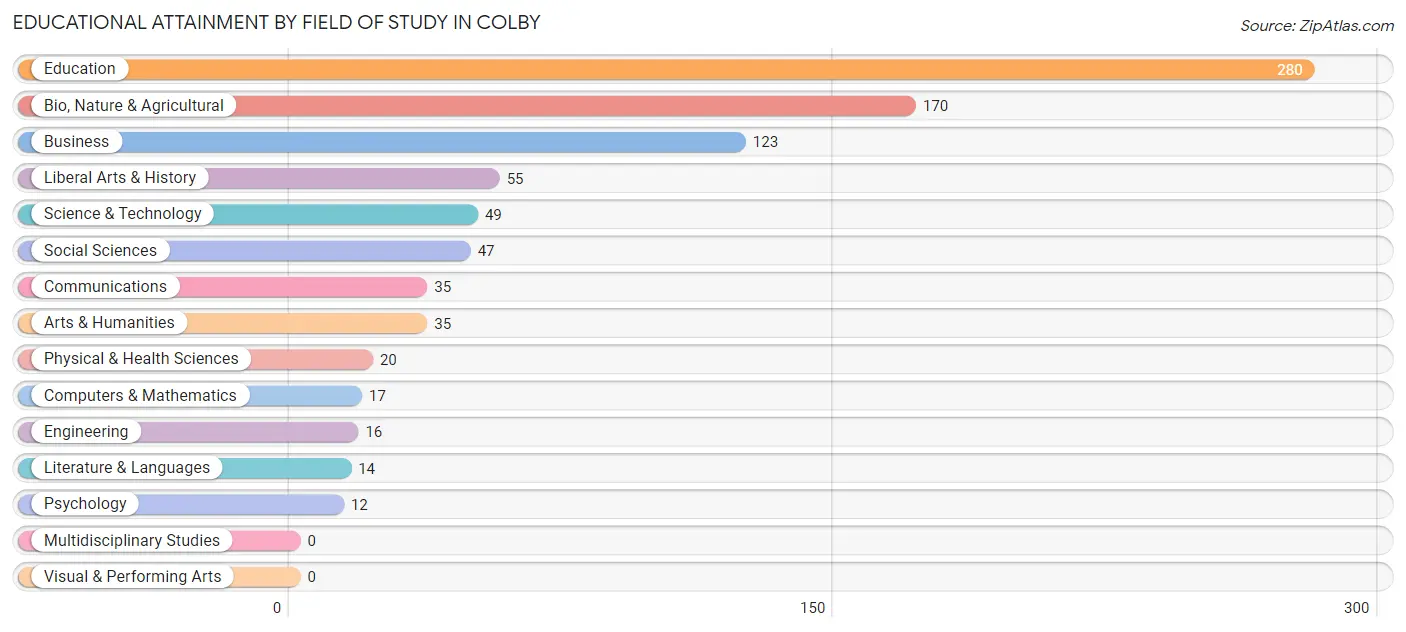
Educational Attainment by Field of Study in Colby
Education (280 | 32.1%), bio, nature & agricultural (170 | 19.5%), business (123 | 14.1%), liberal arts & history (55 | 6.3%), and science & technology (49 | 5.6%) are the most common fields of study among 873 individuals in Colby who have obtained a bachelor's degree or higher.
| Field of Study | # Graduates | % Graduates |
| Computers & Mathematics | 17 | 1.9% |
| Bio, Nature & Agricultural | 170 | 19.5% |
| Physical & Health Sciences | 20 | 2.3% |
| Psychology | 12 | 1.4% |
| Social Sciences | 47 | 5.4% |
| Engineering | 16 | 1.8% |
| Multidisciplinary Studies | 0 | 0.0% |
| Science & Technology | 49 | 5.6% |
| Business | 123 | 14.1% |
| Education | 280 | 32.1% |
| Literature & Languages | 14 | 1.6% |
| Liberal Arts & History | 55 | 6.3% |
| Visual & Performing Arts | 0 | 0.0% |
| Communications | 35 | 4.0% |
| Arts & Humanities | 35 | 4.0% |
| Total | 873 | 100.0% |
Transportation & Commute in Colby
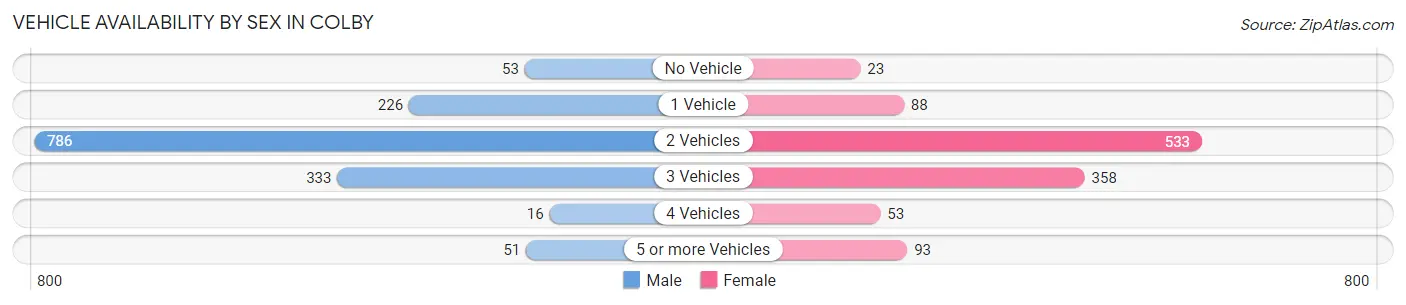
Vehicle Availability by Sex in Colby
The most prevalent vehicle ownership categories in Colby are males with 2 vehicles (786, accounting for 53.6%) and females with 2 vehicles (533, making up 68.5%).
| Vehicles Available | Male | Female |
| No Vehicle | 53 (3.6%) | 23 (2.0%) |
| 1 Vehicle | 226 (15.4%) | 88 (7.7%) |
| 2 Vehicles | 786 (53.6%) | 533 (46.4%) |
| 3 Vehicles | 333 (22.7%) | 358 (31.2%) |
| 4 Vehicles | 16 (1.1%) | 53 (4.6%) |
| 5 or more Vehicles | 51 (3.5%) | 93 (8.1%) |
| Total | 1,465 (100.0%) | 1,148 (100.0%) |
Commute Time in Colby
The most frequently occuring commute durations in Colby are 5 to 9 minutes (1,070 commuters, 41.8%), less than 5 minutes (531 commuters, 20.8%), and 10 to 14 minutes (500 commuters, 19.6%).
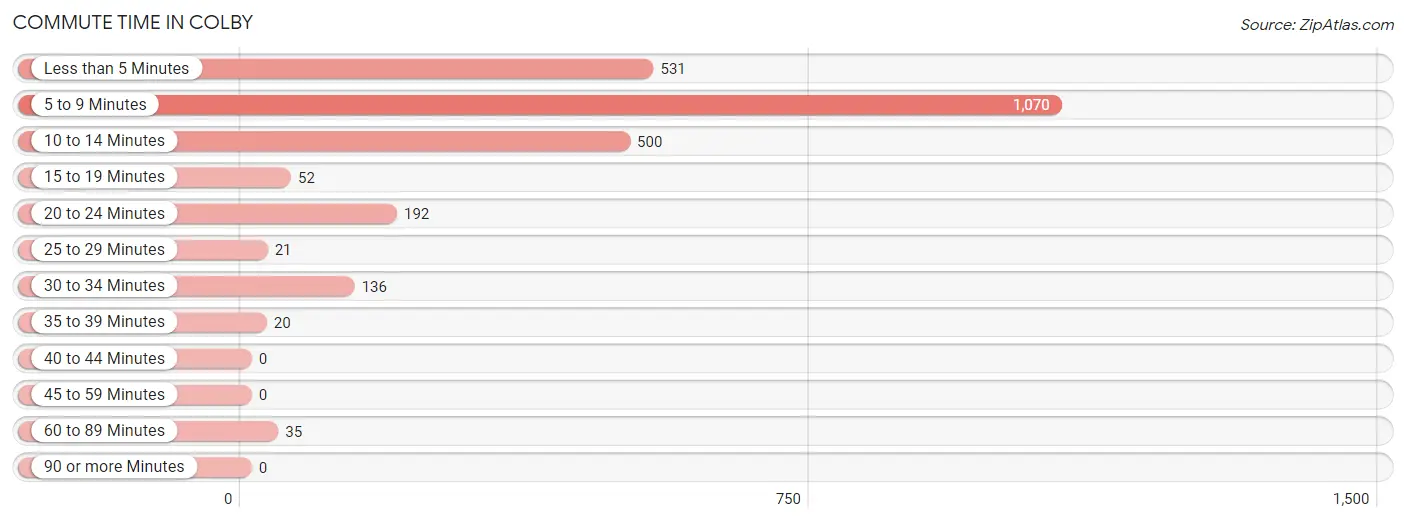
| Commute Time | # Commuters | % Commuters |
| Less than 5 Minutes | 531 | 20.8% |
| 5 to 9 Minutes | 1,070 | 41.8% |
| 10 to 14 Minutes | 500 | 19.6% |
| 15 to 19 Minutes | 52 | 2.0% |
| 20 to 24 Minutes | 192 | 7.5% |
| 25 to 29 Minutes | 21 | 0.8% |
| 30 to 34 Minutes | 136 | 5.3% |
| 35 to 39 Minutes | 20 | 0.8% |
| 40 to 44 Minutes | 0 | 0.0% |
| 45 to 59 Minutes | 0 | 0.0% |
| 60 to 89 Minutes | 35 | 1.4% |
| 90 or more Minutes | 0 | 0.0% |
Commute Time by Sex in Colby
The most common commute times in Colby are 5 to 9 minutes (483 commuters, 33.4%) for males and 5 to 9 minutes (587 commuters, 52.8%) for females.
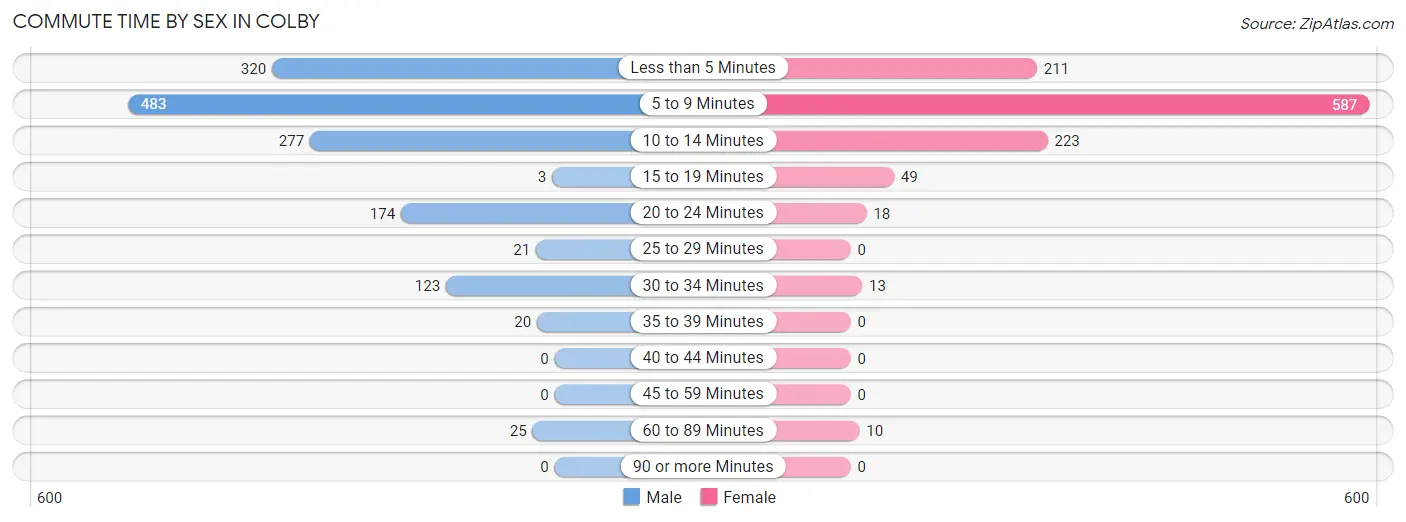
| Commute Time | Male | Female |
| Less than 5 Minutes | 320 (22.1%) | 211 (19.0%) |
| 5 to 9 Minutes | 483 (33.4%) | 587 (52.8%) |
| 10 to 14 Minutes | 277 (19.2%) | 223 (20.1%) |
| 15 to 19 Minutes | 3 (0.2%) | 49 (4.4%) |
| 20 to 24 Minutes | 174 (12.0%) | 18 (1.6%) |
| 25 to 29 Minutes | 21 (1.5%) | 0 (0.0%) |
| 30 to 34 Minutes | 123 (8.5%) | 13 (1.2%) |
| 35 to 39 Minutes | 20 (1.4%) | 0 (0.0%) |
| 40 to 44 Minutes | 0 (0.0%) | 0 (0.0%) |
| 45 to 59 Minutes | 0 (0.0%) | 0 (0.0%) |
| 60 to 89 Minutes | 25 (1.7%) | 10 (0.9%) |
| 90 or more Minutes | 0 (0.0%) | 0 (0.0%) |
Time of Departure to Work by Sex in Colby
The most frequent times of departure to work in Colby are 7:30 AM to 7:59 AM (456, 31.5%) for males and 7:30 AM to 7:59 AM (466, 41.9%) for females.
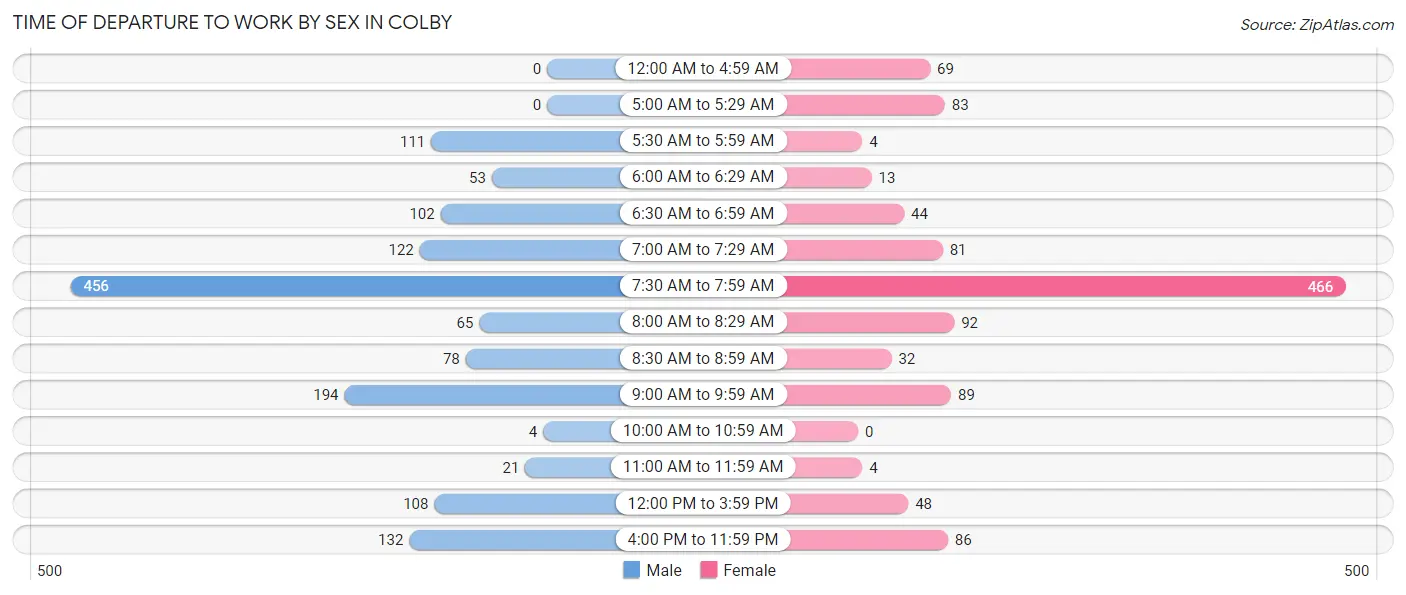
| Time of Departure | Male | Female |
| 12:00 AM to 4:59 AM | 0 (0.0%) | 69 (6.2%) |
| 5:00 AM to 5:29 AM | 0 (0.0%) | 83 (7.5%) |
| 5:30 AM to 5:59 AM | 111 (7.7%) | 4 (0.4%) |
| 6:00 AM to 6:29 AM | 53 (3.7%) | 13 (1.2%) |
| 6:30 AM to 6:59 AM | 102 (7.0%) | 44 (4.0%) |
| 7:00 AM to 7:29 AM | 122 (8.4%) | 81 (7.3%) |
| 7:30 AM to 7:59 AM | 456 (31.5%) | 466 (41.9%) |
| 8:00 AM to 8:29 AM | 65 (4.5%) | 92 (8.3%) |
| 8:30 AM to 8:59 AM | 78 (5.4%) | 32 (2.9%) |
| 9:00 AM to 9:59 AM | 194 (13.4%) | 89 (8.0%) |
| 10:00 AM to 10:59 AM | 4 (0.3%) | 0 (0.0%) |
| 11:00 AM to 11:59 AM | 21 (1.5%) | 4 (0.4%) |
| 12:00 PM to 3:59 PM | 108 (7.5%) | 48 (4.3%) |
| 4:00 PM to 11:59 PM | 132 (9.1%) | 86 (7.7%) |
| Total | 1,446 (100.0%) | 1,111 (100.0%) |
Housing Occupancy in Colby
Occupancy by Ownership in Colby
Of the total 2,118 dwellings in Colby, owner-occupied units account for 1,359 (64.2%), while renter-occupied units make up 759 (35.8%).
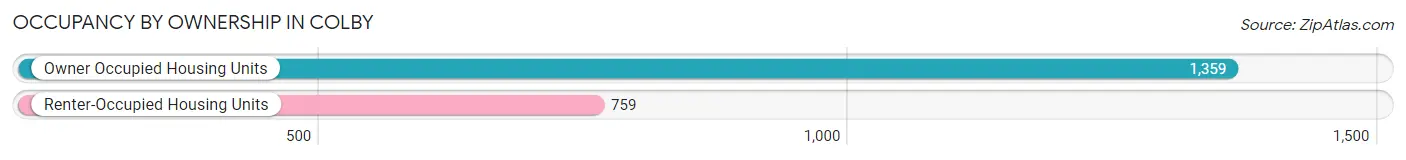
| Occupancy | # Housing Units | % Housing Units |
| Owner Occupied Housing Units | 1,359 | 64.2% |
| Renter-Occupied Housing Units | 759 | 35.8% |
| Total Occupied Housing Units | 2,118 | 100.0% |
Occupancy by Household Size in Colby
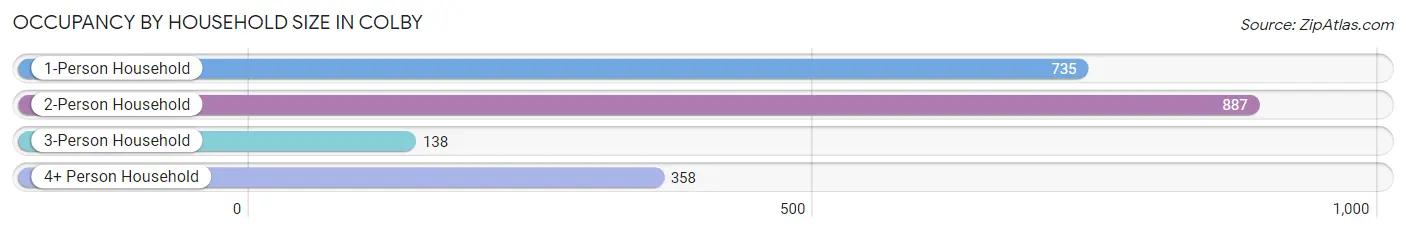
| Household Size | # Housing Units | % Housing Units |
| 1-Person Household | 735 | 34.7% |
| 2-Person Household | 887 | 41.9% |
| 3-Person Household | 138 | 6.5% |
| 4+ Person Household | 358 | 16.9% |
| Total Housing Units | 2,118 | 100.0% |
Occupancy by Ownership by Household Size in Colby
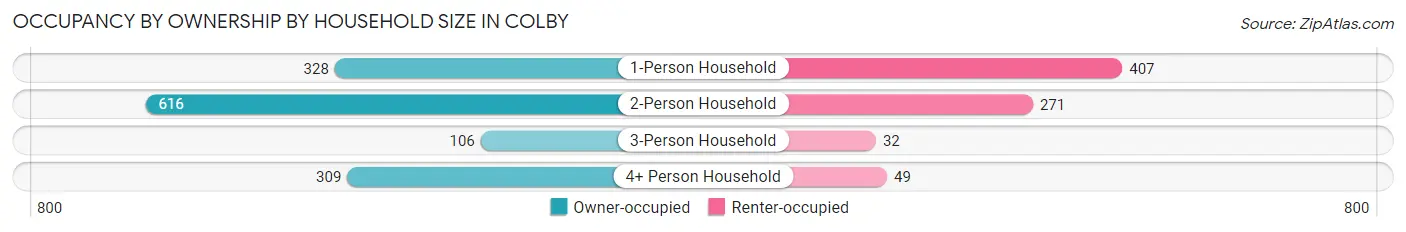
| Household Size | Owner-occupied | Renter-occupied |
| 1-Person Household | 328 (44.6%) | 407 (55.4%) |
| 2-Person Household | 616 (69.5%) | 271 (30.5%) |
| 3-Person Household | 106 (76.8%) | 32 (23.2%) |
| 4+ Person Household | 309 (86.3%) | 49 (13.7%) |
| Total Housing Units | 1,359 (64.2%) | 759 (35.8%) |
Occupancy by Educational Attainment in Colby
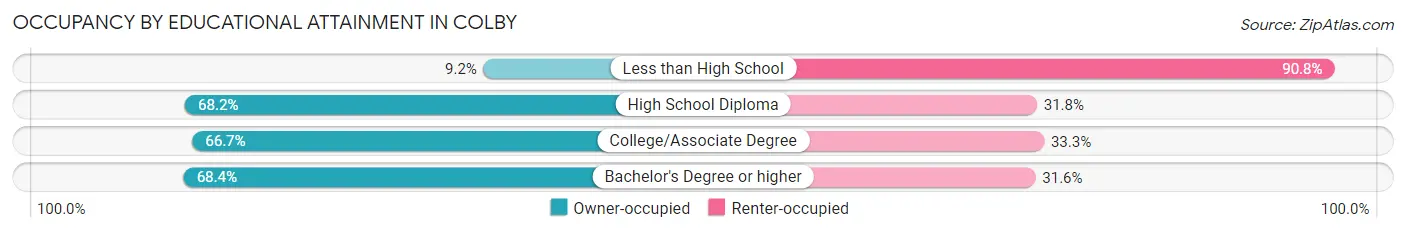
| Household Size | Owner-occupied | Renter-occupied |
| Less than High School | 11 (9.2%) | 109 (90.8%) |
| High School Diploma | 274 (68.2%) | 128 (31.8%) |
| College/Associate Degree | 714 (66.7%) | 356 (33.3%) |
| Bachelor's Degree or higher | 360 (68.4%) | 166 (31.6%) |
Occupancy by Age of Householder in Colby
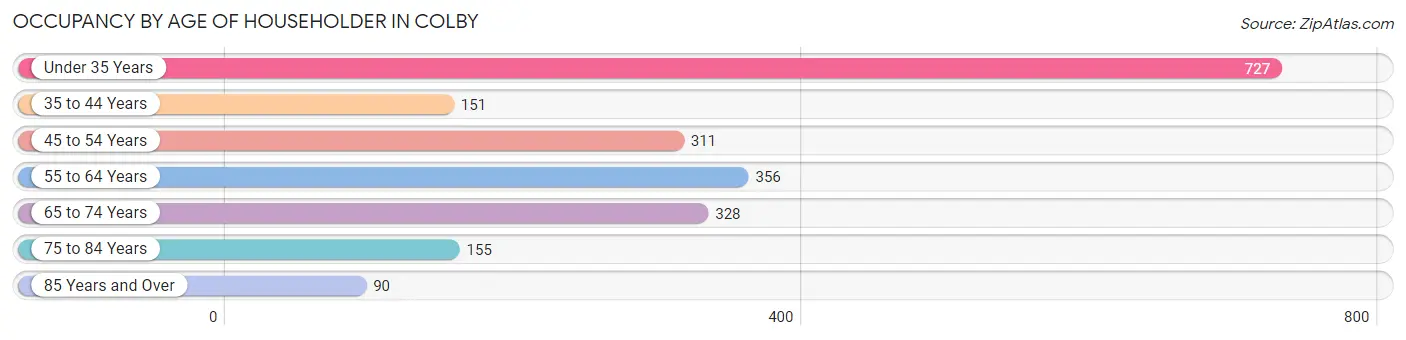
| Age Bracket | # Households | % Households |
| Under 35 Years | 727 | 34.3% |
| 35 to 44 Years | 151 | 7.1% |
| 45 to 54 Years | 311 | 14.7% |
| 55 to 64 Years | 356 | 16.8% |
| 65 to 74 Years | 328 | 15.5% |
| 75 to 84 Years | 155 | 7.3% |
| 85 Years and Over | 90 | 4.3% |
| Total | 2,118 | 100.0% |
Housing Finances in Colby
Median Income by Occupancy in Colby
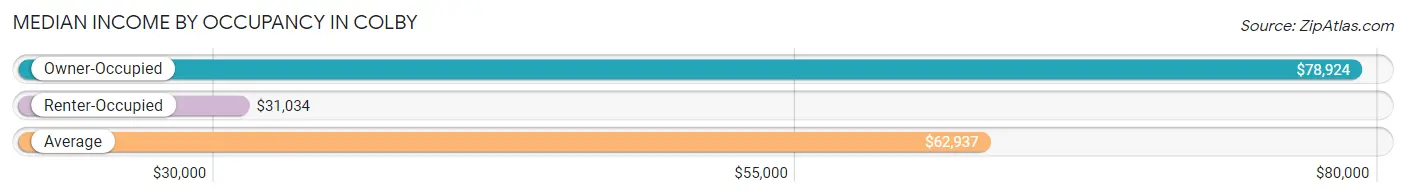
| Occupancy Type | # Households | Median Income |
| Owner-Occupied | 1,359 (64.2%) | $78,924 |
| Renter-Occupied | 759 (35.8%) | $31,034 |
| Average | 2,118 (100.0%) | $62,937 |
Occupancy by Householder Income Bracket in Colby
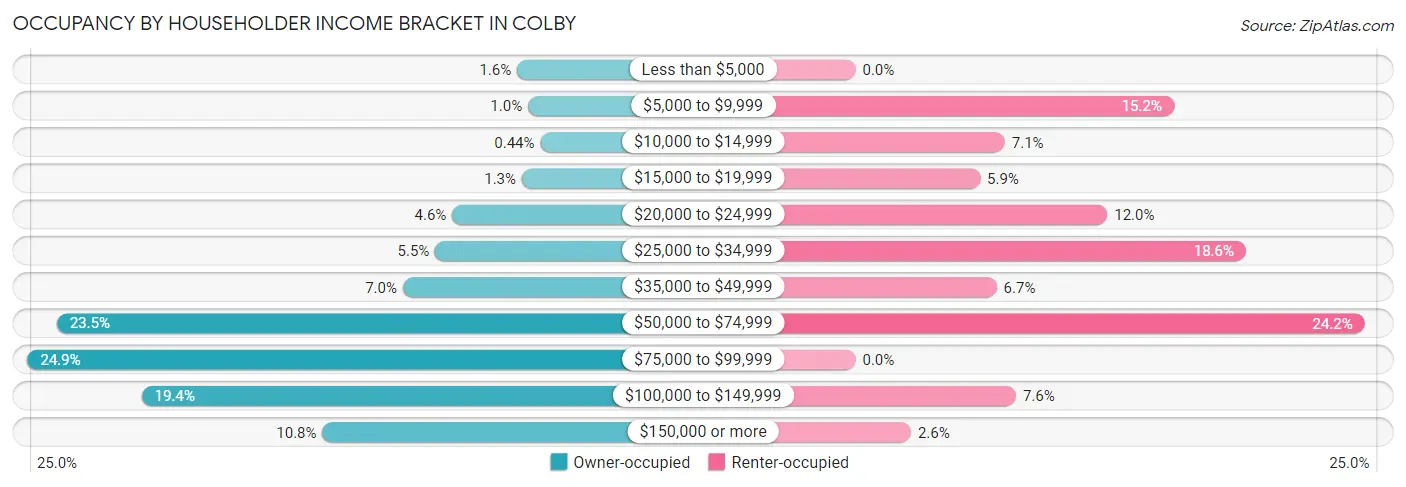
| Income Bracket | Owner-occupied | Renter-occupied |
| Less than $5,000 | 21 (1.5%) | 0 (0.0%) |
| $5,000 to $9,999 | 14 (1.0%) | 115 (15.1%) |
| $10,000 to $14,999 | 6 (0.4%) | 54 (7.1%) |
| $15,000 to $19,999 | 18 (1.3%) | 45 (5.9%) |
| $20,000 to $24,999 | 63 (4.6%) | 91 (12.0%) |
| $25,000 to $34,999 | 74 (5.4%) | 141 (18.6%) |
| $35,000 to $49,999 | 95 (7.0%) | 51 (6.7%) |
| $50,000 to $74,999 | 319 (23.5%) | 184 (24.2%) |
| $75,000 to $99,999 | 338 (24.9%) | 0 (0.0%) |
| $100,000 to $149,999 | 264 (19.4%) | 58 (7.6%) |
| $150,000 or more | 147 (10.8%) | 20 (2.6%) |
| Total | 1,359 (100.0%) | 759 (100.0%) |
Monthly Housing Cost Tiers in Colby
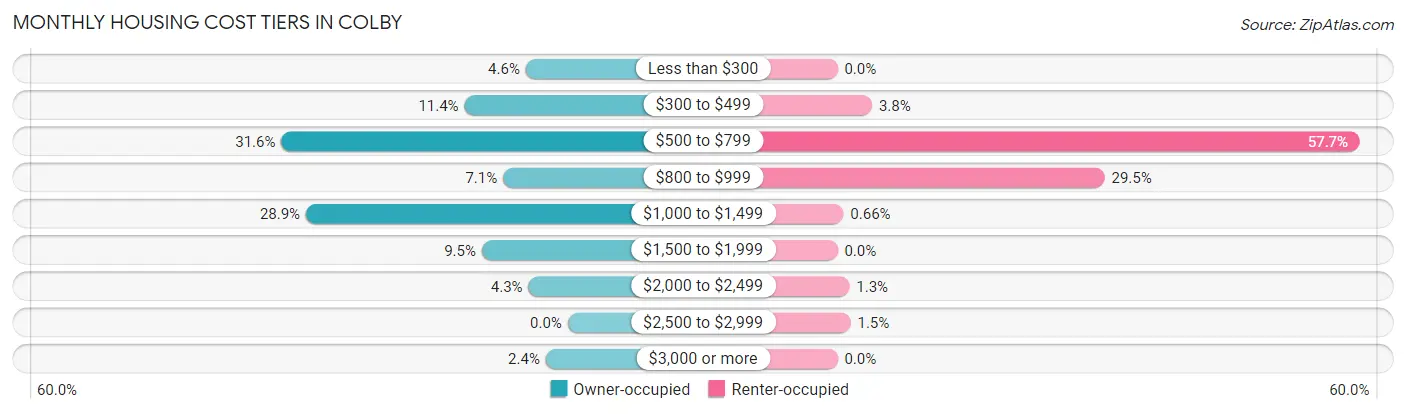
| Monthly Cost | Owner-occupied | Renter-occupied |
| Less than $300 | 63 (4.6%) | 0 (0.0%) |
| $300 to $499 | 155 (11.4%) | 29 (3.8%) |
| $500 to $799 | 430 (31.6%) | 438 (57.7%) |
| $800 to $999 | 97 (7.1%) | 224 (29.5%) |
| $1,000 to $1,499 | 393 (28.9%) | 5 (0.7%) |
| $1,500 to $1,999 | 129 (9.5%) | 0 (0.0%) |
| $2,000 to $2,499 | 59 (4.3%) | 10 (1.3%) |
| $2,500 to $2,999 | 0 (0.0%) | 11 (1.5%) |
| $3,000 or more | 33 (2.4%) | 0 (0.0%) |
| Total | 1,359 (100.0%) | 759 (100.0%) |
Physical Housing Characteristics in Colby
Housing Structures in Colby
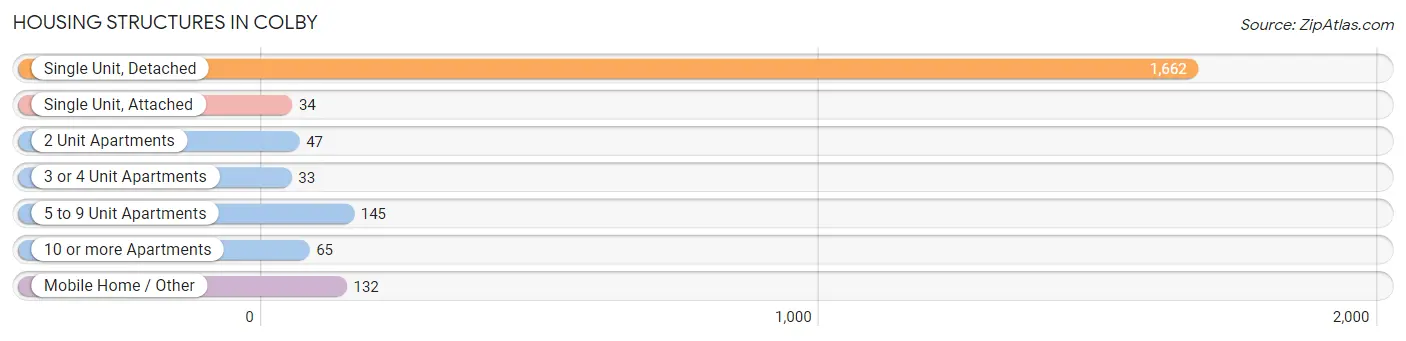
| Structure Type | # Housing Units | % Housing Units |
| Single Unit, Detached | 1,662 | 78.5% |
| Single Unit, Attached | 34 | 1.6% |
| 2 Unit Apartments | 47 | 2.2% |
| 3 or 4 Unit Apartments | 33 | 1.6% |
| 5 to 9 Unit Apartments | 145 | 6.9% |
| 10 or more Apartments | 65 | 3.1% |
| Mobile Home / Other | 132 | 6.2% |
| Total | 2,118 | 100.0% |
Housing Structures by Occupancy in Colby
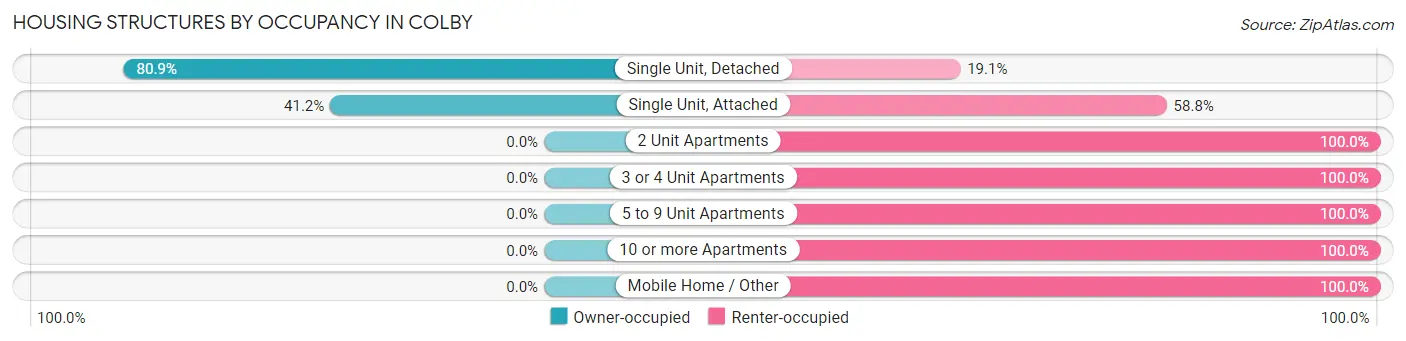
| Structure Type | Owner-occupied | Renter-occupied |
| Single Unit, Detached | 1,345 (80.9%) | 317 (19.1%) |
| Single Unit, Attached | 14 (41.2%) | 20 (58.8%) |
| 2 Unit Apartments | 0 (0.0%) | 47 (100.0%) |
| 3 or 4 Unit Apartments | 0 (0.0%) | 33 (100.0%) |
| 5 to 9 Unit Apartments | 0 (0.0%) | 145 (100.0%) |
| 10 or more Apartments | 0 (0.0%) | 65 (100.0%) |
| Mobile Home / Other | 0 (0.0%) | 132 (100.0%) |
| Total | 1,359 (64.2%) | 759 (35.8%) |
Housing Structures by Number of Rooms in Colby
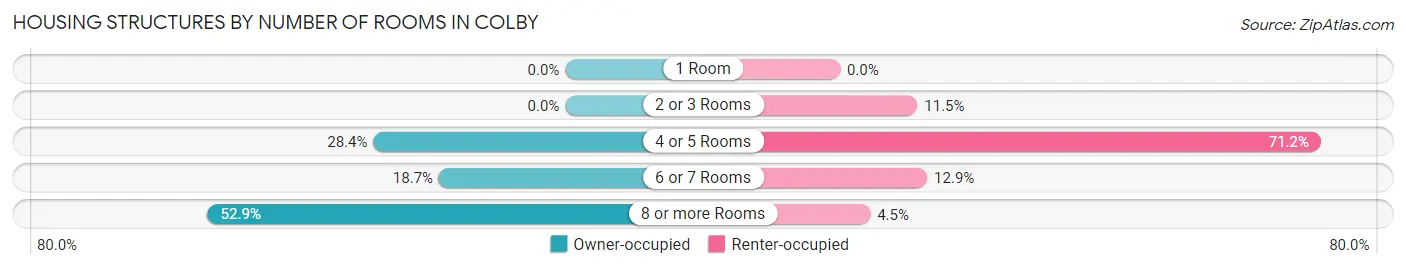
| Number of Rooms | Owner-occupied | Renter-occupied |
| 1 Room | 0 (0.0%) | 0 (0.0%) |
| 2 or 3 Rooms | 0 (0.0%) | 87 (11.5%) |
| 4 or 5 Rooms | 386 (28.4%) | 540 (71.2%) |
| 6 or 7 Rooms | 254 (18.7%) | 98 (12.9%) |
| 8 or more Rooms | 719 (52.9%) | 34 (4.5%) |
| Total | 1,359 (100.0%) | 759 (100.0%) |
Housing Structure by Heating Type in Colby
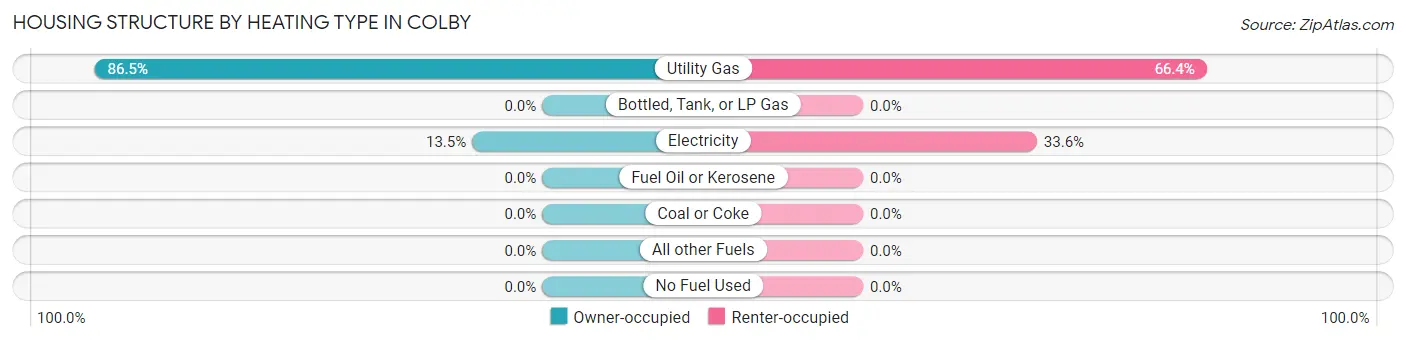
| Heating Type | Owner-occupied | Renter-occupied |
| Utility Gas | 1,175 (86.5%) | 504 (66.4%) |
| Bottled, Tank, or LP Gas | 0 (0.0%) | 0 (0.0%) |
| Electricity | 184 (13.5%) | 255 (33.6%) |
| Fuel Oil or Kerosene | 0 (0.0%) | 0 (0.0%) |
| Coal or Coke | 0 (0.0%) | 0 (0.0%) |
| All other Fuels | 0 (0.0%) | 0 (0.0%) |
| No Fuel Used | 0 (0.0%) | 0 (0.0%) |
| Total | 1,359 (100.0%) | 759 (100.0%) |
Household Vehicle Usage in Colby
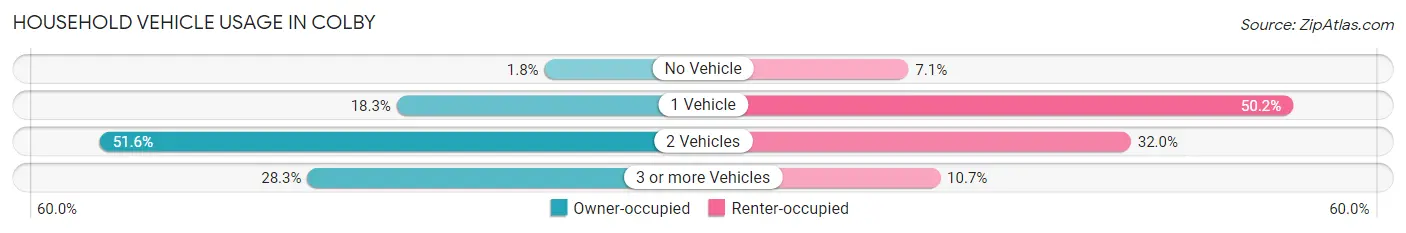
| Vehicles per Household | Owner-occupied | Renter-occupied |
| No Vehicle | 24 (1.8%) | 54 (7.1%) |
| 1 Vehicle | 249 (18.3%) | 381 (50.2%) |
| 2 Vehicles | 701 (51.6%) | 243 (32.0%) |
| 3 or more Vehicles | 385 (28.3%) | 81 (10.7%) |
| Total | 1,359 (100.0%) | 759 (100.0%) |
Real Estate & Mortgages in Colby
Real Estate and Mortgage Overview in Colby
| Characteristic | Without Mortgage | With Mortgage |
| Housing Units | 564 | 795 |
| Median Property Value | $138,700 | $163,900 |
| Median Household Income | $72,625 | $73 |
| Monthly Housing Costs | $540 | $33 |
| Real Estate Taxes | $2,536 | $0 |
Property Value by Mortgage Status in Colby
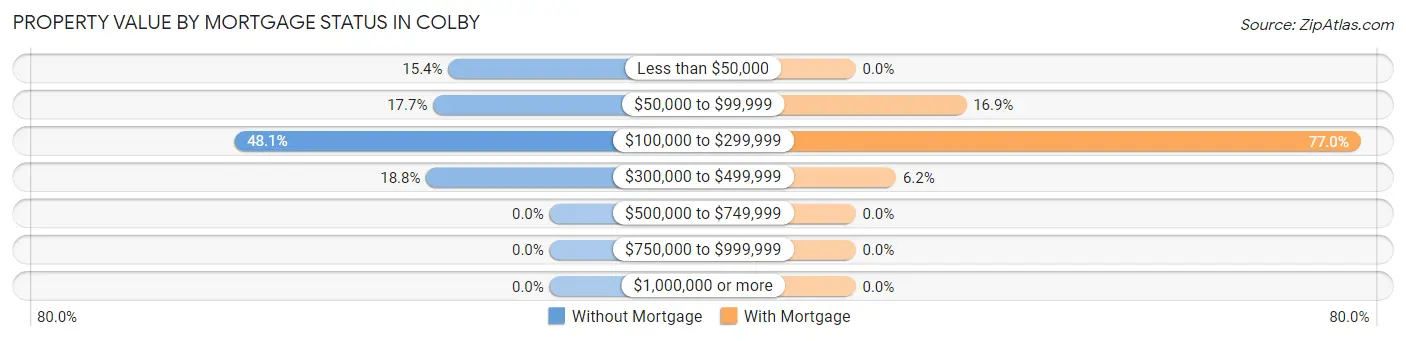
| Property Value | Without Mortgage | With Mortgage |
| Less than $50,000 | 87 (15.4%) | 0 (0.0%) |
| $50,000 to $99,999 | 100 (17.7%) | 134 (16.9%) |
| $100,000 to $299,999 | 271 (48.0%) | 612 (77.0%) |
| $300,000 to $499,999 | 106 (18.8%) | 49 (6.2%) |
| $500,000 to $749,999 | 0 (0.0%) | 0 (0.0%) |
| $750,000 to $999,999 | 0 (0.0%) | 0 (0.0%) |
| $1,000,000 or more | 0 (0.0%) | 0 (0.0%) |
| Total | 564 (100.0%) | 795 (100.0%) |
Household Income by Mortgage Status in Colby
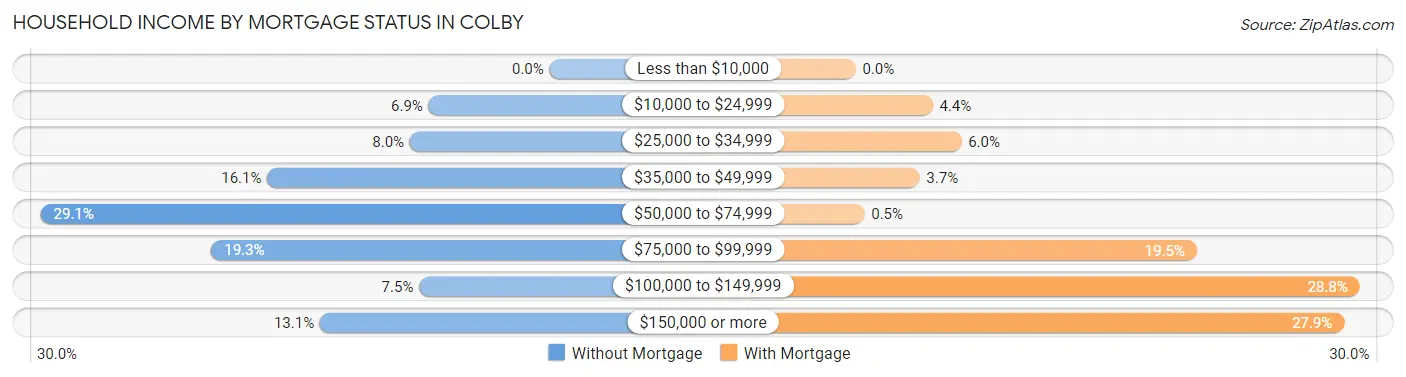
| Household Income | Without Mortgage | With Mortgage |
| Less than $10,000 | 0 (0.0%) | 0 (0.0%) |
| $10,000 to $24,999 | 39 (6.9%) | 35 (4.4%) |
| $25,000 to $34,999 | 45 (8.0%) | 48 (6.0%) |
| $35,000 to $49,999 | 91 (16.1%) | 29 (3.6%) |
| $50,000 to $74,999 | 164 (29.1%) | 4 (0.5%) |
| $75,000 to $99,999 | 109 (19.3%) | 155 (19.5%) |
| $100,000 to $149,999 | 42 (7.4%) | 229 (28.8%) |
| $150,000 or more | 74 (13.1%) | 222 (27.9%) |
| Total | 564 (100.0%) | 795 (100.0%) |
Property Value to Household Income Ratio in Colby
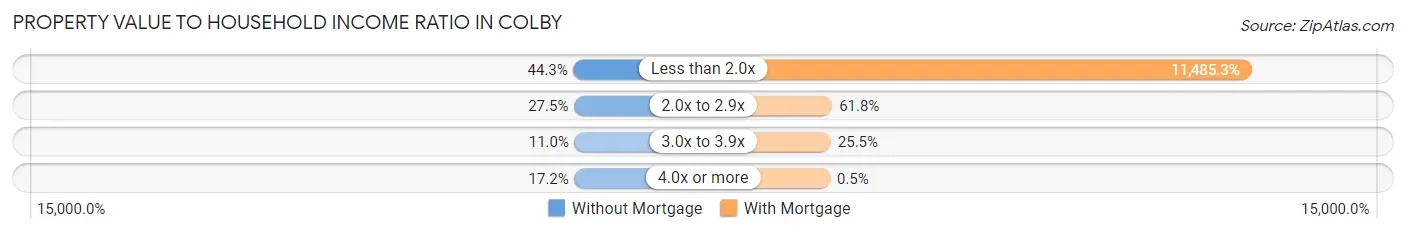
| Value-to-Income Ratio | Without Mortgage | With Mortgage |
| Less than 2.0x | 250 (44.3%) | 91,308 (11,485.3%) |
| 2.0x to 2.9x | 155 (27.5%) | 491 (61.8%) |
| 3.0x to 3.9x | 62 (11.0%) | 203 (25.5%) |
| 4.0x or more | 97 (17.2%) | 4 (0.5%) |
| Total | 564 (100.0%) | 795 (100.0%) |
Real Estate Taxes by Mortgage Status in Colby
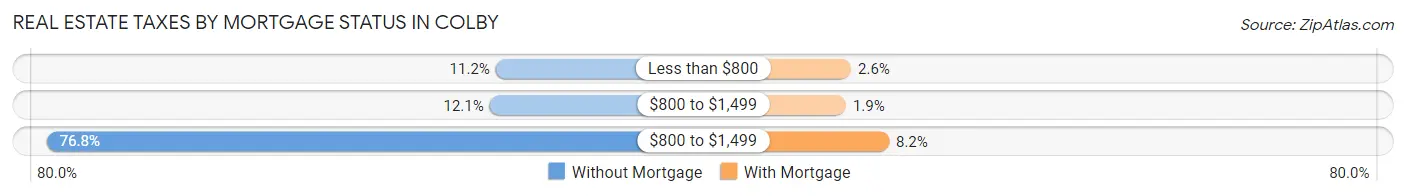
| Property Taxes | Without Mortgage | With Mortgage |
| Less than $800 | 63 (11.2%) | 21 (2.6%) |
| $800 to $1,499 | 68 (12.1%) | 15 (1.9%) |
| $800 to $1,499 | 433 (76.8%) | 65 (8.2%) |
| Total | 564 (100.0%) | 795 (100.0%) |
Health & Disability in Colby
Health Insurance Coverage by Age in Colby
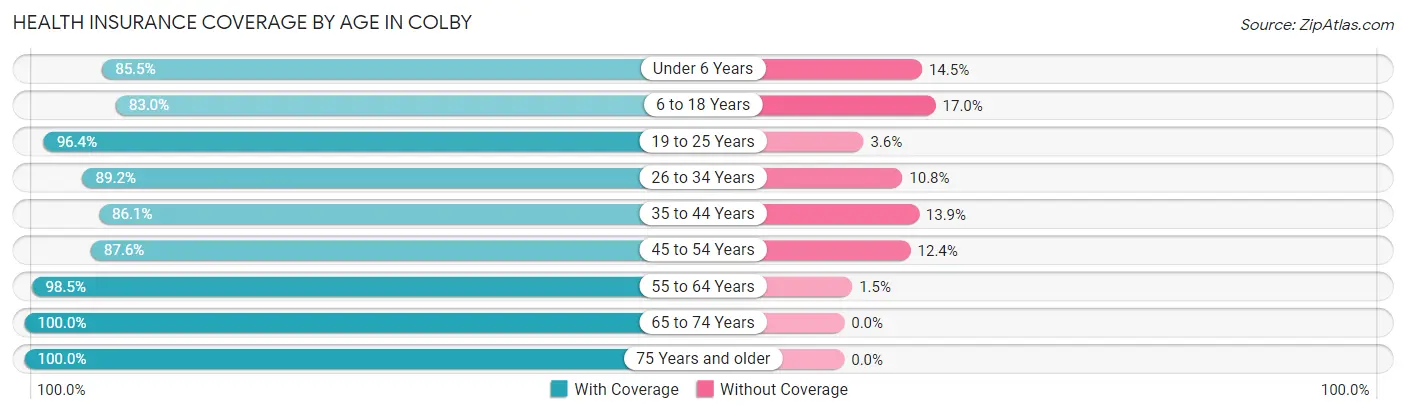
| Age Bracket | With Coverage | Without Coverage |
| Under 6 Years | 413 (85.5%) | 70 (14.5%) |
| 6 to 18 Years | 877 (83.0%) | 180 (17.0%) |
| 19 to 25 Years | 754 (96.4%) | 28 (3.6%) |
| 26 to 34 Years | 560 (89.2%) | 68 (10.8%) |
| 35 to 44 Years | 353 (86.1%) | 57 (13.9%) |
| 45 to 54 Years | 425 (87.6%) | 60 (12.4%) |
| 55 to 64 Years | 667 (98.5%) | 10 (1.5%) |
| 65 to 74 Years | 412 (100.0%) | 0 (0.0%) |
| 75 Years and older | 351 (100.0%) | 0 (0.0%) |
| Total | 4,812 (91.0%) | 473 (8.9%) |
Health Insurance Coverage by Citizenship Status in Colby
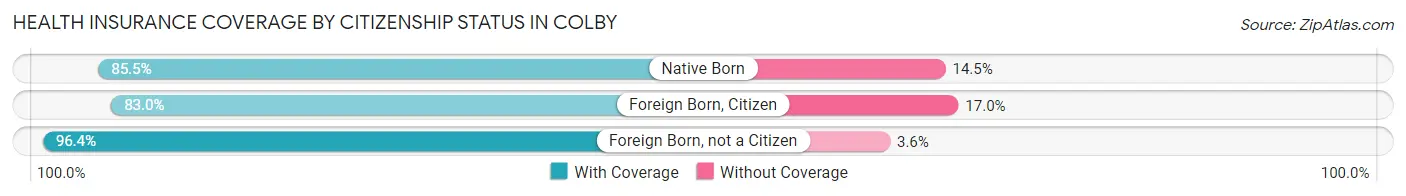
| Citizenship Status | With Coverage | Without Coverage |
| Native Born | 413 (85.5%) | 70 (14.5%) |
| Foreign Born, Citizen | 877 (83.0%) | 180 (17.0%) |
| Foreign Born, not a Citizen | 754 (96.4%) | 28 (3.6%) |
Health Insurance Coverage by Household Income in Colby
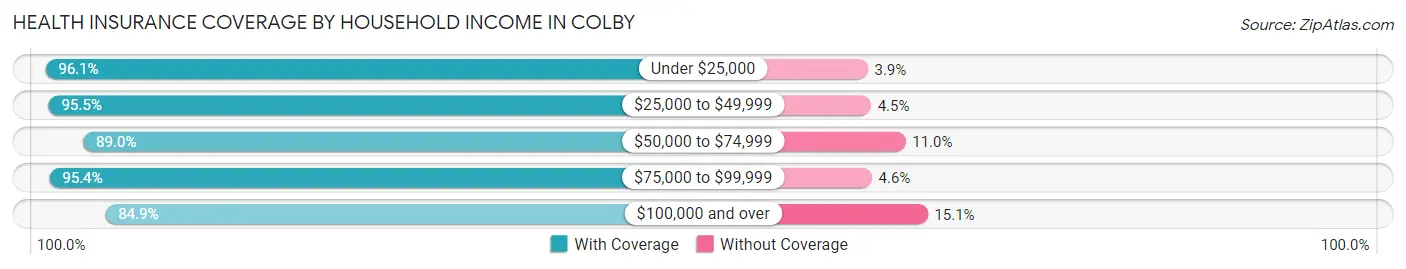
| Household Income | With Coverage | Without Coverage |
| Under $25,000 | 520 (96.1%) | 21 (3.9%) |
| $25,000 to $49,999 | 683 (95.5%) | 32 (4.5%) |
| $50,000 to $74,999 | 902 (89.0%) | 111 (11.0%) |
| $75,000 to $99,999 | 904 (95.4%) | 44 (4.6%) |
| $100,000 and over | 1,489 (84.9%) | 265 (15.1%) |
Public vs Private Health Insurance Coverage by Age in Colby
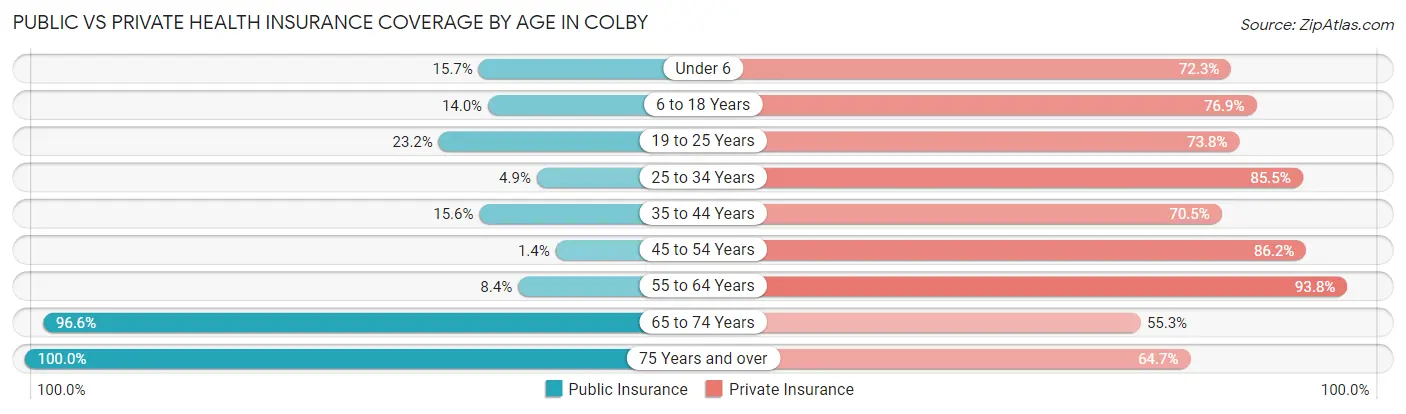
| Age Bracket | Public Insurance | Private Insurance |
| Under 6 | 76 (15.7%) | 349 (72.3%) |
| 6 to 18 Years | 148 (14.0%) | 813 (76.9%) |
| 19 to 25 Years | 181 (23.2%) | 577 (73.8%) |
| 25 to 34 Years | 31 (4.9%) | 537 (85.5%) |
| 35 to 44 Years | 64 (15.6%) | 289 (70.5%) |
| 45 to 54 Years | 7 (1.4%) | 418 (86.2%) |
| 55 to 64 Years | 57 (8.4%) | 635 (93.8%) |
| 65 to 74 Years | 398 (96.6%) | 228 (55.3%) |
| 75 Years and over | 351 (100.0%) | 227 (64.7%) |
| Total | 1,313 (24.8%) | 4,073 (77.1%) |
Disability Status by Sex by Age in Colby
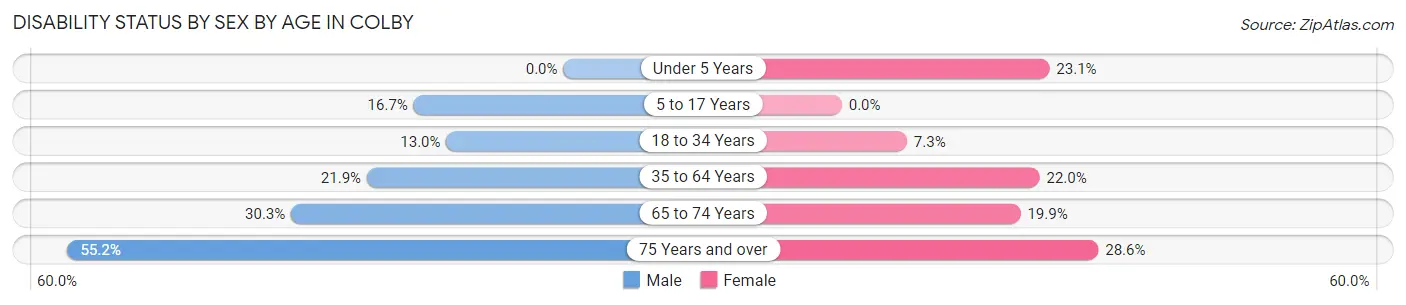
| Age Bracket | Male | Female |
| Under 5 Years | 0 (0.0%) | 43 (23.1%) |
| 5 to 17 Years | 91 (16.7%) | 0 (0.0%) |
| 18 to 34 Years | 104 (13.0%) | 57 (7.2%) |
| 35 to 64 Years | 175 (21.9%) | 170 (22.0%) |
| 65 to 74 Years | 67 (30.3%) | 38 (19.9%) |
| 75 Years and over | 74 (55.2%) | 62 (28.6%) |
Disability Class by Sex by Age in Colby
Disability Class: Hearing Difficulty
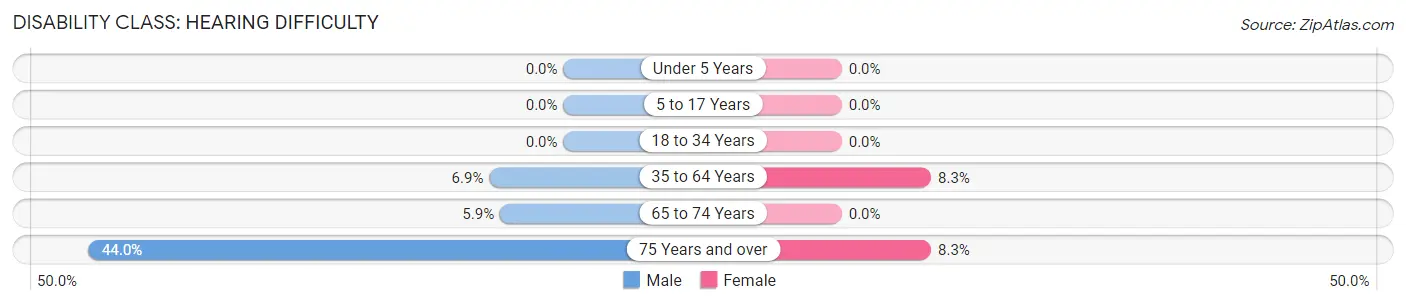
| Age Bracket | Male | Female |
| Under 5 Years | 0 (0.0%) | 0 (0.0%) |
| 5 to 17 Years | 0 (0.0%) | 0 (0.0%) |
| 18 to 34 Years | 0 (0.0%) | 0 (0.0%) |
| 35 to 64 Years | 55 (6.9%) | 64 (8.3%) |
| 65 to 74 Years | 13 (5.9%) | 0 (0.0%) |
| 75 Years and over | 59 (44.0%) | 18 (8.3%) |
Disability Class: Vision Difficulty
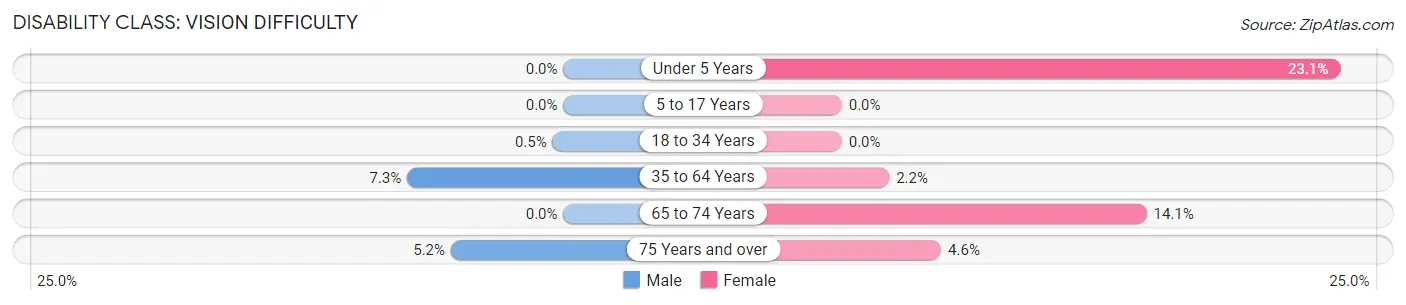
| Age Bracket | Male | Female |
| Under 5 Years | 0 (0.0%) | 43 (23.1%) |
| 5 to 17 Years | 0 (0.0%) | 0 (0.0%) |
| 18 to 34 Years | 4 (0.5%) | 0 (0.0%) |
| 35 to 64 Years | 58 (7.2%) | 17 (2.2%) |
| 65 to 74 Years | 0 (0.0%) | 27 (14.1%) |
| 75 Years and over | 7 (5.2%) | 10 (4.6%) |
Disability Class: Cognitive Difficulty
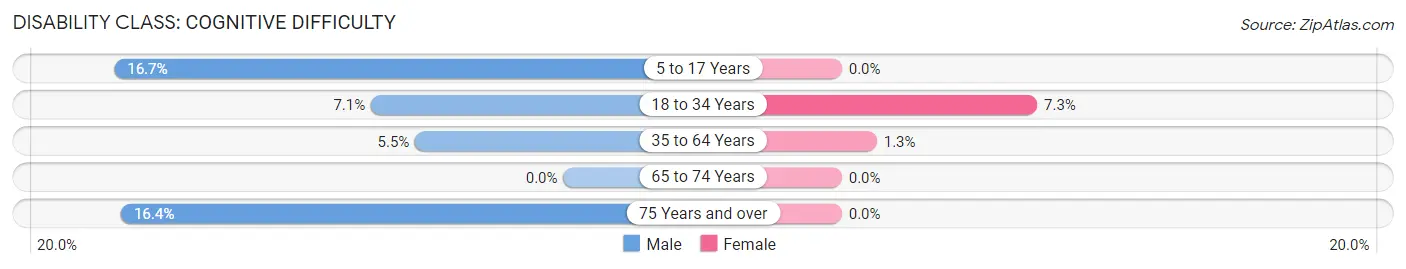
| Age Bracket | Male | Female |
| 5 to 17 Years | 91 (16.7%) | 0 (0.0%) |
| 18 to 34 Years | 57 (7.1%) | 57 (7.2%) |
| 35 to 64 Years | 44 (5.5%) | 10 (1.3%) |
| 65 to 74 Years | 0 (0.0%) | 0 (0.0%) |
| 75 Years and over | 22 (16.4%) | 0 (0.0%) |
Disability Class: Ambulatory Difficulty
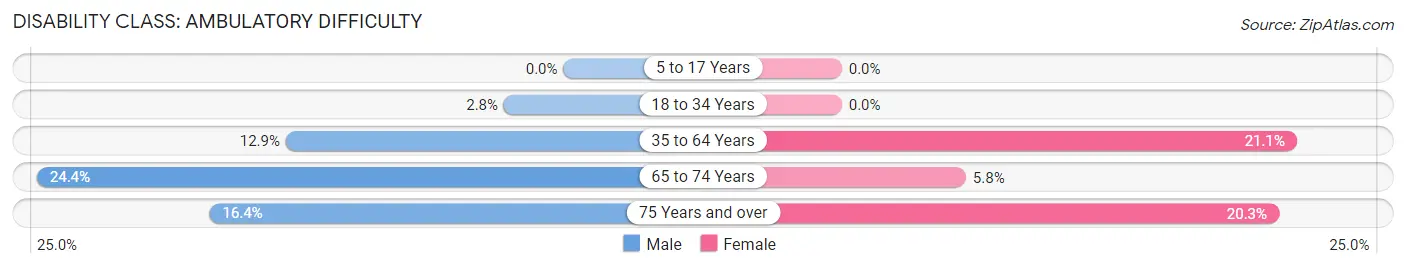
| Age Bracket | Male | Female |
| 5 to 17 Years | 0 (0.0%) | 0 (0.0%) |
| 18 to 34 Years | 22 (2.8%) | 0 (0.0%) |
| 35 to 64 Years | 103 (12.9%) | 163 (21.1%) |
| 65 to 74 Years | 54 (24.4%) | 11 (5.8%) |
| 75 Years and over | 22 (16.4%) | 44 (20.3%) |
Disability Class: Self-Care Difficulty
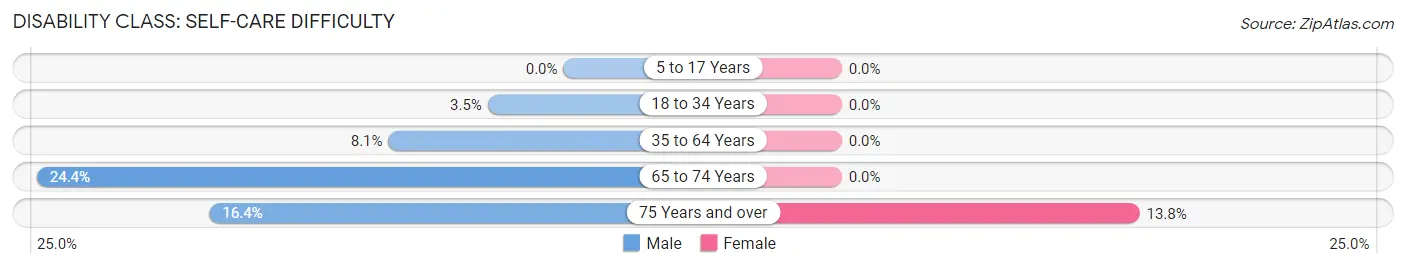
| Age Bracket | Male | Female |
| 5 to 17 Years | 0 (0.0%) | 0 (0.0%) |
| 18 to 34 Years | 28 (3.5%) | 0 (0.0%) |
| 35 to 64 Years | 65 (8.1%) | 0 (0.0%) |
| 65 to 74 Years | 54 (24.4%) | 0 (0.0%) |
| 75 Years and over | 22 (16.4%) | 30 (13.8%) |
Technology Access in Colby
Computing Device Access in Colby
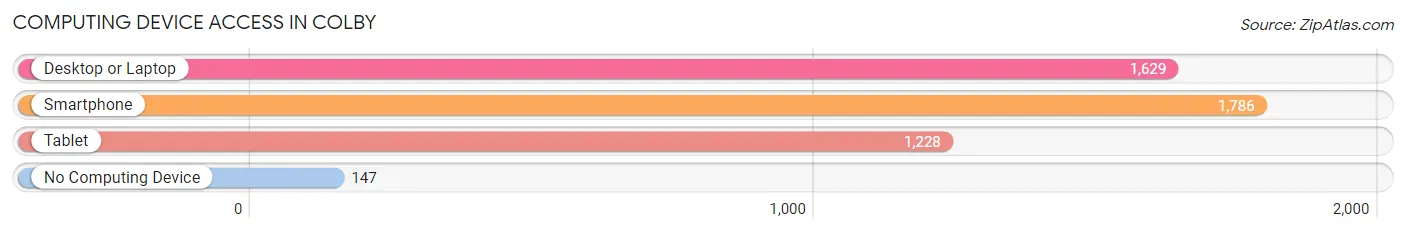
| Device Type | # Households | % Households |
| Desktop or Laptop | 1,629 | 76.9% |
| Smartphone | 1,786 | 84.3% |
| Tablet | 1,228 | 58.0% |
| No Computing Device | 147 | 6.9% |
| Total | 2,118 | 100.0% |
Internet Access in Colby
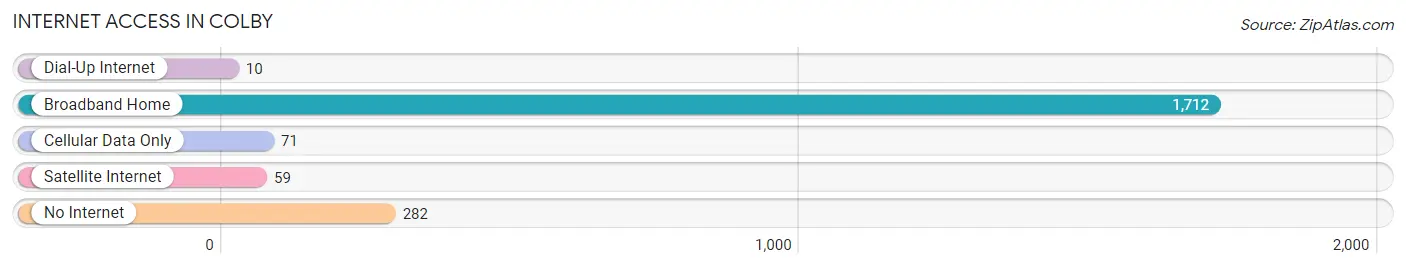
| Internet Type | # Households | % Households |
| Dial-Up Internet | 10 | 0.5% |
| Broadband Home | 1,712 | 80.8% |
| Cellular Data Only | 71 | 3.4% |
| Satellite Internet | 59 | 2.8% |
| No Internet | 282 | 13.3% |
| Total | 2,118 | 100.0% |
Colby Summary
Colby, Kansas is a small city located in the northwest corner of the state, in Thomas County. It is the county seat and the largest city in the county. The city was founded in 1882 and named after the first settler, Colonel W.R. Colby. The city has a population of 5,387 as of the 2010 census.
Geography
Colby is located at 39°25'25"N 101°3'25"W (39.423, -101.056). It is situated in the High Plains region of the Great Plains, at an elevation of 3,093 feet (943 m). The city is located in the northwest corner of Thomas County, and is bordered by Sherman County to the north, Logan County to the east, and Rawlins County to the south. The city is located approximately 50 miles (80 km) east of the Colorado border.
The city is located in the High Plains Aquifer, which provides the city with its water supply. The city is also located in the Central Flyway, a major migratory bird route.
Climate
Colby has a semi-arid climate, with hot summers and cold winters. The average annual temperature is 54.3°F (12.4°C). The average high temperature in July is 92.3°F (33.5°C), and the average low temperature in January is 16.2°F (-8.7°C). The average annual precipitation is 20.2 inches (51.3 cm).
Demographics
As of the 2010 census, Colby had a population of 5,387. The racial makeup of the city was 87.2% White, 0.7% African American, 0.7% Native American, 0.3% Asian, 0.1% Pacific Islander, 9.2% from other races, and 1.9% from two or more races. Hispanic or Latino of any race were 20.2% of the population.
Economy
Colby is the economic center of Thomas County. The city is home to several businesses, including a hospital, a bank, a grocery store, a hardware store, and several restaurants. The city is also home to a number of manufacturing companies, including a plastics manufacturer, a metal fabricator, and a food processor.
The city is also home to a number of agricultural businesses, including a feedlot, a dairy, and a grain elevator. The city is also home to a number of oil and gas companies, including a drilling company and a pipeline company.
The city is served by the Colby Municipal Airport, which is located just outside the city limits. The airport is used for general aviation and is home to a number of corporate aircraft.
Education
Colby is served by the Colby Public Schools, which includes an elementary school, a middle school, and a high school. The city is also home to a number of private schools, including a Catholic school and a Christian school.
The city is also home to a branch of the North Central Kansas Technical College, which offers a variety of vocational and technical courses.
Conclusion
Colby, Kansas is a small city located in the northwest corner of the state, in Thomas County. It is the county seat and the largest city in the county. The city was founded in 1882 and named after the first settler, Colonel W.R. Colby. The city has a population of 5,387 as of the 2010 census. Colby has a semi-arid climate, with hot summers and cold winters. The city is the economic center of Thomas County, and is home to several businesses, including a hospital, a bank, a grocery store, a hardware store, and several restaurants. The city is also home to a number of manufacturing companies, agricultural businesses, and oil and gas companies. The city is served by the Colby Public Schools, and is also home to a branch of the North Central Kansas Technical College.
Common Questions
What is Per Capita Income in Colby?
Per Capita income in Colby is $31,570.
What is the Median Family Income in Colby?
Median Family Income in Colby is $82,212.
What is the Median Household income in Colby?
Median Household Income in Colby is $62,937.
What is Income or Wage Gap in Colby?
Income or Wage Gap in Colby is 45.0%.
Women in Colby earn 55.0 cents for every dollar earned by a man.
What is Inequality or Gini Index in Colby?
Inequality or Gini Index in Colby is 0.44.
What is the Total Population of Colby?
Total Population of Colby is 5,403.
What is the Total Male Population of Colby?
Total Male Population of Colby is 2,741.
What is the Total Female Population of Colby?
Total Female Population of Colby is 2,662.
What is the Ratio of Males per 100 Females in Colby?
There are 102.97 Males per 100 Females in Colby.
What is the Ratio of Females per 100 Males in Colby?
There are 97.12 Females per 100 Males in Colby.
What is the Median Population Age in Colby?
Median Population Age in Colby is 32.3 Years.
What is the Average Family Size in Colby
Average Family Size in Colby is 3.2 People.
What is the Average Household Size in Colby
Average Household Size in Colby is 2.4 People.
How Large is the Labor Force in Colby?
There are 2,771 People in the Labor Forcein in Colby.
What is the Percentage of People in the Labor Force in Colby?
67.3% of People are in the Labor Force in Colby.
What is the Unemployment Rate in Colby?
Unemployment Rate in Colby is 0.4%.