Cherryvale, KS Map & Demographics
Cherryvale Map
Cherryvale Overview
$23,008
PER CAPITA INCOME
$47,763
AVG FAMILY INCOME
$45,208
AVG HOUSEHOLD INCOME
33.3%
WAGE / INCOME GAP [ % ]
66.7¢/ $1
WAGE / INCOME GAP [ $ ]
0.39
INEQUALITY / GINI INDEX
2,104
TOTAL POPULATION
1,161
MALE POPULATION
943
FEMALE POPULATION
123.12
MALES / 100 FEMALES
81.22
FEMALES / 100 MALES
36.5
MEDIAN AGE
3.3
AVG FAMILY SIZE
2.5
AVG HOUSEHOLD SIZE
961
LABOR FORCE [ PEOPLE ]
60.7%
PERCENT IN LABOR FORCE
5.2%
UNEMPLOYMENT RATE
Cherryvale Zip Codes
Cherryvale Area Codes
Income in Cherryvale
Income Overview in Cherryvale
Per Capita Income in Cherryvale is $23,008, while median incomes of families and households are $47,763 and $45,208 respectively.
| Characteristic | Number | Measure |
| Per Capita Income | 2,104 | $23,008 |
| Median Family Income | 494 | $47,763 |
| Mean Family Income | 494 | $61,660 |
| Median Household Income | 817 | $45,208 |
| Mean Household Income | 817 | $53,099 |
| Income Deficit | 494 | $0 |
| Wage / Income Gap (%) | 2,104 | 33.35% |
| Wage / Income Gap ($) | 2,104 | 66.65¢ per $1 |
| Gini / Inequality Index | 2,104 | 0.39 |
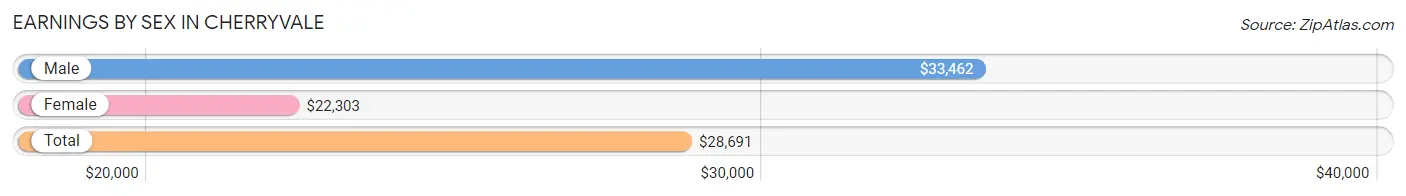
Earnings by Sex in Cherryvale
Average Earnings in Cherryvale are $28,691, $33,462 for men and $22,303 for women, a difference of 33.4%.
| Sex | Number | Average Earnings |
| Male | 538 (54.1%) | $33,462 |
| Female | 457 (45.9%) | $22,303 |
| Total | 995 (100.0%) | $28,691 |
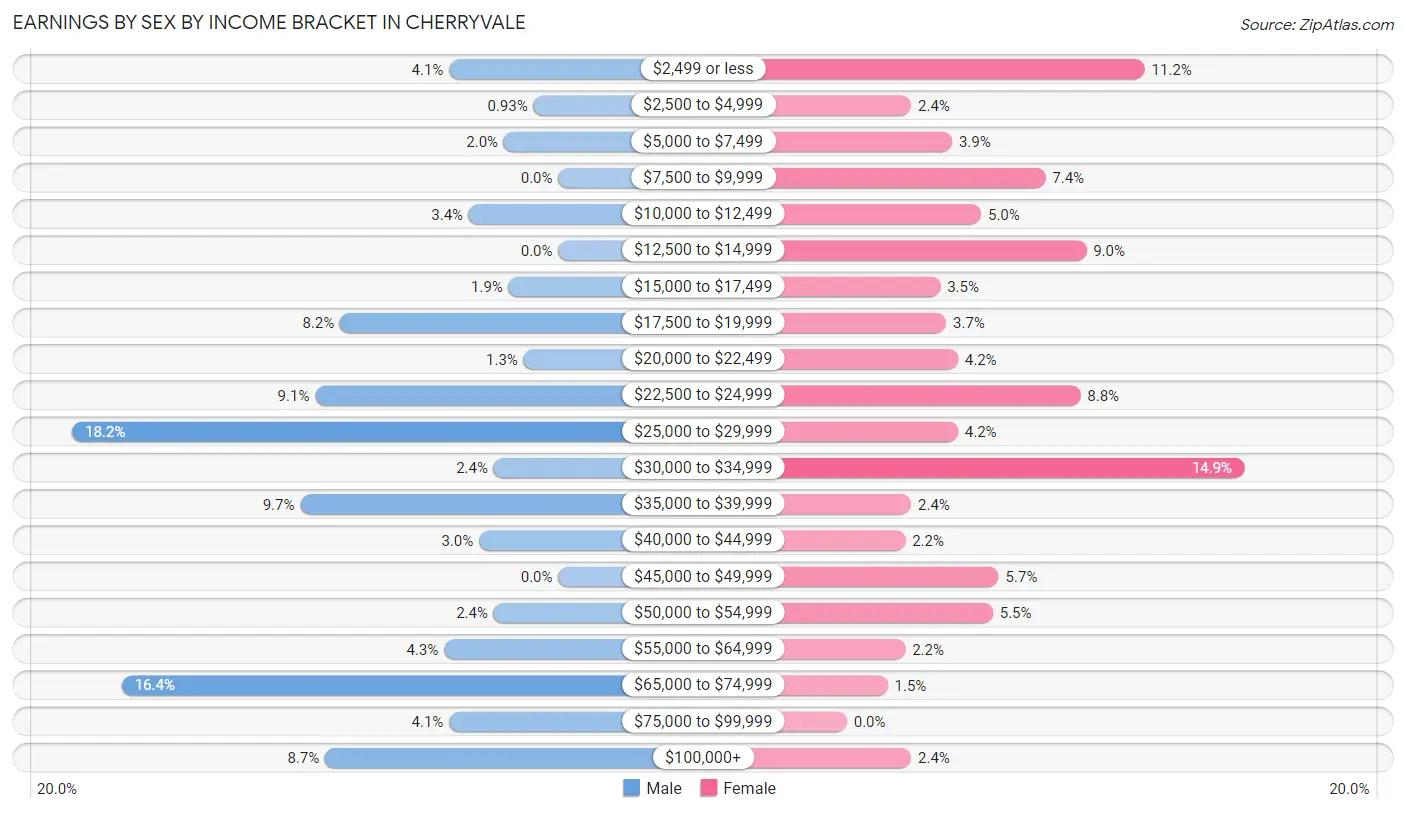
Earnings by Sex by Income Bracket in Cherryvale
The most common earnings brackets in Cherryvale are $25,000 to $29,999 for men (98 | 18.2%) and $30,000 to $34,999 for women (68 | 14.9%).
| Income | Male | Female |
| $2,499 or less | 22 (4.1%) | 51 (11.2%) |
| $2,500 to $4,999 | 5 (0.9%) | 11 (2.4%) |
| $5,000 to $7,499 | 11 (2.0%) | 18 (3.9%) |
| $7,500 to $9,999 | 0 (0.0%) | 34 (7.4%) |
| $10,000 to $12,499 | 18 (3.4%) | 23 (5.0%) |
| $12,500 to $14,999 | 0 (0.0%) | 41 (9.0%) |
| $15,000 to $17,499 | 10 (1.9%) | 16 (3.5%) |
| $17,500 to $19,999 | 44 (8.2%) | 17 (3.7%) |
| $20,000 to $22,499 | 7 (1.3%) | 19 (4.2%) |
| $22,500 to $24,999 | 49 (9.1%) | 40 (8.7%) |
| $25,000 to $29,999 | 98 (18.2%) | 19 (4.2%) |
| $30,000 to $34,999 | 13 (2.4%) | 68 (14.9%) |
| $35,000 to $39,999 | 52 (9.7%) | 11 (2.4%) |
| $40,000 to $44,999 | 16 (3.0%) | 10 (2.2%) |
| $45,000 to $49,999 | 0 (0.0%) | 26 (5.7%) |
| $50,000 to $54,999 | 13 (2.4%) | 25 (5.5%) |
| $55,000 to $64,999 | 23 (4.3%) | 10 (2.2%) |
| $65,000 to $74,999 | 88 (16.4%) | 7 (1.5%) |
| $75,000 to $99,999 | 22 (4.1%) | 0 (0.0%) |
| $100,000+ | 47 (8.7%) | 11 (2.4%) |
| Total | 538 (100.0%) | 457 (100.0%) |
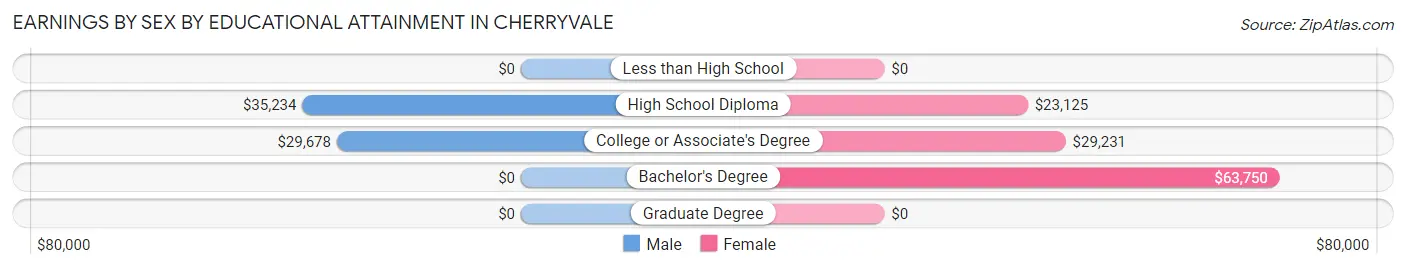
Earnings by Sex by Educational Attainment in Cherryvale
Average earnings in Cherryvale are $35,125 for men and $24,531 for women, a difference of 30.2%. Men with an educational attainment of high school diploma enjoy the highest average annual earnings of $35,234, while those with college or associate's degree education earn the least with $29,678. Women with an educational attainment of bachelor's degree earn the most with the average annual earnings of $63,750, while those with high school diploma education have the smallest earnings of $23,125.
| Educational Attainment | Male Income | Female Income |
| Less than High School | - | - |
| High School Diploma | $35,234 | $23,125 |
| College or Associate's Degree | $29,678 | $29,231 |
| Bachelor's Degree | - | - |
| Graduate Degree | - | - |
| Total | $35,125 | $24,531 |
Family Income in Cherryvale
Family Income Brackets in Cherryvale
According to the Cherryvale family income data, there are 113 families falling into the $50,000 to $74,999 income range, which is the most common income bracket and makes up 22.9% of all families. Conversely, the $75,000 to $99,999 income bracket is the least frequent group with only 11 families (2.2%) belonging to this category.
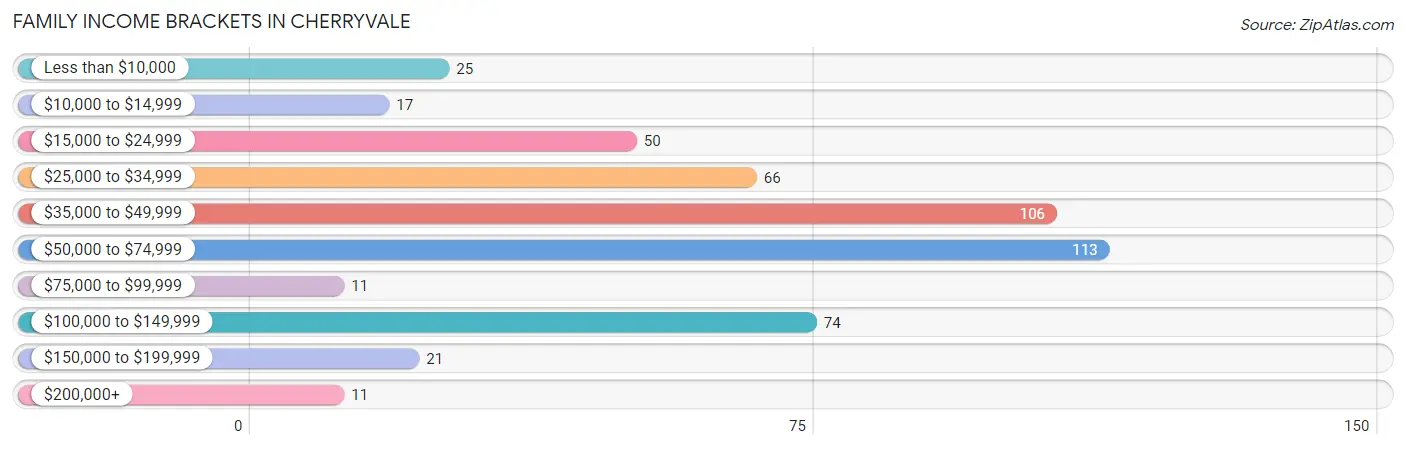
| Income Bracket | # Families | % Families |
| Less than $10,000 | 25 | 5.1% |
| $10,000 to $14,999 | 17 | 3.4% |
| $15,000 to $24,999 | 50 | 10.1% |
| $25,000 to $34,999 | 66 | 13.4% |
| $35,000 to $49,999 | 106 | 21.5% |
| $50,000 to $74,999 | 113 | 22.9% |
| $75,000 to $99,999 | 11 | 2.2% |
| $100,000 to $149,999 | 74 | 15.0% |
| $150,000 to $199,999 | 21 | 4.3% |
| $200,000+ | 11 | 2.2% |
Family Income by Famaliy Size in Cherryvale
5-person families (76 | 15.4%) account for the highest median family income in Cherryvale with $66,563 per family, while 2-person families (272 | 55.1%) have the highest median income of $22,404 per family member.
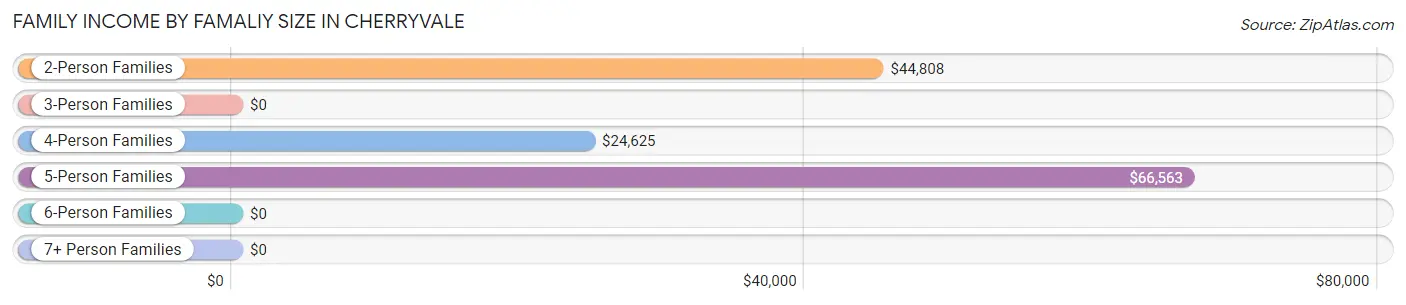
| Income Bracket | # Families | Median Income |
| 2-Person Families | 272 (55.1%) | $44,808 |
| 3-Person Families | 82 (16.6%) | $0 |
| 4-Person Families | 58 (11.7%) | $24,625 |
| 5-Person Families | 76 (15.4%) | $66,563 |
| 6-Person Families | 6 (1.2%) | $0 |
| 7+ Person Families | 0 (0.0%) | $0 |
| Total | 494 (100.0%) | $47,763 |
Family Income by Number of Earners in Cherryvale
The median family income in Cherryvale is $47,763, with families comprising 3+ earners (62) having the highest median family income of $118,500, while families with no earners (69) have the lowest median family income of $29,013, accounting for 12.6% and 14.0% of families, respectively.
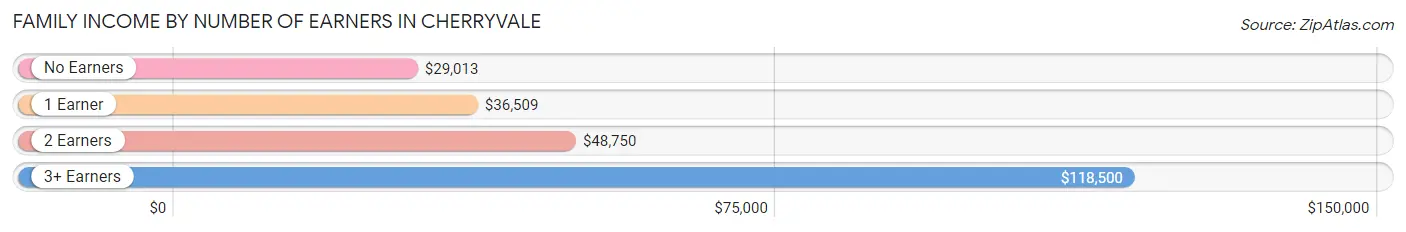
| Number of Earners | # Families | Median Income |
| No Earners | 69 (14.0%) | $29,013 |
| 1 Earner | 241 (48.8%) | $36,509 |
| 2 Earners | 122 (24.7%) | $48,750 |
| 3+ Earners | 62 (12.6%) | $118,500 |
| Total | 494 (100.0%) | $47,763 |
Household Income in Cherryvale
Household Income Brackets in Cherryvale
With 227 households falling in the category, the $50,000 to $74,999 income range is the most frequent in Cherryvale, accounting for 27.8% of all households. In contrast, only 11 households (1.3%) fall into the $200,000+ income bracket, making it the least populous group.
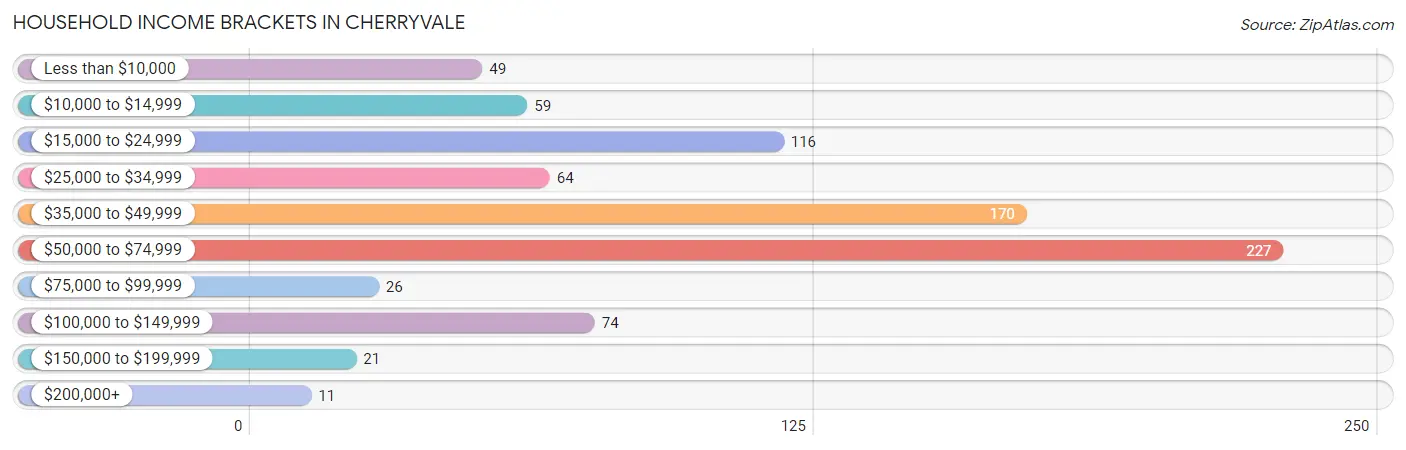
| Income Bracket | # Households | % Households |
| Less than $10,000 | 49 | 6.0% |
| $10,000 to $14,999 | 59 | 7.2% |
| $15,000 to $24,999 | 116 | 14.2% |
| $25,000 to $34,999 | 64 | 7.8% |
| $35,000 to $49,999 | 170 | 20.8% |
| $50,000 to $74,999 | 227 | 27.8% |
| $75,000 to $99,999 | 26 | 3.2% |
| $100,000 to $149,999 | 74 | 9.1% |
| $150,000 to $199,999 | 21 | 2.6% |
| $200,000+ | 11 | 1.3% |
Household Income by Householder Age in Cherryvale
The median household income in Cherryvale is $45,208, with the highest median household income of $54,531 found in the 45 to 64 years age bracket for the primary householder. A total of 284 households (34.8%) fall into this category. Meanwhile, the 15 to 24 years age bracket for the primary householder has the lowest median household income of $32,813, with 57 households (7.0%) in this group.
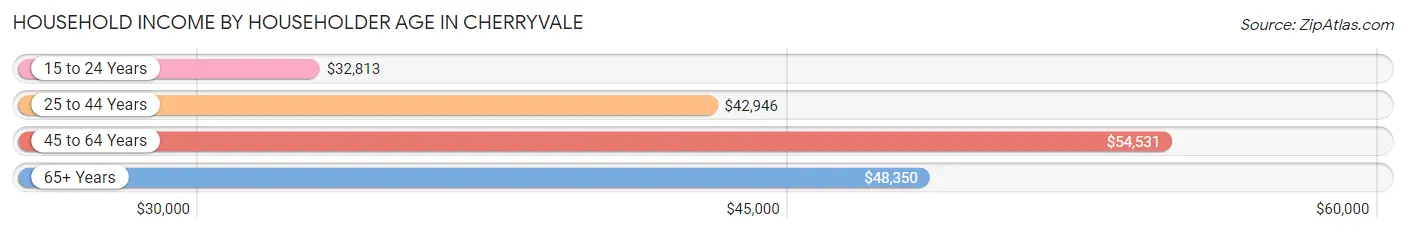
| Income Bracket | # Households | Median Income |
| 15 to 24 Years | 57 (7.0%) | $32,813 |
| 25 to 44 Years | 283 (34.6%) | $42,946 |
| 45 to 64 Years | 284 (34.8%) | $54,531 |
| 65+ Years | 193 (23.6%) | $48,350 |
| Total | 817 (100.0%) | $45,208 |
Poverty in Cherryvale
Income Below Poverty by Sex and Age in Cherryvale
With 19.4% poverty level for males and 24.1% for females among the residents of Cherryvale, 15 year old males and 25 to 34 year old females are the most vulnerable to poverty, with 10 males (100.0%) and 79 females (56.4%) in their respective age groups living below the poverty level.
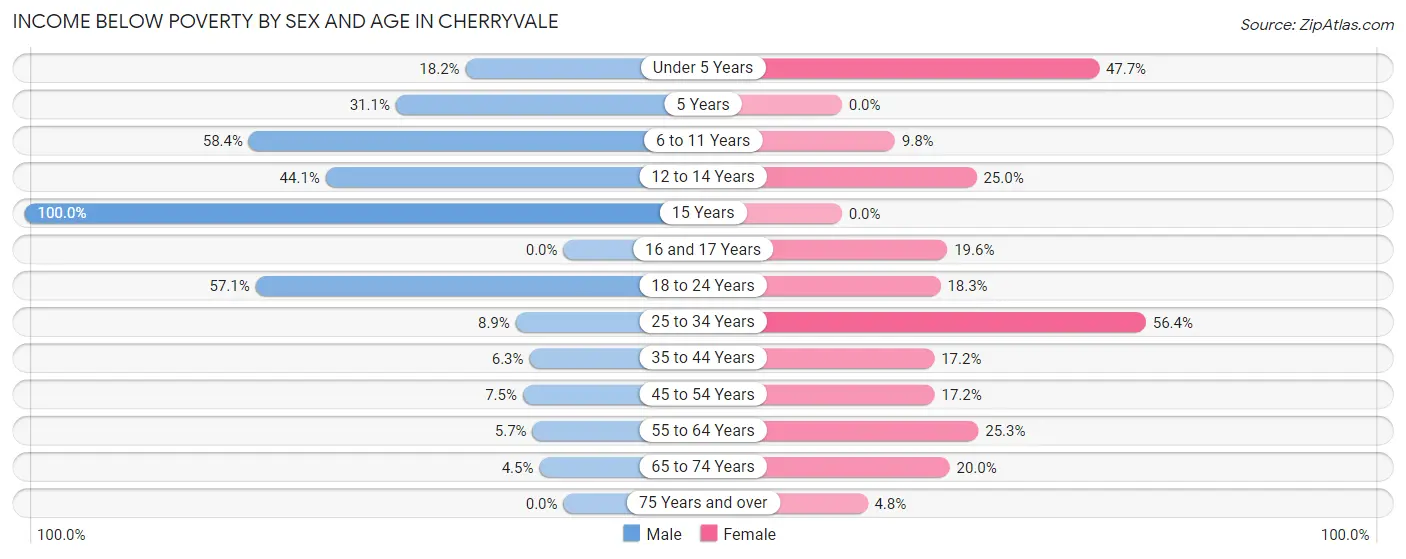
| Age Bracket | Male | Female |
| Under 5 Years | 20 (18.2%) | 21 (47.7%) |
| 5 Years | 14 (31.1%) | 0 (0.0%) |
| 6 to 11 Years | 87 (58.4%) | 6 (9.8%) |
| 12 to 14 Years | 15 (44.1%) | 8 (25.0%) |
| 15 Years | 10 (100.0%) | 0 (0.0%) |
| 16 and 17 Years | 0 (0.0%) | 9 (19.6%) |
| 18 to 24 Years | 32 (57.1%) | 13 (18.3%) |
| 25 to 34 Years | 14 (8.9%) | 79 (56.4%) |
| 35 to 44 Years | 7 (6.3%) | 23 (17.2%) |
| 45 to 54 Years | 7 (7.5%) | 21 (17.2%) |
| 55 to 64 Years | 12 (5.7%) | 19 (25.3%) |
| 65 to 74 Years | 5 (4.5%) | 17 (20.0%) |
| 75 Years and over | 0 (0.0%) | 3 (4.8%) |
| Total | 223 (19.4%) | 219 (24.1%) |
Income Above Poverty by Sex and Age in Cherryvale
According to the poverty statistics in Cherryvale, males aged 16 and 17 years and females aged 5 years are the age groups that are most secure financially, with 100.0% of males and 100.0% of females in these age groups living above the poverty line.
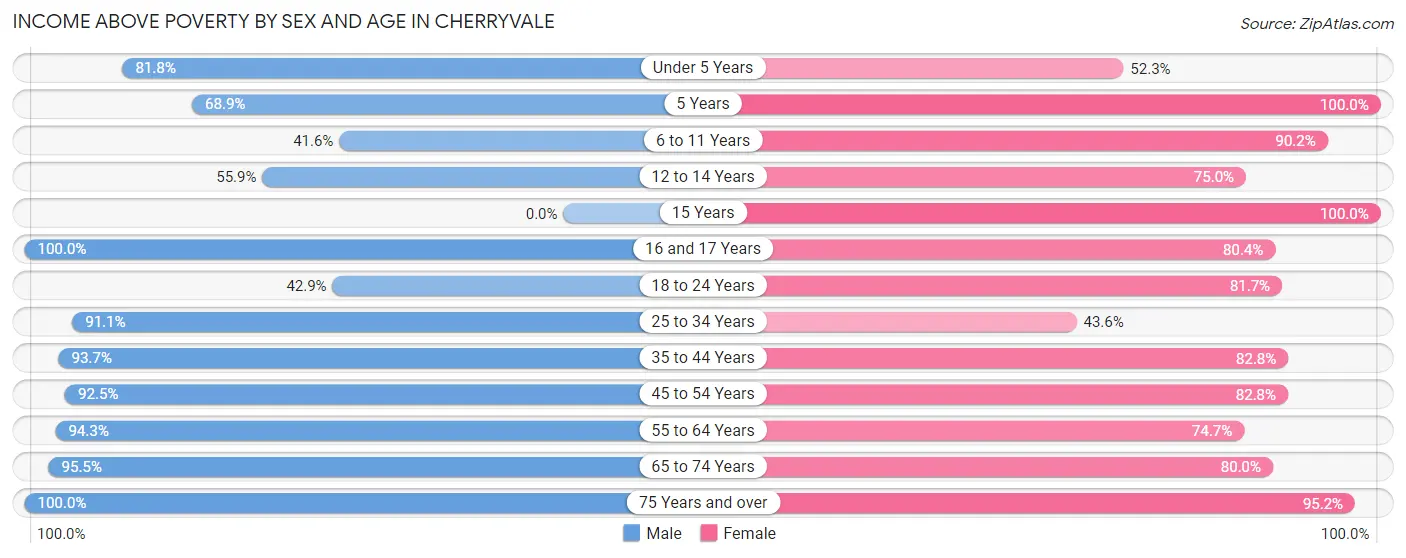
| Age Bracket | Male | Female |
| Under 5 Years | 90 (81.8%) | 23 (52.3%) |
| 5 Years | 31 (68.9%) | 30 (100.0%) |
| 6 to 11 Years | 62 (41.6%) | 55 (90.2%) |
| 12 to 14 Years | 19 (55.9%) | 24 (75.0%) |
| 15 Years | 0 (0.0%) | 6 (100.0%) |
| 16 and 17 Years | 46 (100.0%) | 37 (80.4%) |
| 18 to 24 Years | 24 (42.9%) | 58 (81.7%) |
| 25 to 34 Years | 144 (91.1%) | 61 (43.6%) |
| 35 to 44 Years | 104 (93.7%) | 111 (82.8%) |
| 45 to 54 Years | 86 (92.5%) | 101 (82.8%) |
| 55 to 64 Years | 197 (94.3%) | 56 (74.7%) |
| 65 to 74 Years | 107 (95.5%) | 68 (80.0%) |
| 75 Years and over | 19 (100.0%) | 60 (95.2%) |
| Total | 929 (80.6%) | 690 (75.9%) |
Income Below Poverty Among Married-Couple Families in Cherryvale
The poverty statistics for married-couple families in Cherryvale show that 3.3% or 8 of the total 243 families live below the poverty line. Families with 3 or 4 children have the highest poverty rate of 27.6%, comprising of 8 families. On the other hand, families with no children have the lowest poverty rate of 0.0%, which includes 0 families.
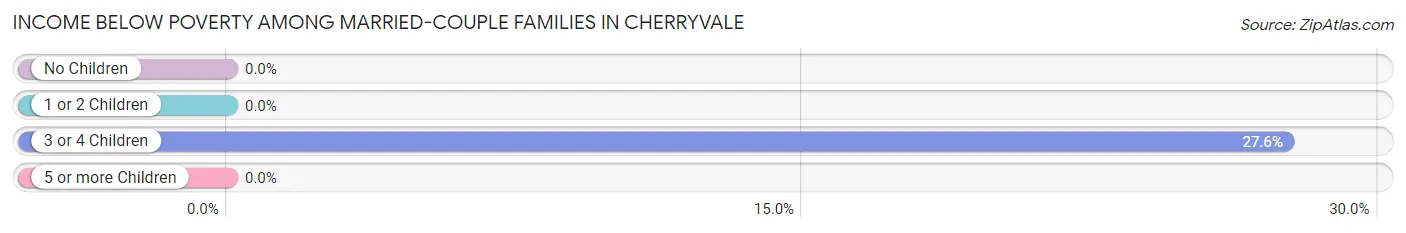
| Children | Above Poverty | Below Poverty |
| No Children | 153 (100.0%) | 0 (0.0%) |
| 1 or 2 Children | 61 (100.0%) | 0 (0.0%) |
| 3 or 4 Children | 21 (72.4%) | 8 (27.6%) |
| 5 or more Children | 0 (0.0%) | 0 (0.0%) |
| Total | 235 (96.7%) | 8 (3.3%) |
Income Below Poverty Among Single-Parent Households in Cherryvale
According to the poverty data in Cherryvale, 5.6% or 5 single-father households and 40.1% or 65 single-mother households are living below the poverty line. Among single-father households, those with no children have the highest poverty rate, with 5 households (18.5%) experiencing poverty. Likewise, among single-mother households, those with 3 or 4 children have the highest poverty rate, with 40 households (100.0%) falling below the poverty line.
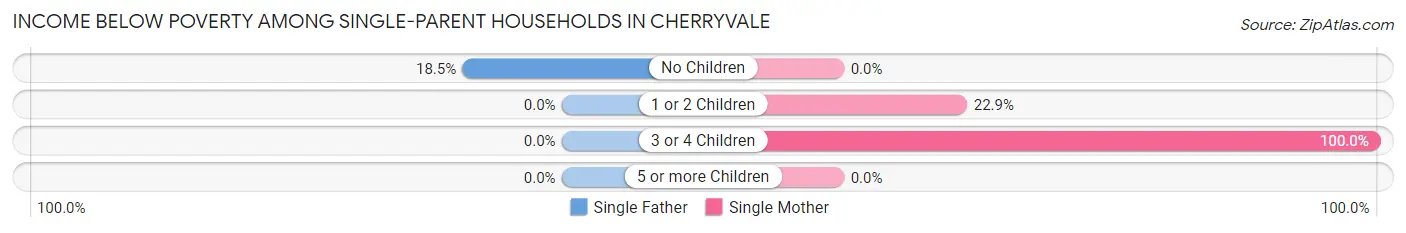
| Children | Single Father | Single Mother |
| No Children | 5 (18.5%) | 0 (0.0%) |
| 1 or 2 Children | 0 (0.0%) | 25 (22.9%) |
| 3 or 4 Children | 0 (0.0%) | 40 (100.0%) |
| 5 or more Children | 0 (0.0%) | 0 (0.0%) |
| Total | 5 (5.6%) | 65 (40.1%) |
Income Below Poverty Among Married-Couple vs Single-Parent Households in Cherryvale
The poverty data for Cherryvale shows that 8 of the married-couple family households (3.3%) and 70 of the single-parent households (27.9%) are living below the poverty level. Within the married-couple family households, those with 3 or 4 children have the highest poverty rate, with 8 households (27.6%) falling below the poverty line. Among the single-parent households, those with 3 or 4 children have the highest poverty rate, with 40 household (90.9%) living below poverty.
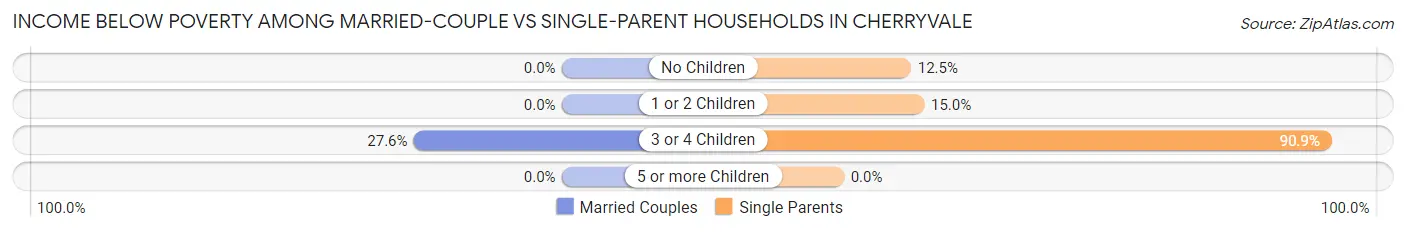
| Children | Married-Couple Families | Single-Parent Households |
| No Children | 0 (0.0%) | 5 (12.5%) |
| 1 or 2 Children | 0 (0.0%) | 25 (15.0%) |
| 3 or 4 Children | 8 (27.6%) | 40 (90.9%) |
| 5 or more Children | 0 (0.0%) | 0 (0.0%) |
| Total | 8 (3.3%) | 70 (27.9%) |
Race in Cherryvale
The most populous races in Cherryvale are White / Caucasian (1,940 | 92.2%), Two or more Races (104 | 4.9%), and Asian (50 | 2.4%).
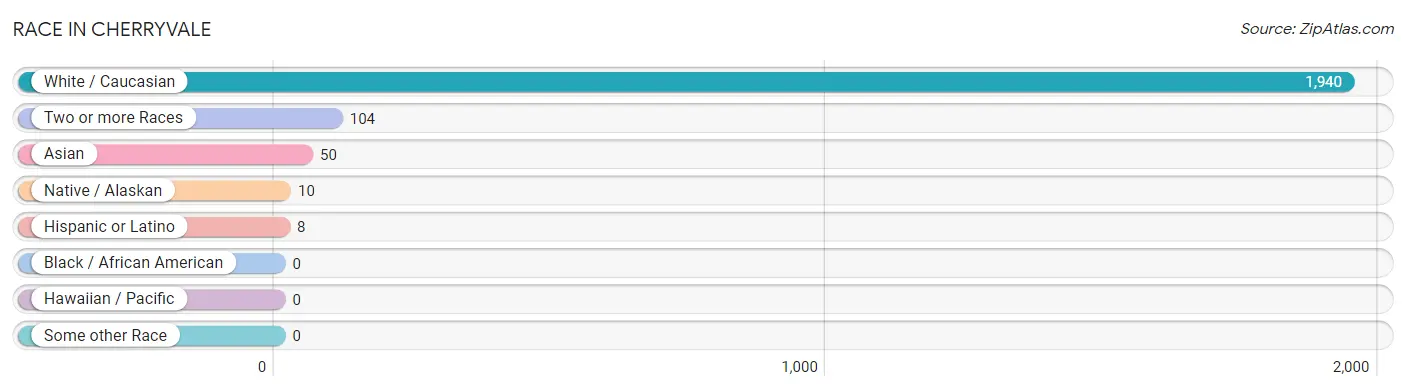
| Race | # Population | % Population |
| Asian | 50 | 2.4% |
| Black / African American | 0 | 0.0% |
| Hawaiian / Pacific | 0 | 0.0% |
| Hispanic or Latino | 8 | 0.4% |
| Native / Alaskan | 10 | 0.5% |
| White / Caucasian | 1,940 | 92.2% |
| Two or more Races | 104 | 4.9% |
| Some other Race | 0 | 0.0% |
| Total | 2,104 | 100.0% |
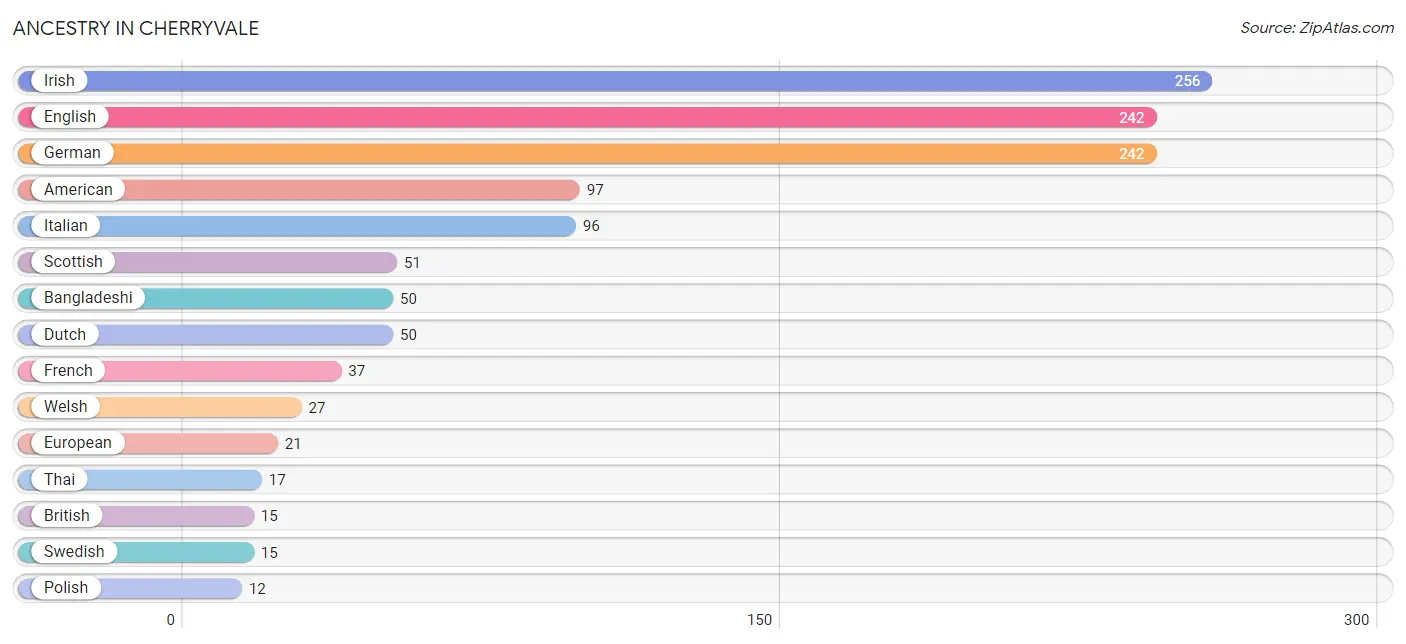
Ancestry in Cherryvale
The most populous ancestries reported in Cherryvale are Irish (256 | 12.2%), English (242 | 11.5%), German (242 | 11.5%), American (97 | 4.6%), and Italian (96 | 4.6%), together accounting for 44.3% of all Cherryvale residents.
| Ancestry | # Population | % Population |
| African | 10 | 0.5% |
| American | 97 | 4.6% |
| Bangladeshi | 50 | 2.4% |
| British | 15 | 0.7% |
| Danish | 1 | 0.1% |
| Delaware | 7 | 0.3% |
| Dutch | 50 | 2.4% |
| Eastern European | 11 | 0.5% |
| English | 242 | 11.5% |
| European | 21 | 1.0% |
| French | 37 | 1.8% |
| French Canadian | 3 | 0.1% |
| German | 242 | 11.5% |
| Hungarian | 3 | 0.1% |
| Irish | 256 | 12.2% |
| Italian | 96 | 4.6% |
| Mexican | 8 | 0.4% |
| Norwegian | 8 | 0.4% |
| Polish | 12 | 0.6% |
| Romanian | 3 | 0.1% |
| Scandinavian | 5 | 0.2% |
| Scottish | 51 | 2.4% |
| Subsaharan African | 10 | 0.5% |
| Swedish | 15 | 0.7% |
| Thai | 17 | 0.8% |
| Tlingit-Haida | 10 | 0.5% |
| Welsh | 27 | 1.3% | View All 27 Rows |
Immigrants in Cherryvale
The most numerous immigrant groups reported in Cherryvale came from , and Canada (3 | 0.1%), together accounting for 0.1% of all Cherryvale residents.

| Immigration Origin | # Population | % Population |
| Canada | 3 | 0.1% | View All 1 Rows |
Sex and Age in Cherryvale
Sex and Age in Cherryvale
The most populous age groups in Cherryvale are 5 to 9 Years (179 | 15.4%) for men and 25 to 29 Years (80 | 8.5%) for women.
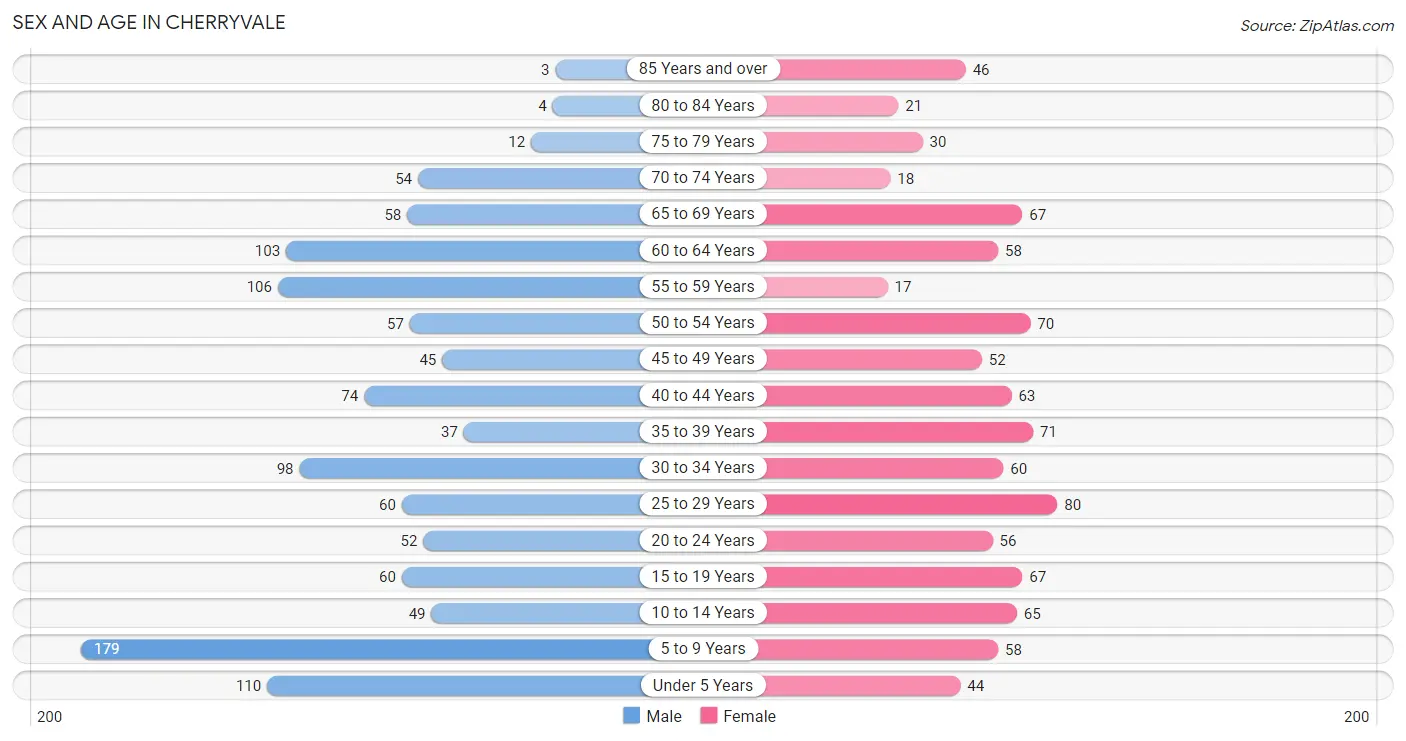
| Age Bracket | Male | Female |
| Under 5 Years | 110 (9.5%) | 44 (4.7%) |
| 5 to 9 Years | 179 (15.4%) | 58 (6.1%) |
| 10 to 14 Years | 49 (4.2%) | 65 (6.9%) |
| 15 to 19 Years | 60 (5.2%) | 67 (7.1%) |
| 20 to 24 Years | 52 (4.5%) | 56 (5.9%) |
| 25 to 29 Years | 60 (5.2%) | 80 (8.5%) |
| 30 to 34 Years | 98 (8.4%) | 60 (6.4%) |
| 35 to 39 Years | 37 (3.2%) | 71 (7.5%) |
| 40 to 44 Years | 74 (6.4%) | 63 (6.7%) |
| 45 to 49 Years | 45 (3.9%) | 52 (5.5%) |
| 50 to 54 Years | 57 (4.9%) | 70 (7.4%) |
| 55 to 59 Years | 106 (9.1%) | 17 (1.8%) |
| 60 to 64 Years | 103 (8.9%) | 58 (6.1%) |
| 65 to 69 Years | 58 (5.0%) | 67 (7.1%) |
| 70 to 74 Years | 54 (4.6%) | 18 (1.9%) |
| 75 to 79 Years | 12 (1.0%) | 30 (3.2%) |
| 80 to 84 Years | 4 (0.3%) | 21 (2.2%) |
| 85 Years and over | 3 (0.3%) | 46 (4.9%) |
| Total | 1,161 (100.0%) | 943 (100.0%) |
Families and Households in Cherryvale
Median Family Size in Cherryvale
The median family size in Cherryvale is 3.26 persons per family, with single female/mother families (162 | 32.8%) accounting for the largest median family size of 3.41 persons per family. On the other hand, married-couple families (243 | 49.2%) represent the smallest median family size with 3.16 persons per family.
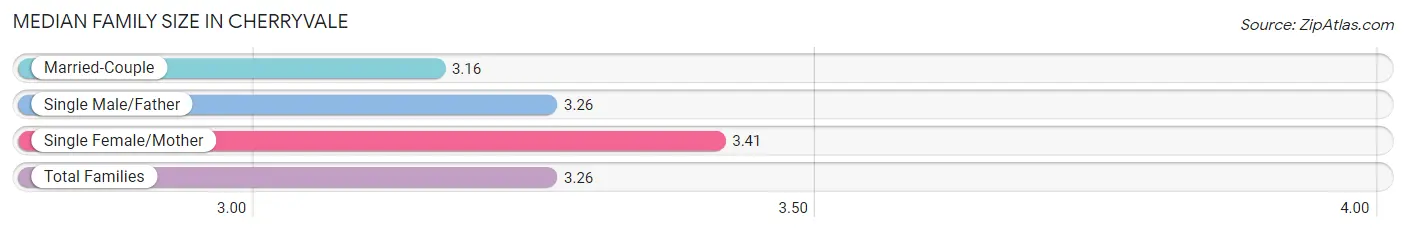
| Family Type | # Families | Family Size |
| Married-Couple | 243 (49.2%) | 3.16 |
| Single Male/Father | 89 (18.0%) | 3.26 |
| Single Female/Mother | 162 (32.8%) | 3.41 |
| Total Families | 494 (100.0%) | 3.26 |
Median Household Size in Cherryvale
The median household size in Cherryvale is 2.52 persons per household, with single male/father households (89 | 10.9%) accounting for the largest median household size of 3.93 persons per household. non-family households (323 | 39.5%) represent the smallest median household size with 1.06 persons per household.
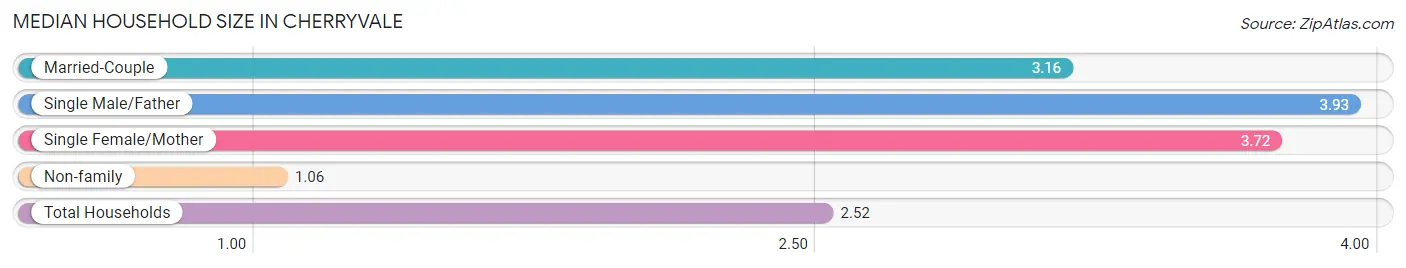
| Household Type | # Households | Household Size |
| Married-Couple | 243 (29.7%) | 3.16 |
| Single Male/Father | 89 (10.9%) | 3.93 |
| Single Female/Mother | 162 (19.8%) | 3.72 |
| Non-family | 323 (39.5%) | 1.06 |
| Total Households | 817 (100.0%) | 2.52 |
Household Size by Marriage Status in Cherryvale
Out of a total of 817 households in Cherryvale, 494 (60.5%) are family households, while 323 (39.5%) are nonfamily households. The most numerous type of family households are 2-person households, comprising 224, and the most common type of nonfamily households are 1-person households, comprising 308.
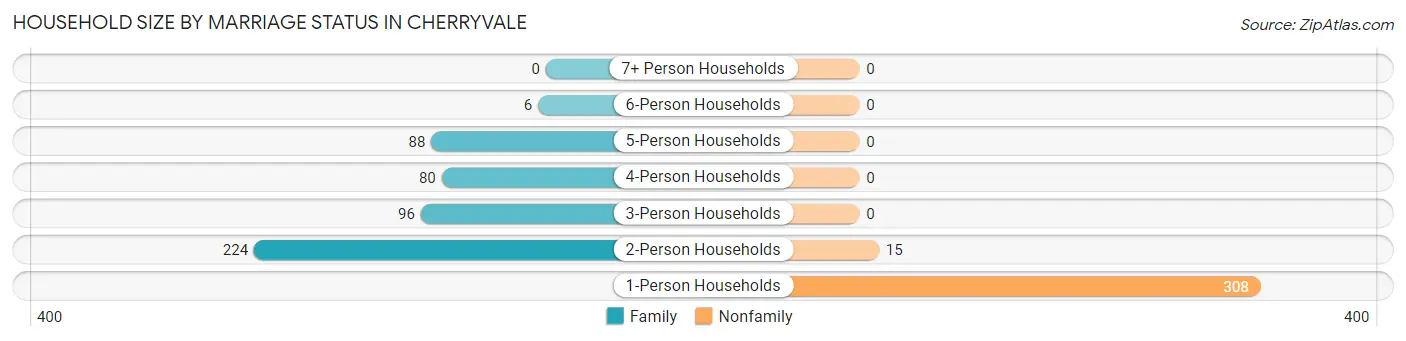
| Household Size | Family Households | Nonfamily Households |
| 1-Person Households | - | 308 (37.7%) |
| 2-Person Households | 224 (27.4%) | 15 (1.8%) |
| 3-Person Households | 96 (11.7%) | 0 (0.0%) |
| 4-Person Households | 80 (9.8%) | 0 (0.0%) |
| 5-Person Households | 88 (10.8%) | 0 (0.0%) |
| 6-Person Households | 6 (0.7%) | 0 (0.0%) |
| 7+ Person Households | 0 (0.0%) | 0 (0.0%) |
| Total | 494 (60.5%) | 323 (39.5%) |
Female Fertility in Cherryvale
Fertility by Age in Cherryvale
Average fertility rate in Cherryvale is 17.0 births per 1,000 women. Women in the age bracket of 20 to 34 years have the highest fertility rate with 41.0 births per 1,000 women. Women in the age bracket of 20 to 34 years acount for 100.0% of all women with births.
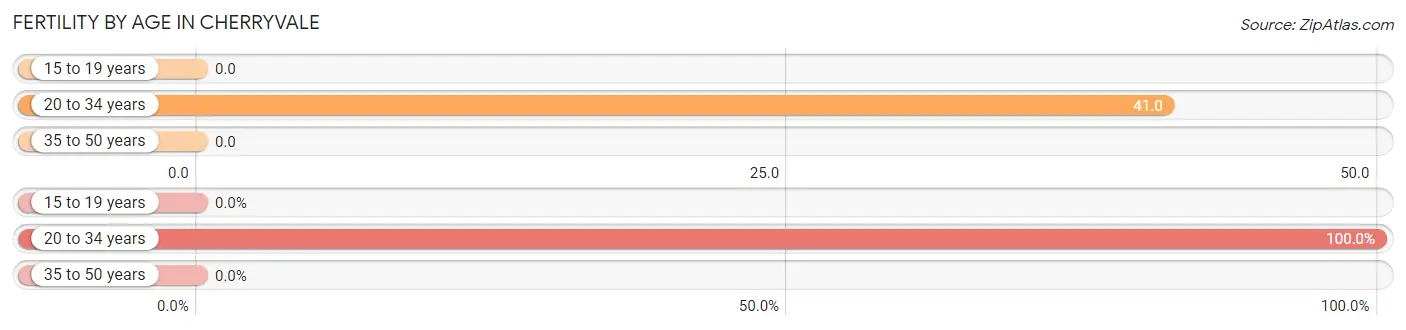
| Age Bracket | Women with Births | Births / 1,000 Women |
| 15 to 19 years | 0 (0.0%) | 0.0 |
| 20 to 34 years | 8 (100.0%) | 41.0 |
| 35 to 50 years | 0 (0.0%) | 0.0 |
| Total | 8 (100.0%) | 17.0 |
Fertility by Age by Marriage Status in Cherryvale
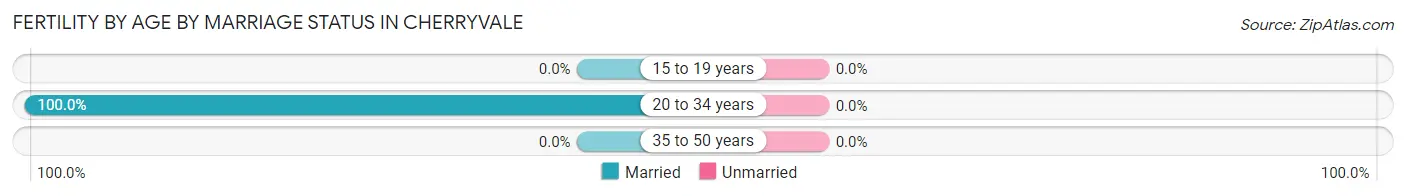
| Age Bracket | Married | Unmarried |
| 15 to 19 years | 0 (0.0%) | 0 (0.0%) |
| 20 to 34 years | 8 (100.0%) | 0 (0.0%) |
| 35 to 50 years | 0 (0.0%) | 0 (0.0%) |
| Total | 8 (100.0%) | 0 (0.0%) |
Fertility by Education in Cherryvale
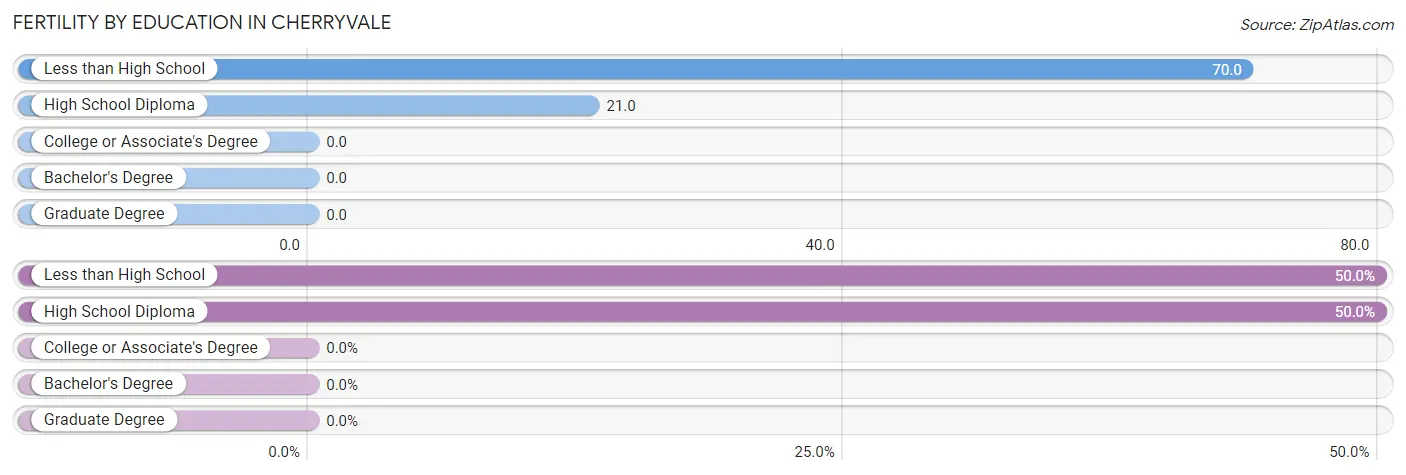
| Educational Attainment | Women with Births | Births / 1,000 Women |
| Less than High School | 4 (50.0%) | 70.0 |
| High School Diploma | 4 (50.0%) | 21.0 |
| College or Associate's Degree | 0 (0.0%) | 0.0 |
| Bachelor's Degree | 0 (0.0%) | 0.0 |
| Graduate Degree | 0 (0.0%) | 0.0 |
| Total | 8 (100.0%) | 17.0 |
Fertility by Education by Marriage Status in Cherryvale
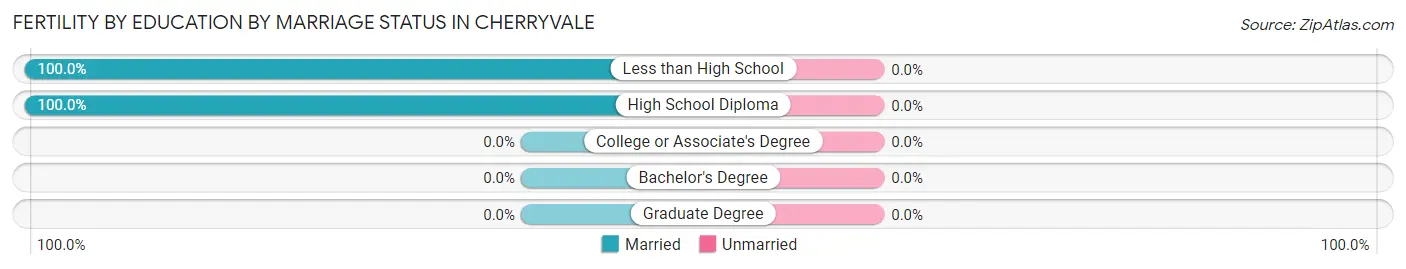
| Educational Attainment | Married | Unmarried |
| Less than High School | 4 (100.0%) | 0 (0.0%) |
| High School Diploma | 4 (100.0%) | 0 (0.0%) |
| College or Associate's Degree | 0 (0.0%) | 0 (0.0%) |
| Bachelor's Degree | 0 (0.0%) | 0 (0.0%) |
| Graduate Degree | 0 (0.0%) | 0 (0.0%) |
| Total | 8 (100.0%) | 0 (0.0%) |
Employment Characteristics in Cherryvale
Employment by Class of Employer in Cherryvale
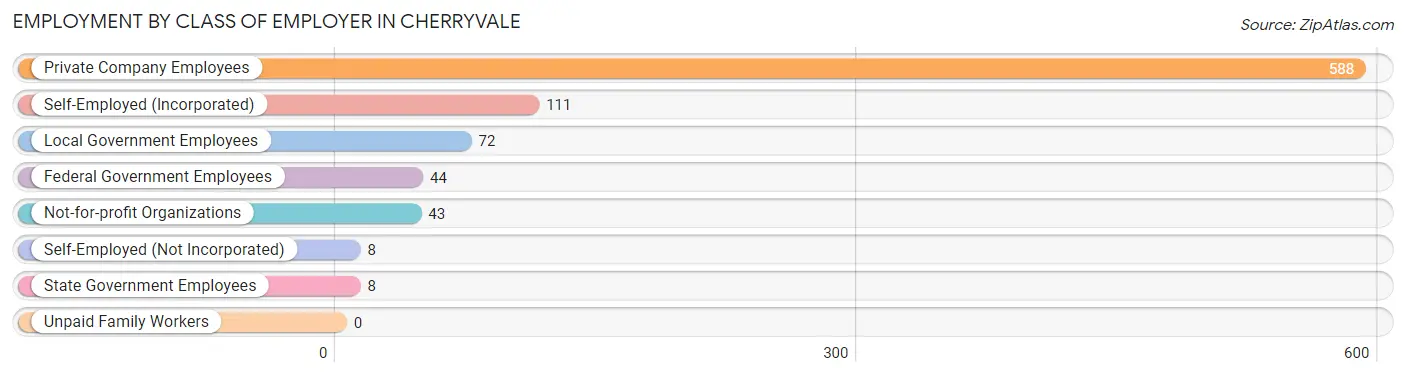
Among the 874 employed individuals in Cherryvale, private company employees (588 | 67.3%), self-employed (incorporated) (111 | 12.7%), and local government employees (72 | 8.2%) make up the most common classes of employment.
| Employer Class | # Employees | % Employees |
| Private Company Employees | 588 | 67.3% |
| Self-Employed (Incorporated) | 111 | 12.7% |
| Self-Employed (Not Incorporated) | 8 | 0.9% |
| Not-for-profit Organizations | 43 | 4.9% |
| Local Government Employees | 72 | 8.2% |
| State Government Employees | 8 | 0.9% |
| Federal Government Employees | 44 | 5.0% |
| Unpaid Family Workers | 0 | 0.0% |
| Total | 874 | 100.0% |
Employment Status by Age in Cherryvale
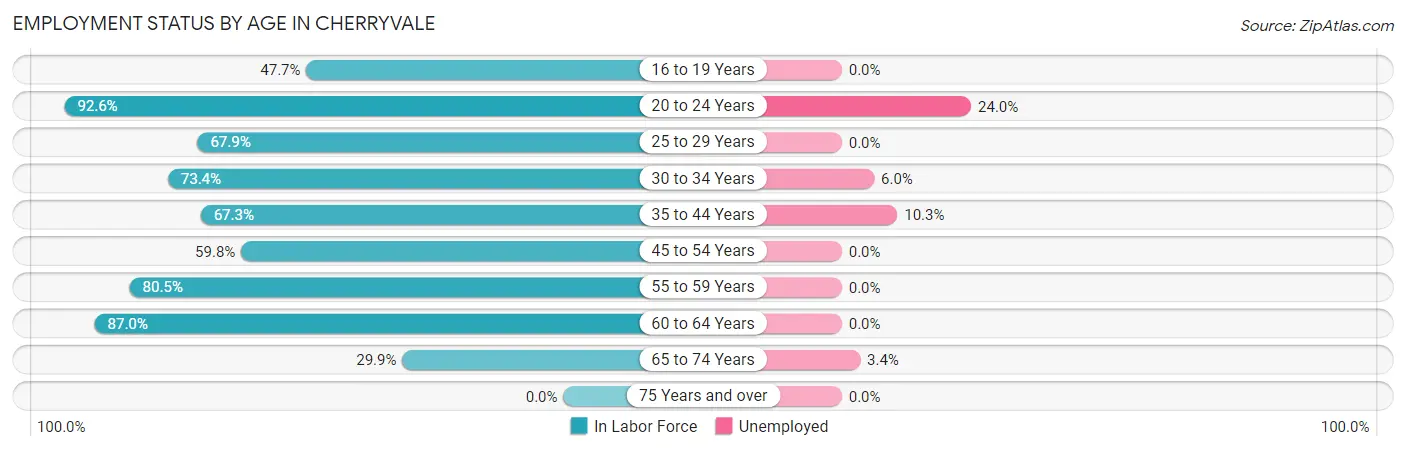
According to the labor force statistics for Cherryvale, out of the total population over 16 years of age (1,583), 60.7% or 961 individuals are in the labor force, with 5.2% or 50 of them unemployed. The age group with the highest labor force participation rate is 20 to 24 years, with 92.6% or 100 individuals in the labor force. Within the labor force, the 20 to 24 years age range has the highest percentage of unemployed individuals, with 24.0% or 24 of them being unemployed.
| Age Bracket | In Labor Force | Unemployed |
| 16 to 19 Years | 53 (47.7%) | 0 (0.0%) |
| 20 to 24 Years | 100 (92.6%) | 24 (24.0%) |
| 25 to 29 Years | 95 (67.9%) | 0 (0.0%) |
| 30 to 34 Years | 116 (73.4%) | 7 (6.0%) |
| 35 to 44 Years | 165 (67.3%) | 17 (10.3%) |
| 45 to 54 Years | 134 (59.8%) | 0 (0.0%) |
| 55 to 59 Years | 99 (80.5%) | 0 (0.0%) |
| 60 to 64 Years | 140 (87.0%) | 0 (0.0%) |
| 65 to 74 Years | 59 (29.9%) | 2 (3.4%) |
| 75 Years and over | 0 (0.0%) | 0 (0.0%) |
| Total | 961 (60.7%) | 50 (5.2%) |
Employment Status by Educational Attainment in Cherryvale
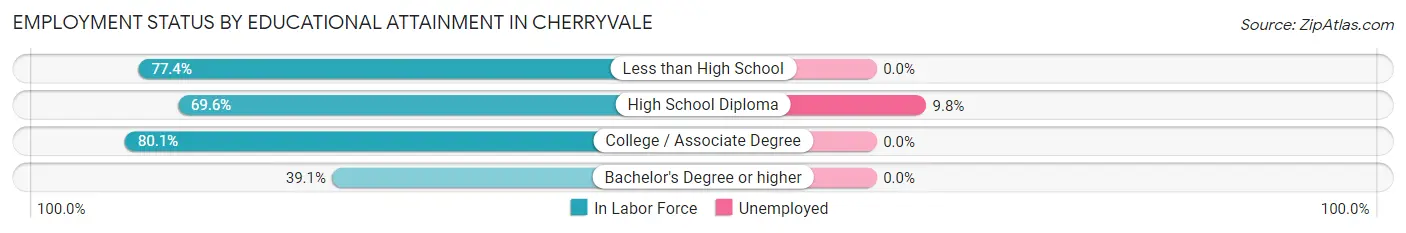
According to labor force statistics for Cherryvale, 71.3% of individuals (749) out of the total population between 25 and 64 years of age (1,051) are in the labor force, with 3.2% or 24 of them being unemployed. The group with the highest labor force participation rate are those with the educational attainment of college / associate degree, with 80.1% or 358 individuals in the labor force. Within the labor force, individuals with high school diploma education have the highest percentage of unemployment, with 9.8% or 24 of them being unemployed.
| Educational Attainment | In Labor Force | Unemployed |
| Less than High School | 96 (77.4%) | 0 (0.0%) |
| High School Diploma | 245 (69.6%) | 34 (9.8%) |
| College / Associate Degree | 358 (80.1%) | 0 (0.0%) |
| Bachelor's Degree or higher | 50 (39.1%) | 0 (0.0%) |
| Total | 749 (71.3%) | 34 (3.2%) |
Employment Occupations by Sex in Cherryvale
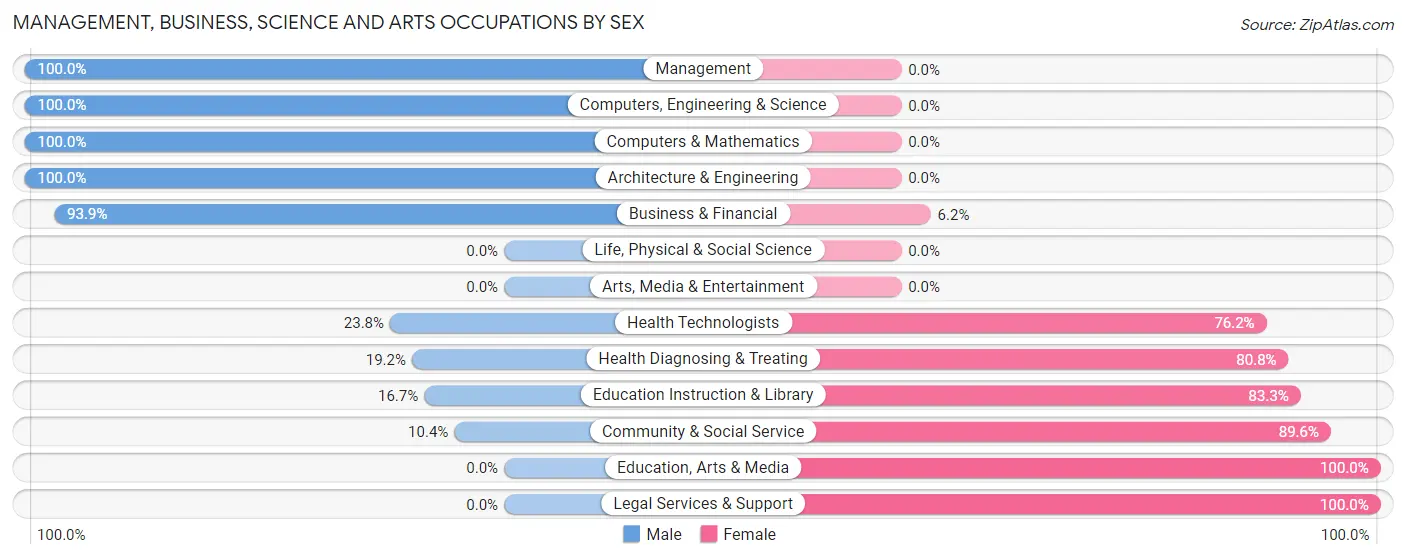
Management, Business, Science and Arts Occupations
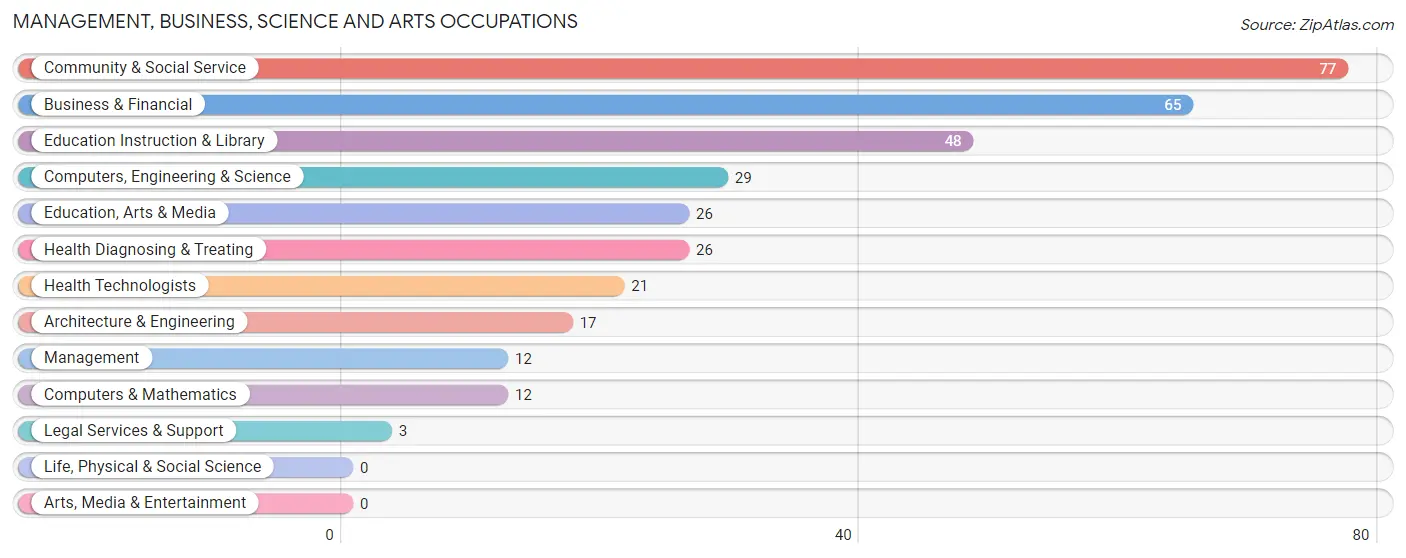
The most common Management, Business, Science and Arts occupations in Cherryvale are Community & Social Service (77 | 8.5%), Business & Financial (65 | 7.1%), Education Instruction & Library (48 | 5.3%), Computers, Engineering & Science (29 | 3.2%), and Education, Arts & Media (26 | 2.9%).
Management, Business, Science and Arts Occupations by Sex
Within the Management, Business, Science and Arts occupations in Cherryvale, the most male-oriented occupations are Management (100.0%), Computers, Engineering & Science (100.0%), and Computers & Mathematics (100.0%), while the most female-oriented occupations are Education, Arts & Media (100.0%), Legal Services & Support (100.0%), and Community & Social Service (89.6%).
| Occupation | Male | Female |
| Management | 12 (100.0%) | 0 (0.0%) |
| Business & Financial | 61 (93.9%) | 4 (6.1%) |
| Computers, Engineering & Science | 29 (100.0%) | 0 (0.0%) |
| Computers & Mathematics | 12 (100.0%) | 0 (0.0%) |
| Architecture & Engineering | 17 (100.0%) | 0 (0.0%) |
| Life, Physical & Social Science | 0 (0.0%) | 0 (0.0%) |
| Community & Social Service | 8 (10.4%) | 69 (89.6%) |
| Education, Arts & Media | 0 (0.0%) | 26 (100.0%) |
| Legal Services & Support | 0 (0.0%) | 3 (100.0%) |
| Education Instruction & Library | 8 (16.7%) | 40 (83.3%) |
| Arts, Media & Entertainment | 0 (0.0%) | 0 (0.0%) |
| Health Diagnosing & Treating | 5 (19.2%) | 21 (80.8%) |
| Health Technologists | 5 (23.8%) | 16 (76.2%) |
| Total (Category) | 115 (55.0%) | 94 (45.0%) |
| Total (Overall) | 515 (56.5%) | 396 (43.5%) |
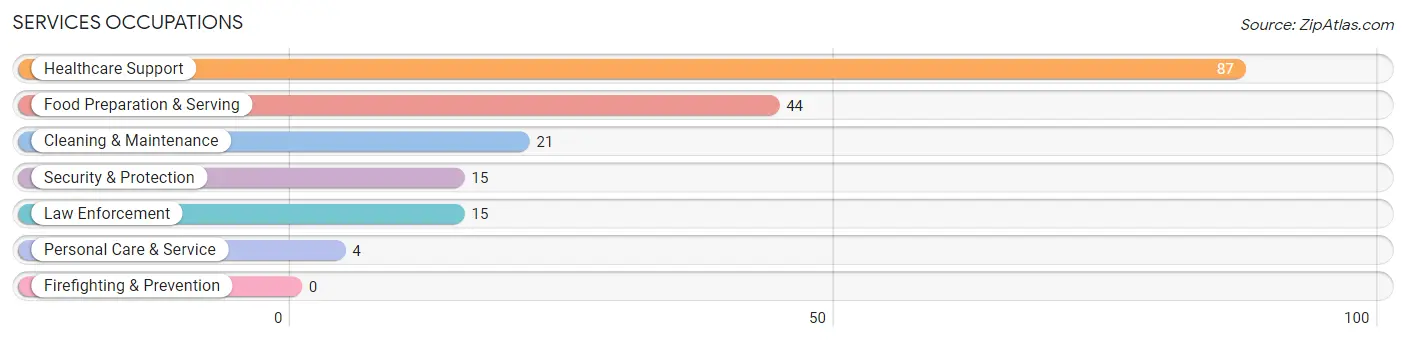
Services Occupations
The most common Services occupations in Cherryvale are Healthcare Support (87 | 9.6%), Food Preparation & Serving (44 | 4.8%), Cleaning & Maintenance (21 | 2.3%), Security & Protection (15 | 1.7%), and Law Enforcement (15 | 1.7%).
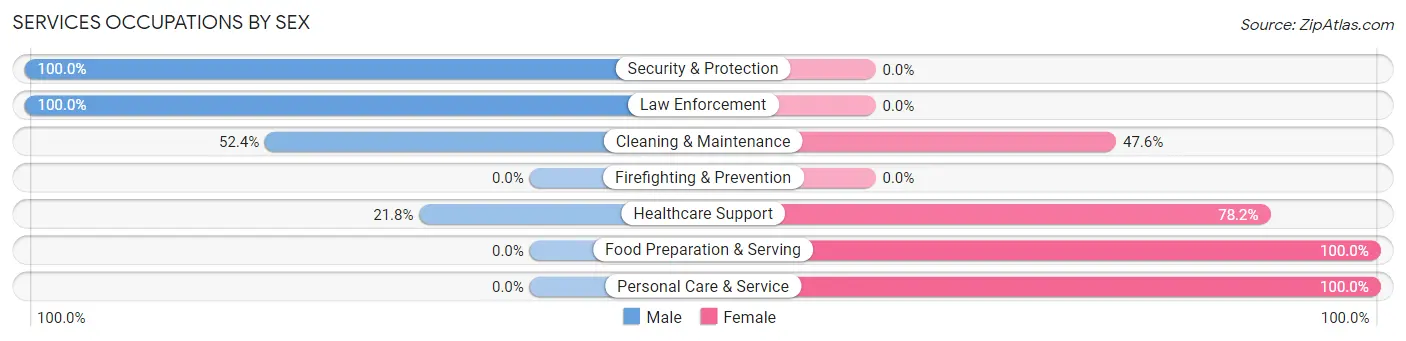
Services Occupations by Sex
Within the Services occupations in Cherryvale, the most male-oriented occupations are Security & Protection (100.0%), Law Enforcement (100.0%), and Cleaning & Maintenance (52.4%), while the most female-oriented occupations are Food Preparation & Serving (100.0%), Personal Care & Service (100.0%), and Healthcare Support (78.2%).
| Occupation | Male | Female |
| Healthcare Support | 19 (21.8%) | 68 (78.2%) |
| Security & Protection | 15 (100.0%) | 0 (0.0%) |
| Firefighting & Prevention | 0 (0.0%) | 0 (0.0%) |
| Law Enforcement | 15 (100.0%) | 0 (0.0%) |
| Food Preparation & Serving | 0 (0.0%) | 44 (100.0%) |
| Cleaning & Maintenance | 11 (52.4%) | 10 (47.6%) |
| Personal Care & Service | 0 (0.0%) | 4 (100.0%) |
| Total (Category) | 45 (26.3%) | 126 (73.7%) |
| Total (Overall) | 515 (56.5%) | 396 (43.5%) |
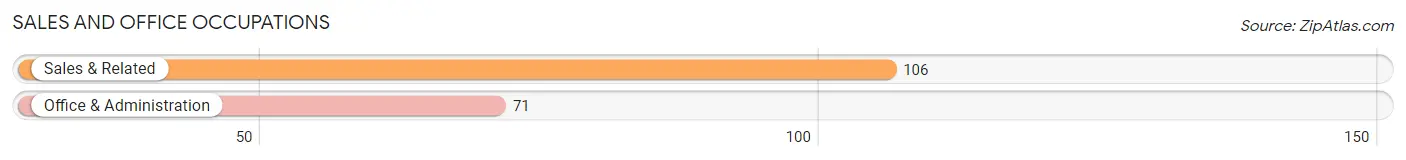
Sales and Office Occupations
The most common Sales and Office occupations in Cherryvale are Sales & Related (106 | 11.6%), and Office & Administration (71 | 7.8%).
Sales and Office Occupations by Sex
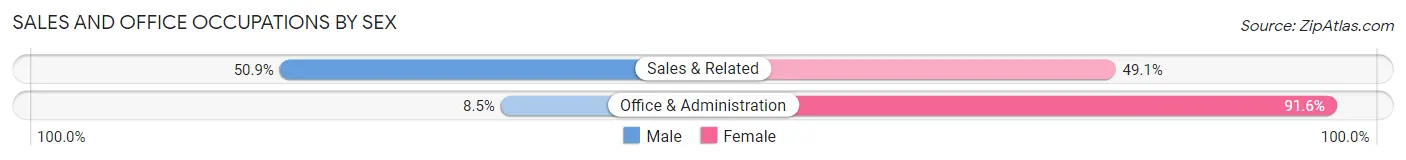
| Occupation | Male | Female |
| Sales & Related | 54 (50.9%) | 52 (49.1%) |
| Office & Administration | 6 (8.5%) | 65 (91.5%) |
| Total (Category) | 60 (33.9%) | 117 (66.1%) |
| Total (Overall) | 515 (56.5%) | 396 (43.5%) |
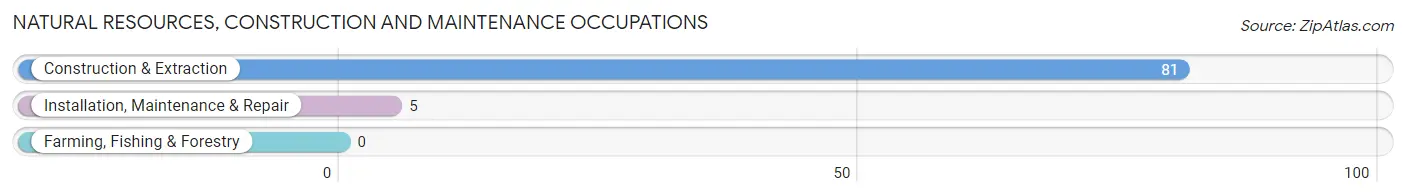
Natural Resources, Construction and Maintenance Occupations
The most common Natural Resources, Construction and Maintenance occupations in Cherryvale are Construction & Extraction (81 | 8.9%), and Installation, Maintenance & Repair (5 | 0.5%).
Natural Resources, Construction and Maintenance Occupations by Sex
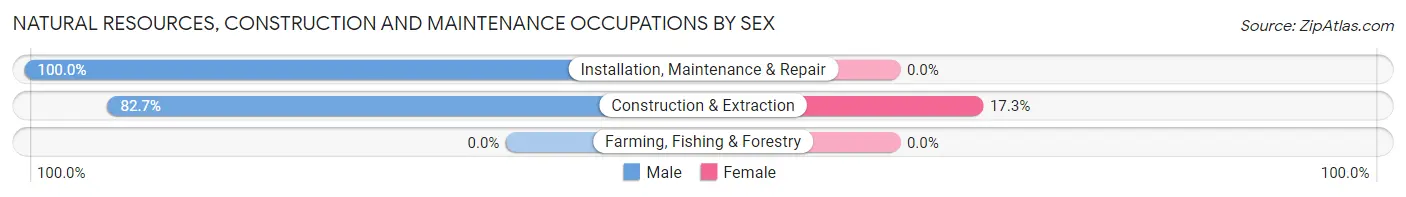
| Occupation | Male | Female |
| Farming, Fishing & Forestry | 0 (0.0%) | 0 (0.0%) |
| Construction & Extraction | 67 (82.7%) | 14 (17.3%) |
| Installation, Maintenance & Repair | 5 (100.0%) | 0 (0.0%) |
| Total (Category) | 72 (83.7%) | 14 (16.3%) |
| Total (Overall) | 515 (56.5%) | 396 (43.5%) |
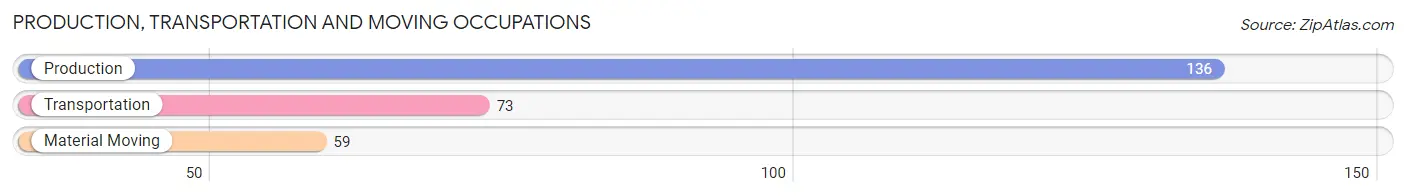
Production, Transportation and Moving Occupations
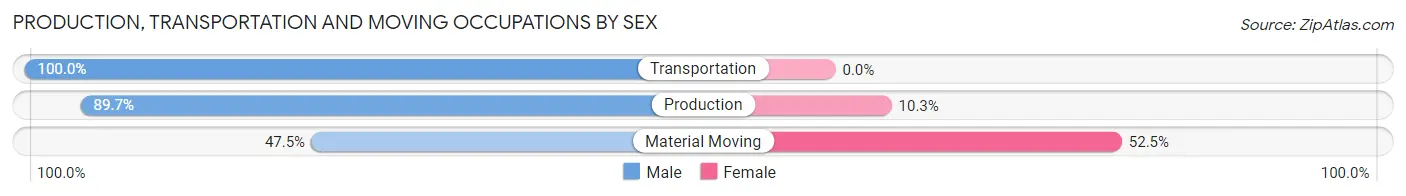
The most common Production, Transportation and Moving occupations in Cherryvale are Production (136 | 14.9%), Transportation (73 | 8.0%), and Material Moving (59 | 6.5%).
Production, Transportation and Moving Occupations by Sex
| Occupation | Male | Female |
| Production | 122 (89.7%) | 14 (10.3%) |
| Transportation | 73 (100.0%) | 0 (0.0%) |
| Material Moving | 28 (47.5%) | 31 (52.5%) |
| Total (Category) | 223 (83.2%) | 45 (16.8%) |
| Total (Overall) | 515 (56.5%) | 396 (43.5%) |
Employment Industries by Sex in Cherryvale
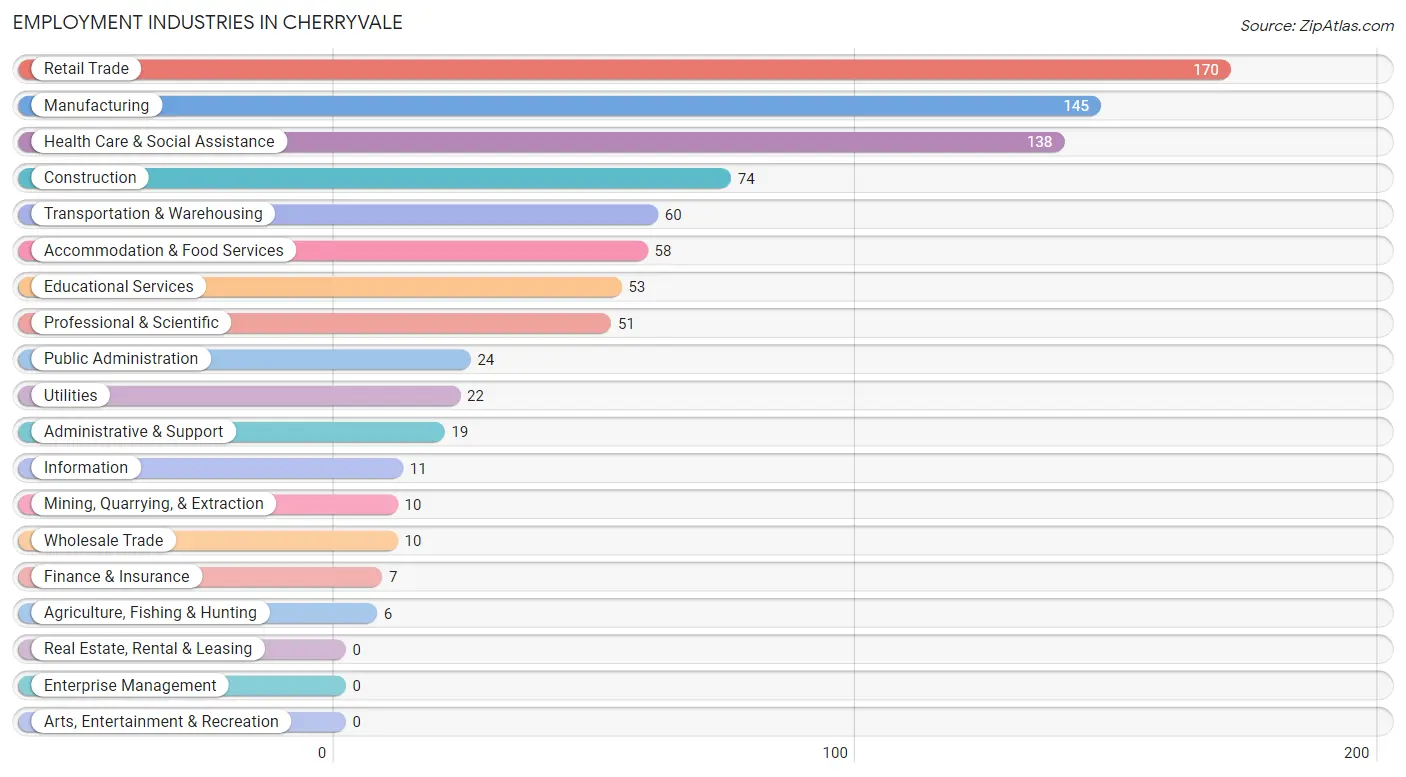
Employment Industries in Cherryvale
The major employment industries in Cherryvale include Retail Trade (170 | 18.7%), Manufacturing (145 | 15.9%), Health Care & Social Assistance (138 | 15.1%), Construction (74 | 8.1%), and Transportation & Warehousing (60 | 6.6%).
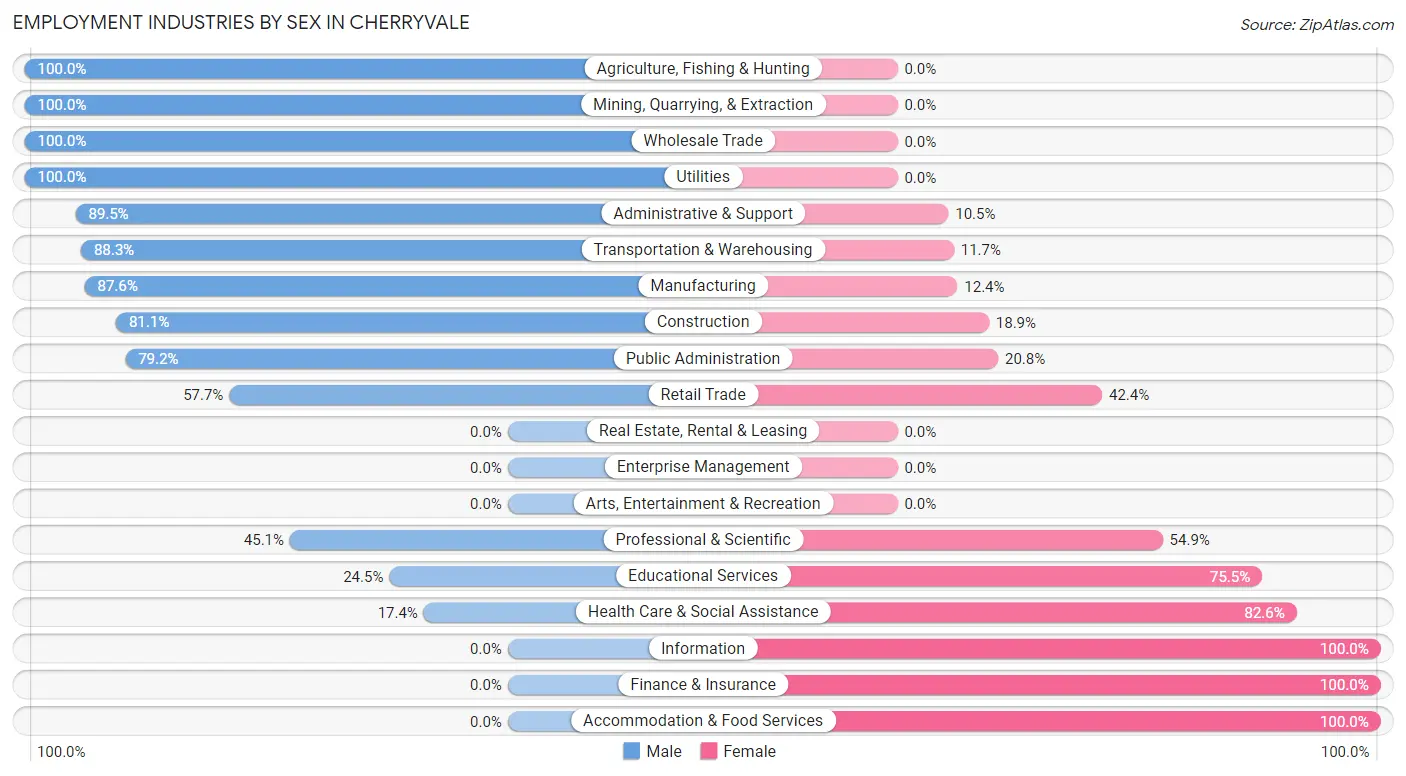
Employment Industries by Sex in Cherryvale
The Cherryvale industries that see more men than women are Agriculture, Fishing & Hunting (100.0%), Mining, Quarrying, & Extraction (100.0%), and Wholesale Trade (100.0%), whereas the industries that tend to have a higher number of women are Information (100.0%), Finance & Insurance (100.0%), and Accommodation & Food Services (100.0%).
| Industry | Male | Female |
| Agriculture, Fishing & Hunting | 6 (100.0%) | 0 (0.0%) |
| Mining, Quarrying, & Extraction | 10 (100.0%) | 0 (0.0%) |
| Construction | 60 (81.1%) | 14 (18.9%) |
| Manufacturing | 127 (87.6%) | 18 (12.4%) |
| Wholesale Trade | 10 (100.0%) | 0 (0.0%) |
| Retail Trade | 98 (57.7%) | 72 (42.3%) |
| Transportation & Warehousing | 53 (88.3%) | 7 (11.7%) |
| Utilities | 22 (100.0%) | 0 (0.0%) |
| Information | 0 (0.0%) | 11 (100.0%) |
| Finance & Insurance | 0 (0.0%) | 7 (100.0%) |
| Real Estate, Rental & Leasing | 0 (0.0%) | 0 (0.0%) |
| Professional & Scientific | 23 (45.1%) | 28 (54.9%) |
| Enterprise Management | 0 (0.0%) | 0 (0.0%) |
| Administrative & Support | 17 (89.5%) | 2 (10.5%) |
| Educational Services | 13 (24.5%) | 40 (75.5%) |
| Health Care & Social Assistance | 24 (17.4%) | 114 (82.6%) |
| Arts, Entertainment & Recreation | 0 (0.0%) | 0 (0.0%) |
| Accommodation & Food Services | 0 (0.0%) | 58 (100.0%) |
| Public Administration | 19 (79.2%) | 5 (20.8%) |
| Total | 515 (56.5%) | 396 (43.5%) |
Education in Cherryvale
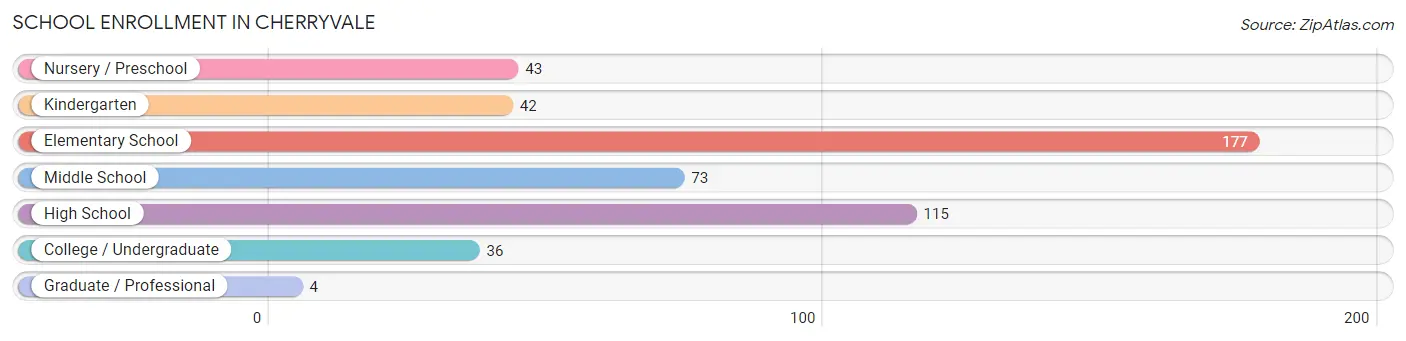
School Enrollment in Cherryvale
The most common levels of schooling among the 490 students in Cherryvale are elementary school (177 | 36.1%), high school (115 | 23.5%), and middle school (73 | 14.9%).
| School Level | # Students | % Students |
| Nursery / Preschool | 43 | 8.8% |
| Kindergarten | 42 | 8.6% |
| Elementary School | 177 | 36.1% |
| Middle School | 73 | 14.9% |
| High School | 115 | 23.5% |
| College / Undergraduate | 36 | 7.3% |
| Graduate / Professional | 4 | 0.8% |
| Total | 490 | 100.0% |
School Enrollment by Age by Funding Source in Cherryvale
Out of a total of 490 students who are enrolled in schools in Cherryvale, 72 (14.7%) attend a private institution, while the remaining 418 (85.3%) are enrolled in public schools. The age group of 3 to 4 year olds has the highest likelihood of being enrolled in private schools, with 6 (100.0% in the age bracket) enrolled. Conversely, the age group of 18 to 19 year olds has the lowest likelihood of being enrolled in a private school, with 12 (100.0% in the age bracket) attending a public institution.
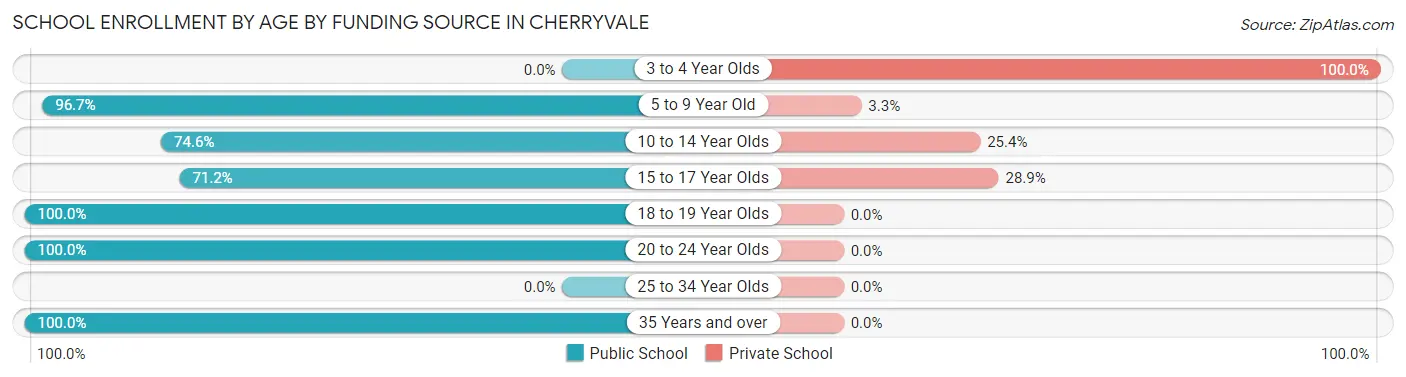
| Age Bracket | Public School | Private School |
| 3 to 4 Year Olds | 0 (0.0%) | 6 (100.0%) |
| 5 to 9 Year Old | 205 (96.7%) | 7 (3.3%) |
| 10 to 14 Year Olds | 85 (74.6%) | 29 (25.4%) |
| 15 to 17 Year Olds | 74 (71.2%) | 30 (28.8%) |
| 18 to 19 Year Olds | 12 (100.0%) | 0 (0.0%) |
| 20 to 24 Year Olds | 17 (100.0%) | 0 (0.0%) |
| 25 to 34 Year Olds | 0 (0.0%) | 0 (0.0%) |
| 35 Years and over | 25 (100.0%) | 0 (0.0%) |
| Total | 418 (85.3%) | 72 (14.7%) |
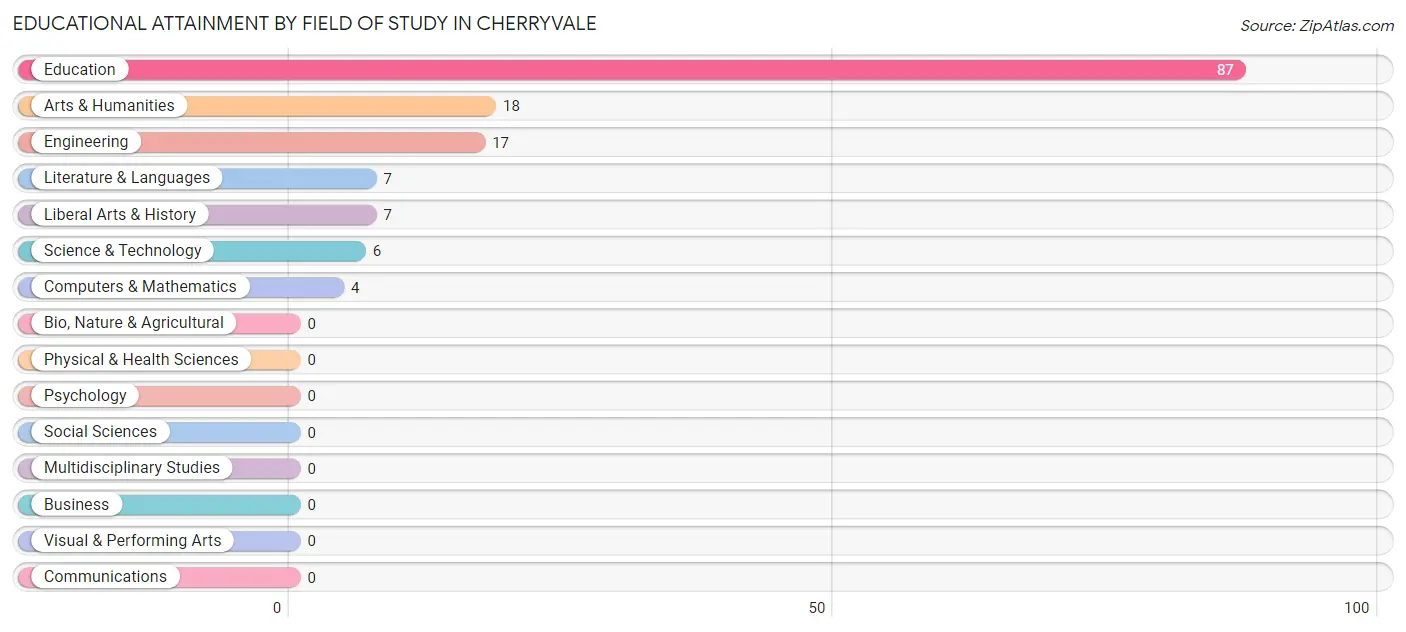
Educational Attainment by Field of Study in Cherryvale
Education (87 | 59.6%), arts & humanities (18 | 12.3%), engineering (17 | 11.6%), literature & languages (7 | 4.8%), and liberal arts & history (7 | 4.8%) are the most common fields of study among 146 individuals in Cherryvale who have obtained a bachelor's degree or higher.
| Field of Study | # Graduates | % Graduates |
| Computers & Mathematics | 4 | 2.7% |
| Bio, Nature & Agricultural | 0 | 0.0% |
| Physical & Health Sciences | 0 | 0.0% |
| Psychology | 0 | 0.0% |
| Social Sciences | 0 | 0.0% |
| Engineering | 17 | 11.6% |
| Multidisciplinary Studies | 0 | 0.0% |
| Science & Technology | 6 | 4.1% |
| Business | 0 | 0.0% |
| Education | 87 | 59.6% |
| Literature & Languages | 7 | 4.8% |
| Liberal Arts & History | 7 | 4.8% |
| Visual & Performing Arts | 0 | 0.0% |
| Communications | 0 | 0.0% |
| Arts & Humanities | 18 | 12.3% |
| Total | 146 | 100.0% |
Transportation & Commute in Cherryvale
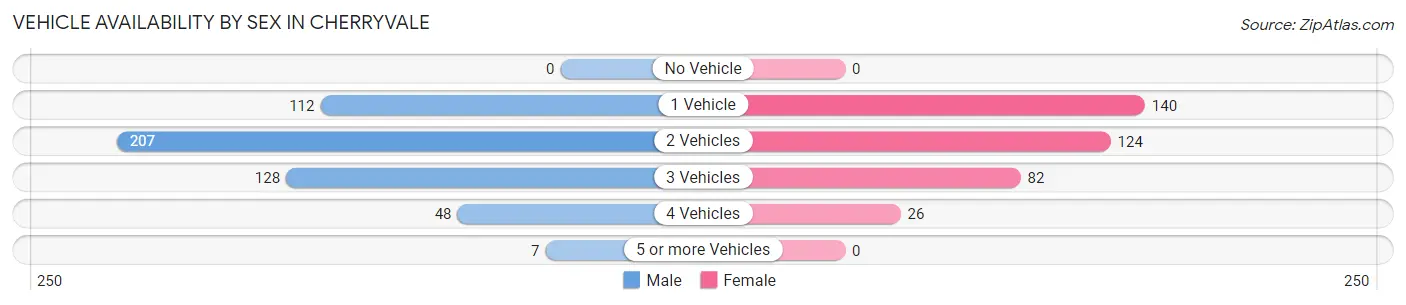
Vehicle Availability by Sex in Cherryvale
The most prevalent vehicle ownership categories in Cherryvale are males with 2 vehicles (207, accounting for 41.2%) and females with 2 vehicles (124, making up 55.6%).
| Vehicles Available | Male | Female |
| No Vehicle | 0 (0.0%) | 0 (0.0%) |
| 1 Vehicle | 112 (22.3%) | 140 (37.6%) |
| 2 Vehicles | 207 (41.2%) | 124 (33.3%) |
| 3 Vehicles | 128 (25.5%) | 82 (22.0%) |
| 4 Vehicles | 48 (9.6%) | 26 (7.0%) |
| 5 or more Vehicles | 7 (1.4%) | 0 (0.0%) |
| Total | 502 (100.0%) | 372 (100.0%) |
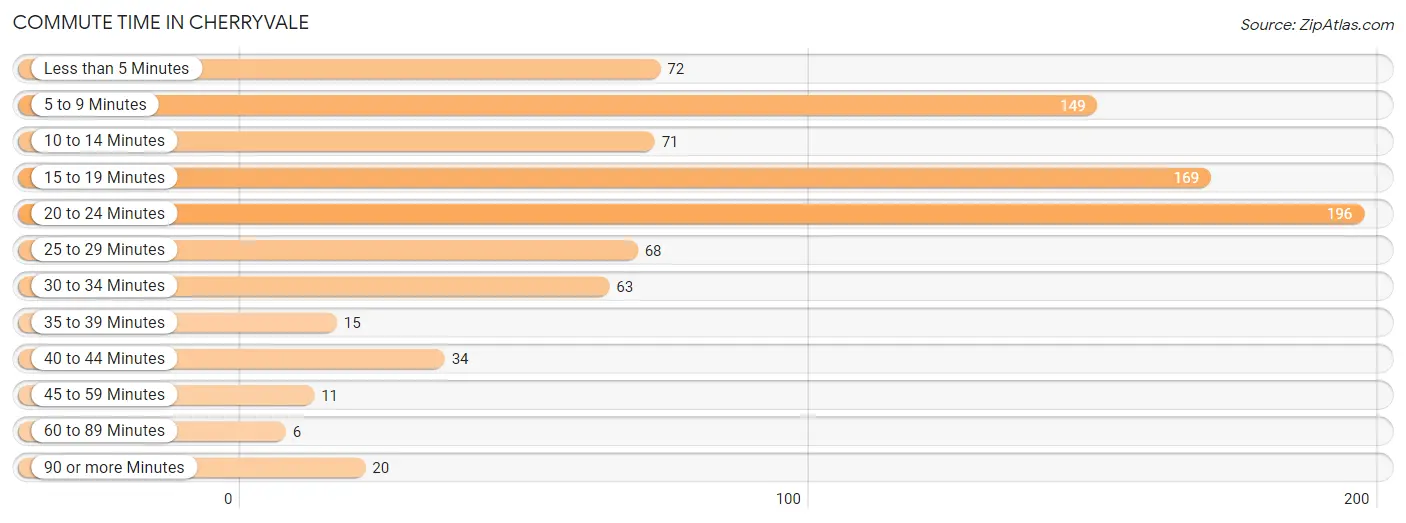
Commute Time in Cherryvale
The most frequently occuring commute durations in Cherryvale are 20 to 24 minutes (196 commuters, 22.4%), 15 to 19 minutes (169 commuters, 19.3%), and 5 to 9 minutes (149 commuters, 17.1%).
| Commute Time | # Commuters | % Commuters |
| Less than 5 Minutes | 72 | 8.2% |
| 5 to 9 Minutes | 149 | 17.1% |
| 10 to 14 Minutes | 71 | 8.1% |
| 15 to 19 Minutes | 169 | 19.3% |
| 20 to 24 Minutes | 196 | 22.4% |
| 25 to 29 Minutes | 68 | 7.8% |
| 30 to 34 Minutes | 63 | 7.2% |
| 35 to 39 Minutes | 15 | 1.7% |
| 40 to 44 Minutes | 34 | 3.9% |
| 45 to 59 Minutes | 11 | 1.3% |
| 60 to 89 Minutes | 6 | 0.7% |
| 90 or more Minutes | 20 | 2.3% |
Commute Time by Sex in Cherryvale
The most common commute times in Cherryvale are 20 to 24 minutes (147 commuters, 29.3%) for males and 10 to 14 minutes (71 commuters, 19.1%) for females.
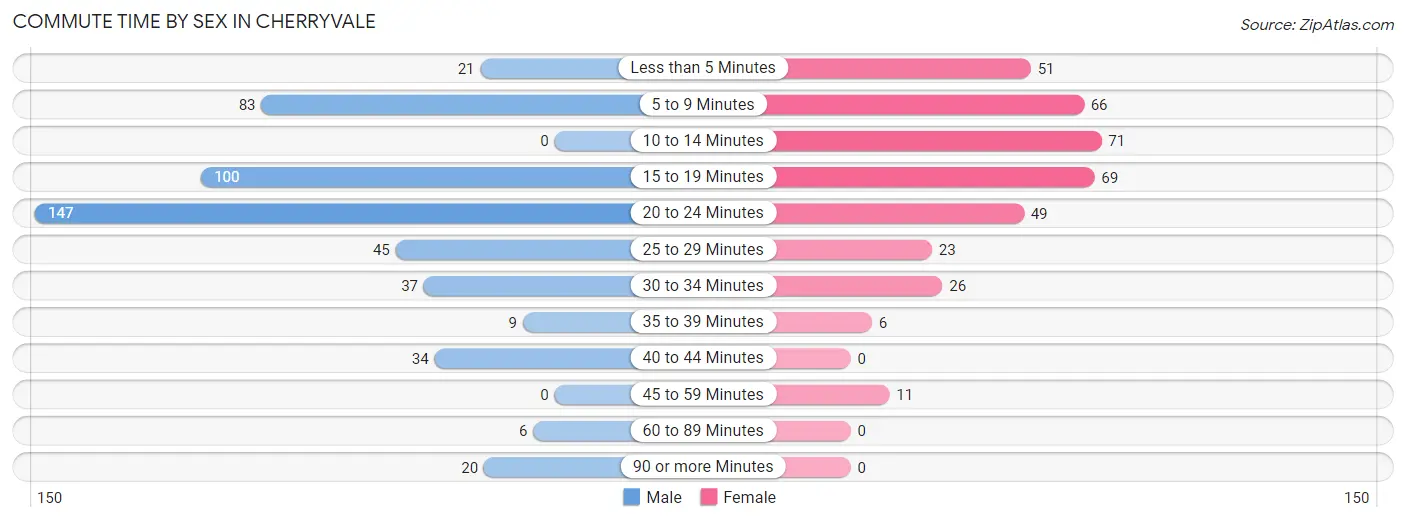
| Commute Time | Male | Female |
| Less than 5 Minutes | 21 (4.2%) | 51 (13.7%) |
| 5 to 9 Minutes | 83 (16.5%) | 66 (17.7%) |
| 10 to 14 Minutes | 0 (0.0%) | 71 (19.1%) |
| 15 to 19 Minutes | 100 (19.9%) | 69 (18.5%) |
| 20 to 24 Minutes | 147 (29.3%) | 49 (13.2%) |
| 25 to 29 Minutes | 45 (9.0%) | 23 (6.2%) |
| 30 to 34 Minutes | 37 (7.4%) | 26 (7.0%) |
| 35 to 39 Minutes | 9 (1.8%) | 6 (1.6%) |
| 40 to 44 Minutes | 34 (6.8%) | 0 (0.0%) |
| 45 to 59 Minutes | 0 (0.0%) | 11 (3.0%) |
| 60 to 89 Minutes | 6 (1.2%) | 0 (0.0%) |
| 90 or more Minutes | 20 (4.0%) | 0 (0.0%) |
Time of Departure to Work by Sex in Cherryvale
The most frequent times of departure to work in Cherryvale are 12:00 AM to 4:59 AM (93, 18.5%) for males and 7:30 AM to 7:59 AM (77, 20.7%) for females.
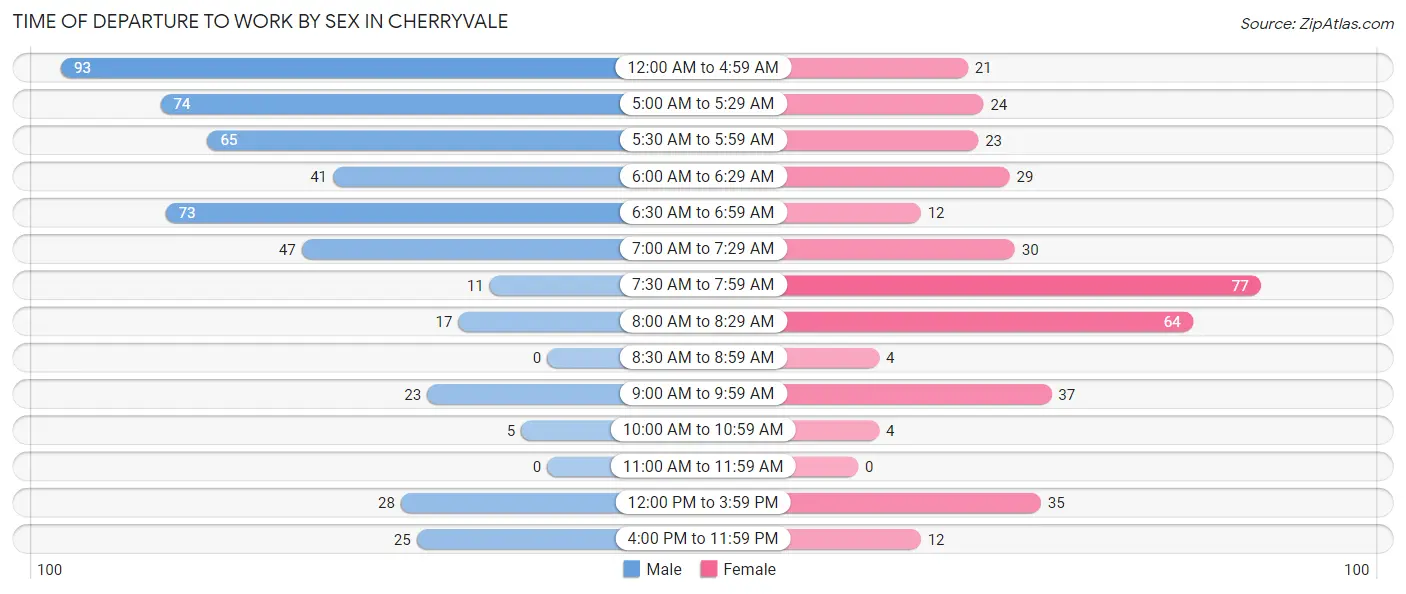
| Time of Departure | Male | Female |
| 12:00 AM to 4:59 AM | 93 (18.5%) | 21 (5.7%) |
| 5:00 AM to 5:29 AM | 74 (14.7%) | 24 (6.5%) |
| 5:30 AM to 5:59 AM | 65 (13.0%) | 23 (6.2%) |
| 6:00 AM to 6:29 AM | 41 (8.2%) | 29 (7.8%) |
| 6:30 AM to 6:59 AM | 73 (14.5%) | 12 (3.2%) |
| 7:00 AM to 7:29 AM | 47 (9.4%) | 30 (8.1%) |
| 7:30 AM to 7:59 AM | 11 (2.2%) | 77 (20.7%) |
| 8:00 AM to 8:29 AM | 17 (3.4%) | 64 (17.2%) |
| 8:30 AM to 8:59 AM | 0 (0.0%) | 4 (1.1%) |
| 9:00 AM to 9:59 AM | 23 (4.6%) | 37 (10.0%) |
| 10:00 AM to 10:59 AM | 5 (1.0%) | 4 (1.1%) |
| 11:00 AM to 11:59 AM | 0 (0.0%) | 0 (0.0%) |
| 12:00 PM to 3:59 PM | 28 (5.6%) | 35 (9.4%) |
| 4:00 PM to 11:59 PM | 25 (5.0%) | 12 (3.2%) |
| Total | 502 (100.0%) | 372 (100.0%) |
Housing Occupancy in Cherryvale
Occupancy by Ownership in Cherryvale
Of the total 817 dwellings in Cherryvale, owner-occupied units account for 550 (67.3%), while renter-occupied units make up 267 (32.7%).
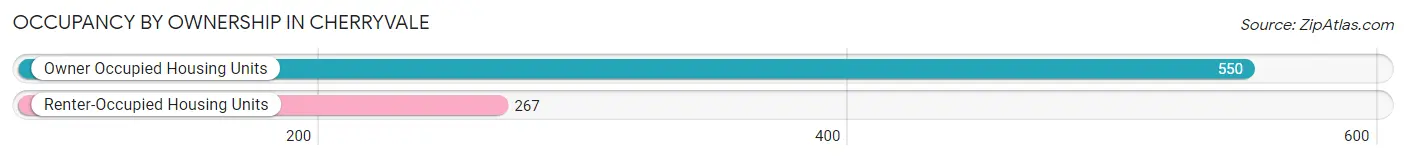
| Occupancy | # Housing Units | % Housing Units |
| Owner Occupied Housing Units | 550 | 67.3% |
| Renter-Occupied Housing Units | 267 | 32.7% |
| Total Occupied Housing Units | 817 | 100.0% |
Occupancy by Household Size in Cherryvale
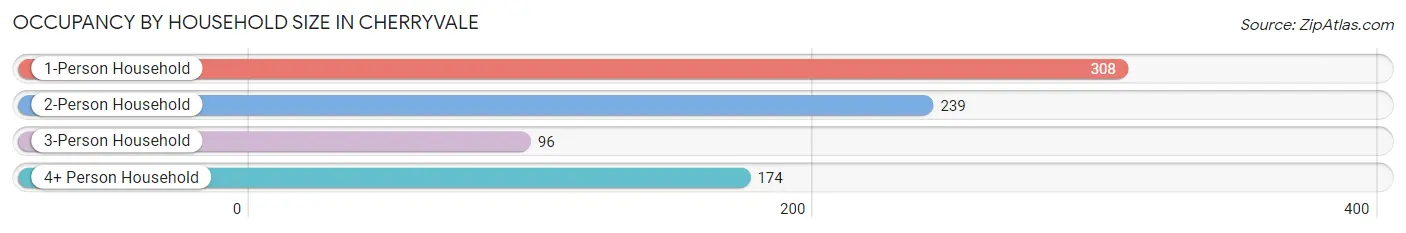
| Household Size | # Housing Units | % Housing Units |
| 1-Person Household | 308 | 37.7% |
| 2-Person Household | 239 | 29.2% |
| 3-Person Household | 96 | 11.7% |
| 4+ Person Household | 174 | 21.3% |
| Total Housing Units | 817 | 100.0% |
Occupancy by Ownership by Household Size in Cherryvale
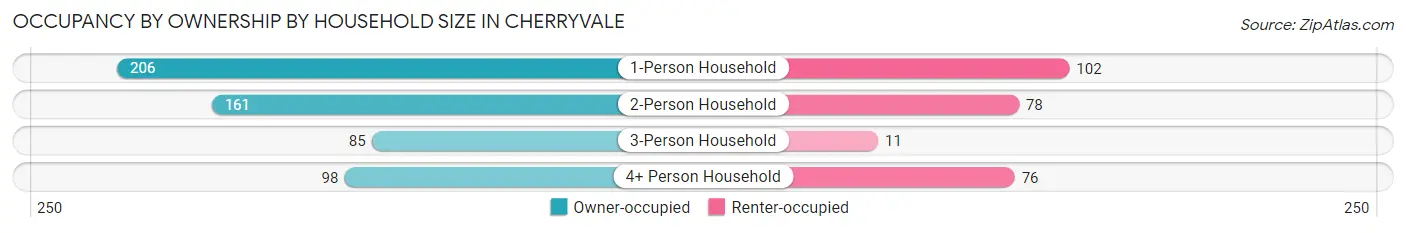
| Household Size | Owner-occupied | Renter-occupied |
| 1-Person Household | 206 (66.9%) | 102 (33.1%) |
| 2-Person Household | 161 (67.4%) | 78 (32.6%) |
| 3-Person Household | 85 (88.5%) | 11 (11.5%) |
| 4+ Person Household | 98 (56.3%) | 76 (43.7%) |
| Total Housing Units | 550 (67.3%) | 267 (32.7%) |
Occupancy by Educational Attainment in Cherryvale
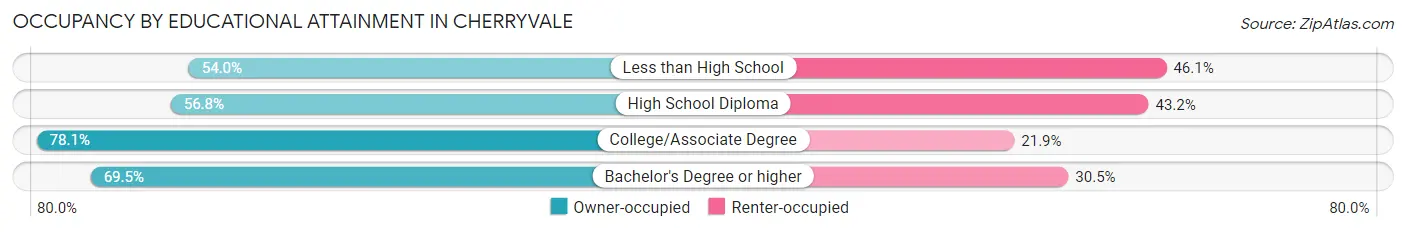
| Household Size | Owner-occupied | Renter-occupied |
| Less than High School | 41 (53.9%) | 35 (46.1%) |
| High School Diploma | 167 (56.8%) | 127 (43.2%) |
| College/Associate Degree | 285 (78.1%) | 80 (21.9%) |
| Bachelor's Degree or higher | 57 (69.5%) | 25 (30.5%) |
Occupancy by Age of Householder in Cherryvale
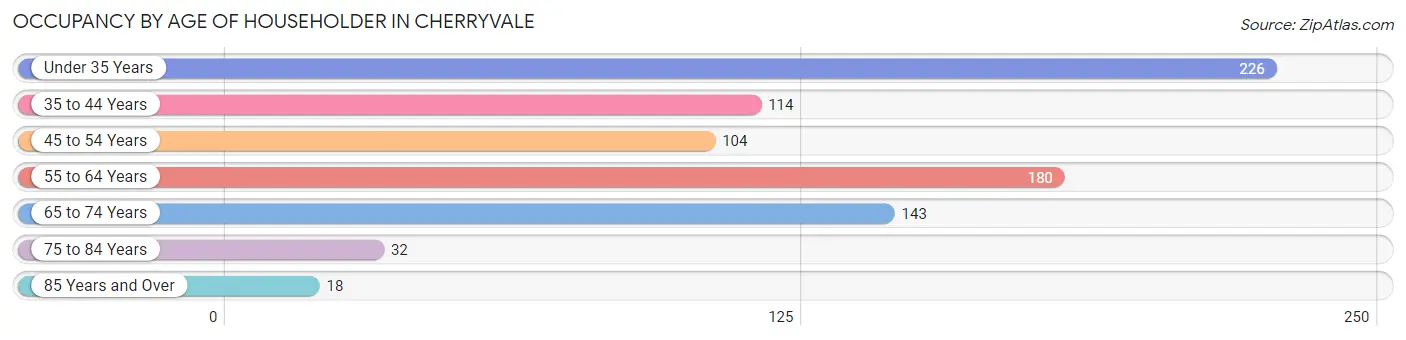
| Age Bracket | # Households | % Households |
| Under 35 Years | 226 | 27.7% |
| 35 to 44 Years | 114 | 14.0% |
| 45 to 54 Years | 104 | 12.7% |
| 55 to 64 Years | 180 | 22.0% |
| 65 to 74 Years | 143 | 17.5% |
| 75 to 84 Years | 32 | 3.9% |
| 85 Years and Over | 18 | 2.2% |
| Total | 817 | 100.0% |
Housing Finances in Cherryvale
Median Income by Occupancy in Cherryvale
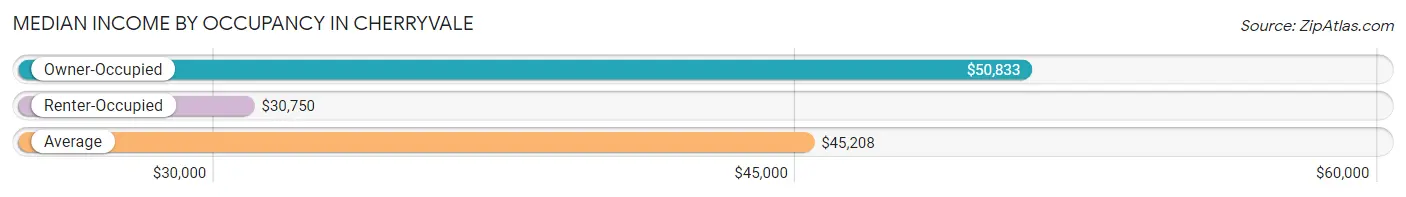
| Occupancy Type | # Households | Median Income |
| Owner-Occupied | 550 (67.3%) | $50,833 |
| Renter-Occupied | 267 (32.7%) | $30,750 |
| Average | 817 (100.0%) | $45,208 |
Occupancy by Householder Income Bracket in Cherryvale
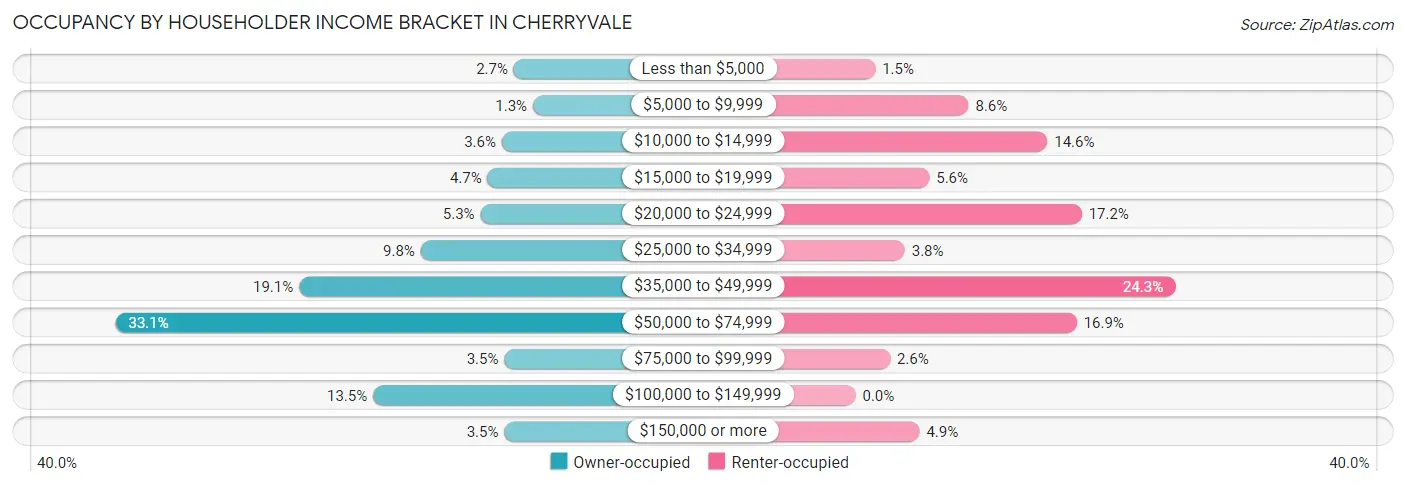
| Income Bracket | Owner-occupied | Renter-occupied |
| Less than $5,000 | 15 (2.7%) | 4 (1.5%) |
| $5,000 to $9,999 | 7 (1.3%) | 23 (8.6%) |
| $10,000 to $14,999 | 20 (3.6%) | 39 (14.6%) |
| $15,000 to $19,999 | 26 (4.7%) | 15 (5.6%) |
| $20,000 to $24,999 | 29 (5.3%) | 46 (17.2%) |
| $25,000 to $34,999 | 54 (9.8%) | 10 (3.7%) |
| $35,000 to $49,999 | 105 (19.1%) | 65 (24.3%) |
| $50,000 to $74,999 | 182 (33.1%) | 45 (16.9%) |
| $75,000 to $99,999 | 19 (3.5%) | 7 (2.6%) |
| $100,000 to $149,999 | 74 (13.5%) | 0 (0.0%) |
| $150,000 or more | 19 (3.5%) | 13 (4.9%) |
| Total | 550 (100.0%) | 267 (100.0%) |
Monthly Housing Cost Tiers in Cherryvale
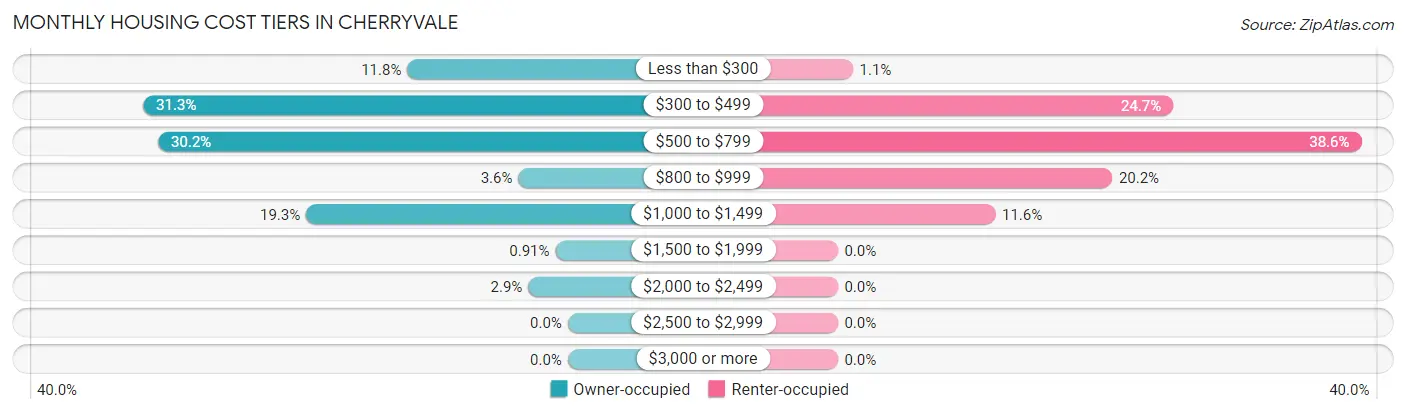
| Monthly Cost | Owner-occupied | Renter-occupied |
| Less than $300 | 65 (11.8%) | 3 (1.1%) |
| $300 to $499 | 172 (31.3%) | 66 (24.7%) |
| $500 to $799 | 166 (30.2%) | 103 (38.6%) |
| $800 to $999 | 20 (3.6%) | 54 (20.2%) |
| $1,000 to $1,499 | 106 (19.3%) | 31 (11.6%) |
| $1,500 to $1,999 | 5 (0.9%) | 0 (0.0%) |
| $2,000 to $2,499 | 16 (2.9%) | 0 (0.0%) |
| $2,500 to $2,999 | 0 (0.0%) | 0 (0.0%) |
| $3,000 or more | 0 (0.0%) | 0 (0.0%) |
| Total | 550 (100.0%) | 267 (100.0%) |
Physical Housing Characteristics in Cherryvale
Housing Structures in Cherryvale
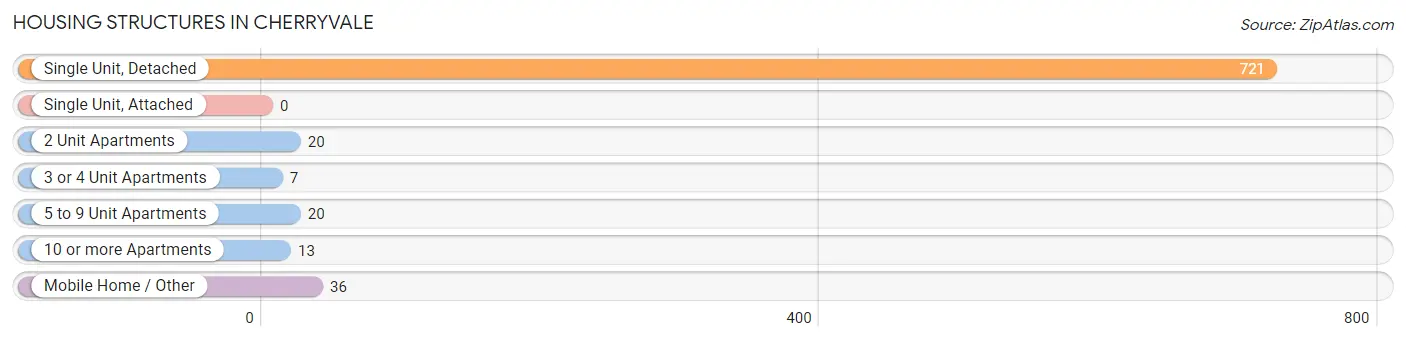
| Structure Type | # Housing Units | % Housing Units |
| Single Unit, Detached | 721 | 88.2% |
| Single Unit, Attached | 0 | 0.0% |
| 2 Unit Apartments | 20 | 2.5% |
| 3 or 4 Unit Apartments | 7 | 0.9% |
| 5 to 9 Unit Apartments | 20 | 2.5% |
| 10 or more Apartments | 13 | 1.6% |
| Mobile Home / Other | 36 | 4.4% |
| Total | 817 | 100.0% |
Housing Structures by Occupancy in Cherryvale
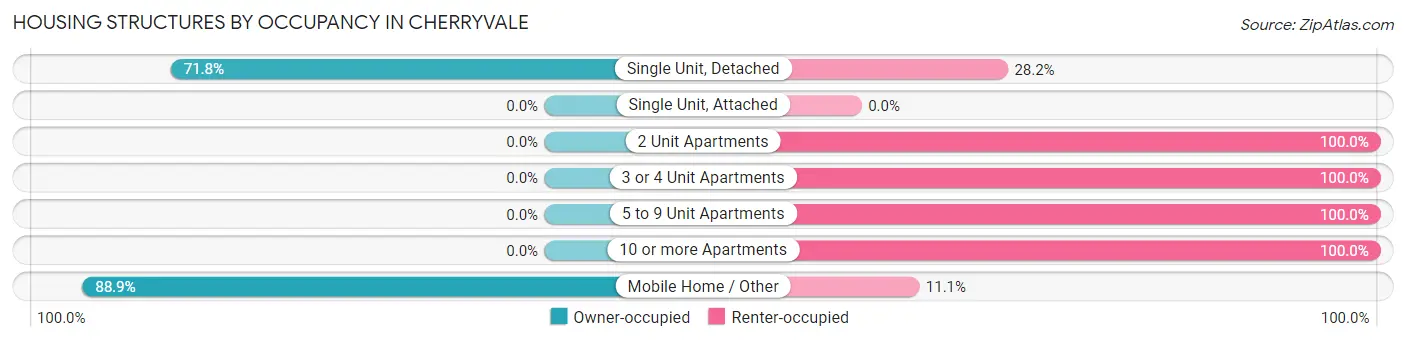
| Structure Type | Owner-occupied | Renter-occupied |
| Single Unit, Detached | 518 (71.8%) | 203 (28.2%) |
| Single Unit, Attached | 0 (0.0%) | 0 (0.0%) |
| 2 Unit Apartments | 0 (0.0%) | 20 (100.0%) |
| 3 or 4 Unit Apartments | 0 (0.0%) | 7 (100.0%) |
| 5 to 9 Unit Apartments | 0 (0.0%) | 20 (100.0%) |
| 10 or more Apartments | 0 (0.0%) | 13 (100.0%) |
| Mobile Home / Other | 32 (88.9%) | 4 (11.1%) |
| Total | 550 (67.3%) | 267 (32.7%) |
Housing Structures by Number of Rooms in Cherryvale
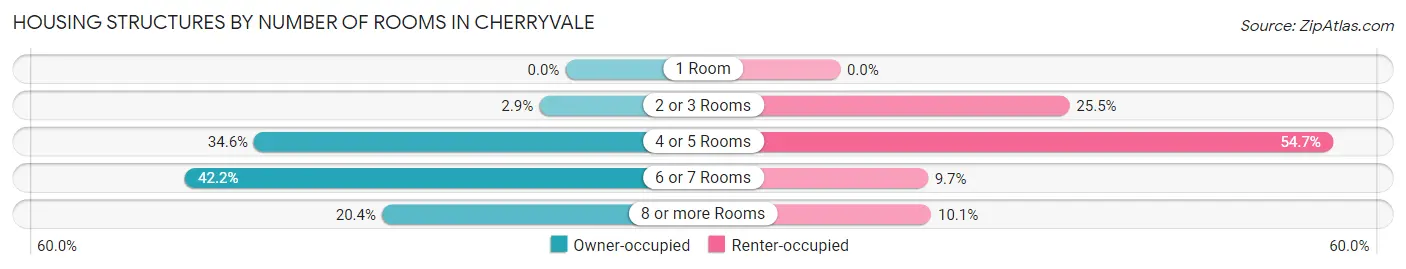
| Number of Rooms | Owner-occupied | Renter-occupied |
| 1 Room | 0 (0.0%) | 0 (0.0%) |
| 2 or 3 Rooms | 16 (2.9%) | 68 (25.5%) |
| 4 or 5 Rooms | 190 (34.5%) | 146 (54.7%) |
| 6 or 7 Rooms | 232 (42.2%) | 26 (9.7%) |
| 8 or more Rooms | 112 (20.4%) | 27 (10.1%) |
| Total | 550 (100.0%) | 267 (100.0%) |
Housing Structure by Heating Type in Cherryvale
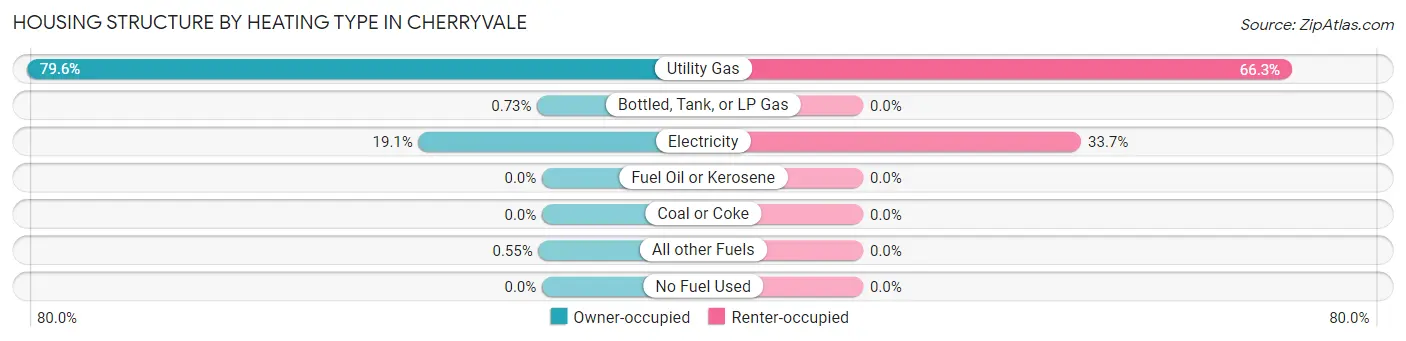
| Heating Type | Owner-occupied | Renter-occupied |
| Utility Gas | 438 (79.6%) | 177 (66.3%) |
| Bottled, Tank, or LP Gas | 4 (0.7%) | 0 (0.0%) |
| Electricity | 105 (19.1%) | 90 (33.7%) |
| Fuel Oil or Kerosene | 0 (0.0%) | 0 (0.0%) |
| Coal or Coke | 0 (0.0%) | 0 (0.0%) |
| All other Fuels | 3 (0.5%) | 0 (0.0%) |
| No Fuel Used | 0 (0.0%) | 0 (0.0%) |
| Total | 550 (100.0%) | 267 (100.0%) |
Household Vehicle Usage in Cherryvale
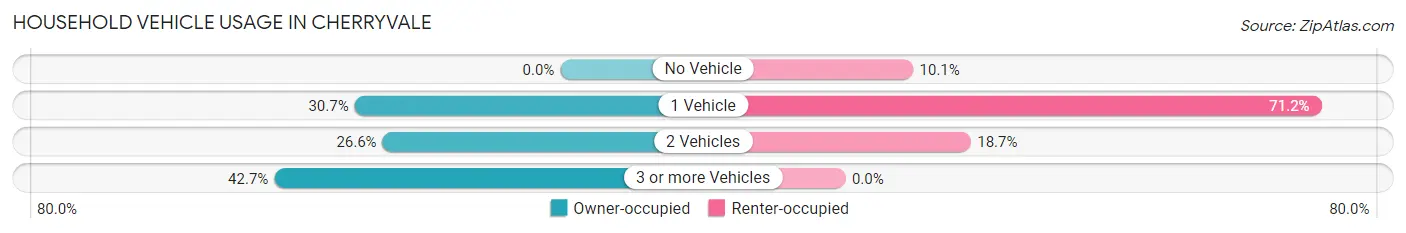
| Vehicles per Household | Owner-occupied | Renter-occupied |
| No Vehicle | 0 (0.0%) | 27 (10.1%) |
| 1 Vehicle | 169 (30.7%) | 190 (71.2%) |
| 2 Vehicles | 146 (26.6%) | 50 (18.7%) |
| 3 or more Vehicles | 235 (42.7%) | 0 (0.0%) |
| Total | 550 (100.0%) | 267 (100.0%) |
Real Estate & Mortgages in Cherryvale
Real Estate and Mortgage Overview in Cherryvale
| Characteristic | Without Mortgage | With Mortgage |
| Housing Units | 365 | 185 |
| Median Property Value | $40,600 | $59,200 |
| Median Household Income | $48,819 | $16 |
| Monthly Housing Costs | $434 | $0 |
| Real Estate Taxes | $745 | $0 |
Property Value by Mortgage Status in Cherryvale
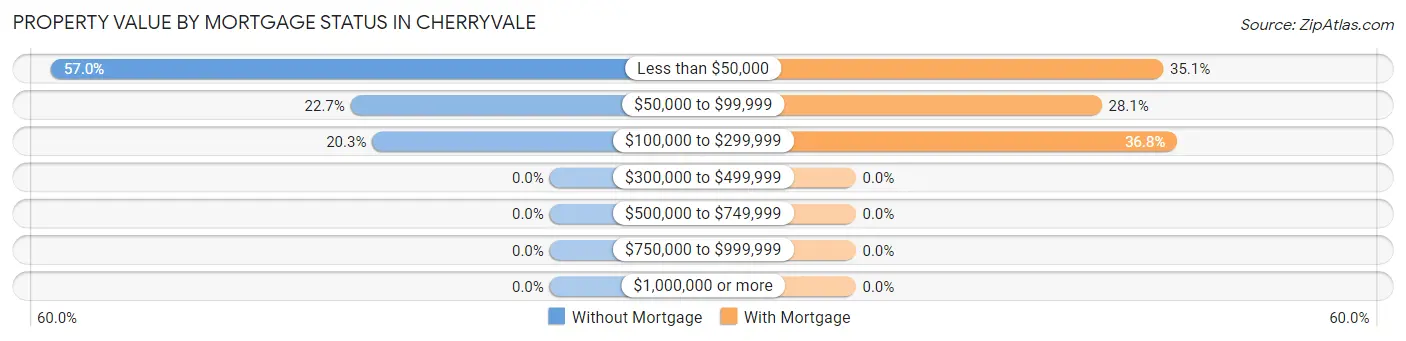
| Property Value | Without Mortgage | With Mortgage |
| Less than $50,000 | 208 (57.0%) | 65 (35.1%) |
| $50,000 to $99,999 | 83 (22.7%) | 52 (28.1%) |
| $100,000 to $299,999 | 74 (20.3%) | 68 (36.8%) |
| $300,000 to $499,999 | 0 (0.0%) | 0 (0.0%) |
| $500,000 to $749,999 | 0 (0.0%) | 0 (0.0%) |
| $750,000 to $999,999 | 0 (0.0%) | 0 (0.0%) |
| $1,000,000 or more | 0 (0.0%) | 0 (0.0%) |
| Total | 365 (100.0%) | 185 (100.0%) |
Household Income by Mortgage Status in Cherryvale
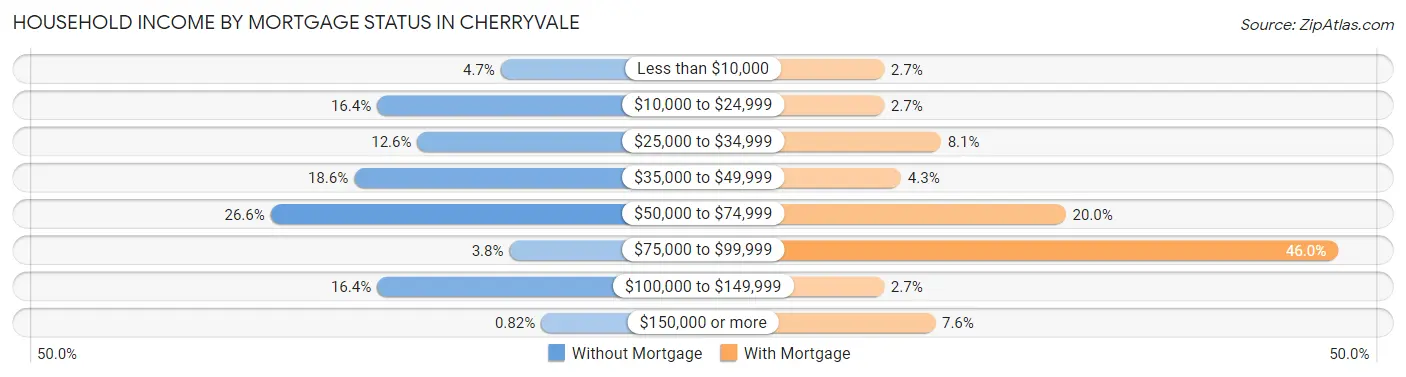
| Household Income | Without Mortgage | With Mortgage |
| Less than $10,000 | 17 (4.7%) | 5 (2.7%) |
| $10,000 to $24,999 | 60 (16.4%) | 5 (2.7%) |
| $25,000 to $34,999 | 46 (12.6%) | 15 (8.1%) |
| $35,000 to $49,999 | 68 (18.6%) | 8 (4.3%) |
| $50,000 to $74,999 | 97 (26.6%) | 37 (20.0%) |
| $75,000 to $99,999 | 14 (3.8%) | 85 (46.0%) |
| $100,000 to $149,999 | 60 (16.4%) | 5 (2.7%) |
| $150,000 or more | 3 (0.8%) | 14 (7.6%) |
| Total | 365 (100.0%) | 185 (100.0%) |
Property Value to Household Income Ratio in Cherryvale
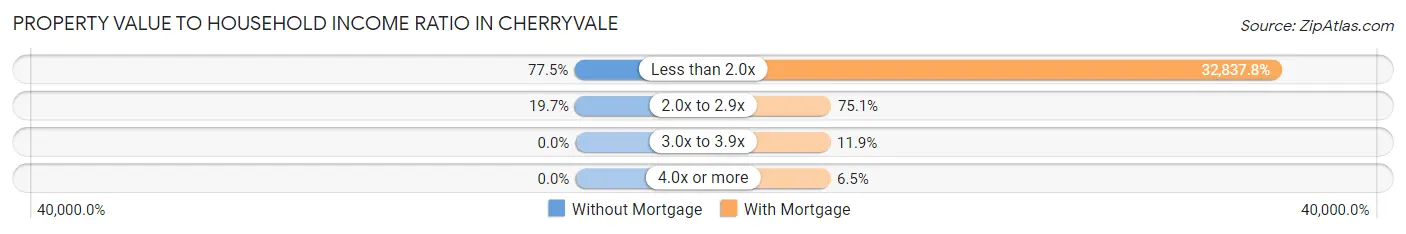
| Value-to-Income Ratio | Without Mortgage | With Mortgage |
| Less than 2.0x | 283 (77.5%) | 60,750 (32,837.8%) |
| 2.0x to 2.9x | 72 (19.7%) | 139 (75.1%) |
| 3.0x to 3.9x | 0 (0.0%) | 22 (11.9%) |
| 4.0x or more | 0 (0.0%) | 12 (6.5%) |
| Total | 365 (100.0%) | 185 (100.0%) |
Real Estate Taxes by Mortgage Status in Cherryvale
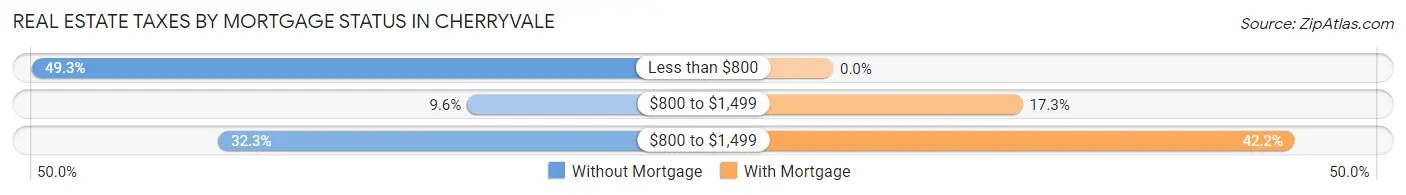
| Property Taxes | Without Mortgage | With Mortgage |
| Less than $800 | 180 (49.3%) | 0 (0.0%) |
| $800 to $1,499 | 35 (9.6%) | 32 (17.3%) |
| $800 to $1,499 | 118 (32.3%) | 78 (42.2%) |
| Total | 365 (100.0%) | 185 (100.0%) |
Health & Disability in Cherryvale
Health Insurance Coverage by Age in Cherryvale
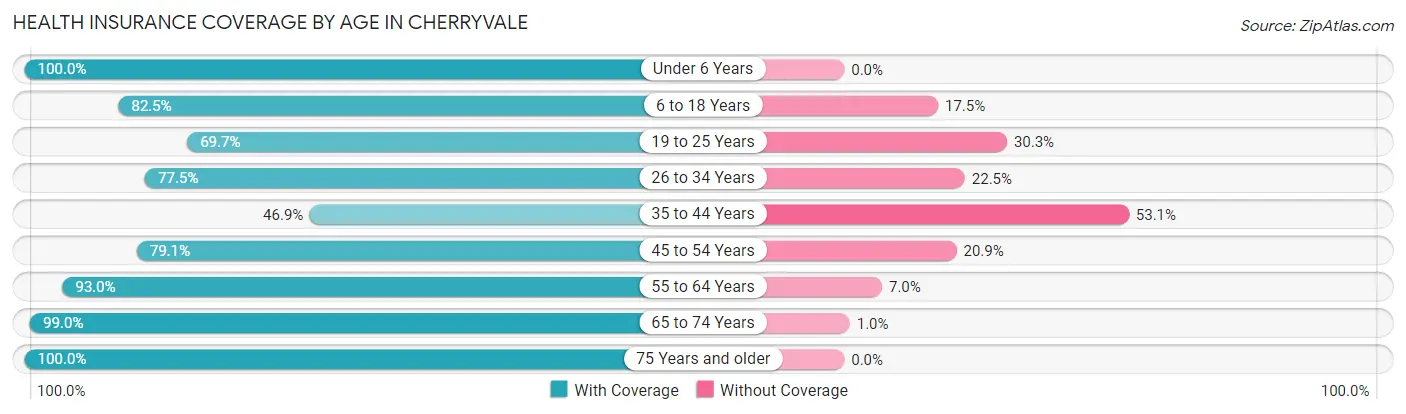
| Age Bracket | With Coverage | Without Coverage |
| Under 6 Years | 229 (100.0%) | 0 (0.0%) |
| 6 to 18 Years | 321 (82.5%) | 68 (17.5%) |
| 19 to 25 Years | 85 (69.7%) | 37 (30.3%) |
| 26 to 34 Years | 231 (77.5%) | 67 (22.5%) |
| 35 to 44 Years | 115 (46.9%) | 130 (53.1%) |
| 45 to 54 Years | 170 (79.1%) | 45 (20.9%) |
| 55 to 64 Years | 264 (93.0%) | 20 (7.0%) |
| 65 to 74 Years | 195 (99.0%) | 2 (1.0%) |
| 75 Years and older | 82 (100.0%) | 0 (0.0%) |
| Total | 1,692 (82.1%) | 369 (17.9%) |
Health Insurance Coverage by Citizenship Status in Cherryvale
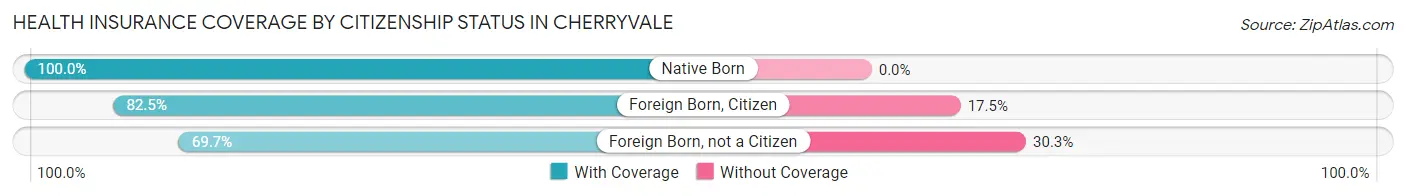
| Citizenship Status | With Coverage | Without Coverage |
| Native Born | 229 (100.0%) | 0 (0.0%) |
| Foreign Born, Citizen | 321 (82.5%) | 68 (17.5%) |
| Foreign Born, not a Citizen | 85 (69.7%) | 37 (30.3%) |
Health Insurance Coverage by Household Income in Cherryvale
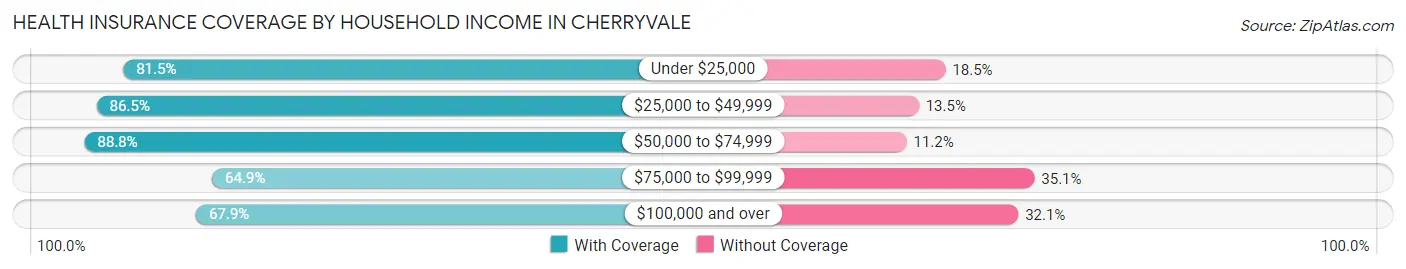
| Household Income | With Coverage | Without Coverage |
| Under $25,000 | 353 (81.5%) | 80 (18.5%) |
| $25,000 to $49,999 | 475 (86.5%) | 74 (13.5%) |
| $50,000 to $74,999 | 563 (88.8%) | 71 (11.2%) |
| $75,000 to $99,999 | 24 (64.9%) | 13 (35.1%) |
| $100,000 and over | 277 (67.9%) | 131 (32.1%) |
Public vs Private Health Insurance Coverage by Age in Cherryvale
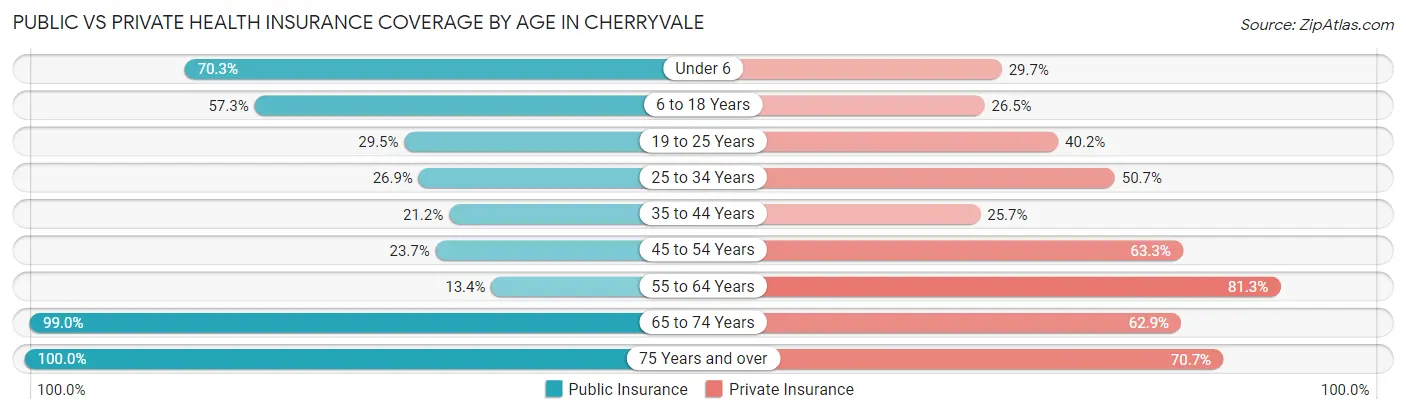
| Age Bracket | Public Insurance | Private Insurance |
| Under 6 | 161 (70.3%) | 68 (29.7%) |
| 6 to 18 Years | 223 (57.3%) | 103 (26.5%) |
| 19 to 25 Years | 36 (29.5%) | 49 (40.2%) |
| 25 to 34 Years | 80 (26.9%) | 151 (50.7%) |
| 35 to 44 Years | 52 (21.2%) | 63 (25.7%) |
| 45 to 54 Years | 51 (23.7%) | 136 (63.3%) |
| 55 to 64 Years | 38 (13.4%) | 231 (81.3%) |
| 65 to 74 Years | 195 (99.0%) | 124 (62.9%) |
| 75 Years and over | 82 (100.0%) | 58 (70.7%) |
| Total | 918 (44.5%) | 983 (47.7%) |
Disability Status by Sex by Age in Cherryvale
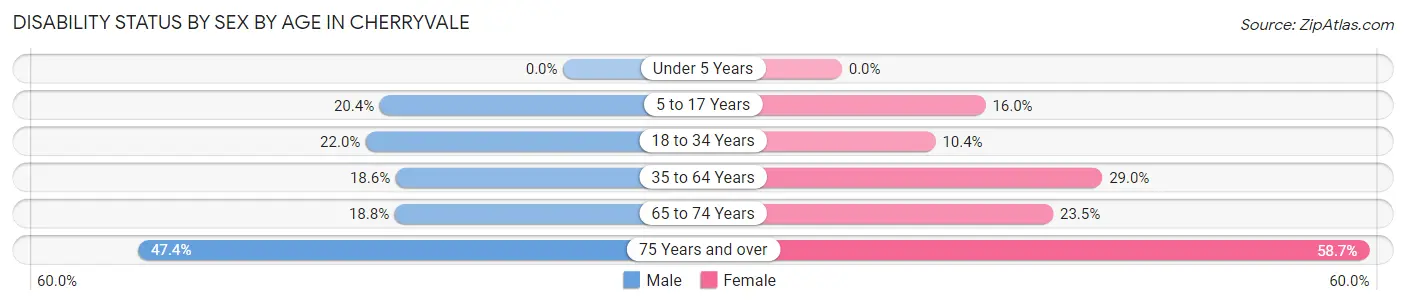
| Age Bracket | Male | Female |
| Under 5 Years | 0 (0.0%) | 0 (0.0%) |
| 5 to 17 Years | 58 (20.4%) | 28 (16.0%) |
| 18 to 34 Years | 47 (22.0%) | 22 (10.4%) |
| 35 to 64 Years | 77 (18.6%) | 96 (29.0%) |
| 65 to 74 Years | 21 (18.8%) | 20 (23.5%) |
| 75 Years and over | 9 (47.4%) | 37 (58.7%) |
Disability Class by Sex by Age in Cherryvale
Disability Class: Hearing Difficulty
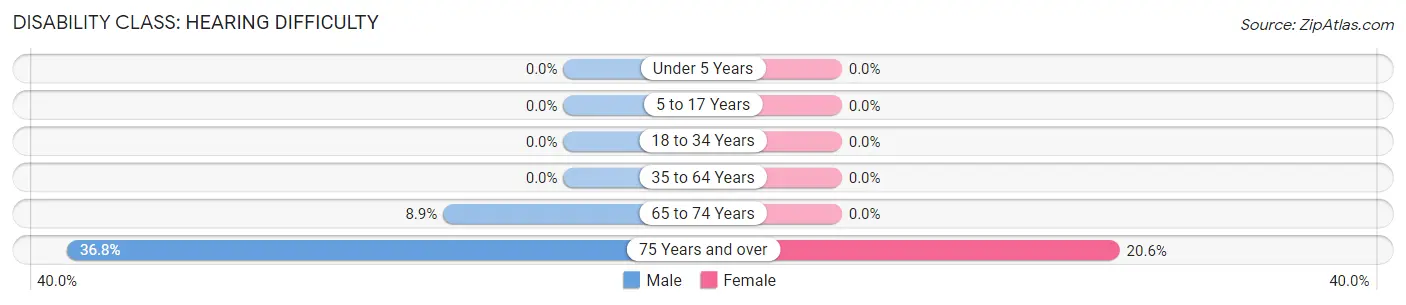
| Age Bracket | Male | Female |
| Under 5 Years | 0 (0.0%) | 0 (0.0%) |
| 5 to 17 Years | 0 (0.0%) | 0 (0.0%) |
| 18 to 34 Years | 0 (0.0%) | 0 (0.0%) |
| 35 to 64 Years | 0 (0.0%) | 0 (0.0%) |
| 65 to 74 Years | 10 (8.9%) | 0 (0.0%) |
| 75 Years and over | 7 (36.8%) | 13 (20.6%) |
Disability Class: Vision Difficulty
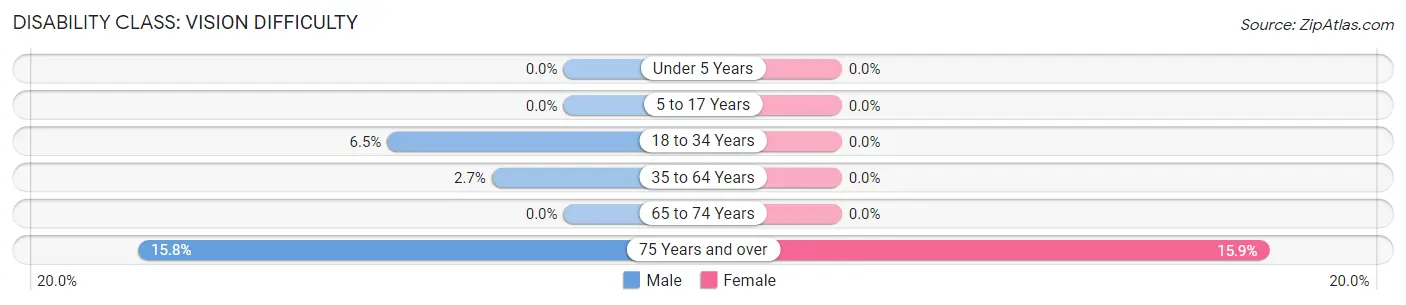
| Age Bracket | Male | Female |
| Under 5 Years | 0 (0.0%) | 0 (0.0%) |
| 5 to 17 Years | 0 (0.0%) | 0 (0.0%) |
| 18 to 34 Years | 14 (6.5%) | 0 (0.0%) |
| 35 to 64 Years | 11 (2.7%) | 0 (0.0%) |
| 65 to 74 Years | 0 (0.0%) | 0 (0.0%) |
| 75 Years and over | 3 (15.8%) | 10 (15.9%) |
Disability Class: Cognitive Difficulty
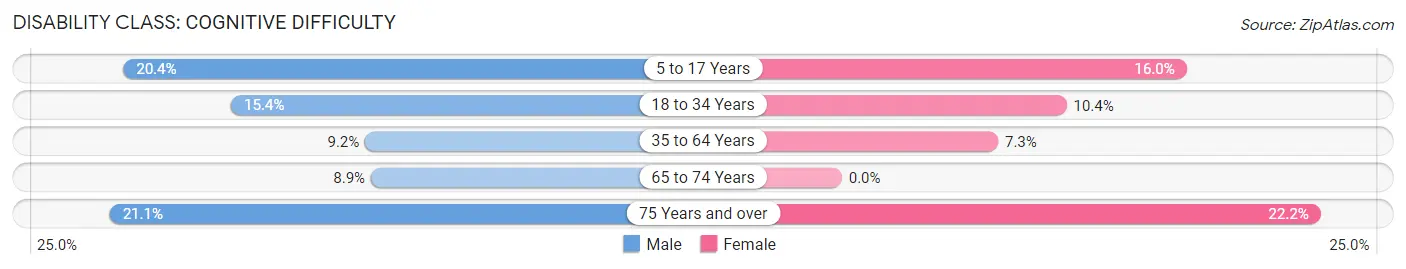
| Age Bracket | Male | Female |
| 5 to 17 Years | 58 (20.4%) | 28 (16.0%) |
| 18 to 34 Years | 33 (15.4%) | 22 (10.4%) |
| 35 to 64 Years | 38 (9.2%) | 24 (7.2%) |
| 65 to 74 Years | 10 (8.9%) | 0 (0.0%) |
| 75 Years and over | 4 (21.0%) | 14 (22.2%) |
Disability Class: Ambulatory Difficulty
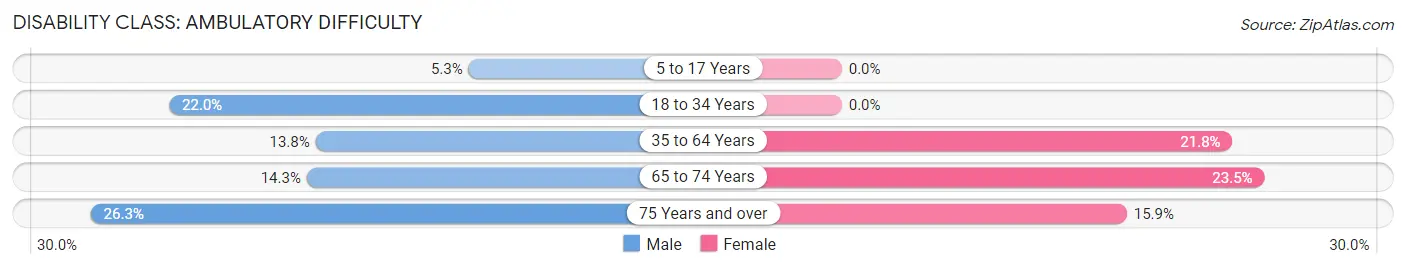
| Age Bracket | Male | Female |
| 5 to 17 Years | 15 (5.3%) | 0 (0.0%) |
| 18 to 34 Years | 47 (22.0%) | 0 (0.0%) |
| 35 to 64 Years | 57 (13.8%) | 72 (21.7%) |
| 65 to 74 Years | 16 (14.3%) | 20 (23.5%) |
| 75 Years and over | 5 (26.3%) | 10 (15.9%) |
Disability Class: Self-Care Difficulty
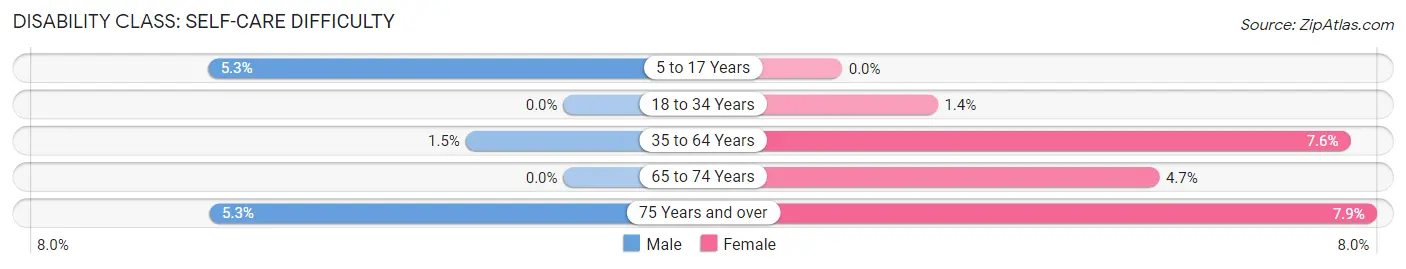
| Age Bracket | Male | Female |
| 5 to 17 Years | 15 (5.3%) | 0 (0.0%) |
| 18 to 34 Years | 0 (0.0%) | 3 (1.4%) |
| 35 to 64 Years | 6 (1.5%) | 25 (7.5%) |
| 65 to 74 Years | 0 (0.0%) | 4 (4.7%) |
| 75 Years and over | 1 (5.3%) | 5 (7.9%) |
Technology Access in Cherryvale
Computing Device Access in Cherryvale
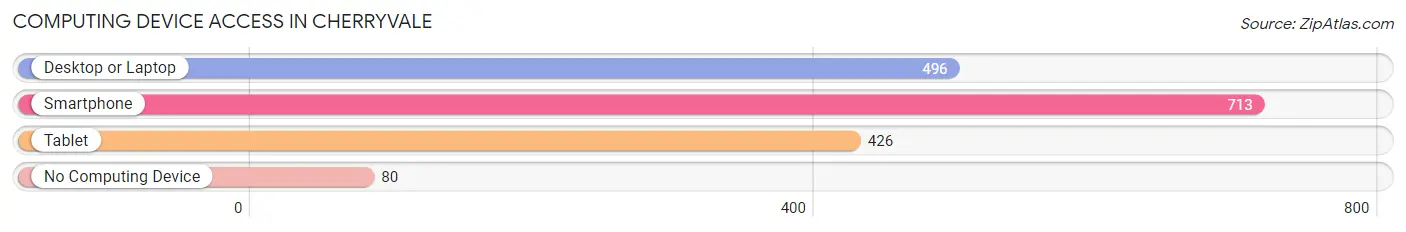
| Device Type | # Households | % Households |
| Desktop or Laptop | 496 | 60.7% |
| Smartphone | 713 | 87.3% |
| Tablet | 426 | 52.1% |
| No Computing Device | 80 | 9.8% |
| Total | 817 | 100.0% |
Internet Access in Cherryvale
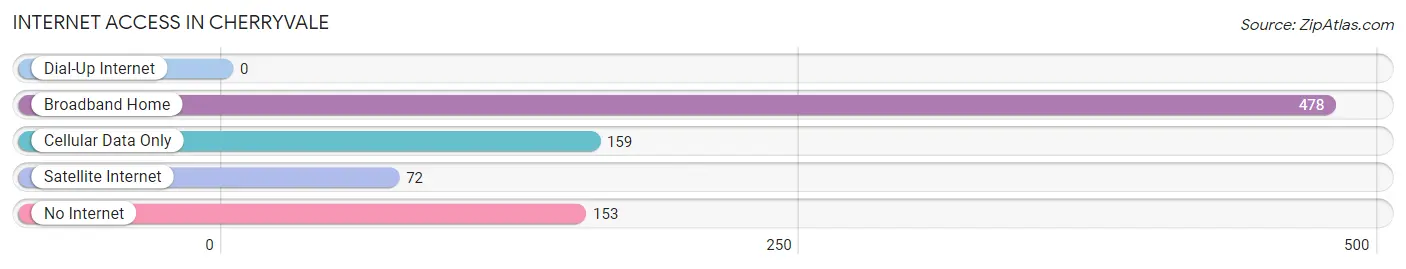
| Internet Type | # Households | % Households |
| Dial-Up Internet | 0 | 0.0% |
| Broadband Home | 478 | 58.5% |
| Cellular Data Only | 159 | 19.5% |
| Satellite Internet | 72 | 8.8% |
| No Internet | 153 | 18.7% |
| Total | 817 | 100.0% |
Cherryvale Summary
Cherryvale is a small city located in Montgomery County, Kansas, United States. It is situated in the southeastern corner of the state, approximately 50 miles south of the state capital, Topeka. The city has a population of approximately 2,500 people and is the county seat of Montgomery County.
History
Cherryvale was founded in 1871 by a group of settlers from Ohio. The city was named after the cherry trees that grew in the area. The first post office was established in 1872 and the city was incorporated in 1873.
The city grew rapidly in the late 19th century, becoming a major center for the coal mining industry. The city was also home to a number of other industries, including a flour mill, a brickyard, and a canning factory.
In the early 20th century, the city experienced a period of decline as the coal industry declined and the Great Depression hit the area. However, the city was able to rebound in the 1950s and 1960s, thanks to the growth of the oil and gas industry.
Geography
Cherryvale is located in southeastern Kansas, approximately 50 miles south of the state capital, Topeka. The city is situated in the Osage Plains region of the state, which is characterized by rolling hills and open prairies. The city is located at the intersection of U.S. Route 169 and Kansas State Highway 99.
The climate in Cherryvale is characterized by hot, humid summers and cold, dry winters. The average annual temperature is around 54°F, with an average high of around 79°F in the summer and an average low of around 29°F in the winter.
Economy
Cherryvale’s economy is largely based on agriculture and oil and gas production. The city is home to a number of agricultural businesses, including grain elevators, feed mills, and livestock operations. The city is also home to a number of oil and gas production companies, as well as a number of related businesses, such as drilling and pipeline companies.
The city is also home to a number of retail businesses, including grocery stores, restaurants, and clothing stores. The city is also home to a number of manufacturing businesses, including a plastics plant and a metal fabrication plant.
Demographics
As of the 2010 census, the population of Cherryvale was 2,521. The racial makeup of the city was 94.3% White, 0.7% African American, 0.3% Native American, 0.2% Asian, 0.1% Pacific Islander, 2.2% from other races, and 2.4% from two or more races. Hispanic or Latino of any race were 4.3% of the population.
The median household income in Cherryvale was $37,917, and the median family income was $45,938. The per capita income for the city was $18,945. About 11.3% of families and 14.2% of the population were below the poverty line, including 19.2% of those under age 18 and 8.2% of those age 65 or over.
Common Questions
What is Per Capita Income in Cherryvale?
Per Capita income in Cherryvale is $23,008.
What is the Median Family Income in Cherryvale?
Median Family Income in Cherryvale is $47,763.
What is the Median Household income in Cherryvale?
Median Household Income in Cherryvale is $45,208.
What is Income or Wage Gap in Cherryvale?
Income or Wage Gap in Cherryvale is 33.3%.
Women in Cherryvale earn 66.7 cents for every dollar earned by a man.
What is Inequality or Gini Index in Cherryvale?
Inequality or Gini Index in Cherryvale is 0.39.
What is the Total Population of Cherryvale?
Total Population of Cherryvale is 2,104.
What is the Total Male Population of Cherryvale?
Total Male Population of Cherryvale is 1,161.
What is the Total Female Population of Cherryvale?
Total Female Population of Cherryvale is 943.
What is the Ratio of Males per 100 Females in Cherryvale?
There are 123.12 Males per 100 Females in Cherryvale.
What is the Ratio of Females per 100 Males in Cherryvale?
There are 81.22 Females per 100 Males in Cherryvale.
What is the Median Population Age in Cherryvale?
Median Population Age in Cherryvale is 36.5 Years.
What is the Average Family Size in Cherryvale
Average Family Size in Cherryvale is 3.3 People.
What is the Average Household Size in Cherryvale
Average Household Size in Cherryvale is 2.5 People.
How Large is the Labor Force in Cherryvale?
There are 961 People in the Labor Forcein in Cherryvale.
What is the Percentage of People in the Labor Force in Cherryvale?
60.7% of People are in the Labor Force in Cherryvale.
What is the Unemployment Rate in Cherryvale?
Unemployment Rate in Cherryvale is 5.2%.