Cherokee, KS Map & Demographics
Cherokee Map
Cherokee Overview
$21,602
PER CAPITA INCOME
$62,727
AVG FAMILY INCOME
$37,250
AVG HOUSEHOLD INCOME
38.4%
WAGE / INCOME GAP [ % ]
61.6¢/ $1
WAGE / INCOME GAP [ $ ]
$3,564
FAMILY INCOME DEFICIT
0.39
INEQUALITY / GINI INDEX
703
TOTAL POPULATION
369
MALE POPULATION
334
FEMALE POPULATION
110.48
MALES / 100 FEMALES
90.51
FEMALES / 100 MALES
38.3
MEDIAN AGE
3.6
AVG FAMILY SIZE
2.6
AVG HOUSEHOLD SIZE
346
LABOR FORCE [ PEOPLE ]
61.7%
PERCENT IN LABOR FORCE
7.8%
UNEMPLOYMENT RATE
Cherokee Zip Codes
Cherokee Area Codes
Income in Cherokee
Income Overview in Cherokee
Per Capita Income in Cherokee is $21,602, while median incomes of families and households are $62,727 and $37,250 respectively.
| Characteristic | Number | Measure |
| Per Capita Income | 703 | $21,602 |
| Median Family Income | 150 | $62,727 |
| Mean Family Income | 150 | $65,860 |
| Median Household Income | 270 | $37,250 |
| Mean Household Income | 270 | $53,271 |
| Income Deficit | 150 | $3,564 |
| Wage / Income Gap (%) | 703 | 38.41% |
| Wage / Income Gap ($) | 703 | 61.59¢ per $1 |
| Gini / Inequality Index | 703 | 0.39 |
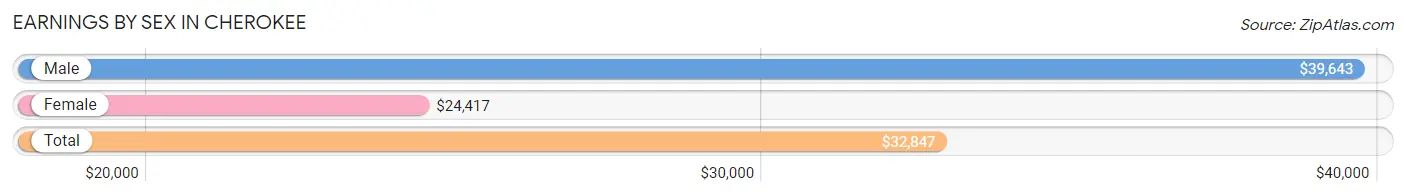
Earnings by Sex in Cherokee
Average Earnings in Cherokee are $32,847, $39,643 for men and $24,417 for women, a difference of 38.4%.
| Sex | Number | Average Earnings |
| Male | 194 (56.6%) | $39,643 |
| Female | 149 (43.4%) | $24,417 |
| Total | 343 (100.0%) | $32,847 |
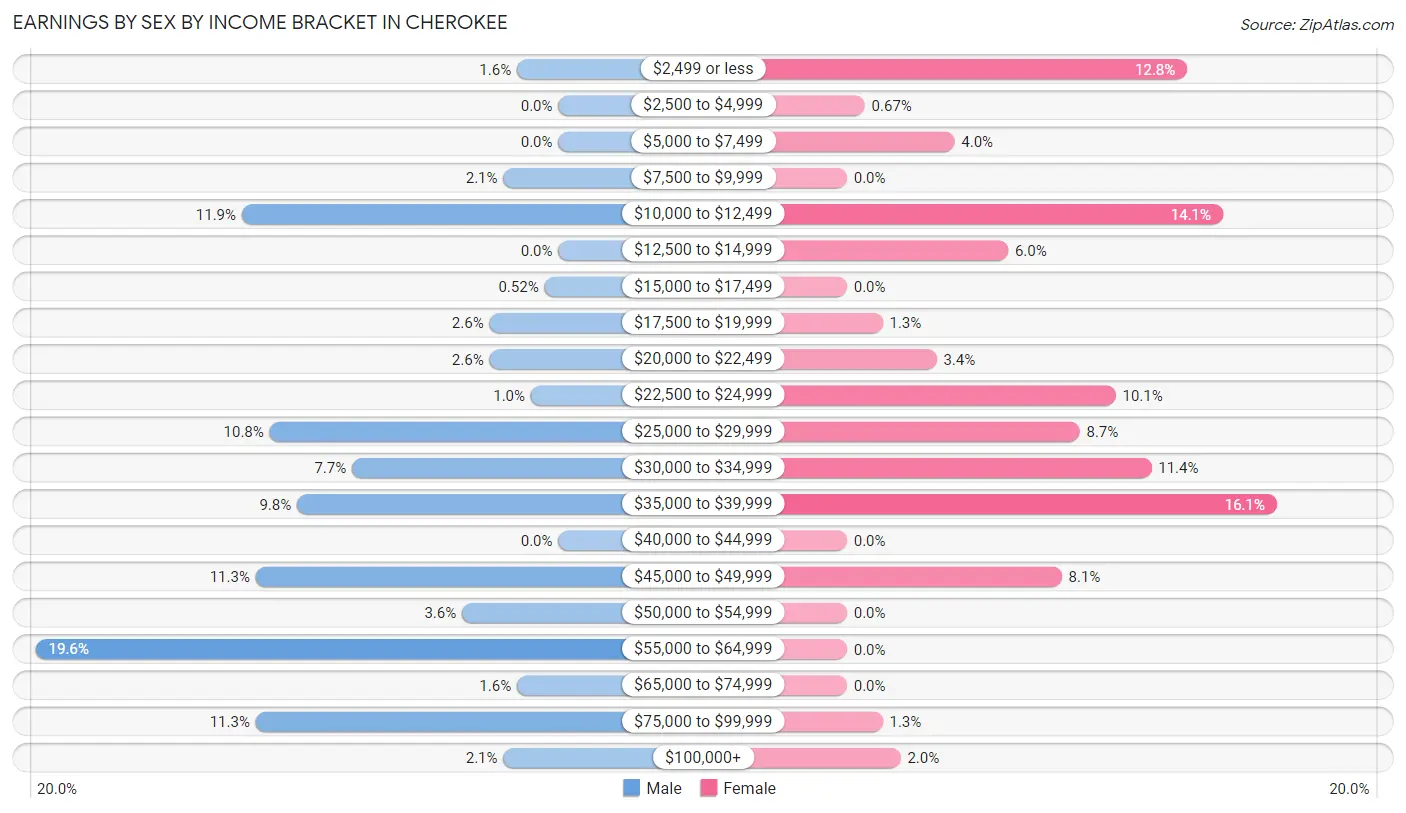
Earnings by Sex by Income Bracket in Cherokee
The most common earnings brackets in Cherokee are $55,000 to $64,999 for men (38 | 19.6%) and $35,000 to $39,999 for women (24 | 16.1%).
| Income | Male | Female |
| $2,499 or less | 3 (1.5%) | 19 (12.8%) |
| $2,500 to $4,999 | 0 (0.0%) | 1 (0.7%) |
| $5,000 to $7,499 | 0 (0.0%) | 6 (4.0%) |
| $7,500 to $9,999 | 4 (2.1%) | 0 (0.0%) |
| $10,000 to $12,499 | 23 (11.9%) | 21 (14.1%) |
| $12,500 to $14,999 | 0 (0.0%) | 9 (6.0%) |
| $15,000 to $17,499 | 1 (0.5%) | 0 (0.0%) |
| $17,500 to $19,999 | 5 (2.6%) | 2 (1.3%) |
| $20,000 to $22,499 | 5 (2.6%) | 5 (3.4%) |
| $22,500 to $24,999 | 2 (1.0%) | 15 (10.1%) |
| $25,000 to $29,999 | 21 (10.8%) | 13 (8.7%) |
| $30,000 to $34,999 | 15 (7.7%) | 17 (11.4%) |
| $35,000 to $39,999 | 19 (9.8%) | 24 (16.1%) |
| $40,000 to $44,999 | 0 (0.0%) | 0 (0.0%) |
| $45,000 to $49,999 | 22 (11.3%) | 12 (8.1%) |
| $50,000 to $54,999 | 7 (3.6%) | 0 (0.0%) |
| $55,000 to $64,999 | 38 (19.6%) | 0 (0.0%) |
| $65,000 to $74,999 | 3 (1.5%) | 0 (0.0%) |
| $75,000 to $99,999 | 22 (11.3%) | 2 (1.3%) |
| $100,000+ | 4 (2.1%) | 3 (2.0%) |
| Total | 194 (100.0%) | 149 (100.0%) |
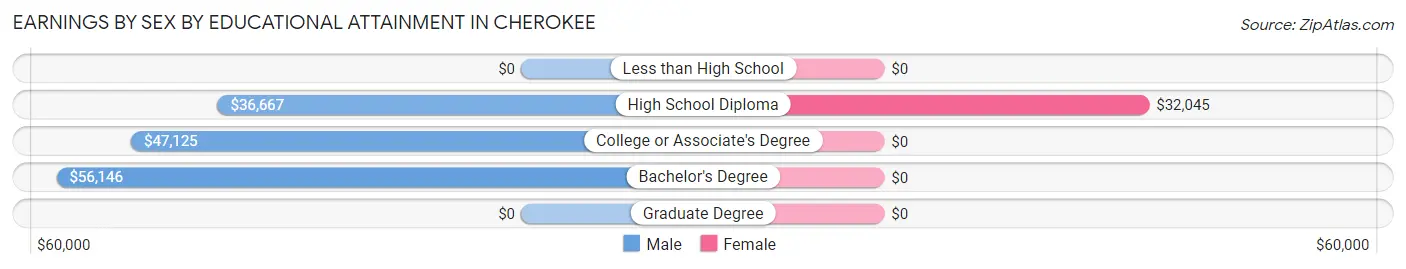
Earnings by Sex by Educational Attainment in Cherokee
Average earnings in Cherokee are $47,500 for men and $28,636 for women, a difference of 39.7%. Men with an educational attainment of bachelor's degree enjoy the highest average annual earnings of $56,146, while those with high school diploma education earn the least with $36,667. Women with an educational attainment of high school diploma earn the most with the average annual earnings of $32,045, while those with high school diploma education have the smallest earnings of $32,045.
| Educational Attainment | Male Income | Female Income |
| Less than High School | - | - |
| High School Diploma | $36,667 | $32,045 |
| College or Associate's Degree | $47,125 | $0 |
| Bachelor's Degree | $56,146 | $0 |
| Graduate Degree | - | - |
| Total | $47,500 | $28,636 |
Family Income in Cherokee
Family Income Brackets in Cherokee
According to the Cherokee family income data, there are 44 families falling into the $35,000 to $49,999 income range, which is the most common income bracket and makes up 29.3% of all families.
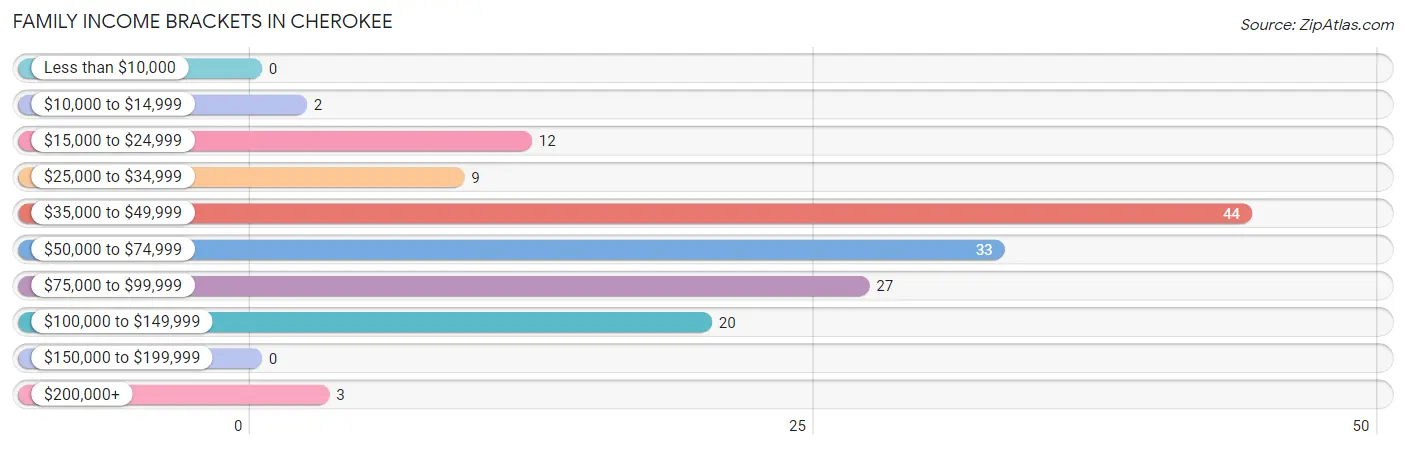
| Income Bracket | # Families | % Families |
| Less than $10,000 | 0 | 0.0% |
| $10,000 to $14,999 | 2 | 1.3% |
| $15,000 to $24,999 | 12 | 8.0% |
| $25,000 to $34,999 | 9 | 6.0% |
| $35,000 to $49,999 | 44 | 29.3% |
| $50,000 to $74,999 | 33 | 22.0% |
| $75,000 to $99,999 | 27 | 18.0% |
| $100,000 to $149,999 | 20 | 13.3% |
| $150,000 to $199,999 | 0 | 0.0% |
| $200,000+ | 3 | 2.0% |
Family Income by Famaliy Size in Cherokee
4-person families (22 | 14.7%) account for the highest median family income in Cherokee with $70,313 per family, while 2-person families (42 | 28.0%) have the highest median income of $29,500 per family member.
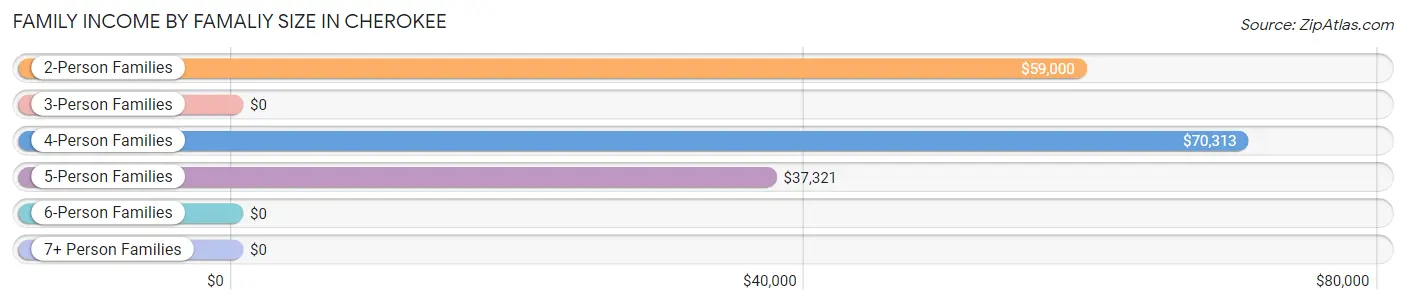
| Income Bracket | # Families | Median Income |
| 2-Person Families | 42 (28.0%) | $59,000 |
| 3-Person Families | 53 (35.3%) | $0 |
| 4-Person Families | 22 (14.7%) | $70,313 |
| 5-Person Families | 26 (17.3%) | $37,321 |
| 6-Person Families | 0 (0.0%) | $0 |
| 7+ Person Families | 7 (4.7%) | $0 |
| Total | 150 (100.0%) | $62,727 |
Family Income by Number of Earners in Cherokee
The median family income in Cherokee is $62,727, with families comprising 3+ earners (13) having the highest median family income of $72,031, while families with no earners (14) have the lowest median family income of $31,000, accounting for 8.7% and 9.3% of families, respectively.
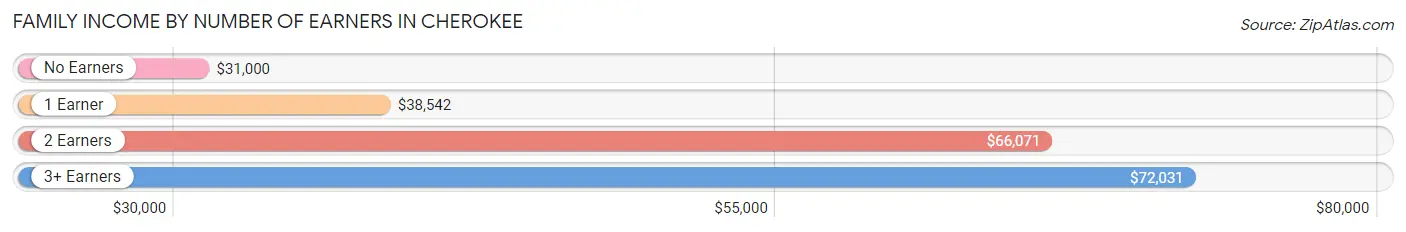
| Number of Earners | # Families | Median Income |
| No Earners | 14 (9.3%) | $31,000 |
| 1 Earner | 51 (34.0%) | $38,542 |
| 2 Earners | 72 (48.0%) | $66,071 |
| 3+ Earners | 13 (8.7%) | $72,031 |
| Total | 150 (100.0%) | $62,727 |
Household Income in Cherokee
Household Income Brackets in Cherokee
With 55 households falling in the category, the $25,000 to $34,999 income range is the most frequent in Cherokee, accounting for 20.4% of all households.
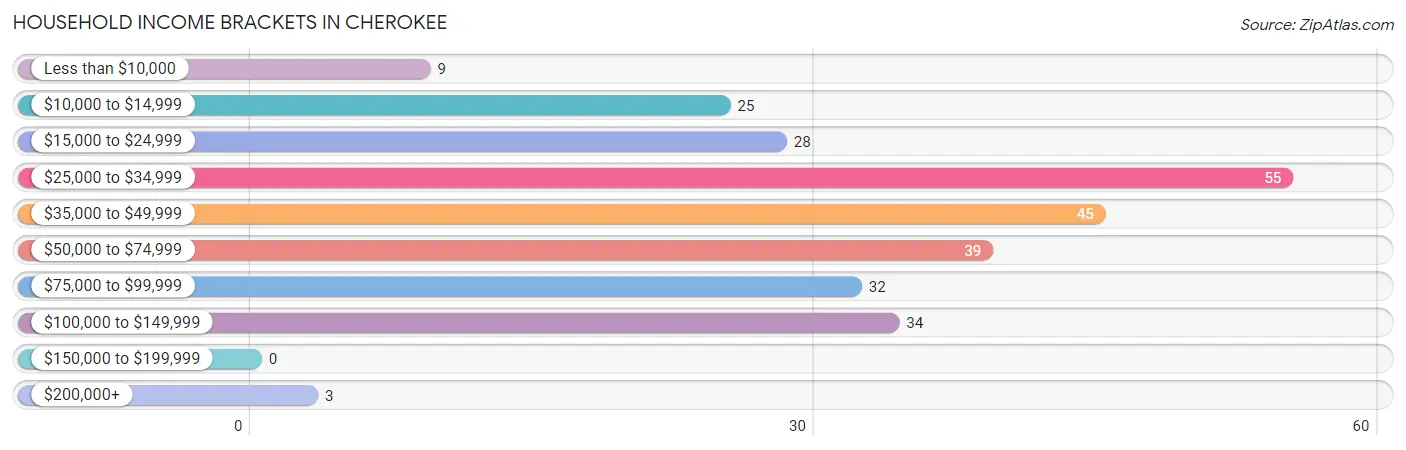
| Income Bracket | # Households | % Households |
| Less than $10,000 | 9 | 3.3% |
| $10,000 to $14,999 | 25 | 9.3% |
| $15,000 to $24,999 | 28 | 10.4% |
| $25,000 to $34,999 | 55 | 20.4% |
| $35,000 to $49,999 | 45 | 16.7% |
| $50,000 to $74,999 | 39 | 14.4% |
| $75,000 to $99,999 | 32 | 11.9% |
| $100,000 to $149,999 | 34 | 12.6% |
| $150,000 to $199,999 | 0 | 0.0% |
| $200,000+ | 3 | 1.1% |
Household Income by Householder Age in Cherokee
The median household income in Cherokee is $37,250, with the highest median household income of $66,250 found in the 25 to 44 years age bracket for the primary householder. A total of 89 households (33.0%) fall into this category. Meanwhile, the 65+ years age bracket for the primary householder has the lowest median household income of $22,750, with 75 households (27.8%) in this group.
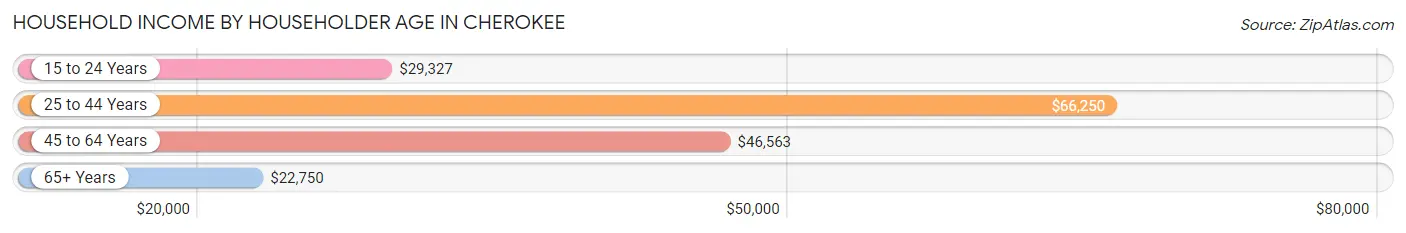
| Income Bracket | # Households | Median Income |
| 15 to 24 Years | 19 (7.0%) | $29,327 |
| 25 to 44 Years | 89 (33.0%) | $66,250 |
| 45 to 64 Years | 87 (32.2%) | $46,563 |
| 65+ Years | 75 (27.8%) | $22,750 |
| Total | 270 (100.0%) | $37,250 |
Poverty in Cherokee
Income Below Poverty by Sex and Age in Cherokee
With 12.5% poverty level for males and 9.3% for females among the residents of Cherokee, 75 year old and over males and 75 year old and over females are the most vulnerable to poverty, with 8 males (53.3%) and 12 females (25.5%) in their respective age groups living below the poverty level.
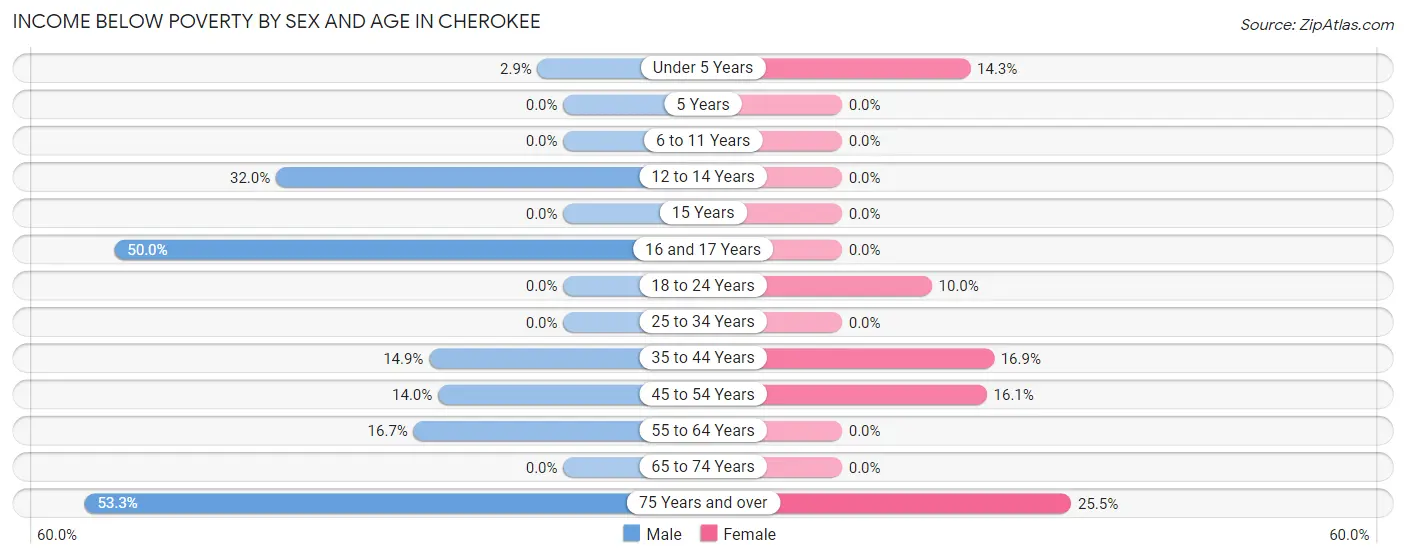
| Age Bracket | Male | Female |
| Under 5 Years | 1 (2.9%) | 1 (14.3%) |
| 5 Years | 0 (0.0%) | 0 (0.0%) |
| 6 to 11 Years | 0 (0.0%) | 0 (0.0%) |
| 12 to 14 Years | 8 (32.0%) | 0 (0.0%) |
| 15 Years | 0 (0.0%) | 0 (0.0%) |
| 16 and 17 Years | 6 (50.0%) | 0 (0.0%) |
| 18 to 24 Years | 0 (0.0%) | 2 (10.0%) |
| 25 to 34 Years | 0 (0.0%) | 0 (0.0%) |
| 35 to 44 Years | 13 (14.9%) | 11 (16.9%) |
| 45 to 54 Years | 6 (14.0%) | 5 (16.1%) |
| 55 to 64 Years | 4 (16.7%) | 0 (0.0%) |
| 65 to 74 Years | 0 (0.0%) | 0 (0.0%) |
| 75 Years and over | 8 (53.3%) | 12 (25.5%) |
| Total | 46 (12.5%) | 31 (9.3%) |
Income Above Poverty by Sex and Age in Cherokee
According to the poverty statistics in Cherokee, males aged 6 to 11 years and females aged 6 to 11 years are the age groups that are most secure financially, with 100.0% of males and 100.0% of females in these age groups living above the poverty line.
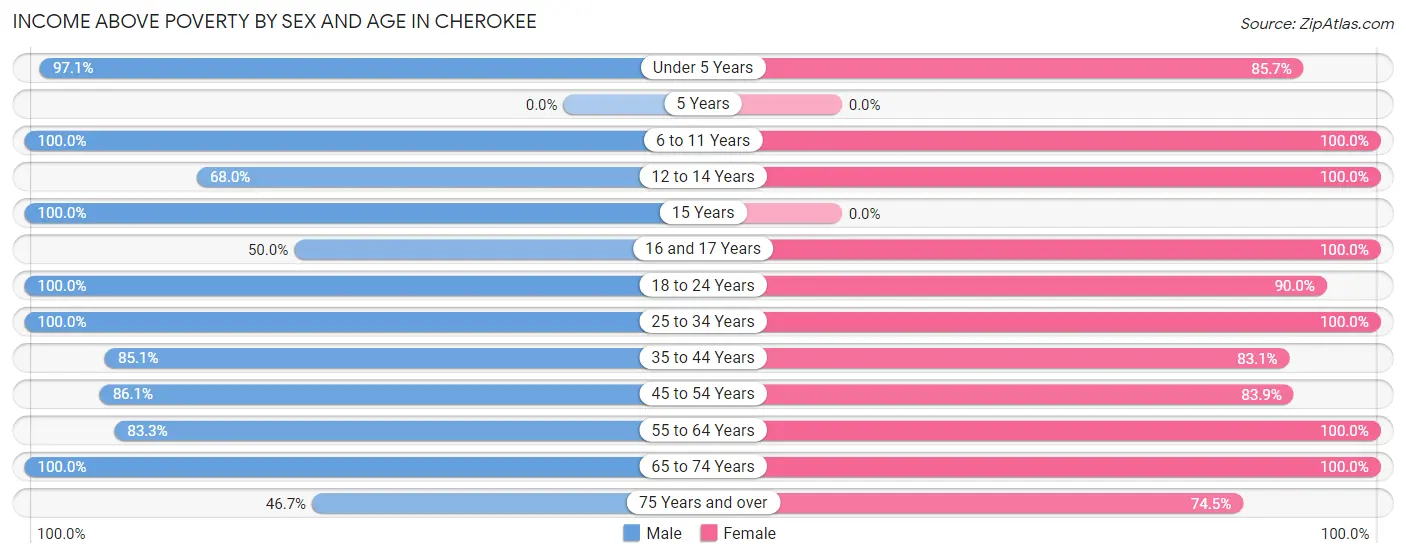
| Age Bracket | Male | Female |
| Under 5 Years | 34 (97.1%) | 6 (85.7%) |
| 5 Years | 0 (0.0%) | 0 (0.0%) |
| 6 to 11 Years | 35 (100.0%) | 9 (100.0%) |
| 12 to 14 Years | 17 (68.0%) | 18 (100.0%) |
| 15 Years | 12 (100.0%) | 0 (0.0%) |
| 16 and 17 Years | 6 (50.0%) | 36 (100.0%) |
| 18 to 24 Years | 44 (100.0%) | 18 (90.0%) |
| 25 to 34 Years | 17 (100.0%) | 40 (100.0%) |
| 35 to 44 Years | 74 (85.1%) | 54 (83.1%) |
| 45 to 54 Years | 37 (86.1%) | 26 (83.9%) |
| 55 to 64 Years | 20 (83.3%) | 38 (100.0%) |
| 65 to 74 Years | 19 (100.0%) | 23 (100.0%) |
| 75 Years and over | 7 (46.7%) | 35 (74.5%) |
| Total | 322 (87.5%) | 303 (90.7%) |
Income Below Poverty Among Married-Couple Families in Cherokee
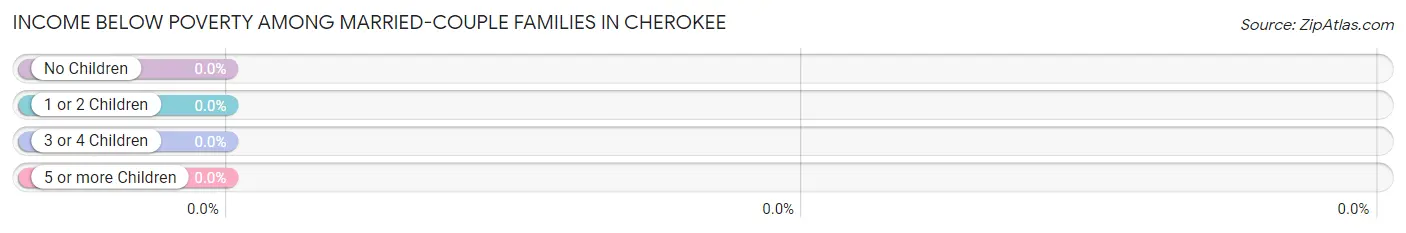
| Children | Above Poverty | Below Poverty |
| No Children | 56 (100.0%) | 0 (0.0%) |
| 1 or 2 Children | 26 (100.0%) | 0 (0.0%) |
| 3 or 4 Children | 25 (100.0%) | 0 (0.0%) |
| 5 or more Children | 7 (100.0%) | 0 (0.0%) |
| Total | 114 (100.0%) | 0 (0.0%) |
Income Below Poverty Among Single-Parent Households in Cherokee
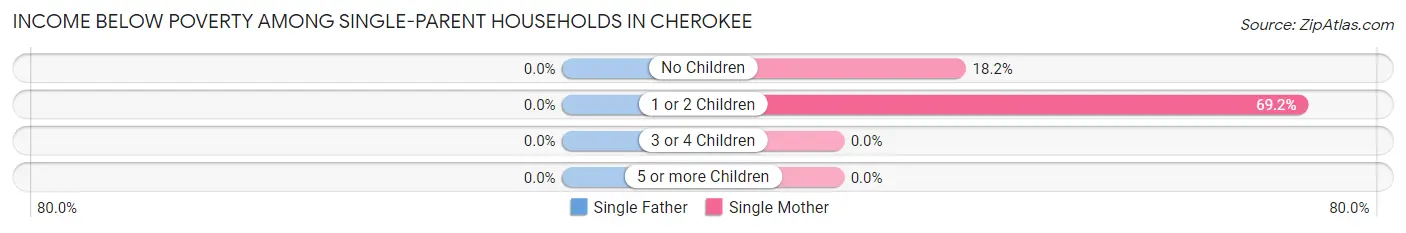
| Children | Single Father | Single Mother |
| No Children | 0 (0.0%) | 2 (18.2%) |
| 1 or 2 Children | 0 (0.0%) | 9 (69.2%) |
| 3 or 4 Children | 0 (0.0%) | 0 (0.0%) |
| 5 or more Children | 0 (0.0%) | 0 (0.0%) |
| Total | 0 (0.0%) | 11 (45.8%) |
Income Below Poverty Among Married-Couple vs Single-Parent Households in Cherokee
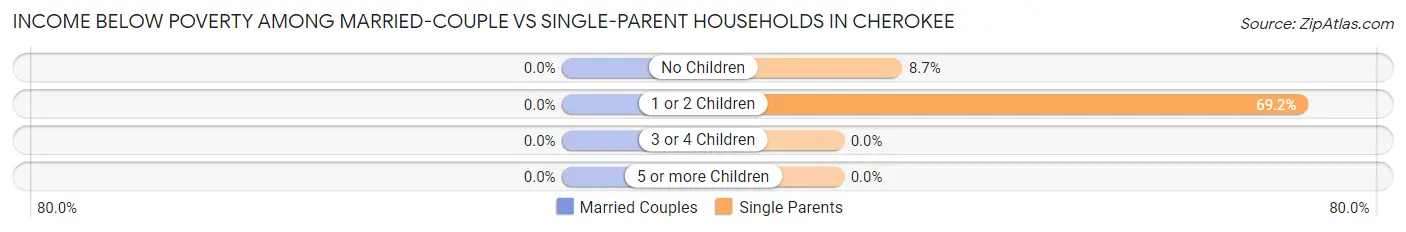
| Children | Married-Couple Families | Single-Parent Households |
| No Children | 0 (0.0%) | 2 (8.7%) |
| 1 or 2 Children | 0 (0.0%) | 9 (69.2%) |
| 3 or 4 Children | 0 (0.0%) | 0 (0.0%) |
| 5 or more Children | 0 (0.0%) | 0 (0.0%) |
| Total | 0 (0.0%) | 11 (30.6%) |
Race in Cherokee
The most populous races in Cherokee are White / Caucasian (652 | 92.7%), Two or more Races (51 | 7.2%), and Hispanic or Latino (4 | 0.6%).
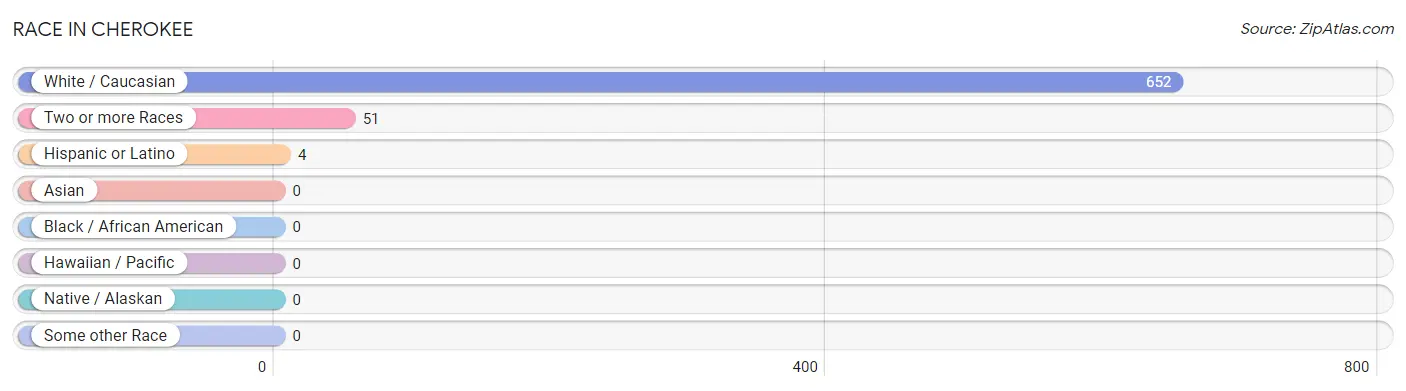
| Race | # Population | % Population |
| Asian | 0 | 0.0% |
| Black / African American | 0 | 0.0% |
| Hawaiian / Pacific | 0 | 0.0% |
| Hispanic or Latino | 4 | 0.6% |
| Native / Alaskan | 0 | 0.0% |
| White / Caucasian | 652 | 92.7% |
| Two or more Races | 51 | 7.2% |
| Some other Race | 0 | 0.0% |
| Total | 703 | 100.0% |
Ancestry in Cherokee
The most populous ancestries reported in Cherokee are American (175 | 24.9%), German (142 | 20.2%), Italian (99 | 14.1%), Irish (65 | 9.2%), and English (56 | 8.0%), together accounting for 76.4% of all Cherokee residents.
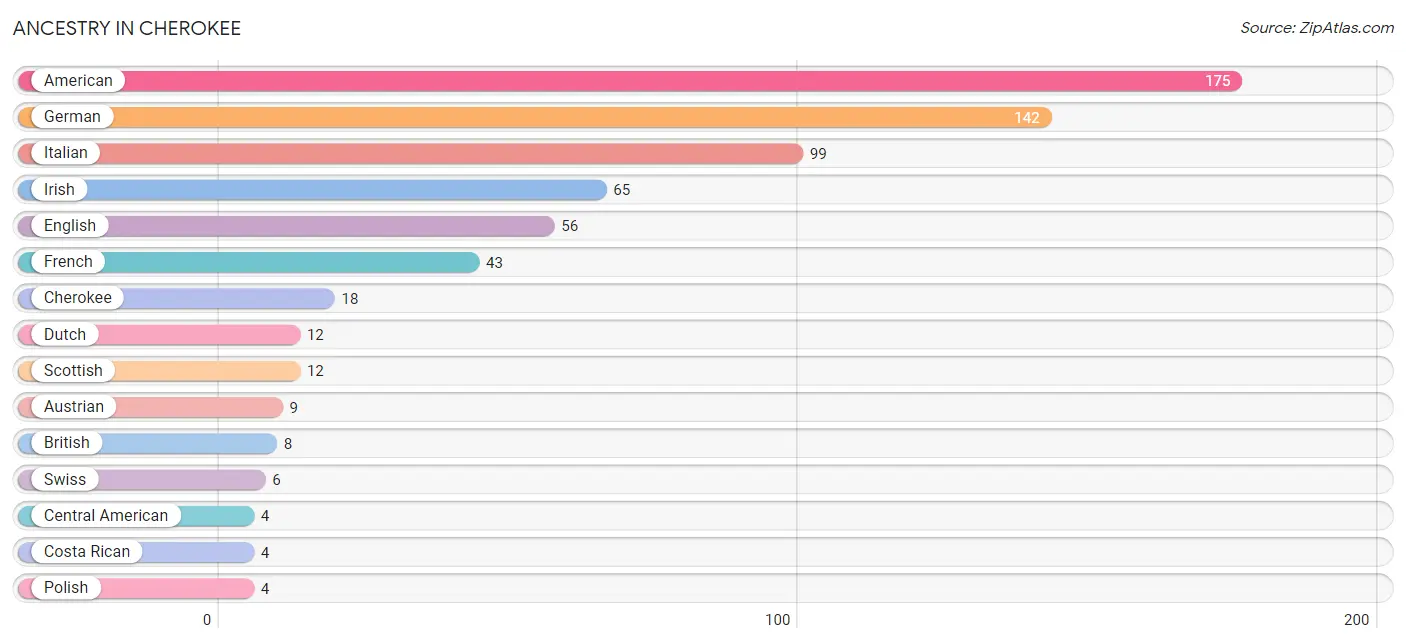
| Ancestry | # Population | % Population |
| American | 175 | 24.9% |
| Arab | 1 | 0.1% |
| Austrian | 9 | 1.3% |
| Blackfeet | 2 | 0.3% |
| British | 8 | 1.1% |
| Central American | 4 | 0.6% |
| Cherokee | 18 | 2.6% |
| Costa Rican | 4 | 0.6% |
| Dutch | 12 | 1.7% |
| English | 56 | 8.0% |
| French | 43 | 6.1% |
| German | 142 | 20.2% |
| Irish | 65 | 9.2% |
| Italian | 99 | 14.1% |
| Northern European | 2 | 0.3% |
| Polish | 4 | 0.6% |
| Scandinavian | 2 | 0.3% |
| Scotch-Irish | 2 | 0.3% |
| Scottish | 12 | 1.7% |
| Sioux | 1 | 0.1% |
| Swedish | 2 | 0.3% |
| Swiss | 6 | 0.9% |
| Syrian | 1 | 0.1% |
| Welsh | 3 | 0.4% | View All 24 Rows |
Immigrants in Cherokee

| Immigration Origin | # Population | % Population | View All 0 Rows |
Sex and Age in Cherokee
Sex and Age in Cherokee
The most populous age groups in Cherokee are 35 to 39 Years (54 | 14.6%) for men and 40 to 44 Years (47 | 14.1%) for women.
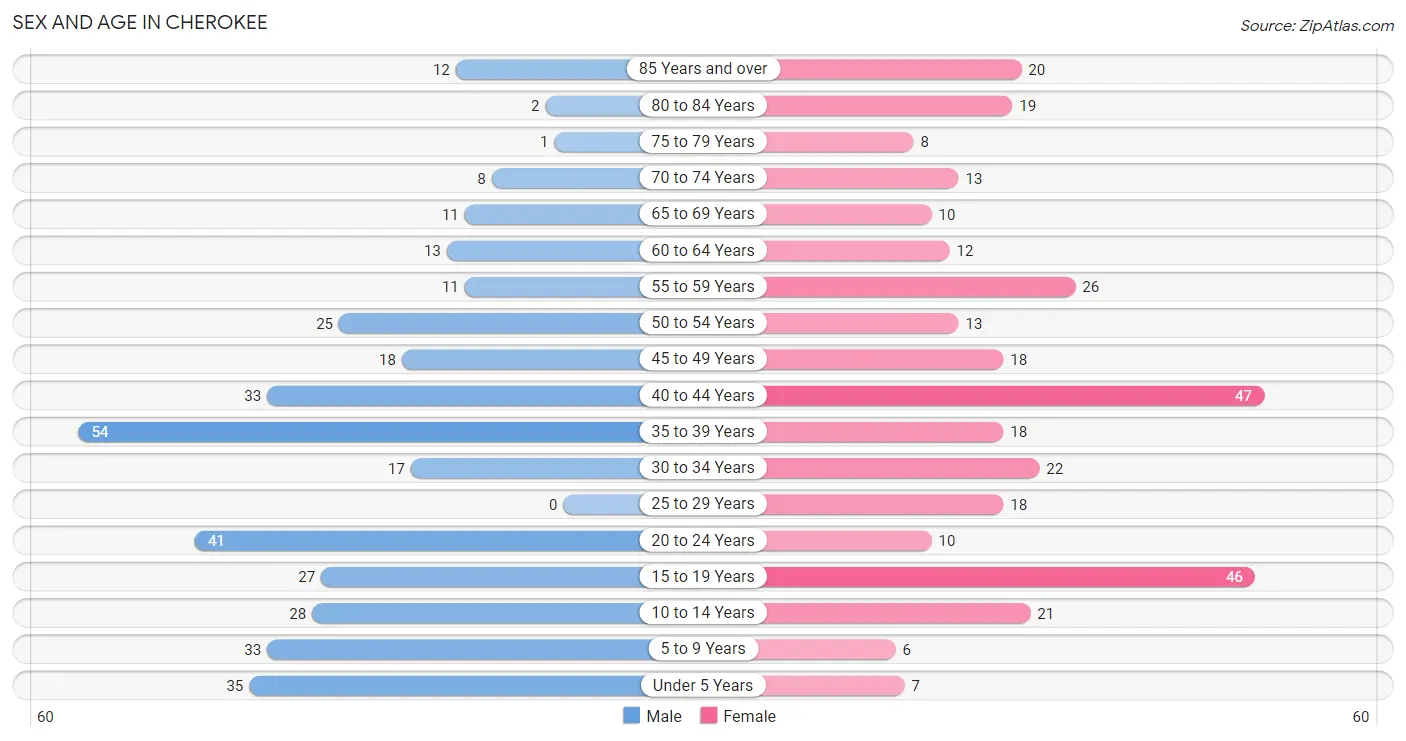
| Age Bracket | Male | Female |
| Under 5 Years | 35 (9.5%) | 7 (2.1%) |
| 5 to 9 Years | 33 (8.9%) | 6 (1.8%) |
| 10 to 14 Years | 28 (7.6%) | 21 (6.3%) |
| 15 to 19 Years | 27 (7.3%) | 46 (13.8%) |
| 20 to 24 Years | 41 (11.1%) | 10 (3.0%) |
| 25 to 29 Years | 0 (0.0%) | 18 (5.4%) |
| 30 to 34 Years | 17 (4.6%) | 22 (6.6%) |
| 35 to 39 Years | 54 (14.6%) | 18 (5.4%) |
| 40 to 44 Years | 33 (8.9%) | 47 (14.1%) |
| 45 to 49 Years | 18 (4.9%) | 18 (5.4%) |
| 50 to 54 Years | 25 (6.8%) | 13 (3.9%) |
| 55 to 59 Years | 11 (3.0%) | 26 (7.8%) |
| 60 to 64 Years | 13 (3.5%) | 12 (3.6%) |
| 65 to 69 Years | 11 (3.0%) | 10 (3.0%) |
| 70 to 74 Years | 8 (2.2%) | 13 (3.9%) |
| 75 to 79 Years | 1 (0.3%) | 8 (2.4%) |
| 80 to 84 Years | 2 (0.5%) | 19 (5.7%) |
| 85 Years and over | 12 (3.3%) | 20 (6.0%) |
| Total | 369 (100.0%) | 334 (100.0%) |
Families and Households in Cherokee
Median Family Size in Cherokee
The median family size in Cherokee is 3.63 persons per family, with married-couple families (114 | 76.0%) accounting for the largest median family size of 3.89 persons per family. On the other hand, single male/father families (12 | 8.0%) represent the smallest median family size with 2.83 persons per family.
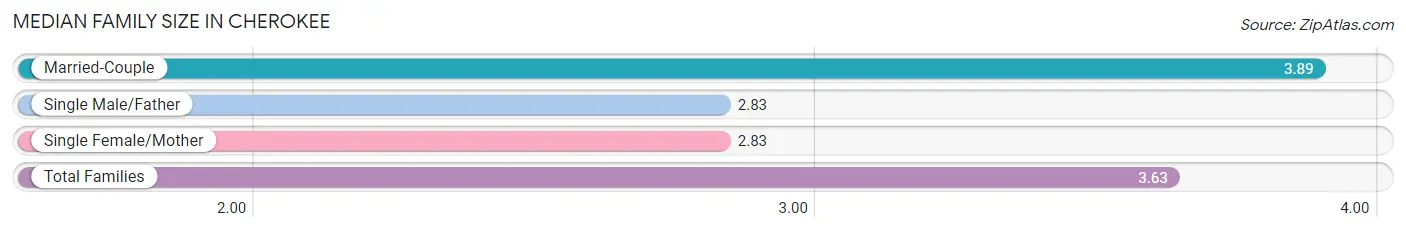
| Family Type | # Families | Family Size |
| Married-Couple | 114 (76.0%) | 3.89 |
| Single Male/Father | 12 (8.0%) | 2.83 |
| Single Female/Mother | 24 (16.0%) | 2.83 |
| Total Families | 150 (100.0%) | 3.63 |
Median Household Size in Cherokee
The median household size in Cherokee is 2.60 persons per household, with married-couple households (114 | 42.2%) accounting for the largest median household size of 3.89 persons per household. non-family households (120 | 44.4%) represent the smallest median household size with 1.22 persons per household.
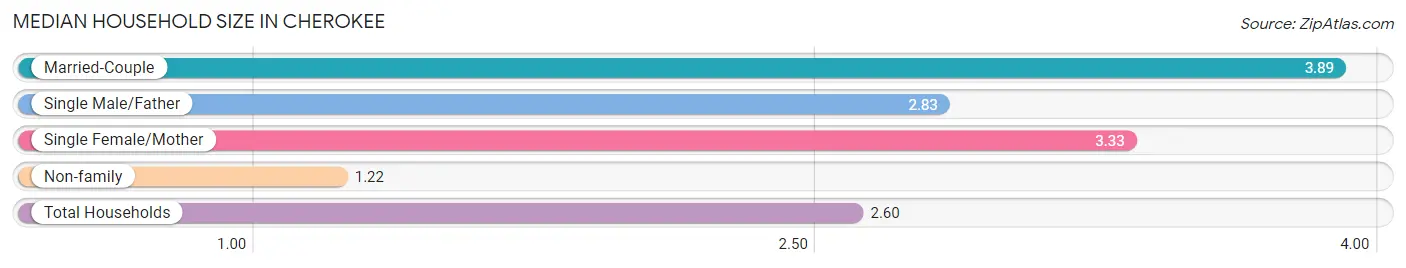
| Household Type | # Households | Household Size |
| Married-Couple | 114 (42.2%) | 3.89 |
| Single Male/Father | 12 (4.4%) | 2.83 |
| Single Female/Mother | 24 (8.9%) | 3.33 |
| Non-family | 120 (44.4%) | 1.22 |
| Total Households | 270 (100.0%) | 2.60 |
Household Size by Marriage Status in Cherokee
Out of a total of 270 households in Cherokee, 150 (55.6%) are family households, while 120 (44.4%) are nonfamily households. The most numerous type of family households are 3-person households, comprising 44, and the most common type of nonfamily households are 1-person households, comprising 99.
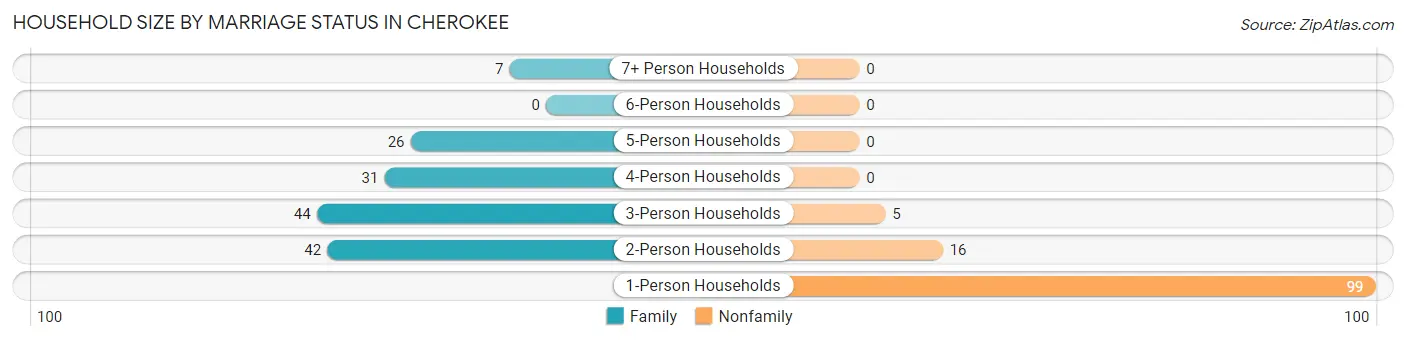
| Household Size | Family Households | Nonfamily Households |
| 1-Person Households | - | 99 (36.7%) |
| 2-Person Households | 42 (15.6%) | 16 (5.9%) |
| 3-Person Households | 44 (16.3%) | 5 (1.8%) |
| 4-Person Households | 31 (11.5%) | 0 (0.0%) |
| 5-Person Households | 26 (9.6%) | 0 (0.0%) |
| 6-Person Households | 0 (0.0%) | 0 (0.0%) |
| 7+ Person Households | 7 (2.6%) | 0 (0.0%) |
| Total | 150 (55.6%) | 120 (44.4%) |
Female Fertility in Cherokee
Fertility by Age in Cherokee
Average fertility rate in Cherokee is 101.0 births per 1,000 women. Women in the age bracket of 20 to 34 years have the highest fertility rate with 220.0 births per 1,000 women. Women in the age bracket of 20 to 34 years acount for 61.1% of all women with births.
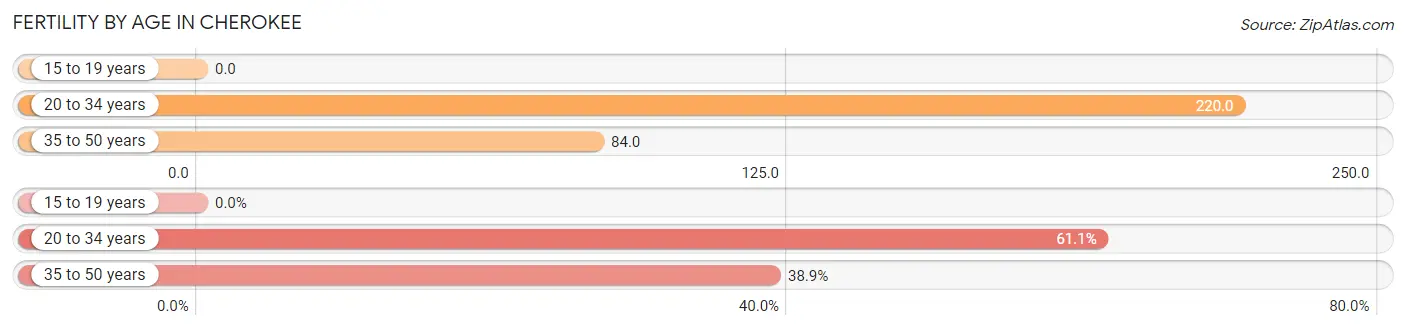
| Age Bracket | Women with Births | Births / 1,000 Women |
| 15 to 19 years | 0 (0.0%) | 0.0 |
| 20 to 34 years | 11 (61.1%) | 220.0 |
| 35 to 50 years | 7 (38.9%) | 84.0 |
| Total | 18 (100.0%) | 101.0 |
Fertility by Age by Marriage Status in Cherokee
88.9% of women with births (18) in Cherokee are married. The highest percentage of unmarried women with births falls into 20 to 34 years age bracket with 18.2% of them unmarried at the time of birth, while the lowest percentage of unmarried women with births belong to 35 to 50 years age bracket with 0.0% of them unmarried.
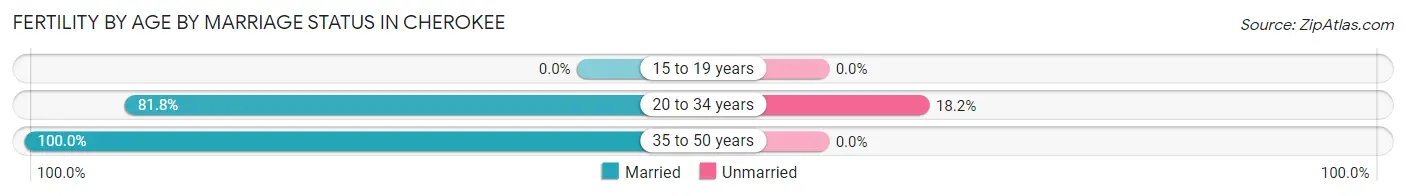
| Age Bracket | Married | Unmarried |
| 15 to 19 years | 0 (0.0%) | 0 (0.0%) |
| 20 to 34 years | 9 (81.8%) | 2 (18.2%) |
| 35 to 50 years | 7 (100.0%) | 0 (0.0%) |
| Total | 16 (88.9%) | 2 (11.1%) |
Fertility by Education in Cherokee
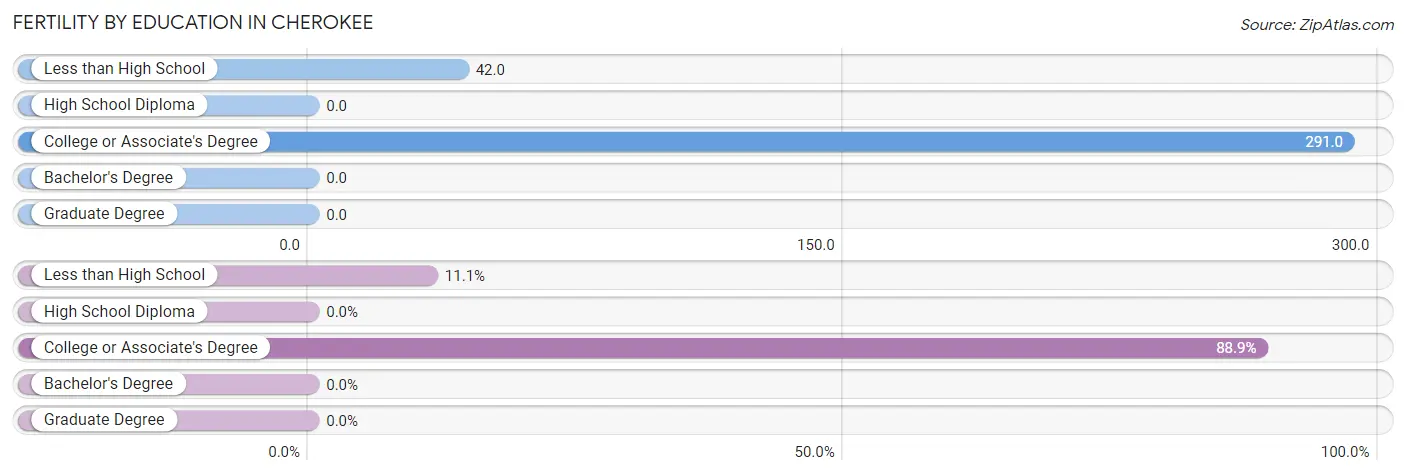
| Educational Attainment | Women with Births | Births / 1,000 Women |
| Less than High School | 2 (11.1%) | 42.0 |
| High School Diploma | 0 (0.0%) | 0.0 |
| College or Associate's Degree | 16 (88.9%) | 291.0 |
| Bachelor's Degree | 0 (0.0%) | 0.0 |
| Graduate Degree | 0 (0.0%) | 0.0 |
| Total | 18 (100.0%) | 101.0 |
Fertility by Education by Marriage Status in Cherokee
11.1% of women with births in Cherokee are unmarried. Women with the educational attainment of college or associate's degree are most likely to be married with 100.0% of them married at childbirth, while women with the educational attainment of less than high school are least likely to be married with 100.0% of them unmarried at childbirth.
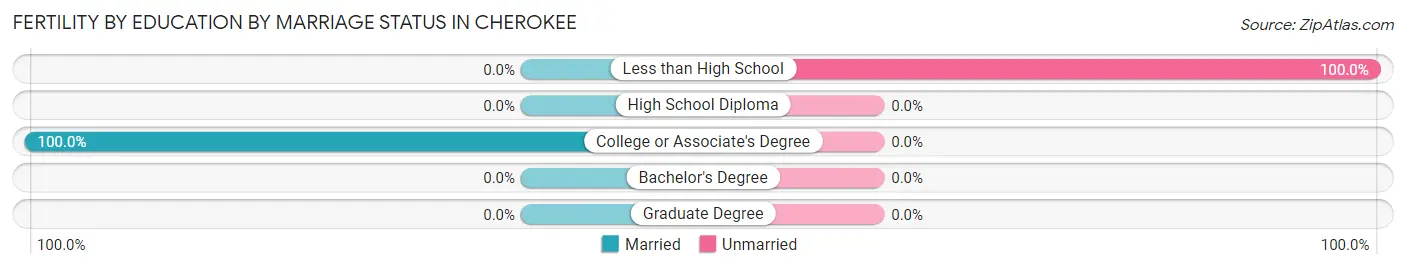
| Educational Attainment | Married | Unmarried |
| Less than High School | 0 (0.0%) | 2 (100.0%) |
| High School Diploma | 0 (0.0%) | 0 (0.0%) |
| College or Associate's Degree | 16 (100.0%) | 0 (0.0%) |
| Bachelor's Degree | 0 (0.0%) | 0 (0.0%) |
| Graduate Degree | 0 (0.0%) | 0 (0.0%) |
| Total | 16 (88.9%) | 2 (11.1%) |
Employment Characteristics in Cherokee
Employment by Class of Employer in Cherokee
Among the 318 employed individuals in Cherokee, private company employees (202 | 63.5%), self-employed (not incorporated) (27 | 8.5%), and not-for-profit organizations (27 | 8.5%) make up the most common classes of employment.
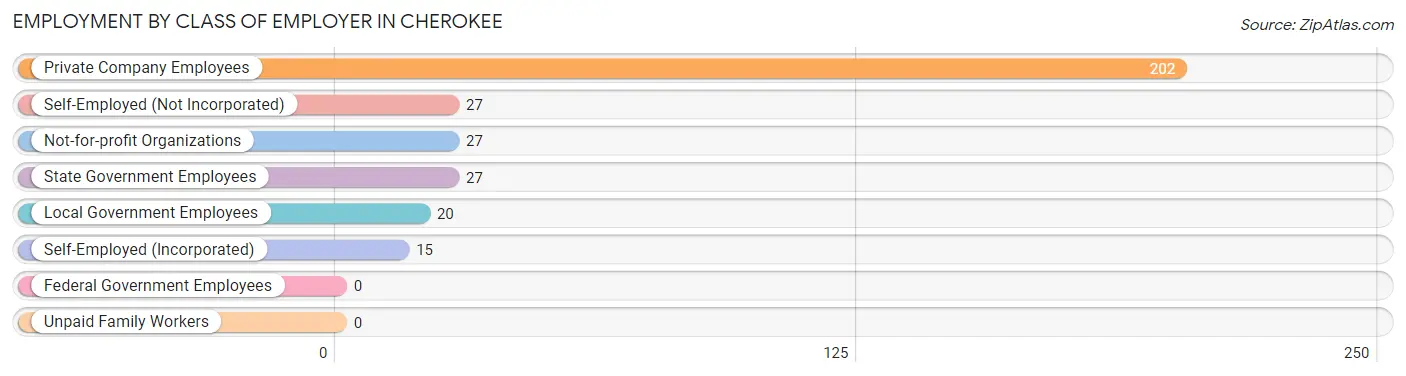
| Employer Class | # Employees | % Employees |
| Private Company Employees | 202 | 63.5% |
| Self-Employed (Incorporated) | 15 | 4.7% |
| Self-Employed (Not Incorporated) | 27 | 8.5% |
| Not-for-profit Organizations | 27 | 8.5% |
| Local Government Employees | 20 | 6.3% |
| State Government Employees | 27 | 8.5% |
| Federal Government Employees | 0 | 0.0% |
| Unpaid Family Workers | 0 | 0.0% |
| Total | 318 | 100.0% |
Employment Status by Age in Cherokee
According to the labor force statistics for Cherokee, out of the total population over 16 years of age (561), 61.7% or 346 individuals are in the labor force, with 7.8% or 27 of them unemployed. The age group with the highest labor force participation rate is 35 to 44 years, with 96.7% or 147 individuals in the labor force. Within the labor force, the 16 to 19 years age range has the highest percentage of unemployed individuals, with 71.4% or 10 of them being unemployed.
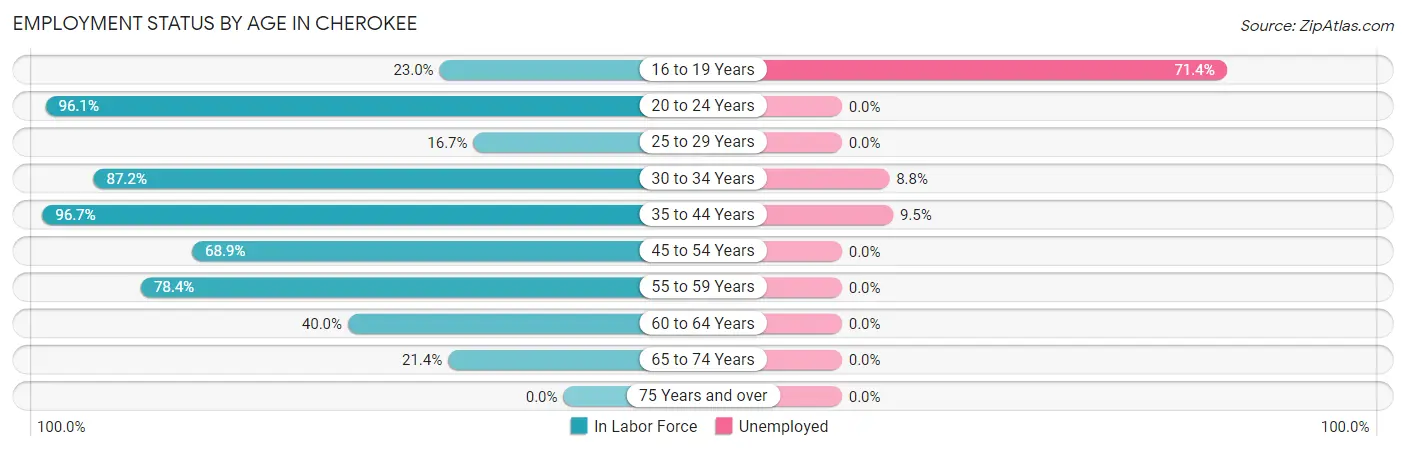
| Age Bracket | In Labor Force | Unemployed |
| 16 to 19 Years | 14 (23.0%) | 10 (71.4%) |
| 20 to 24 Years | 49 (96.1%) | 0 (0.0%) |
| 25 to 29 Years | 3 (16.7%) | 0 (0.0%) |
| 30 to 34 Years | 34 (87.2%) | 3 (8.8%) |
| 35 to 44 Years | 147 (96.7%) | 14 (9.5%) |
| 45 to 54 Years | 51 (68.9%) | 0 (0.0%) |
| 55 to 59 Years | 29 (78.4%) | 0 (0.0%) |
| 60 to 64 Years | 10 (40.0%) | 0 (0.0%) |
| 65 to 74 Years | 9 (21.4%) | 0 (0.0%) |
| 75 Years and over | 0 (0.0%) | 0 (0.0%) |
| Total | 346 (61.7%) | 27 (7.8%) |
Employment Status by Educational Attainment in Cherokee
According to labor force statistics for Cherokee, 79.4% of individuals (274) out of the total population between 25 and 64 years of age (345) are in the labor force, with 6.2% or 17 of them being unemployed. The group with the highest labor force participation rate are those with the educational attainment of less than high school, with 88.9% or 8 individuals in the labor force. Within the labor force, individuals with college / associate degree education have the highest percentage of unemployment, with 13.0% or 14 of them being unemployed.
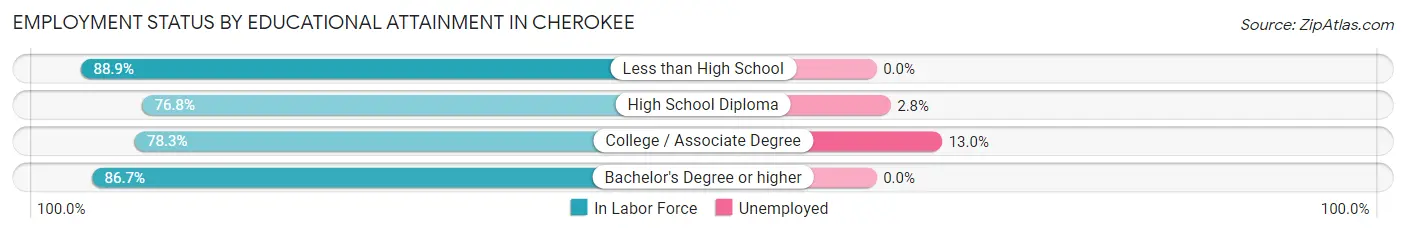
| Educational Attainment | In Labor Force | Unemployed |
| Less than High School | 8 (88.9%) | 0 (0.0%) |
| High School Diploma | 106 (76.8%) | 4 (2.8%) |
| College / Associate Degree | 108 (78.3%) | 18 (13.0%) |
| Bachelor's Degree or higher | 52 (86.7%) | 0 (0.0%) |
| Total | 274 (79.4%) | 21 (6.2%) |
Employment Occupations by Sex in Cherokee
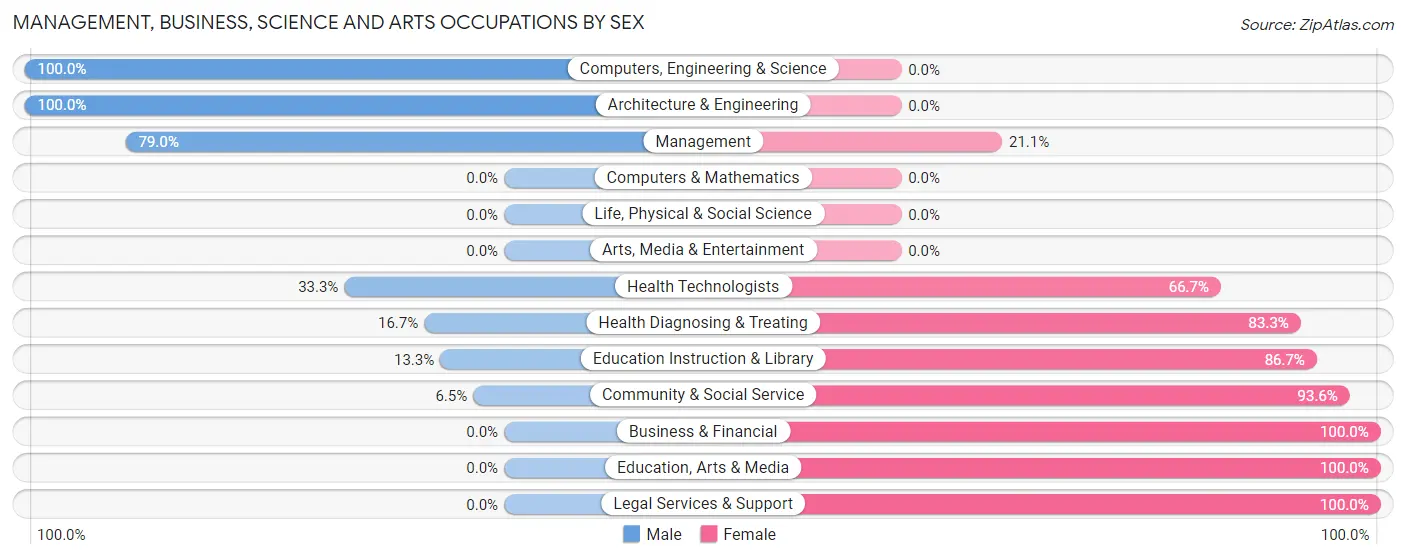
Management, Business, Science and Arts Occupations
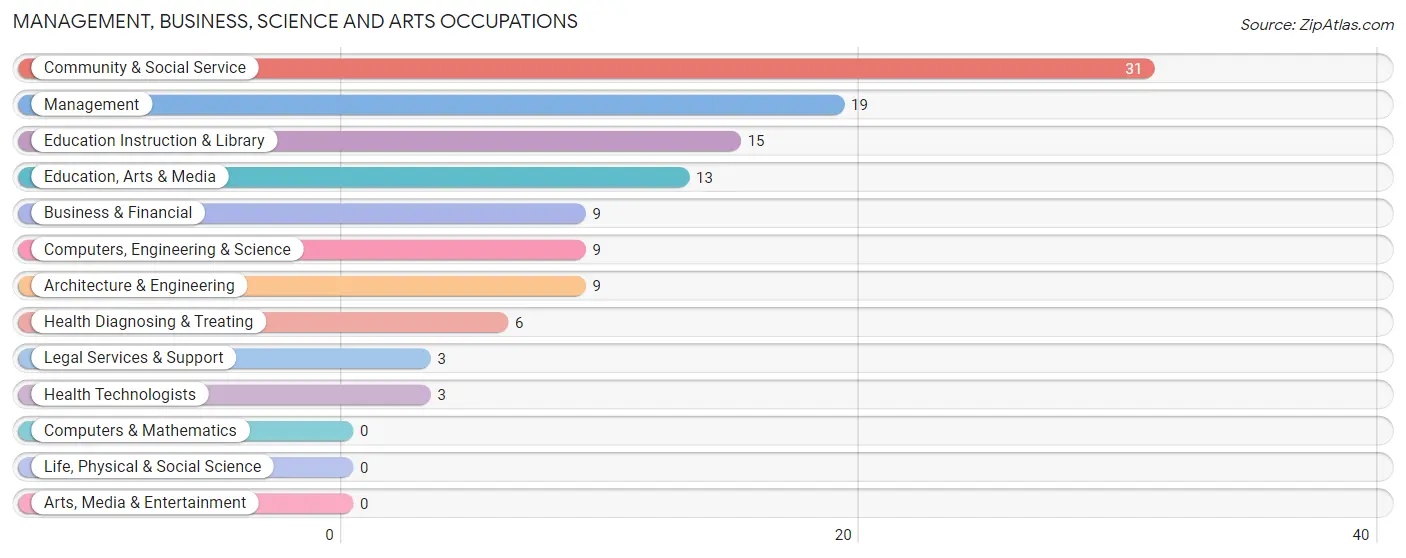
The most common Management, Business, Science and Arts occupations in Cherokee are Community & Social Service (31 | 9.7%), Management (19 | 6.0%), Education Instruction & Library (15 | 4.7%), Education, Arts & Media (13 | 4.1%), and Business & Financial (9 | 2.8%).
Management, Business, Science and Arts Occupations by Sex
Within the Management, Business, Science and Arts occupations in Cherokee, the most male-oriented occupations are Computers, Engineering & Science (100.0%), Architecture & Engineering (100.0%), and Management (78.9%), while the most female-oriented occupations are Business & Financial (100.0%), Education, Arts & Media (100.0%), and Legal Services & Support (100.0%).
| Occupation | Male | Female |
| Management | 15 (78.9%) | 4 (21.0%) |
| Business & Financial | 0 (0.0%) | 9 (100.0%) |
| Computers, Engineering & Science | 9 (100.0%) | 0 (0.0%) |
| Computers & Mathematics | 0 (0.0%) | 0 (0.0%) |
| Architecture & Engineering | 9 (100.0%) | 0 (0.0%) |
| Life, Physical & Social Science | 0 (0.0%) | 0 (0.0%) |
| Community & Social Service | 2 (6.5%) | 29 (93.5%) |
| Education, Arts & Media | 0 (0.0%) | 13 (100.0%) |
| Legal Services & Support | 0 (0.0%) | 3 (100.0%) |
| Education Instruction & Library | 2 (13.3%) | 13 (86.7%) |
| Arts, Media & Entertainment | 0 (0.0%) | 0 (0.0%) |
| Health Diagnosing & Treating | 1 (16.7%) | 5 (83.3%) |
| Health Technologists | 1 (33.3%) | 2 (66.7%) |
| Total (Category) | 27 (36.5%) | 47 (63.5%) |
| Total (Overall) | 186 (58.3%) | 133 (41.7%) |
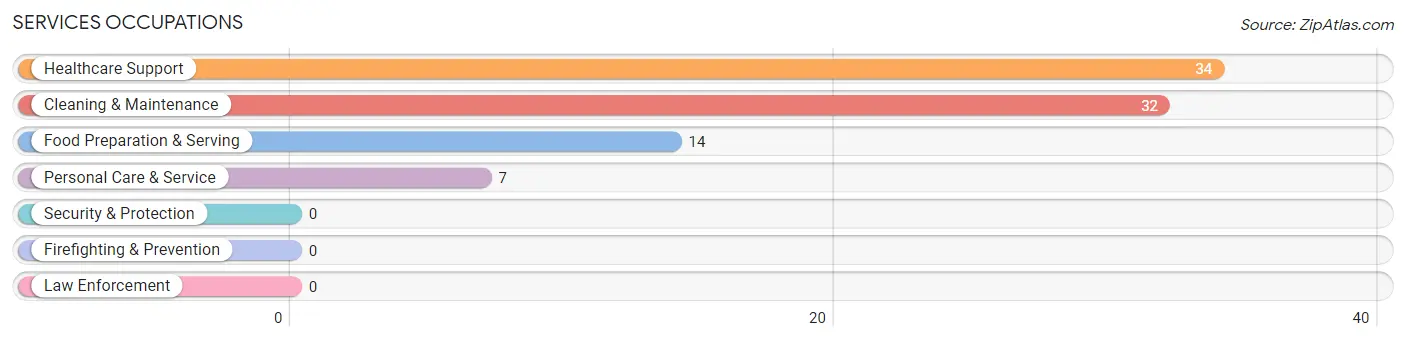
Services Occupations
The most common Services occupations in Cherokee are Healthcare Support (34 | 10.7%), Cleaning & Maintenance (32 | 10.0%), Food Preparation & Serving (14 | 4.4%), and Personal Care & Service (7 | 2.2%).
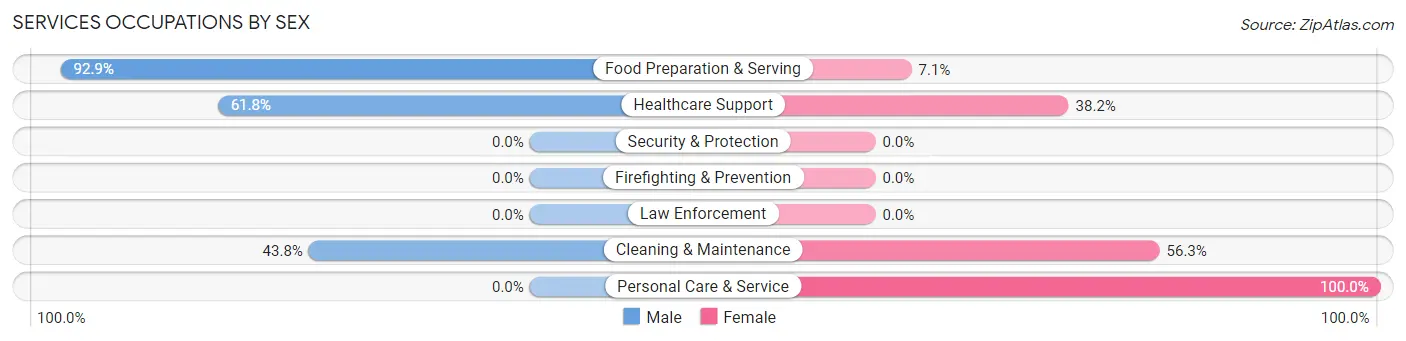
Services Occupations by Sex
Within the Services occupations in Cherokee, the most male-oriented occupations are Food Preparation & Serving (92.9%), Healthcare Support (61.8%), and Cleaning & Maintenance (43.8%), while the most female-oriented occupations are Personal Care & Service (100.0%), Cleaning & Maintenance (56.2%), and Healthcare Support (38.2%).
| Occupation | Male | Female |
| Healthcare Support | 21 (61.8%) | 13 (38.2%) |
| Security & Protection | 0 (0.0%) | 0 (0.0%) |
| Firefighting & Prevention | 0 (0.0%) | 0 (0.0%) |
| Law Enforcement | 0 (0.0%) | 0 (0.0%) |
| Food Preparation & Serving | 13 (92.9%) | 1 (7.1%) |
| Cleaning & Maintenance | 14 (43.8%) | 18 (56.2%) |
| Personal Care & Service | 0 (0.0%) | 7 (100.0%) |
| Total (Category) | 48 (55.2%) | 39 (44.8%) |
| Total (Overall) | 186 (58.3%) | 133 (41.7%) |
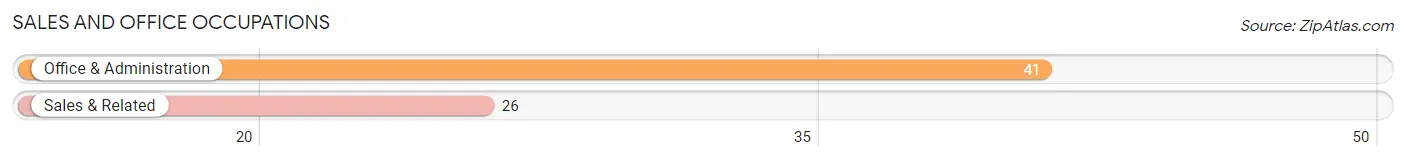
Sales and Office Occupations
The most common Sales and Office occupations in Cherokee are Office & Administration (41 | 12.9%), and Sales & Related (26 | 8.2%).
Sales and Office Occupations by Sex
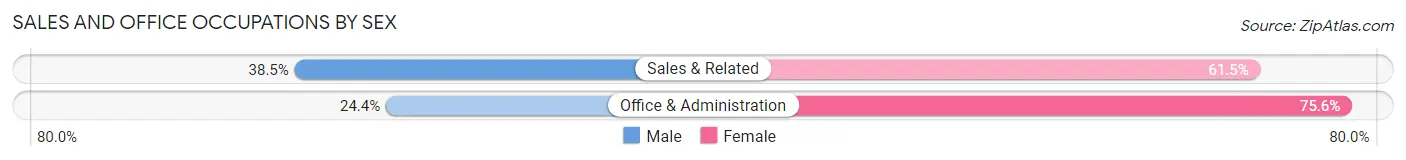
| Occupation | Male | Female |
| Sales & Related | 10 (38.5%) | 16 (61.5%) |
| Office & Administration | 10 (24.4%) | 31 (75.6%) |
| Total (Category) | 20 (29.8%) | 47 (70.2%) |
| Total (Overall) | 186 (58.3%) | 133 (41.7%) |
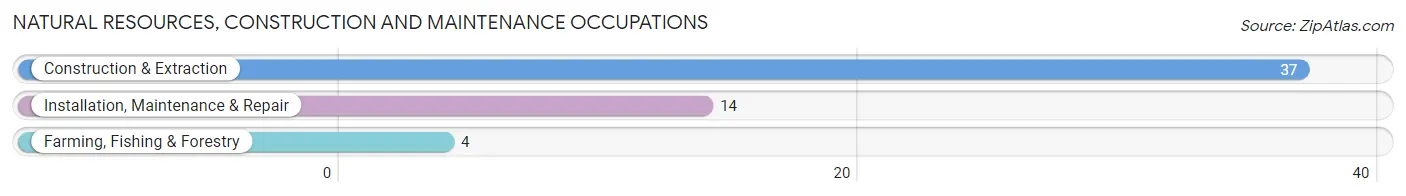
Natural Resources, Construction and Maintenance Occupations
The most common Natural Resources, Construction and Maintenance occupations in Cherokee are Construction & Extraction (37 | 11.6%), Installation, Maintenance & Repair (14 | 4.4%), and Farming, Fishing & Forestry (4 | 1.3%).
Natural Resources, Construction and Maintenance Occupations by Sex
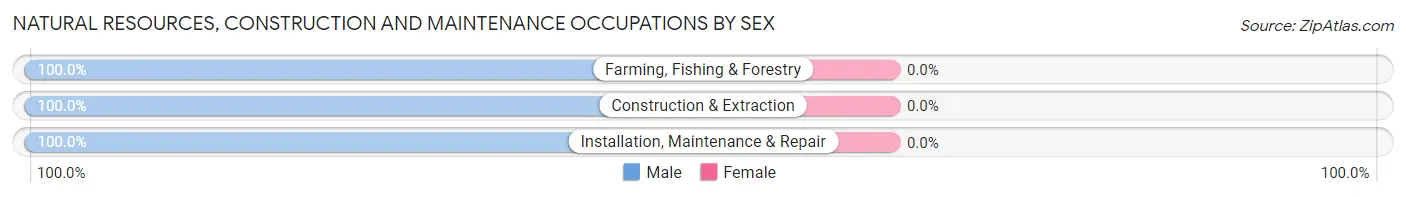
| Occupation | Male | Female |
| Farming, Fishing & Forestry | 4 (100.0%) | 0 (0.0%) |
| Construction & Extraction | 37 (100.0%) | 0 (0.0%) |
| Installation, Maintenance & Repair | 14 (100.0%) | 0 (0.0%) |
| Total (Category) | 55 (100.0%) | 0 (0.0%) |
| Total (Overall) | 186 (58.3%) | 133 (41.7%) |
Production, Transportation and Moving Occupations
The most common Production, Transportation and Moving occupations in Cherokee are Material Moving (15 | 4.7%), Transportation (13 | 4.1%), and Production (8 | 2.5%).
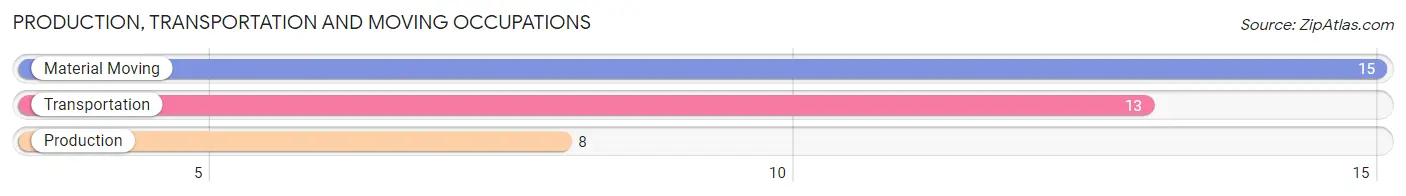
Production, Transportation and Moving Occupations by Sex
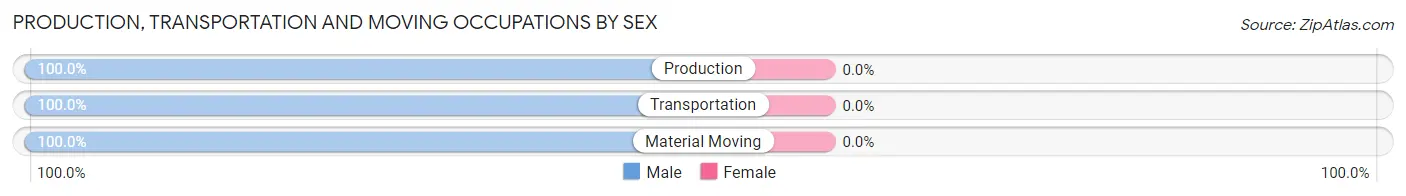
| Occupation | Male | Female |
| Production | 8 (100.0%) | 0 (0.0%) |
| Transportation | 13 (100.0%) | 0 (0.0%) |
| Material Moving | 15 (100.0%) | 0 (0.0%) |
| Total (Category) | 36 (100.0%) | 0 (0.0%) |
| Total (Overall) | 186 (58.3%) | 133 (41.7%) |
Employment Industries by Sex in Cherokee
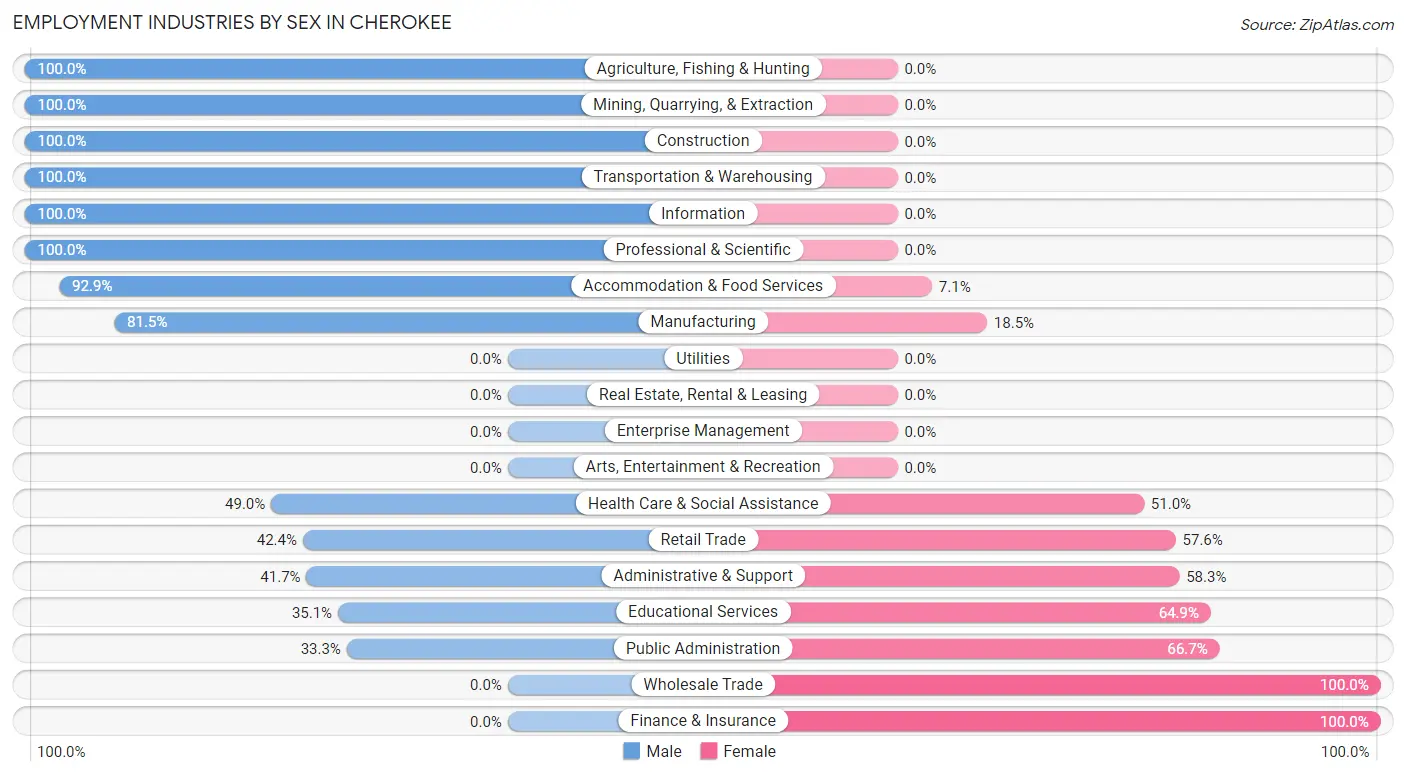
Employment Industries in Cherokee
The major employment industries in Cherokee include Educational Services (74 | 23.2%), Health Care & Social Assistance (49 | 15.4%), Construction (36 | 11.3%), Retail Trade (33 | 10.3%), and Manufacturing (27 | 8.5%).
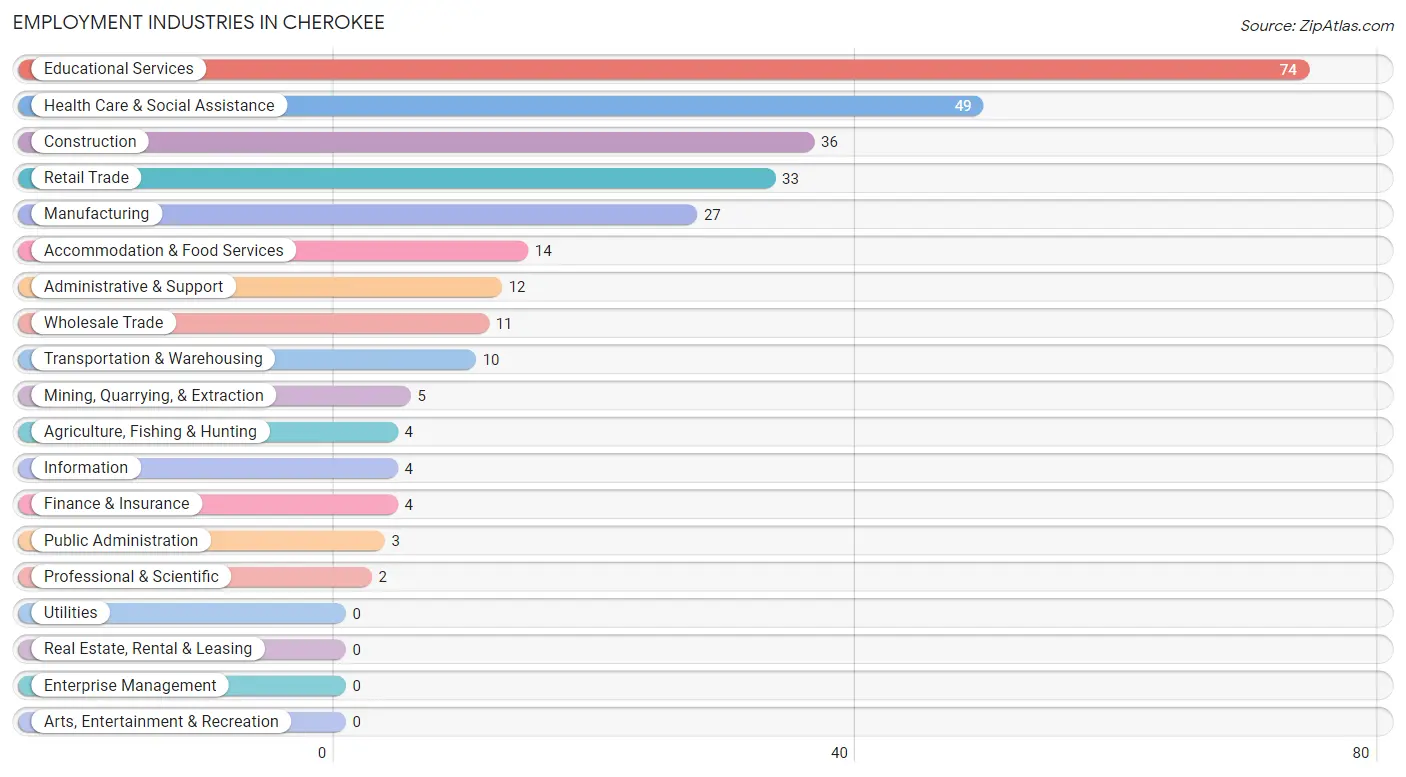
Employment Industries by Sex in Cherokee
The Cherokee industries that see more men than women are Agriculture, Fishing & Hunting (100.0%), Mining, Quarrying, & Extraction (100.0%), and Construction (100.0%), whereas the industries that tend to have a higher number of women are Wholesale Trade (100.0%), Finance & Insurance (100.0%), and Public Administration (66.7%).
| Industry | Male | Female |
| Agriculture, Fishing & Hunting | 4 (100.0%) | 0 (0.0%) |
| Mining, Quarrying, & Extraction | 5 (100.0%) | 0 (0.0%) |
| Construction | 36 (100.0%) | 0 (0.0%) |
| Manufacturing | 22 (81.5%) | 5 (18.5%) |
| Wholesale Trade | 0 (0.0%) | 11 (100.0%) |
| Retail Trade | 14 (42.4%) | 19 (57.6%) |
| Transportation & Warehousing | 10 (100.0%) | 0 (0.0%) |
| Utilities | 0 (0.0%) | 0 (0.0%) |
| Information | 4 (100.0%) | 0 (0.0%) |
| Finance & Insurance | 0 (0.0%) | 4 (100.0%) |
| Real Estate, Rental & Leasing | 0 (0.0%) | 0 (0.0%) |
| Professional & Scientific | 2 (100.0%) | 0 (0.0%) |
| Enterprise Management | 0 (0.0%) | 0 (0.0%) |
| Administrative & Support | 5 (41.7%) | 7 (58.3%) |
| Educational Services | 26 (35.1%) | 48 (64.9%) |
| Health Care & Social Assistance | 24 (49.0%) | 25 (51.0%) |
| Arts, Entertainment & Recreation | 0 (0.0%) | 0 (0.0%) |
| Accommodation & Food Services | 13 (92.9%) | 1 (7.1%) |
| Public Administration | 1 (33.3%) | 2 (66.7%) |
| Total | 186 (58.3%) | 133 (41.7%) |
Education in Cherokee
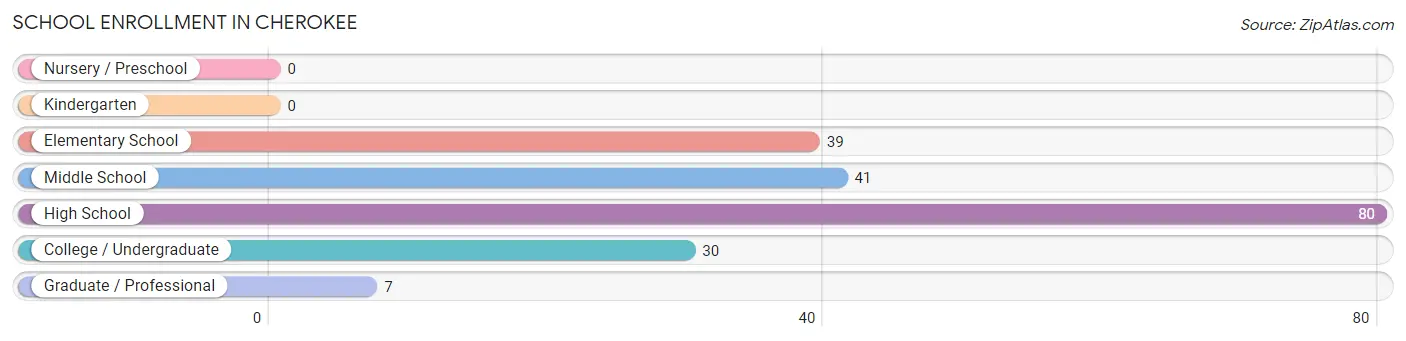
School Enrollment in Cherokee
The most common levels of schooling among the 197 students in Cherokee are high school (80 | 40.6%), middle school (41 | 20.8%), and elementary school (39 | 19.8%).
| School Level | # Students | % Students |
| Nursery / Preschool | 0 | 0.0% |
| Kindergarten | 0 | 0.0% |
| Elementary School | 39 | 19.8% |
| Middle School | 41 | 20.8% |
| High School | 80 | 40.6% |
| College / Undergraduate | 30 | 15.2% |
| Graduate / Professional | 7 | 3.5% |
| Total | 197 | 100.0% |
School Enrollment by Age by Funding Source in Cherokee
Out of a total of 197 students who are enrolled in schools in Cherokee, 29 (14.7%) attend a private institution, while the remaining 168 (85.3%) are enrolled in public schools. The age group of 15 to 17 year olds has the highest likelihood of being enrolled in private schools, with 25 (41.7% in the age bracket) enrolled. Conversely, the age group of 5 to 9 year old has the lowest likelihood of being enrolled in a private school, with 39 (100.0% in the age bracket) attending a public institution.
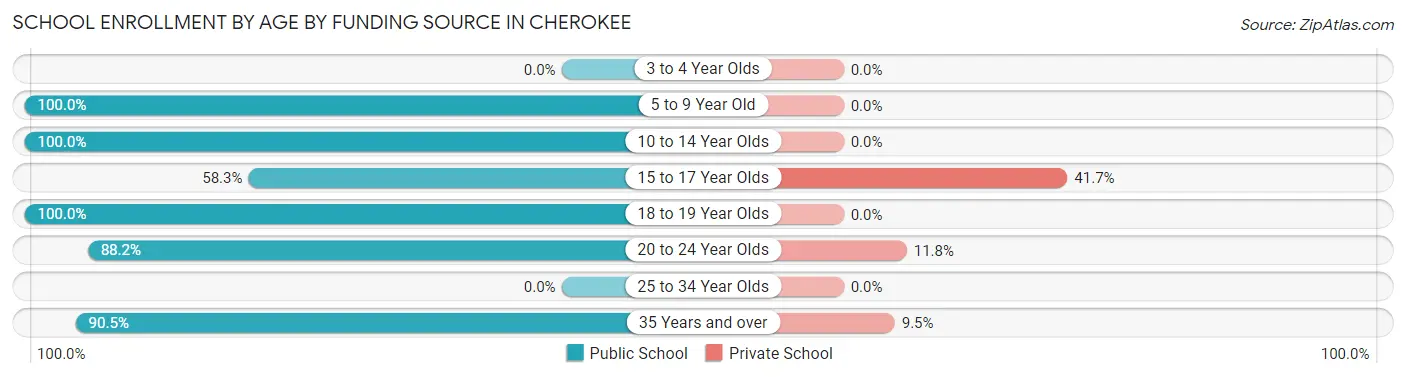
| Age Bracket | Public School | Private School |
| 3 to 4 Year Olds | 0 (0.0%) | 0 (0.0%) |
| 5 to 9 Year Old | 39 (100.0%) | 0 (0.0%) |
| 10 to 14 Year Olds | 49 (100.0%) | 0 (0.0%) |
| 15 to 17 Year Olds | 35 (58.3%) | 25 (41.7%) |
| 18 to 19 Year Olds | 11 (100.0%) | 0 (0.0%) |
| 20 to 24 Year Olds | 15 (88.2%) | 2 (11.8%) |
| 25 to 34 Year Olds | 0 (0.0%) | 0 (0.0%) |
| 35 Years and over | 19 (90.5%) | 2 (9.5%) |
| Total | 168 (85.3%) | 29 (14.7%) |
Educational Attainment by Field of Study in Cherokee
Education (27 | 29.7%), science & technology (20 | 22.0%), arts & humanities (16 | 17.6%), psychology (13 | 14.3%), and business (6 | 6.6%) are the most common fields of study among 91 individuals in Cherokee who have obtained a bachelor's degree or higher.
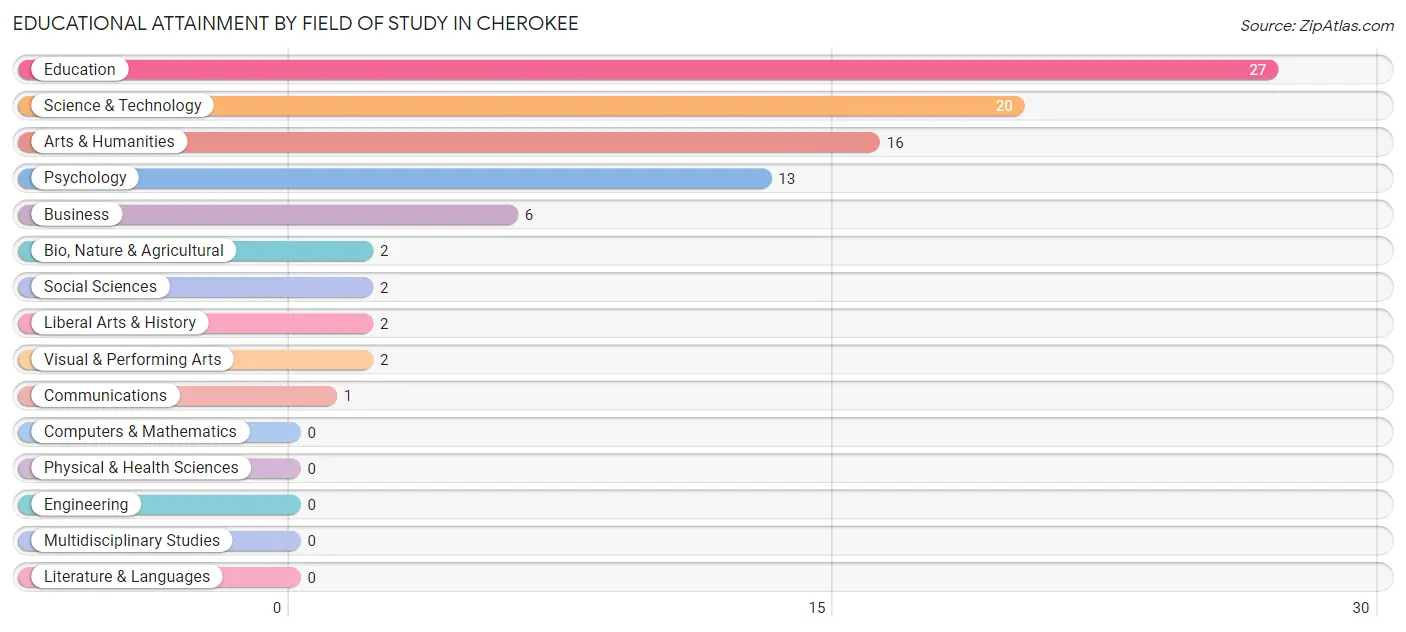
| Field of Study | # Graduates | % Graduates |
| Computers & Mathematics | 0 | 0.0% |
| Bio, Nature & Agricultural | 2 | 2.2% |
| Physical & Health Sciences | 0 | 0.0% |
| Psychology | 13 | 14.3% |
| Social Sciences | 2 | 2.2% |
| Engineering | 0 | 0.0% |
| Multidisciplinary Studies | 0 | 0.0% |
| Science & Technology | 20 | 22.0% |
| Business | 6 | 6.6% |
| Education | 27 | 29.7% |
| Literature & Languages | 0 | 0.0% |
| Liberal Arts & History | 2 | 2.2% |
| Visual & Performing Arts | 2 | 2.2% |
| Communications | 1 | 1.1% |
| Arts & Humanities | 16 | 17.6% |
| Total | 91 | 100.0% |
Transportation & Commute in Cherokee
Vehicle Availability by Sex in Cherokee
The most prevalent vehicle ownership categories in Cherokee are males with 4 vehicles (59, accounting for 31.7%) and females with 4 vehicles (22, making up 44.7%).
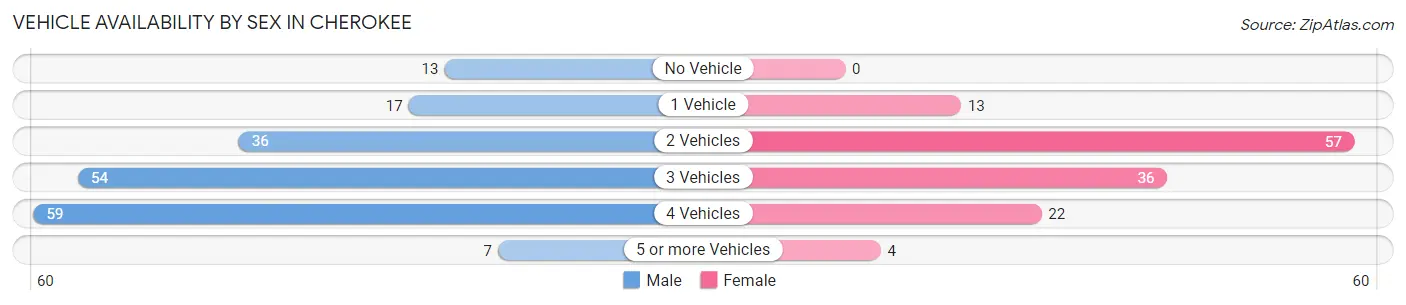
| Vehicles Available | Male | Female |
| No Vehicle | 13 (7.0%) | 0 (0.0%) |
| 1 Vehicle | 17 (9.1%) | 13 (9.9%) |
| 2 Vehicles | 36 (19.4%) | 57 (43.2%) |
| 3 Vehicles | 54 (29.0%) | 36 (27.3%) |
| 4 Vehicles | 59 (31.7%) | 22 (16.7%) |
| 5 or more Vehicles | 7 (3.8%) | 4 (3.0%) |
| Total | 186 (100.0%) | 132 (100.0%) |
Commute Time in Cherokee
The most frequently occuring commute durations in Cherokee are 15 to 19 minutes (93 commuters, 30.9%), 20 to 24 minutes (74 commuters, 24.6%), and 30 to 34 minutes (37 commuters, 12.3%).
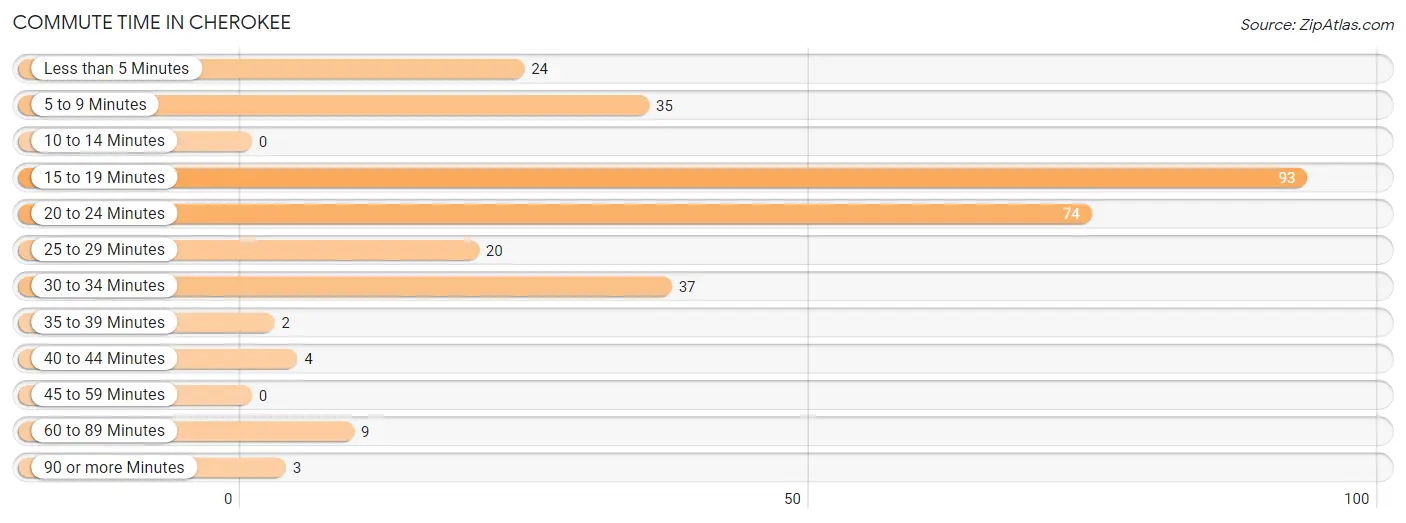
| Commute Time | # Commuters | % Commuters |
| Less than 5 Minutes | 24 | 8.0% |
| 5 to 9 Minutes | 35 | 11.6% |
| 10 to 14 Minutes | 0 | 0.0% |
| 15 to 19 Minutes | 93 | 30.9% |
| 20 to 24 Minutes | 74 | 24.6% |
| 25 to 29 Minutes | 20 | 6.6% |
| 30 to 34 Minutes | 37 | 12.3% |
| 35 to 39 Minutes | 2 | 0.7% |
| 40 to 44 Minutes | 4 | 1.3% |
| 45 to 59 Minutes | 0 | 0.0% |
| 60 to 89 Minutes | 9 | 3.0% |
| 90 or more Minutes | 3 | 1.0% |
Commute Time by Sex in Cherokee
The most common commute times in Cherokee are 15 to 19 minutes (79 commuters, 45.9%) for males and 20 to 24 minutes (45 commuters, 34.9%) for females.
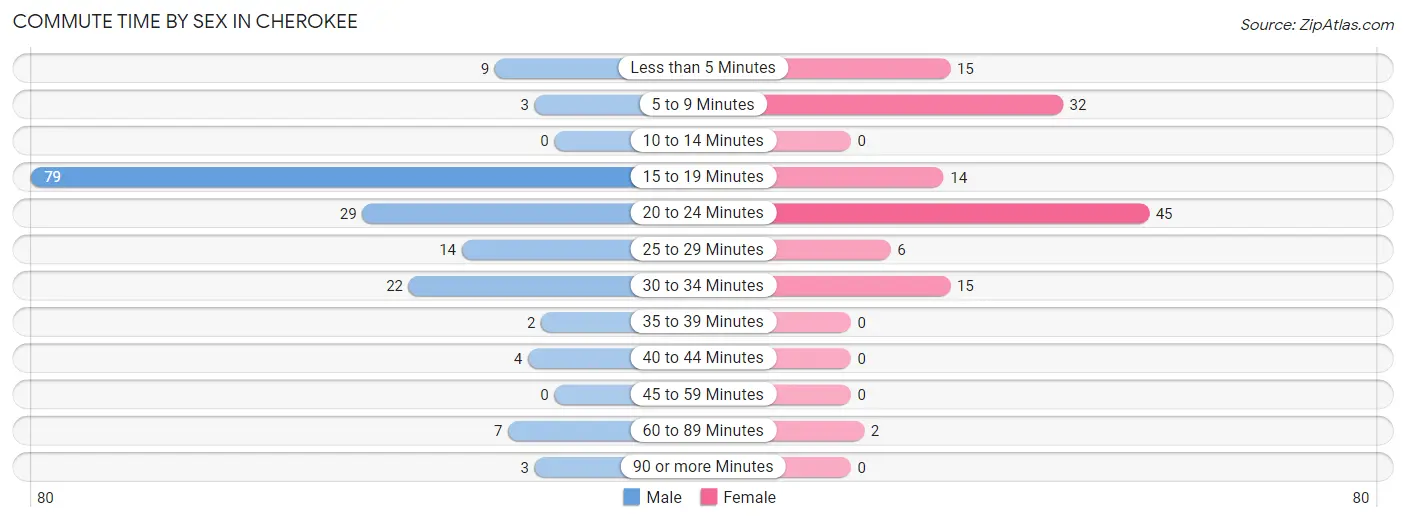
| Commute Time | Male | Female |
| Less than 5 Minutes | 9 (5.2%) | 15 (11.6%) |
| 5 to 9 Minutes | 3 (1.7%) | 32 (24.8%) |
| 10 to 14 Minutes | 0 (0.0%) | 0 (0.0%) |
| 15 to 19 Minutes | 79 (45.9%) | 14 (10.8%) |
| 20 to 24 Minutes | 29 (16.9%) | 45 (34.9%) |
| 25 to 29 Minutes | 14 (8.1%) | 6 (4.6%) |
| 30 to 34 Minutes | 22 (12.8%) | 15 (11.6%) |
| 35 to 39 Minutes | 2 (1.2%) | 0 (0.0%) |
| 40 to 44 Minutes | 4 (2.3%) | 0 (0.0%) |
| 45 to 59 Minutes | 0 (0.0%) | 0 (0.0%) |
| 60 to 89 Minutes | 7 (4.1%) | 2 (1.5%) |
| 90 or more Minutes | 3 (1.7%) | 0 (0.0%) |
Time of Departure to Work by Sex in Cherokee
The most frequent times of departure to work in Cherokee are 7:30 AM to 7:59 AM (47, 27.3%) for males and 7:00 AM to 7:29 AM (29, 22.5%) for females.
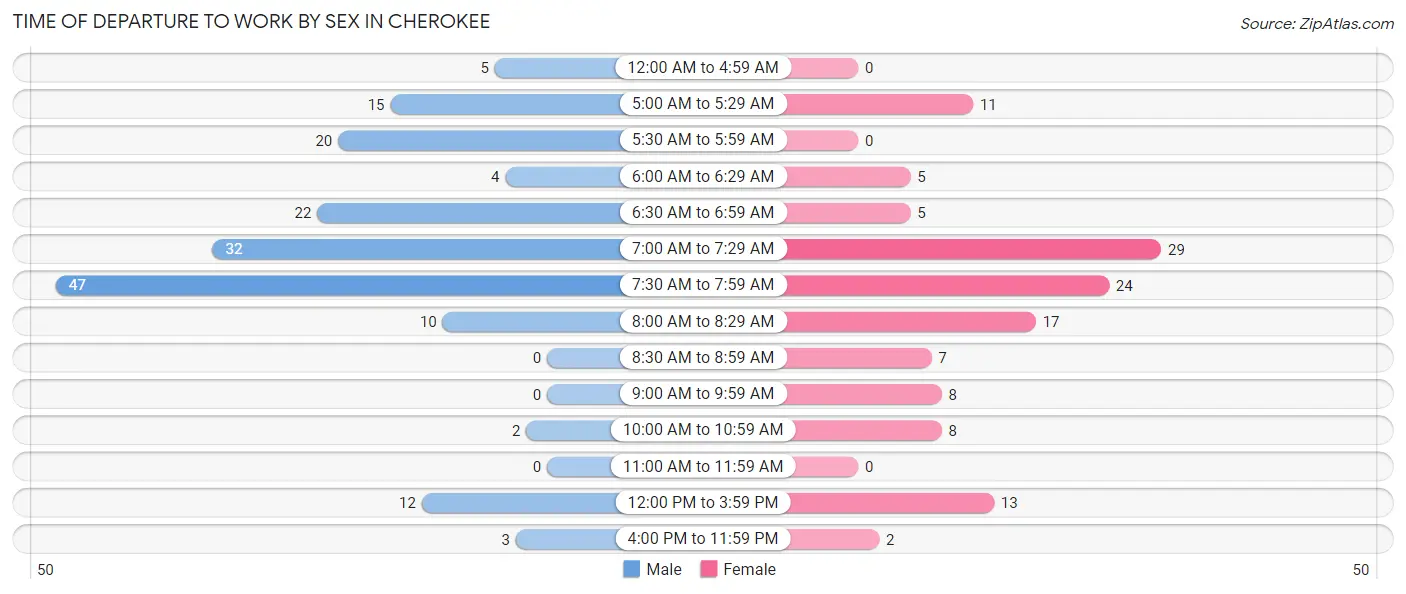
| Time of Departure | Male | Female |
| 12:00 AM to 4:59 AM | 5 (2.9%) | 0 (0.0%) |
| 5:00 AM to 5:29 AM | 15 (8.7%) | 11 (8.5%) |
| 5:30 AM to 5:59 AM | 20 (11.6%) | 0 (0.0%) |
| 6:00 AM to 6:29 AM | 4 (2.3%) | 5 (3.9%) |
| 6:30 AM to 6:59 AM | 22 (12.8%) | 5 (3.9%) |
| 7:00 AM to 7:29 AM | 32 (18.6%) | 29 (22.5%) |
| 7:30 AM to 7:59 AM | 47 (27.3%) | 24 (18.6%) |
| 8:00 AM to 8:29 AM | 10 (5.8%) | 17 (13.2%) |
| 8:30 AM to 8:59 AM | 0 (0.0%) | 7 (5.4%) |
| 9:00 AM to 9:59 AM | 0 (0.0%) | 8 (6.2%) |
| 10:00 AM to 10:59 AM | 2 (1.2%) | 8 (6.2%) |
| 11:00 AM to 11:59 AM | 0 (0.0%) | 0 (0.0%) |
| 12:00 PM to 3:59 PM | 12 (7.0%) | 13 (10.1%) |
| 4:00 PM to 11:59 PM | 3 (1.7%) | 2 (1.5%) |
| Total | 172 (100.0%) | 129 (100.0%) |
Housing Occupancy in Cherokee
Occupancy by Ownership in Cherokee
Of the total 270 dwellings in Cherokee, owner-occupied units account for 211 (78.1%), while renter-occupied units make up 59 (21.8%).
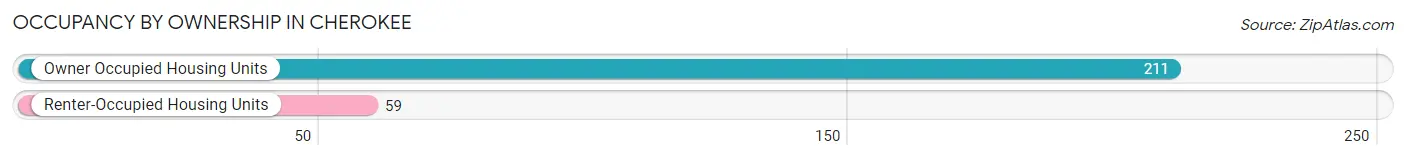
| Occupancy | # Housing Units | % Housing Units |
| Owner Occupied Housing Units | 211 | 78.1% |
| Renter-Occupied Housing Units | 59 | 21.8% |
| Total Occupied Housing Units | 270 | 100.0% |
Occupancy by Household Size in Cherokee
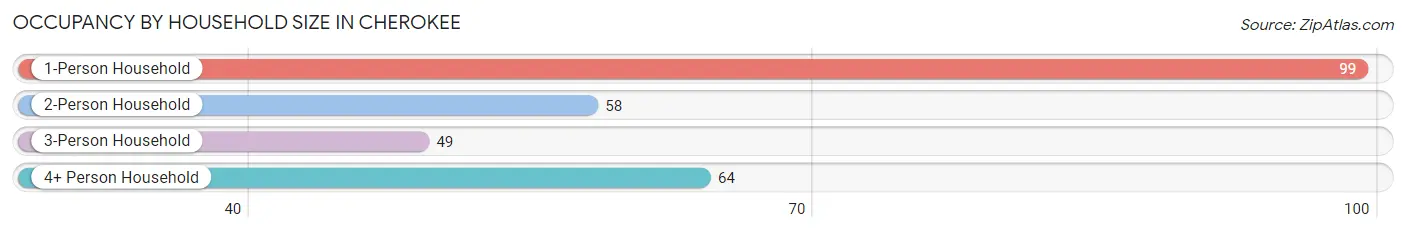
| Household Size | # Housing Units | % Housing Units |
| 1-Person Household | 99 | 36.7% |
| 2-Person Household | 58 | 21.5% |
| 3-Person Household | 49 | 18.1% |
| 4+ Person Household | 64 | 23.7% |
| Total Housing Units | 270 | 100.0% |
Occupancy by Ownership by Household Size in Cherokee
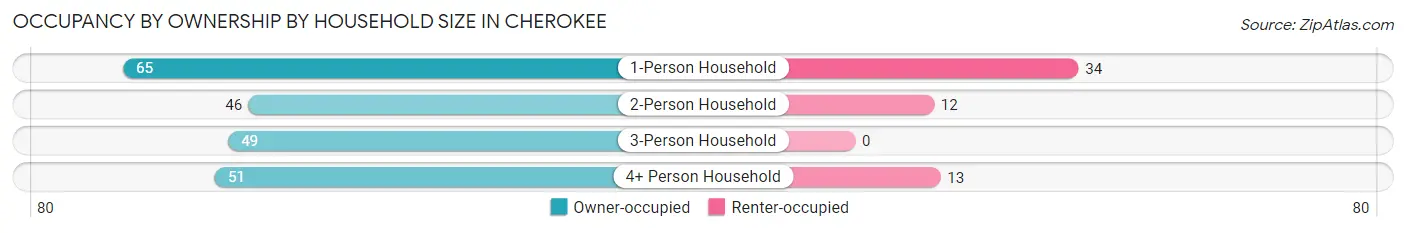
| Household Size | Owner-occupied | Renter-occupied |
| 1-Person Household | 65 (65.7%) | 34 (34.3%) |
| 2-Person Household | 46 (79.3%) | 12 (20.7%) |
| 3-Person Household | 49 (100.0%) | 0 (0.0%) |
| 4+ Person Household | 51 (79.7%) | 13 (20.3%) |
| Total Housing Units | 211 (78.1%) | 59 (21.8%) |
Occupancy by Educational Attainment in Cherokee
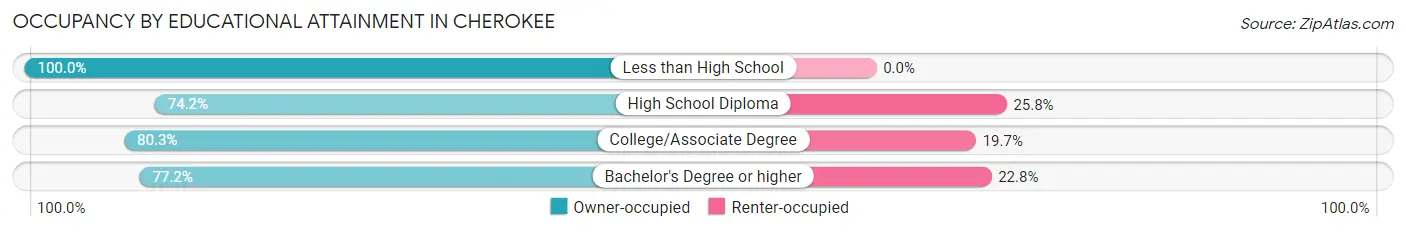
| Household Size | Owner-occupied | Renter-occupied |
| Less than High School | 17 (100.0%) | 0 (0.0%) |
| High School Diploma | 89 (74.2%) | 31 (25.8%) |
| College/Associate Degree | 61 (80.3%) | 15 (19.7%) |
| Bachelor's Degree or higher | 44 (77.2%) | 13 (22.8%) |
Occupancy by Age of Householder in Cherokee
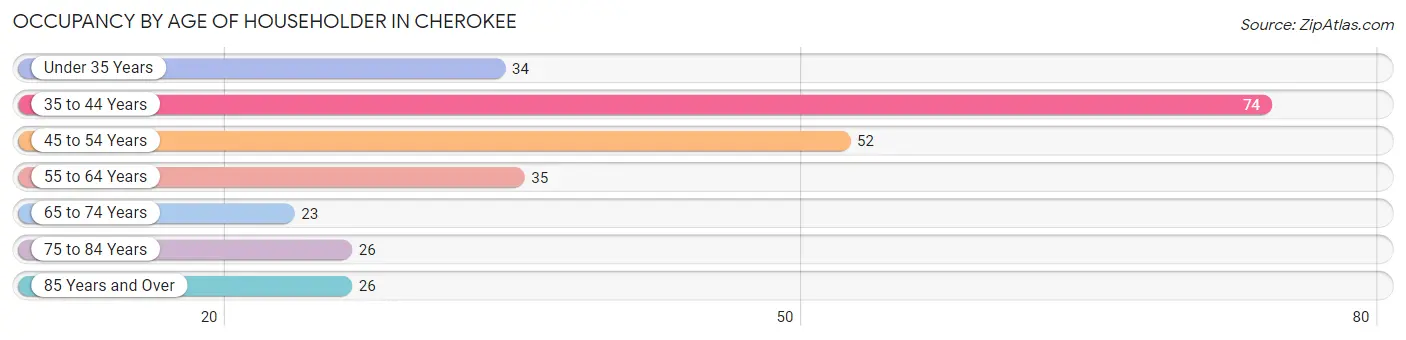
| Age Bracket | # Households | % Households |
| Under 35 Years | 34 | 12.6% |
| 35 to 44 Years | 74 | 27.4% |
| 45 to 54 Years | 52 | 19.3% |
| 55 to 64 Years | 35 | 13.0% |
| 65 to 74 Years | 23 | 8.5% |
| 75 to 84 Years | 26 | 9.6% |
| 85 Years and Over | 26 | 9.6% |
| Total | 270 | 100.0% |
Housing Finances in Cherokee
Median Income by Occupancy in Cherokee
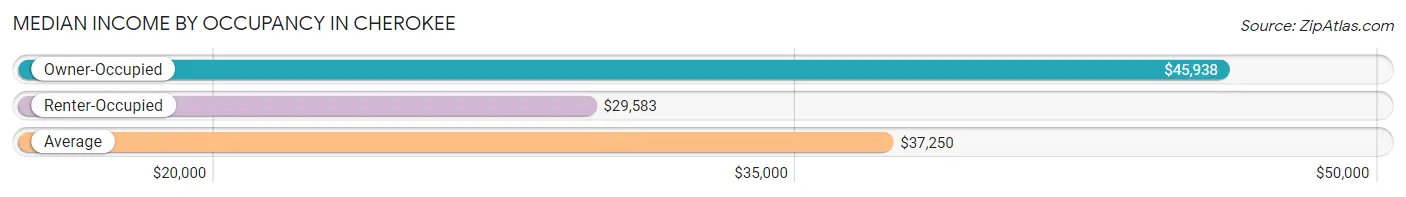
| Occupancy Type | # Households | Median Income |
| Owner-Occupied | 211 (78.1%) | $45,938 |
| Renter-Occupied | 59 (21.8%) | $29,583 |
| Average | 270 (100.0%) | $37,250 |
Occupancy by Householder Income Bracket in Cherokee
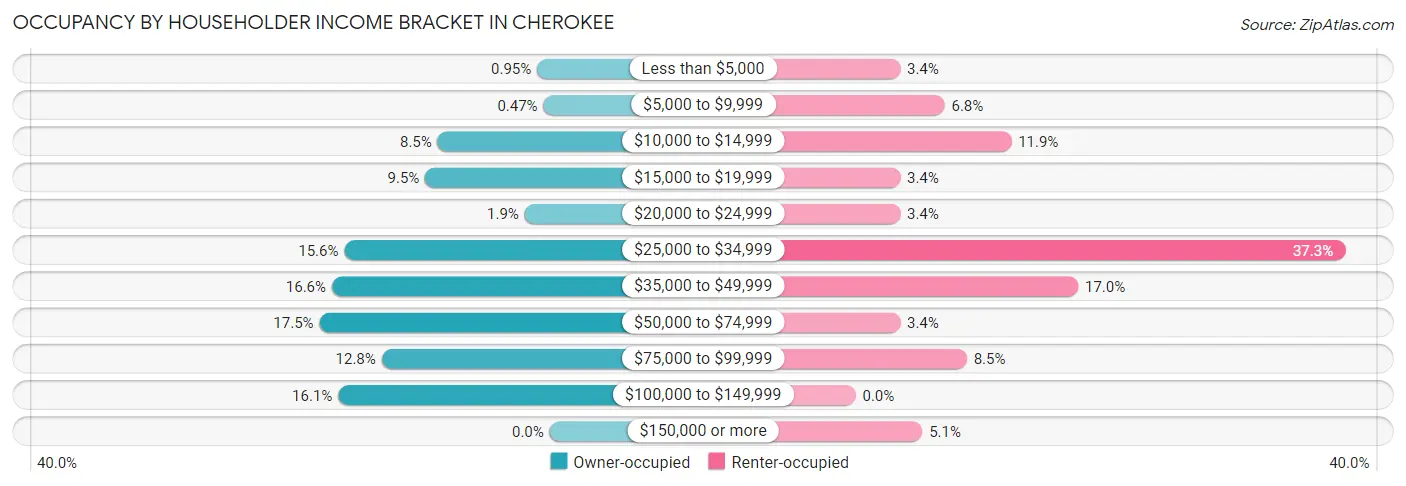
| Income Bracket | Owner-occupied | Renter-occupied |
| Less than $5,000 | 2 (0.9%) | 2 (3.4%) |
| $5,000 to $9,999 | 1 (0.5%) | 4 (6.8%) |
| $10,000 to $14,999 | 18 (8.5%) | 7 (11.9%) |
| $15,000 to $19,999 | 20 (9.5%) | 2 (3.4%) |
| $20,000 to $24,999 | 4 (1.9%) | 2 (3.4%) |
| $25,000 to $34,999 | 33 (15.6%) | 22 (37.3%) |
| $35,000 to $49,999 | 35 (16.6%) | 10 (17.0%) |
| $50,000 to $74,999 | 37 (17.5%) | 2 (3.4%) |
| $75,000 to $99,999 | 27 (12.8%) | 5 (8.5%) |
| $100,000 to $149,999 | 34 (16.1%) | 0 (0.0%) |
| $150,000 or more | 0 (0.0%) | 3 (5.1%) |
| Total | 211 (100.0%) | 59 (100.0%) |
Monthly Housing Cost Tiers in Cherokee
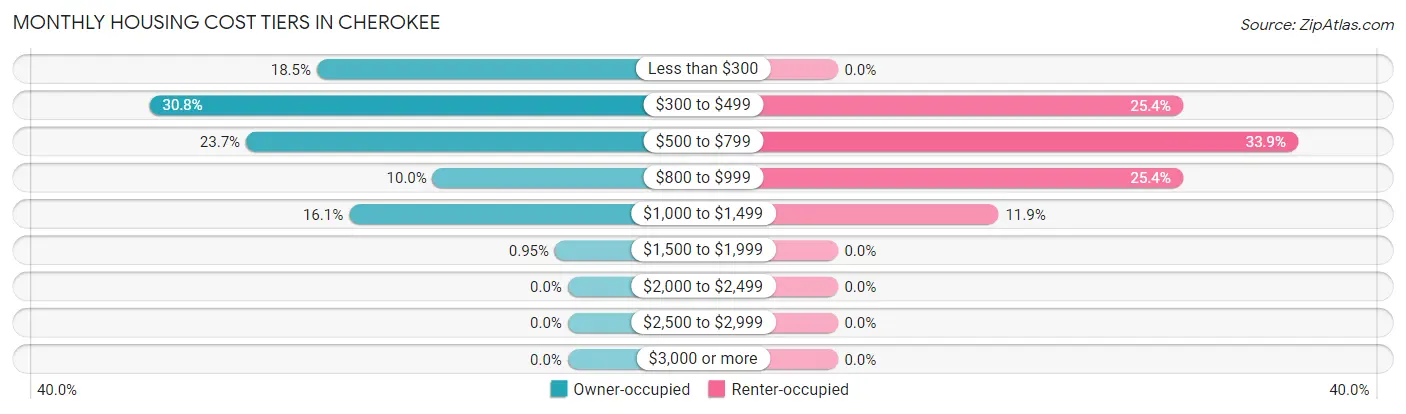
| Monthly Cost | Owner-occupied | Renter-occupied |
| Less than $300 | 39 (18.5%) | 0 (0.0%) |
| $300 to $499 | 65 (30.8%) | 15 (25.4%) |
| $500 to $799 | 50 (23.7%) | 20 (33.9%) |
| $800 to $999 | 21 (10.0%) | 15 (25.4%) |
| $1,000 to $1,499 | 34 (16.1%) | 7 (11.9%) |
| $1,500 to $1,999 | 2 (0.9%) | 0 (0.0%) |
| $2,000 to $2,499 | 0 (0.0%) | 0 (0.0%) |
| $2,500 to $2,999 | 0 (0.0%) | 0 (0.0%) |
| $3,000 or more | 0 (0.0%) | 0 (0.0%) |
| Total | 211 (100.0%) | 59 (100.0%) |
Physical Housing Characteristics in Cherokee
Housing Structures in Cherokee
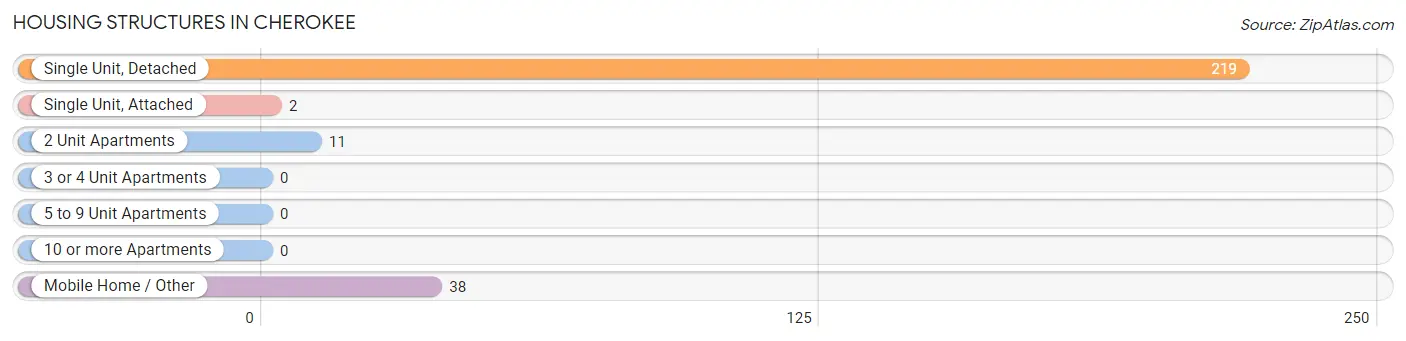
| Structure Type | # Housing Units | % Housing Units |
| Single Unit, Detached | 219 | 81.1% |
| Single Unit, Attached | 2 | 0.7% |
| 2 Unit Apartments | 11 | 4.1% |
| 3 or 4 Unit Apartments | 0 | 0.0% |
| 5 to 9 Unit Apartments | 0 | 0.0% |
| 10 or more Apartments | 0 | 0.0% |
| Mobile Home / Other | 38 | 14.1% |
| Total | 270 | 100.0% |
Housing Structures by Occupancy in Cherokee
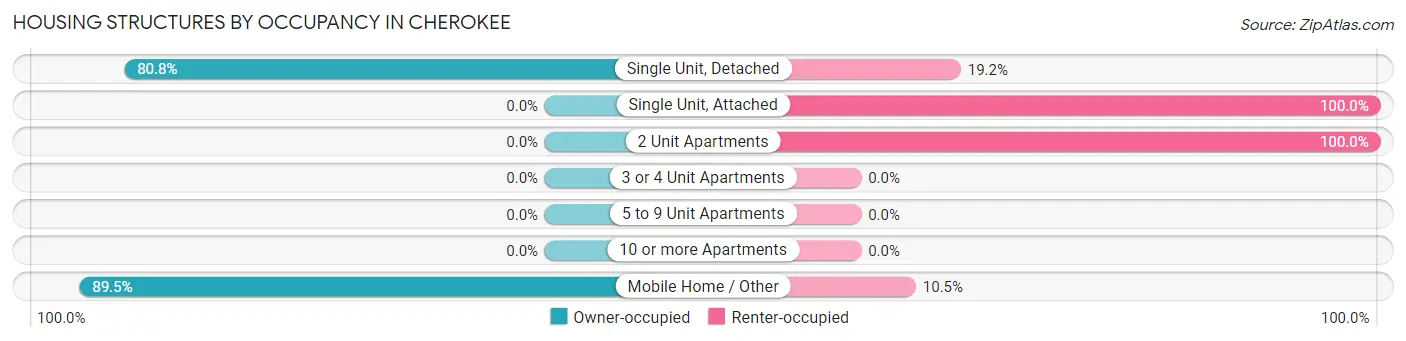
| Structure Type | Owner-occupied | Renter-occupied |
| Single Unit, Detached | 177 (80.8%) | 42 (19.2%) |
| Single Unit, Attached | 0 (0.0%) | 2 (100.0%) |
| 2 Unit Apartments | 0 (0.0%) | 11 (100.0%) |
| 3 or 4 Unit Apartments | 0 (0.0%) | 0 (0.0%) |
| 5 to 9 Unit Apartments | 0 (0.0%) | 0 (0.0%) |
| 10 or more Apartments | 0 (0.0%) | 0 (0.0%) |
| Mobile Home / Other | 34 (89.5%) | 4 (10.5%) |
| Total | 211 (78.1%) | 59 (21.8%) |
Housing Structures by Number of Rooms in Cherokee
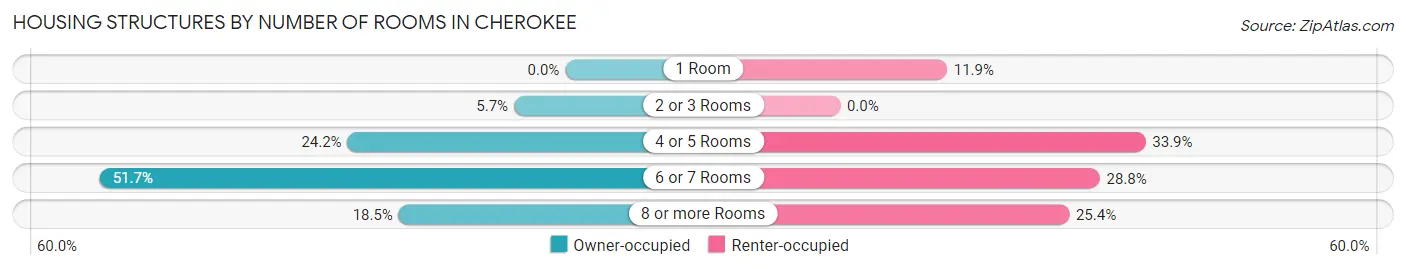
| Number of Rooms | Owner-occupied | Renter-occupied |
| 1 Room | 0 (0.0%) | 7 (11.9%) |
| 2 or 3 Rooms | 12 (5.7%) | 0 (0.0%) |
| 4 or 5 Rooms | 51 (24.2%) | 20 (33.9%) |
| 6 or 7 Rooms | 109 (51.7%) | 17 (28.8%) |
| 8 or more Rooms | 39 (18.5%) | 15 (25.4%) |
| Total | 211 (100.0%) | 59 (100.0%) |
Housing Structure by Heating Type in Cherokee
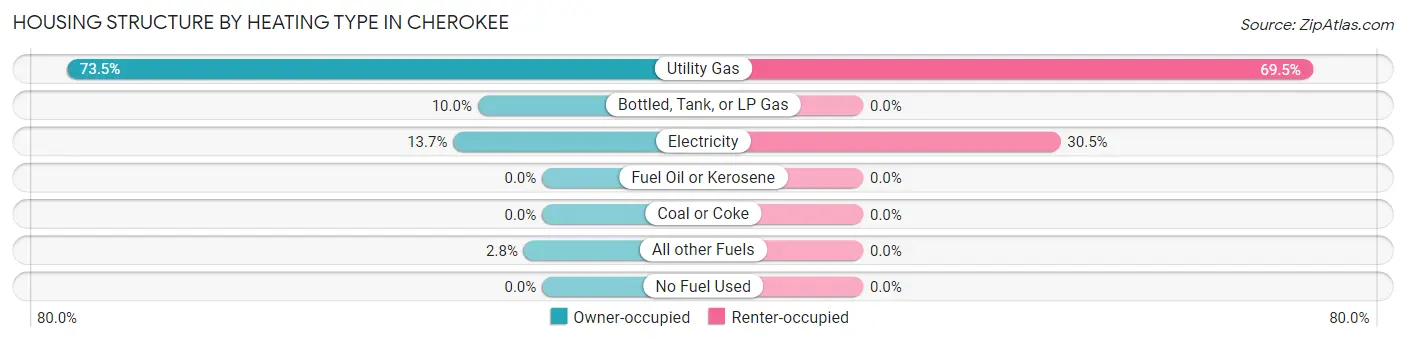
| Heating Type | Owner-occupied | Renter-occupied |
| Utility Gas | 155 (73.5%) | 41 (69.5%) |
| Bottled, Tank, or LP Gas | 21 (10.0%) | 0 (0.0%) |
| Electricity | 29 (13.7%) | 18 (30.5%) |
| Fuel Oil or Kerosene | 0 (0.0%) | 0 (0.0%) |
| Coal or Coke | 0 (0.0%) | 0 (0.0%) |
| All other Fuels | 6 (2.8%) | 0 (0.0%) |
| No Fuel Used | 0 (0.0%) | 0 (0.0%) |
| Total | 211 (100.0%) | 59 (100.0%) |
Household Vehicle Usage in Cherokee
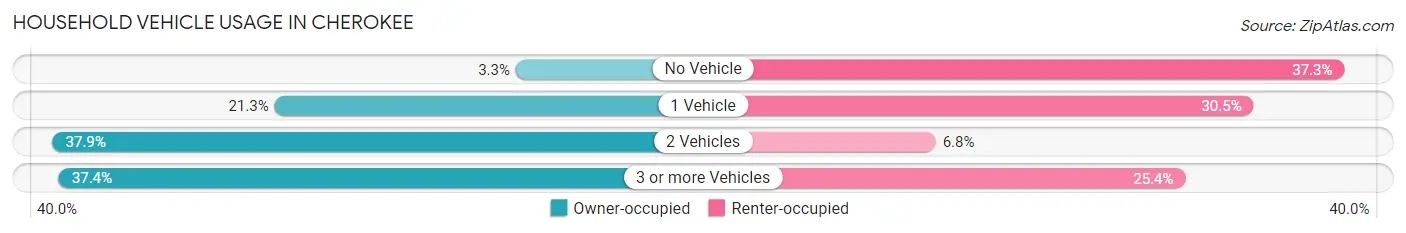
| Vehicles per Household | Owner-occupied | Renter-occupied |
| No Vehicle | 7 (3.3%) | 22 (37.3%) |
| 1 Vehicle | 45 (21.3%) | 18 (30.5%) |
| 2 Vehicles | 80 (37.9%) | 4 (6.8%) |
| 3 or more Vehicles | 79 (37.4%) | 15 (25.4%) |
| Total | 211 (100.0%) | 59 (100.0%) |
Real Estate & Mortgages in Cherokee
Real Estate and Mortgage Overview in Cherokee
| Characteristic | Without Mortgage | With Mortgage |
| Housing Units | 131 | 80 |
| Median Property Value | $49,800 | $98,700 |
| Median Household Income | $31,544 | $0 |
| Monthly Housing Costs | $401 | $0 |
| Real Estate Taxes | $569 | $0 |
Property Value by Mortgage Status in Cherokee
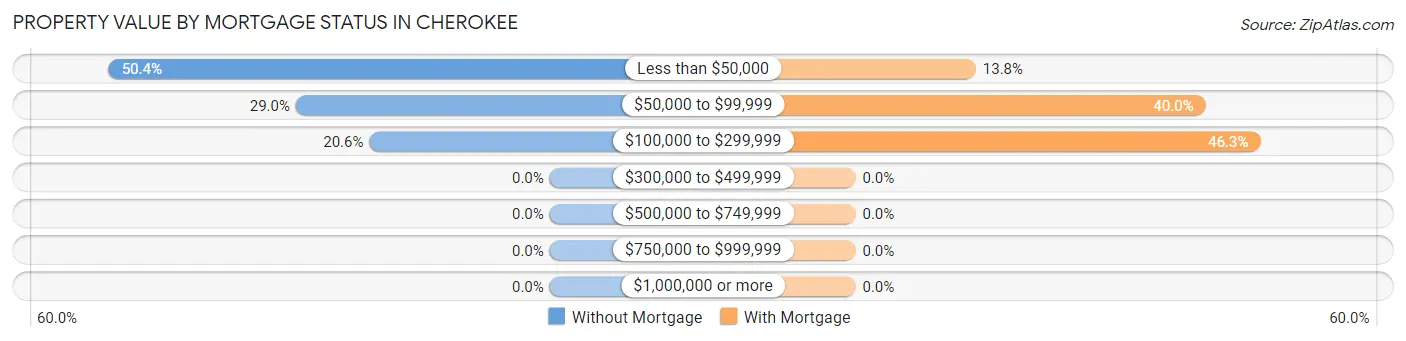
| Property Value | Without Mortgage | With Mortgage |
| Less than $50,000 | 66 (50.4%) | 11 (13.8%) |
| $50,000 to $99,999 | 38 (29.0%) | 32 (40.0%) |
| $100,000 to $299,999 | 27 (20.6%) | 37 (46.3%) |
| $300,000 to $499,999 | 0 (0.0%) | 0 (0.0%) |
| $500,000 to $749,999 | 0 (0.0%) | 0 (0.0%) |
| $750,000 to $999,999 | 0 (0.0%) | 0 (0.0%) |
| $1,000,000 or more | 0 (0.0%) | 0 (0.0%) |
| Total | 131 (100.0%) | 80 (100.0%) |
Household Income by Mortgage Status in Cherokee
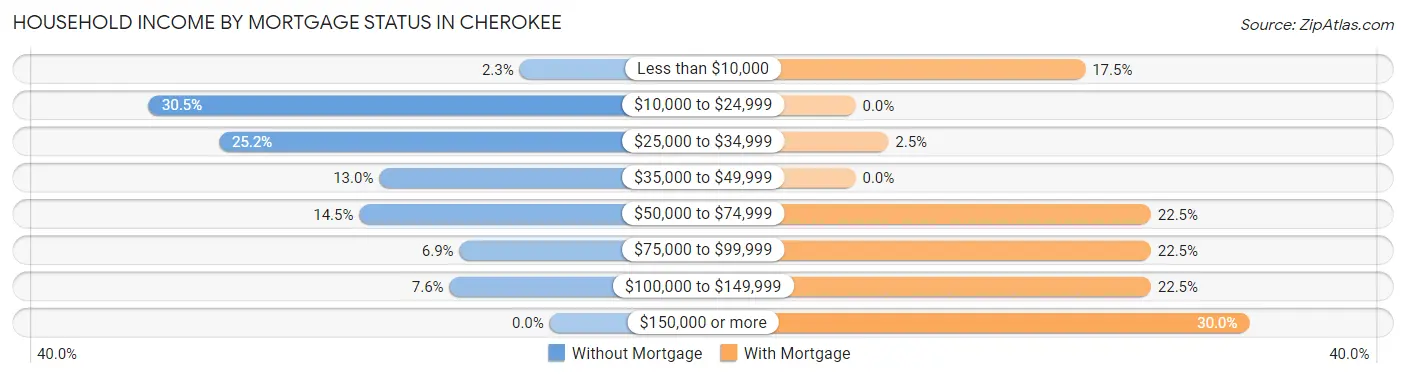
| Household Income | Without Mortgage | With Mortgage |
| Less than $10,000 | 3 (2.3%) | 14 (17.5%) |
| $10,000 to $24,999 | 40 (30.5%) | 0 (0.0%) |
| $25,000 to $34,999 | 33 (25.2%) | 2 (2.5%) |
| $35,000 to $49,999 | 17 (13.0%) | 0 (0.0%) |
| $50,000 to $74,999 | 19 (14.5%) | 18 (22.5%) |
| $75,000 to $99,999 | 9 (6.9%) | 18 (22.5%) |
| $100,000 to $149,999 | 10 (7.6%) | 18 (22.5%) |
| $150,000 or more | 0 (0.0%) | 24 (30.0%) |
| Total | 131 (100.0%) | 80 (100.0%) |
Property Value to Household Income Ratio in Cherokee
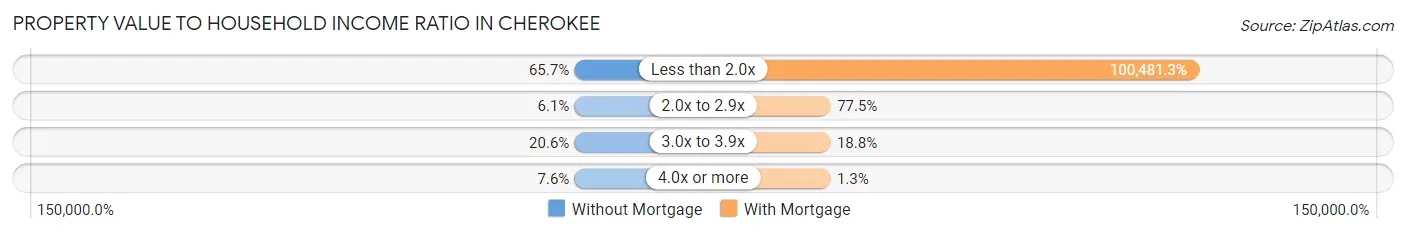
| Value-to-Income Ratio | Without Mortgage | With Mortgage |
| Less than 2.0x | 86 (65.6%) | 80,385 (100,481.2%) |
| 2.0x to 2.9x | 8 (6.1%) | 62 (77.5%) |
| 3.0x to 3.9x | 27 (20.6%) | 15 (18.8%) |
| 4.0x or more | 10 (7.6%) | 1 (1.3%) |
| Total | 131 (100.0%) | 80 (100.0%) |
Real Estate Taxes by Mortgage Status in Cherokee
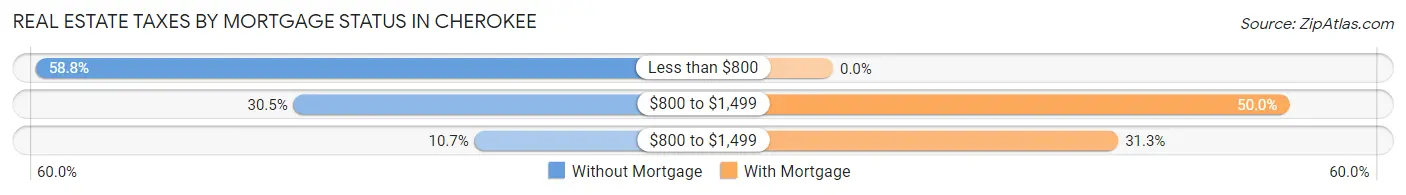
| Property Taxes | Without Mortgage | With Mortgage |
| Less than $800 | 77 (58.8%) | 0 (0.0%) |
| $800 to $1,499 | 40 (30.5%) | 40 (50.0%) |
| $800 to $1,499 | 14 (10.7%) | 25 (31.2%) |
| Total | 131 (100.0%) | 80 (100.0%) |
Health & Disability in Cherokee
Health Insurance Coverage by Age in Cherokee
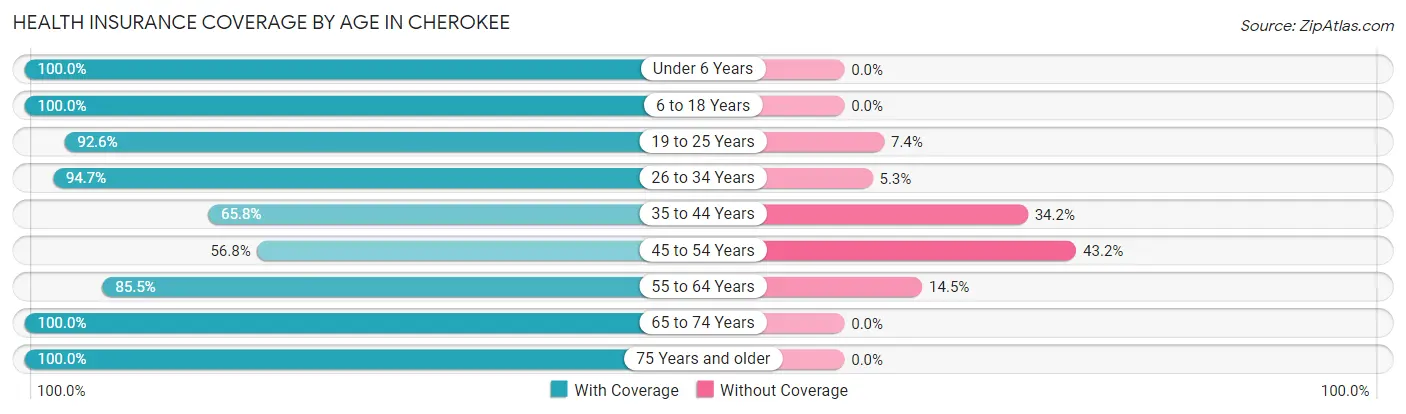
| Age Bracket | With Coverage | Without Coverage |
| Under 6 Years | 42 (100.0%) | 0 (0.0%) |
| 6 to 18 Years | 158 (100.0%) | 0 (0.0%) |
| 19 to 25 Years | 50 (92.6%) | 4 (7.4%) |
| 26 to 34 Years | 54 (94.7%) | 3 (5.3%) |
| 35 to 44 Years | 100 (65.8%) | 52 (34.2%) |
| 45 to 54 Years | 42 (56.8%) | 32 (43.2%) |
| 55 to 64 Years | 53 (85.5%) | 9 (14.5%) |
| 65 to 74 Years | 42 (100.0%) | 0 (0.0%) |
| 75 Years and older | 62 (100.0%) | 0 (0.0%) |
| Total | 603 (85.8%) | 100 (14.2%) |
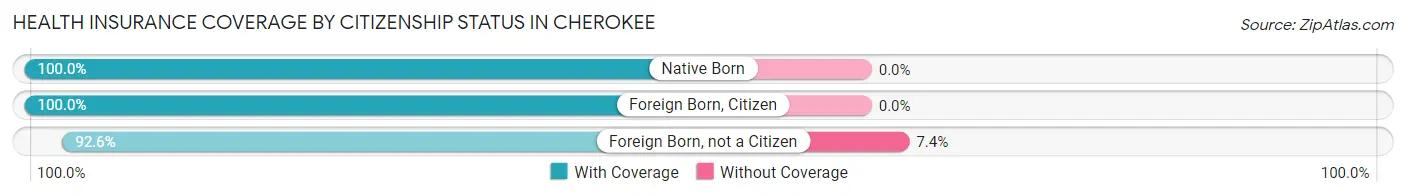
Health Insurance Coverage by Citizenship Status in Cherokee
| Citizenship Status | With Coverage | Without Coverage |
| Native Born | 42 (100.0%) | 0 (0.0%) |
| Foreign Born, Citizen | 158 (100.0%) | 0 (0.0%) |
| Foreign Born, not a Citizen | 50 (92.6%) | 4 (7.4%) |
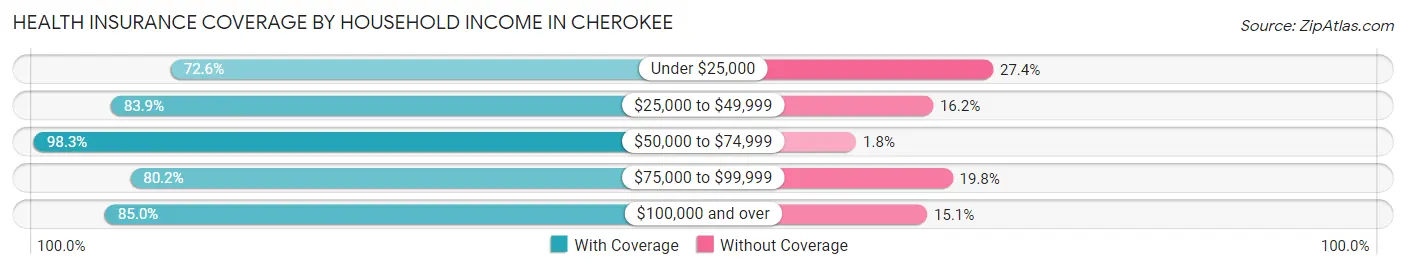
Health Insurance Coverage by Household Income in Cherokee
| Household Income | With Coverage | Without Coverage |
| Under $25,000 | 53 (72.6%) | 20 (27.4%) |
| $25,000 to $49,999 | 218 (83.9%) | 42 (16.2%) |
| $50,000 to $74,999 | 168 (98.3%) | 3 (1.8%) |
| $75,000 to $99,999 | 85 (80.2%) | 21 (19.8%) |
| $100,000 and over | 79 (85.0%) | 14 (15.0%) |
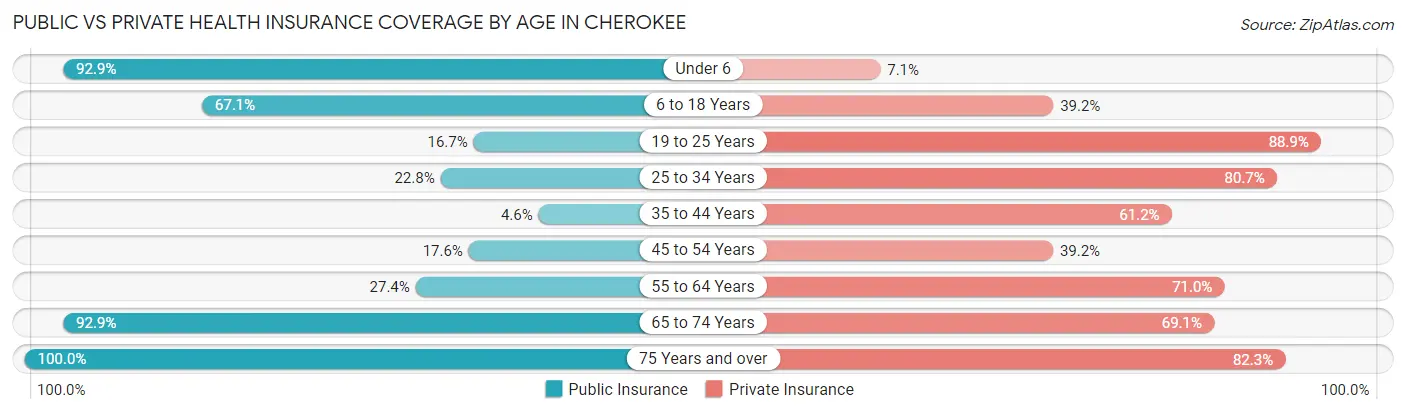
Public vs Private Health Insurance Coverage by Age in Cherokee
| Age Bracket | Public Insurance | Private Insurance |
| Under 6 | 39 (92.9%) | 3 (7.1%) |
| 6 to 18 Years | 106 (67.1%) | 62 (39.2%) |
| 19 to 25 Years | 9 (16.7%) | 48 (88.9%) |
| 25 to 34 Years | 13 (22.8%) | 46 (80.7%) |
| 35 to 44 Years | 7 (4.6%) | 93 (61.2%) |
| 45 to 54 Years | 13 (17.6%) | 29 (39.2%) |
| 55 to 64 Years | 17 (27.4%) | 44 (71.0%) |
| 65 to 74 Years | 39 (92.9%) | 29 (69.1%) |
| 75 Years and over | 62 (100.0%) | 51 (82.3%) |
| Total | 305 (43.4%) | 405 (57.6%) |
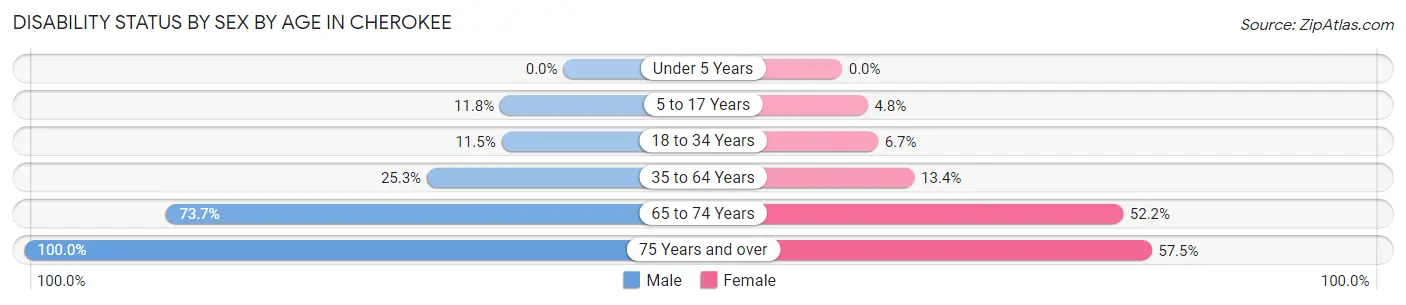
Disability Status by Sex by Age in Cherokee
| Age Bracket | Male | Female |
| Under 5 Years | 0 (0.0%) | 0 (0.0%) |
| 5 to 17 Years | 10 (11.8%) | 3 (4.8%) |
| 18 to 34 Years | 7 (11.5%) | 4 (6.7%) |
| 35 to 64 Years | 39 (25.3%) | 18 (13.4%) |
| 65 to 74 Years | 14 (73.7%) | 12 (52.2%) |
| 75 Years and over | 15 (100.0%) | 27 (57.5%) |
Disability Class by Sex by Age in Cherokee
Disability Class: Hearing Difficulty
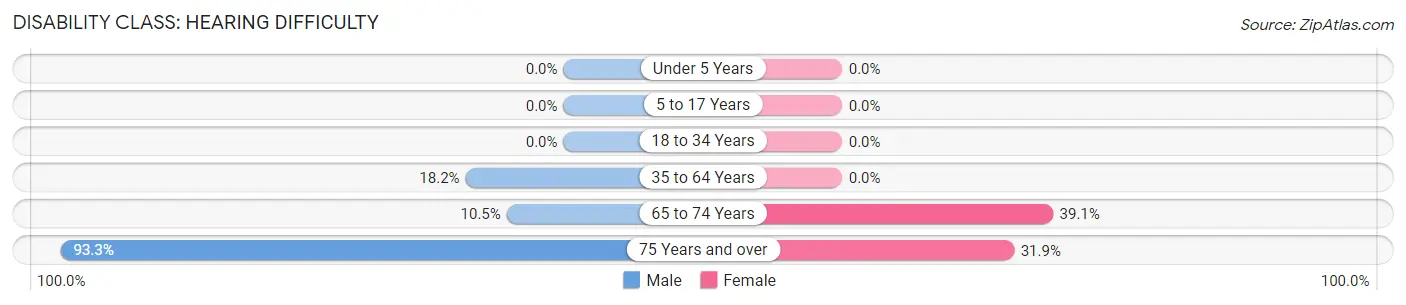
| Age Bracket | Male | Female |
| Under 5 Years | 0 (0.0%) | 0 (0.0%) |
| 5 to 17 Years | 0 (0.0%) | 0 (0.0%) |
| 18 to 34 Years | 0 (0.0%) | 0 (0.0%) |
| 35 to 64 Years | 28 (18.2%) | 0 (0.0%) |
| 65 to 74 Years | 2 (10.5%) | 9 (39.1%) |
| 75 Years and over | 14 (93.3%) | 15 (31.9%) |
Disability Class: Vision Difficulty
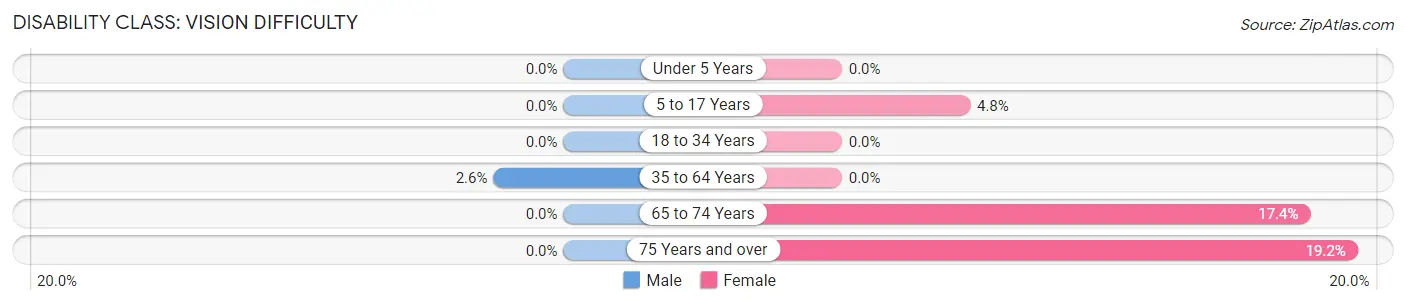
| Age Bracket | Male | Female |
| Under 5 Years | 0 (0.0%) | 0 (0.0%) |
| 5 to 17 Years | 0 (0.0%) | 3 (4.8%) |
| 18 to 34 Years | 0 (0.0%) | 0 (0.0%) |
| 35 to 64 Years | 4 (2.6%) | 0 (0.0%) |
| 65 to 74 Years | 0 (0.0%) | 4 (17.4%) |
| 75 Years and over | 0 (0.0%) | 9 (19.2%) |
Disability Class: Cognitive Difficulty
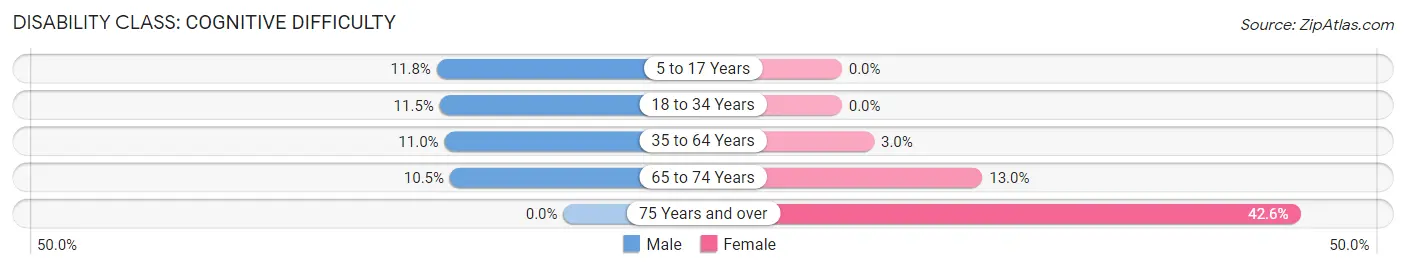
| Age Bracket | Male | Female |
| 5 to 17 Years | 10 (11.8%) | 0 (0.0%) |
| 18 to 34 Years | 7 (11.5%) | 0 (0.0%) |
| 35 to 64 Years | 17 (11.0%) | 4 (3.0%) |
| 65 to 74 Years | 2 (10.5%) | 3 (13.0%) |
| 75 Years and over | 0 (0.0%) | 20 (42.5%) |
Disability Class: Ambulatory Difficulty
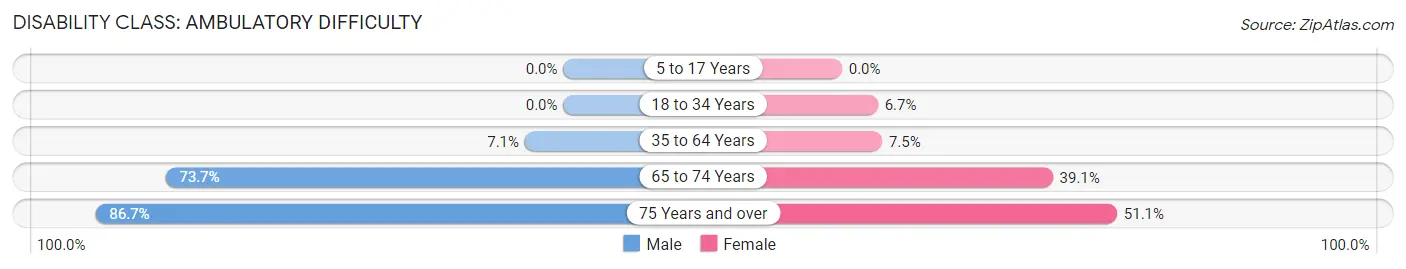
| Age Bracket | Male | Female |
| 5 to 17 Years | 0 (0.0%) | 0 (0.0%) |
| 18 to 34 Years | 0 (0.0%) | 4 (6.7%) |
| 35 to 64 Years | 11 (7.1%) | 10 (7.5%) |
| 65 to 74 Years | 14 (73.7%) | 9 (39.1%) |
| 75 Years and over | 13 (86.7%) | 24 (51.1%) |
Disability Class: Self-Care Difficulty
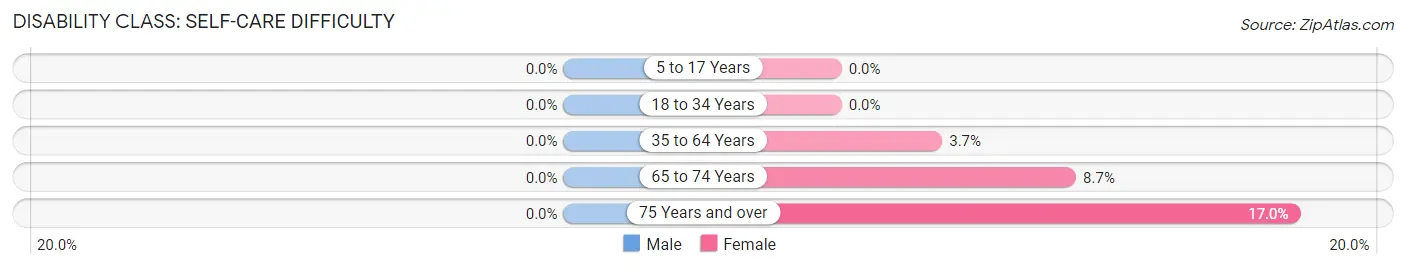
| Age Bracket | Male | Female |
| 5 to 17 Years | 0 (0.0%) | 0 (0.0%) |
| 18 to 34 Years | 0 (0.0%) | 0 (0.0%) |
| 35 to 64 Years | 0 (0.0%) | 5 (3.7%) |
| 65 to 74 Years | 0 (0.0%) | 2 (8.7%) |
| 75 Years and over | 0 (0.0%) | 8 (17.0%) |
Technology Access in Cherokee
Computing Device Access in Cherokee
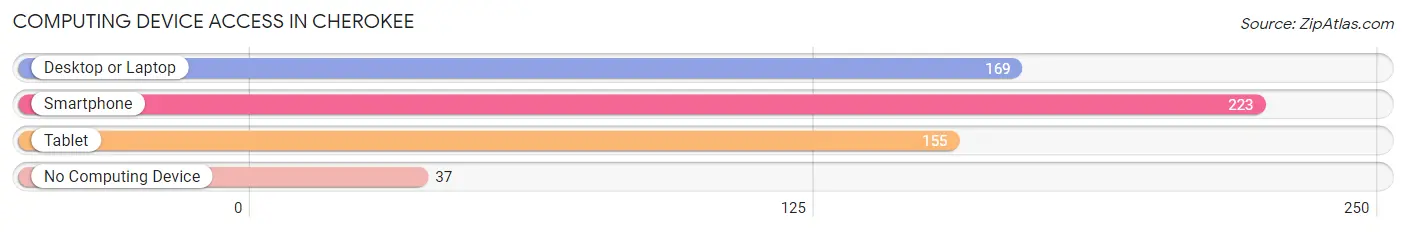
| Device Type | # Households | % Households |
| Desktop or Laptop | 169 | 62.6% |
| Smartphone | 223 | 82.6% |
| Tablet | 155 | 57.4% |
| No Computing Device | 37 | 13.7% |
| Total | 270 | 100.0% |
Internet Access in Cherokee
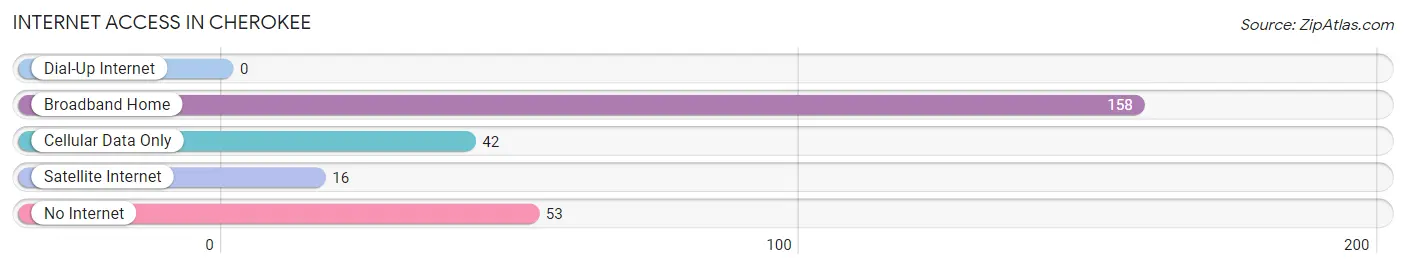
| Internet Type | # Households | % Households |
| Dial-Up Internet | 0 | 0.0% |
| Broadband Home | 158 | 58.5% |
| Cellular Data Only | 42 | 15.6% |
| Satellite Internet | 16 | 5.9% |
| No Internet | 53 | 19.6% |
| Total | 270 | 100.0% |
Cherokee Summary
Cherokee, Kansas is a small town located in the southeastern corner of the state, near the Oklahoma border. It is part of the Cherokee County, and is the county seat. The town was founded in 1867 and has a population of just over 1,000 people.
Geography
Cherokee is located in the southeastern corner of Kansas, near the Oklahoma border. It is part of the Cherokee County, and is the county seat. The town is situated on the banks of the Spring River, which flows through the town. The town is surrounded by rolling hills and prairies, and is located in the Osage Plains region of the state. The climate is generally mild, with hot summers and cold winters.
Economy
Cherokee’s economy is largely based on agriculture. The town is home to several farms, which produce a variety of crops, including wheat, corn, soybeans, and hay. The town also has a few small businesses, including a grocery store, a hardware store, and a few restaurants.
Demographics
As of the 2010 census, the population of Cherokee was 1,039. The racial makeup of the town was 95.3% White, 0.7% African American, 0.3% Native American, 0.2% Asian, 0.1% Pacific Islander, and 3.4% from other races. The median household income was $37,917, and the median family income was $45,625.
History
Cherokee was founded in 1867, when the first settlers arrived in the area. The town was named after the Cherokee Indians, who had once lived in the area. The town was incorporated in 1872, and the first post office was established in 1873.
In the late 19th century, Cherokee was a thriving agricultural community. The town was home to several grain elevators, a flour mill, and a creamery. The town also had a few small businesses, including a hotel, a bank, and a newspaper.
In the early 20th century, the town began to decline. The Great Depression hit the town hard, and many of the businesses closed. The town’s population also began to decline, and by the 1950s, the population had dropped to just over 500 people.
In recent years, the town has seen a resurgence. The population has grown to over 1,000 people, and the town has seen an influx of new businesses. The town is now home to several restaurants, a grocery store, a hardware store, and a few other small businesses.
Cherokee is a small town with a rich history and a bright future. The town is home to a diverse population, and is a great place to live and work. The town is surrounded by rolling hills and prairies, and is located in the Osage Plains region of the state. The town has a strong agricultural economy, and is home to several small businesses. The town is also home to a vibrant community, and is a great place to raise a family.
Common Questions
What is Per Capita Income in Cherokee?
Per Capita income in Cherokee is $21,602.
What is the Median Family Income in Cherokee?
Median Family Income in Cherokee is $62,727.
What is the Median Household income in Cherokee?
Median Household Income in Cherokee is $37,250.
What is Income or Wage Gap in Cherokee?
Income or Wage Gap in Cherokee is 38.4%.
Women in Cherokee earn 61.6 cents for every dollar earned by a man.
What is Family Income Deficit in Cherokee?
Family Income Deficit in Cherokee is $3,564.
Families that are below poverty line in Cherokee earn $3,564 less on average than the poverty threshold level.
What is Inequality or Gini Index in Cherokee?
Inequality or Gini Index in Cherokee is 0.39.
What is the Total Population of Cherokee?
Total Population of Cherokee is 703.
What is the Total Male Population of Cherokee?
Total Male Population of Cherokee is 369.
What is the Total Female Population of Cherokee?
Total Female Population of Cherokee is 334.
What is the Ratio of Males per 100 Females in Cherokee?
There are 110.48 Males per 100 Females in Cherokee.
What is the Ratio of Females per 100 Males in Cherokee?
There are 90.51 Females per 100 Males in Cherokee.
What is the Median Population Age in Cherokee?
Median Population Age in Cherokee is 38.3 Years.
What is the Average Family Size in Cherokee
Average Family Size in Cherokee is 3.6 People.
What is the Average Household Size in Cherokee
Average Household Size in Cherokee is 2.6 People.
How Large is the Labor Force in Cherokee?
There are 346 People in the Labor Forcein in Cherokee.
What is the Percentage of People in the Labor Force in Cherokee?
61.7% of People are in the Labor Force in Cherokee.
What is the Unemployment Rate in Cherokee?
Unemployment Rate in Cherokee is 7.8%.