Chanute, KS Map & Demographics
Chanute Map
Chanute Overview
$28,800
PER CAPITA INCOME
$66,563
AVG FAMILY INCOME
$52,608
AVG HOUSEHOLD INCOME
35.4%
WAGE / INCOME GAP [ % ]
64.6¢/ $1
WAGE / INCOME GAP [ $ ]
0.46
INEQUALITY / GINI INDEX
8,713
TOTAL POPULATION
4,151
MALE POPULATION
4,562
FEMALE POPULATION
90.99
MALES / 100 FEMALES
109.90
FEMALES / 100 MALES
38.0
MEDIAN AGE
2.9
AVG FAMILY SIZE
2.4
AVG HOUSEHOLD SIZE
4,000
LABOR FORCE [ PEOPLE ]
57.4%
PERCENT IN LABOR FORCE
7.2%
UNEMPLOYMENT RATE
Chanute Zip Codes
Chanute Area Codes
Income in Chanute
Income Overview in Chanute
Per Capita Income in Chanute is $28,800, while median incomes of families and households are $66,563 and $52,608 respectively.
| Characteristic | Number | Measure |
| Per Capita Income | 8,713 | $28,800 |
| Median Family Income | 2,214 | $66,563 |
| Mean Family Income | 2,214 | $76,792 |
| Median Household Income | 3,533 | $52,608 |
| Mean Household Income | 3,533 | $66,162 |
| Income Deficit | 2,214 | $0 |
| Wage / Income Gap (%) | 8,713 | 35.45% |
| Wage / Income Gap ($) | 8,713 | 64.55¢ per $1 |
| Gini / Inequality Index | 8,713 | 0.46 |
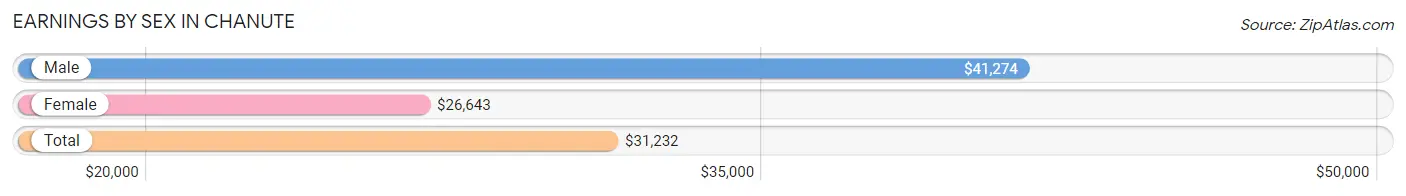
Earnings by Sex in Chanute
Average Earnings in Chanute are $31,232, $41,274 for men and $26,643 for women, a difference of 35.4%.
| Sex | Number | Average Earnings |
| Male | 2,029 (46.7%) | $41,274 |
| Female | 2,313 (53.3%) | $26,643 |
| Total | 4,342 (100.0%) | $31,232 |
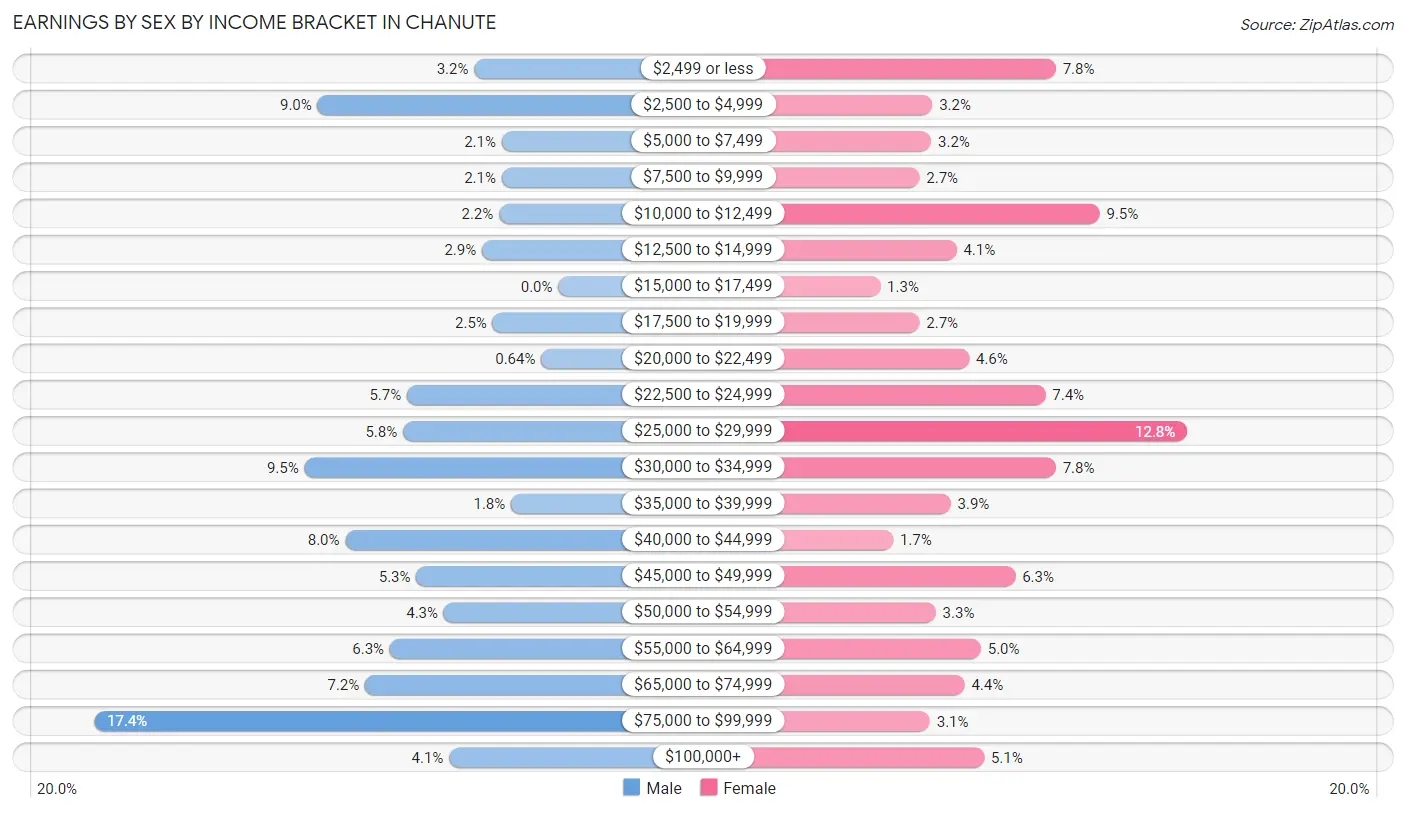
Earnings by Sex by Income Bracket in Chanute
The most common earnings brackets in Chanute are $75,000 to $99,999 for men (353 | 17.4%) and $25,000 to $29,999 for women (295 | 12.8%).
| Income | Male | Female |
| $2,499 or less | 64 (3.2%) | 181 (7.8%) |
| $2,500 to $4,999 | 183 (9.0%) | 74 (3.2%) |
| $5,000 to $7,499 | 43 (2.1%) | 73 (3.2%) |
| $7,500 to $9,999 | 43 (2.1%) | 63 (2.7%) |
| $10,000 to $12,499 | 45 (2.2%) | 219 (9.5%) |
| $12,500 to $14,999 | 58 (2.9%) | 95 (4.1%) |
| $15,000 to $17,499 | 0 (0.0%) | 29 (1.3%) |
| $17,500 to $19,999 | 50 (2.5%) | 63 (2.7%) |
| $20,000 to $22,499 | 13 (0.6%) | 106 (4.6%) |
| $22,500 to $24,999 | 115 (5.7%) | 172 (7.4%) |
| $25,000 to $29,999 | 118 (5.8%) | 295 (12.8%) |
| $30,000 to $34,999 | 193 (9.5%) | 181 (7.8%) |
| $35,000 to $39,999 | 36 (1.8%) | 90 (3.9%) |
| $40,000 to $44,999 | 162 (8.0%) | 40 (1.7%) |
| $45,000 to $49,999 | 108 (5.3%) | 146 (6.3%) |
| $50,000 to $54,999 | 87 (4.3%) | 77 (3.3%) |
| $55,000 to $64,999 | 128 (6.3%) | 116 (5.0%) |
| $65,000 to $74,999 | 147 (7.2%) | 102 (4.4%) |
| $75,000 to $99,999 | 353 (17.4%) | 72 (3.1%) |
| $100,000+ | 83 (4.1%) | 119 (5.1%) |
| Total | 2,029 (100.0%) | 2,313 (100.0%) |
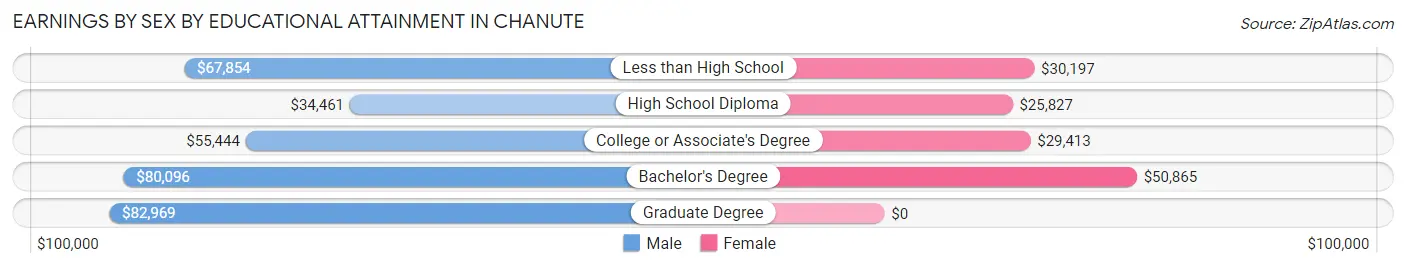
Earnings by Sex by Educational Attainment in Chanute
Average earnings in Chanute are $46,765 for men and $30,084 for women, a difference of 35.7%. Men with an educational attainment of graduate degree enjoy the highest average annual earnings of $82,969, while those with high school diploma education earn the least with $34,461. Women with an educational attainment of bachelor's degree earn the most with the average annual earnings of $50,865, while those with high school diploma education have the smallest earnings of $25,827.
| Educational Attainment | Male Income | Female Income |
| Less than High School | $67,854 | $30,197 |
| High School Diploma | $34,461 | $25,827 |
| College or Associate's Degree | $55,444 | $29,413 |
| Bachelor's Degree | $80,096 | $50,865 |
| Graduate Degree | $82,969 | $0 |
| Total | $46,765 | $30,084 |
Family Income in Chanute
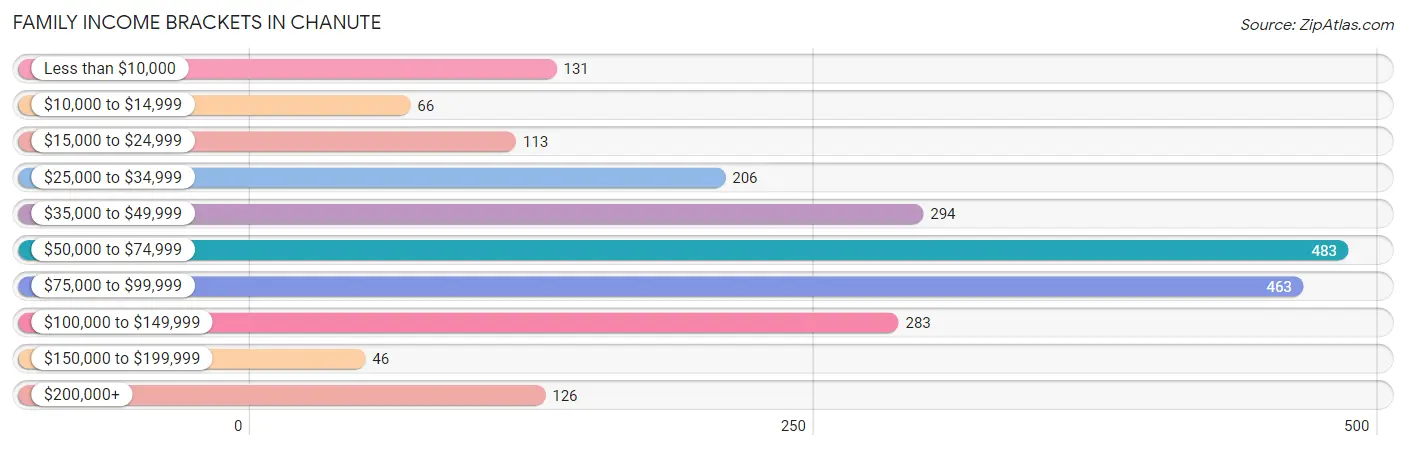
Family Income Brackets in Chanute
According to the Chanute family income data, there are 483 families falling into the $50,000 to $74,999 income range, which is the most common income bracket and makes up 21.8% of all families. Conversely, the $150,000 to $199,999 income bracket is the least frequent group with only 46 families (2.1%) belonging to this category.
| Income Bracket | # Families | % Families |
| Less than $10,000 | 131 | 5.9% |
| $10,000 to $14,999 | 66 | 3.0% |
| $15,000 to $24,999 | 113 | 5.1% |
| $25,000 to $34,999 | 206 | 9.3% |
| $35,000 to $49,999 | 294 | 13.3% |
| $50,000 to $74,999 | 483 | 21.8% |
| $75,000 to $99,999 | 463 | 20.9% |
| $100,000 to $149,999 | 283 | 12.8% |
| $150,000 to $199,999 | 46 | 2.1% |
| $200,000+ | 126 | 5.7% |
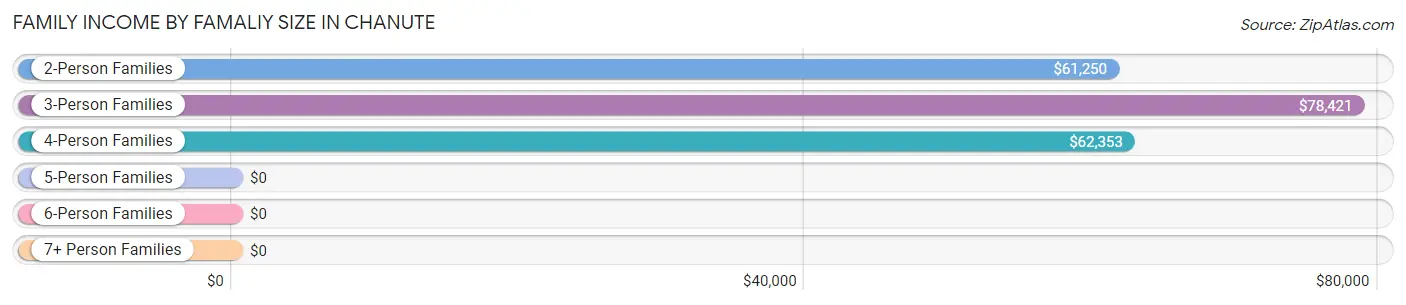
Family Income by Famaliy Size in Chanute
3-person families (432 | 19.5%) account for the highest median family income in Chanute with $78,421 per family, while 2-person families (1,182 | 53.4%) have the highest median income of $30,625 per family member.
| Income Bracket | # Families | Median Income |
| 2-Person Families | 1,182 (53.4%) | $61,250 |
| 3-Person Families | 432 (19.5%) | $78,421 |
| 4-Person Families | 400 (18.1%) | $62,353 |
| 5-Person Families | 148 (6.7%) | $0 |
| 6-Person Families | 8 (0.4%) | $0 |
| 7+ Person Families | 44 (2.0%) | $0 |
| Total | 2,214 (100.0%) | $66,563 |
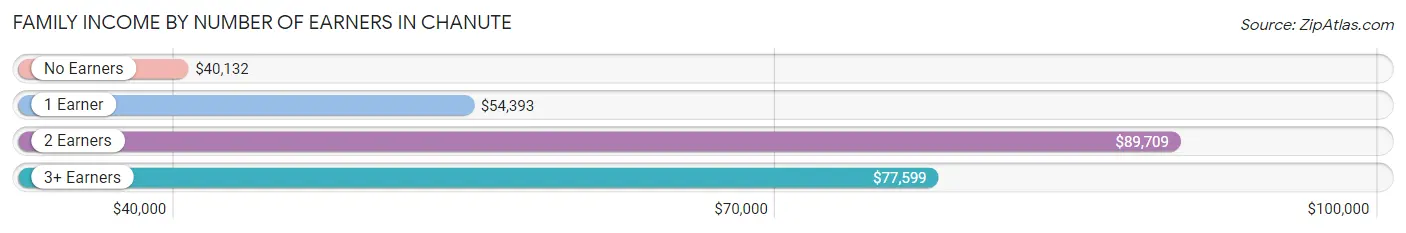
Family Income by Number of Earners in Chanute
The median family income in Chanute is $66,563, with families comprising 2 earners (670) having the highest median family income of $89,709, while families with no earners (460) have the lowest median family income of $40,132, accounting for 30.3% and 20.8% of families, respectively.
| Number of Earners | # Families | Median Income |
| No Earners | 460 (20.8%) | $40,132 |
| 1 Earner | 937 (42.3%) | $54,393 |
| 2 Earners | 670 (30.3%) | $89,709 |
| 3+ Earners | 147 (6.6%) | $77,599 |
| Total | 2,214 (100.0%) | $66,563 |
Household Income in Chanute
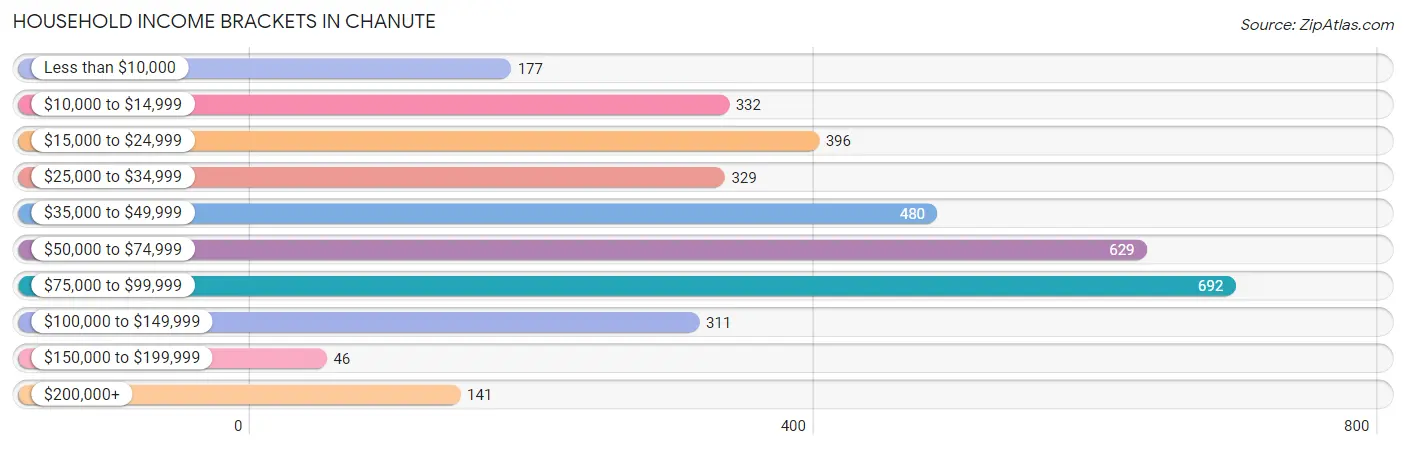
Household Income Brackets in Chanute
With 692 households falling in the category, the $75,000 to $99,999 income range is the most frequent in Chanute, accounting for 19.6% of all households. In contrast, only 46 households (1.3%) fall into the $150,000 to $199,999 income bracket, making it the least populous group.
| Income Bracket | # Households | % Households |
| Less than $10,000 | 177 | 5.0% |
| $10,000 to $14,999 | 332 | 9.4% |
| $15,000 to $24,999 | 396 | 11.2% |
| $25,000 to $34,999 | 329 | 9.3% |
| $35,000 to $49,999 | 480 | 13.6% |
| $50,000 to $74,999 | 629 | 17.8% |
| $75,000 to $99,999 | 692 | 19.6% |
| $100,000 to $149,999 | 311 | 8.8% |
| $150,000 to $199,999 | 46 | 1.3% |
| $200,000+ | 141 | 4.0% |
Household Income by Householder Age in Chanute
The median household income in Chanute is $52,608, with the highest median household income of $61,441 found in the 25 to 44 years age bracket for the primary householder. A total of 1,046 households (29.6%) fall into this category. Meanwhile, the 15 to 24 years age bracket for the primary householder has the lowest median household income of $0, with 179 households (5.1%) in this group.
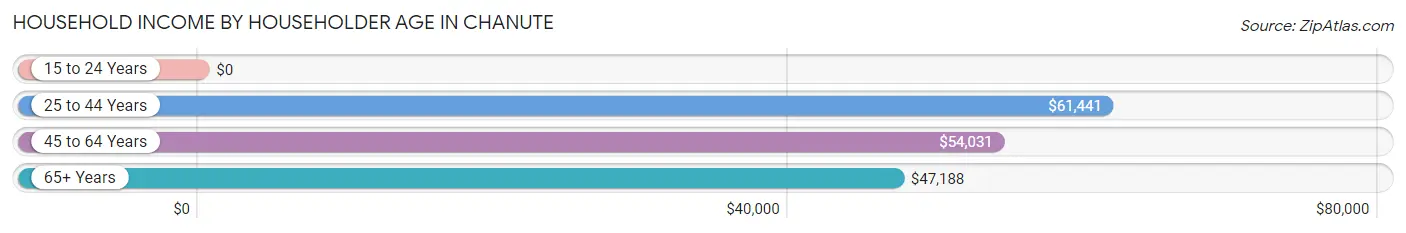
| Income Bracket | # Households | Median Income |
| 15 to 24 Years | 179 (5.1%) | $0 |
| 25 to 44 Years | 1,046 (29.6%) | $61,441 |
| 45 to 64 Years | 1,228 (34.8%) | $54,031 |
| 65+ Years | 1,080 (30.6%) | $47,188 |
| Total | 3,533 (100.0%) | $52,608 |
Poverty in Chanute
Income Below Poverty by Sex and Age in Chanute
With 18.0% poverty level for males and 19.5% for females among the residents of Chanute, 15 year old males and 18 to 24 year old females are the most vulnerable to poverty, with 24 males (80.0%) and 105 females (37.6%) in their respective age groups living below the poverty level.
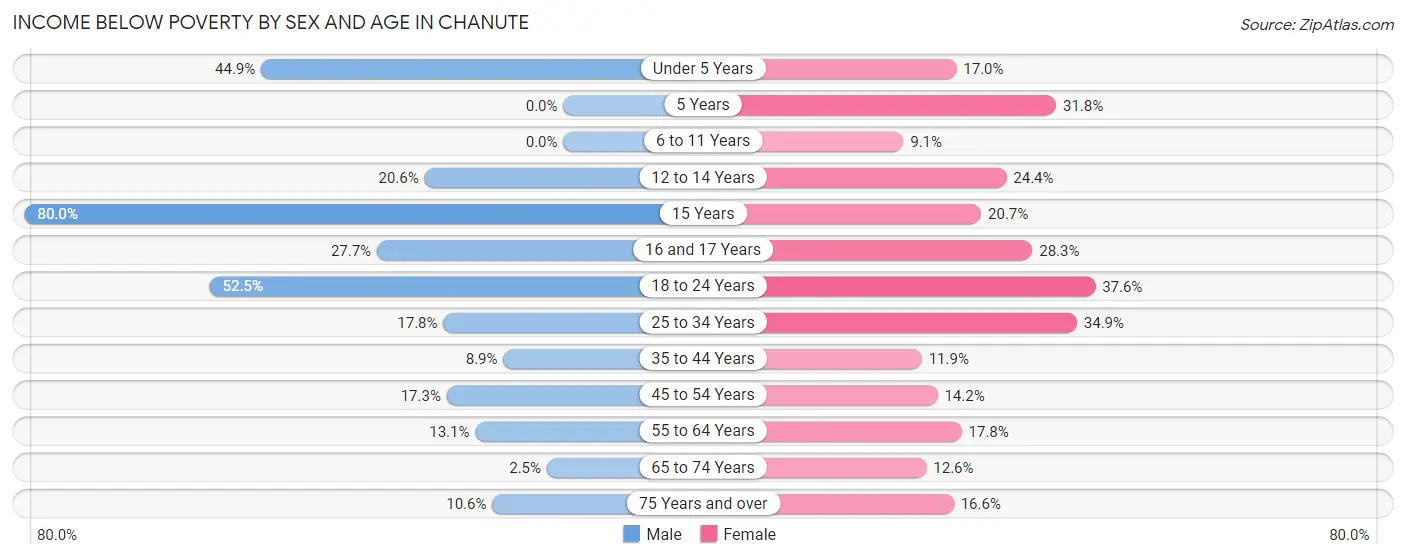
| Age Bracket | Male | Female |
| Under 5 Years | 114 (44.9%) | 33 (17.0%) |
| 5 Years | 0 (0.0%) | 21 (31.8%) |
| 6 to 11 Years | 0 (0.0%) | 23 (9.1%) |
| 12 to 14 Years | 74 (20.6%) | 55 (24.4%) |
| 15 Years | 24 (80.0%) | 12 (20.7%) |
| 16 and 17 Years | 49 (27.7%) | 58 (28.3%) |
| 18 to 24 Years | 146 (52.5%) | 105 (37.6%) |
| 25 to 34 Years | 85 (17.8%) | 170 (34.9%) |
| 35 to 44 Years | 41 (8.9%) | 71 (11.9%) |
| 45 to 54 Years | 79 (17.3%) | 77 (14.2%) |
| 55 to 64 Years | 65 (13.1%) | 92 (17.8%) |
| 65 to 74 Years | 11 (2.5%) | 73 (12.6%) |
| 75 Years and over | 21 (10.5%) | 61 (16.6%) |
| Total | 709 (18.0%) | 851 (19.5%) |
Income Above Poverty by Sex and Age in Chanute
According to the poverty statistics in Chanute, males aged 5 years and females aged 6 to 11 years are the age groups that are most secure financially, with 100.0% of males and 90.9% of females in these age groups living above the poverty line.
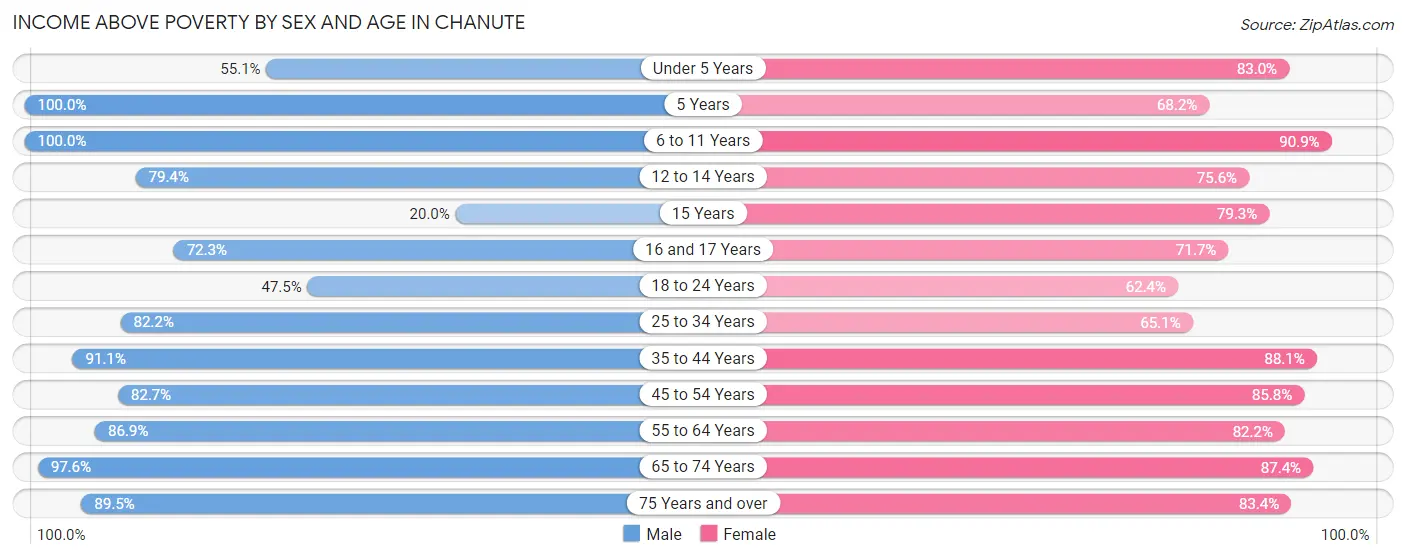
| Age Bracket | Male | Female |
| Under 5 Years | 140 (55.1%) | 161 (83.0%) |
| 5 Years | 76 (100.0%) | 45 (68.2%) |
| 6 to 11 Years | 229 (100.0%) | 229 (90.9%) |
| 12 to 14 Years | 285 (79.4%) | 170 (75.6%) |
| 15 Years | 6 (20.0%) | 46 (79.3%) |
| 16 and 17 Years | 128 (72.3%) | 147 (71.7%) |
| 18 to 24 Years | 132 (47.5%) | 174 (62.4%) |
| 25 to 34 Years | 392 (82.2%) | 317 (65.1%) |
| 35 to 44 Years | 419 (91.1%) | 527 (88.1%) |
| 45 to 54 Years | 377 (82.7%) | 465 (85.8%) |
| 55 to 64 Years | 432 (86.9%) | 425 (82.2%) |
| 65 to 74 Years | 438 (97.6%) | 508 (87.4%) |
| 75 Years and over | 178 (89.4%) | 306 (83.4%) |
| Total | 3,232 (82.0%) | 3,520 (80.5%) |
Income Below Poverty Among Married-Couple Families in Chanute
The poverty statistics for married-couple families in Chanute show that 8.4% or 119 of the total 1,415 families live below the poverty line. Families with no children have the highest poverty rate of 10.0%, comprising of 87 families. On the other hand, families with 3 or 4 children have the lowest poverty rate of 0.0%, which includes 0 families.
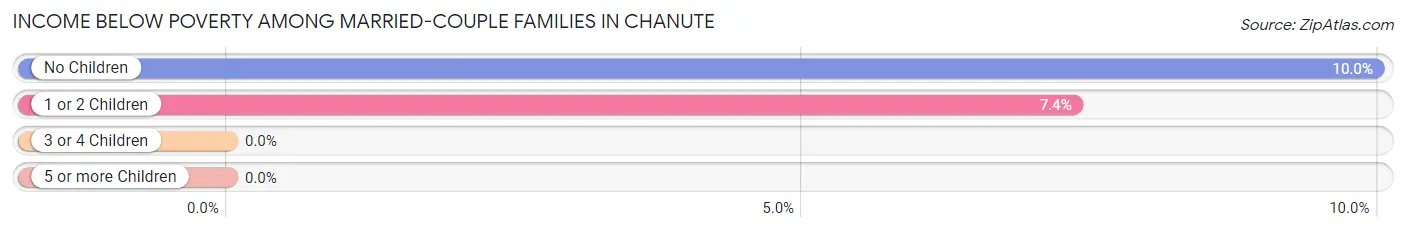
| Children | Above Poverty | Below Poverty |
| No Children | 785 (90.0%) | 87 (10.0%) |
| 1 or 2 Children | 403 (92.6%) | 32 (7.4%) |
| 3 or 4 Children | 108 (100.0%) | 0 (0.0%) |
| 5 or more Children | 0 (0.0%) | 0 (0.0%) |
| Total | 1,296 (91.6%) | 119 (8.4%) |
Income Below Poverty Among Single-Parent Households in Chanute
According to the poverty data in Chanute, 10.3% or 26 single-father households and 32.2% or 176 single-mother households are living below the poverty line. Among single-father households, those with 1 or 2 children have the highest poverty rate, with 26 households (13.3%) experiencing poverty. Likewise, among single-mother households, those with 3 or 4 children have the highest poverty rate, with 91 households (56.2%) falling below the poverty line.
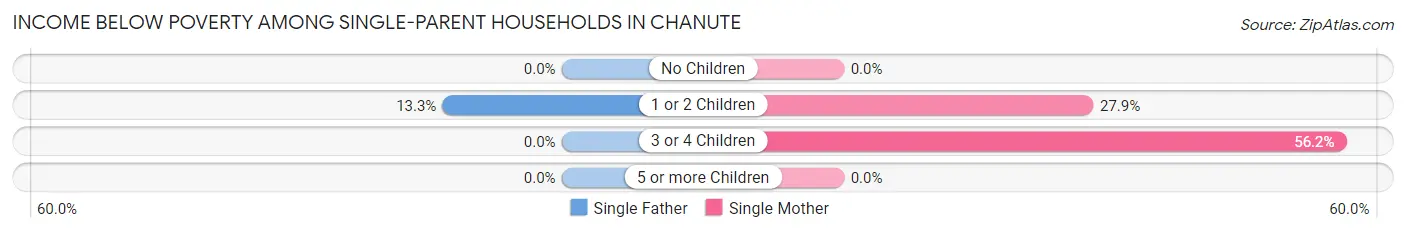
| Children | Single Father | Single Mother |
| No Children | 0 (0.0%) | 0 (0.0%) |
| 1 or 2 Children | 26 (13.3%) | 85 (27.9%) |
| 3 or 4 Children | 0 (0.0%) | 91 (56.2%) |
| 5 or more Children | 0 (0.0%) | 0 (0.0%) |
| Total | 26 (10.3%) | 176 (32.2%) |
Income Below Poverty Among Married-Couple vs Single-Parent Households in Chanute
The poverty data for Chanute shows that 119 of the married-couple family households (8.4%) and 202 of the single-parent households (25.3%) are living below the poverty level. Within the married-couple family households, those with no children have the highest poverty rate, with 87 households (10.0%) falling below the poverty line. Among the single-parent households, those with 3 or 4 children have the highest poverty rate, with 91 household (48.9%) living below poverty.
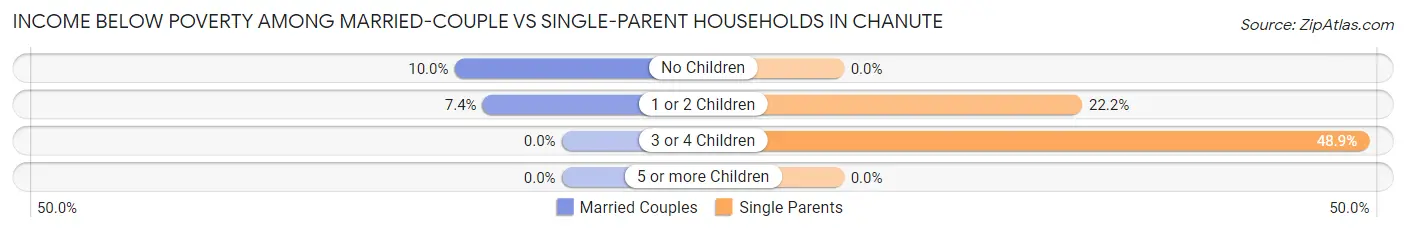
| Children | Married-Couple Families | Single-Parent Households |
| No Children | 87 (10.0%) | 0 (0.0%) |
| 1 or 2 Children | 32 (7.4%) | 111 (22.2%) |
| 3 or 4 Children | 0 (0.0%) | 91 (48.9%) |
| 5 or more Children | 0 (0.0%) | 0 (0.0%) |
| Total | 119 (8.4%) | 202 (25.3%) |
Race in Chanute
The most populous races in Chanute are White / Caucasian (8,248 | 94.7%), Hispanic or Latino (651 | 7.5%), and Two or more Races (307 | 3.5%).
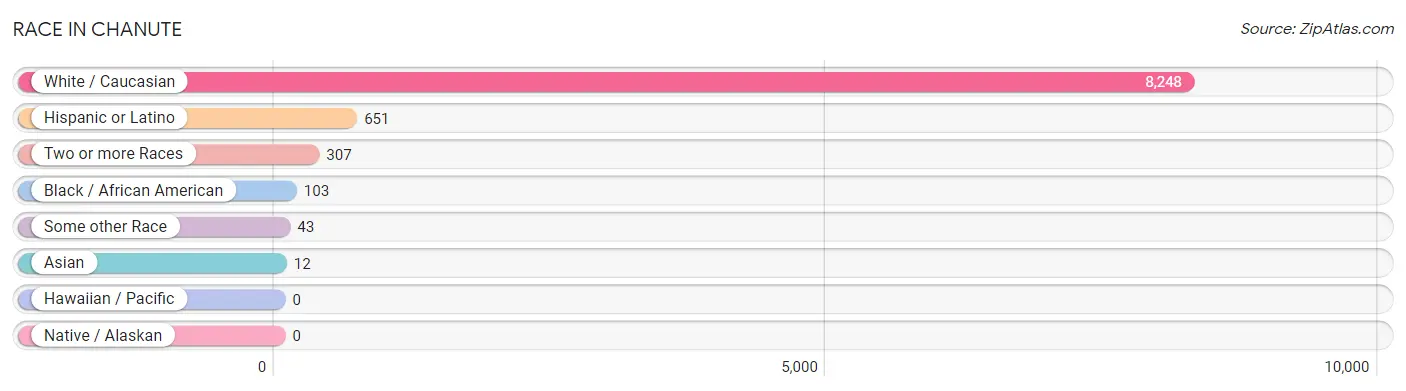
| Race | # Population | % Population |
| Asian | 12 | 0.1% |
| Black / African American | 103 | 1.2% |
| Hawaiian / Pacific | 0 | 0.0% |
| Hispanic or Latino | 651 | 7.5% |
| Native / Alaskan | 0 | 0.0% |
| White / Caucasian | 8,248 | 94.7% |
| Two or more Races | 307 | 3.5% |
| Some other Race | 43 | 0.5% |
| Total | 8,713 | 100.0% |
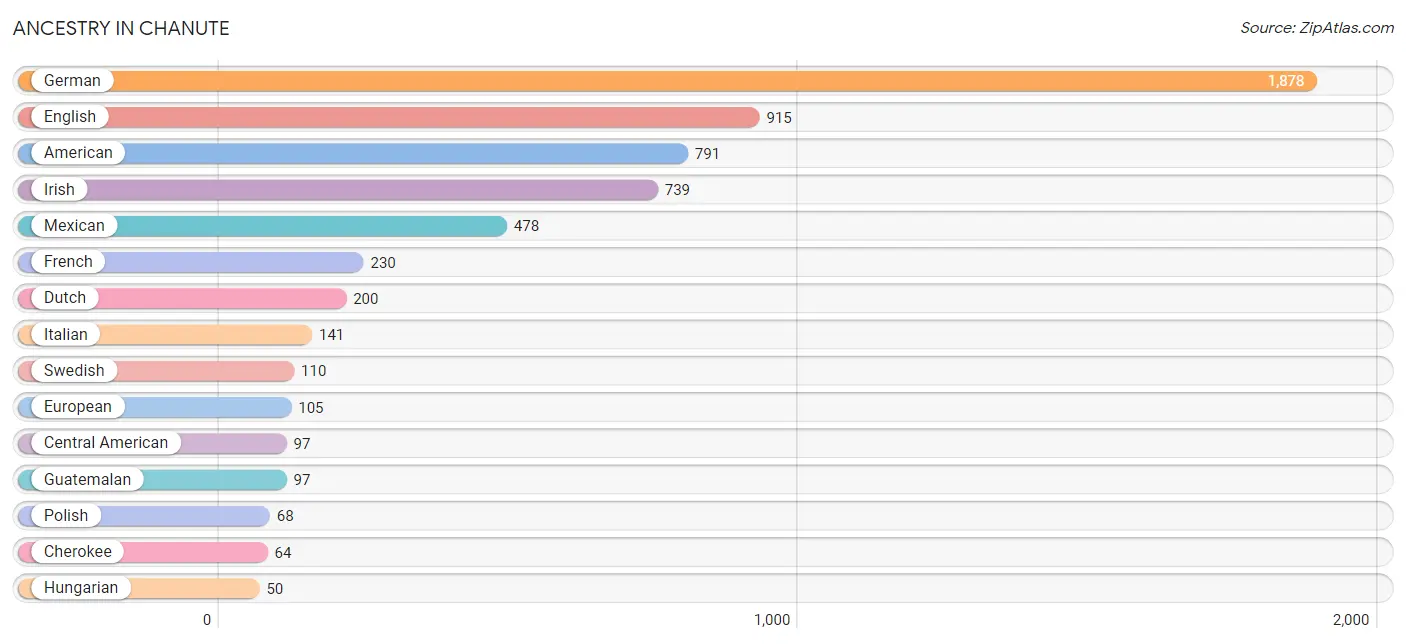
Ancestry in Chanute
The most populous ancestries reported in Chanute are German (1,878 | 21.5%), English (915 | 10.5%), American (791 | 9.1%), Irish (739 | 8.5%), and Mexican (478 | 5.5%), together accounting for 55.1% of all Chanute residents.
| Ancestry | # Population | % Population |
| African | 15 | 0.2% |
| American | 791 | 9.1% |
| Bhutanese | 6 | 0.1% |
| Brazilian | 10 | 0.1% |
| British | 23 | 0.3% |
| Burmese | 17 | 0.2% |
| Central American | 97 | 1.1% |
| Cherokee | 64 | 0.7% |
| Choctaw | 26 | 0.3% |
| Cuban | 7 | 0.1% |
| Danish | 11 | 0.1% |
| Dutch | 200 | 2.3% |
| English | 915 | 10.5% |
| European | 105 | 1.2% |
| French | 230 | 2.6% |
| French Canadian | 15 | 0.2% |
| German | 1,878 | 21.5% |
| Guatemalan | 97 | 1.1% |
| Hungarian | 50 | 0.6% |
| Irish | 739 | 8.5% |
| Italian | 141 | 1.6% |
| Jamaican | 6 | 0.1% |
| Mexican | 478 | 5.5% |
| Norwegian | 4 | 0.1% |
| Polish | 68 | 0.8% |
| Puerto Rican | 6 | 0.1% |
| Scotch-Irish | 27 | 0.3% |
| Scottish | 20 | 0.2% |
| Spanish | 44 | 0.5% |
| Subsaharan African | 21 | 0.2% |
| Sudanese | 6 | 0.1% |
| Swedish | 110 | 1.3% |
| Swiss | 20 | 0.2% |
| Welsh | 22 | 0.3% | View All 34 Rows |
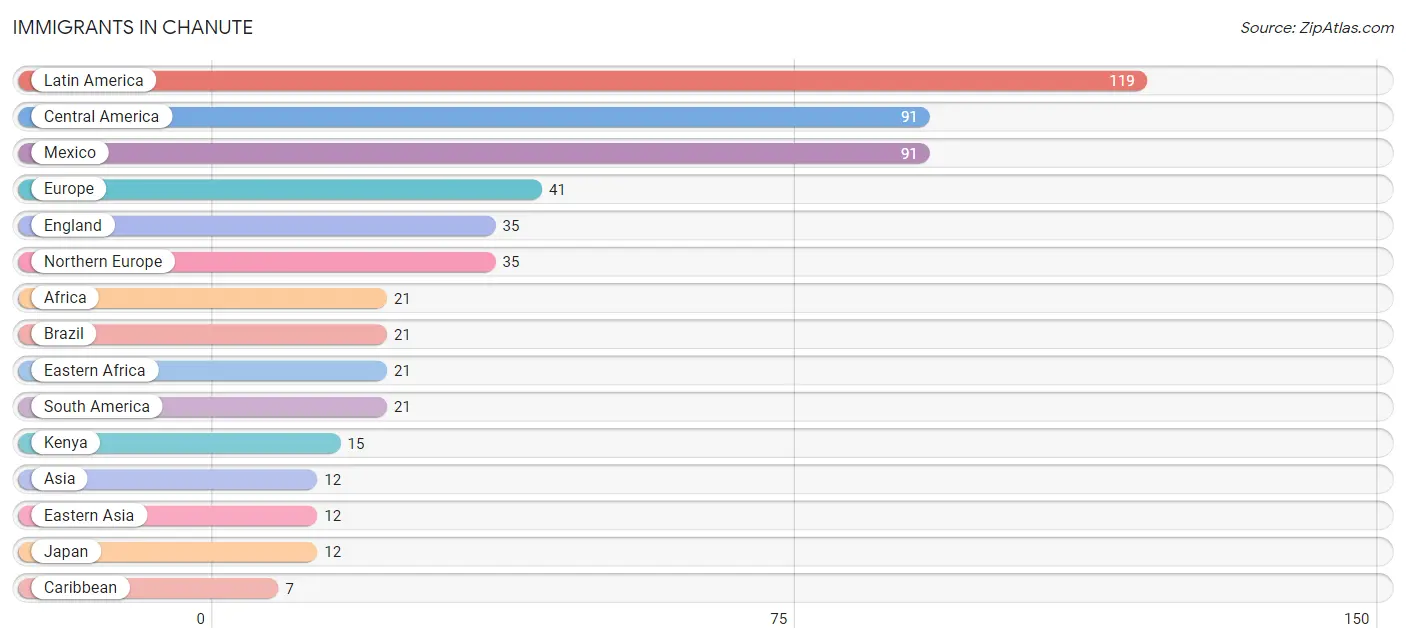
Immigrants in Chanute
The most numerous immigrant groups reported in Chanute came from Latin America (119 | 1.4%), Central America (91 | 1.0%), Mexico (91 | 1.0%), Europe (41 | 0.5%), and England (35 | 0.4%), together accounting for 4.3% of all Chanute residents.
| Immigration Origin | # Population | % Population |
| Africa | 21 | 0.2% |
| Asia | 12 | 0.1% |
| Brazil | 21 | 0.2% |
| Caribbean | 7 | 0.1% |
| Central America | 91 | 1.0% |
| Cuba | 7 | 0.1% |
| Eastern Africa | 21 | 0.2% |
| Eastern Asia | 12 | 0.1% |
| England | 35 | 0.4% |
| Europe | 41 | 0.5% |
| Germany | 6 | 0.1% |
| Japan | 12 | 0.1% |
| Kenya | 15 | 0.2% |
| Latin America | 119 | 1.4% |
| Mexico | 91 | 1.0% |
| Northern Europe | 35 | 0.4% |
| South America | 21 | 0.2% |
| Western Europe | 6 | 0.1% | View All 18 Rows |
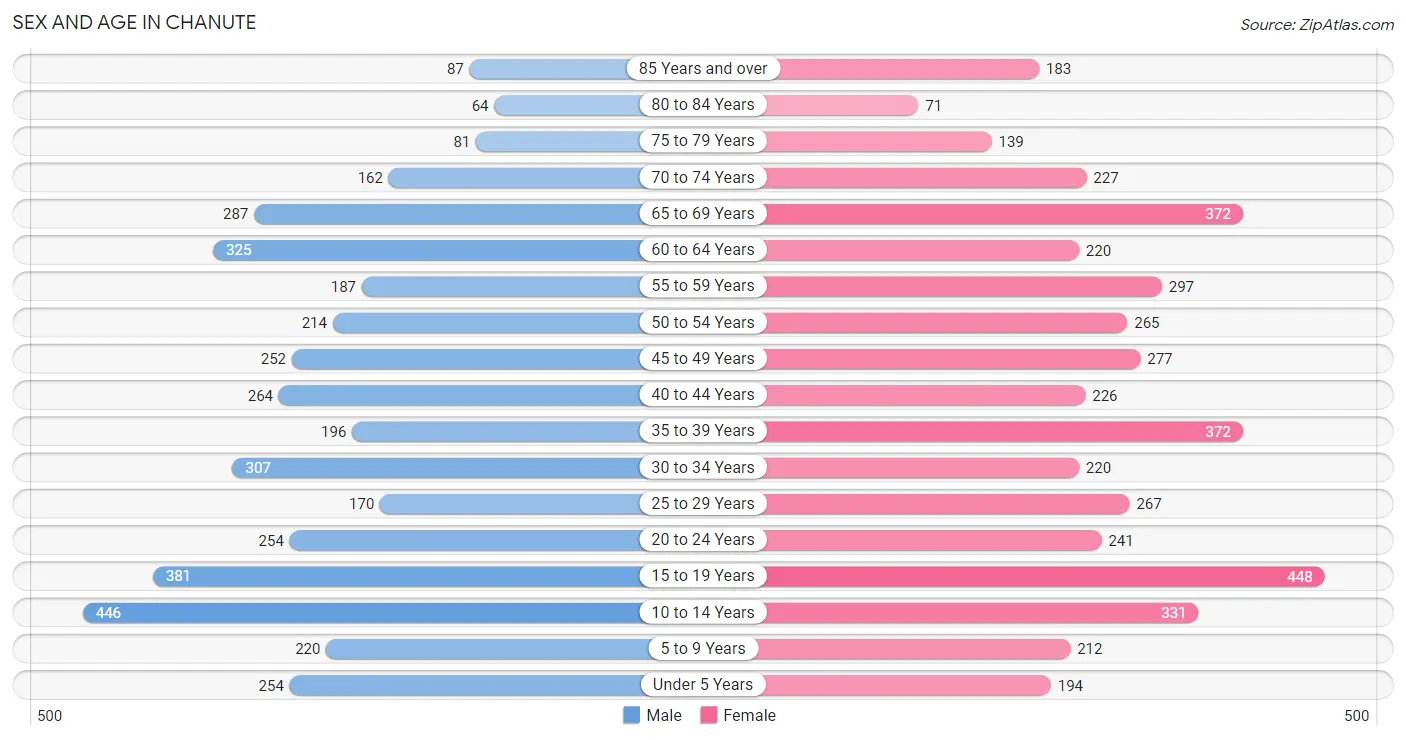
Sex and Age in Chanute
Sex and Age in Chanute
The most populous age groups in Chanute are 10 to 14 Years (446 | 10.7%) for men and 15 to 19 Years (448 | 9.8%) for women.
| Age Bracket | Male | Female |
| Under 5 Years | 254 (6.1%) | 194 (4.3%) |
| 5 to 9 Years | 220 (5.3%) | 212 (4.6%) |
| 10 to 14 Years | 446 (10.7%) | 331 (7.3%) |
| 15 to 19 Years | 381 (9.2%) | 448 (9.8%) |
| 20 to 24 Years | 254 (6.1%) | 241 (5.3%) |
| 25 to 29 Years | 170 (4.1%) | 267 (5.9%) |
| 30 to 34 Years | 307 (7.4%) | 220 (4.8%) |
| 35 to 39 Years | 196 (4.7%) | 372 (8.2%) |
| 40 to 44 Years | 264 (6.4%) | 226 (5.0%) |
| 45 to 49 Years | 252 (6.1%) | 277 (6.1%) |
| 50 to 54 Years | 214 (5.2%) | 265 (5.8%) |
| 55 to 59 Years | 187 (4.5%) | 297 (6.5%) |
| 60 to 64 Years | 325 (7.8%) | 220 (4.8%) |
| 65 to 69 Years | 287 (6.9%) | 372 (8.2%) |
| 70 to 74 Years | 162 (3.9%) | 227 (5.0%) |
| 75 to 79 Years | 81 (1.9%) | 139 (3.0%) |
| 80 to 84 Years | 64 (1.5%) | 71 (1.6%) |
| 85 Years and over | 87 (2.1%) | 183 (4.0%) |
| Total | 4,151 (100.0%) | 4,562 (100.0%) |
Families and Households in Chanute
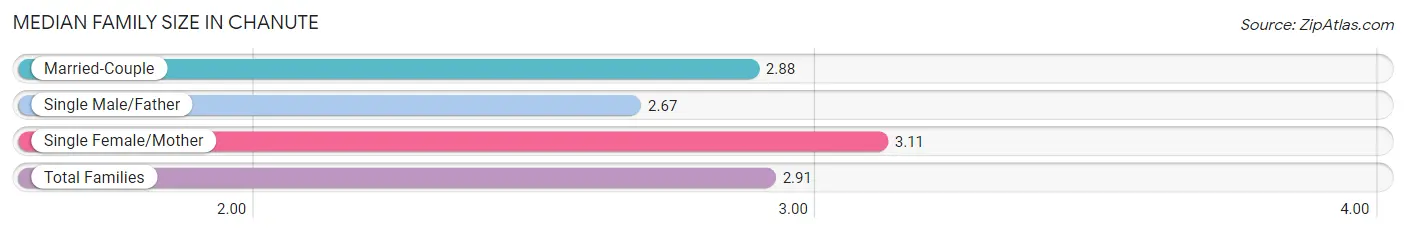
Median Family Size in Chanute
The median family size in Chanute is 2.91 persons per family, with single female/mother families (547 | 24.7%) accounting for the largest median family size of 3.11 persons per family. On the other hand, single male/father families (252 | 11.4%) represent the smallest median family size with 2.67 persons per family.
| Family Type | # Families | Family Size |
| Married-Couple | 1,415 (63.9%) | 2.88 |
| Single Male/Father | 252 (11.4%) | 2.67 |
| Single Female/Mother | 547 (24.7%) | 3.11 |
| Total Families | 2,214 (100.0%) | 2.91 |
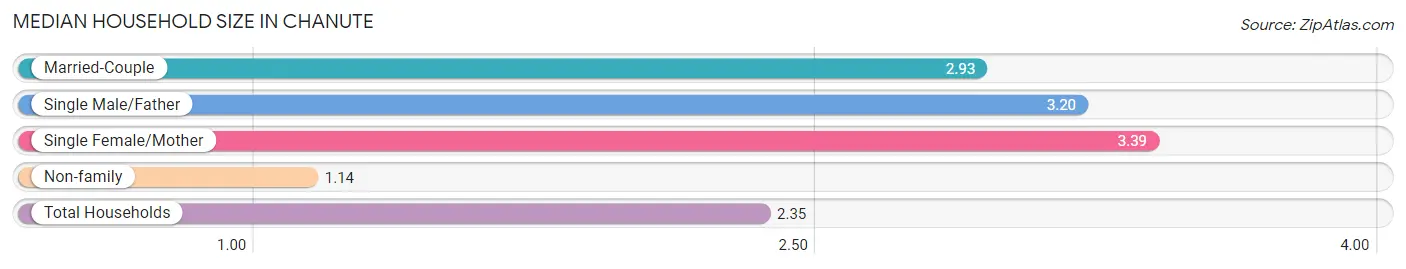
Median Household Size in Chanute
The median household size in Chanute is 2.35 persons per household, with single female/mother households (547 | 15.5%) accounting for the largest median household size of 3.39 persons per household. non-family households (1,319 | 37.3%) represent the smallest median household size with 1.14 persons per household.
| Household Type | # Households | Household Size |
| Married-Couple | 1,415 (40.1%) | 2.93 |
| Single Male/Father | 252 (7.1%) | 3.20 |
| Single Female/Mother | 547 (15.5%) | 3.39 |
| Non-family | 1,319 (37.3%) | 1.14 |
| Total Households | 3,533 (100.0%) | 2.35 |
Household Size by Marriage Status in Chanute
Out of a total of 3,533 households in Chanute, 2,214 (62.7%) are family households, while 1,319 (37.3%) are nonfamily households. The most numerous type of family households are 2-person households, comprising 1,016, and the most common type of nonfamily households are 1-person households, comprising 1,192.
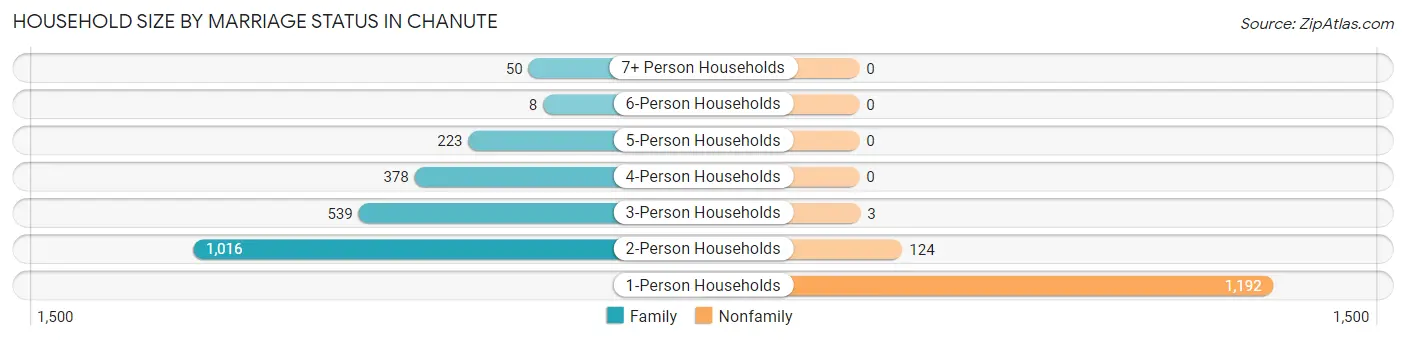
| Household Size | Family Households | Nonfamily Households |
| 1-Person Households | - | 1,192 (33.7%) |
| 2-Person Households | 1,016 (28.8%) | 124 (3.5%) |
| 3-Person Households | 539 (15.3%) | 3 (0.1%) |
| 4-Person Households | 378 (10.7%) | 0 (0.0%) |
| 5-Person Households | 223 (6.3%) | 0 (0.0%) |
| 6-Person Households | 8 (0.2%) | 0 (0.0%) |
| 7+ Person Households | 50 (1.4%) | 0 (0.0%) |
| Total | 2,214 (62.7%) | 1,319 (37.3%) |
Female Fertility in Chanute
Fertility by Age in Chanute
Average fertility rate in Chanute is 14.0 births per 1,000 women. Women in the age bracket of 20 to 34 years have the highest fertility rate with 40.0 births per 1,000 women. Women in the age bracket of 20 to 34 years acount for 100.0% of all women with births.
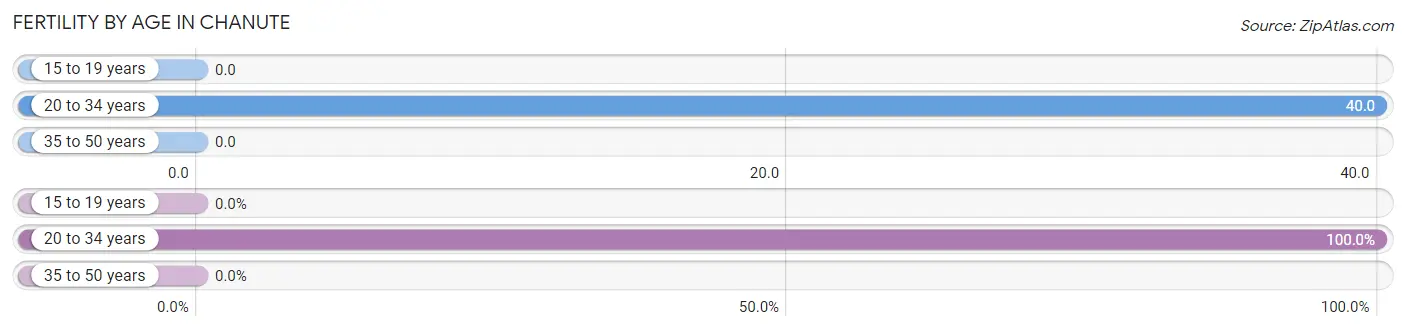
| Age Bracket | Women with Births | Births / 1,000 Women |
| 15 to 19 years | 0 (0.0%) | 0.0 |
| 20 to 34 years | 29 (100.0%) | 40.0 |
| 35 to 50 years | 0 (0.0%) | 0.0 |
| Total | 29 (100.0%) | 14.0 |
Fertility by Age by Marriage Status in Chanute
51.7% of women with births (29) in Chanute are married. The highest percentage of unmarried women with births falls into 20 to 34 years age bracket with 48.3% of them unmarried at the time of birth, while the lowest percentage of unmarried women with births belong to 20 to 34 years age bracket with 48.3% of them unmarried.
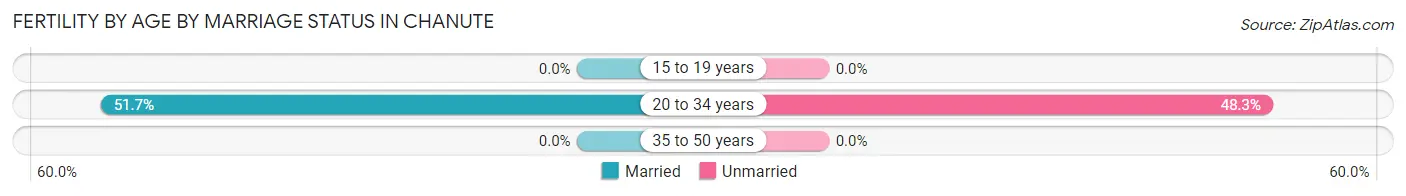
| Age Bracket | Married | Unmarried |
| 15 to 19 years | 0 (0.0%) | 0 (0.0%) |
| 20 to 34 years | 15 (51.7%) | 14 (48.3%) |
| 35 to 50 years | 0 (0.0%) | 0 (0.0%) |
| Total | 15 (51.7%) | 14 (48.3%) |
Fertility by Education in Chanute
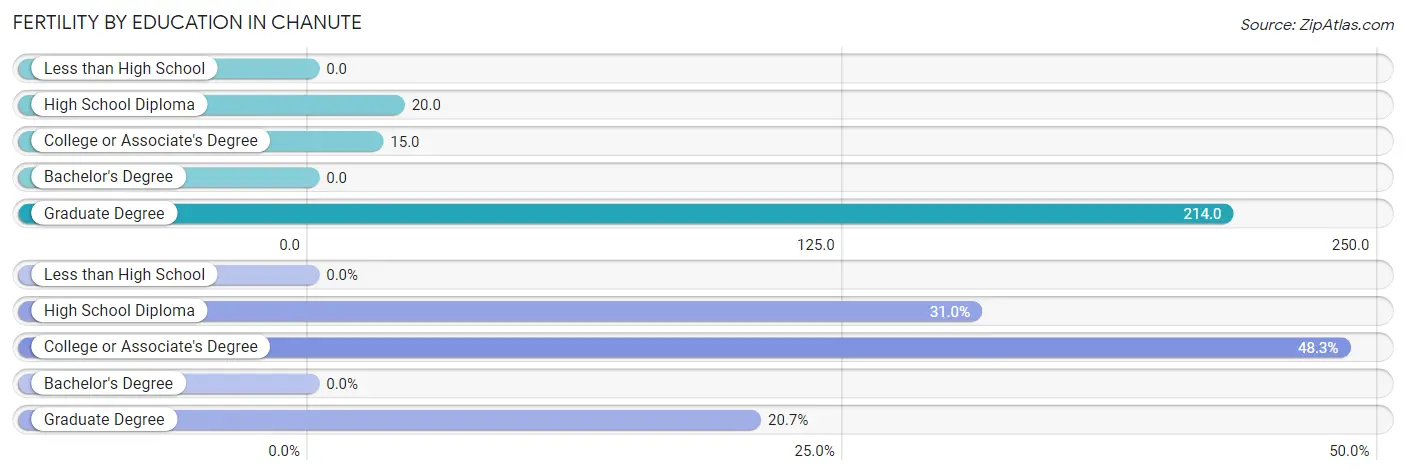
| Educational Attainment | Women with Births | Births / 1,000 Women |
| Less than High School | 0 (0.0%) | 0.0 |
| High School Diploma | 9 (31.0%) | 20.0 |
| College or Associate's Degree | 14 (48.3%) | 15.0 |
| Bachelor's Degree | 0 (0.0%) | 0.0 |
| Graduate Degree | 6 (20.7%) | 214.0 |
| Total | 29 (100.0%) | 14.0 |
Fertility by Education by Marriage Status in Chanute
48.3% of women with births in Chanute are unmarried. Women with the educational attainment of high school diploma are most likely to be married with 100.0% of them married at childbirth, while women with the educational attainment of college or associate's degree are least likely to be married with 100.0% of them unmarried at childbirth.
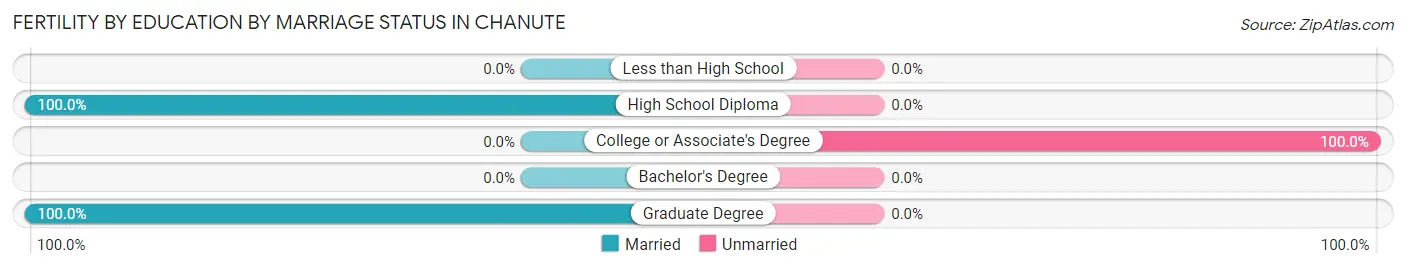
| Educational Attainment | Married | Unmarried |
| Less than High School | 0 (0.0%) | 0 (0.0%) |
| High School Diploma | 9 (100.0%) | 0 (0.0%) |
| College or Associate's Degree | 0 (0.0%) | 14 (100.0%) |
| Bachelor's Degree | 0 (0.0%) | 0 (0.0%) |
| Graduate Degree | 6 (100.0%) | 0 (0.0%) |
| Total | 15 (51.7%) | 14 (48.3%) |
Employment Characteristics in Chanute
Employment by Class of Employer in Chanute
Among the 3,615 employed individuals in Chanute, private company employees (2,480 | 68.6%), state government employees (428 | 11.8%), and local government employees (305 | 8.4%) make up the most common classes of employment.
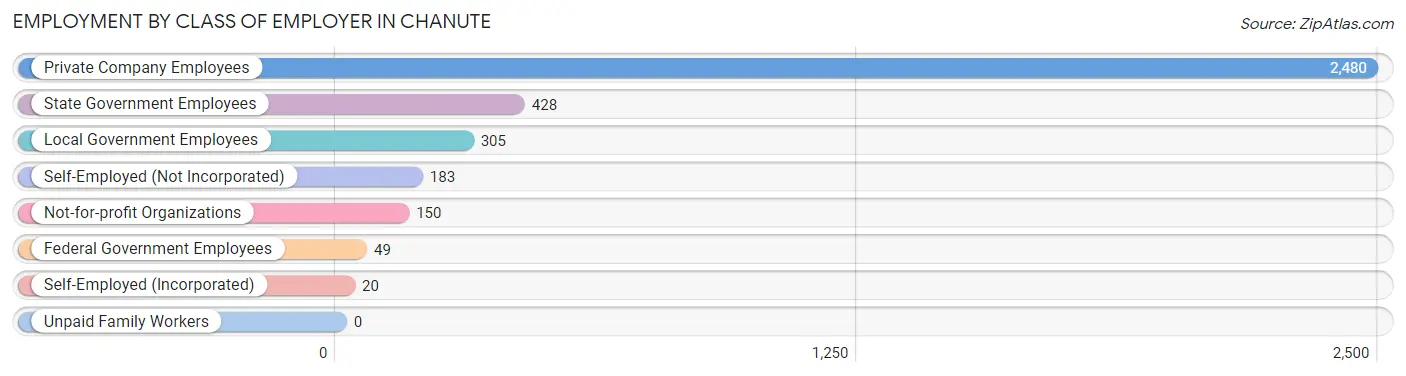
| Employer Class | # Employees | % Employees |
| Private Company Employees | 2,480 | 68.6% |
| Self-Employed (Incorporated) | 20 | 0.5% |
| Self-Employed (Not Incorporated) | 183 | 5.1% |
| Not-for-profit Organizations | 150 | 4.2% |
| Local Government Employees | 305 | 8.4% |
| State Government Employees | 428 | 11.8% |
| Federal Government Employees | 49 | 1.4% |
| Unpaid Family Workers | 0 | 0.0% |
| Total | 3,615 | 100.0% |
Employment Status by Age in Chanute
According to the labor force statistics for Chanute, out of the total population over 16 years of age (6,968), 57.4% or 4,000 individuals are in the labor force, with 7.2% or 288 of them unemployed. The age group with the highest labor force participation rate is 25 to 29 years, with 85.1% or 372 individuals in the labor force. Within the labor force, the 16 to 19 years age range has the highest percentage of unemployed individuals, with 35.3% or 55 of them being unemployed.
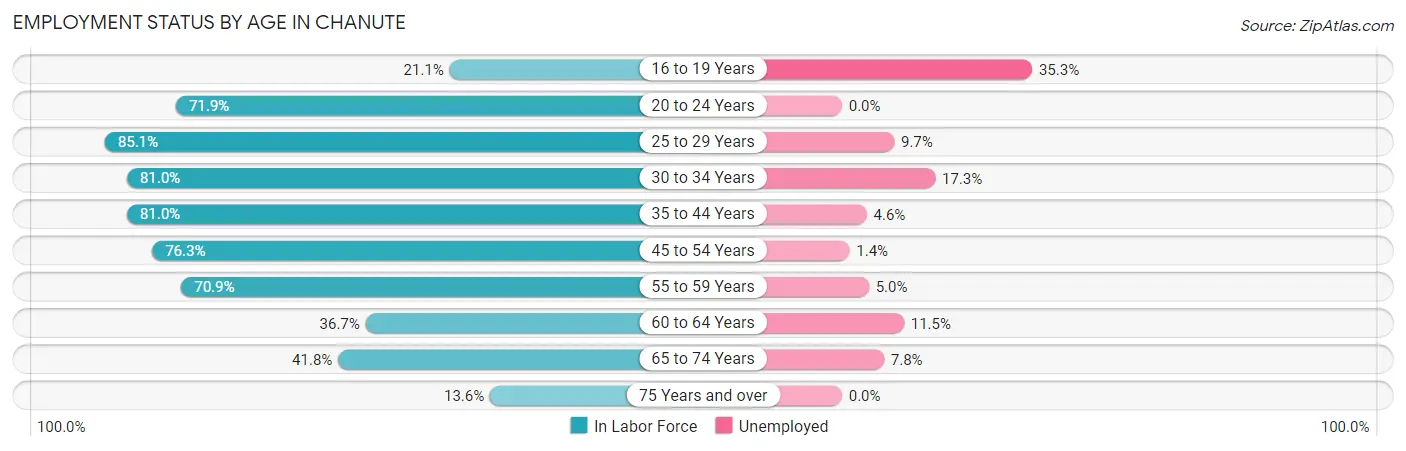
| Age Bracket | In Labor Force | Unemployed |
| 16 to 19 Years | 156 (21.1%) | 55 (35.3%) |
| 20 to 24 Years | 356 (71.9%) | 0 (0.0%) |
| 25 to 29 Years | 372 (85.1%) | 36 (9.7%) |
| 30 to 34 Years | 427 (81.0%) | 74 (17.3%) |
| 35 to 44 Years | 857 (81.0%) | 39 (4.6%) |
| 45 to 54 Years | 769 (76.3%) | 11 (1.4%) |
| 55 to 59 Years | 343 (70.9%) | 17 (5.0%) |
| 60 to 64 Years | 200 (36.7%) | 23 (11.5%) |
| 65 to 74 Years | 438 (41.8%) | 34 (7.8%) |
| 75 Years and over | 85 (13.6%) | 0 (0.0%) |
| Total | 4,000 (57.4%) | 288 (7.2%) |
Employment Status by Educational Attainment in Chanute
According to labor force statistics for Chanute, 73.1% of individuals (2,967) out of the total population between 25 and 64 years of age (4,059) are in the labor force, with 6.7% or 199 of them being unemployed. The group with the highest labor force participation rate are those with the educational attainment of college / associate degree, with 87.6% or 1,509 individuals in the labor force. Within the labor force, individuals with less than high school education have the highest percentage of unemployment, with 24.9% or 62 of them being unemployed.
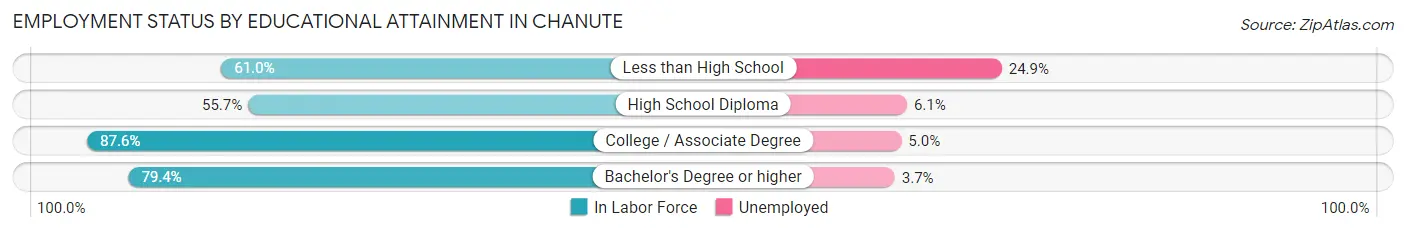
| Educational Attainment | In Labor Force | Unemployed |
| Less than High School | 249 (61.0%) | 102 (24.9%) |
| High School Diploma | 755 (55.7%) | 83 (6.1%) |
| College / Associate Degree | 1,509 (87.6%) | 86 (5.0%) |
| Bachelor's Degree or higher | 455 (79.4%) | 21 (3.7%) |
| Total | 2,967 (73.1%) | 272 (6.7%) |
Employment Occupations by Sex in Chanute
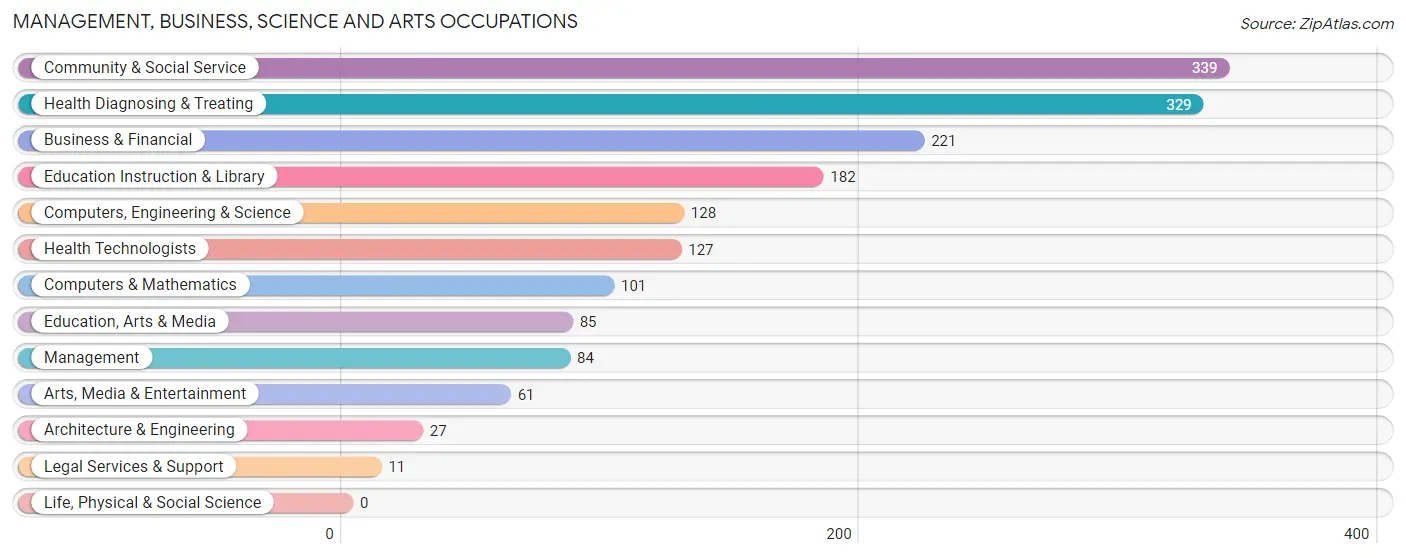
Management, Business, Science and Arts Occupations
The most common Management, Business, Science and Arts occupations in Chanute are Community & Social Service (339 | 9.1%), Health Diagnosing & Treating (329 | 8.9%), Business & Financial (221 | 5.9%), Education Instruction & Library (182 | 4.9%), and Computers, Engineering & Science (128 | 3.5%).
Management, Business, Science and Arts Occupations by Sex
Within the Management, Business, Science and Arts occupations in Chanute, the most male-oriented occupations are Computers, Engineering & Science (100.0%), Computers & Mathematics (100.0%), and Architecture & Engineering (100.0%), while the most female-oriented occupations are Health Technologists (100.0%), Education Instruction & Library (90.7%), and Arts, Media & Entertainment (88.5%).
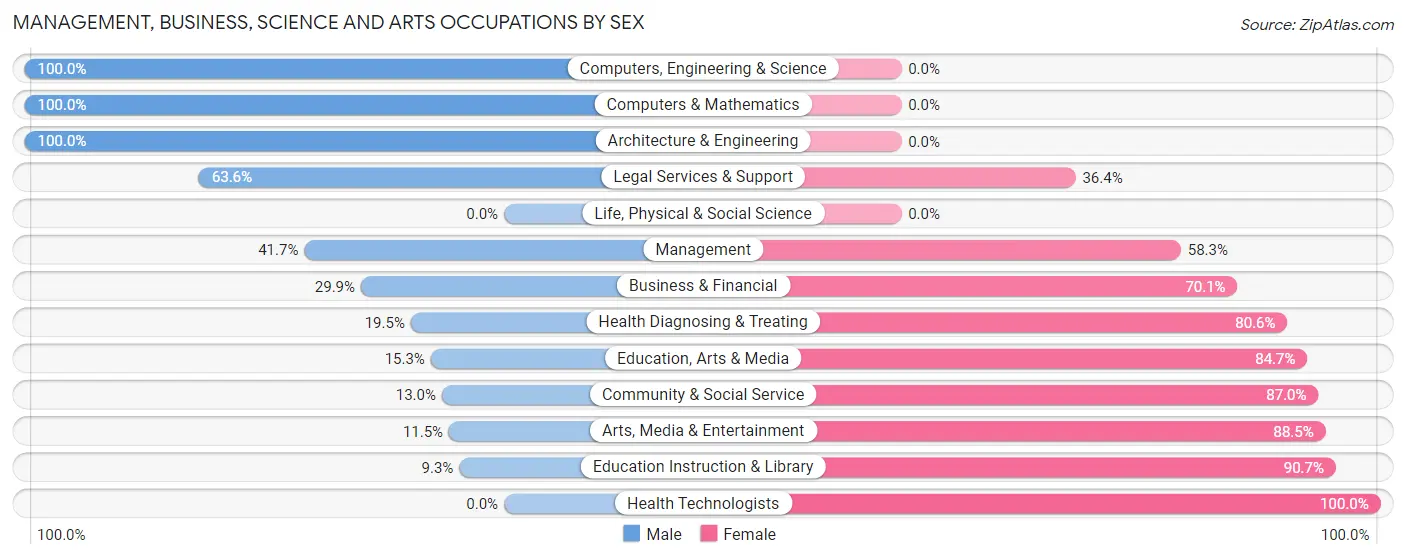
| Occupation | Male | Female |
| Management | 35 (41.7%) | 49 (58.3%) |
| Business & Financial | 66 (29.9%) | 155 (70.1%) |
| Computers, Engineering & Science | 128 (100.0%) | 0 (0.0%) |
| Computers & Mathematics | 101 (100.0%) | 0 (0.0%) |
| Architecture & Engineering | 27 (100.0%) | 0 (0.0%) |
| Life, Physical & Social Science | 0 (0.0%) | 0 (0.0%) |
| Community & Social Service | 44 (13.0%) | 295 (87.0%) |
| Education, Arts & Media | 13 (15.3%) | 72 (84.7%) |
| Legal Services & Support | 7 (63.6%) | 4 (36.4%) |
| Education Instruction & Library | 17 (9.3%) | 165 (90.7%) |
| Arts, Media & Entertainment | 7 (11.5%) | 54 (88.5%) |
| Health Diagnosing & Treating | 64 (19.5%) | 265 (80.5%) |
| Health Technologists | 0 (0.0%) | 127 (100.0%) |
| Total (Category) | 337 (30.6%) | 764 (69.4%) |
| Total (Overall) | 1,730 (46.6%) | 1,984 (53.4%) |
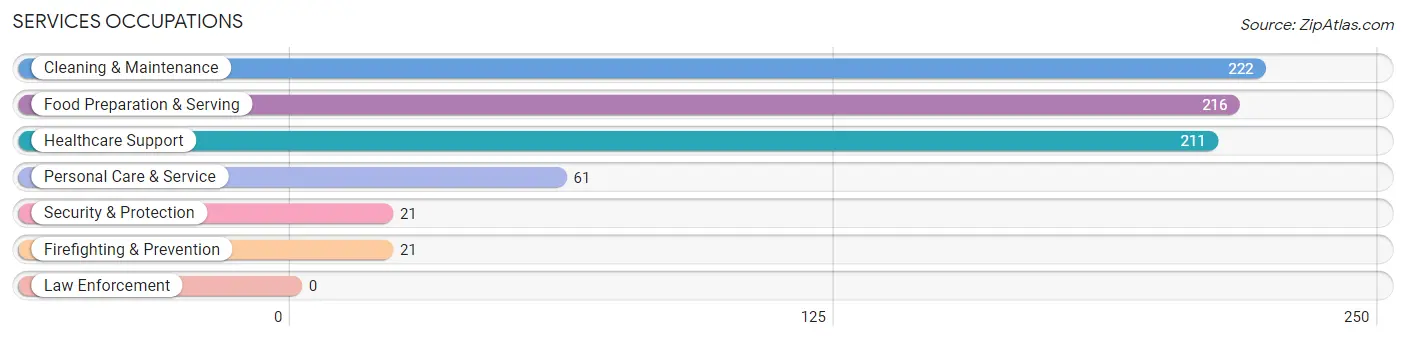
Services Occupations
The most common Services occupations in Chanute are Cleaning & Maintenance (222 | 6.0%), Food Preparation & Serving (216 | 5.8%), Healthcare Support (211 | 5.7%), Personal Care & Service (61 | 1.6%), and Security & Protection (21 | 0.6%).
Services Occupations by Sex
Within the Services occupations in Chanute, the most male-oriented occupations are Security & Protection (100.0%), Firefighting & Prevention (100.0%), and Food Preparation & Serving (57.9%), while the most female-oriented occupations are Healthcare Support (100.0%), Cleaning & Maintenance (54.0%), and Personal Care & Service (45.9%).
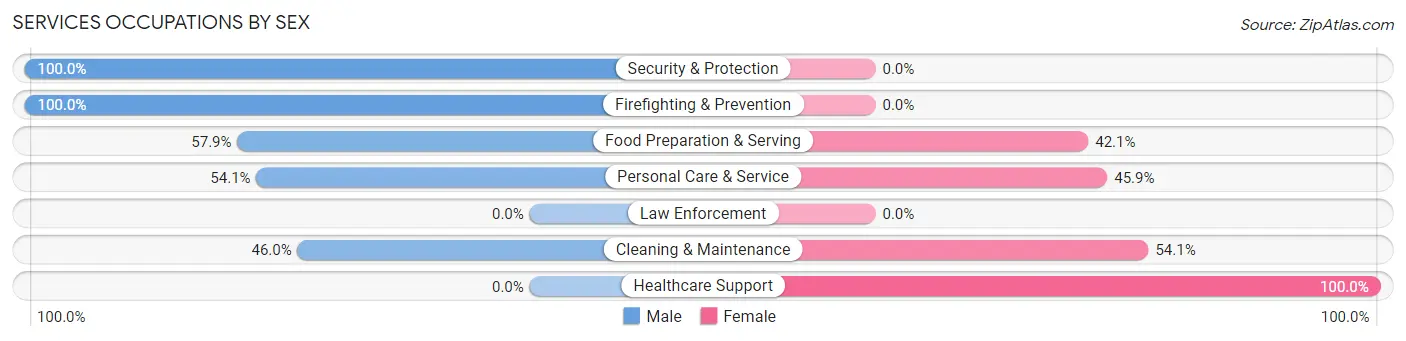
| Occupation | Male | Female |
| Healthcare Support | 0 (0.0%) | 211 (100.0%) |
| Security & Protection | 21 (100.0%) | 0 (0.0%) |
| Firefighting & Prevention | 21 (100.0%) | 0 (0.0%) |
| Law Enforcement | 0 (0.0%) | 0 (0.0%) |
| Food Preparation & Serving | 125 (57.9%) | 91 (42.1%) |
| Cleaning & Maintenance | 102 (46.0%) | 120 (54.0%) |
| Personal Care & Service | 33 (54.1%) | 28 (45.9%) |
| Total (Category) | 281 (38.4%) | 450 (61.6%) |
| Total (Overall) | 1,730 (46.6%) | 1,984 (53.4%) |
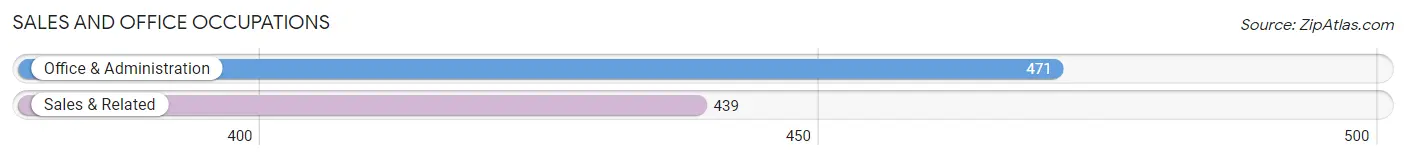
Sales and Office Occupations
The most common Sales and Office occupations in Chanute are Office & Administration (471 | 12.7%), and Sales & Related (439 | 11.8%).
Sales and Office Occupations by Sex
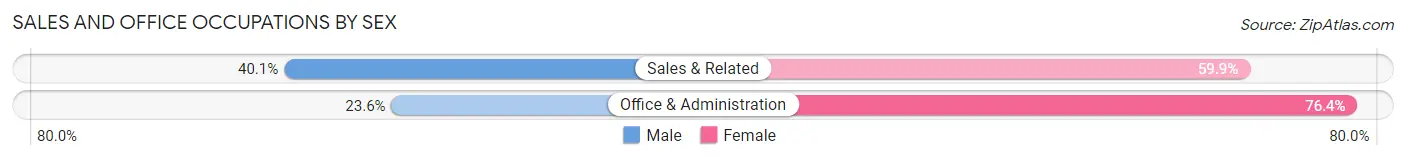
| Occupation | Male | Female |
| Sales & Related | 176 (40.1%) | 263 (59.9%) |
| Office & Administration | 111 (23.6%) | 360 (76.4%) |
| Total (Category) | 287 (31.5%) | 623 (68.5%) |
| Total (Overall) | 1,730 (46.6%) | 1,984 (53.4%) |
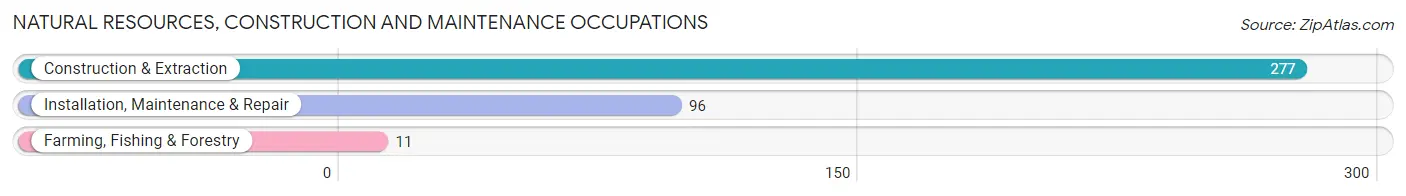
Natural Resources, Construction and Maintenance Occupations
The most common Natural Resources, Construction and Maintenance occupations in Chanute are Construction & Extraction (277 | 7.5%), Installation, Maintenance & Repair (96 | 2.6%), and Farming, Fishing & Forestry (11 | 0.3%).
Natural Resources, Construction and Maintenance Occupations by Sex
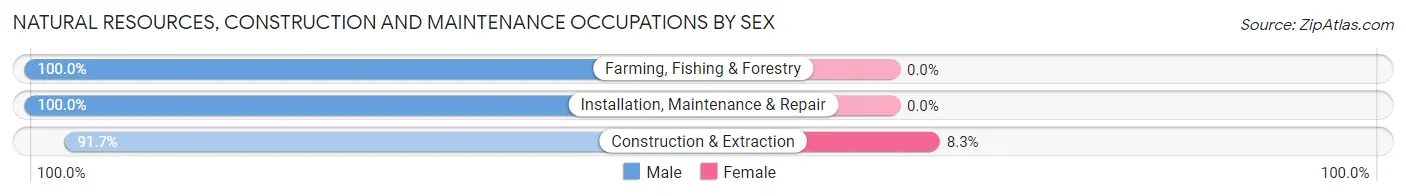
| Occupation | Male | Female |
| Farming, Fishing & Forestry | 11 (100.0%) | 0 (0.0%) |
| Construction & Extraction | 254 (91.7%) | 23 (8.3%) |
| Installation, Maintenance & Repair | 96 (100.0%) | 0 (0.0%) |
| Total (Category) | 361 (94.0%) | 23 (6.0%) |
| Total (Overall) | 1,730 (46.6%) | 1,984 (53.4%) |
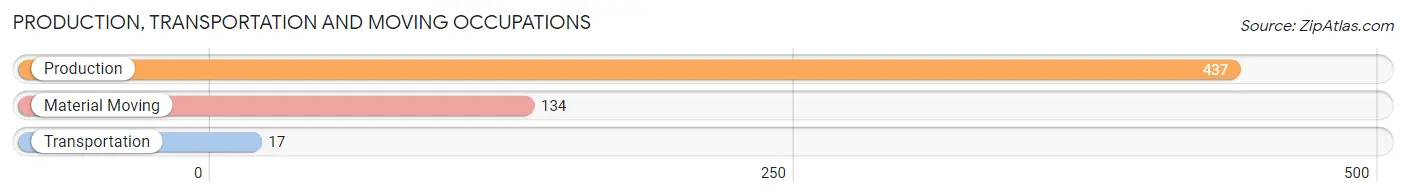
Production, Transportation and Moving Occupations
The most common Production, Transportation and Moving occupations in Chanute are Production (437 | 11.8%), Material Moving (134 | 3.6%), and Transportation (17 | 0.5%).
Production, Transportation and Moving Occupations by Sex
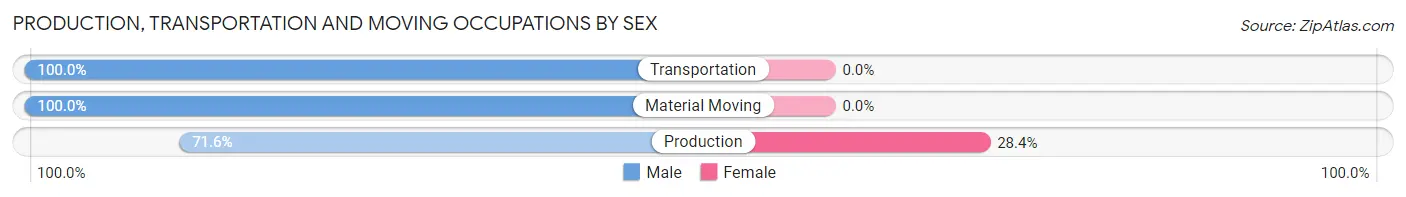
| Occupation | Male | Female |
| Production | 313 (71.6%) | 124 (28.4%) |
| Transportation | 17 (100.0%) | 0 (0.0%) |
| Material Moving | 134 (100.0%) | 0 (0.0%) |
| Total (Category) | 464 (78.9%) | 124 (21.1%) |
| Total (Overall) | 1,730 (46.6%) | 1,984 (53.4%) |
Employment Industries by Sex in Chanute
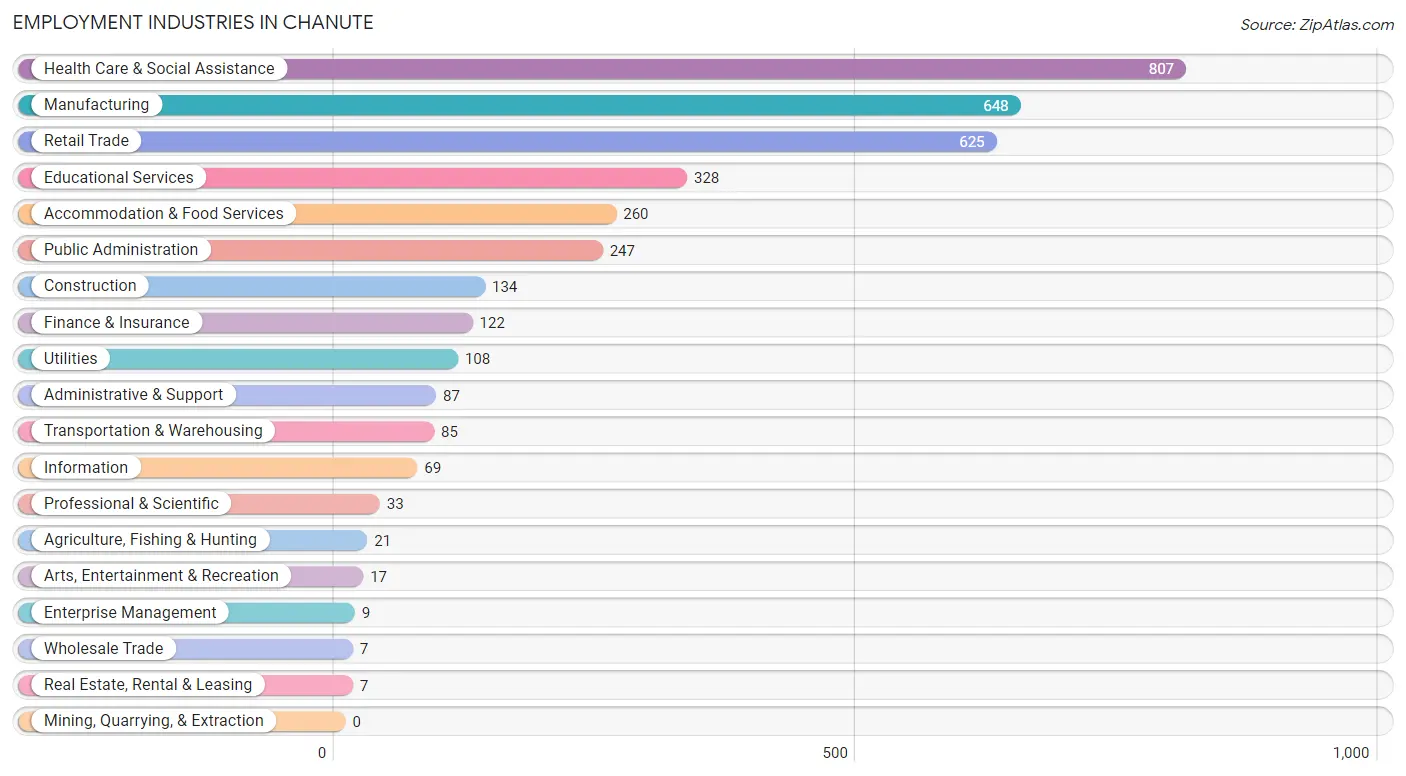
Employment Industries in Chanute
The major employment industries in Chanute include Health Care & Social Assistance (807 | 21.7%), Manufacturing (648 | 17.4%), Retail Trade (625 | 16.8%), Educational Services (328 | 8.8%), and Accommodation & Food Services (260 | 7.0%).
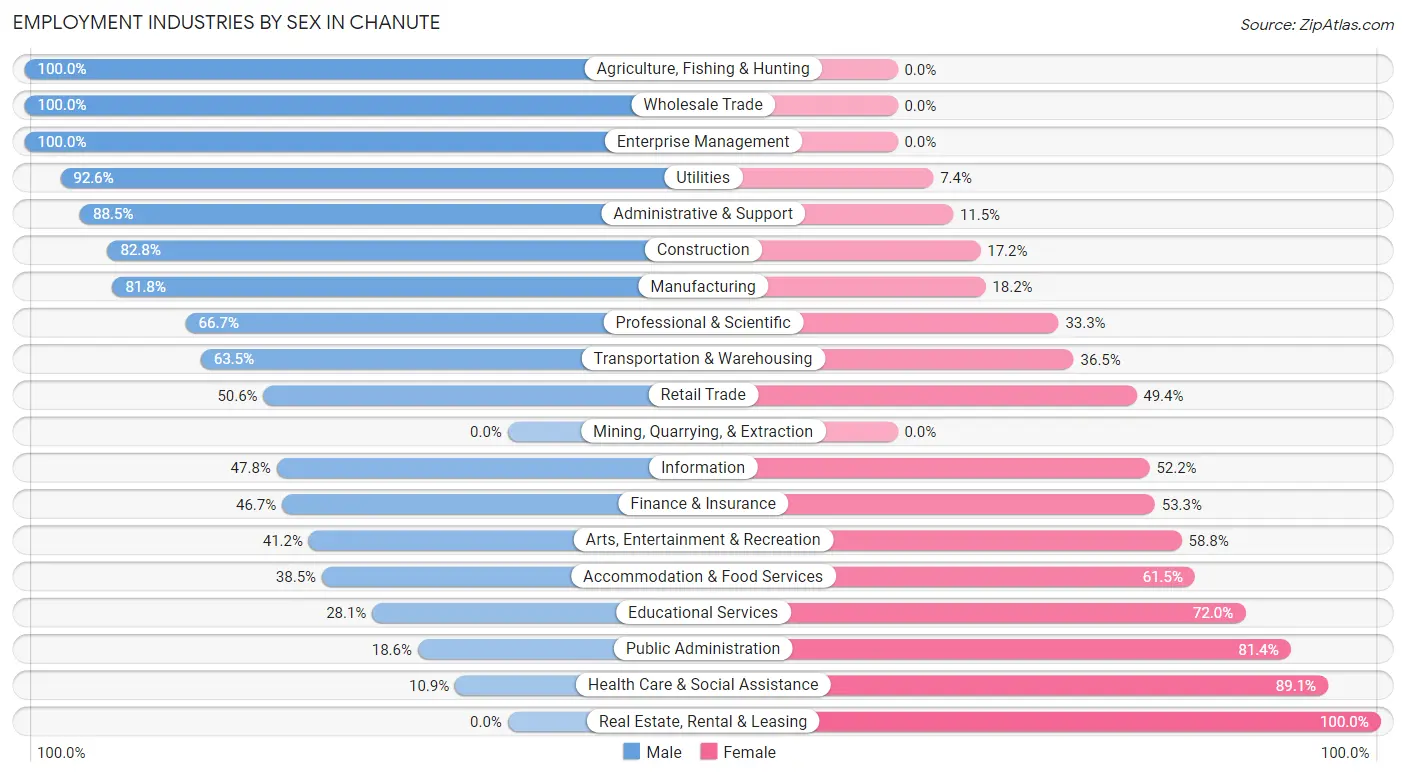
Employment Industries by Sex in Chanute
The Chanute industries that see more men than women are Agriculture, Fishing & Hunting (100.0%), Wholesale Trade (100.0%), and Enterprise Management (100.0%), whereas the industries that tend to have a higher number of women are Real Estate, Rental & Leasing (100.0%), Health Care & Social Assistance (89.1%), and Public Administration (81.4%).
| Industry | Male | Female |
| Agriculture, Fishing & Hunting | 21 (100.0%) | 0 (0.0%) |
| Mining, Quarrying, & Extraction | 0 (0.0%) | 0 (0.0%) |
| Construction | 111 (82.8%) | 23 (17.2%) |
| Manufacturing | 530 (81.8%) | 118 (18.2%) |
| Wholesale Trade | 7 (100.0%) | 0 (0.0%) |
| Retail Trade | 316 (50.6%) | 309 (49.4%) |
| Transportation & Warehousing | 54 (63.5%) | 31 (36.5%) |
| Utilities | 100 (92.6%) | 8 (7.4%) |
| Information | 33 (47.8%) | 36 (52.2%) |
| Finance & Insurance | 57 (46.7%) | 65 (53.3%) |
| Real Estate, Rental & Leasing | 0 (0.0%) | 7 (100.0%) |
| Professional & Scientific | 22 (66.7%) | 11 (33.3%) |
| Enterprise Management | 9 (100.0%) | 0 (0.0%) |
| Administrative & Support | 77 (88.5%) | 10 (11.5%) |
| Educational Services | 92 (28.1%) | 236 (72.0%) |
| Health Care & Social Assistance | 88 (10.9%) | 719 (89.1%) |
| Arts, Entertainment & Recreation | 7 (41.2%) | 10 (58.8%) |
| Accommodation & Food Services | 100 (38.5%) | 160 (61.5%) |
| Public Administration | 46 (18.6%) | 201 (81.4%) |
| Total | 1,730 (46.6%) | 1,984 (53.4%) |
Education in Chanute
School Enrollment in Chanute
The most common levels of schooling among the 2,422 students in Chanute are middle school (757 | 31.3%), college / undergraduate (562 | 23.2%), and high school (511 | 21.1%).
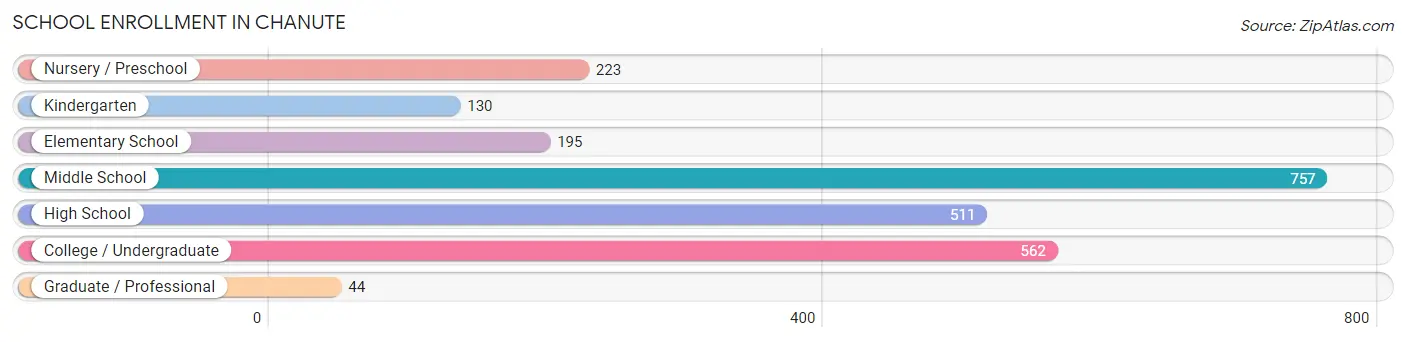
| School Level | # Students | % Students |
| Nursery / Preschool | 223 | 9.2% |
| Kindergarten | 130 | 5.4% |
| Elementary School | 195 | 8.1% |
| Middle School | 757 | 31.3% |
| High School | 511 | 21.1% |
| College / Undergraduate | 562 | 23.2% |
| Graduate / Professional | 44 | 1.8% |
| Total | 2,422 | 100.0% |
School Enrollment by Age by Funding Source in Chanute
Out of a total of 2,422 students who are enrolled in schools in Chanute, 252 (10.4%) attend a private institution, while the remaining 2,170 (89.6%) are enrolled in public schools. The age group of 35 years and over has the highest likelihood of being enrolled in private schools, with 13 (37.1% in the age bracket) enrolled. Conversely, the age group of 3 to 4 year olds has the lowest likelihood of being enrolled in a private school, with 104 (100.0% in the age bracket) attending a public institution.
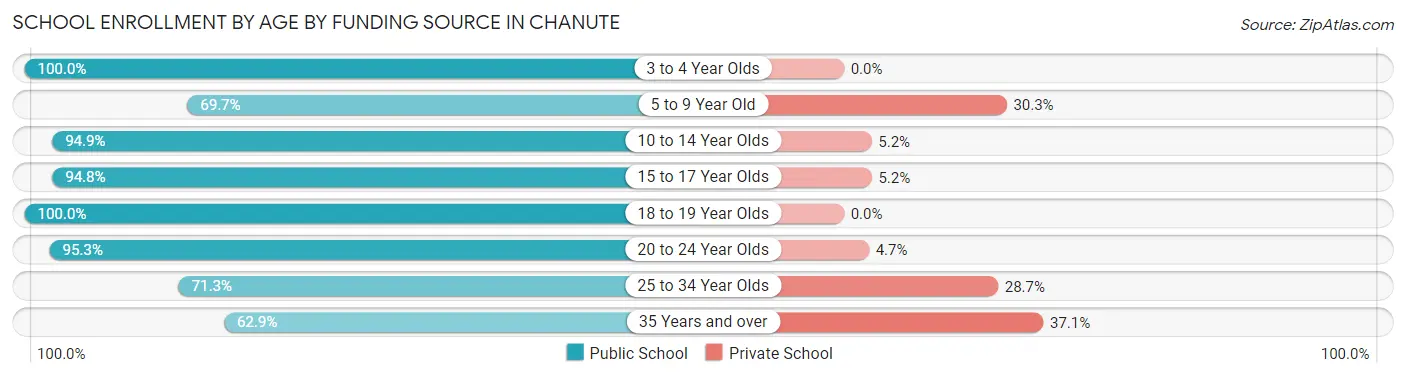
| Age Bracket | Public School | Private School |
| 3 to 4 Year Olds | 104 (100.0%) | 0 (0.0%) |
| 5 to 9 Year Old | 301 (69.7%) | 131 (30.3%) |
| 10 to 14 Year Olds | 737 (94.9%) | 40 (5.1%) |
| 15 to 17 Year Olds | 440 (94.8%) | 24 (5.2%) |
| 18 to 19 Year Olds | 259 (100.0%) | 0 (0.0%) |
| 20 to 24 Year Olds | 225 (95.3%) | 11 (4.7%) |
| 25 to 34 Year Olds | 82 (71.3%) | 33 (28.7%) |
| 35 Years and over | 22 (62.9%) | 13 (37.1%) |
| Total | 2,170 (89.6%) | 252 (10.4%) |
Educational Attainment by Field of Study in Chanute
Business (232 | 21.9%), education (170 | 16.1%), bio, nature & agricultural (130 | 12.3%), arts & humanities (119 | 11.3%), and psychology (112 | 10.6%) are the most common fields of study among 1,058 individuals in Chanute who have obtained a bachelor's degree or higher.
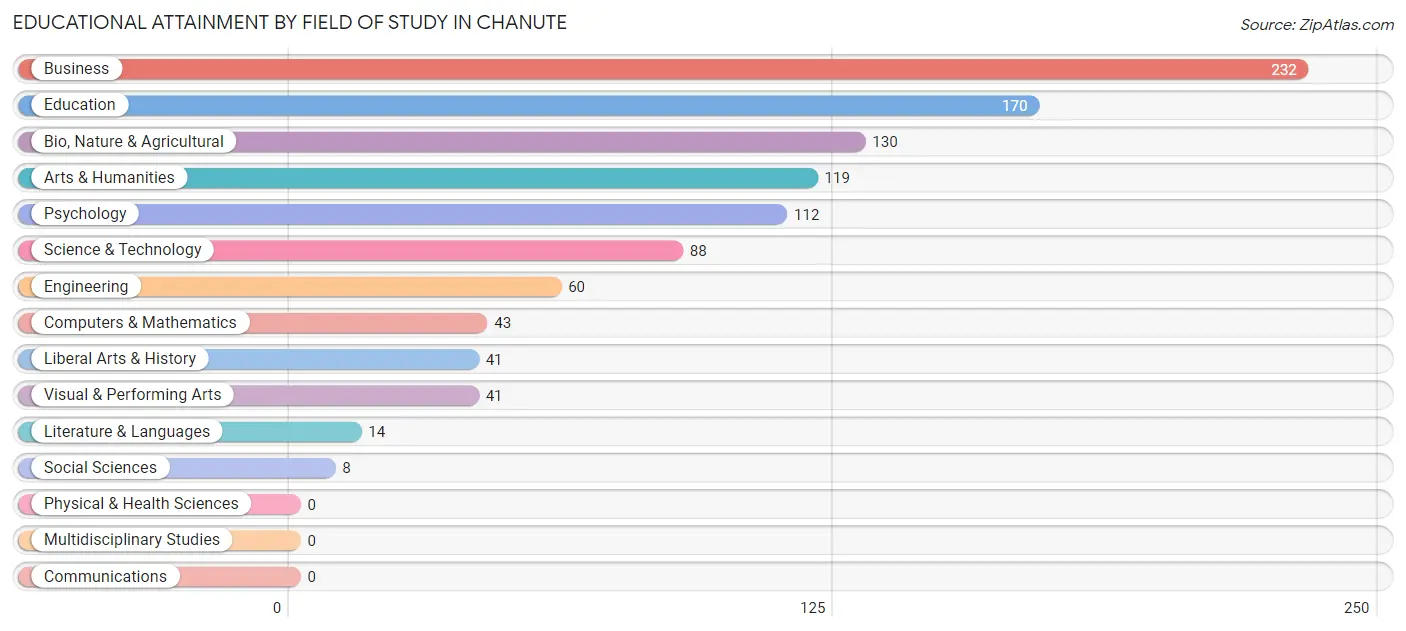
| Field of Study | # Graduates | % Graduates |
| Computers & Mathematics | 43 | 4.1% |
| Bio, Nature & Agricultural | 130 | 12.3% |
| Physical & Health Sciences | 0 | 0.0% |
| Psychology | 112 | 10.6% |
| Social Sciences | 8 | 0.8% |
| Engineering | 60 | 5.7% |
| Multidisciplinary Studies | 0 | 0.0% |
| Science & Technology | 88 | 8.3% |
| Business | 232 | 21.9% |
| Education | 170 | 16.1% |
| Literature & Languages | 14 | 1.3% |
| Liberal Arts & History | 41 | 3.9% |
| Visual & Performing Arts | 41 | 3.9% |
| Communications | 0 | 0.0% |
| Arts & Humanities | 119 | 11.3% |
| Total | 1,058 | 100.0% |
Transportation & Commute in Chanute
Vehicle Availability by Sex in Chanute
The most prevalent vehicle ownership categories in Chanute are males with 2 vehicles (793, accounting for 46.3%) and females with 2 vehicles (632, making up 42.4%).
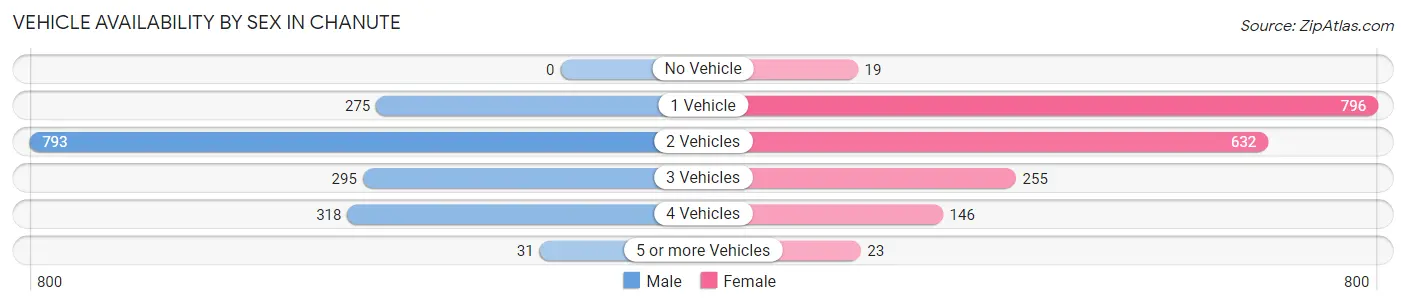
| Vehicles Available | Male | Female |
| No Vehicle | 0 (0.0%) | 19 (1.0%) |
| 1 Vehicle | 275 (16.1%) | 796 (42.5%) |
| 2 Vehicles | 793 (46.3%) | 632 (33.8%) |
| 3 Vehicles | 295 (17.2%) | 255 (13.6%) |
| 4 Vehicles | 318 (18.6%) | 146 (7.8%) |
| 5 or more Vehicles | 31 (1.8%) | 23 (1.2%) |
| Total | 1,712 (100.0%) | 1,871 (100.0%) |
Commute Time in Chanute
The most frequently occuring commute durations in Chanute are 5 to 9 minutes (1,366 commuters, 38.5%), 10 to 14 minutes (835 commuters, 23.5%), and less than 5 minutes (439 commuters, 12.4%).
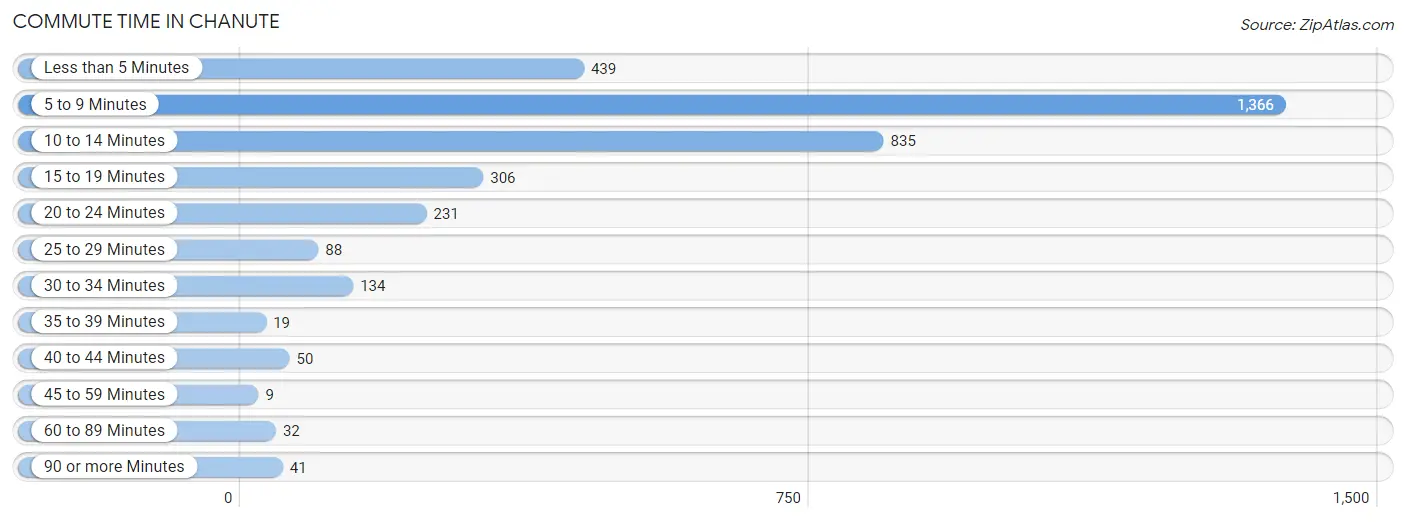
| Commute Time | # Commuters | % Commuters |
| Less than 5 Minutes | 439 | 12.4% |
| 5 to 9 Minutes | 1,366 | 38.5% |
| 10 to 14 Minutes | 835 | 23.5% |
| 15 to 19 Minutes | 306 | 8.6% |
| 20 to 24 Minutes | 231 | 6.5% |
| 25 to 29 Minutes | 88 | 2.5% |
| 30 to 34 Minutes | 134 | 3.8% |
| 35 to 39 Minutes | 19 | 0.5% |
| 40 to 44 Minutes | 50 | 1.4% |
| 45 to 59 Minutes | 9 | 0.3% |
| 60 to 89 Minutes | 32 | 0.9% |
| 90 or more Minutes | 41 | 1.1% |
Commute Time by Sex in Chanute
The most common commute times in Chanute are 5 to 9 minutes (718 commuters, 41.8%) for males and 5 to 9 minutes (648 commuters, 35.3%) for females.
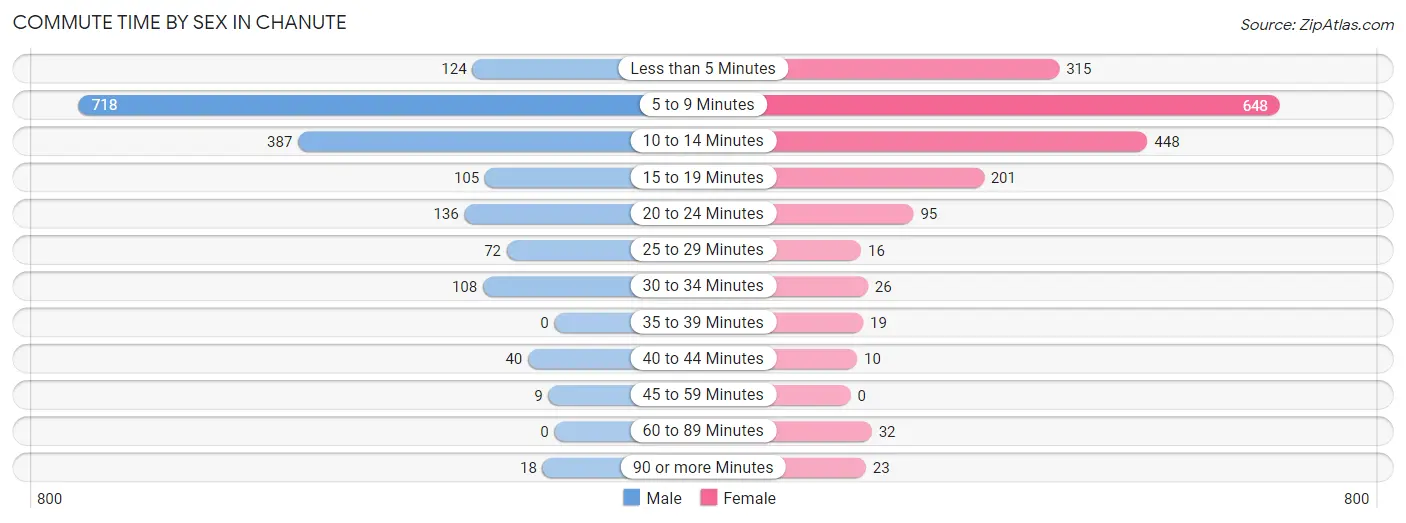
| Commute Time | Male | Female |
| Less than 5 Minutes | 124 (7.2%) | 315 (17.2%) |
| 5 to 9 Minutes | 718 (41.8%) | 648 (35.3%) |
| 10 to 14 Minutes | 387 (22.5%) | 448 (24.4%) |
| 15 to 19 Minutes | 105 (6.1%) | 201 (11.0%) |
| 20 to 24 Minutes | 136 (7.9%) | 95 (5.2%) |
| 25 to 29 Minutes | 72 (4.2%) | 16 (0.9%) |
| 30 to 34 Minutes | 108 (6.3%) | 26 (1.4%) |
| 35 to 39 Minutes | 0 (0.0%) | 19 (1.0%) |
| 40 to 44 Minutes | 40 (2.3%) | 10 (0.5%) |
| 45 to 59 Minutes | 9 (0.5%) | 0 (0.0%) |
| 60 to 89 Minutes | 0 (0.0%) | 32 (1.8%) |
| 90 or more Minutes | 18 (1.1%) | 23 (1.3%) |
Time of Departure to Work by Sex in Chanute
The most frequent times of departure to work in Chanute are 6:30 AM to 6:59 AM (307, 17.9%) for males and 7:30 AM to 7:59 AM (582, 31.8%) for females.
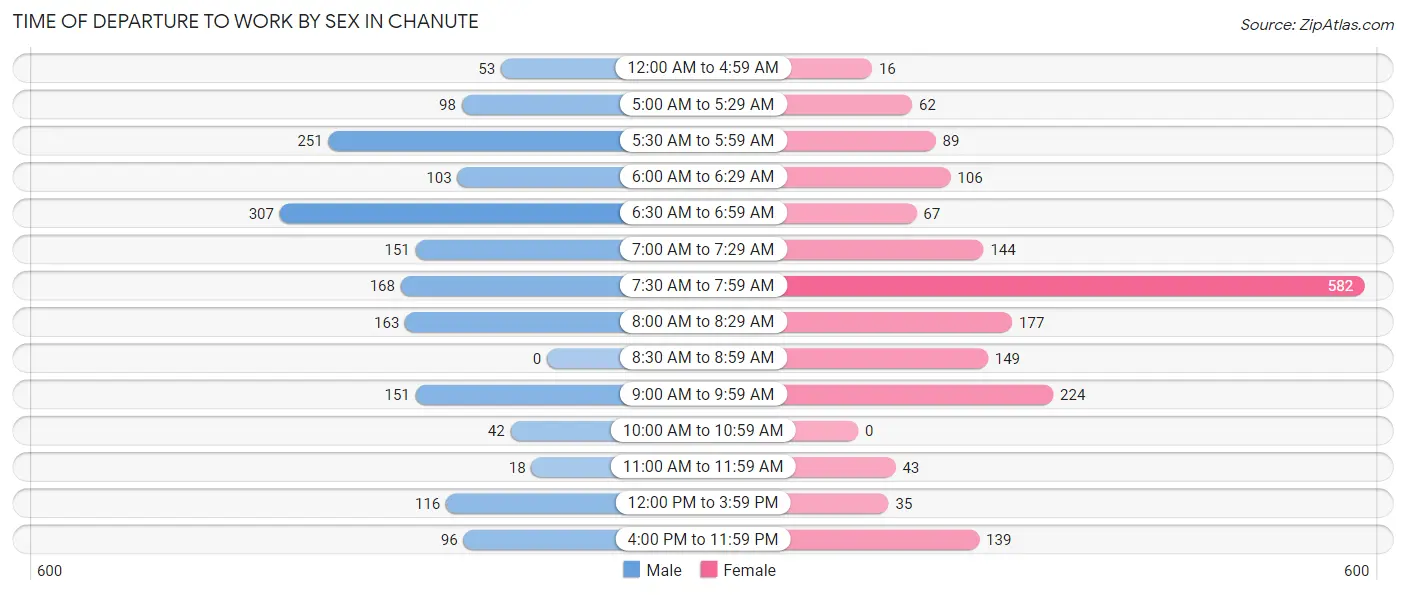
| Time of Departure | Male | Female |
| 12:00 AM to 4:59 AM | 53 (3.1%) | 16 (0.9%) |
| 5:00 AM to 5:29 AM | 98 (5.7%) | 62 (3.4%) |
| 5:30 AM to 5:59 AM | 251 (14.6%) | 89 (4.9%) |
| 6:00 AM to 6:29 AM | 103 (6.0%) | 106 (5.8%) |
| 6:30 AM to 6:59 AM | 307 (17.9%) | 67 (3.7%) |
| 7:00 AM to 7:29 AM | 151 (8.8%) | 144 (7.9%) |
| 7:30 AM to 7:59 AM | 168 (9.8%) | 582 (31.8%) |
| 8:00 AM to 8:29 AM | 163 (9.5%) | 177 (9.7%) |
| 8:30 AM to 8:59 AM | 0 (0.0%) | 149 (8.1%) |
| 9:00 AM to 9:59 AM | 151 (8.8%) | 224 (12.2%) |
| 10:00 AM to 10:59 AM | 42 (2.5%) | 0 (0.0%) |
| 11:00 AM to 11:59 AM | 18 (1.1%) | 43 (2.4%) |
| 12:00 PM to 3:59 PM | 116 (6.8%) | 35 (1.9%) |
| 4:00 PM to 11:59 PM | 96 (5.6%) | 139 (7.6%) |
| Total | 1,717 (100.0%) | 1,833 (100.0%) |
Housing Occupancy in Chanute
Occupancy by Ownership in Chanute
Of the total 3,533 dwellings in Chanute, owner-occupied units account for 2,421 (68.5%), while renter-occupied units make up 1,112 (31.5%).
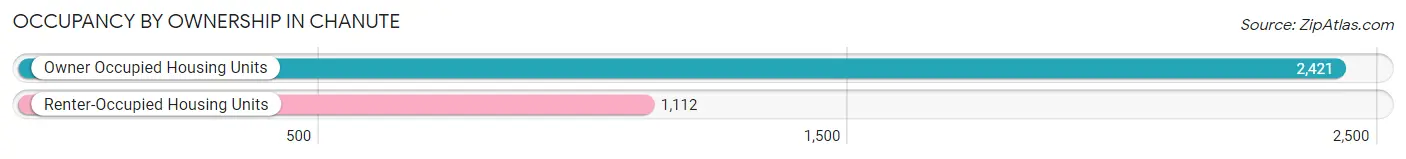
| Occupancy | # Housing Units | % Housing Units |
| Owner Occupied Housing Units | 2,421 | 68.5% |
| Renter-Occupied Housing Units | 1,112 | 31.5% |
| Total Occupied Housing Units | 3,533 | 100.0% |
Occupancy by Household Size in Chanute
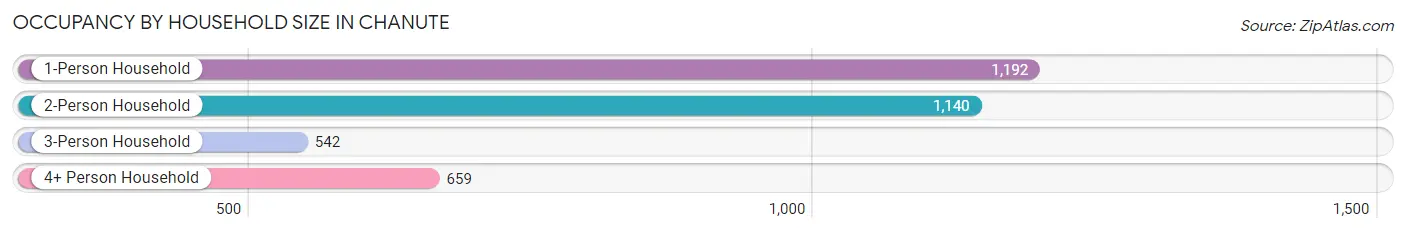
| Household Size | # Housing Units | % Housing Units |
| 1-Person Household | 1,192 | 33.7% |
| 2-Person Household | 1,140 | 32.3% |
| 3-Person Household | 542 | 15.3% |
| 4+ Person Household | 659 | 18.6% |
| Total Housing Units | 3,533 | 100.0% |
Occupancy by Ownership by Household Size in Chanute
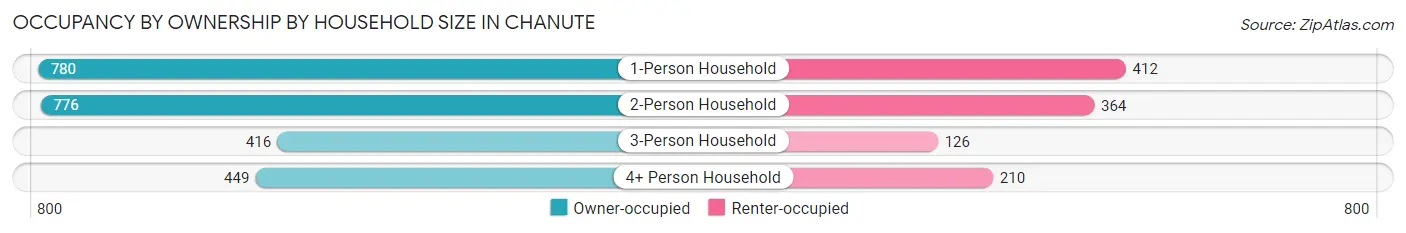
| Household Size | Owner-occupied | Renter-occupied |
| 1-Person Household | 780 (65.4%) | 412 (34.6%) |
| 2-Person Household | 776 (68.1%) | 364 (31.9%) |
| 3-Person Household | 416 (76.7%) | 126 (23.3%) |
| 4+ Person Household | 449 (68.1%) | 210 (31.9%) |
| Total Housing Units | 2,421 (68.5%) | 1,112 (31.5%) |
Occupancy by Educational Attainment in Chanute
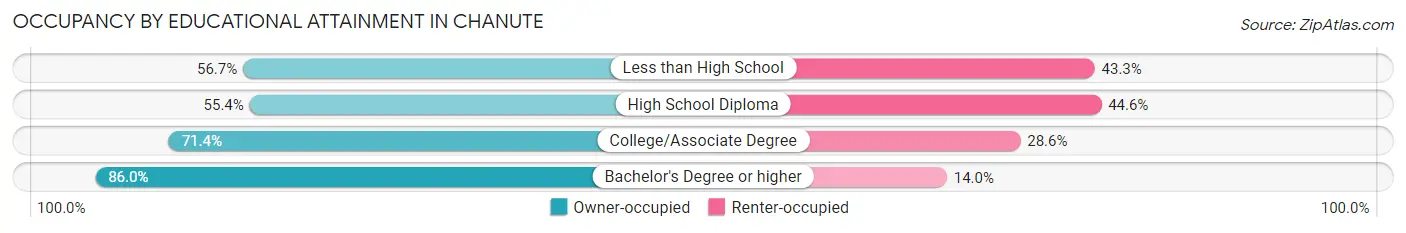
| Household Size | Owner-occupied | Renter-occupied |
| Less than High School | 144 (56.7%) | 110 (43.3%) |
| High School Diploma | 555 (55.4%) | 447 (44.6%) |
| College/Associate Degree | 1,157 (71.4%) | 463 (28.6%) |
| Bachelor's Degree or higher | 565 (86.0%) | 92 (14.0%) |
Occupancy by Age of Householder in Chanute
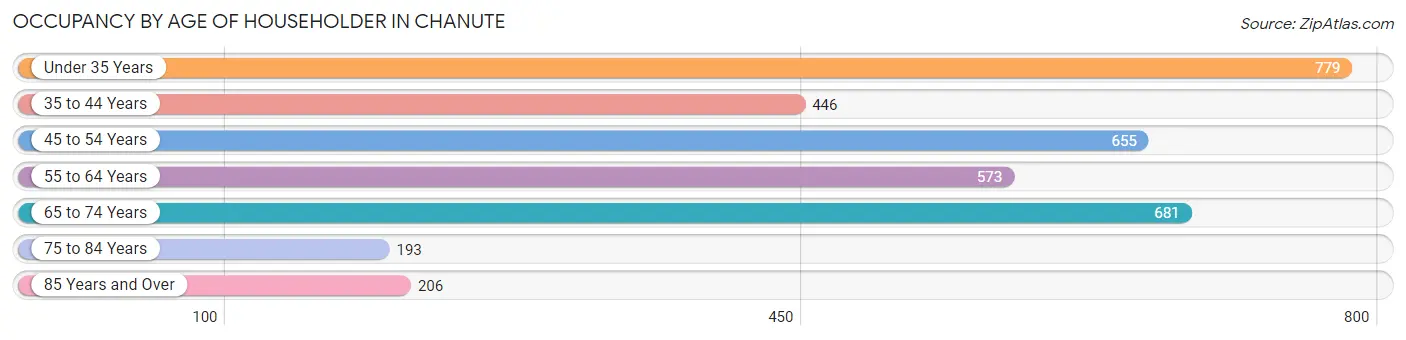
| Age Bracket | # Households | % Households |
| Under 35 Years | 779 | 22.1% |
| 35 to 44 Years | 446 | 12.6% |
| 45 to 54 Years | 655 | 18.5% |
| 55 to 64 Years | 573 | 16.2% |
| 65 to 74 Years | 681 | 19.3% |
| 75 to 84 Years | 193 | 5.5% |
| 85 Years and Over | 206 | 5.8% |
| Total | 3,533 | 100.0% |
Housing Finances in Chanute
Median Income by Occupancy in Chanute
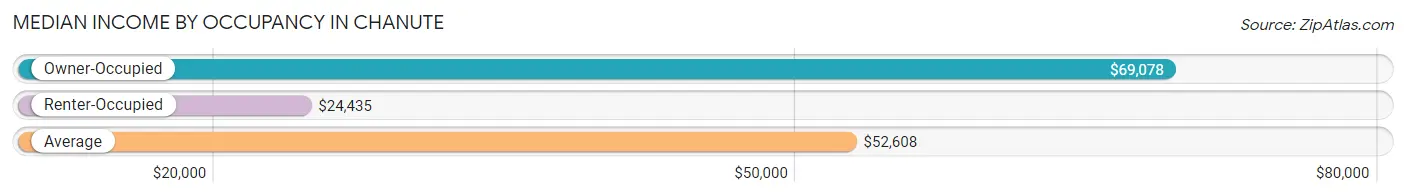
| Occupancy Type | # Households | Median Income |
| Owner-Occupied | 2,421 (68.5%) | $69,078 |
| Renter-Occupied | 1,112 (31.5%) | $24,435 |
| Average | 3,533 (100.0%) | $52,608 |
Occupancy by Householder Income Bracket in Chanute
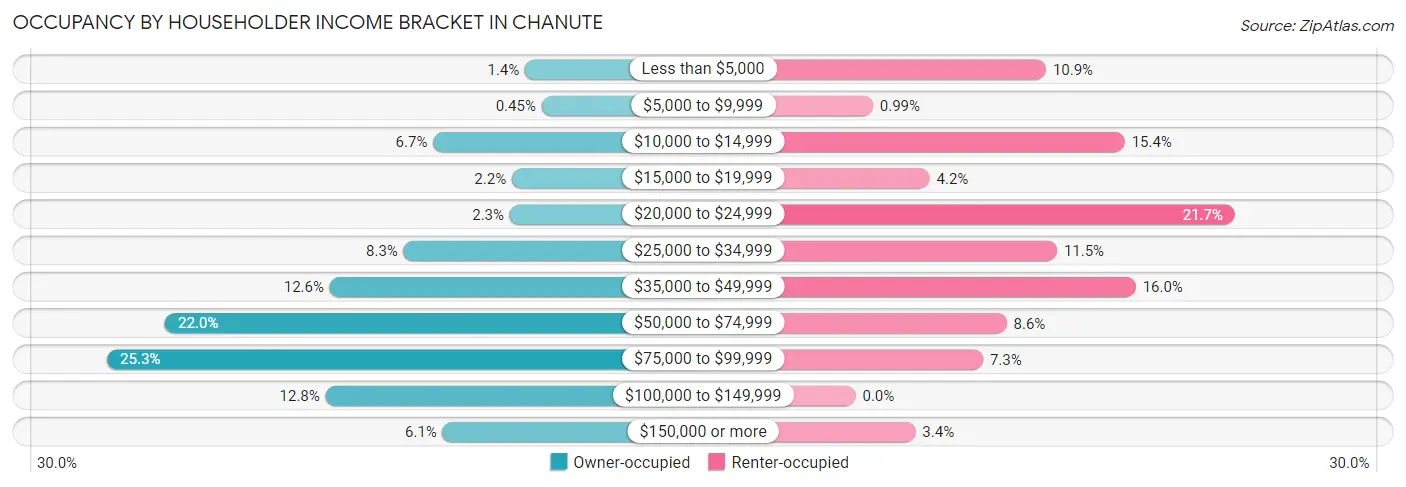
| Income Bracket | Owner-occupied | Renter-occupied |
| Less than $5,000 | 34 (1.4%) | 121 (10.9%) |
| $5,000 to $9,999 | 11 (0.4%) | 11 (1.0%) |
| $10,000 to $14,999 | 161 (6.7%) | 171 (15.4%) |
| $15,000 to $19,999 | 52 (2.1%) | 47 (4.2%) |
| $20,000 to $24,999 | 55 (2.3%) | 241 (21.7%) |
| $25,000 to $34,999 | 202 (8.3%) | 128 (11.5%) |
| $35,000 to $49,999 | 304 (12.6%) | 178 (16.0%) |
| $50,000 to $74,999 | 532 (22.0%) | 96 (8.6%) |
| $75,000 to $99,999 | 612 (25.3%) | 81 (7.3%) |
| $100,000 to $149,999 | 310 (12.8%) | 0 (0.0%) |
| $150,000 or more | 148 (6.1%) | 38 (3.4%) |
| Total | 2,421 (100.0%) | 1,112 (100.0%) |
Monthly Housing Cost Tiers in Chanute
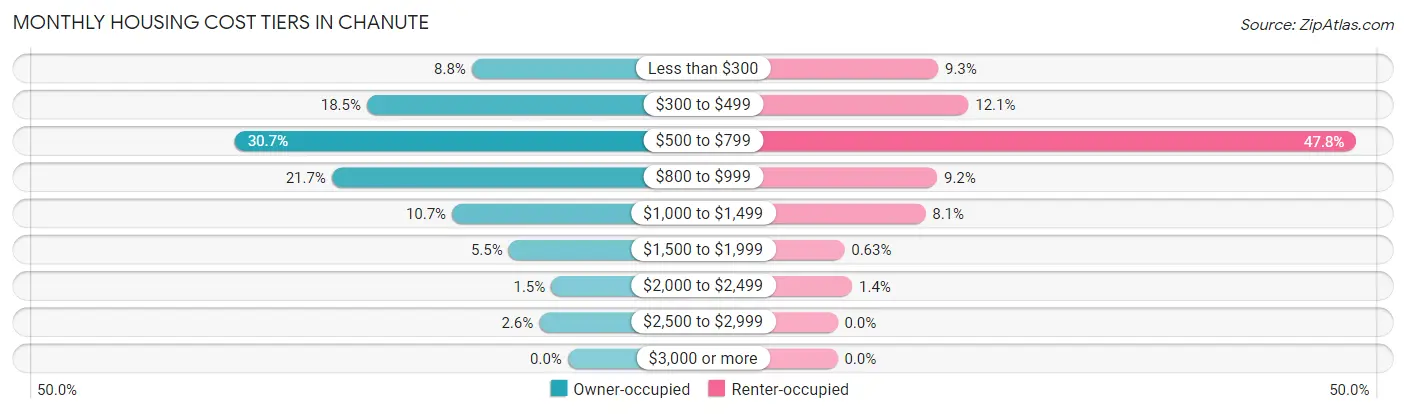
| Monthly Cost | Owner-occupied | Renter-occupied |
| Less than $300 | 214 (8.8%) | 103 (9.3%) |
| $300 to $499 | 448 (18.5%) | 134 (12.0%) |
| $500 to $799 | 742 (30.6%) | 531 (47.7%) |
| $800 to $999 | 526 (21.7%) | 102 (9.2%) |
| $1,000 to $1,499 | 258 (10.7%) | 90 (8.1%) |
| $1,500 to $1,999 | 132 (5.4%) | 7 (0.6%) |
| $2,000 to $2,499 | 37 (1.5%) | 15 (1.3%) |
| $2,500 to $2,999 | 64 (2.6%) | 0 (0.0%) |
| $3,000 or more | 0 (0.0%) | 0 (0.0%) |
| Total | 2,421 (100.0%) | 1,112 (100.0%) |
Physical Housing Characteristics in Chanute
Housing Structures in Chanute

| Structure Type | # Housing Units | % Housing Units |
| Single Unit, Detached | 3,036 | 85.9% |
| Single Unit, Attached | 42 | 1.2% |
| 2 Unit Apartments | 74 | 2.1% |
| 3 or 4 Unit Apartments | 97 | 2.8% |
| 5 to 9 Unit Apartments | 81 | 2.3% |
| 10 or more Apartments | 203 | 5.8% |
| Mobile Home / Other | 0 | 0.0% |
| Total | 3,533 | 100.0% |
Housing Structures by Occupancy in Chanute
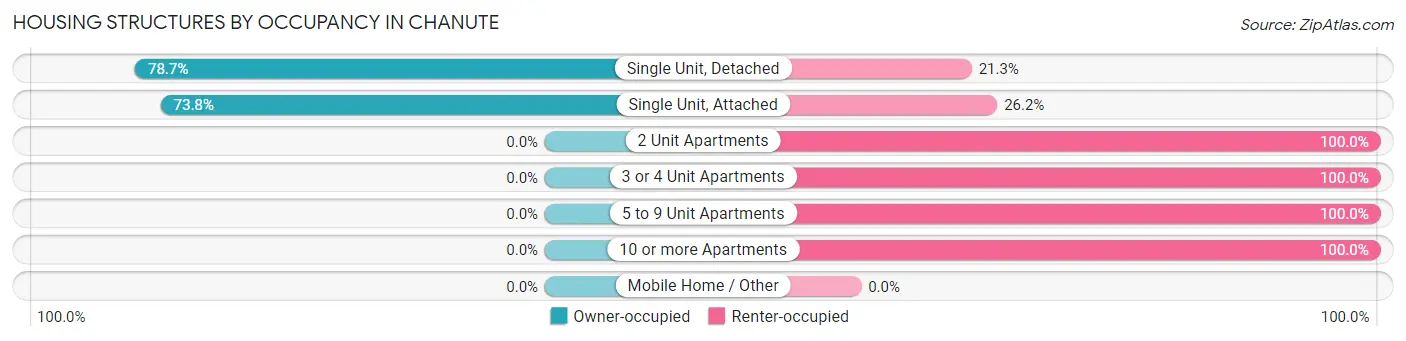
| Structure Type | Owner-occupied | Renter-occupied |
| Single Unit, Detached | 2,390 (78.7%) | 646 (21.3%) |
| Single Unit, Attached | 31 (73.8%) | 11 (26.2%) |
| 2 Unit Apartments | 0 (0.0%) | 74 (100.0%) |
| 3 or 4 Unit Apartments | 0 (0.0%) | 97 (100.0%) |
| 5 to 9 Unit Apartments | 0 (0.0%) | 81 (100.0%) |
| 10 or more Apartments | 0 (0.0%) | 203 (100.0%) |
| Mobile Home / Other | 0 (0.0%) | 0 (0.0%) |
| Total | 2,421 (68.5%) | 1,112 (31.5%) |
Housing Structures by Number of Rooms in Chanute
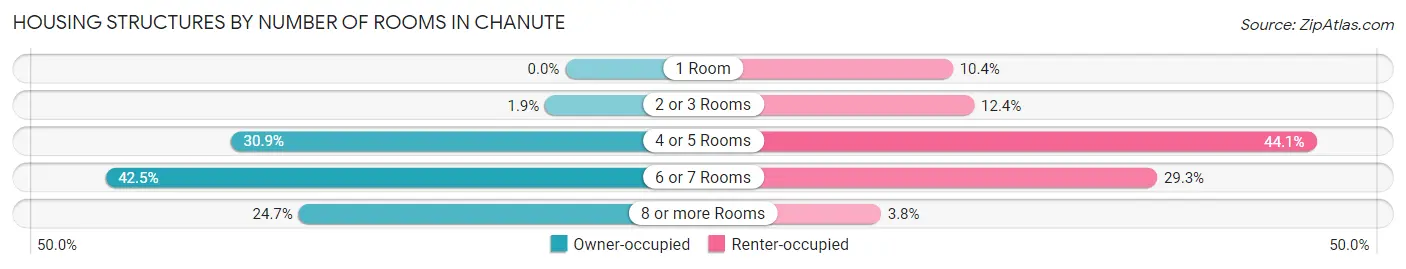
| Number of Rooms | Owner-occupied | Renter-occupied |
| 1 Room | 0 (0.0%) | 116 (10.4%) |
| 2 or 3 Rooms | 45 (1.9%) | 138 (12.4%) |
| 4 or 5 Rooms | 749 (30.9%) | 490 (44.1%) |
| 6 or 7 Rooms | 1,030 (42.5%) | 326 (29.3%) |
| 8 or more Rooms | 597 (24.7%) | 42 (3.8%) |
| Total | 2,421 (100.0%) | 1,112 (100.0%) |
Housing Structure by Heating Type in Chanute
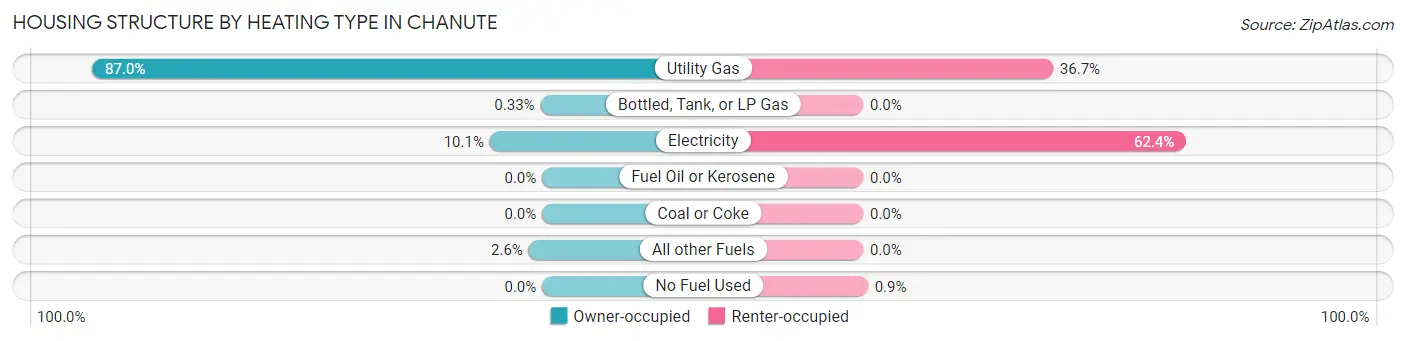
| Heating Type | Owner-occupied | Renter-occupied |
| Utility Gas | 2,105 (87.0%) | 408 (36.7%) |
| Bottled, Tank, or LP Gas | 8 (0.3%) | 0 (0.0%) |
| Electricity | 245 (10.1%) | 694 (62.4%) |
| Fuel Oil or Kerosene | 0 (0.0%) | 0 (0.0%) |
| Coal or Coke | 0 (0.0%) | 0 (0.0%) |
| All other Fuels | 63 (2.6%) | 0 (0.0%) |
| No Fuel Used | 0 (0.0%) | 10 (0.9%) |
| Total | 2,421 (100.0%) | 1,112 (100.0%) |
Household Vehicle Usage in Chanute
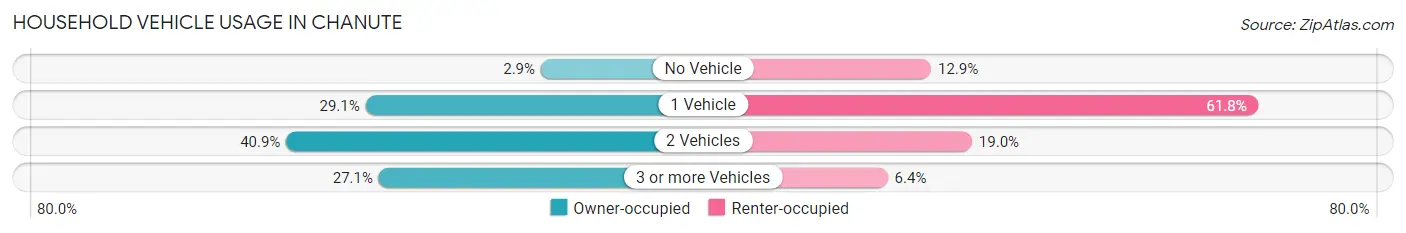
| Vehicles per Household | Owner-occupied | Renter-occupied |
| No Vehicle | 70 (2.9%) | 143 (12.9%) |
| 1 Vehicle | 704 (29.1%) | 687 (61.8%) |
| 2 Vehicles | 991 (40.9%) | 211 (19.0%) |
| 3 or more Vehicles | 656 (27.1%) | 71 (6.4%) |
| Total | 2,421 (100.0%) | 1,112 (100.0%) |
Real Estate & Mortgages in Chanute
Real Estate and Mortgage Overview in Chanute
| Characteristic | Without Mortgage | With Mortgage |
| Housing Units | 1,219 | 1,202 |
| Median Property Value | $84,600 | $91,200 |
| Median Household Income | $53,834 | $84 |
| Monthly Housing Costs | $477 | $0 |
| Real Estate Taxes | $1,309 | $0 |
Property Value by Mortgage Status in Chanute
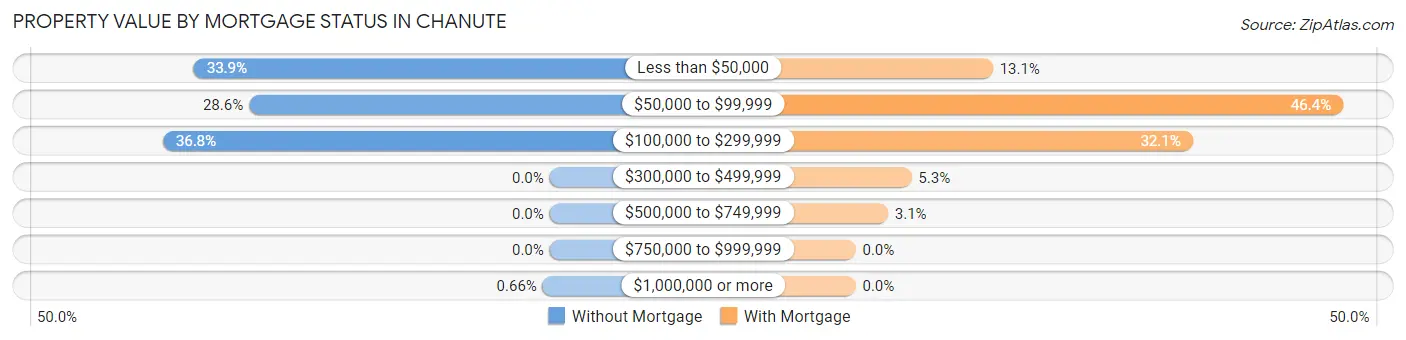
| Property Value | Without Mortgage | With Mortgage |
| Less than $50,000 | 413 (33.9%) | 157 (13.1%) |
| $50,000 to $99,999 | 349 (28.6%) | 558 (46.4%) |
| $100,000 to $299,999 | 449 (36.8%) | 386 (32.1%) |
| $300,000 to $499,999 | 0 (0.0%) | 64 (5.3%) |
| $500,000 to $749,999 | 0 (0.0%) | 37 (3.1%) |
| $750,000 to $999,999 | 0 (0.0%) | 0 (0.0%) |
| $1,000,000 or more | 8 (0.7%) | 0 (0.0%) |
| Total | 1,219 (100.0%) | 1,202 (100.0%) |
Household Income by Mortgage Status in Chanute
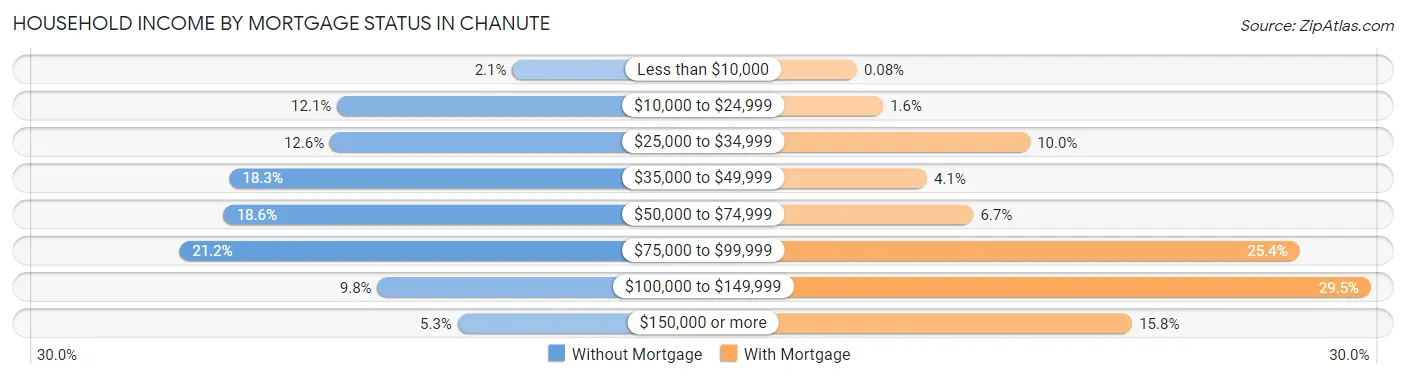
| Household Income | Without Mortgage | With Mortgage |
| Less than $10,000 | 26 (2.1%) | 1 (0.1%) |
| $10,000 to $24,999 | 148 (12.1%) | 19 (1.6%) |
| $25,000 to $34,999 | 153 (12.6%) | 120 (10.0%) |
| $35,000 to $49,999 | 223 (18.3%) | 49 (4.1%) |
| $50,000 to $74,999 | 227 (18.6%) | 81 (6.7%) |
| $75,000 to $99,999 | 258 (21.2%) | 305 (25.4%) |
| $100,000 to $149,999 | 120 (9.8%) | 354 (29.4%) |
| $150,000 or more | 64 (5.2%) | 190 (15.8%) |
| Total | 1,219 (100.0%) | 1,202 (100.0%) |
Property Value to Household Income Ratio in Chanute
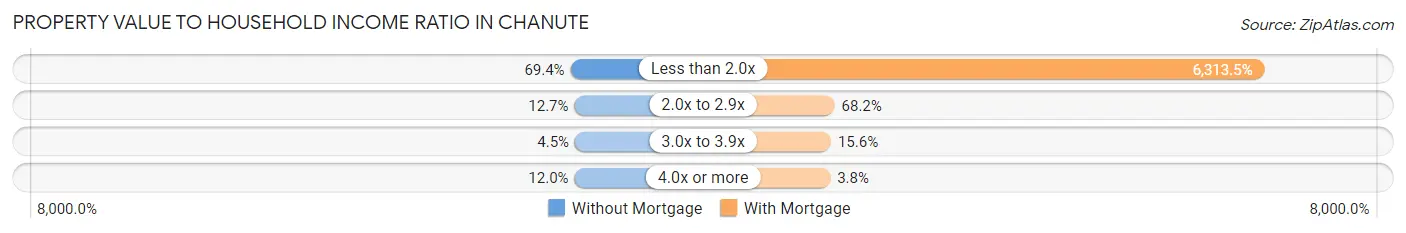
| Value-to-Income Ratio | Without Mortgage | With Mortgage |
| Less than 2.0x | 846 (69.4%) | 75,888 (6,313.5%) |
| 2.0x to 2.9x | 155 (12.7%) | 820 (68.2%) |
| 3.0x to 3.9x | 55 (4.5%) | 187 (15.6%) |
| 4.0x or more | 146 (12.0%) | 46 (3.8%) |
| Total | 1,219 (100.0%) | 1,202 (100.0%) |
Real Estate Taxes by Mortgage Status in Chanute
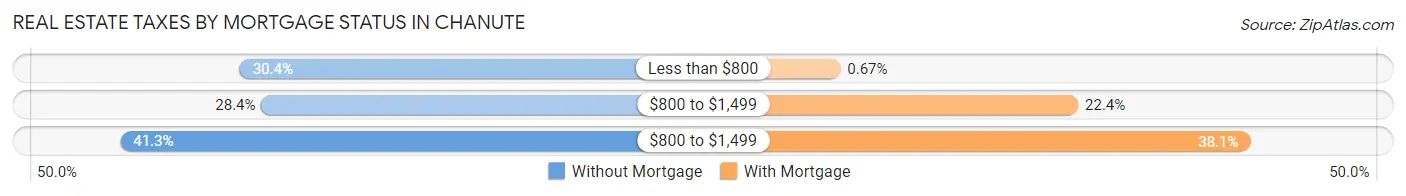
| Property Taxes | Without Mortgage | With Mortgage |
| Less than $800 | 370 (30.3%) | 8 (0.7%) |
| $800 to $1,499 | 346 (28.4%) | 269 (22.4%) |
| $800 to $1,499 | 503 (41.3%) | 458 (38.1%) |
| Total | 1,219 (100.0%) | 1,202 (100.0%) |
Health & Disability in Chanute
Health Insurance Coverage by Age in Chanute
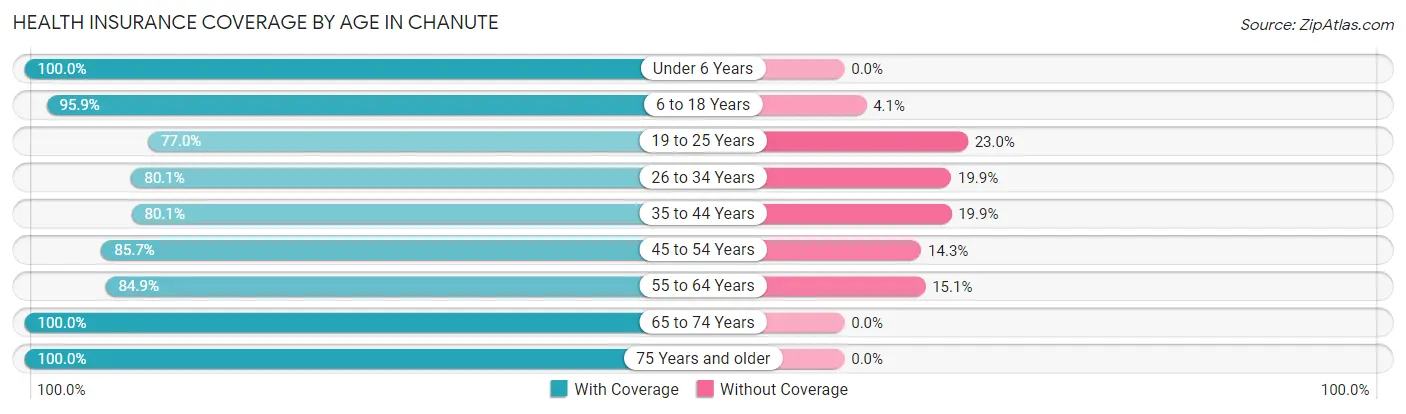
| Age Bracket | With Coverage | Without Coverage |
| Under 6 Years | 590 (100.0%) | 0 (0.0%) |
| 6 to 18 Years | 1,621 (95.9%) | 69 (4.1%) |
| 19 to 25 Years | 609 (77.0%) | 182 (23.0%) |
| 26 to 34 Years | 700 (80.1%) | 174 (19.9%) |
| 35 to 44 Years | 847 (80.1%) | 211 (19.9%) |
| 45 to 54 Years | 855 (85.7%) | 143 (14.3%) |
| 55 to 64 Years | 861 (84.9%) | 153 (15.1%) |
| 65 to 74 Years | 1,030 (100.0%) | 0 (0.0%) |
| 75 Years and older | 566 (100.0%) | 0 (0.0%) |
| Total | 7,679 (89.2%) | 932 (10.8%) |
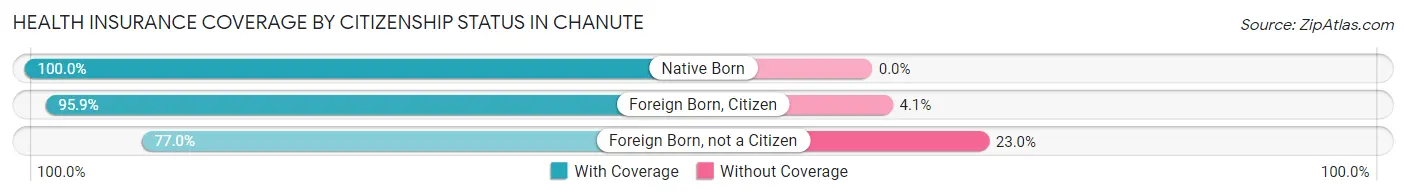
Health Insurance Coverage by Citizenship Status in Chanute
| Citizenship Status | With Coverage | Without Coverage |
| Native Born | 590 (100.0%) | 0 (0.0%) |
| Foreign Born, Citizen | 1,621 (95.9%) | 69 (4.1%) |
| Foreign Born, not a Citizen | 609 (77.0%) | 182 (23.0%) |
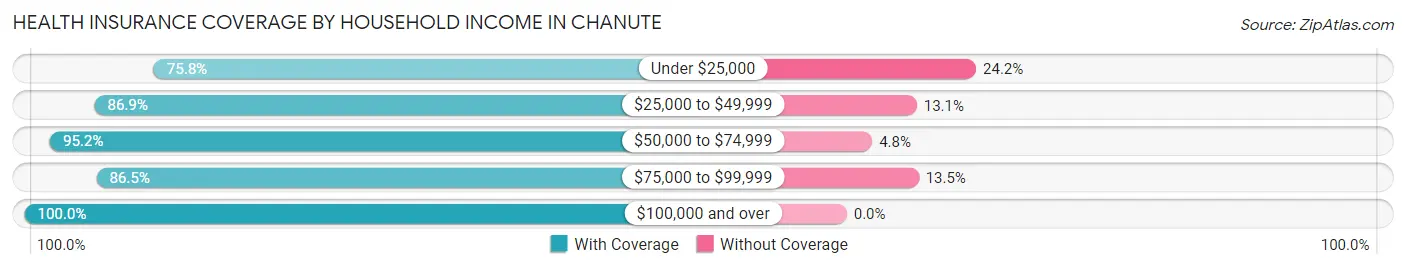
Health Insurance Coverage by Household Income in Chanute
| Household Income | With Coverage | Without Coverage |
| Under $25,000 | 1,129 (75.8%) | 361 (24.2%) |
| $25,000 to $49,999 | 1,584 (86.9%) | 239 (13.1%) |
| $50,000 to $74,999 | 1,778 (95.2%) | 89 (4.8%) |
| $75,000 to $99,999 | 1,503 (86.5%) | 234 (13.5%) |
| $100,000 and over | 1,391 (100.0%) | 0 (0.0%) |
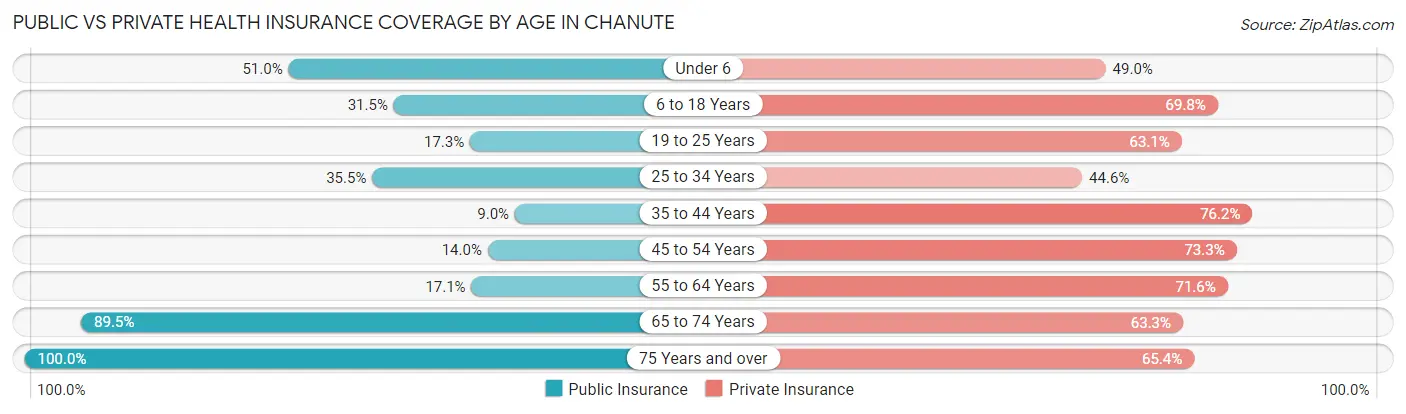
Public vs Private Health Insurance Coverage by Age in Chanute
| Age Bracket | Public Insurance | Private Insurance |
| Under 6 | 301 (51.0%) | 289 (49.0%) |
| 6 to 18 Years | 532 (31.5%) | 1,179 (69.8%) |
| 19 to 25 Years | 137 (17.3%) | 499 (63.1%) |
| 25 to 34 Years | 310 (35.5%) | 390 (44.6%) |
| 35 to 44 Years | 95 (9.0%) | 806 (76.2%) |
| 45 to 54 Years | 140 (14.0%) | 731 (73.3%) |
| 55 to 64 Years | 173 (17.1%) | 726 (71.6%) |
| 65 to 74 Years | 922 (89.5%) | 652 (63.3%) |
| 75 Years and over | 566 (100.0%) | 370 (65.4%) |
| Total | 3,176 (36.9%) | 5,642 (65.5%) |
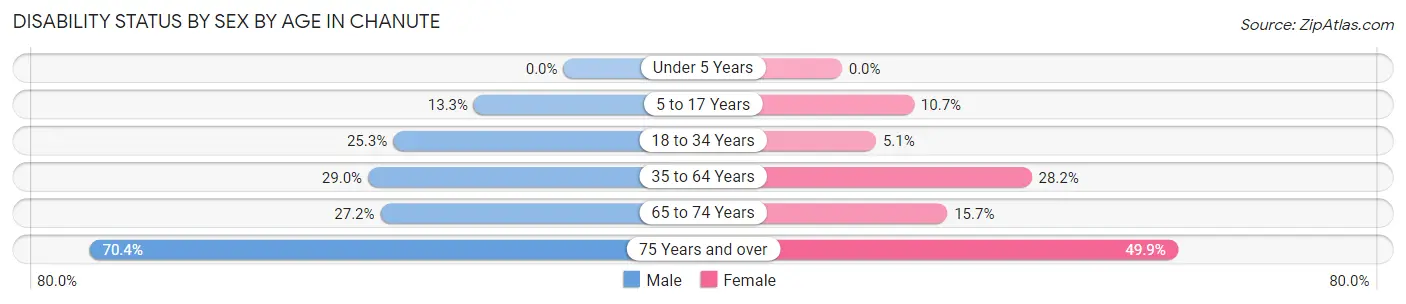
Disability Status by Sex by Age in Chanute
| Age Bracket | Male | Female |
| Under 5 Years | 0 (0.0%) | 0 (0.0%) |
| 5 to 17 Years | 116 (13.3%) | 87 (10.7%) |
| 18 to 34 Years | 229 (25.3%) | 46 (5.1%) |
| 35 to 64 Years | 410 (29.0%) | 467 (28.2%) |
| 65 to 74 Years | 122 (27.2%) | 91 (15.7%) |
| 75 Years and over | 140 (70.4%) | 183 (49.9%) |
Disability Class by Sex by Age in Chanute
Disability Class: Hearing Difficulty
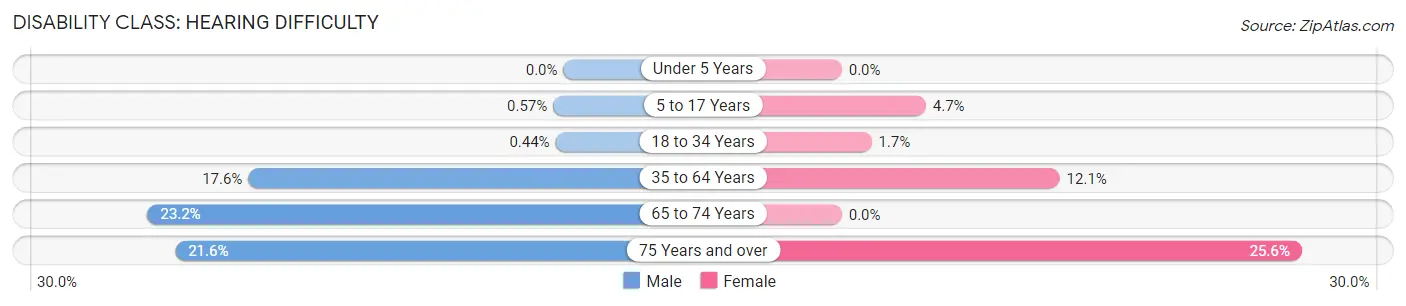
| Age Bracket | Male | Female |
| Under 5 Years | 0 (0.0%) | 0 (0.0%) |
| 5 to 17 Years | 5 (0.6%) | 38 (4.7%) |
| 18 to 34 Years | 4 (0.4%) | 15 (1.7%) |
| 35 to 64 Years | 248 (17.5%) | 201 (12.1%) |
| 65 to 74 Years | 104 (23.2%) | 0 (0.0%) |
| 75 Years and over | 43 (21.6%) | 94 (25.6%) |
Disability Class: Vision Difficulty
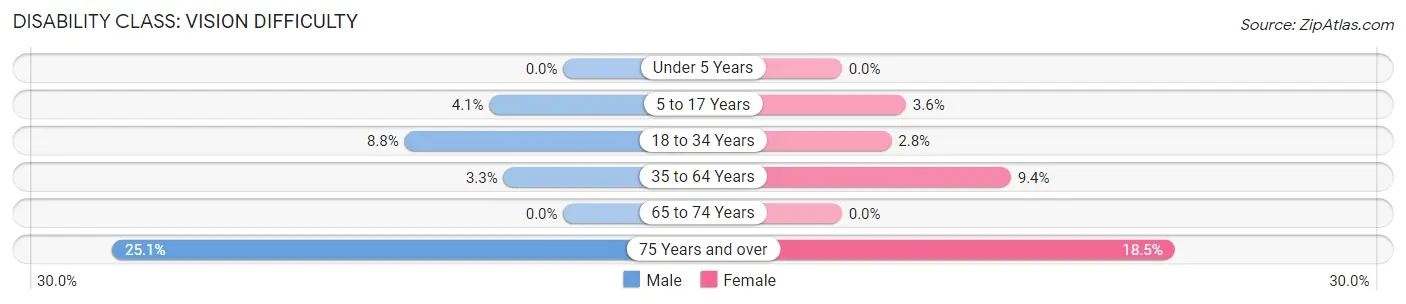
| Age Bracket | Male | Female |
| Under 5 Years | 0 (0.0%) | 0 (0.0%) |
| 5 to 17 Years | 36 (4.1%) | 29 (3.6%) |
| 18 to 34 Years | 80 (8.8%) | 25 (2.8%) |
| 35 to 64 Years | 47 (3.3%) | 156 (9.4%) |
| 65 to 74 Years | 0 (0.0%) | 0 (0.0%) |
| 75 Years and over | 50 (25.1%) | 68 (18.5%) |
Disability Class: Cognitive Difficulty
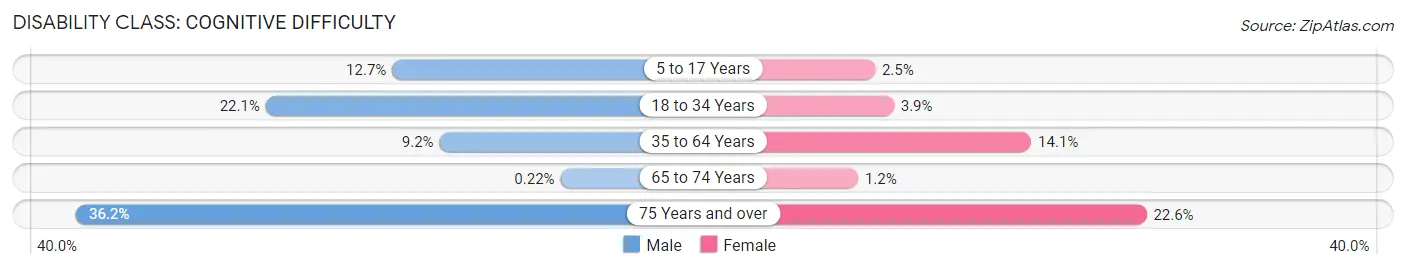
| Age Bracket | Male | Female |
| 5 to 17 Years | 111 (12.7%) | 20 (2.5%) |
| 18 to 34 Years | 200 (22.1%) | 35 (3.9%) |
| 35 to 64 Years | 130 (9.2%) | 233 (14.1%) |
| 65 to 74 Years | 1 (0.2%) | 7 (1.2%) |
| 75 Years and over | 72 (36.2%) | 83 (22.6%) |
Disability Class: Ambulatory Difficulty
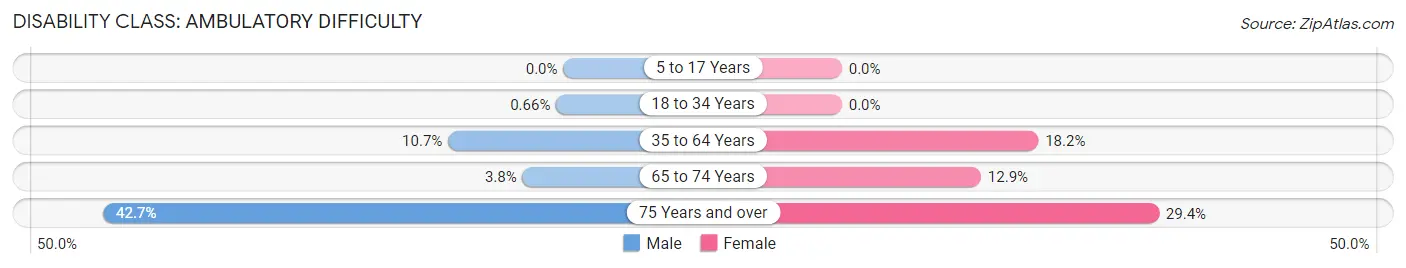
| Age Bracket | Male | Female |
| 5 to 17 Years | 0 (0.0%) | 0 (0.0%) |
| 18 to 34 Years | 6 (0.7%) | 0 (0.0%) |
| 35 to 64 Years | 151 (10.7%) | 302 (18.2%) |
| 65 to 74 Years | 17 (3.8%) | 75 (12.9%) |
| 75 Years and over | 85 (42.7%) | 108 (29.4%) |
Disability Class: Self-Care Difficulty
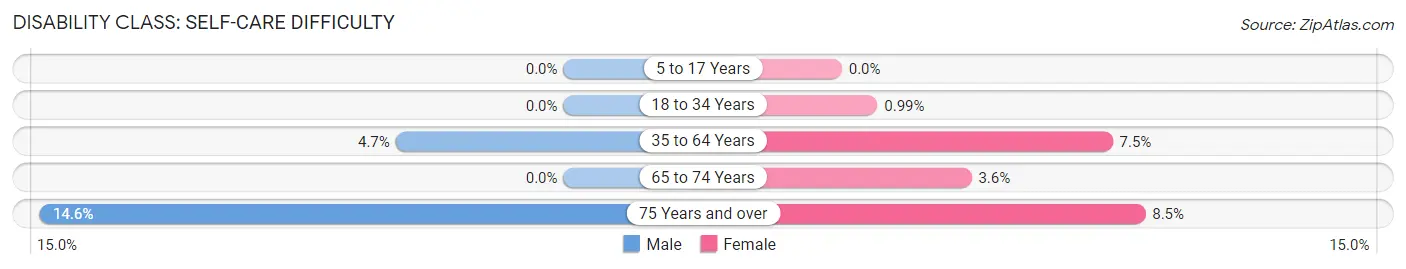
| Age Bracket | Male | Female |
| 5 to 17 Years | 0 (0.0%) | 0 (0.0%) |
| 18 to 34 Years | 0 (0.0%) | 9 (1.0%) |
| 35 to 64 Years | 66 (4.7%) | 125 (7.5%) |
| 65 to 74 Years | 0 (0.0%) | 21 (3.6%) |
| 75 Years and over | 29 (14.6%) | 31 (8.5%) |
Technology Access in Chanute
Computing Device Access in Chanute
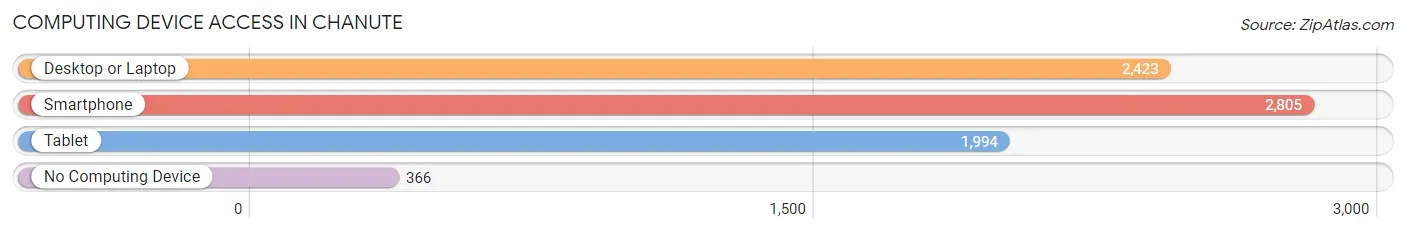
| Device Type | # Households | % Households |
| Desktop or Laptop | 2,423 | 68.6% |
| Smartphone | 2,805 | 79.4% |
| Tablet | 1,994 | 56.4% |
| No Computing Device | 366 | 10.4% |
| Total | 3,533 | 100.0% |
Internet Access in Chanute
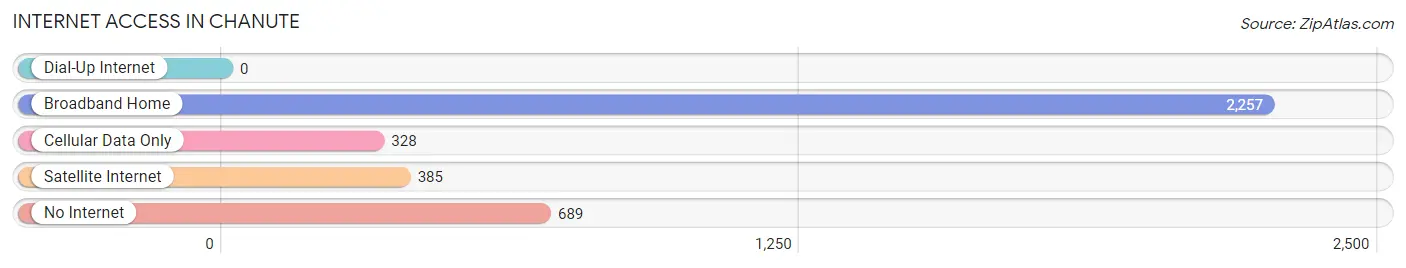
| Internet Type | # Households | % Households |
| Dial-Up Internet | 0 | 0.0% |
| Broadband Home | 2,257 | 63.9% |
| Cellular Data Only | 328 | 9.3% |
| Satellite Internet | 385 | 10.9% |
| No Internet | 689 | 19.5% |
| Total | 3,533 | 100.0% |
Chanute Summary
History
The city of Chanute, Kansas is located in the southeastern corner of the state, in Neosho County. It is the county seat and the largest city in the county. The city was founded in 1873 and named after the famous railroad engineer, Octave Chanute. The city was originally a stop on the Missouri Pacific Railroad, and it quickly grew into a thriving community.
The city was incorporated in 1874 and the first mayor was elected in 1875. The city was a major hub for the railroad industry, and it was also a major agricultural center. The city was home to several large grain elevators, and it was also a major shipping point for livestock.
In the early 1900s, the city experienced a period of rapid growth. The population increased from 1,000 in 1900 to over 5,000 by 1910. The city was home to several large businesses, including a flour mill, a brick factory, and a furniture factory.
The city continued to grow throughout the 20th century. In the 1950s, the city was home to several large manufacturing plants, including a paper mill and a steel mill. The city also had a thriving retail sector, with several large department stores and specialty shops.
The city experienced a period of decline in the late 20th century, as many of the manufacturing plants closed and the population decreased. However, the city has experienced a resurgence in recent years, with new businesses and industries moving into the area.
Geography
Chanute is located in the southeastern corner of Kansas, in Neosho County. The city is situated on the Neosho River, and it is surrounded by rolling hills and farmland. The city is located about 50 miles south of the Kansas-Missouri border.
The city has a total area of 5.3 square miles, all of which is land. The city has a humid continental climate, with hot summers and cold winters. The average annual temperature is 54 degrees Fahrenheit, and the average annual precipitation is 36 inches.
Economy
The economy of Chanute is largely based on agriculture and manufacturing. The city is home to several large grain elevators, and it is also a major shipping point for livestock. The city is also home to several large manufacturing plants, including a paper mill and a steel mill.
The city also has a thriving retail sector, with several large department stores and specialty shops. The city is also home to several large employers, including the Neosho County Hospital and the Neosho County Community College.
Demographics
As of the 2010 census, the population of Chanute was 9,119. The racial makeup of the city was 87.3% White, 8.2% African American, 0.7% Native American, 0.5% Asian, 0.1% Pacific Islander, and 2.2% from other races. Hispanic or Latino of any race were 3.2% of the population.
The median household income in the city was $37,917, and the median family income was $45,938. The per capita income in the city was $19,845. About 15.3% of the population was below the poverty line.
Common Questions
What is Per Capita Income in Chanute?
Per Capita income in Chanute is $28,800.
What is the Median Family Income in Chanute?
Median Family Income in Chanute is $66,563.
What is the Median Household income in Chanute?
Median Household Income in Chanute is $52,608.
What is Income or Wage Gap in Chanute?
Income or Wage Gap in Chanute is 35.4%.
Women in Chanute earn 64.6 cents for every dollar earned by a man.
What is Inequality or Gini Index in Chanute?
Inequality or Gini Index in Chanute is 0.46.
What is the Total Population of Chanute?
Total Population of Chanute is 8,713.
What is the Total Male Population of Chanute?
Total Male Population of Chanute is 4,151.
What is the Total Female Population of Chanute?
Total Female Population of Chanute is 4,562.
What is the Ratio of Males per 100 Females in Chanute?
There are 90.99 Males per 100 Females in Chanute.
What is the Ratio of Females per 100 Males in Chanute?
There are 109.90 Females per 100 Males in Chanute.
What is the Median Population Age in Chanute?
Median Population Age in Chanute is 38.0 Years.
What is the Average Family Size in Chanute
Average Family Size in Chanute is 2.9 People.
What is the Average Household Size in Chanute
Average Household Size in Chanute is 2.4 People.
How Large is the Labor Force in Chanute?
There are 4,000 People in the Labor Forcein in Chanute.
What is the Percentage of People in the Labor Force in Chanute?
57.4% of People are in the Labor Force in Chanute.
What is the Unemployment Rate in Chanute?
Unemployment Rate in Chanute is 7.2%.