Carbondale, KS Map & Demographics
Carbondale Map
Carbondale Overview
$29,629
PER CAPITA INCOME
$85,078
AVG FAMILY INCOME
$65,764
AVG HOUSEHOLD INCOME
31.3%
WAGE / INCOME GAP [ % ]
68.7¢/ $1
WAGE / INCOME GAP [ $ ]
0.39
INEQUALITY / GINI INDEX
1,396
TOTAL POPULATION
647
MALE POPULATION
749
FEMALE POPULATION
86.38
MALES / 100 FEMALES
115.77
FEMALES / 100 MALES
35.9
MEDIAN AGE
3.1
AVG FAMILY SIZE
2.5
AVG HOUSEHOLD SIZE
729
LABOR FORCE [ PEOPLE ]
69.3%
PERCENT IN LABOR FORCE
1.7%
UNEMPLOYMENT RATE
Carbondale Zip Codes
Carbondale Area Codes
Income in Carbondale
Income Overview in Carbondale
Per Capita Income in Carbondale is $29,629, while median incomes of families and households are $85,078 and $65,764 respectively.
| Characteristic | Number | Measure |
| Per Capita Income | 1,396 | $29,629 |
| Median Family Income | 369 | $85,078 |
| Mean Family Income | 369 | $88,867 |
| Median Household Income | 553 | $65,764 |
| Mean Household Income | 553 | $74,972 |
| Income Deficit | 369 | $0 |
| Wage / Income Gap (%) | 1,396 | 31.35% |
| Wage / Income Gap ($) | 1,396 | 68.65¢ per $1 |
| Gini / Inequality Index | 1,396 | 0.39 |
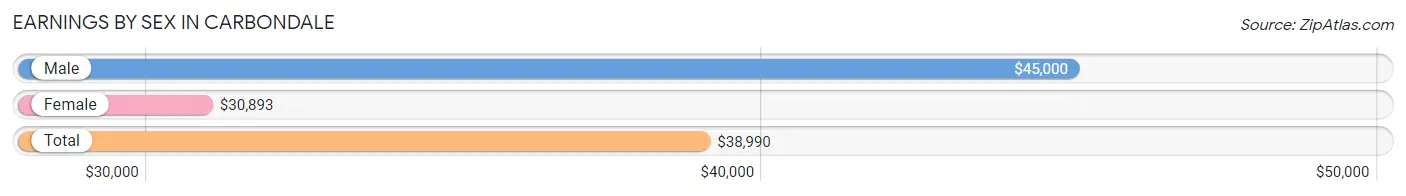
Earnings by Sex in Carbondale
Average Earnings in Carbondale are $38,990, $45,000 for men and $30,893 for women, a difference of 31.4%.
| Sex | Number | Average Earnings |
| Male | 346 (46.2%) | $45,000 |
| Female | 403 (53.8%) | $30,893 |
| Total | 749 (100.0%) | $38,990 |
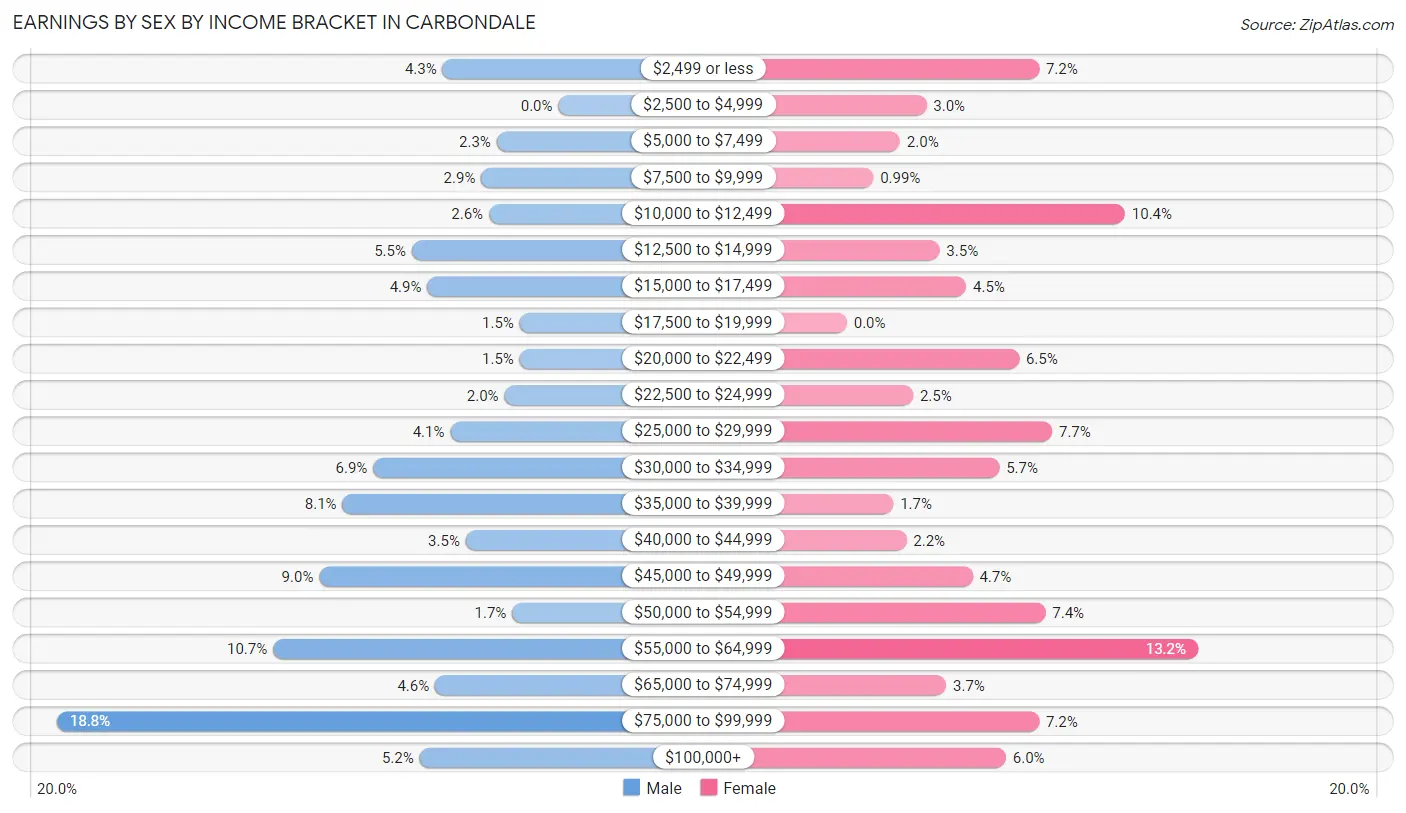
Earnings by Sex by Income Bracket in Carbondale
The most common earnings brackets in Carbondale are $75,000 to $99,999 for men (65 | 18.8%) and $55,000 to $64,999 for women (53 | 13.2%).
| Income | Male | Female |
| $2,499 or less | 15 (4.3%) | 29 (7.2%) |
| $2,500 to $4,999 | 0 (0.0%) | 12 (3.0%) |
| $5,000 to $7,499 | 8 (2.3%) | 8 (2.0%) |
| $7,500 to $9,999 | 10 (2.9%) | 4 (1.0%) |
| $10,000 to $12,499 | 9 (2.6%) | 42 (10.4%) |
| $12,500 to $14,999 | 19 (5.5%) | 14 (3.5%) |
| $15,000 to $17,499 | 17 (4.9%) | 18 (4.5%) |
| $17,500 to $19,999 | 5 (1.5%) | 0 (0.0%) |
| $20,000 to $22,499 | 5 (1.5%) | 26 (6.5%) |
| $22,500 to $24,999 | 7 (2.0%) | 10 (2.5%) |
| $25,000 to $29,999 | 14 (4.1%) | 31 (7.7%) |
| $30,000 to $34,999 | 24 (6.9%) | 23 (5.7%) |
| $35,000 to $39,999 | 28 (8.1%) | 7 (1.7%) |
| $40,000 to $44,999 | 12 (3.5%) | 9 (2.2%) |
| $45,000 to $49,999 | 31 (9.0%) | 19 (4.7%) |
| $50,000 to $54,999 | 6 (1.7%) | 30 (7.4%) |
| $55,000 to $64,999 | 37 (10.7%) | 53 (13.2%) |
| $65,000 to $74,999 | 16 (4.6%) | 15 (3.7%) |
| $75,000 to $99,999 | 65 (18.8%) | 29 (7.2%) |
| $100,000+ | 18 (5.2%) | 24 (6.0%) |
| Total | 346 (100.0%) | 403 (100.0%) |
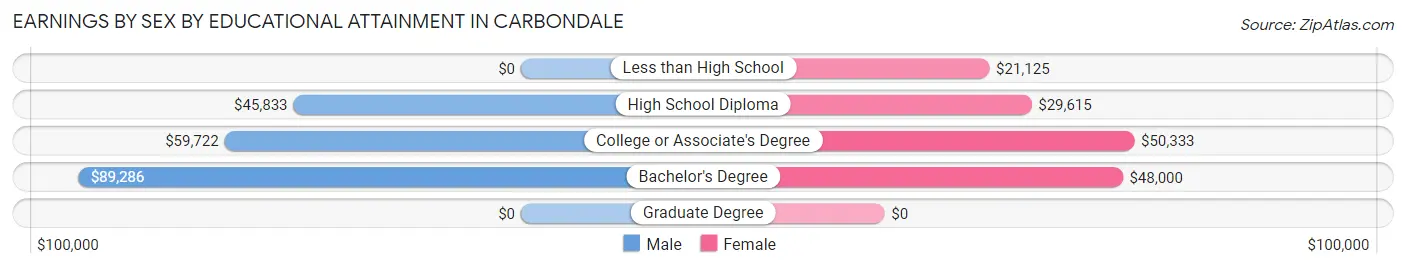
Earnings by Sex by Educational Attainment in Carbondale
Average earnings in Carbondale are $56,250 for men and $45,893 for women, a difference of 18.4%. Men with an educational attainment of bachelor's degree enjoy the highest average annual earnings of $89,286, while those with high school diploma education earn the least with $45,833. Women with an educational attainment of college or associate's degree earn the most with the average annual earnings of $50,333, while those with less than high school education have the smallest earnings of $21,125.
| Educational Attainment | Male Income | Female Income |
| Less than High School | - | - |
| High School Diploma | $45,833 | $29,615 |
| College or Associate's Degree | $59,722 | $50,333 |
| Bachelor's Degree | $89,286 | $48,000 |
| Graduate Degree | - | - |
| Total | $56,250 | $45,893 |
Family Income in Carbondale
Family Income Brackets in Carbondale
According to the Carbondale family income data, there are 78 families falling into the $75,000 to $99,999 income range, which is the most common income bracket and makes up 21.1% of all families. Conversely, the less than $10,000 income bracket is the least frequent group with only 5 families (1.4%) belonging to this category.
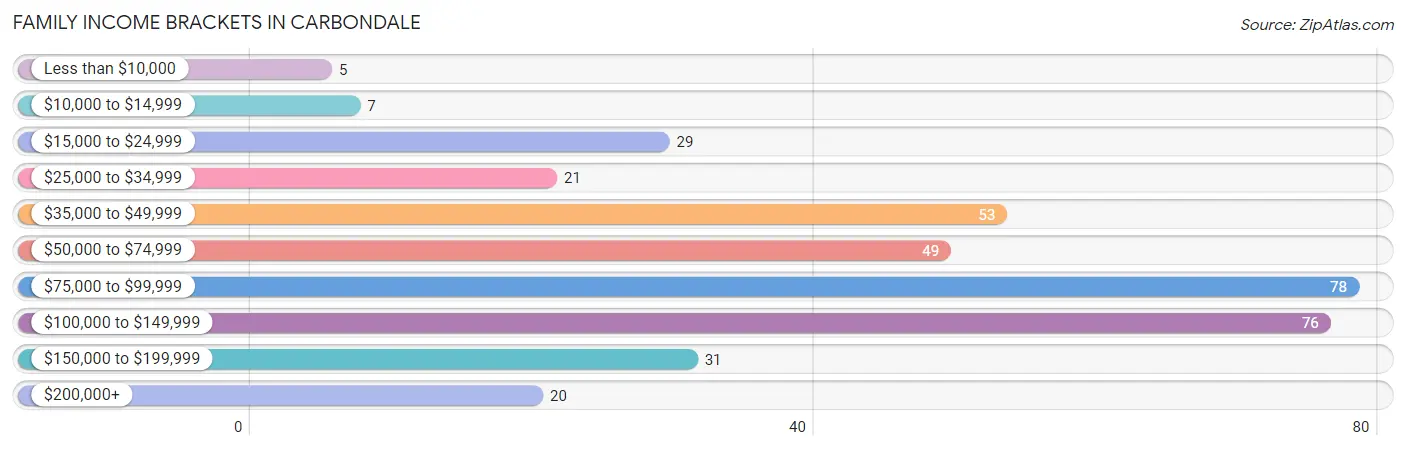
| Income Bracket | # Families | % Families |
| Less than $10,000 | 5 | 1.4% |
| $10,000 to $14,999 | 7 | 1.9% |
| $15,000 to $24,999 | 29 | 7.9% |
| $25,000 to $34,999 | 21 | 5.7% |
| $35,000 to $49,999 | 53 | 14.4% |
| $50,000 to $74,999 | 49 | 13.3% |
| $75,000 to $99,999 | 78 | 21.1% |
| $100,000 to $149,999 | 76 | 20.6% |
| $150,000 to $199,999 | 31 | 8.4% |
| $200,000+ | 20 | 5.4% |
Family Income by Famaliy Size in Carbondale
3-person families (90 | 24.4%) account for the highest median family income in Carbondale with $114,167 per family, while 3-person families (90 | 24.4%) have the highest median income of $38,056 per family member.
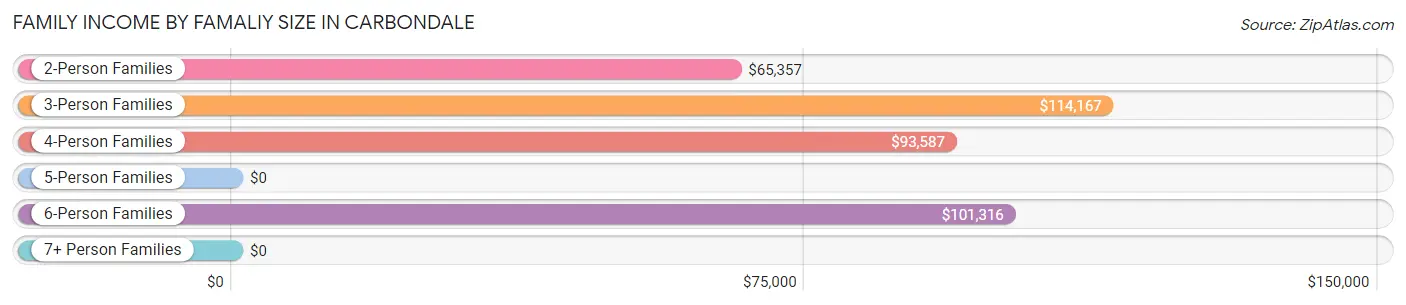
| Income Bracket | # Families | Median Income |
| 2-Person Families | 172 (46.6%) | $65,357 |
| 3-Person Families | 90 (24.4%) | $114,167 |
| 4-Person Families | 66 (17.9%) | $93,587 |
| 5-Person Families | 11 (3.0%) | $0 |
| 6-Person Families | 30 (8.1%) | $101,316 |
| 7+ Person Families | 0 (0.0%) | $0 |
| Total | 369 (100.0%) | $85,078 |
Family Income by Number of Earners in Carbondale
The median family income in Carbondale is $85,078, with families comprising 3+ earners (68) having the highest median family income of $159,688, while families with 1 earner (127) have the lowest median family income of $47,083, accounting for 18.4% and 34.4% of families, respectively.
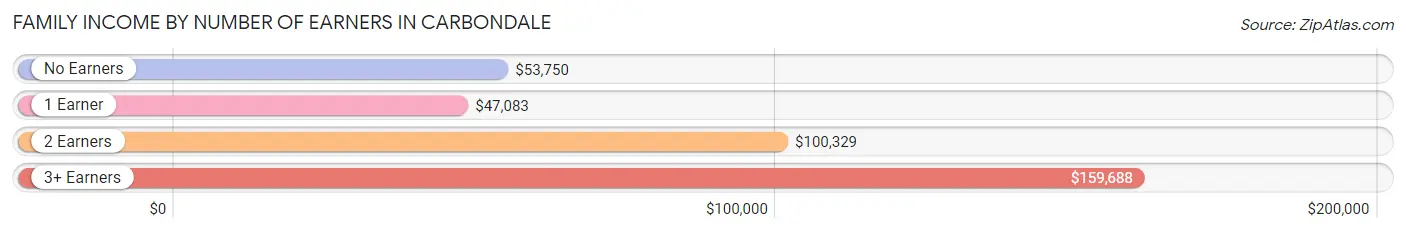
| Number of Earners | # Families | Median Income |
| No Earners | 71 (19.2%) | $53,750 |
| 1 Earner | 127 (34.4%) | $47,083 |
| 2 Earners | 103 (27.9%) | $100,329 |
| 3+ Earners | 68 (18.4%) | $159,688 |
| Total | 369 (100.0%) | $85,078 |
Household Income in Carbondale
Household Income Brackets in Carbondale
With 95 households falling in the category, the $35,000 to $49,999 income range is the most frequent in Carbondale, accounting for 17.2% of all households. In contrast, only 22 households (4.0%) fall into the less than $10,000 income bracket, making it the least populous group.
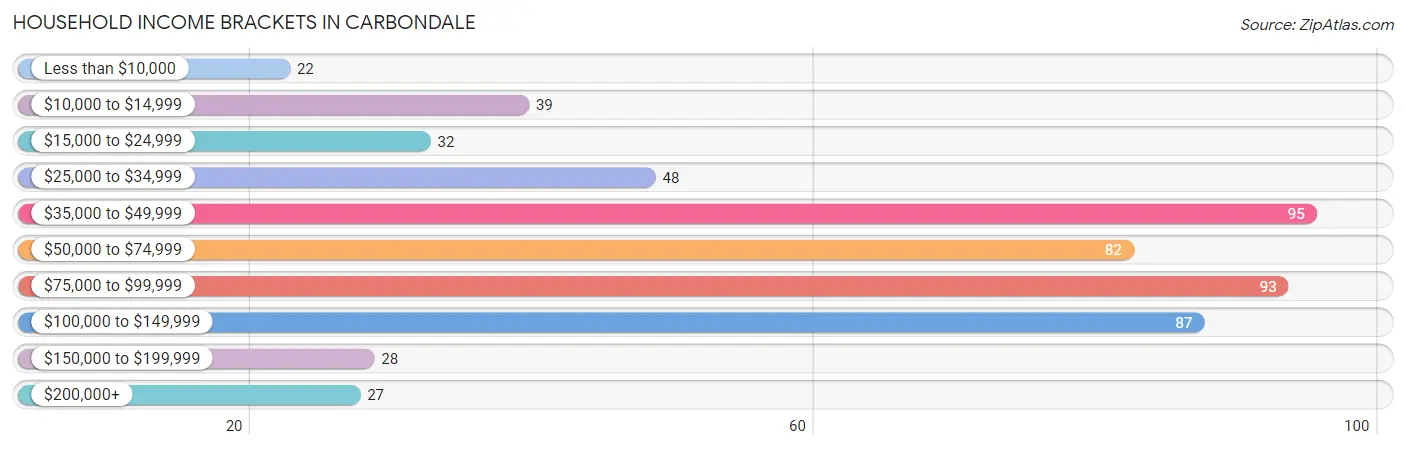
| Income Bracket | # Households | % Households |
| Less than $10,000 | 22 | 4.0% |
| $10,000 to $14,999 | 39 | 7.1% |
| $15,000 to $24,999 | 32 | 5.8% |
| $25,000 to $34,999 | 48 | 8.7% |
| $35,000 to $49,999 | 95 | 17.2% |
| $50,000 to $74,999 | 82 | 14.8% |
| $75,000 to $99,999 | 93 | 16.8% |
| $100,000 to $149,999 | 87 | 15.7% |
| $150,000 to $199,999 | 28 | 5.1% |
| $200,000+ | 27 | 4.9% |
Household Income by Householder Age in Carbondale
The median household income in Carbondale is $65,764, with the highest median household income of $93,859 found in the 25 to 44 years age bracket for the primary householder. A total of 199 households (36.0%) fall into this category. Meanwhile, the 15 to 24 years age bracket for the primary householder has the lowest median household income of $47,250, with 24 households (4.3%) in this group.
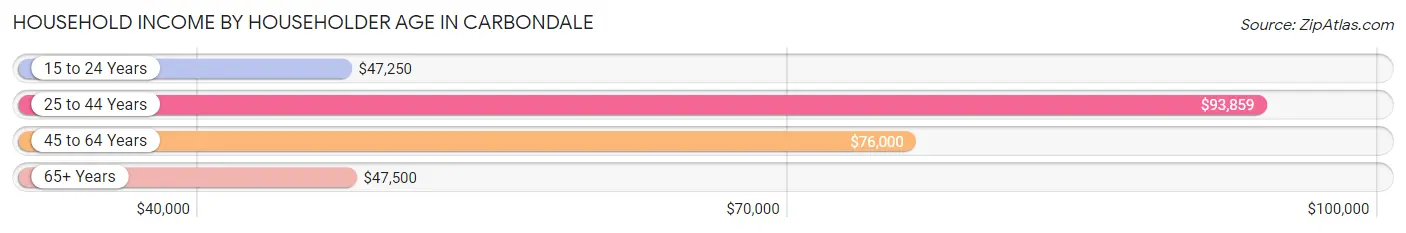
| Income Bracket | # Households | Median Income |
| 15 to 24 Years | 24 (4.3%) | $47,250 |
| 25 to 44 Years | 199 (36.0%) | $93,859 |
| 45 to 64 Years | 180 (32.6%) | $76,000 |
| 65+ Years | 150 (27.1%) | $47,500 |
| Total | 553 (100.0%) | $65,764 |
Poverty in Carbondale
Income Below Poverty by Sex and Age in Carbondale
With 11.1% poverty level for males and 18.7% for females among the residents of Carbondale, 15 year old males and 18 to 24 year old females are the most vulnerable to poverty, with 4 males (30.8%) and 9 females (42.9%) in their respective age groups living below the poverty level.
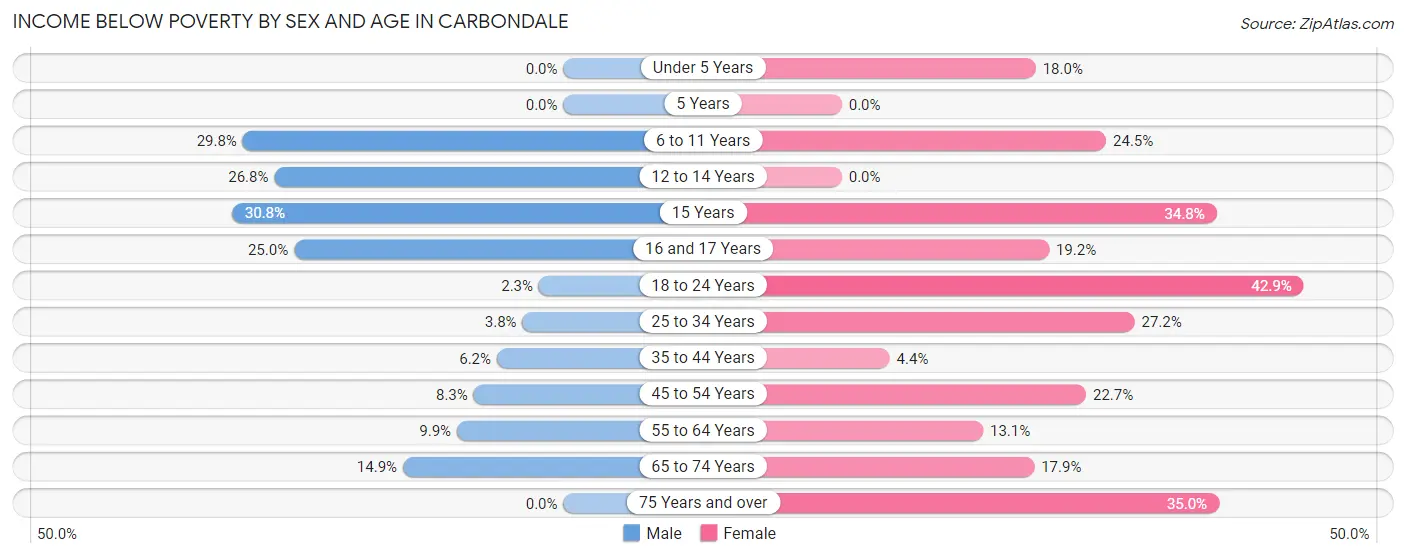
| Age Bracket | Male | Female |
| Under 5 Years | 0 (0.0%) | 9 (18.0%) |
| 5 Years | 0 (0.0%) | 0 (0.0%) |
| 6 to 11 Years | 25 (29.8%) | 13 (24.5%) |
| 12 to 14 Years | 11 (26.8%) | 0 (0.0%) |
| 15 Years | 4 (30.8%) | 8 (34.8%) |
| 16 and 17 Years | 4 (25.0%) | 10 (19.2%) |
| 18 to 24 Years | 2 (2.3%) | 9 (42.9%) |
| 25 to 34 Years | 3 (3.8%) | 25 (27.2%) |
| 35 to 44 Years | 5 (6.2%) | 4 (4.4%) |
| 45 to 54 Years | 3 (8.3%) | 17 (22.7%) |
| 55 to 64 Years | 8 (9.9%) | 16 (13.1%) |
| 65 to 74 Years | 7 (14.9%) | 15 (17.9%) |
| 75 Years and over | 0 (0.0%) | 14 (35.0%) |
| Total | 72 (11.1%) | 140 (18.7%) |
Income Above Poverty by Sex and Age in Carbondale
According to the poverty statistics in Carbondale, males aged under 5 years and females aged 5 years are the age groups that are most secure financially, with 100.0% of males and 100.0% of females in these age groups living above the poverty line.
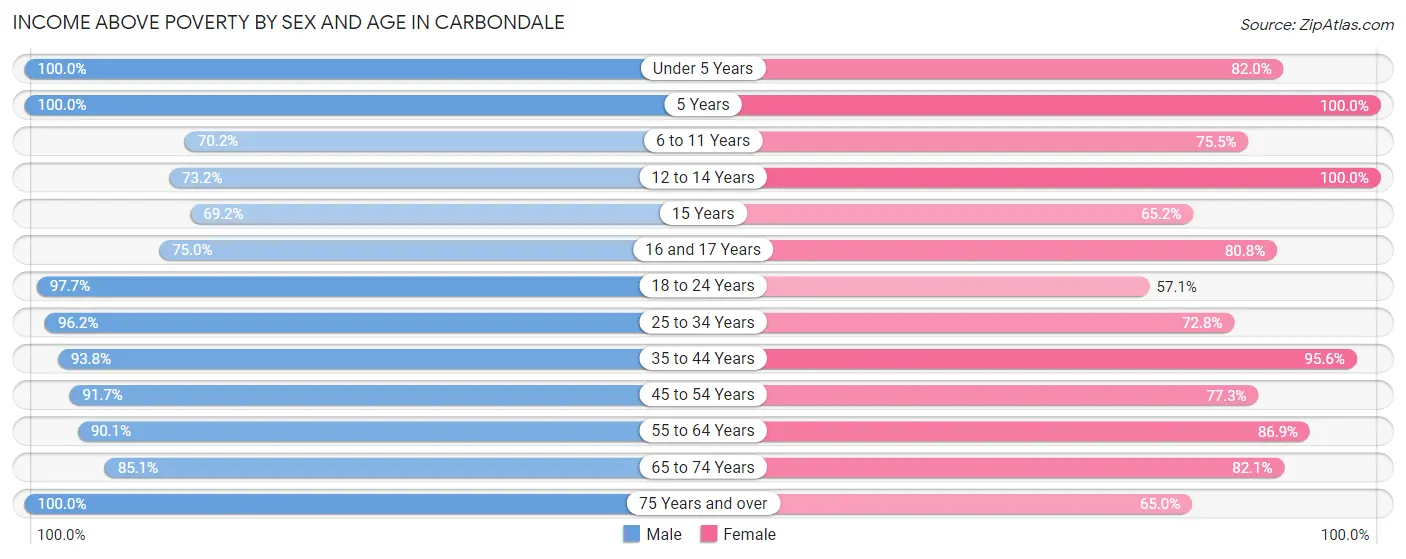
| Age Bracket | Male | Female |
| Under 5 Years | 29 (100.0%) | 41 (82.0%) |
| 5 Years | 4 (100.0%) | 31 (100.0%) |
| 6 to 11 Years | 59 (70.2%) | 40 (75.5%) |
| 12 to 14 Years | 30 (73.2%) | 16 (100.0%) |
| 15 Years | 9 (69.2%) | 15 (65.2%) |
| 16 and 17 Years | 12 (75.0%) | 42 (80.8%) |
| 18 to 24 Years | 86 (97.7%) | 12 (57.1%) |
| 25 to 34 Years | 76 (96.2%) | 67 (72.8%) |
| 35 to 44 Years | 76 (93.8%) | 86 (95.6%) |
| 45 to 54 Years | 33 (91.7%) | 58 (77.3%) |
| 55 to 64 Years | 73 (90.1%) | 106 (86.9%) |
| 65 to 74 Years | 40 (85.1%) | 69 (82.1%) |
| 75 Years and over | 48 (100.0%) | 26 (65.0%) |
| Total | 575 (88.9%) | 609 (81.3%) |
Income Below Poverty Among Married-Couple Families in Carbondale
The poverty statistics for married-couple families in Carbondale show that 4.3% or 11 of the total 256 families live below the poverty line. Families with 3 or 4 children have the highest poverty rate of 14.3%, comprising of 5 families. On the other hand, families with no children have the lowest poverty rate of 2.1%, which includes 3 families.
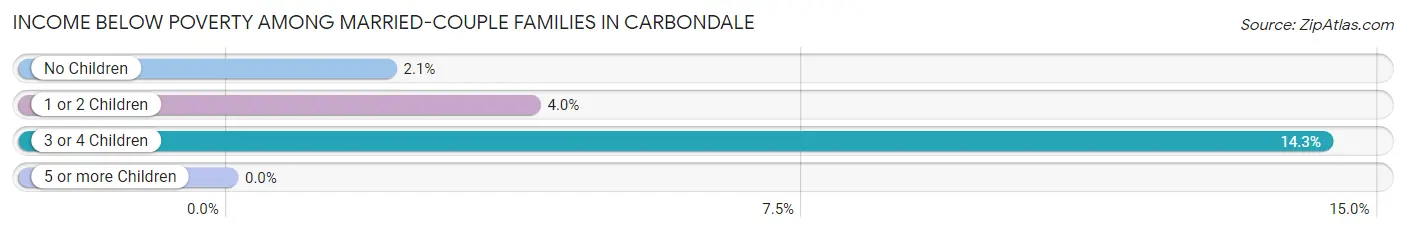
| Children | Above Poverty | Below Poverty |
| No Children | 142 (97.9%) | 3 (2.1%) |
| 1 or 2 Children | 73 (96.1%) | 3 (4.0%) |
| 3 or 4 Children | 30 (85.7%) | 5 (14.3%) |
| 5 or more Children | 0 (0.0%) | 0 (0.0%) |
| Total | 245 (95.7%) | 11 (4.3%) |
Income Below Poverty Among Single-Parent Households in Carbondale
According to the poverty data in Carbondale, 25.8% or 8 single-father households and 31.7% or 26 single-mother households are living below the poverty line. Among single-father households, those with 1 or 2 children have the highest poverty rate, with 8 households (47.1%) experiencing poverty. Likewise, among single-mother households, those with 1 or 2 children have the highest poverty rate, with 22 households (44.9%) falling below the poverty line.
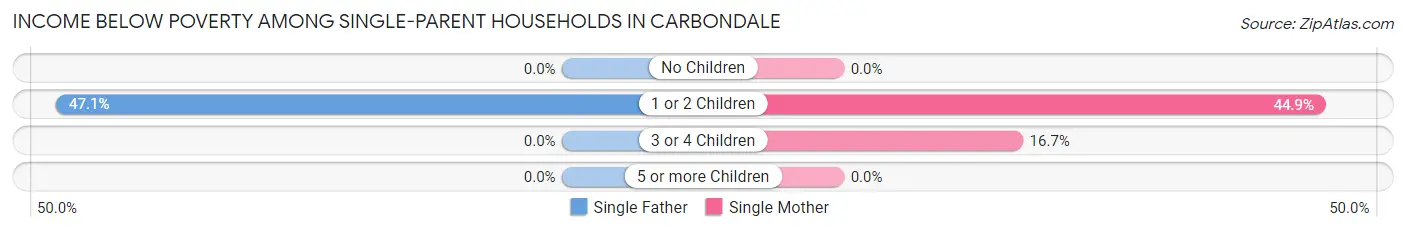
| Children | Single Father | Single Mother |
| No Children | 0 (0.0%) | 0 (0.0%) |
| 1 or 2 Children | 8 (47.1%) | 22 (44.9%) |
| 3 or 4 Children | 0 (0.0%) | 4 (16.7%) |
| 5 or more Children | 0 (0.0%) | 0 (0.0%) |
| Total | 8 (25.8%) | 26 (31.7%) |
Income Below Poverty Among Married-Couple vs Single-Parent Households in Carbondale
The poverty data for Carbondale shows that 11 of the married-couple family households (4.3%) and 34 of the single-parent households (30.1%) are living below the poverty level. Within the married-couple family households, those with 3 or 4 children have the highest poverty rate, with 5 households (14.3%) falling below the poverty line. Among the single-parent households, those with 1 or 2 children have the highest poverty rate, with 30 household (45.5%) living below poverty.
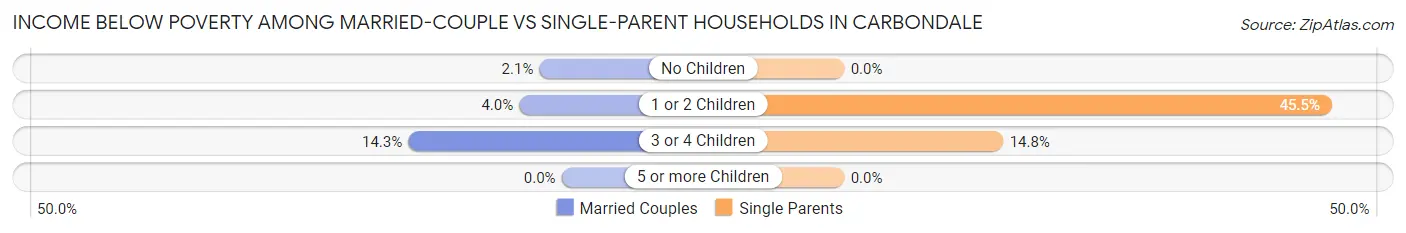
| Children | Married-Couple Families | Single-Parent Households |
| No Children | 3 (2.1%) | 0 (0.0%) |
| 1 or 2 Children | 3 (4.0%) | 30 (45.5%) |
| 3 or 4 Children | 5 (14.3%) | 4 (14.8%) |
| 5 or more Children | 0 (0.0%) | 0 (0.0%) |
| Total | 11 (4.3%) | 34 (30.1%) |
Race in Carbondale
The most populous races in Carbondale are White / Caucasian (1,235 | 88.5%), Two or more Races (120 | 8.6%), and Hispanic or Latino (115 | 8.2%).
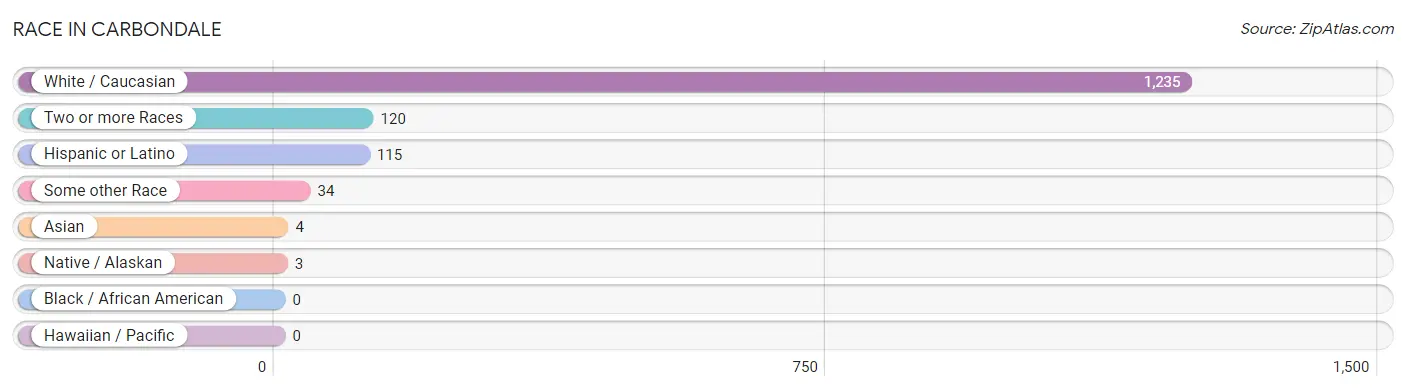
| Race | # Population | % Population |
| Asian | 4 | 0.3% |
| Black / African American | 0 | 0.0% |
| Hawaiian / Pacific | 0 | 0.0% |
| Hispanic or Latino | 115 | 8.2% |
| Native / Alaskan | 3 | 0.2% |
| White / Caucasian | 1,235 | 88.5% |
| Two or more Races | 120 | 8.6% |
| Some other Race | 34 | 2.4% |
| Total | 1,396 | 100.0% |
Ancestry in Carbondale
The most populous ancestries reported in Carbondale are Irish (311 | 22.3%), German (261 | 18.7%), European (124 | 8.9%), Mexican (115 | 8.2%), and English (106 | 7.6%), together accounting for 65.7% of all Carbondale residents.
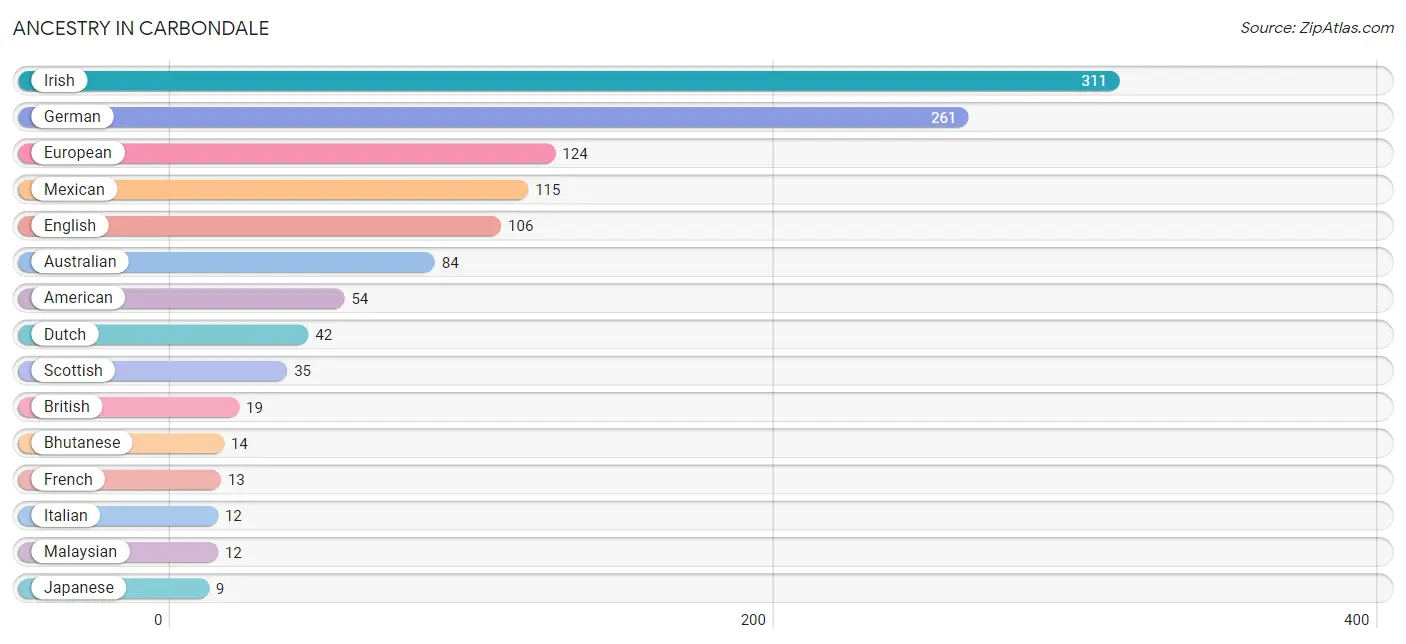
| Ancestry | # Population | % Population |
| American | 54 | 3.9% |
| Australian | 84 | 6.0% |
| Bhutanese | 14 | 1.0% |
| British | 19 | 1.4% |
| Cherokee | 4 | 0.3% |
| Choctaw | 1 | 0.1% |
| Dutch | 42 | 3.0% |
| English | 106 | 7.6% |
| European | 124 | 8.9% |
| Finnish | 3 | 0.2% |
| French | 13 | 0.9% |
| French Canadian | 3 | 0.2% |
| German | 261 | 18.7% |
| Irish | 311 | 22.3% |
| Italian | 12 | 0.9% |
| Japanese | 9 | 0.6% |
| Luxembourger | 1 | 0.1% |
| Malaysian | 12 | 0.9% |
| Mexican | 115 | 8.2% |
| Native Hawaiian | 3 | 0.2% |
| Polish | 2 | 0.1% |
| Portuguese | 3 | 0.2% |
| Potawatomi | 3 | 0.2% |
| Russian | 4 | 0.3% |
| Scandinavian | 3 | 0.2% |
| Scotch-Irish | 3 | 0.2% |
| Scottish | 35 | 2.5% |
| Swedish | 3 | 0.2% |
| Swiss | 4 | 0.3% |
| Welsh | 8 | 0.6% | View All 30 Rows |
Immigrants in Carbondale
The most numerous immigrant groups reported in Carbondale came from Australia (20 | 1.4%), Oceania (20 | 1.4%), Central America (8 | 0.6%), Latin America (8 | 0.6%), and Mexico (8 | 0.6%), together accounting for 4.6% of all Carbondale residents.
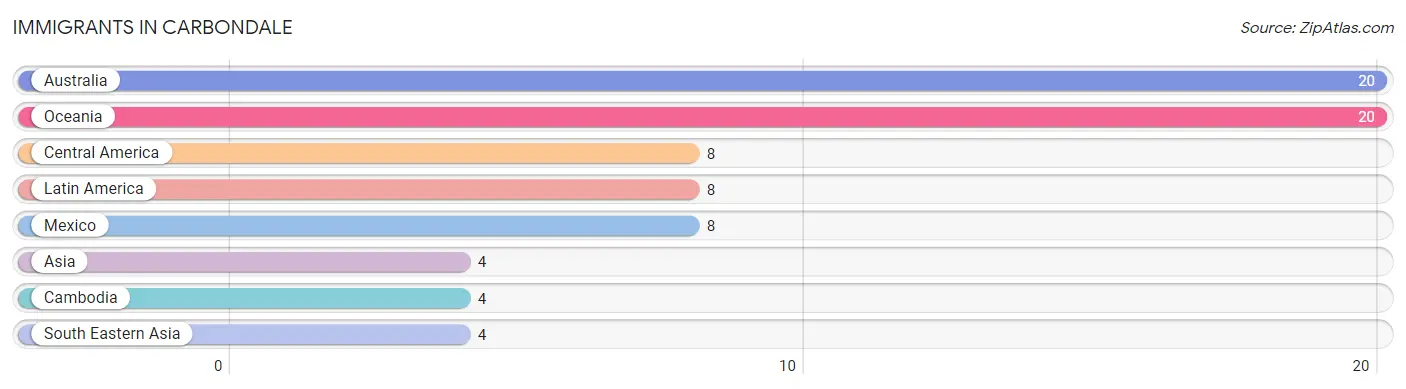
| Immigration Origin | # Population | % Population |
| Asia | 4 | 0.3% |
| Australia | 20 | 1.4% |
| Cambodia | 4 | 0.3% |
| Central America | 8 | 0.6% |
| Latin America | 8 | 0.6% |
| Mexico | 8 | 0.6% |
| Oceania | 20 | 1.4% |
| South Eastern Asia | 4 | 0.3% | View All 8 Rows |
Sex and Age in Carbondale
Sex and Age in Carbondale
The most populous age groups in Carbondale are 20 to 24 Years (79 | 12.2%) for men and 5 to 9 Years (84 | 11.2%) for women.
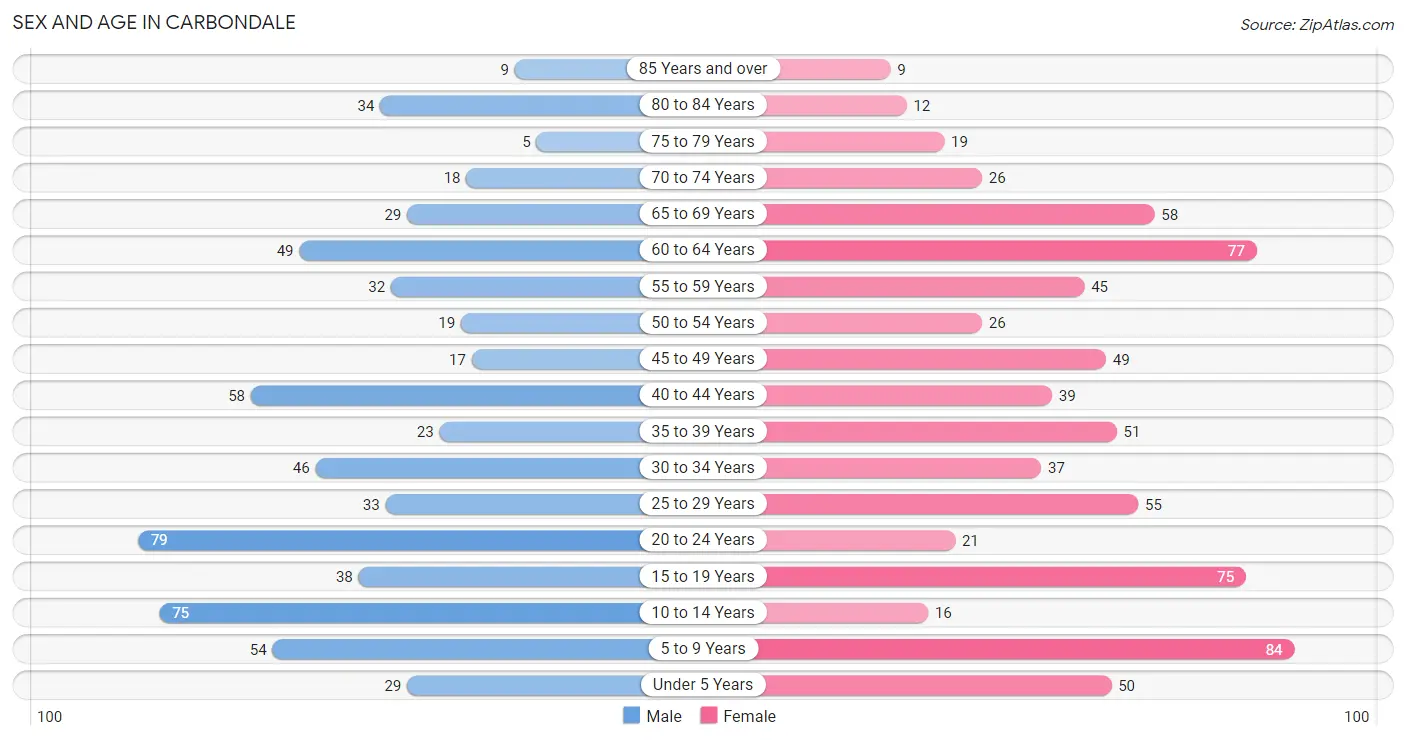
| Age Bracket | Male | Female |
| Under 5 Years | 29 (4.5%) | 50 (6.7%) |
| 5 to 9 Years | 54 (8.4%) | 84 (11.2%) |
| 10 to 14 Years | 75 (11.6%) | 16 (2.1%) |
| 15 to 19 Years | 38 (5.9%) | 75 (10.0%) |
| 20 to 24 Years | 79 (12.2%) | 21 (2.8%) |
| 25 to 29 Years | 33 (5.1%) | 55 (7.3%) |
| 30 to 34 Years | 46 (7.1%) | 37 (4.9%) |
| 35 to 39 Years | 23 (3.5%) | 51 (6.8%) |
| 40 to 44 Years | 58 (9.0%) | 39 (5.2%) |
| 45 to 49 Years | 17 (2.6%) | 49 (6.5%) |
| 50 to 54 Years | 19 (2.9%) | 26 (3.5%) |
| 55 to 59 Years | 32 (5.0%) | 45 (6.0%) |
| 60 to 64 Years | 49 (7.6%) | 77 (10.3%) |
| 65 to 69 Years | 29 (4.5%) | 58 (7.7%) |
| 70 to 74 Years | 18 (2.8%) | 26 (3.5%) |
| 75 to 79 Years | 5 (0.8%) | 19 (2.5%) |
| 80 to 84 Years | 34 (5.3%) | 12 (1.6%) |
| 85 Years and over | 9 (1.4%) | 9 (1.2%) |
| Total | 647 (100.0%) | 749 (100.0%) |
Families and Households in Carbondale
Median Family Size in Carbondale
The median family size in Carbondale is 3.13 persons per family, with married-couple families (256 | 69.4%) accounting for the largest median family size of 3.22 persons per family. On the other hand, single male/father families (31 | 8.4%) represent the smallest median family size with 2.94 persons per family.
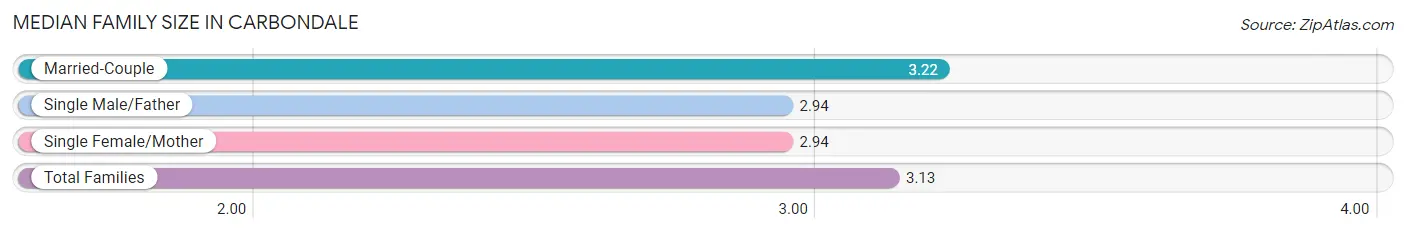
| Family Type | # Families | Family Size |
| Married-Couple | 256 (69.4%) | 3.22 |
| Single Male/Father | 31 (8.4%) | 2.94 |
| Single Female/Mother | 82 (22.2%) | 2.94 |
| Total Families | 369 (100.0%) | 3.13 |
Median Household Size in Carbondale
The median household size in Carbondale is 2.52 persons per household, with single male/father households (31 | 5.6%) accounting for the largest median household size of 3.39 persons per household. non-family households (184 | 33.3%) represent the smallest median household size with 1.15 persons per household.
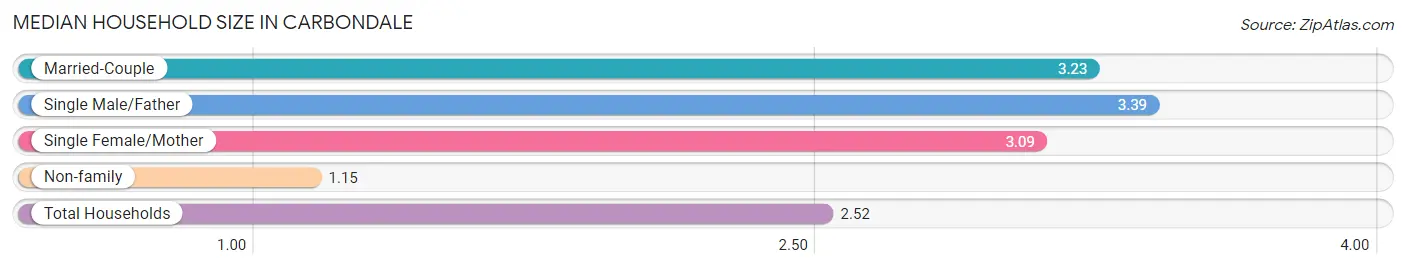
| Household Type | # Households | Household Size |
| Married-Couple | 256 (46.3%) | 3.23 |
| Single Male/Father | 31 (5.6%) | 3.39 |
| Single Female/Mother | 82 (14.8%) | 3.09 |
| Non-family | 184 (33.3%) | 1.15 |
| Total Households | 553 (100.0%) | 2.52 |
Household Size by Marriage Status in Carbondale
Out of a total of 553 households in Carbondale, 369 (66.7%) are family households, while 184 (33.3%) are nonfamily households. The most numerous type of family households are 2-person households, comprising 157, and the most common type of nonfamily households are 1-person households, comprising 165.
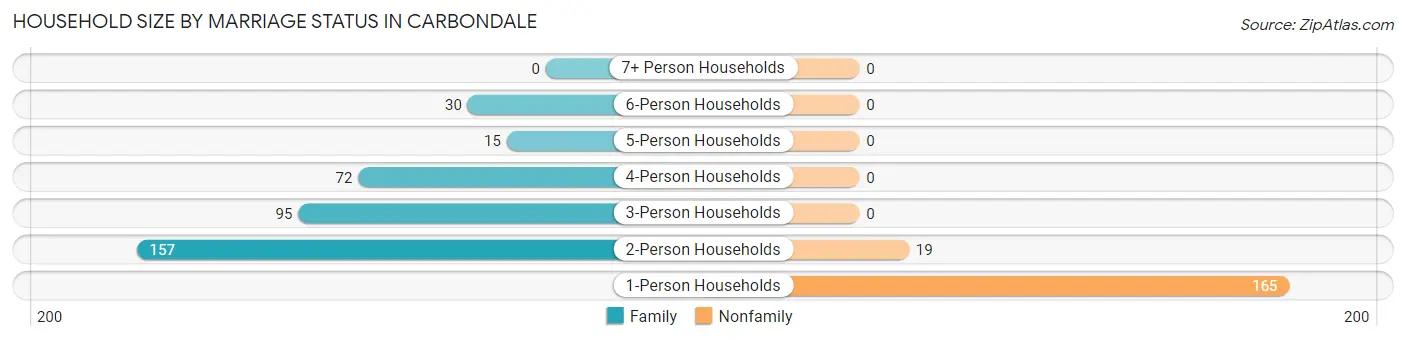
| Household Size | Family Households | Nonfamily Households |
| 1-Person Households | - | 165 (29.8%) |
| 2-Person Households | 157 (28.4%) | 19 (3.4%) |
| 3-Person Households | 95 (17.2%) | 0 (0.0%) |
| 4-Person Households | 72 (13.0%) | 0 (0.0%) |
| 5-Person Households | 15 (2.7%) | 0 (0.0%) |
| 6-Person Households | 30 (5.4%) | 0 (0.0%) |
| 7+ Person Households | 0 (0.0%) | 0 (0.0%) |
| Total | 369 (66.7%) | 184 (33.3%) |
Female Fertility in Carbondale
Fertility by Age in Carbondale
Average fertility rate in Carbondale is 39.0 births per 1,000 women. Women in the age bracket of 20 to 34 years have the highest fertility rate with 115.0 births per 1,000 women. Women in the age bracket of 20 to 34 years acount for 100.0% of all women with births.
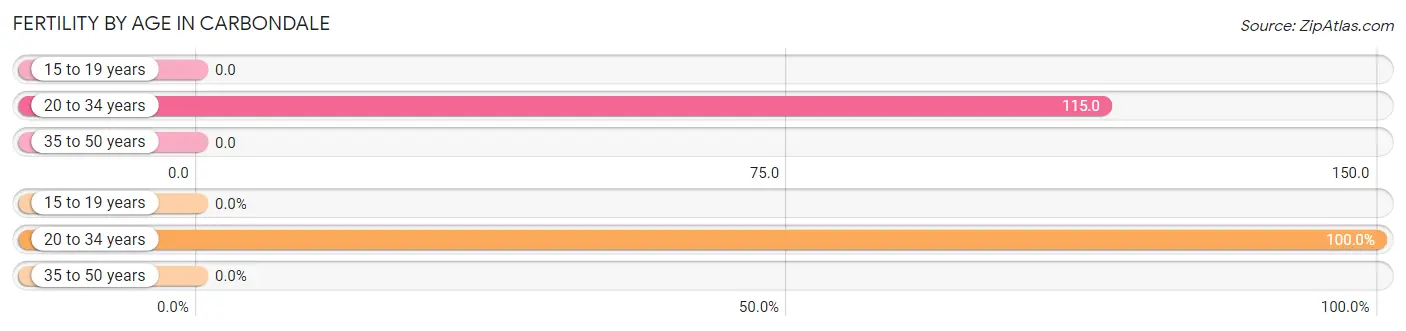
| Age Bracket | Women with Births | Births / 1,000 Women |
| 15 to 19 years | 0 (0.0%) | 0.0 |
| 20 to 34 years | 13 (100.0%) | 115.0 |
| 35 to 50 years | 0 (0.0%) | 0.0 |
| Total | 13 (100.0%) | 39.0 |
Fertility by Age by Marriage Status in Carbondale
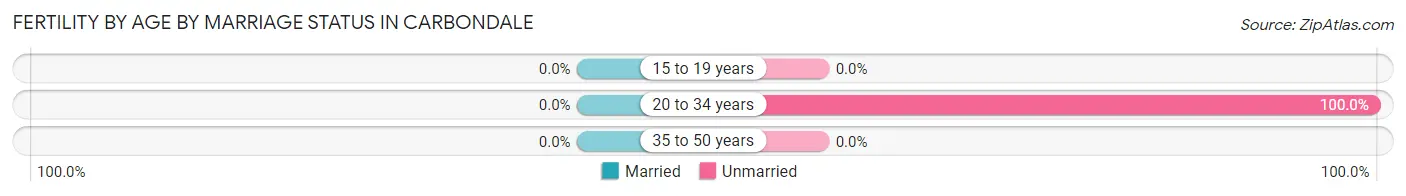
| Age Bracket | Married | Unmarried |
| 15 to 19 years | 0 (0.0%) | 0 (0.0%) |
| 20 to 34 years | 0 (0.0%) | 13 (100.0%) |
| 35 to 50 years | 0 (0.0%) | 0 (0.0%) |
| Total | 0 (0.0%) | 13 (100.0%) |
Fertility by Education in Carbondale
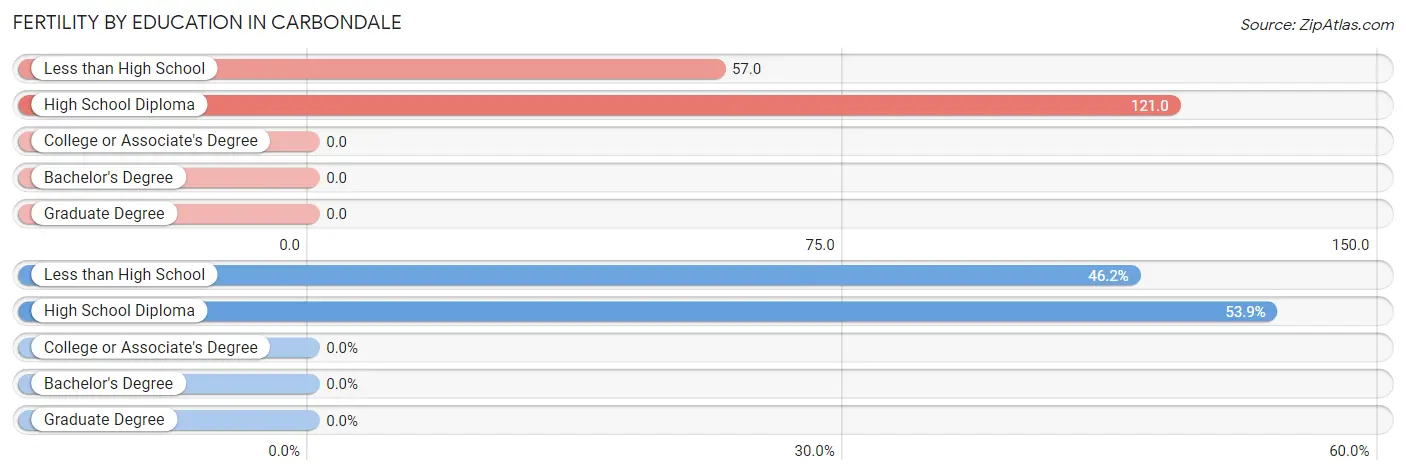
| Educational Attainment | Women with Births | Births / 1,000 Women |
| Less than High School | 6 (46.2%) | 57.0 |
| High School Diploma | 7 (53.8%) | 121.0 |
| College or Associate's Degree | 0 (0.0%) | 0.0 |
| Bachelor's Degree | 0 (0.0%) | 0.0 |
| Graduate Degree | 0 (0.0%) | 0.0 |
| Total | 13 (100.0%) | 39.0 |
Fertility by Education by Marriage Status in Carbondale
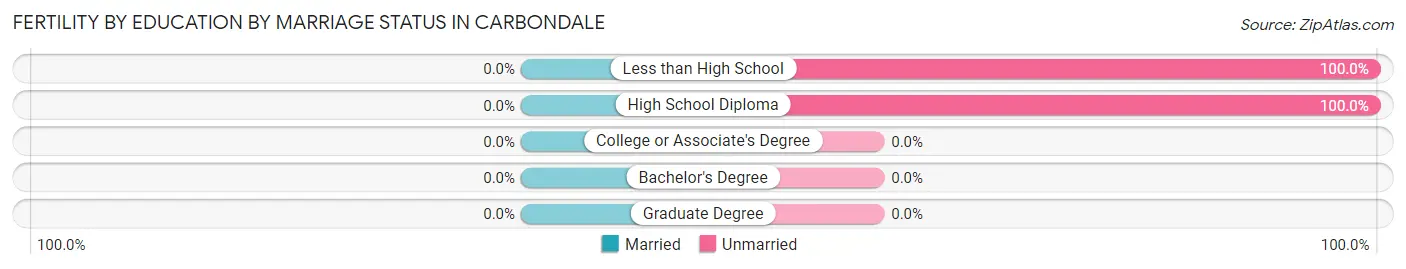
| Educational Attainment | Married | Unmarried |
| Less than High School | 0 (0.0%) | 6 (100.0%) |
| High School Diploma | 0 (0.0%) | 7 (100.0%) |
| College or Associate's Degree | 0 (0.0%) | 0 (0.0%) |
| Bachelor's Degree | 0 (0.0%) | 0 (0.0%) |
| Graduate Degree | 0 (0.0%) | 0 (0.0%) |
| Total | 0 (0.0%) | 13 (100.0%) |
Employment Characteristics in Carbondale
Employment by Class of Employer in Carbondale
Among the 697 employed individuals in Carbondale, private company employees (473 | 67.9%), state government employees (70 | 10.0%), and local government employees (63 | 9.0%) make up the most common classes of employment.
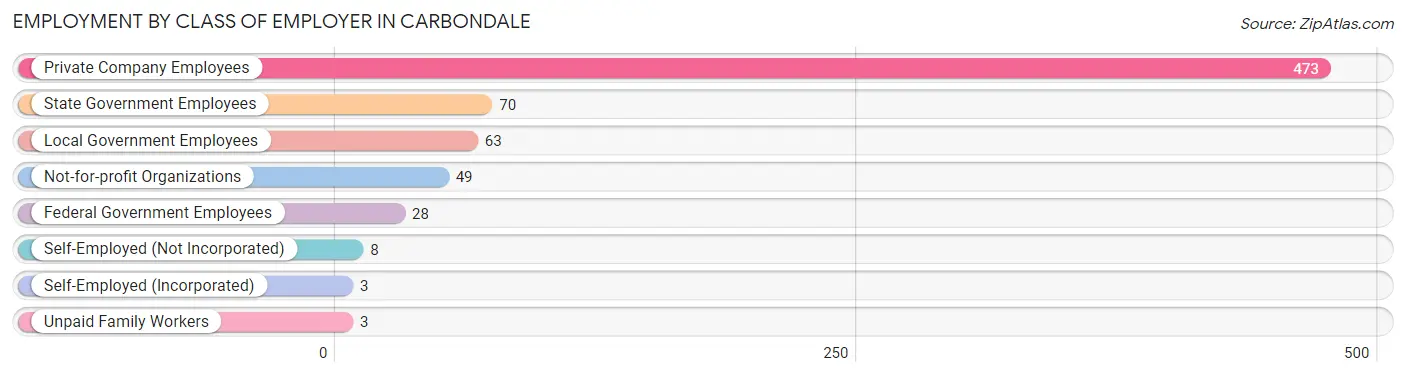
| Employer Class | # Employees | % Employees |
| Private Company Employees | 473 | 67.9% |
| Self-Employed (Incorporated) | 3 | 0.4% |
| Self-Employed (Not Incorporated) | 8 | 1.1% |
| Not-for-profit Organizations | 49 | 7.0% |
| Local Government Employees | 63 | 9.0% |
| State Government Employees | 70 | 10.0% |
| Federal Government Employees | 28 | 4.0% |
| Unpaid Family Workers | 3 | 0.4% |
| Total | 697 | 100.0% |
Employment Status by Age in Carbondale
According to the labor force statistics for Carbondale, out of the total population over 16 years of age (1,052), 69.3% or 729 individuals are in the labor force, with 1.7% or 12 of them unemployed. The age group with the highest labor force participation rate is 20 to 24 years, with 94.0% or 94 individuals in the labor force. Within the labor force, the 20 to 24 years age range has the highest percentage of unemployed individuals, with 5.3% or 5 of them being unemployed.
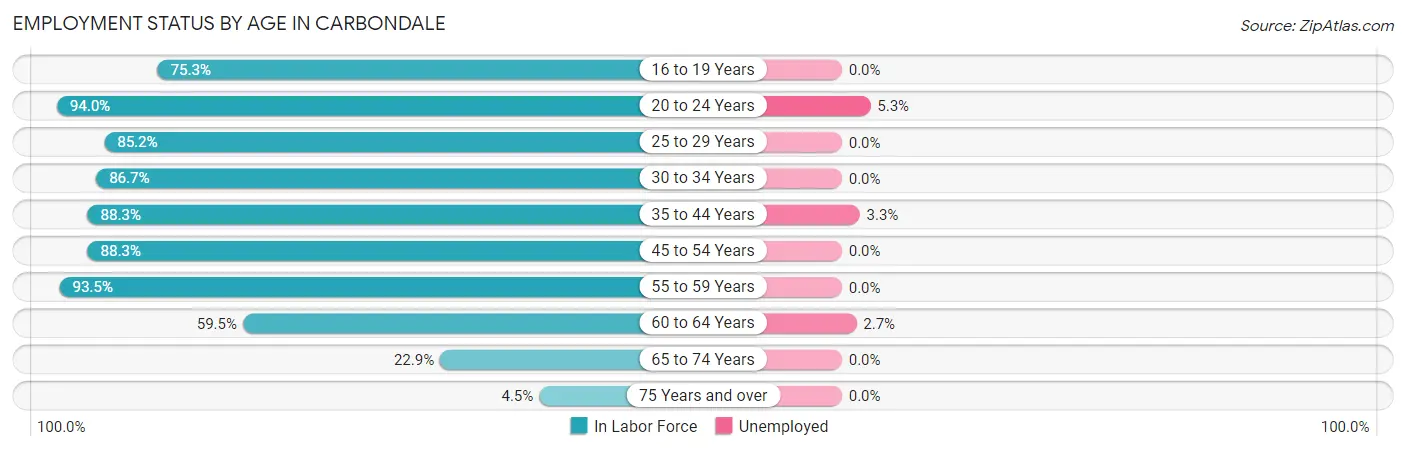
| Age Bracket | In Labor Force | Unemployed |
| 16 to 19 Years | 58 (75.3%) | 0 (0.0%) |
| 20 to 24 Years | 94 (94.0%) | 5 (5.3%) |
| 25 to 29 Years | 75 (85.2%) | 0 (0.0%) |
| 30 to 34 Years | 72 (86.7%) | 0 (0.0%) |
| 35 to 44 Years | 151 (88.3%) | 5 (3.3%) |
| 45 to 54 Years | 98 (88.3%) | 0 (0.0%) |
| 55 to 59 Years | 72 (93.5%) | 0 (0.0%) |
| 60 to 64 Years | 75 (59.5%) | 2 (2.7%) |
| 65 to 74 Years | 30 (22.9%) | 0 (0.0%) |
| 75 Years and over | 4 (4.5%) | 0 (0.0%) |
| Total | 729 (69.3%) | 12 (1.7%) |
Employment Status by Educational Attainment in Carbondale
According to labor force statistics for Carbondale, 82.8% of individuals (543) out of the total population between 25 and 64 years of age (656) are in the labor force, with 1.3% or 7 of them being unemployed. The group with the highest labor force participation rate are those with the educational attainment of bachelor's degree or higher, with 100.0% or 94 individuals in the labor force. Within the labor force, individuals with high school diploma education have the highest percentage of unemployment, with 3.1% or 7 of them being unemployed.
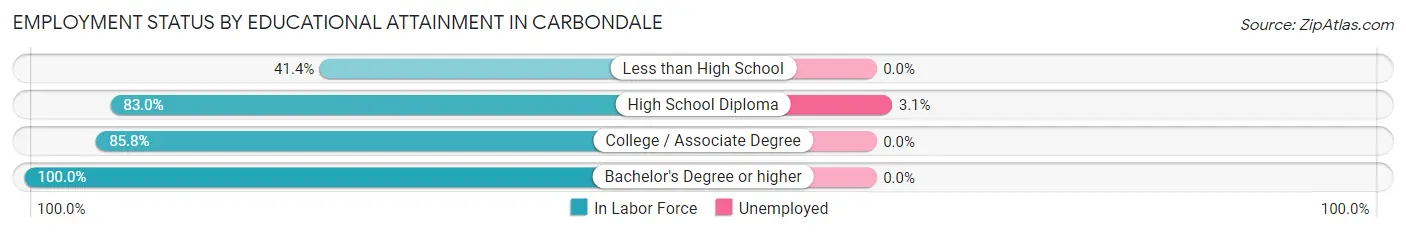
| Educational Attainment | In Labor Force | Unemployed |
| Less than High School | 24 (41.4%) | 0 (0.0%) |
| High School Diploma | 225 (83.0%) | 8 (3.1%) |
| College / Associate Degree | 200 (85.8%) | 0 (0.0%) |
| Bachelor's Degree or higher | 94 (100.0%) | 0 (0.0%) |
| Total | 543 (82.8%) | 9 (1.3%) |
Employment Occupations by Sex in Carbondale
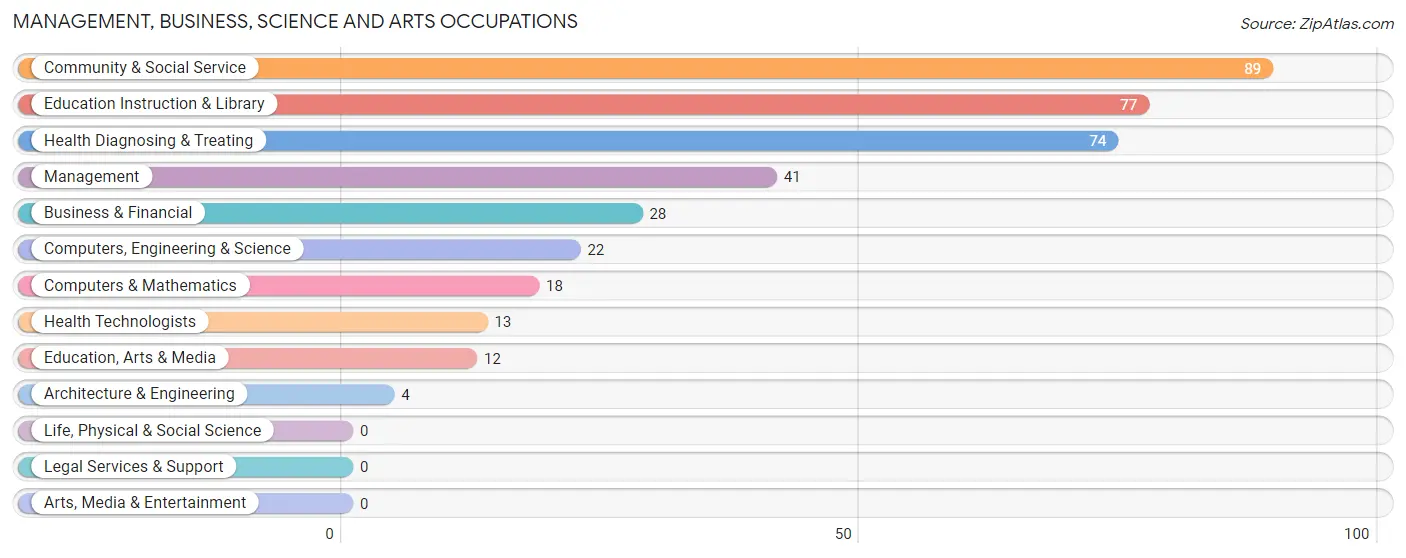
Management, Business, Science and Arts Occupations
The most common Management, Business, Science and Arts occupations in Carbondale are Community & Social Service (89 | 12.5%), Education Instruction & Library (77 | 10.8%), Health Diagnosing & Treating (74 | 10.4%), Management (41 | 5.7%), and Business & Financial (28 | 3.9%).
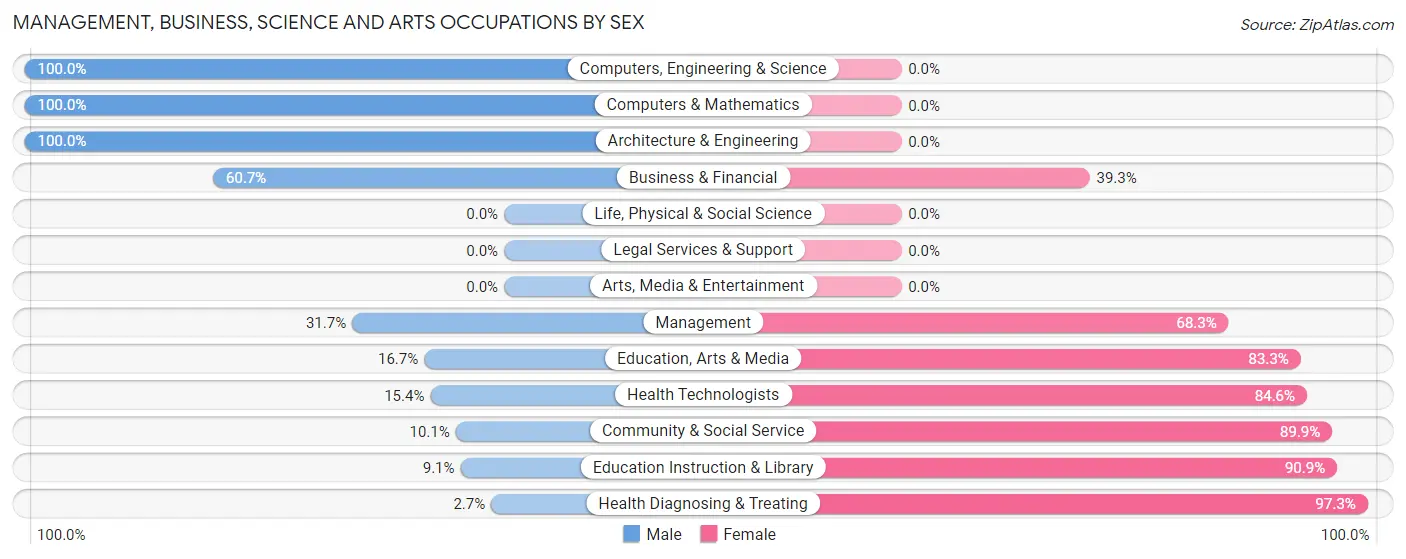
Management, Business, Science and Arts Occupations by Sex
Within the Management, Business, Science and Arts occupations in Carbondale, the most male-oriented occupations are Computers, Engineering & Science (100.0%), Computers & Mathematics (100.0%), and Architecture & Engineering (100.0%), while the most female-oriented occupations are Health Diagnosing & Treating (97.3%), Education Instruction & Library (90.9%), and Community & Social Service (89.9%).
| Occupation | Male | Female |
| Management | 13 (31.7%) | 28 (68.3%) |
| Business & Financial | 17 (60.7%) | 11 (39.3%) |
| Computers, Engineering & Science | 22 (100.0%) | 0 (0.0%) |
| Computers & Mathematics | 18 (100.0%) | 0 (0.0%) |
| Architecture & Engineering | 4 (100.0%) | 0 (0.0%) |
| Life, Physical & Social Science | 0 (0.0%) | 0 (0.0%) |
| Community & Social Service | 9 (10.1%) | 80 (89.9%) |
| Education, Arts & Media | 2 (16.7%) | 10 (83.3%) |
| Legal Services & Support | 0 (0.0%) | 0 (0.0%) |
| Education Instruction & Library | 7 (9.1%) | 70 (90.9%) |
| Arts, Media & Entertainment | 0 (0.0%) | 0 (0.0%) |
| Health Diagnosing & Treating | 2 (2.7%) | 72 (97.3%) |
| Health Technologists | 2 (15.4%) | 11 (84.6%) |
| Total (Category) | 63 (24.8%) | 191 (75.2%) |
| Total (Overall) | 336 (47.1%) | 378 (52.9%) |
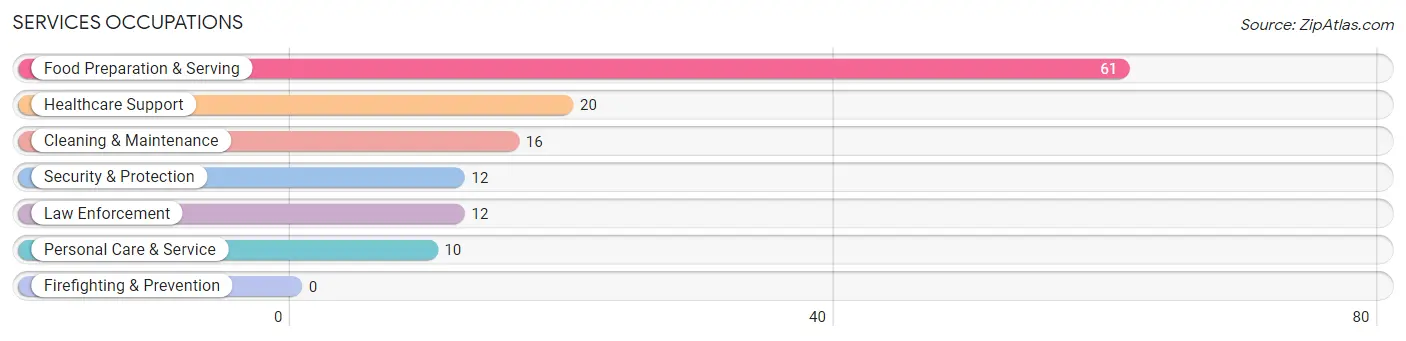
Services Occupations
The most common Services occupations in Carbondale are Food Preparation & Serving (61 | 8.5%), Healthcare Support (20 | 2.8%), Cleaning & Maintenance (16 | 2.2%), Security & Protection (12 | 1.7%), and Law Enforcement (12 | 1.7%).
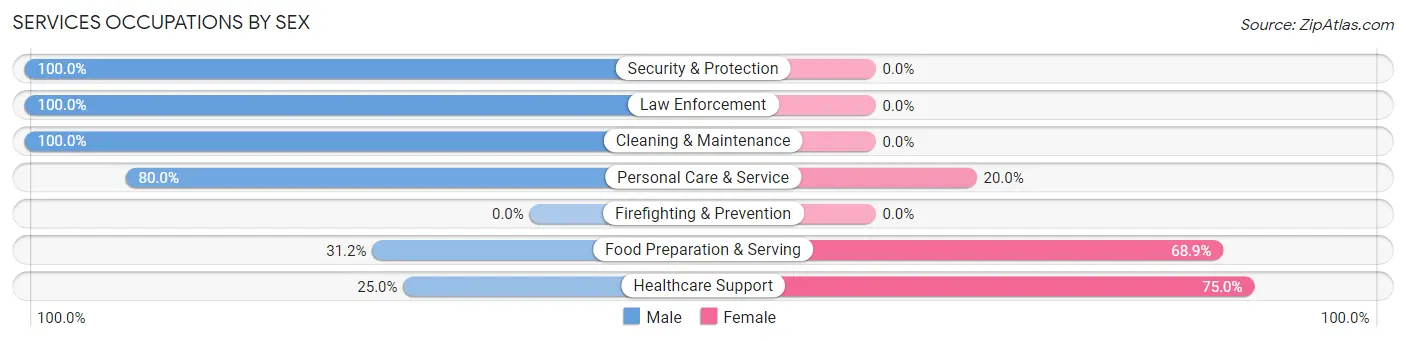
Services Occupations by Sex
Within the Services occupations in Carbondale, the most male-oriented occupations are Security & Protection (100.0%), Law Enforcement (100.0%), and Cleaning & Maintenance (100.0%), while the most female-oriented occupations are Healthcare Support (75.0%), Food Preparation & Serving (68.9%), and Personal Care & Service (20.0%).
| Occupation | Male | Female |
| Healthcare Support | 5 (25.0%) | 15 (75.0%) |
| Security & Protection | 12 (100.0%) | 0 (0.0%) |
| Firefighting & Prevention | 0 (0.0%) | 0 (0.0%) |
| Law Enforcement | 12 (100.0%) | 0 (0.0%) |
| Food Preparation & Serving | 19 (31.1%) | 42 (68.9%) |
| Cleaning & Maintenance | 16 (100.0%) | 0 (0.0%) |
| Personal Care & Service | 8 (80.0%) | 2 (20.0%) |
| Total (Category) | 60 (50.4%) | 59 (49.6%) |
| Total (Overall) | 336 (47.1%) | 378 (52.9%) |
Sales and Office Occupations
The most common Sales and Office occupations in Carbondale are Office & Administration (105 | 14.7%), and Sales & Related (34 | 4.8%).
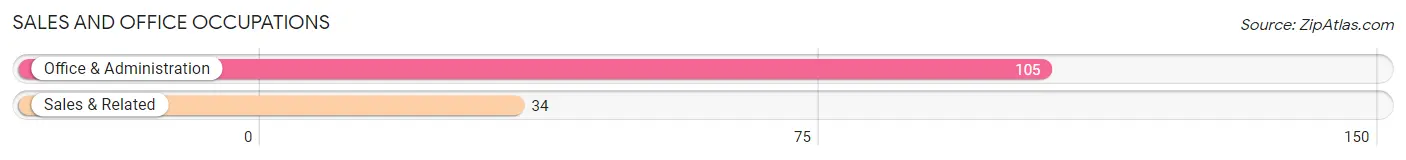
Sales and Office Occupations by Sex
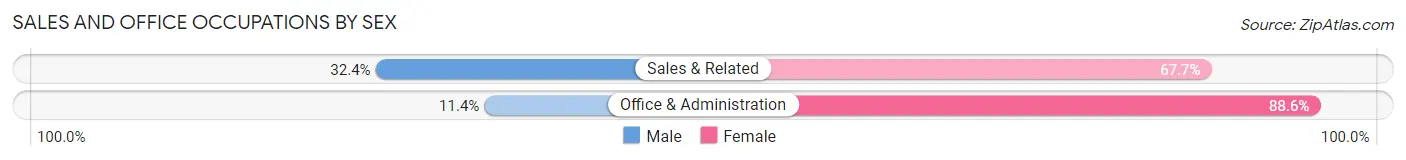
| Occupation | Male | Female |
| Sales & Related | 11 (32.4%) | 23 (67.6%) |
| Office & Administration | 12 (11.4%) | 93 (88.6%) |
| Total (Category) | 23 (16.6%) | 116 (83.5%) |
| Total (Overall) | 336 (47.1%) | 378 (52.9%) |
Natural Resources, Construction and Maintenance Occupations
The most common Natural Resources, Construction and Maintenance occupations in Carbondale are Installation, Maintenance & Repair (45 | 6.3%), and Construction & Extraction (38 | 5.3%).
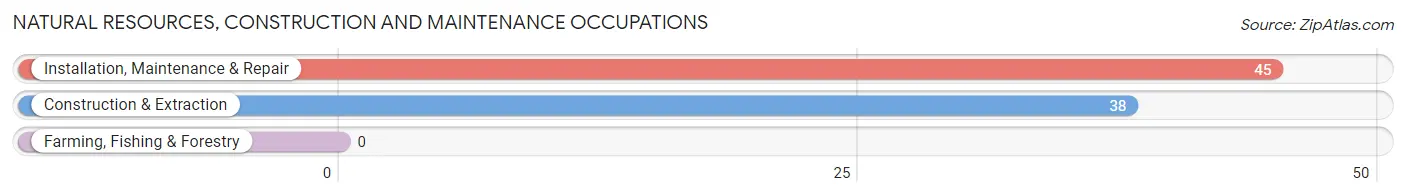
Natural Resources, Construction and Maintenance Occupations by Sex
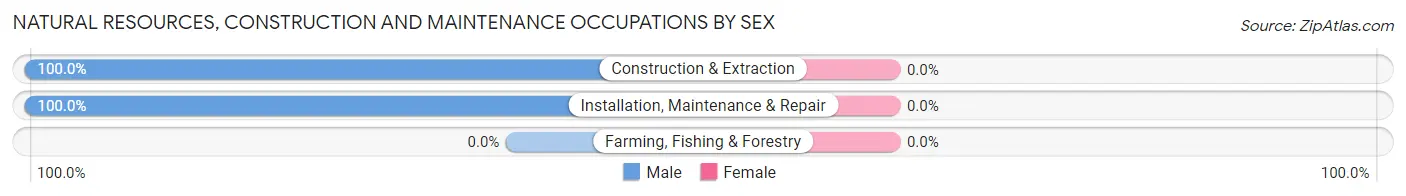
| Occupation | Male | Female |
| Farming, Fishing & Forestry | 0 (0.0%) | 0 (0.0%) |
| Construction & Extraction | 38 (100.0%) | 0 (0.0%) |
| Installation, Maintenance & Repair | 45 (100.0%) | 0 (0.0%) |
| Total (Category) | 83 (100.0%) | 0 (0.0%) |
| Total (Overall) | 336 (47.1%) | 378 (52.9%) |
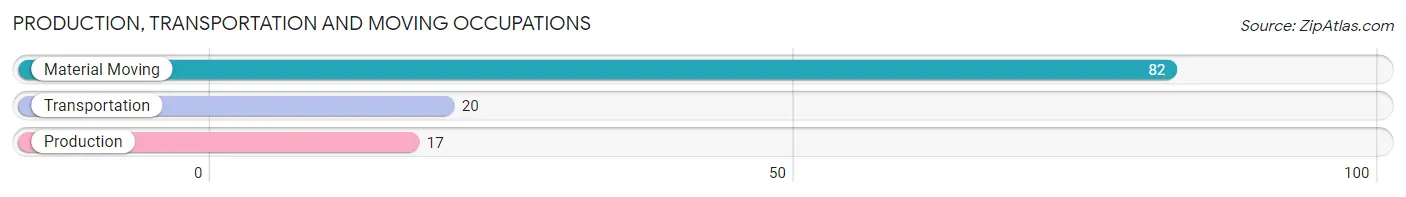
Production, Transportation and Moving Occupations
The most common Production, Transportation and Moving occupations in Carbondale are Material Moving (82 | 11.5%), Transportation (20 | 2.8%), and Production (17 | 2.4%).
Production, Transportation and Moving Occupations by Sex
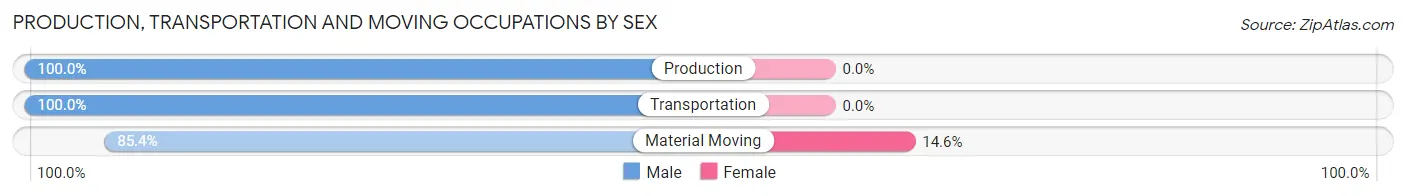
| Occupation | Male | Female |
| Production | 17 (100.0%) | 0 (0.0%) |
| Transportation | 20 (100.0%) | 0 (0.0%) |
| Material Moving | 70 (85.4%) | 12 (14.6%) |
| Total (Category) | 107 (89.9%) | 12 (10.1%) |
| Total (Overall) | 336 (47.1%) | 378 (52.9%) |
Employment Industries by Sex in Carbondale
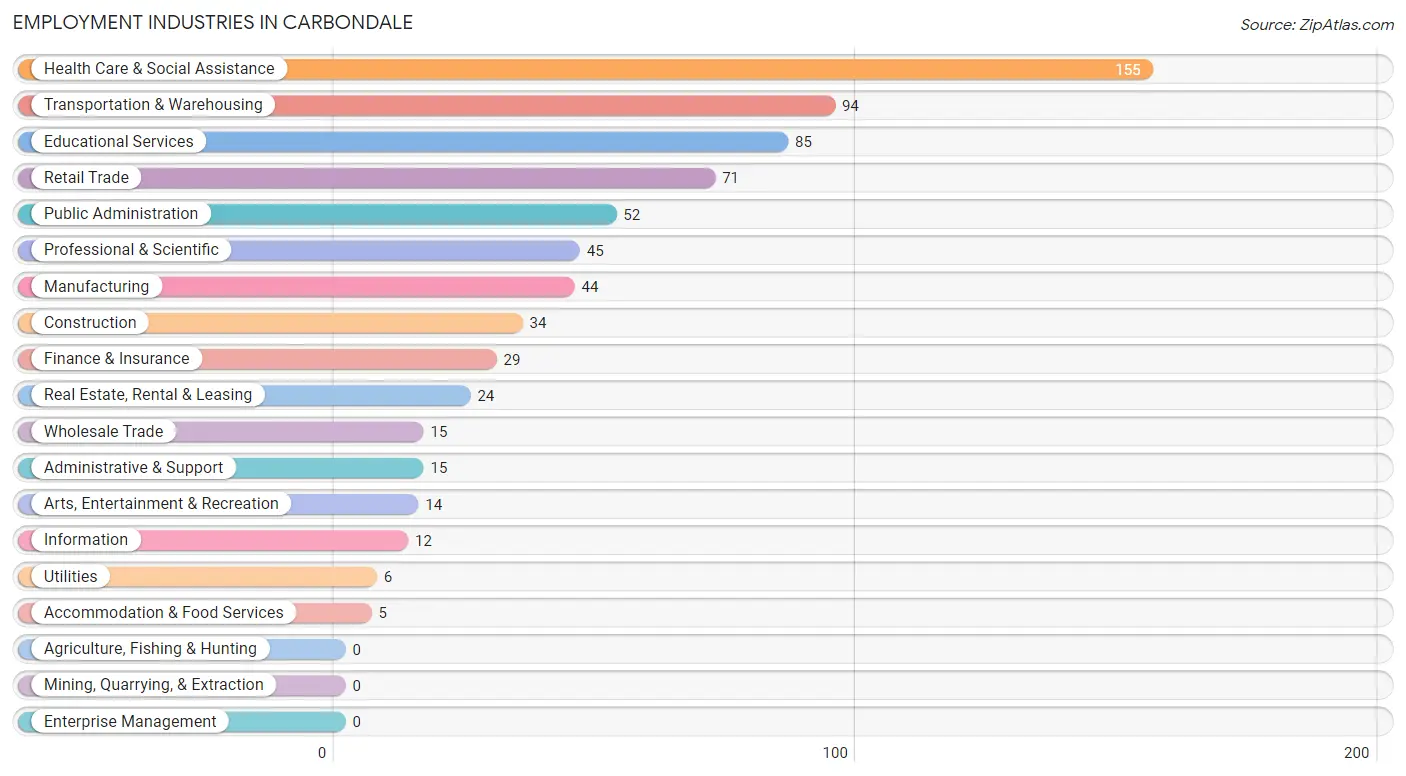
Employment Industries in Carbondale
The major employment industries in Carbondale include Health Care & Social Assistance (155 | 21.7%), Transportation & Warehousing (94 | 13.2%), Educational Services (85 | 11.9%), Retail Trade (71 | 9.9%), and Public Administration (52 | 7.3%).
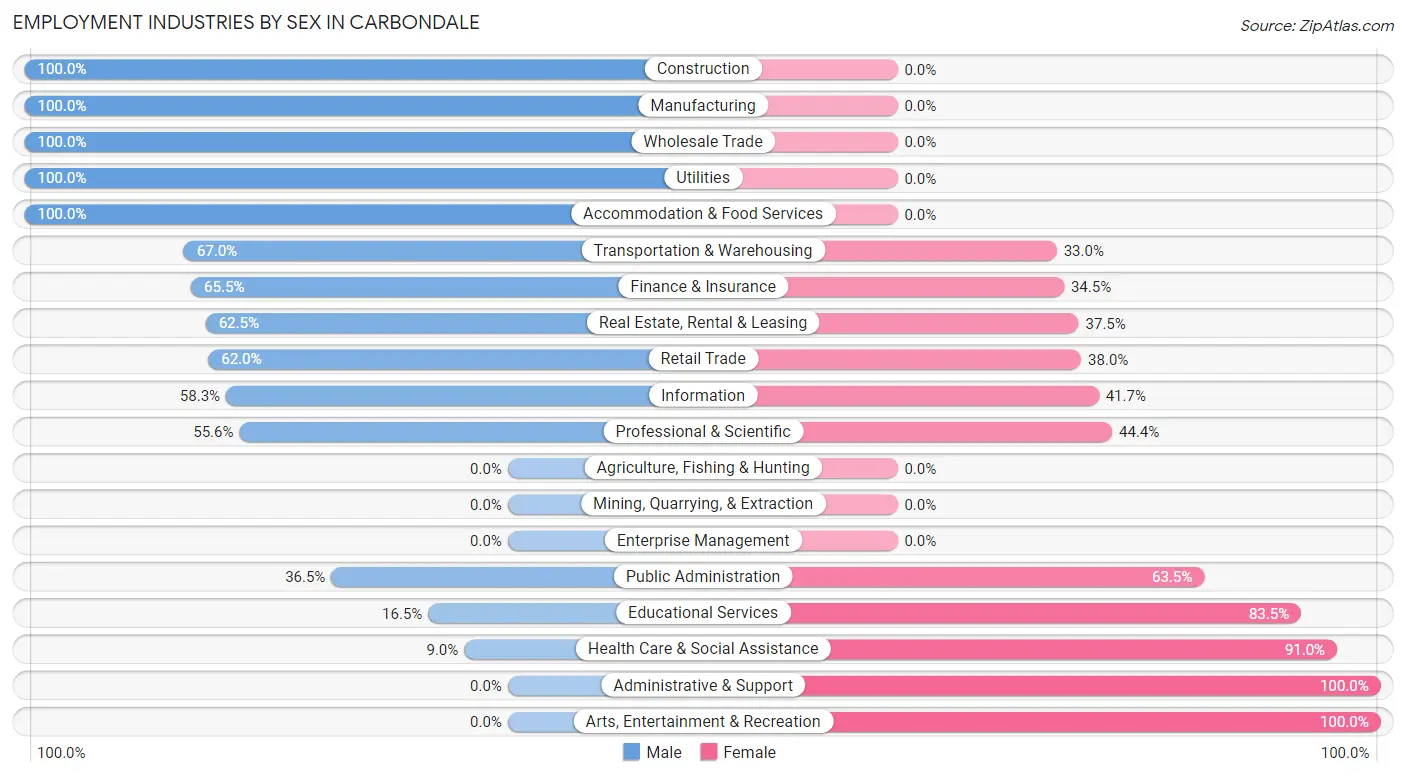
Employment Industries by Sex in Carbondale
The Carbondale industries that see more men than women are Construction (100.0%), Manufacturing (100.0%), and Wholesale Trade (100.0%), whereas the industries that tend to have a higher number of women are Administrative & Support (100.0%), Arts, Entertainment & Recreation (100.0%), and Health Care & Social Assistance (91.0%).
| Industry | Male | Female |
| Agriculture, Fishing & Hunting | 0 (0.0%) | 0 (0.0%) |
| Mining, Quarrying, & Extraction | 0 (0.0%) | 0 (0.0%) |
| Construction | 34 (100.0%) | 0 (0.0%) |
| Manufacturing | 44 (100.0%) | 0 (0.0%) |
| Wholesale Trade | 15 (100.0%) | 0 (0.0%) |
| Retail Trade | 44 (62.0%) | 27 (38.0%) |
| Transportation & Warehousing | 63 (67.0%) | 31 (33.0%) |
| Utilities | 6 (100.0%) | 0 (0.0%) |
| Information | 7 (58.3%) | 5 (41.7%) |
| Finance & Insurance | 19 (65.5%) | 10 (34.5%) |
| Real Estate, Rental & Leasing | 15 (62.5%) | 9 (37.5%) |
| Professional & Scientific | 25 (55.6%) | 20 (44.4%) |
| Enterprise Management | 0 (0.0%) | 0 (0.0%) |
| Administrative & Support | 0 (0.0%) | 15 (100.0%) |
| Educational Services | 14 (16.5%) | 71 (83.5%) |
| Health Care & Social Assistance | 14 (9.0%) | 141 (91.0%) |
| Arts, Entertainment & Recreation | 0 (0.0%) | 14 (100.0%) |
| Accommodation & Food Services | 5 (100.0%) | 0 (0.0%) |
| Public Administration | 19 (36.5%) | 33 (63.5%) |
| Total | 336 (47.1%) | 378 (52.9%) |
Education in Carbondale
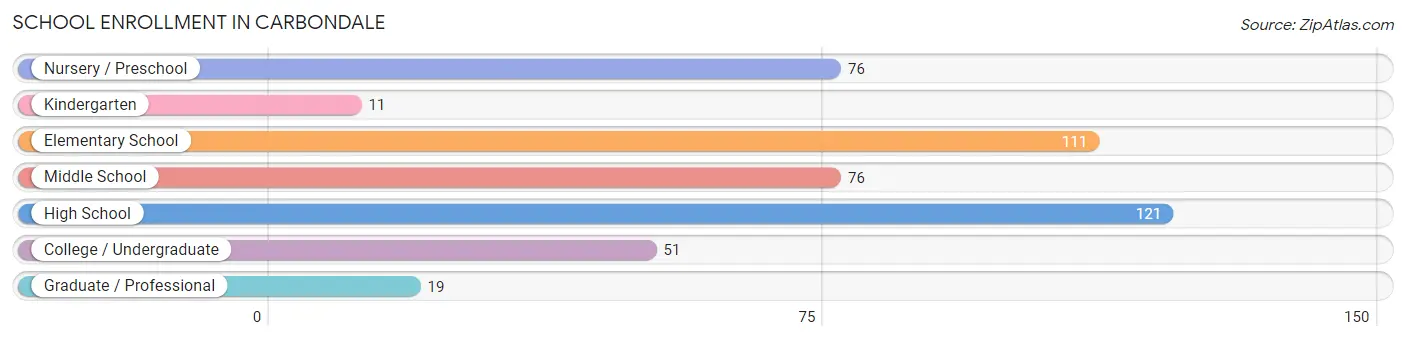
School Enrollment in Carbondale
The most common levels of schooling among the 465 students in Carbondale are high school (121 | 26.0%), elementary school (111 | 23.9%), and nursery / preschool (76 | 16.3%).
| School Level | # Students | % Students |
| Nursery / Preschool | 76 | 16.3% |
| Kindergarten | 11 | 2.4% |
| Elementary School | 111 | 23.9% |
| Middle School | 76 | 16.3% |
| High School | 121 | 26.0% |
| College / Undergraduate | 51 | 11.0% |
| Graduate / Professional | 19 | 4.1% |
| Total | 465 | 100.0% |
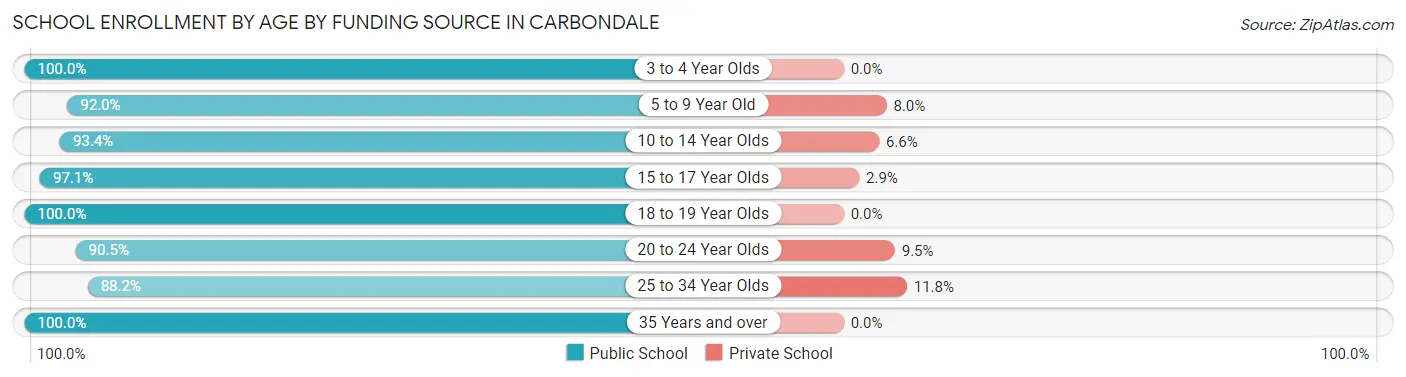
School Enrollment by Age by Funding Source in Carbondale
Out of a total of 465 students who are enrolled in schools in Carbondale, 26 (5.6%) attend a private institution, while the remaining 439 (94.4%) are enrolled in public schools. The age group of 25 to 34 year olds has the highest likelihood of being enrolled in private schools, with 2 (11.8% in the age bracket) enrolled. Conversely, the age group of 3 to 4 year olds has the lowest likelihood of being enrolled in a private school, with 45 (100.0% in the age bracket) attending a public institution.
| Age Bracket | Public School | Private School |
| 3 to 4 Year Olds | 45 (100.0%) | 0 (0.0%) |
| 5 to 9 Year Old | 127 (92.0%) | 11 (8.0%) |
| 10 to 14 Year Olds | 85 (93.4%) | 6 (6.6%) |
| 15 to 17 Year Olds | 101 (97.1%) | 3 (2.9%) |
| 18 to 19 Year Olds | 7 (100.0%) | 0 (0.0%) |
| 20 to 24 Year Olds | 38 (90.5%) | 4 (9.5%) |
| 25 to 34 Year Olds | 15 (88.2%) | 2 (11.8%) |
| 35 Years and over | 21 (100.0%) | 0 (0.0%) |
| Total | 439 (94.4%) | 26 (5.6%) |
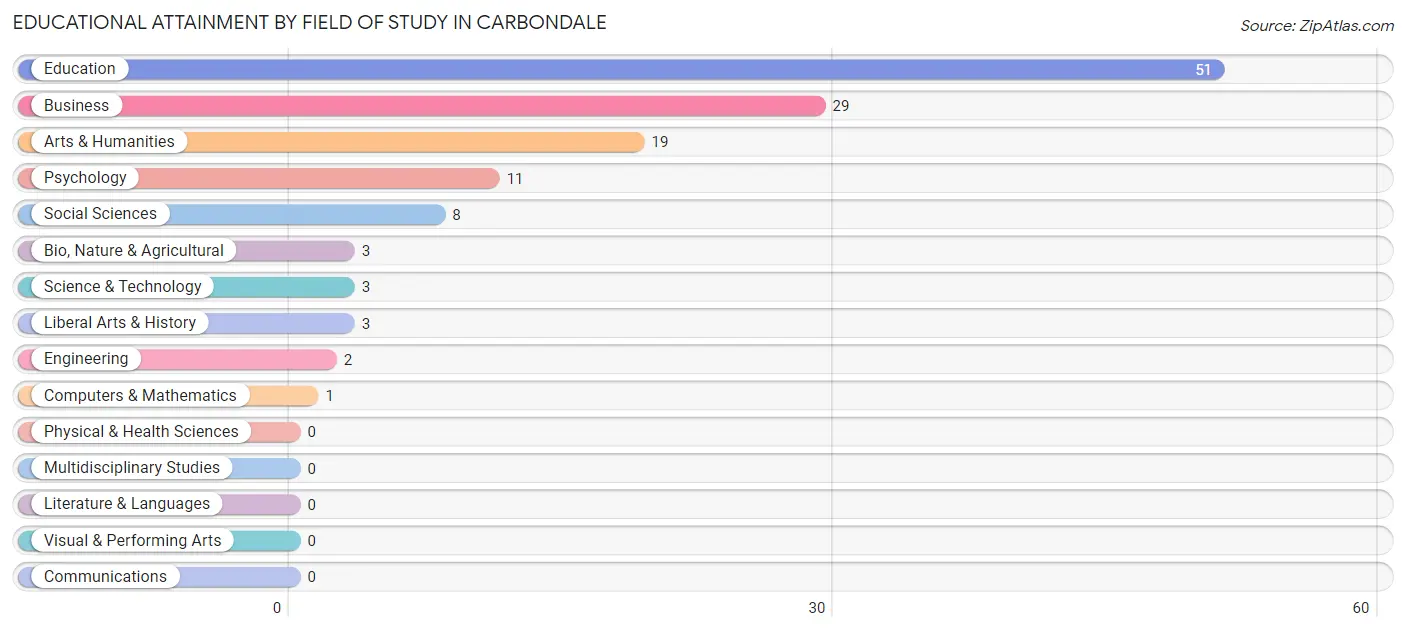
Educational Attainment by Field of Study in Carbondale
Education (51 | 39.2%), business (29 | 22.3%), arts & humanities (19 | 14.6%), psychology (11 | 8.5%), and social sciences (8 | 6.1%) are the most common fields of study among 130 individuals in Carbondale who have obtained a bachelor's degree or higher.
| Field of Study | # Graduates | % Graduates |
| Computers & Mathematics | 1 | 0.8% |
| Bio, Nature & Agricultural | 3 | 2.3% |
| Physical & Health Sciences | 0 | 0.0% |
| Psychology | 11 | 8.5% |
| Social Sciences | 8 | 6.1% |
| Engineering | 2 | 1.5% |
| Multidisciplinary Studies | 0 | 0.0% |
| Science & Technology | 3 | 2.3% |
| Business | 29 | 22.3% |
| Education | 51 | 39.2% |
| Literature & Languages | 0 | 0.0% |
| Liberal Arts & History | 3 | 2.3% |
| Visual & Performing Arts | 0 | 0.0% |
| Communications | 0 | 0.0% |
| Arts & Humanities | 19 | 14.6% |
| Total | 130 | 100.0% |
Transportation & Commute in Carbondale
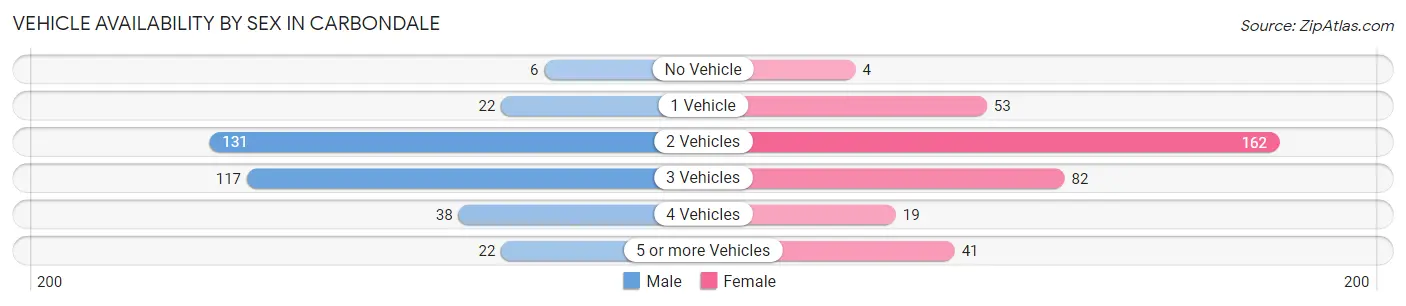
Vehicle Availability by Sex in Carbondale
The most prevalent vehicle ownership categories in Carbondale are males with 2 vehicles (131, accounting for 39.0%) and females with 2 vehicles (162, making up 36.3%).
| Vehicles Available | Male | Female |
| No Vehicle | 6 (1.8%) | 4 (1.1%) |
| 1 Vehicle | 22 (6.6%) | 53 (14.7%) |
| 2 Vehicles | 131 (39.0%) | 162 (44.9%) |
| 3 Vehicles | 117 (34.8%) | 82 (22.7%) |
| 4 Vehicles | 38 (11.3%) | 19 (5.3%) |
| 5 or more Vehicles | 22 (6.6%) | 41 (11.4%) |
| Total | 336 (100.0%) | 361 (100.0%) |
Commute Time in Carbondale
The most frequently occuring commute durations in Carbondale are 25 to 29 minutes (155 commuters, 24.6%), 15 to 19 minutes (103 commuters, 16.4%), and 30 to 34 minutes (102 commuters, 16.2%).
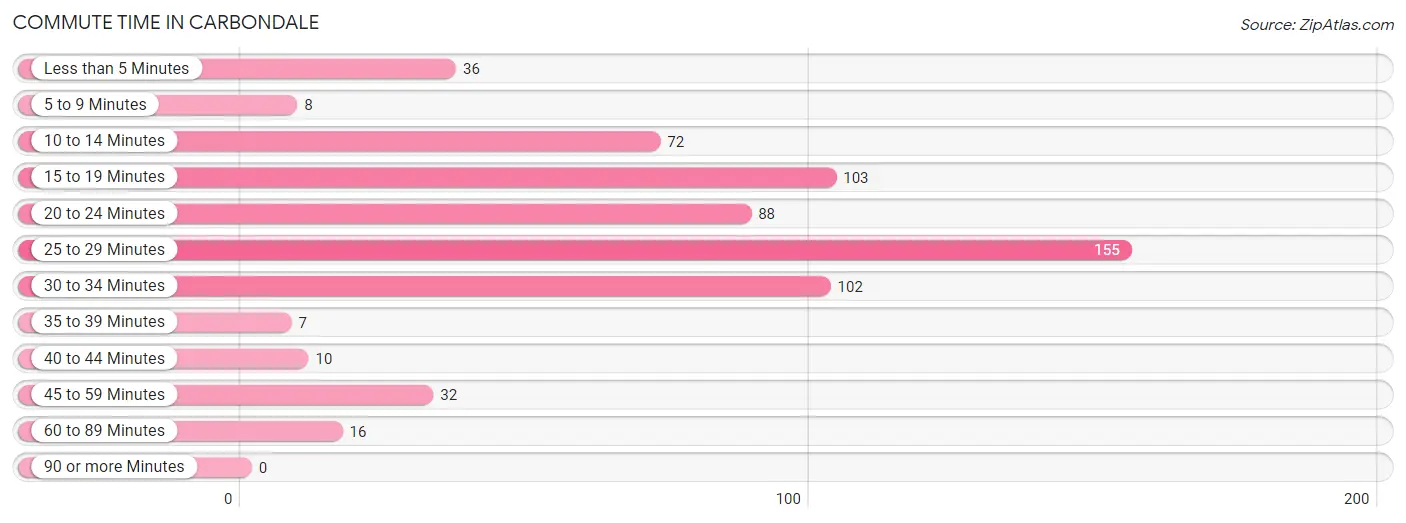
| Commute Time | # Commuters | % Commuters |
| Less than 5 Minutes | 36 | 5.7% |
| 5 to 9 Minutes | 8 | 1.3% |
| 10 to 14 Minutes | 72 | 11.5% |
| 15 to 19 Minutes | 103 | 16.4% |
| 20 to 24 Minutes | 88 | 14.0% |
| 25 to 29 Minutes | 155 | 24.6% |
| 30 to 34 Minutes | 102 | 16.2% |
| 35 to 39 Minutes | 7 | 1.1% |
| 40 to 44 Minutes | 10 | 1.6% |
| 45 to 59 Minutes | 32 | 5.1% |
| 60 to 89 Minutes | 16 | 2.5% |
| 90 or more Minutes | 0 | 0.0% |
Commute Time by Sex in Carbondale
The most common commute times in Carbondale are 25 to 29 minutes (95 commuters, 30.3%) for males and 25 to 29 minutes (60 commuters, 19.0%) for females.
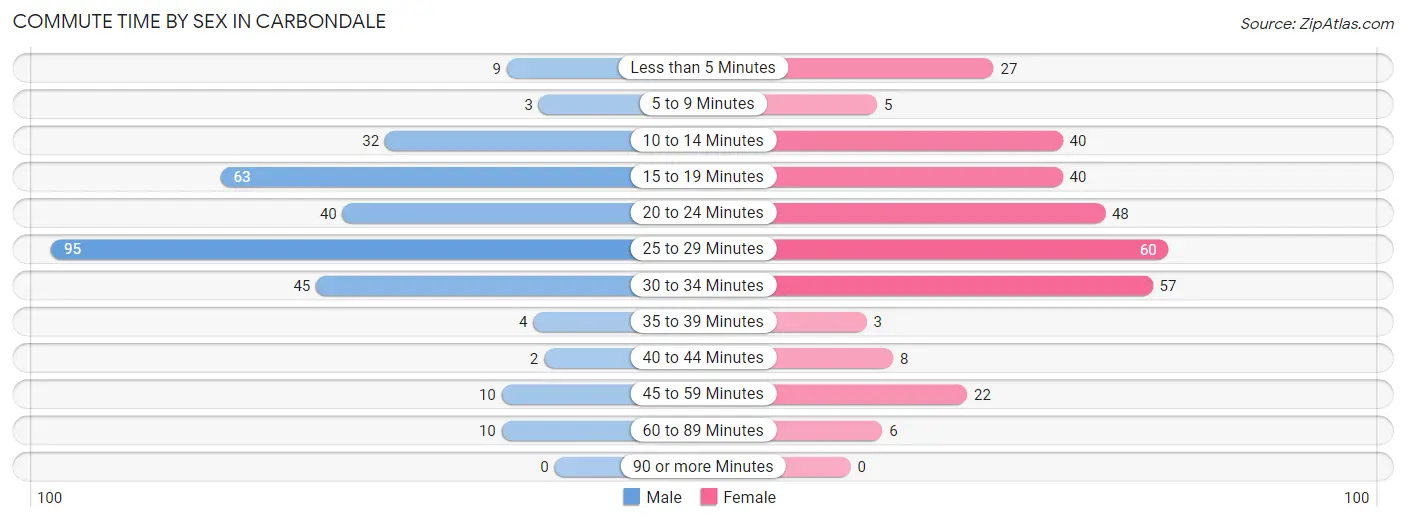
| Commute Time | Male | Female |
| Less than 5 Minutes | 9 (2.9%) | 27 (8.5%) |
| 5 to 9 Minutes | 3 (1.0%) | 5 (1.6%) |
| 10 to 14 Minutes | 32 (10.2%) | 40 (12.7%) |
| 15 to 19 Minutes | 63 (20.1%) | 40 (12.7%) |
| 20 to 24 Minutes | 40 (12.8%) | 48 (15.2%) |
| 25 to 29 Minutes | 95 (30.3%) | 60 (19.0%) |
| 30 to 34 Minutes | 45 (14.4%) | 57 (18.0%) |
| 35 to 39 Minutes | 4 (1.3%) | 3 (0.9%) |
| 40 to 44 Minutes | 2 (0.6%) | 8 (2.5%) |
| 45 to 59 Minutes | 10 (3.2%) | 22 (7.0%) |
| 60 to 89 Minutes | 10 (3.2%) | 6 (1.9%) |
| 90 or more Minutes | 0 (0.0%) | 0 (0.0%) |
Time of Departure to Work by Sex in Carbondale
The most frequent times of departure to work in Carbondale are 6:30 AM to 6:59 AM (78, 24.9%) for males and 7:00 AM to 7:29 AM (79, 25.0%) for females.
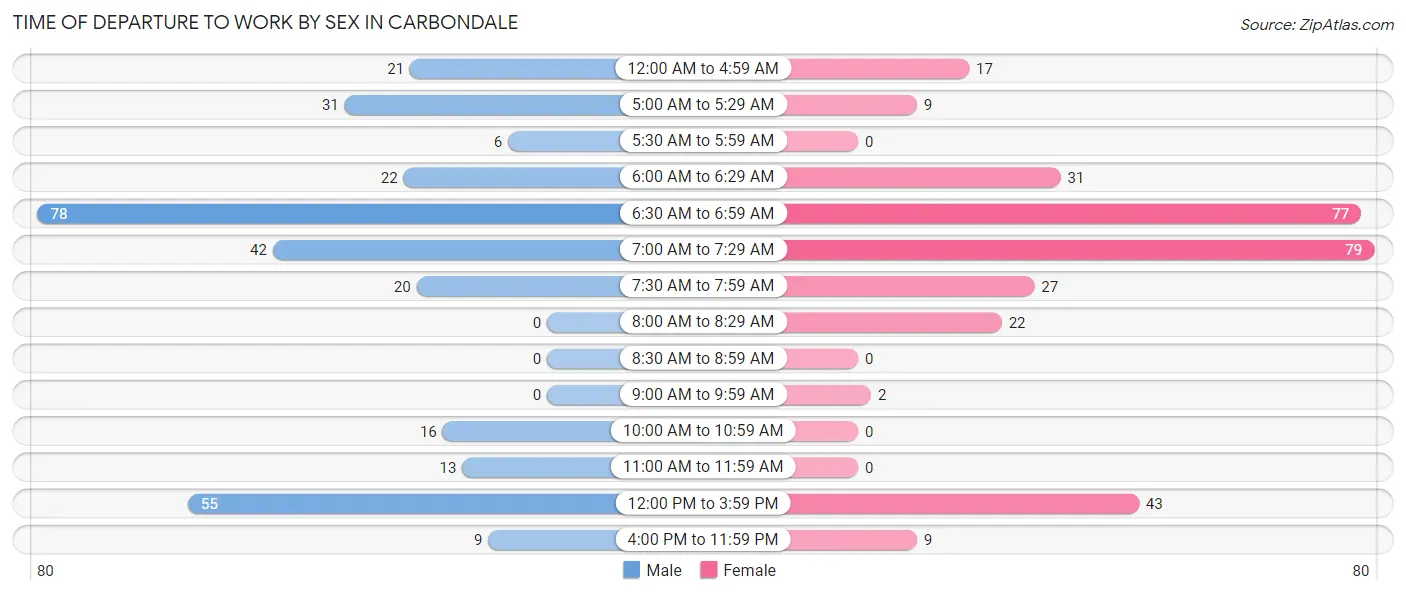
| Time of Departure | Male | Female |
| 12:00 AM to 4:59 AM | 21 (6.7%) | 17 (5.4%) |
| 5:00 AM to 5:29 AM | 31 (9.9%) | 9 (2.9%) |
| 5:30 AM to 5:59 AM | 6 (1.9%) | 0 (0.0%) |
| 6:00 AM to 6:29 AM | 22 (7.0%) | 31 (9.8%) |
| 6:30 AM to 6:59 AM | 78 (24.9%) | 77 (24.4%) |
| 7:00 AM to 7:29 AM | 42 (13.4%) | 79 (25.0%) |
| 7:30 AM to 7:59 AM | 20 (6.4%) | 27 (8.5%) |
| 8:00 AM to 8:29 AM | 0 (0.0%) | 22 (7.0%) |
| 8:30 AM to 8:59 AM | 0 (0.0%) | 0 (0.0%) |
| 9:00 AM to 9:59 AM | 0 (0.0%) | 2 (0.6%) |
| 10:00 AM to 10:59 AM | 16 (5.1%) | 0 (0.0%) |
| 11:00 AM to 11:59 AM | 13 (4.2%) | 0 (0.0%) |
| 12:00 PM to 3:59 PM | 55 (17.6%) | 43 (13.6%) |
| 4:00 PM to 11:59 PM | 9 (2.9%) | 9 (2.9%) |
| Total | 313 (100.0%) | 316 (100.0%) |
Housing Occupancy in Carbondale
Occupancy by Ownership in Carbondale
Of the total 553 dwellings in Carbondale, owner-occupied units account for 390 (70.5%), while renter-occupied units make up 163 (29.5%).
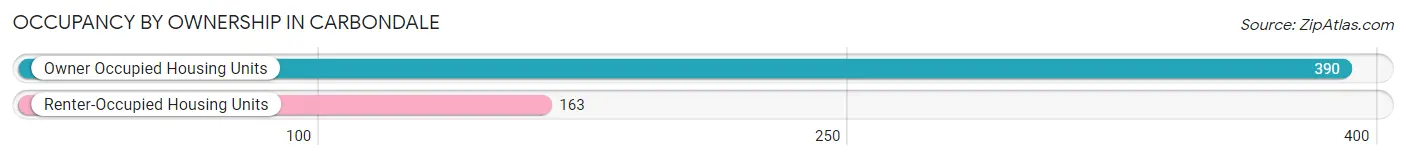
| Occupancy | # Housing Units | % Housing Units |
| Owner Occupied Housing Units | 390 | 70.5% |
| Renter-Occupied Housing Units | 163 | 29.5% |
| Total Occupied Housing Units | 553 | 100.0% |
Occupancy by Household Size in Carbondale
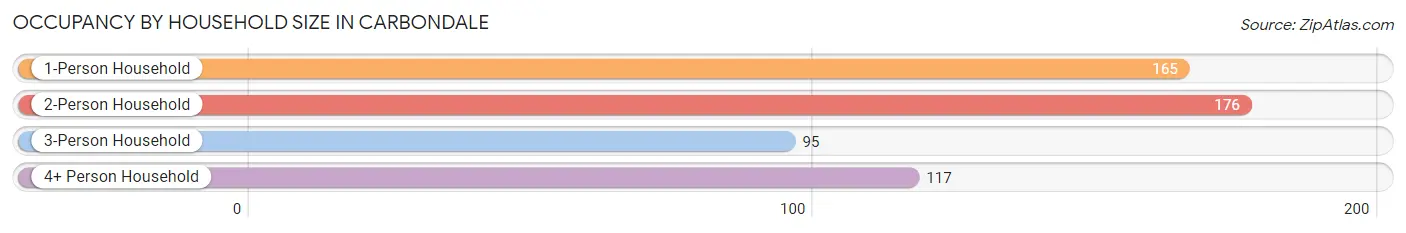
| Household Size | # Housing Units | % Housing Units |
| 1-Person Household | 165 | 29.8% |
| 2-Person Household | 176 | 31.8% |
| 3-Person Household | 95 | 17.2% |
| 4+ Person Household | 117 | 21.2% |
| Total Housing Units | 553 | 100.0% |
Occupancy by Ownership by Household Size in Carbondale
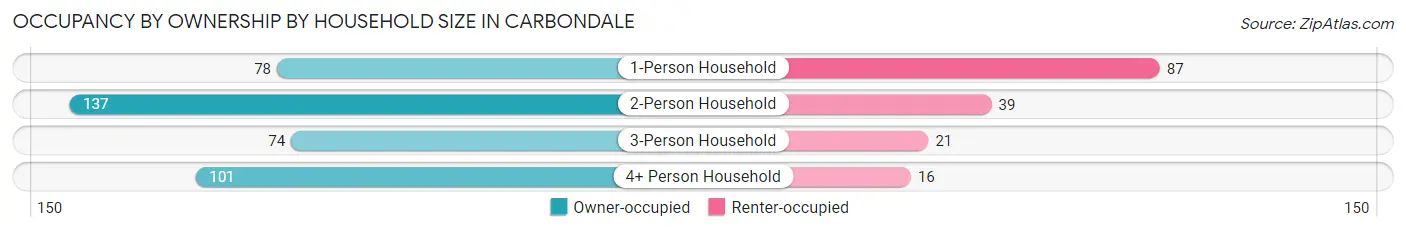
| Household Size | Owner-occupied | Renter-occupied |
| 1-Person Household | 78 (47.3%) | 87 (52.7%) |
| 2-Person Household | 137 (77.8%) | 39 (22.2%) |
| 3-Person Household | 74 (77.9%) | 21 (22.1%) |
| 4+ Person Household | 101 (86.3%) | 16 (13.7%) |
| Total Housing Units | 390 (70.5%) | 163 (29.5%) |
Occupancy by Educational Attainment in Carbondale
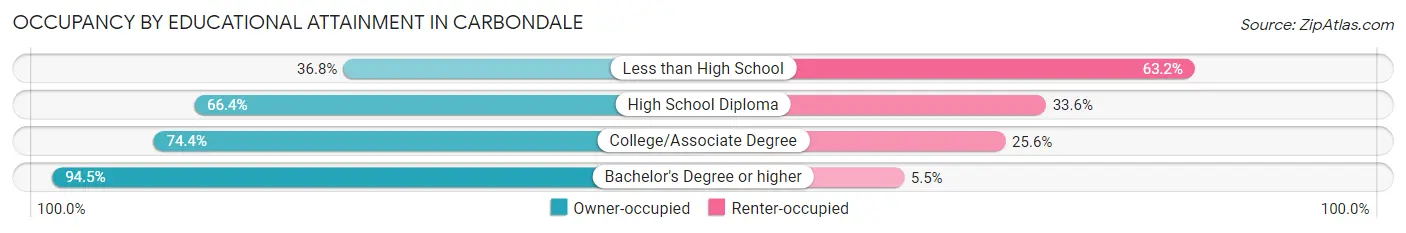
| Household Size | Owner-occupied | Renter-occupied |
| Less than High School | 21 (36.8%) | 36 (63.2%) |
| High School Diploma | 152 (66.4%) | 77 (33.6%) |
| College/Associate Degree | 131 (74.4%) | 45 (25.6%) |
| Bachelor's Degree or higher | 86 (94.5%) | 5 (5.5%) |
Occupancy by Age of Householder in Carbondale
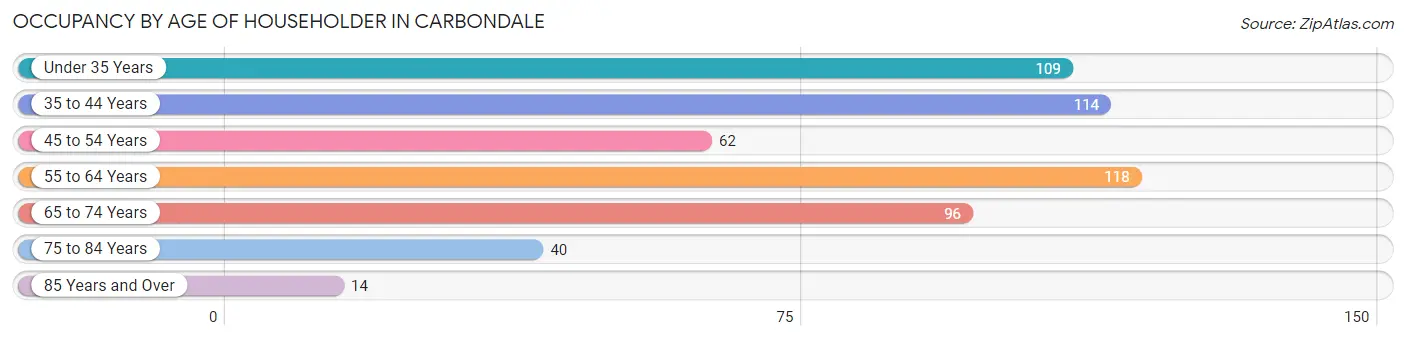
| Age Bracket | # Households | % Households |
| Under 35 Years | 109 | 19.7% |
| 35 to 44 Years | 114 | 20.6% |
| 45 to 54 Years | 62 | 11.2% |
| 55 to 64 Years | 118 | 21.3% |
| 65 to 74 Years | 96 | 17.4% |
| 75 to 84 Years | 40 | 7.2% |
| 85 Years and Over | 14 | 2.5% |
| Total | 553 | 100.0% |
Housing Finances in Carbondale
Median Income by Occupancy in Carbondale
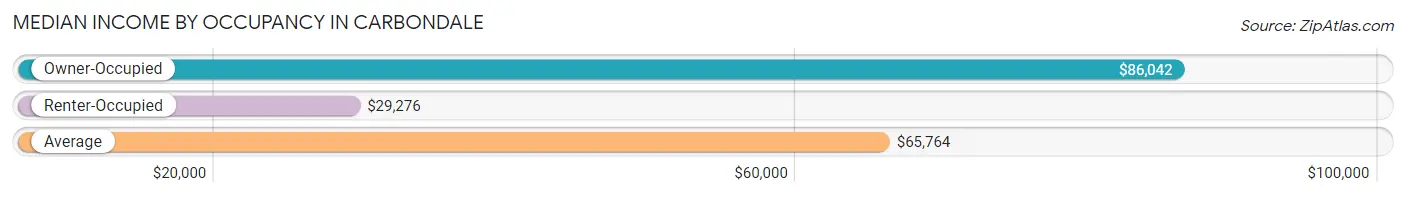
| Occupancy Type | # Households | Median Income |
| Owner-Occupied | 390 (70.5%) | $86,042 |
| Renter-Occupied | 163 (29.5%) | $29,276 |
| Average | 553 (100.0%) | $65,764 |
Occupancy by Householder Income Bracket in Carbondale
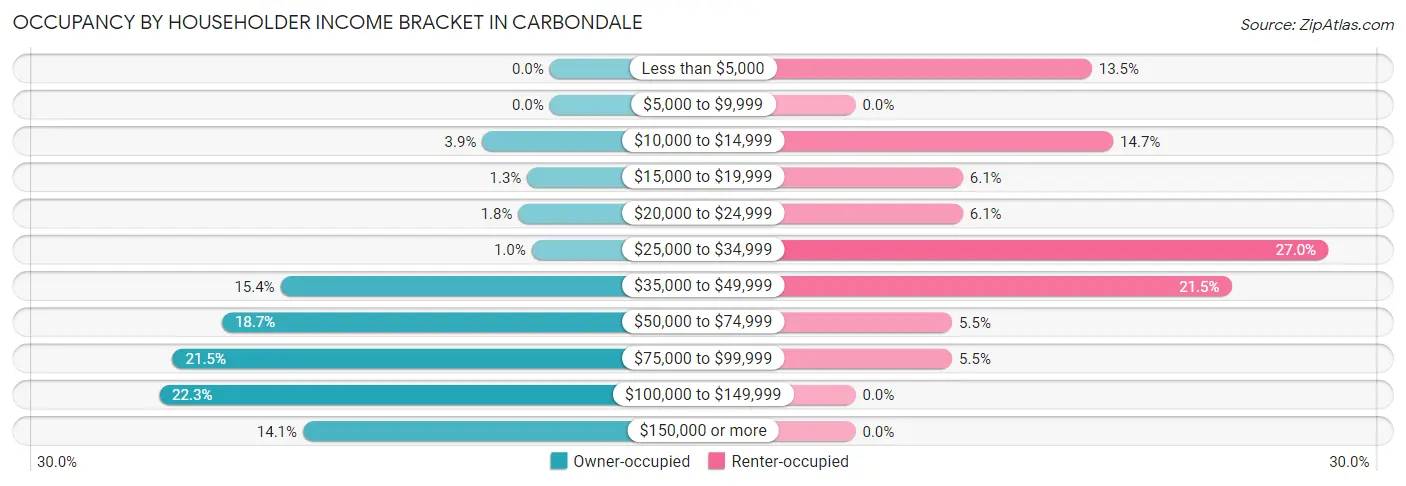
| Income Bracket | Owner-occupied | Renter-occupied |
| Less than $5,000 | 0 (0.0%) | 22 (13.5%) |
| $5,000 to $9,999 | 0 (0.0%) | 0 (0.0%) |
| $10,000 to $14,999 | 15 (3.8%) | 24 (14.7%) |
| $15,000 to $19,999 | 5 (1.3%) | 10 (6.1%) |
| $20,000 to $24,999 | 7 (1.8%) | 10 (6.1%) |
| $25,000 to $34,999 | 4 (1.0%) | 44 (27.0%) |
| $35,000 to $49,999 | 60 (15.4%) | 35 (21.5%) |
| $50,000 to $74,999 | 73 (18.7%) | 9 (5.5%) |
| $75,000 to $99,999 | 84 (21.5%) | 9 (5.5%) |
| $100,000 to $149,999 | 87 (22.3%) | 0 (0.0%) |
| $150,000 or more | 55 (14.1%) | 0 (0.0%) |
| Total | 390 (100.0%) | 163 (100.0%) |
Monthly Housing Cost Tiers in Carbondale
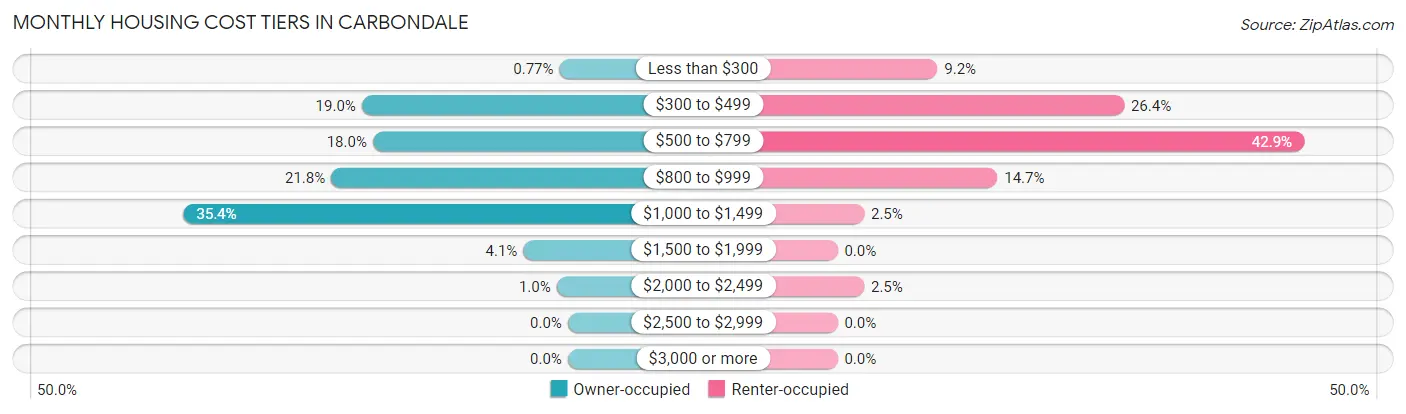
| Monthly Cost | Owner-occupied | Renter-occupied |
| Less than $300 | 3 (0.8%) | 15 (9.2%) |
| $300 to $499 | 74 (19.0%) | 43 (26.4%) |
| $500 to $799 | 70 (17.9%) | 70 (42.9%) |
| $800 to $999 | 85 (21.8%) | 24 (14.7%) |
| $1,000 to $1,499 | 138 (35.4%) | 4 (2.5%) |
| $1,500 to $1,999 | 16 (4.1%) | 0 (0.0%) |
| $2,000 to $2,499 | 4 (1.0%) | 4 (2.5%) |
| $2,500 to $2,999 | 0 (0.0%) | 0 (0.0%) |
| $3,000 or more | 0 (0.0%) | 0 (0.0%) |
| Total | 390 (100.0%) | 163 (100.0%) |
Physical Housing Characteristics in Carbondale
Housing Structures in Carbondale
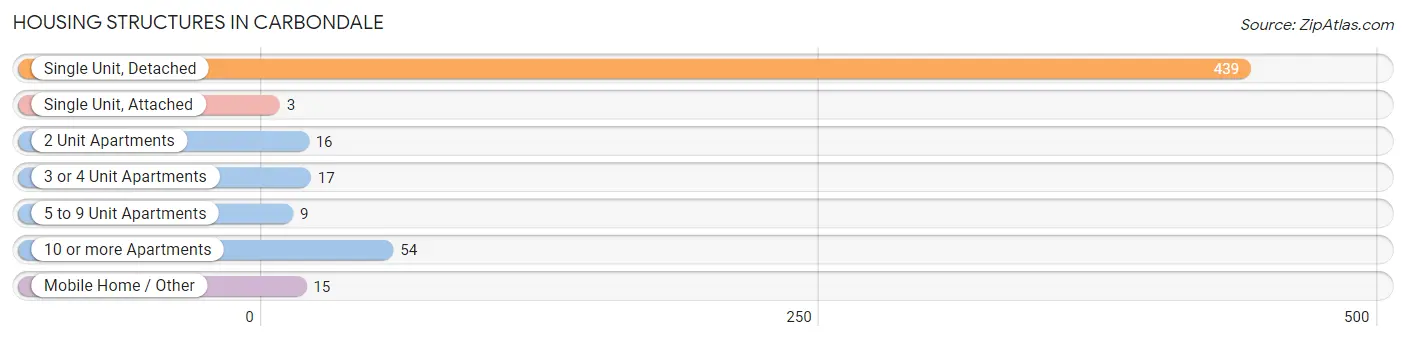
| Structure Type | # Housing Units | % Housing Units |
| Single Unit, Detached | 439 | 79.4% |
| Single Unit, Attached | 3 | 0.5% |
| 2 Unit Apartments | 16 | 2.9% |
| 3 or 4 Unit Apartments | 17 | 3.1% |
| 5 to 9 Unit Apartments | 9 | 1.6% |
| 10 or more Apartments | 54 | 9.8% |
| Mobile Home / Other | 15 | 2.7% |
| Total | 553 | 100.0% |
Housing Structures by Occupancy in Carbondale
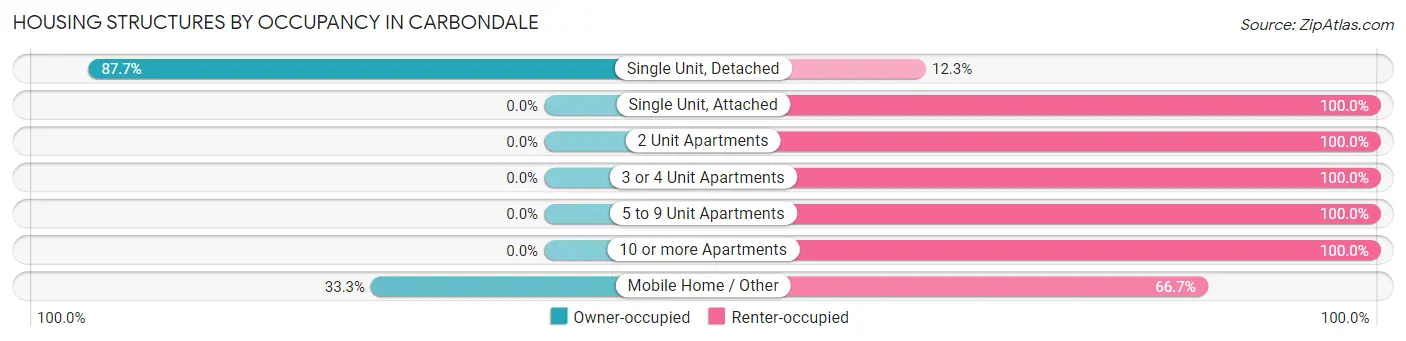
| Structure Type | Owner-occupied | Renter-occupied |
| Single Unit, Detached | 385 (87.7%) | 54 (12.3%) |
| Single Unit, Attached | 0 (0.0%) | 3 (100.0%) |
| 2 Unit Apartments | 0 (0.0%) | 16 (100.0%) |
| 3 or 4 Unit Apartments | 0 (0.0%) | 17 (100.0%) |
| 5 to 9 Unit Apartments | 0 (0.0%) | 9 (100.0%) |
| 10 or more Apartments | 0 (0.0%) | 54 (100.0%) |
| Mobile Home / Other | 5 (33.3%) | 10 (66.7%) |
| Total | 390 (70.5%) | 163 (29.5%) |
Housing Structures by Number of Rooms in Carbondale
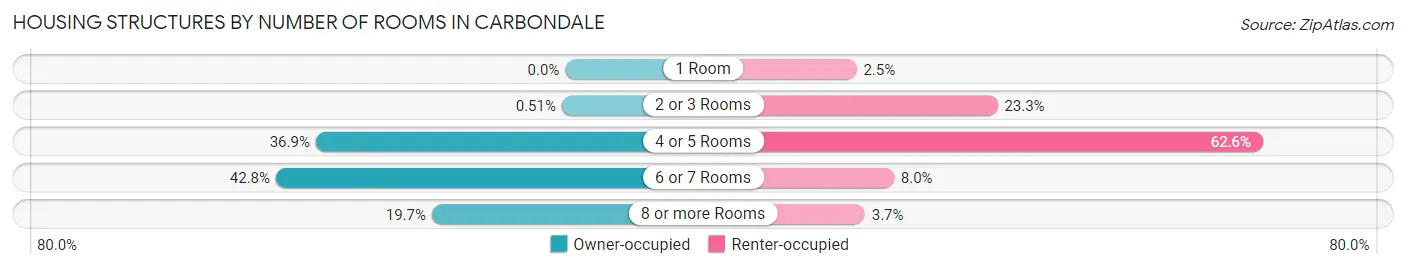
| Number of Rooms | Owner-occupied | Renter-occupied |
| 1 Room | 0 (0.0%) | 4 (2.5%) |
| 2 or 3 Rooms | 2 (0.5%) | 38 (23.3%) |
| 4 or 5 Rooms | 144 (36.9%) | 102 (62.6%) |
| 6 or 7 Rooms | 167 (42.8%) | 13 (8.0%) |
| 8 or more Rooms | 77 (19.7%) | 6 (3.7%) |
| Total | 390 (100.0%) | 163 (100.0%) |
Housing Structure by Heating Type in Carbondale
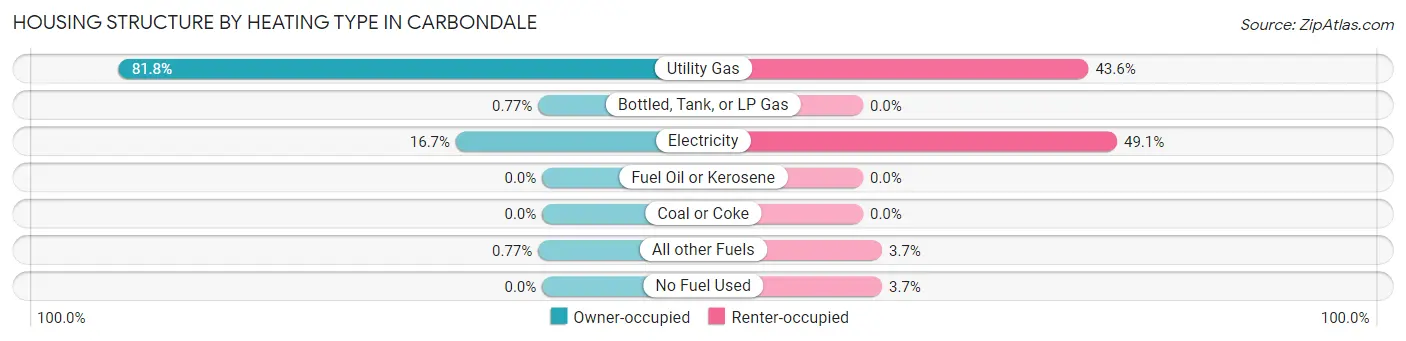
| Heating Type | Owner-occupied | Renter-occupied |
| Utility Gas | 319 (81.8%) | 71 (43.6%) |
| Bottled, Tank, or LP Gas | 3 (0.8%) | 0 (0.0%) |
| Electricity | 65 (16.7%) | 80 (49.1%) |
| Fuel Oil or Kerosene | 0 (0.0%) | 0 (0.0%) |
| Coal or Coke | 0 (0.0%) | 0 (0.0%) |
| All other Fuels | 3 (0.8%) | 6 (3.7%) |
| No Fuel Used | 0 (0.0%) | 6 (3.7%) |
| Total | 390 (100.0%) | 163 (100.0%) |
Household Vehicle Usage in Carbondale
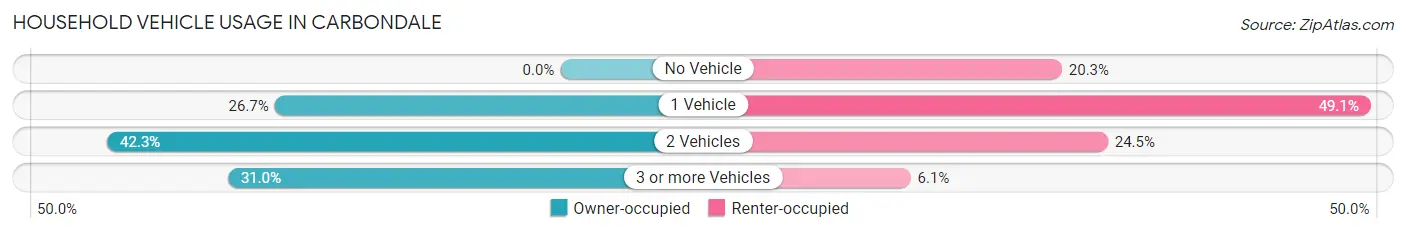
| Vehicles per Household | Owner-occupied | Renter-occupied |
| No Vehicle | 0 (0.0%) | 33 (20.3%) |
| 1 Vehicle | 104 (26.7%) | 80 (49.1%) |
| 2 Vehicles | 165 (42.3%) | 40 (24.5%) |
| 3 or more Vehicles | 121 (31.0%) | 10 (6.1%) |
| Total | 390 (100.0%) | 163 (100.0%) |
Real Estate & Mortgages in Carbondale
Real Estate and Mortgage Overview in Carbondale
| Characteristic | Without Mortgage | With Mortgage |
| Housing Units | 123 | 267 |
| Median Property Value | $89,300 | $107,600 |
| Median Household Income | $75,625 | $45 |
| Monthly Housing Costs | $473 | $0 |
| Real Estate Taxes | $1,705 | $0 |
Property Value by Mortgage Status in Carbondale
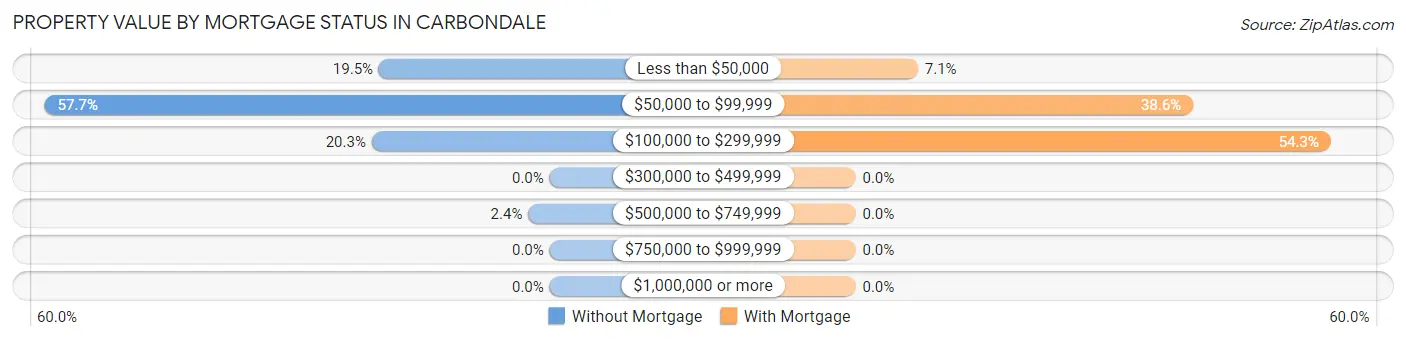
| Property Value | Without Mortgage | With Mortgage |
| Less than $50,000 | 24 (19.5%) | 19 (7.1%) |
| $50,000 to $99,999 | 71 (57.7%) | 103 (38.6%) |
| $100,000 to $299,999 | 25 (20.3%) | 145 (54.3%) |
| $300,000 to $499,999 | 0 (0.0%) | 0 (0.0%) |
| $500,000 to $749,999 | 3 (2.4%) | 0 (0.0%) |
| $750,000 to $999,999 | 0 (0.0%) | 0 (0.0%) |
| $1,000,000 or more | 0 (0.0%) | 0 (0.0%) |
| Total | 123 (100.0%) | 267 (100.0%) |
Household Income by Mortgage Status in Carbondale
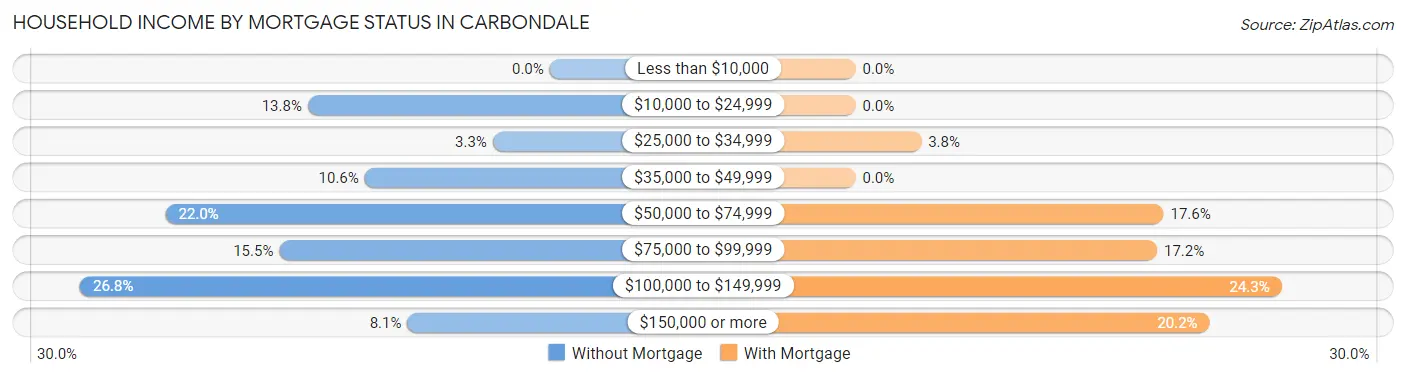
| Household Income | Without Mortgage | With Mortgage |
| Less than $10,000 | 0 (0.0%) | 0 (0.0%) |
| $10,000 to $24,999 | 17 (13.8%) | 0 (0.0%) |
| $25,000 to $34,999 | 4 (3.3%) | 10 (3.7%) |
| $35,000 to $49,999 | 13 (10.6%) | 0 (0.0%) |
| $50,000 to $74,999 | 27 (22.0%) | 47 (17.6%) |
| $75,000 to $99,999 | 19 (15.4%) | 46 (17.2%) |
| $100,000 to $149,999 | 33 (26.8%) | 65 (24.3%) |
| $150,000 or more | 10 (8.1%) | 54 (20.2%) |
| Total | 123 (100.0%) | 267 (100.0%) |
Property Value to Household Income Ratio in Carbondale
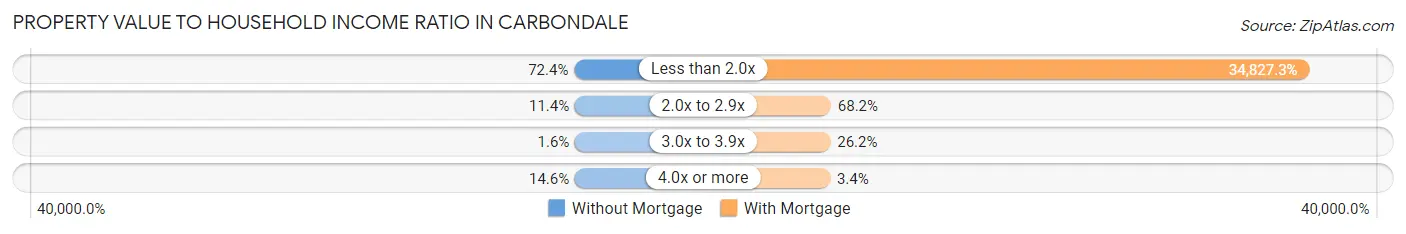
| Value-to-Income Ratio | Without Mortgage | With Mortgage |
| Less than 2.0x | 89 (72.4%) | 92,989 (34,827.3%) |
| 2.0x to 2.9x | 14 (11.4%) | 182 (68.2%) |
| 3.0x to 3.9x | 2 (1.6%) | 70 (26.2%) |
| 4.0x or more | 18 (14.6%) | 9 (3.4%) |
| Total | 123 (100.0%) | 267 (100.0%) |
Real Estate Taxes by Mortgage Status in Carbondale
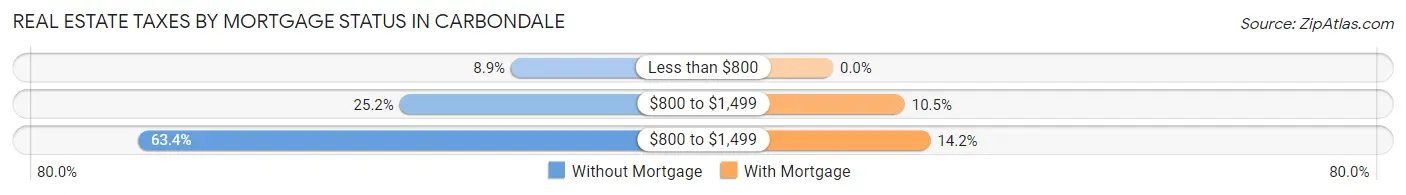
| Property Taxes | Without Mortgage | With Mortgage |
| Less than $800 | 11 (8.9%) | 0 (0.0%) |
| $800 to $1,499 | 31 (25.2%) | 28 (10.5%) |
| $800 to $1,499 | 78 (63.4%) | 38 (14.2%) |
| Total | 123 (100.0%) | 267 (100.0%) |
Health & Disability in Carbondale
Health Insurance Coverage by Age in Carbondale
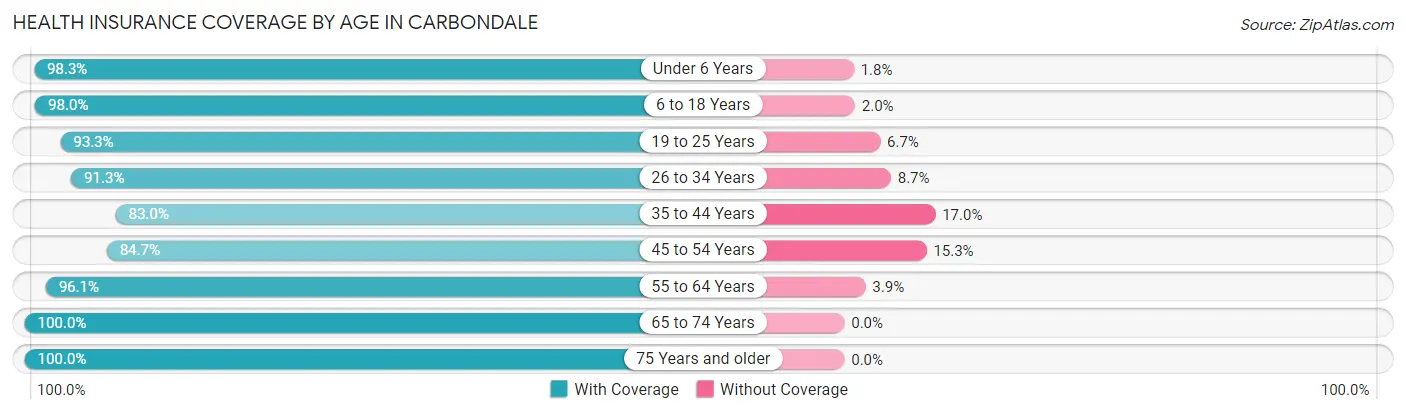
| Age Bracket | With Coverage | Without Coverage |
| Under 6 Years | 112 (98.3%) | 2 (1.8%) |
| 6 to 18 Years | 299 (98.0%) | 6 (2.0%) |
| 19 to 25 Years | 112 (93.3%) | 8 (6.7%) |
| 26 to 34 Years | 137 (91.3%) | 13 (8.7%) |
| 35 to 44 Years | 142 (83.0%) | 29 (17.0%) |
| 45 to 54 Years | 94 (84.7%) | 17 (15.3%) |
| 55 to 64 Years | 195 (96.1%) | 8 (3.9%) |
| 65 to 74 Years | 131 (100.0%) | 0 (0.0%) |
| 75 Years and older | 88 (100.0%) | 0 (0.0%) |
| Total | 1,310 (94.0%) | 83 (6.0%) |
Health Insurance Coverage by Citizenship Status in Carbondale
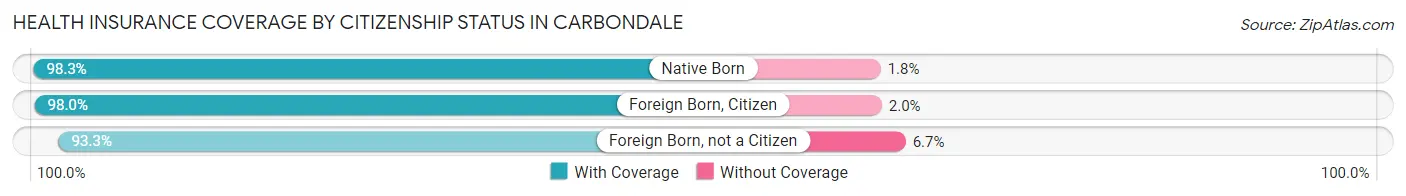
| Citizenship Status | With Coverage | Without Coverage |
| Native Born | 112 (98.3%) | 2 (1.8%) |
| Foreign Born, Citizen | 299 (98.0%) | 6 (2.0%) |
| Foreign Born, not a Citizen | 112 (93.3%) | 8 (6.7%) |
Health Insurance Coverage by Household Income in Carbondale
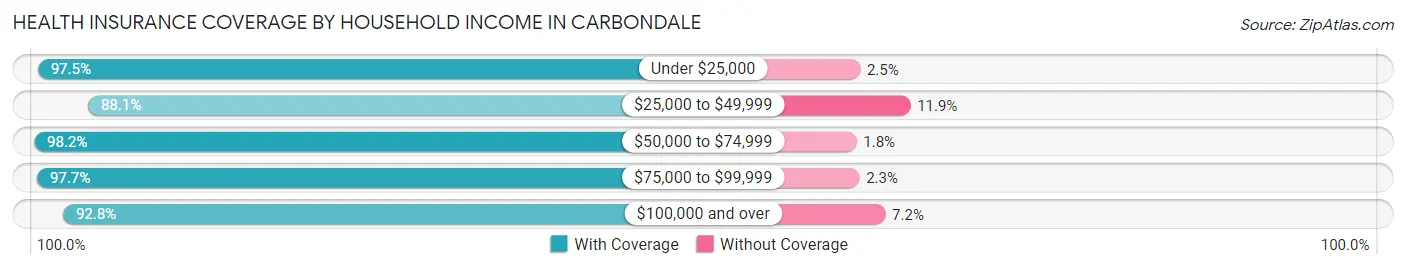
| Household Income | With Coverage | Without Coverage |
| Under $25,000 | 158 (97.5%) | 4 (2.5%) |
| $25,000 to $49,999 | 267 (88.1%) | 36 (11.9%) |
| $50,000 to $74,999 | 165 (98.2%) | 3 (1.8%) |
| $75,000 to $99,999 | 294 (97.7%) | 7 (2.3%) |
| $100,000 and over | 426 (92.8%) | 33 (7.2%) |
Public vs Private Health Insurance Coverage by Age in Carbondale
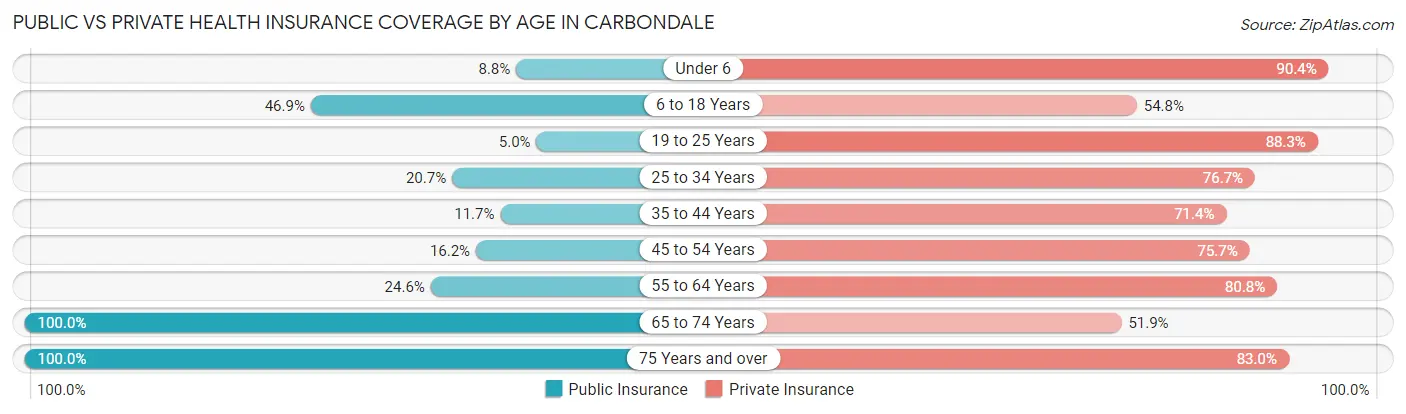
| Age Bracket | Public Insurance | Private Insurance |
| Under 6 | 10 (8.8%) | 103 (90.3%) |
| 6 to 18 Years | 143 (46.9%) | 167 (54.7%) |
| 19 to 25 Years | 6 (5.0%) | 106 (88.3%) |
| 25 to 34 Years | 31 (20.7%) | 115 (76.7%) |
| 35 to 44 Years | 20 (11.7%) | 122 (71.4%) |
| 45 to 54 Years | 18 (16.2%) | 84 (75.7%) |
| 55 to 64 Years | 50 (24.6%) | 164 (80.8%) |
| 65 to 74 Years | 131 (100.0%) | 68 (51.9%) |
| 75 Years and over | 88 (100.0%) | 73 (83.0%) |
| Total | 497 (35.7%) | 1,002 (71.9%) |
Disability Status by Sex by Age in Carbondale
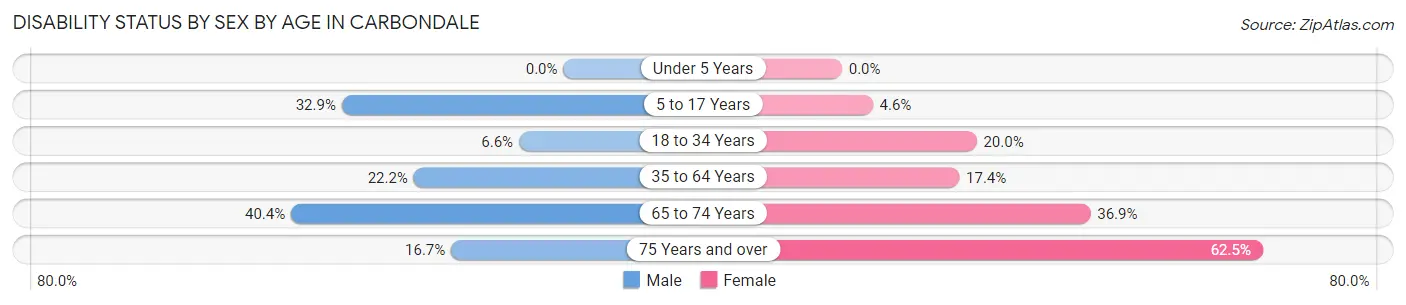
| Age Bracket | Male | Female |
| Under 5 Years | 0 (0.0%) | 0 (0.0%) |
| 5 to 17 Years | 52 (32.9%) | 8 (4.6%) |
| 18 to 34 Years | 11 (6.6%) | 22 (20.0%) |
| 35 to 64 Years | 44 (22.2%) | 50 (17.4%) |
| 65 to 74 Years | 19 (40.4%) | 31 (36.9%) |
| 75 Years and over | 8 (16.7%) | 25 (62.5%) |
Disability Class by Sex by Age in Carbondale
Disability Class: Hearing Difficulty
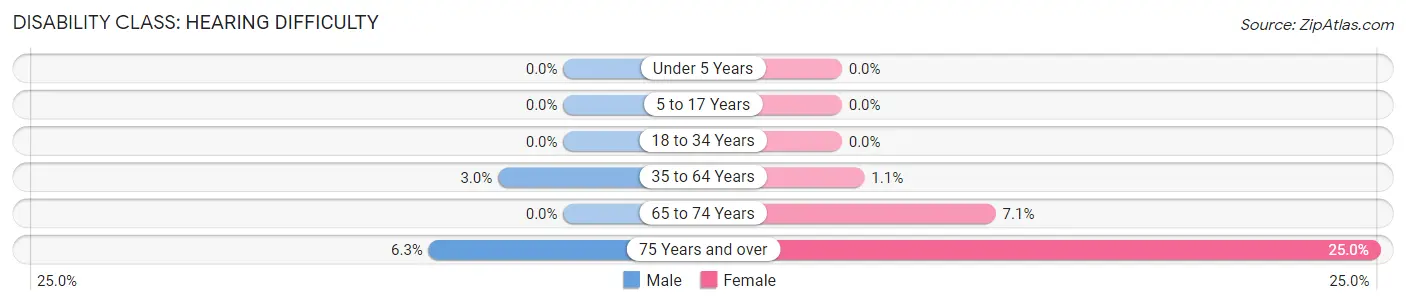
| Age Bracket | Male | Female |
| Under 5 Years | 0 (0.0%) | 0 (0.0%) |
| 5 to 17 Years | 0 (0.0%) | 0 (0.0%) |
| 18 to 34 Years | 0 (0.0%) | 0 (0.0%) |
| 35 to 64 Years | 6 (3.0%) | 3 (1.1%) |
| 65 to 74 Years | 0 (0.0%) | 6 (7.1%) |
| 75 Years and over | 3 (6.2%) | 10 (25.0%) |
Disability Class: Vision Difficulty
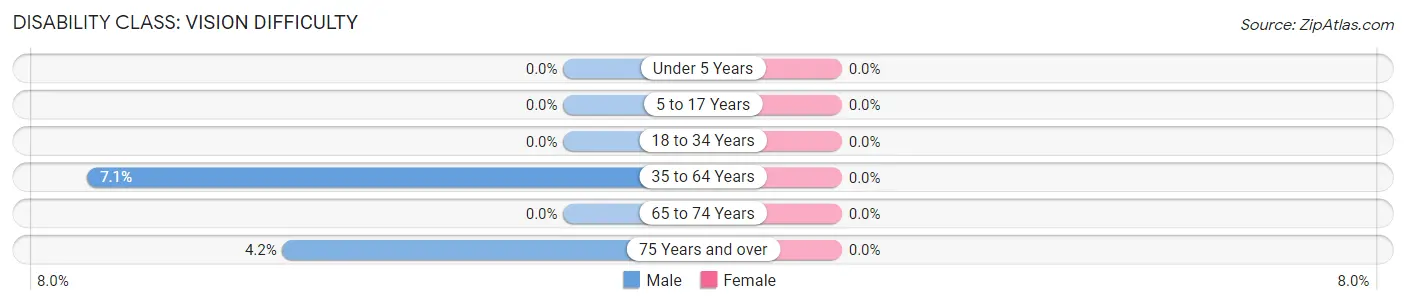
| Age Bracket | Male | Female |
| Under 5 Years | 0 (0.0%) | 0 (0.0%) |
| 5 to 17 Years | 0 (0.0%) | 0 (0.0%) |
| 18 to 34 Years | 0 (0.0%) | 0 (0.0%) |
| 35 to 64 Years | 14 (7.1%) | 0 (0.0%) |
| 65 to 74 Years | 0 (0.0%) | 0 (0.0%) |
| 75 Years and over | 2 (4.2%) | 0 (0.0%) |
Disability Class: Cognitive Difficulty
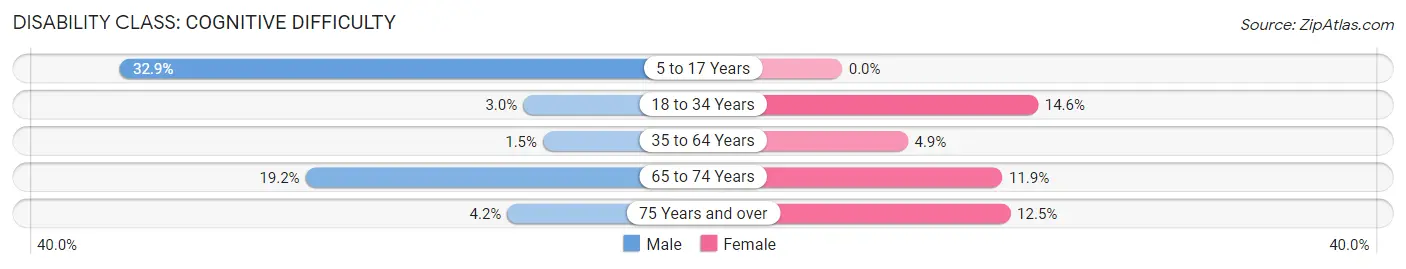
| Age Bracket | Male | Female |
| 5 to 17 Years | 52 (32.9%) | 0 (0.0%) |
| 18 to 34 Years | 5 (3.0%) | 16 (14.5%) |
| 35 to 64 Years | 3 (1.5%) | 14 (4.9%) |
| 65 to 74 Years | 9 (19.2%) | 10 (11.9%) |
| 75 Years and over | 2 (4.2%) | 5 (12.5%) |
Disability Class: Ambulatory Difficulty
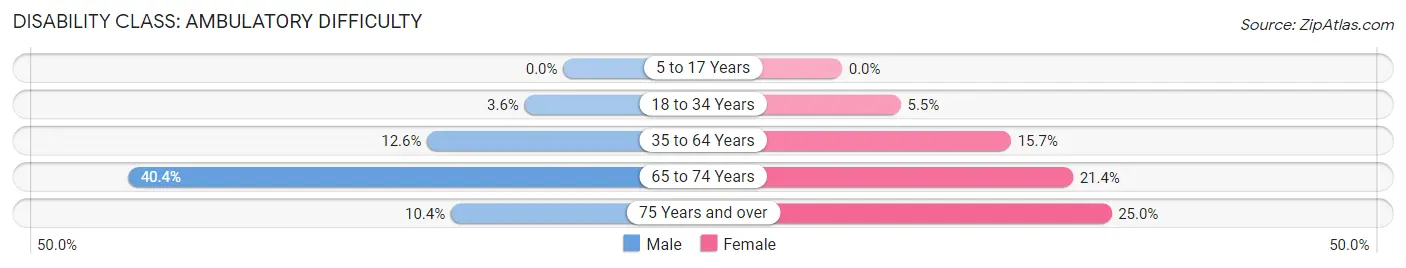
| Age Bracket | Male | Female |
| 5 to 17 Years | 0 (0.0%) | 0 (0.0%) |
| 18 to 34 Years | 6 (3.6%) | 6 (5.4%) |
| 35 to 64 Years | 25 (12.6%) | 45 (15.7%) |
| 65 to 74 Years | 19 (40.4%) | 18 (21.4%) |
| 75 Years and over | 5 (10.4%) | 10 (25.0%) |
Disability Class: Self-Care Difficulty
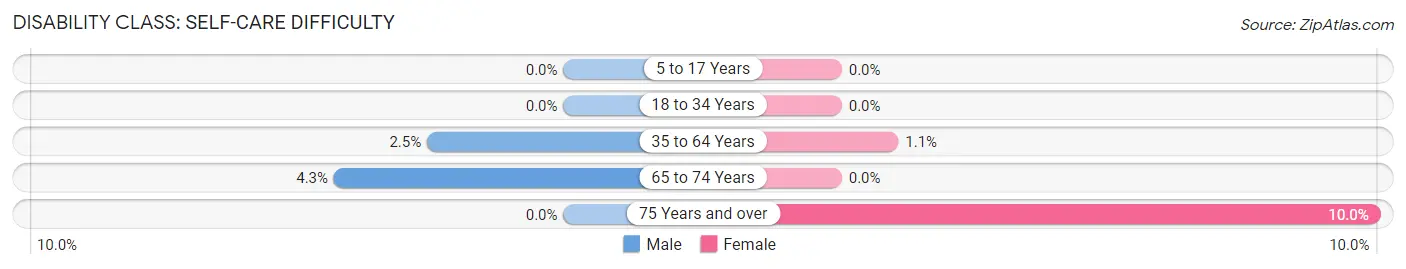
| Age Bracket | Male | Female |
| 5 to 17 Years | 0 (0.0%) | 0 (0.0%) |
| 18 to 34 Years | 0 (0.0%) | 0 (0.0%) |
| 35 to 64 Years | 5 (2.5%) | 3 (1.1%) |
| 65 to 74 Years | 2 (4.3%) | 0 (0.0%) |
| 75 Years and over | 0 (0.0%) | 4 (10.0%) |
Technology Access in Carbondale
Computing Device Access in Carbondale
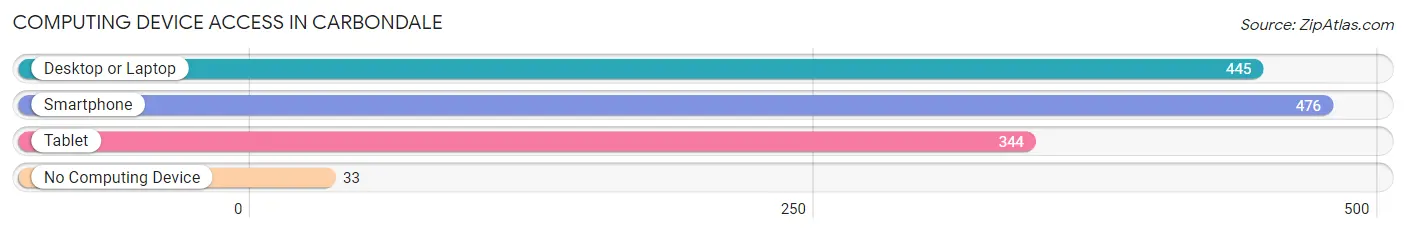
| Device Type | # Households | % Households |
| Desktop or Laptop | 445 | 80.5% |
| Smartphone | 476 | 86.1% |
| Tablet | 344 | 62.2% |
| No Computing Device | 33 | 6.0% |
| Total | 553 | 100.0% |
Internet Access in Carbondale
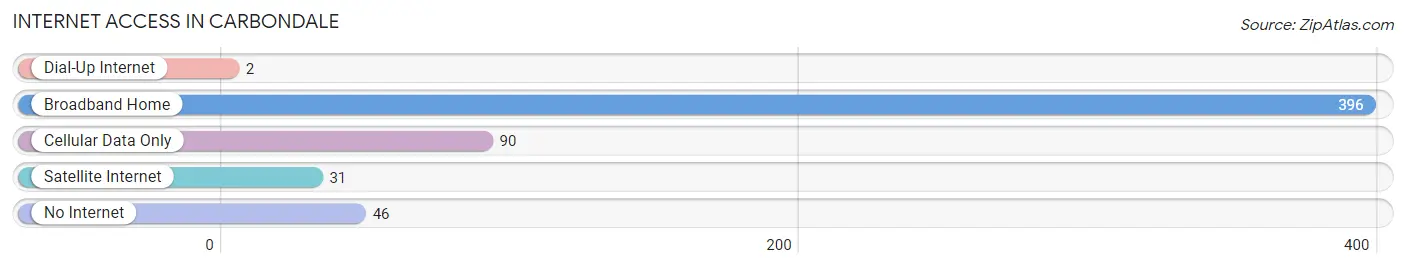
| Internet Type | # Households | % Households |
| Dial-Up Internet | 2 | 0.4% |
| Broadband Home | 396 | 71.6% |
| Cellular Data Only | 90 | 16.3% |
| Satellite Internet | 31 | 5.6% |
| No Internet | 46 | 8.3% |
| Total | 553 | 100.0% |
Carbondale Summary
Carbondale, Kansas is a small town located in Osage County, Kansas. It is situated in the Flint Hills region of the state, and is home to a population of just over 1,000 people. The town was founded in 1871 and has a rich history that is intertwined with the history of the state of Kansas.
History
Carbondale was founded in 1871 by a group of settlers from Ohio. The town was named after the coal deposits that were found in the area, and the settlers were hoping to capitalize on the coal industry. The town quickly grew and by 1873, it had a population of over 500 people. The town was incorporated in 1875 and the first mayor was elected in 1876.
The town was a major hub for the coal industry in the late 19th and early 20th centuries. The coal industry provided jobs for many of the town’s residents and helped to fuel the local economy. The town also had a thriving agricultural industry, with many of the town’s residents working in the fields and on the farms.
In the early 20th century, the town began to decline as the coal industry began to decline. The town’s population began to dwindle and by the 1950s, the population had dropped to just over 500 people. The town has since seen a resurgence in population and is now home to over 1,000 people.
Geography
Carbondale is located in Osage County, Kansas. It is situated in the Flint Hills region of the state and is surrounded by rolling hills and prairies. The town is located about 25 miles south of Topeka and about 50 miles west of Kansas City. The town is situated on the banks of the Marais des Cygnes River and is home to several small lakes and ponds.
The town has a total area of 1.2 square miles, all of which is land. The town has a humid continental climate, with hot summers and cold winters. The average temperature in the summer is around 80 degrees Fahrenheit and the average temperature in the winter is around 30 degrees Fahrenheit.
Economy
The economy of Carbondale is largely based on agriculture and tourism. The town is home to several small farms and ranches, and the town’s residents are largely employed in the agricultural industry. The town is also home to several small businesses, including restaurants, shops, and other services.
The town is also a popular tourist destination, as it is located in the heart of the Flint Hills region. The town is home to several attractions, including the Carbondale Historical Museum, the Carbondale State Park, and the Carbondale Wildlife Refuge. The town also hosts several annual events, including the Carbondale Days Festival and the Carbondale Rodeo.
Demographics
As of the 2010 census, the population of Carbondale was 1,072. The town has a population density of 890 people per square mile. The racial makeup of the town is 97.3% White, 0.7% African American, 0.2% Native American, 0.2% Asian, 0.1% Pacific Islander, 0.3% from other races, and 1.2% from two or more races.
The median income for a household in the town is $37,500 and the median income for a family is $45,000. The per capita income for the town is $19,000. The town has a poverty rate of 16.3%. The town is served by the Carbondale Unified School District, which includes one elementary school, one middle school, and one high school.
Common Questions
What is Per Capita Income in Carbondale?
Per Capita income in Carbondale is $29,629.
What is the Median Family Income in Carbondale?
Median Family Income in Carbondale is $85,078.
What is the Median Household income in Carbondale?
Median Household Income in Carbondale is $65,764.
What is Income or Wage Gap in Carbondale?
Income or Wage Gap in Carbondale is 31.3%.
Women in Carbondale earn 68.7 cents for every dollar earned by a man.
What is Inequality or Gini Index in Carbondale?
Inequality or Gini Index in Carbondale is 0.39.
What is the Total Population of Carbondale?
Total Population of Carbondale is 1,396.
What is the Total Male Population of Carbondale?
Total Male Population of Carbondale is 647.
What is the Total Female Population of Carbondale?
Total Female Population of Carbondale is 749.
What is the Ratio of Males per 100 Females in Carbondale?
There are 86.38 Males per 100 Females in Carbondale.
What is the Ratio of Females per 100 Males in Carbondale?
There are 115.77 Females per 100 Males in Carbondale.
What is the Median Population Age in Carbondale?
Median Population Age in Carbondale is 35.9 Years.
What is the Average Family Size in Carbondale
Average Family Size in Carbondale is 3.1 People.
What is the Average Household Size in Carbondale
Average Household Size in Carbondale is 2.5 People.
How Large is the Labor Force in Carbondale?
There are 729 People in the Labor Forcein in Carbondale.
What is the Percentage of People in the Labor Force in Carbondale?
69.3% of People are in the Labor Force in Carbondale.
What is the Unemployment Rate in Carbondale?
Unemployment Rate in Carbondale is 1.7%.