Bushton, KS Map & Demographics
Bushton Map
Bushton Overview
$27,432
PER CAPITA INCOME
$65,938
AVG FAMILY INCOME
$24,943
AVG HOUSEHOLD INCOME
9.0%
WAGE / INCOME GAP [ % ]
91.0¢/ $1
WAGE / INCOME GAP [ $ ]
0.46
INEQUALITY / GINI INDEX
276
TOTAL POPULATION
109
MALE POPULATION
167
FEMALE POPULATION
65.27
MALES / 100 FEMALES
153.21
FEMALES / 100 MALES
60.0
MEDIAN AGE
2.8
AVG FAMILY SIZE
1.9
AVG HOUSEHOLD SIZE
92
LABOR FORCE [ PEOPLE ]
39.3%
PERCENT IN LABOR FORCE
1.1%
UNEMPLOYMENT RATE
Bushton Zip Codes
Bushton Area Codes
Income in Bushton
Income Overview in Bushton
Per Capita Income in Bushton is $27,432, while median incomes of families and households are $65,938 and $24,943 respectively.
| Characteristic | Number | Measure |
| Per Capita Income | 276 | $27,432 |
| Median Family Income | 71 | $65,938 |
| Mean Family Income | 71 | $78,011 |
| Median Household Income | 148 | $24,943 |
| Mean Household Income | 148 | $50,618 |
| Income Deficit | 71 | $0 |
| Wage / Income Gap (%) | 276 | 9.04% |
| Wage / Income Gap ($) | 276 | 90.96¢ per $1 |
| Gini / Inequality Index | 276 | 0.46 |
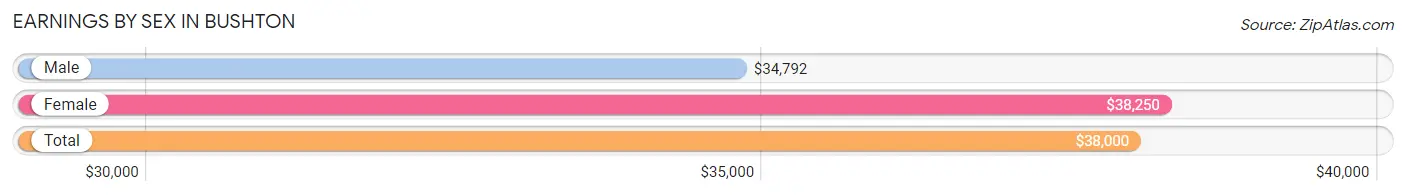
Earnings by Sex in Bushton
Average Earnings in Bushton are $38,000, $34,792 for men and $38,250 for women, a difference of 9.0%.
| Sex | Number | Average Earnings |
| Male | 47 (50.0%) | $34,792 |
| Female | 47 (50.0%) | $38,250 |
| Total | 94 (100.0%) | $38,000 |
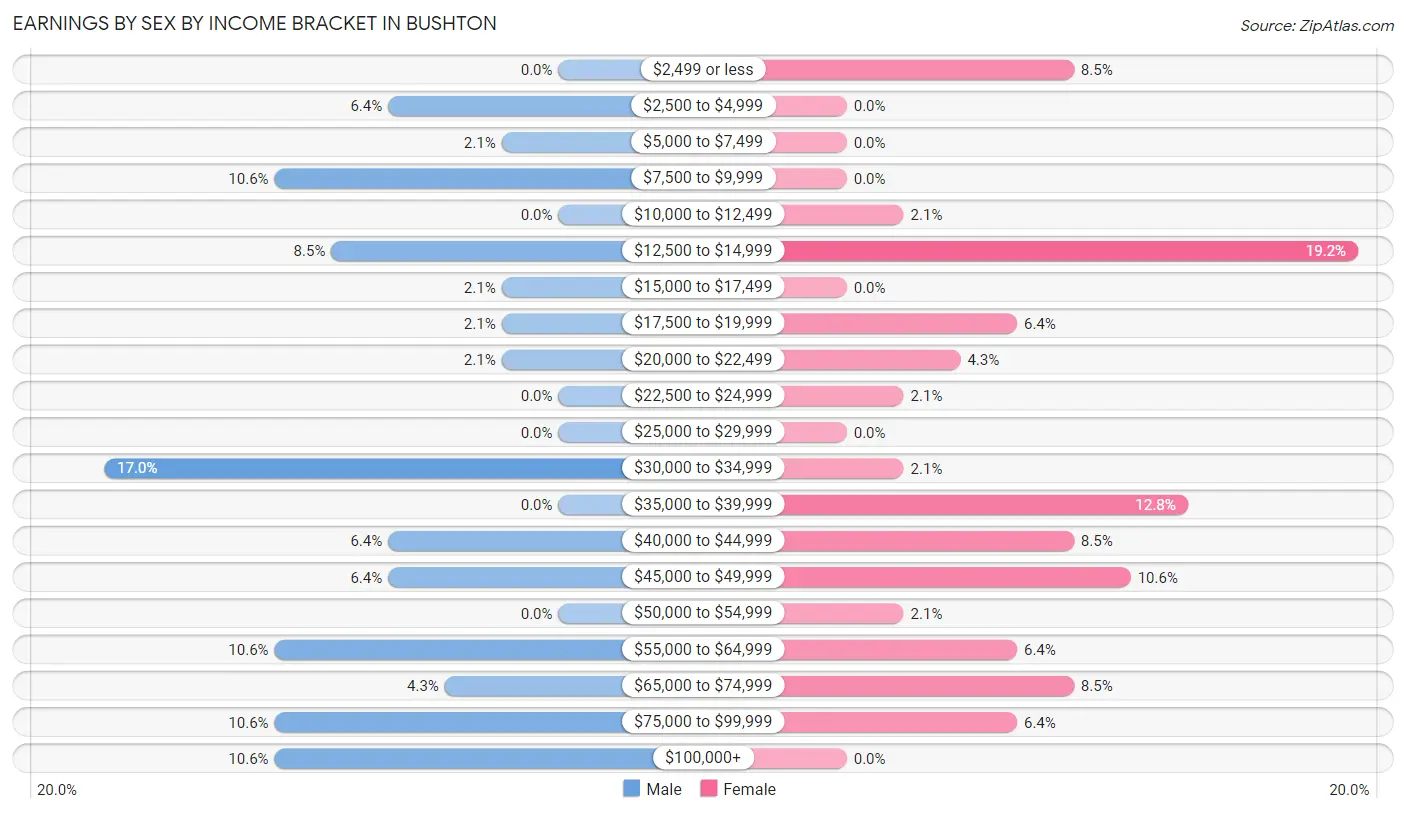
Earnings by Sex by Income Bracket in Bushton
The most common earnings brackets in Bushton are $30,000 to $34,999 for men (8 | 17.0%) and $12,500 to $14,999 for women (9 | 19.2%).
| Income | Male | Female |
| $2,499 or less | 0 (0.0%) | 4 (8.5%) |
| $2,500 to $4,999 | 3 (6.4%) | 0 (0.0%) |
| $5,000 to $7,499 | 1 (2.1%) | 0 (0.0%) |
| $7,500 to $9,999 | 5 (10.6%) | 0 (0.0%) |
| $10,000 to $12,499 | 0 (0.0%) | 1 (2.1%) |
| $12,500 to $14,999 | 4 (8.5%) | 9 (19.2%) |
| $15,000 to $17,499 | 1 (2.1%) | 0 (0.0%) |
| $17,500 to $19,999 | 1 (2.1%) | 3 (6.4%) |
| $20,000 to $22,499 | 1 (2.1%) | 2 (4.3%) |
| $22,500 to $24,999 | 0 (0.0%) | 1 (2.1%) |
| $25,000 to $29,999 | 0 (0.0%) | 0 (0.0%) |
| $30,000 to $34,999 | 8 (17.0%) | 1 (2.1%) |
| $35,000 to $39,999 | 0 (0.0%) | 6 (12.8%) |
| $40,000 to $44,999 | 3 (6.4%) | 4 (8.5%) |
| $45,000 to $49,999 | 3 (6.4%) | 5 (10.6%) |
| $50,000 to $54,999 | 0 (0.0%) | 1 (2.1%) |
| $55,000 to $64,999 | 5 (10.6%) | 3 (6.4%) |
| $65,000 to $74,999 | 2 (4.3%) | 4 (8.5%) |
| $75,000 to $99,999 | 5 (10.6%) | 3 (6.4%) |
| $100,000+ | 5 (10.6%) | 0 (0.0%) |
| Total | 47 (100.0%) | 47 (100.0%) |
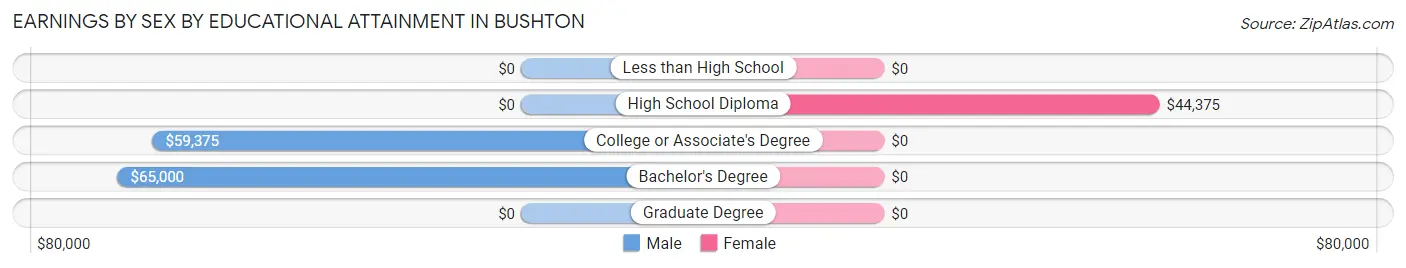
Earnings by Sex by Educational Attainment in Bushton
Average earnings in Bushton are $44,167 for men and $43,125 for women, a difference of 2.4%. Men with an educational attainment of bachelor's degree enjoy the highest average annual earnings of $65,000, while those with college or associate's degree education earn the least with $59,375. Women with an educational attainment of high school diploma earn the most with the average annual earnings of $44,375, while those with high school diploma education have the smallest earnings of $44,375.
| Educational Attainment | Male Income | Female Income |
| Less than High School | - | - |
| High School Diploma | - | - |
| College or Associate's Degree | $59,375 | $0 |
| Bachelor's Degree | $65,000 | $0 |
| Graduate Degree | - | - |
| Total | $44,167 | $43,125 |
Family Income in Bushton
Family Income Brackets in Bushton
According to the Bushton family income data, there are 21 families falling into the $50,000 to $74,999 income range, which is the most common income bracket and makes up 29.6% of all families.
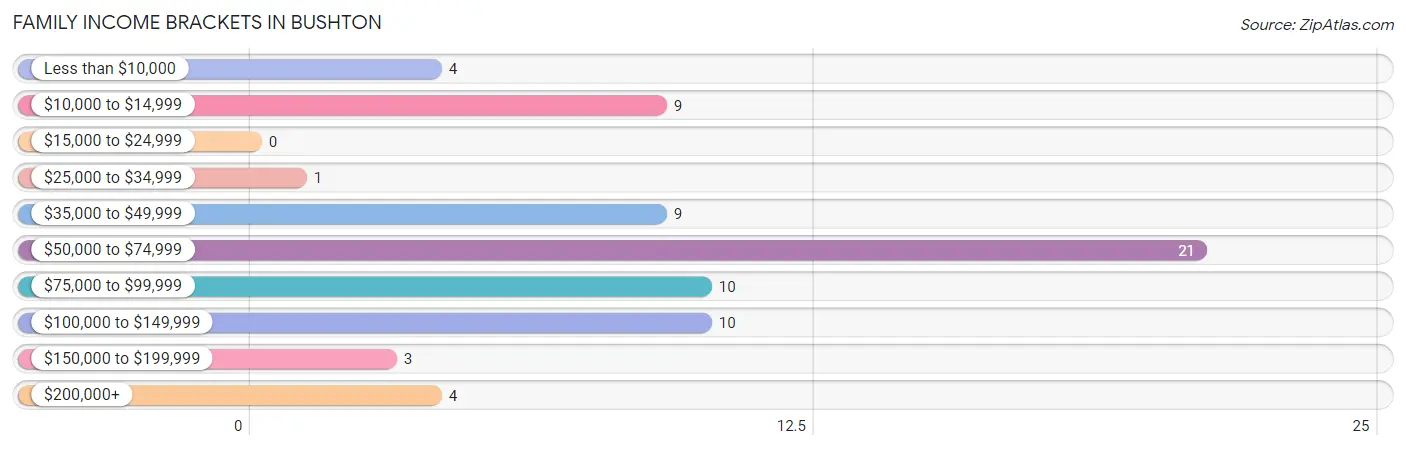
| Income Bracket | # Families | % Families |
| Less than $10,000 | 4 | 5.6% |
| $10,000 to $14,999 | 9 | 12.7% |
| $15,000 to $24,999 | 0 | 0.0% |
| $25,000 to $34,999 | 1 | 1.4% |
| $35,000 to $49,999 | 9 | 12.7% |
| $50,000 to $74,999 | 21 | 29.6% |
| $75,000 to $99,999 | 10 | 14.1% |
| $100,000 to $149,999 | 10 | 14.1% |
| $150,000 to $199,999 | 3 | 4.2% |
| $200,000+ | 4 | 5.6% |
Family Income by Famaliy Size in Bushton
4-person families (10 | 14.1%) account for the highest median family income in Bushton with $170,833 per family, while 4-person families (10 | 14.1%) have the highest median income of $42,708 per family member.
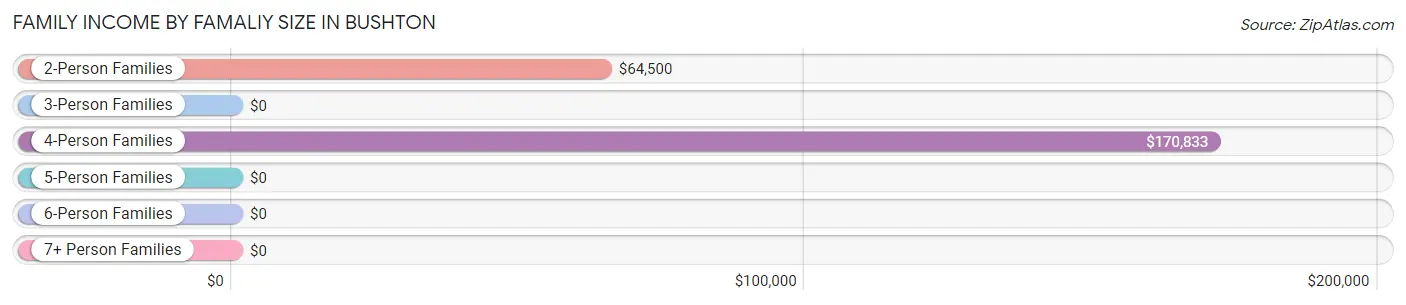
| Income Bracket | # Families | Median Income |
| 2-Person Families | 32 (45.1%) | $64,500 |
| 3-Person Families | 25 (35.2%) | $0 |
| 4-Person Families | 10 (14.1%) | $170,833 |
| 5-Person Families | 3 (4.2%) | $0 |
| 6-Person Families | 1 (1.4%) | $0 |
| 7+ Person Families | 0 (0.0%) | $0 |
| Total | 71 (100.0%) | $65,938 |
Family Income by Number of Earners in Bushton
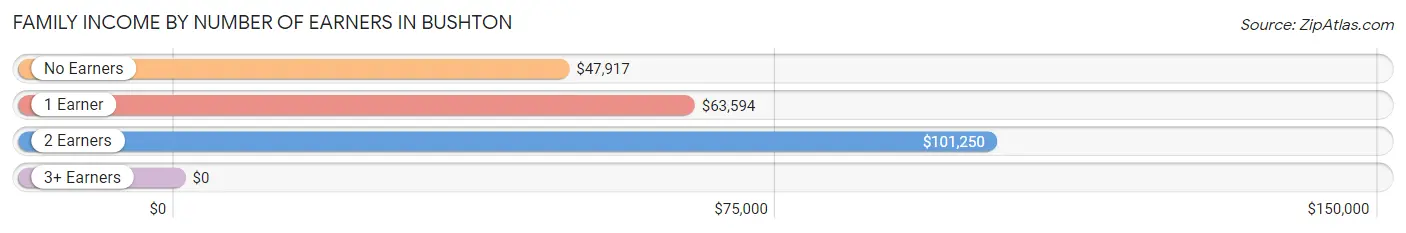
| Number of Earners | # Families | Median Income |
| No Earners | 11 (15.5%) | $47,917 |
| 1 Earner | 33 (46.5%) | $63,594 |
| 2 Earners | 27 (38.0%) | $101,250 |
| 3+ Earners | 0 (0.0%) | $0 |
| Total | 71 (100.0%) | $65,938 |
Household Income in Bushton
Household Income Brackets in Bushton
With 47 households falling in the category, the $15,000 to $24,999 income range is the most frequent in Bushton, accounting for 31.8% of all households. In contrast, only 3 households (2.0%) fall into the $150,000 to $199,999 income bracket, making it the least populous group.
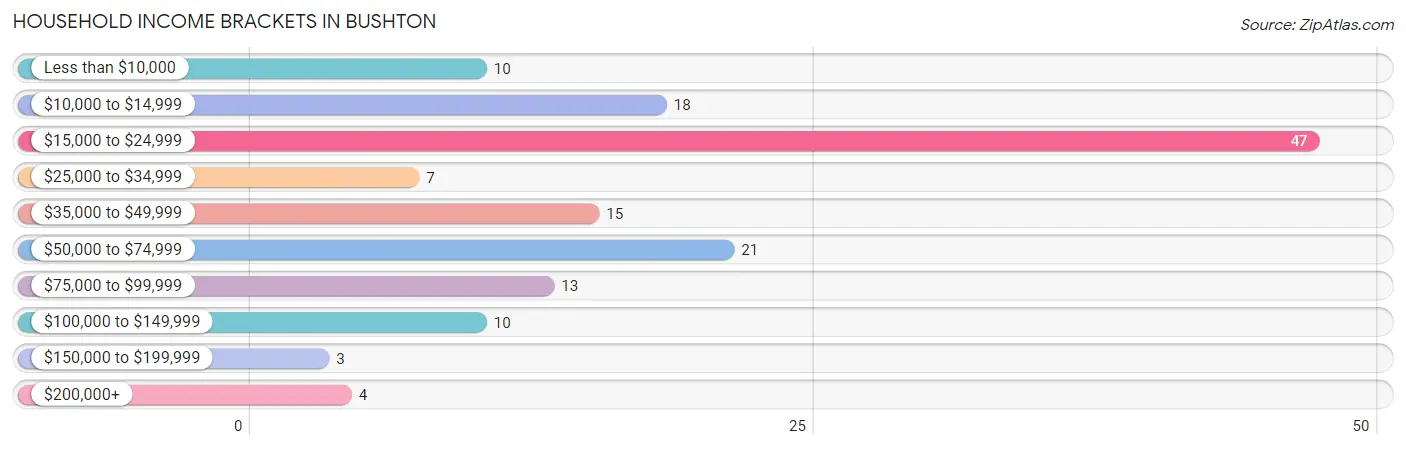
| Income Bracket | # Households | % Households |
| Less than $10,000 | 10 | 6.8% |
| $10,000 to $14,999 | 18 | 12.2% |
| $15,000 to $24,999 | 47 | 31.8% |
| $25,000 to $34,999 | 7 | 4.7% |
| $35,000 to $49,999 | 15 | 10.1% |
| $50,000 to $74,999 | 21 | 14.2% |
| $75,000 to $99,999 | 13 | 8.8% |
| $100,000 to $149,999 | 10 | 6.8% |
| $150,000 to $199,999 | 3 | 2.0% |
| $200,000+ | 4 | 2.7% |
Household Income by Householder Age in Bushton
The median household income in Bushton is $24,943, with the highest median household income of $86,563 found in the 45 to 64 years age bracket for the primary householder. A total of 31 households (20.9%) fall into this category. Meanwhile, the 15 to 24 years age bracket for the primary householder has the lowest median household income of $0, with 14 households (9.5%) in this group.
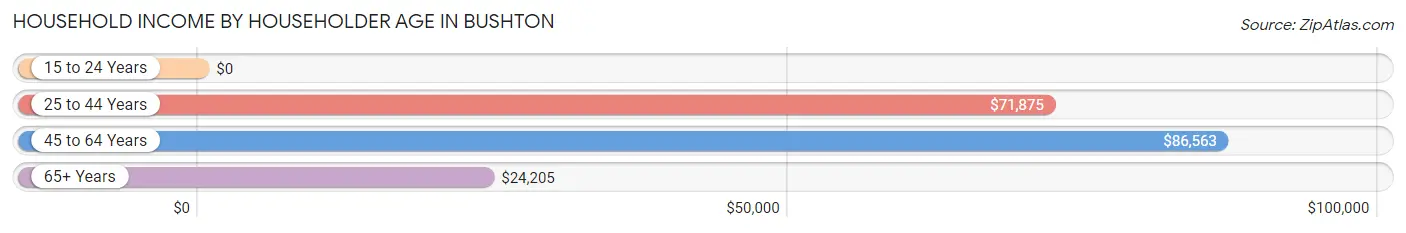
| Income Bracket | # Households | Median Income |
| 15 to 24 Years | 14 (9.5%) | $0 |
| 25 to 44 Years | 15 (10.1%) | $71,875 |
| 45 to 64 Years | 31 (20.9%) | $86,563 |
| 65+ Years | 88 (59.5%) | $24,205 |
| Total | 148 (100.0%) | $24,943 |
Poverty in Bushton
Income Below Poverty by Sex and Age in Bushton
With 16.5% poverty level for males and 18.6% for females among the residents of Bushton, 45 to 54 year old males and 18 to 24 year old females are the most vulnerable to poverty, with 5 males (71.4%) and 9 females (64.3%) in their respective age groups living below the poverty level.
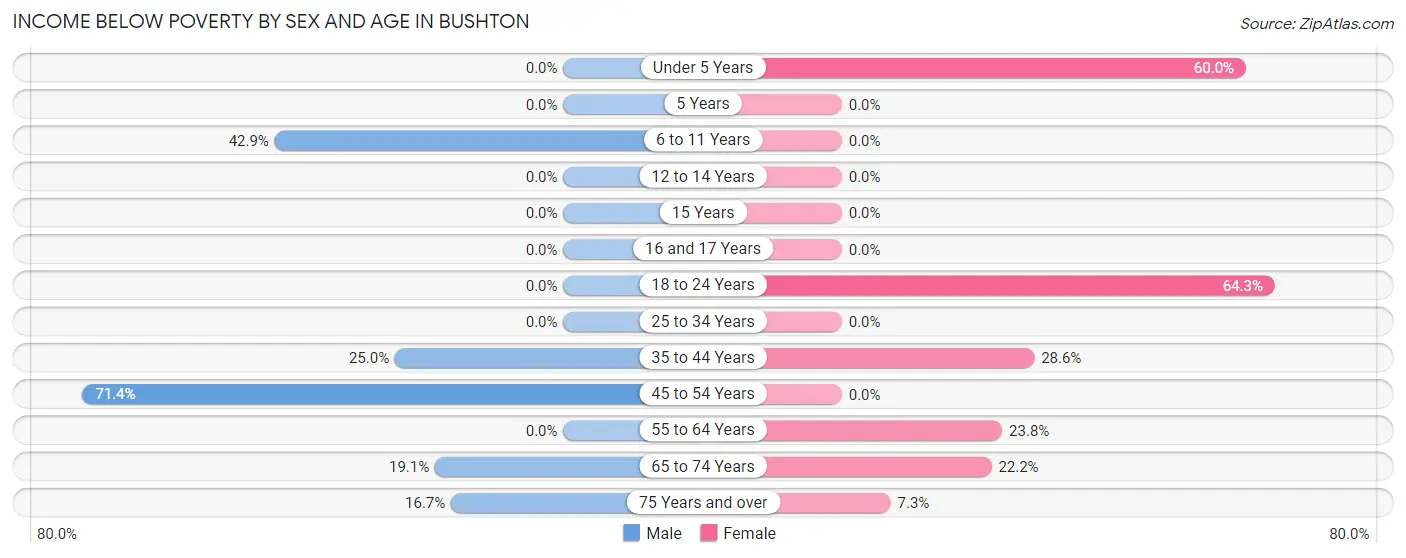
| Age Bracket | Male | Female |
| Under 5 Years | 0 (0.0%) | 6 (60.0%) |
| 5 Years | 0 (0.0%) | 0 (0.0%) |
| 6 to 11 Years | 6 (42.9%) | 0 (0.0%) |
| 12 to 14 Years | 0 (0.0%) | 0 (0.0%) |
| 15 Years | 0 (0.0%) | 0 (0.0%) |
| 16 and 17 Years | 0 (0.0%) | 0 (0.0%) |
| 18 to 24 Years | 0 (0.0%) | 9 (64.3%) |
| 25 to 34 Years | 0 (0.0%) | 0 (0.0%) |
| 35 to 44 Years | 2 (25.0%) | 2 (28.6%) |
| 45 to 54 Years | 5 (71.4%) | 0 (0.0%) |
| 55 to 64 Years | 0 (0.0%) | 5 (23.8%) |
| 65 to 74 Years | 4 (19.1%) | 4 (22.2%) |
| 75 Years and over | 1 (16.7%) | 5 (7.2%) |
| Total | 18 (16.5%) | 31 (18.6%) |
Income Above Poverty by Sex and Age in Bushton
According to the poverty statistics in Bushton, males aged under 5 years and females aged 5 years are the age groups that are most secure financially, with 100.0% of males and 100.0% of females in these age groups living above the poverty line.
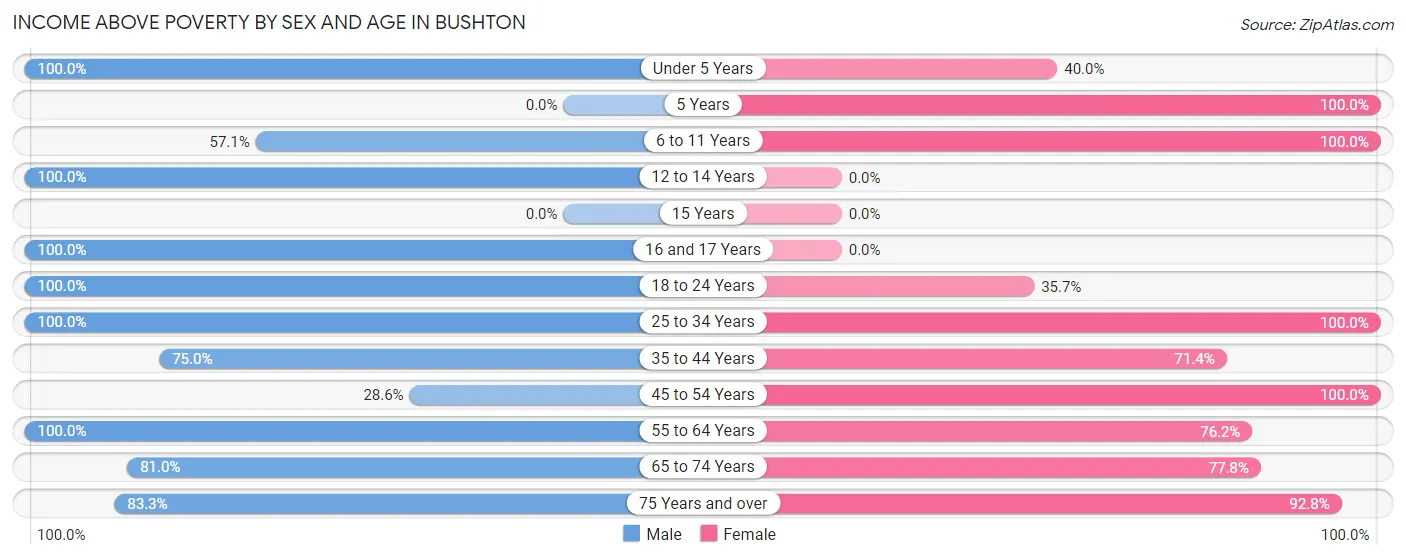
| Age Bracket | Male | Female |
| Under 5 Years | 6 (100.0%) | 4 (40.0%) |
| 5 Years | 0 (0.0%) | 1 (100.0%) |
| 6 to 11 Years | 8 (57.1%) | 9 (100.0%) |
| 12 to 14 Years | 2 (100.0%) | 0 (0.0%) |
| 15 Years | 0 (0.0%) | 0 (0.0%) |
| 16 and 17 Years | 9 (100.0%) | 0 (0.0%) |
| 18 to 24 Years | 5 (100.0%) | 5 (35.7%) |
| 25 to 34 Years | 9 (100.0%) | 6 (100.0%) |
| 35 to 44 Years | 6 (75.0%) | 5 (71.4%) |
| 45 to 54 Years | 2 (28.6%) | 12 (100.0%) |
| 55 to 64 Years | 22 (100.0%) | 16 (76.2%) |
| 65 to 74 Years | 17 (80.9%) | 14 (77.8%) |
| 75 Years and over | 5 (83.3%) | 64 (92.7%) |
| Total | 91 (83.5%) | 136 (81.4%) |
Income Below Poverty Among Married-Couple Families in Bushton
The poverty statistics for married-couple families in Bushton show that 3.8% or 2 of the total 53 families live below the poverty line. Families with no children have the highest poverty rate of 5.0%, comprising of 2 families. On the other hand, families with 1 or 2 children have the lowest poverty rate of 0.0%, which includes 0 families.
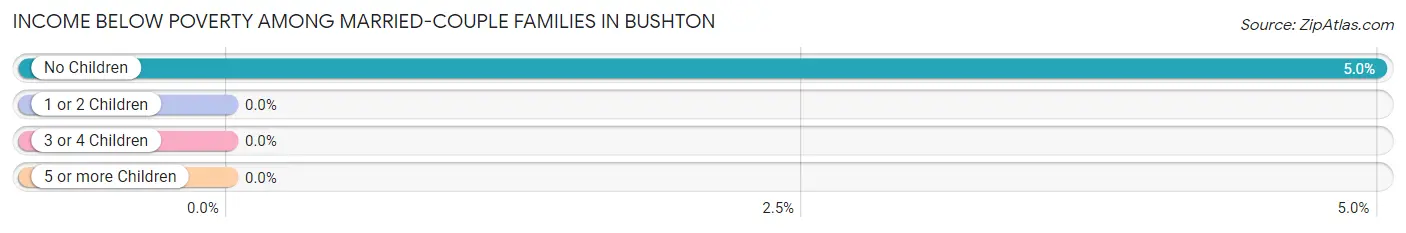
| Children | Above Poverty | Below Poverty |
| No Children | 38 (95.0%) | 2 (5.0%) |
| 1 or 2 Children | 12 (100.0%) | 0 (0.0%) |
| 3 or 4 Children | 1 (100.0%) | 0 (0.0%) |
| 5 or more Children | 0 (0.0%) | 0 (0.0%) |
| Total | 51 (96.2%) | 2 (3.8%) |
Income Below Poverty Among Single-Parent Households in Bushton
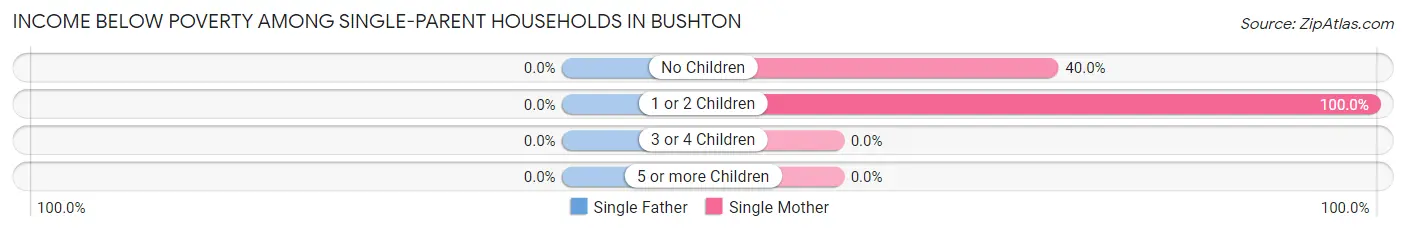
| Children | Single Father | Single Mother |
| No Children | 0 (0.0%) | 2 (40.0%) |
| 1 or 2 Children | 0 (0.0%) | 9 (100.0%) |
| 3 or 4 Children | 0 (0.0%) | 0 (0.0%) |
| 5 or more Children | 0 (0.0%) | 0 (0.0%) |
| Total | 0 (0.0%) | 11 (78.6%) |
Income Below Poverty Among Married-Couple vs Single-Parent Households in Bushton
The poverty data for Bushton shows that 2 of the married-couple family households (3.8%) and 11 of the single-parent households (61.1%) are living below the poverty level. Within the married-couple family households, those with no children have the highest poverty rate, with 2 households (5.0%) falling below the poverty line. Among the single-parent households, those with 1 or 2 children have the highest poverty rate, with 9 household (69.2%) living below poverty.
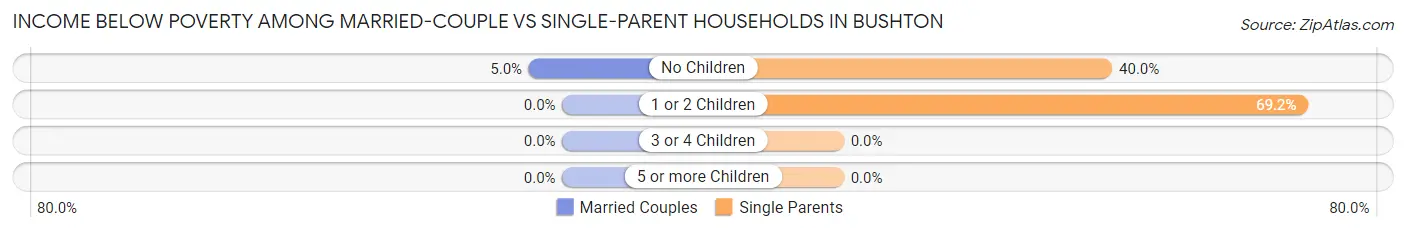
| Children | Married-Couple Families | Single-Parent Households |
| No Children | 2 (5.0%) | 2 (40.0%) |
| 1 or 2 Children | 0 (0.0%) | 9 (69.2%) |
| 3 or 4 Children | 0 (0.0%) | 0 (0.0%) |
| 5 or more Children | 0 (0.0%) | 0 (0.0%) |
| Total | 2 (3.8%) | 11 (61.1%) |
Race in Bushton
The most populous races in Bushton are White / Caucasian (240 | 87.0%), Hispanic or Latino (36 | 13.0%), and Two or more Races (23 | 8.3%).
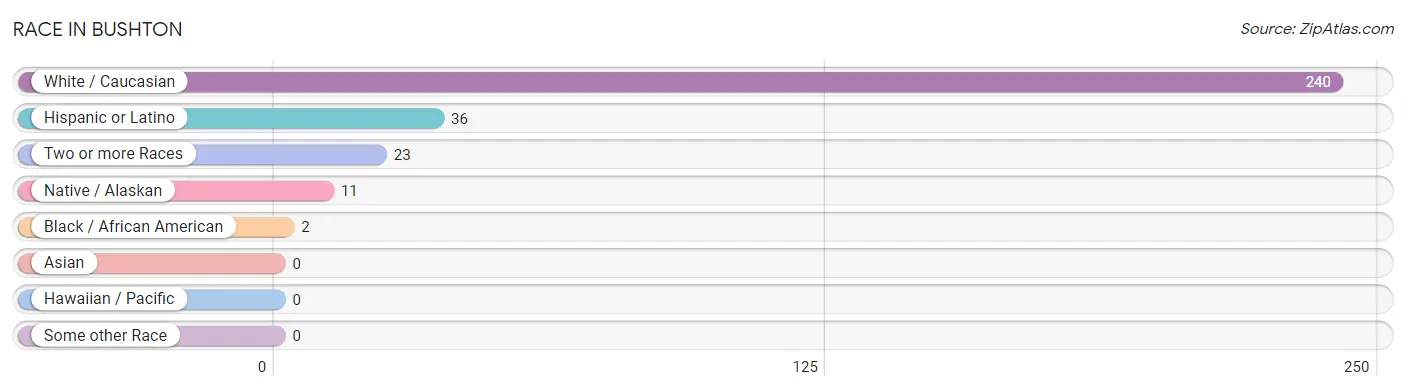
| Race | # Population | % Population |
| Asian | 0 | 0.0% |
| Black / African American | 2 | 0.7% |
| Hawaiian / Pacific | 0 | 0.0% |
| Hispanic or Latino | 36 | 13.0% |
| Native / Alaskan | 11 | 4.0% |
| White / Caucasian | 240 | 87.0% |
| Two or more Races | 23 | 8.3% |
| Some other Race | 0 | 0.0% |
| Total | 276 | 100.0% |
Ancestry in Bushton
The most populous ancestries reported in Bushton are German (85 | 30.8%), Irish (68 | 24.6%), English (51 | 18.5%), Mexican (24 | 8.7%), and American (15 | 5.4%), together accounting for 88.0% of all Bushton residents.
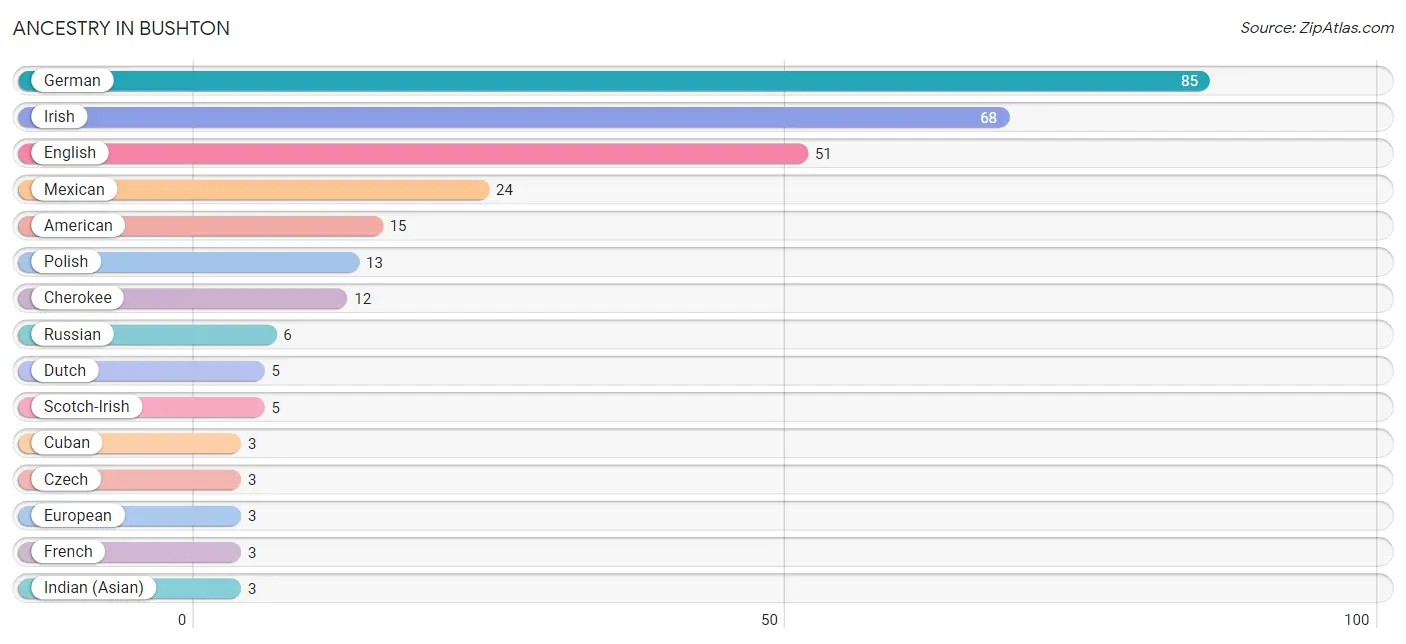
| Ancestry | # Population | % Population |
| American | 15 | 5.4% |
| Cherokee | 12 | 4.3% |
| Cuban | 3 | 1.1% |
| Czech | 3 | 1.1% |
| Dutch | 5 | 1.8% |
| English | 51 | 18.5% |
| European | 3 | 1.1% |
| French | 3 | 1.1% |
| German | 85 | 30.8% |
| Indian (Asian) | 3 | 1.1% |
| Irish | 68 | 24.6% |
| Italian | 1 | 0.4% |
| Mexican | 24 | 8.7% |
| Native Hawaiian | 3 | 1.1% |
| Polish | 13 | 4.7% |
| Russian | 6 | 2.2% |
| Scotch-Irish | 5 | 1.8% |
| Scottish | 2 | 0.7% |
| Swedish | 1 | 0.4% | View All 19 Rows |
Immigrants in Bushton
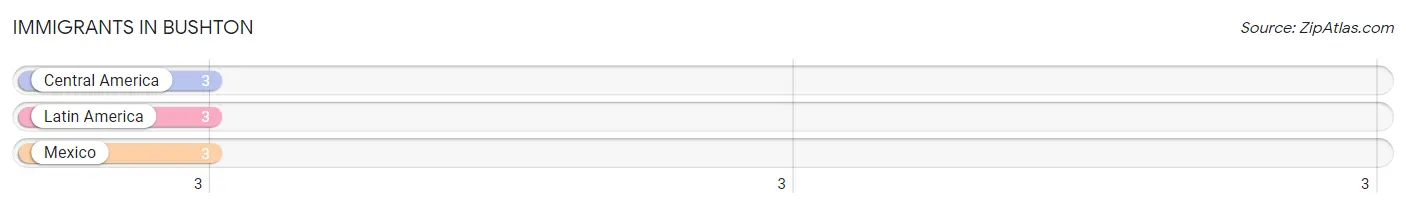
The most numerous immigrant groups reported in Bushton came from Central America (3 | 1.1%), Latin America (3 | 1.1%), and Mexico (3 | 1.1%), together accounting for 3.3% of all Bushton residents.
| Immigration Origin | # Population | % Population |
| Central America | 3 | 1.1% |
| Latin America | 3 | 1.1% |
| Mexico | 3 | 1.1% | View All 3 Rows |
Sex and Age in Bushton
Sex and Age in Bushton
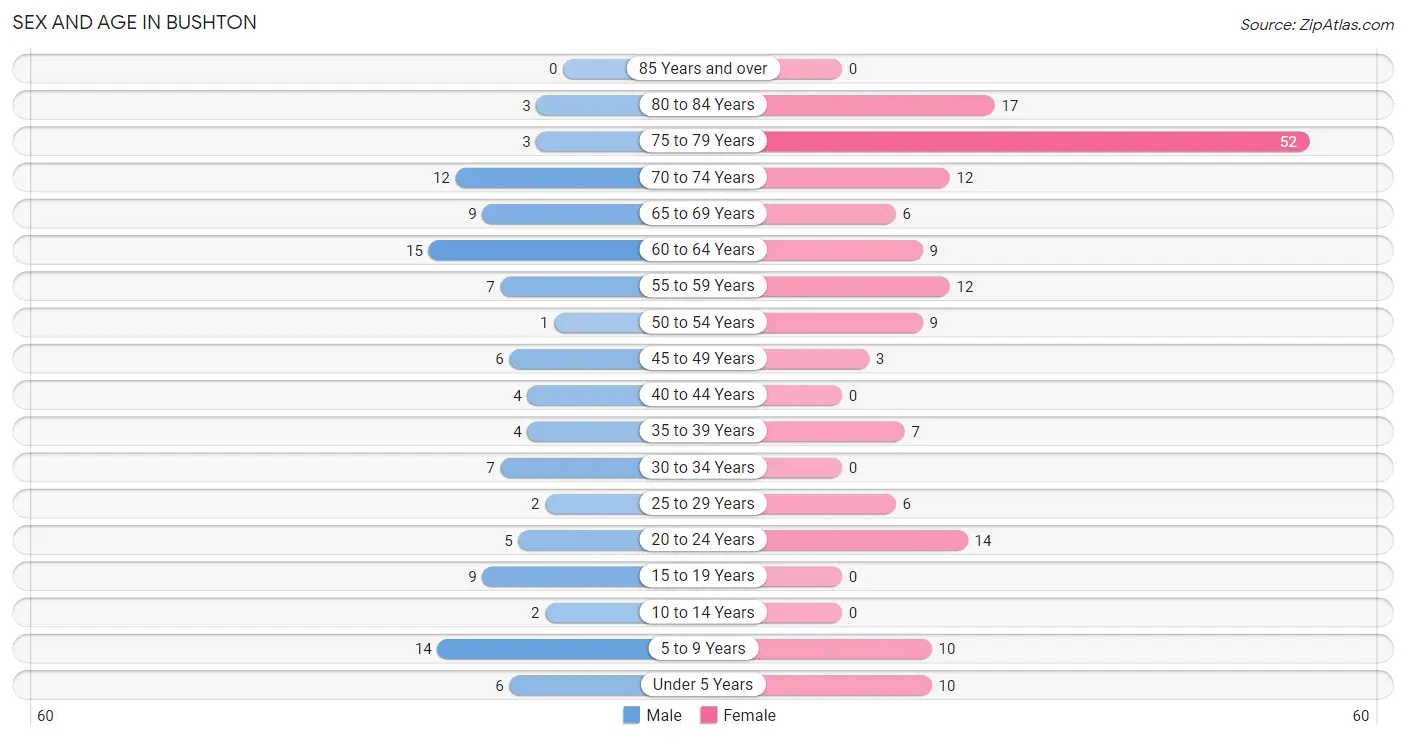
The most populous age groups in Bushton are 60 to 64 Years (15 | 13.8%) for men and 75 to 79 Years (52 | 31.1%) for women.
| Age Bracket | Male | Female |
| Under 5 Years | 6 (5.5%) | 10 (6.0%) |
| 5 to 9 Years | 14 (12.8%) | 10 (6.0%) |
| 10 to 14 Years | 2 (1.8%) | 0 (0.0%) |
| 15 to 19 Years | 9 (8.3%) | 0 (0.0%) |
| 20 to 24 Years | 5 (4.6%) | 14 (8.4%) |
| 25 to 29 Years | 2 (1.8%) | 6 (3.6%) |
| 30 to 34 Years | 7 (6.4%) | 0 (0.0%) |
| 35 to 39 Years | 4 (3.7%) | 7 (4.2%) |
| 40 to 44 Years | 4 (3.7%) | 0 (0.0%) |
| 45 to 49 Years | 6 (5.5%) | 3 (1.8%) |
| 50 to 54 Years | 1 (0.9%) | 9 (5.4%) |
| 55 to 59 Years | 7 (6.4%) | 12 (7.2%) |
| 60 to 64 Years | 15 (13.8%) | 9 (5.4%) |
| 65 to 69 Years | 9 (8.3%) | 6 (3.6%) |
| 70 to 74 Years | 12 (11.0%) | 12 (7.2%) |
| 75 to 79 Years | 3 (2.8%) | 52 (31.1%) |
| 80 to 84 Years | 3 (2.8%) | 17 (10.2%) |
| 85 Years and over | 0 (0.0%) | 0 (0.0%) |
| Total | 109 (100.0%) | 167 (100.0%) |
Families and Households in Bushton
Median Family Size in Bushton
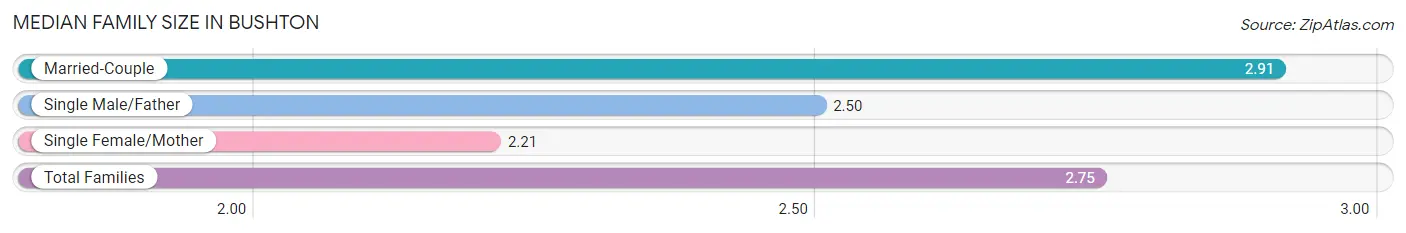
The median family size in Bushton is 2.75 persons per family, with married-couple families (53 | 74.7%) accounting for the largest median family size of 2.91 persons per family. On the other hand, single female/mother families (14 | 19.7%) represent the smallest median family size with 2.21 persons per family.
| Family Type | # Families | Family Size |
| Married-Couple | 53 (74.7%) | 2.91 |
| Single Male/Father | 4 (5.6%) | 2.50 |
| Single Female/Mother | 14 (19.7%) | 2.21 |
| Total Families | 71 (100.0%) | 2.75 |
Median Household Size in Bushton
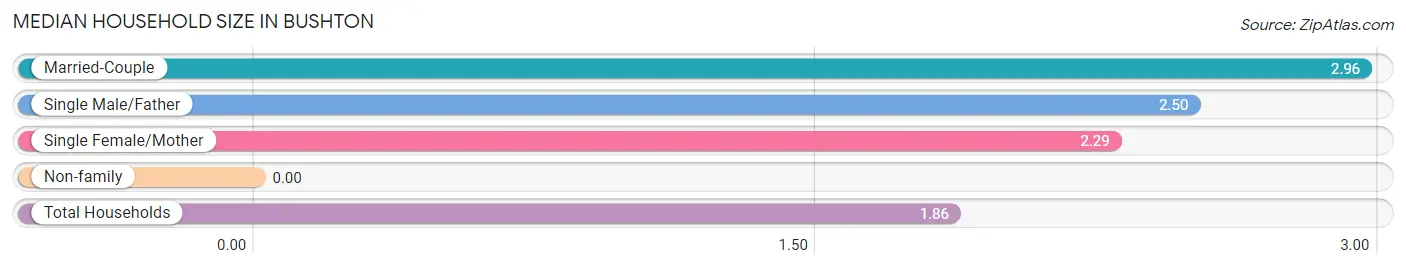
| Household Type | # Households | Household Size |
| Married-Couple | 53 (35.8%) | 2.96 |
| Single Male/Father | 4 (2.7%) | 2.50 |
| Single Female/Mother | 14 (9.5%) | 2.29 |
| Non-family | 77 (52.0%) | - |
| Total Households | 148 (100.0%) | 1.86 |
Household Size by Marriage Status in Bushton
Out of a total of 148 households in Bushton, 71 (48.0%) are family households, while 77 (52.0%) are nonfamily households. The most numerous type of family households are 2-person households, comprising 32, and the most common type of nonfamily households are 1-person households, comprising 77.
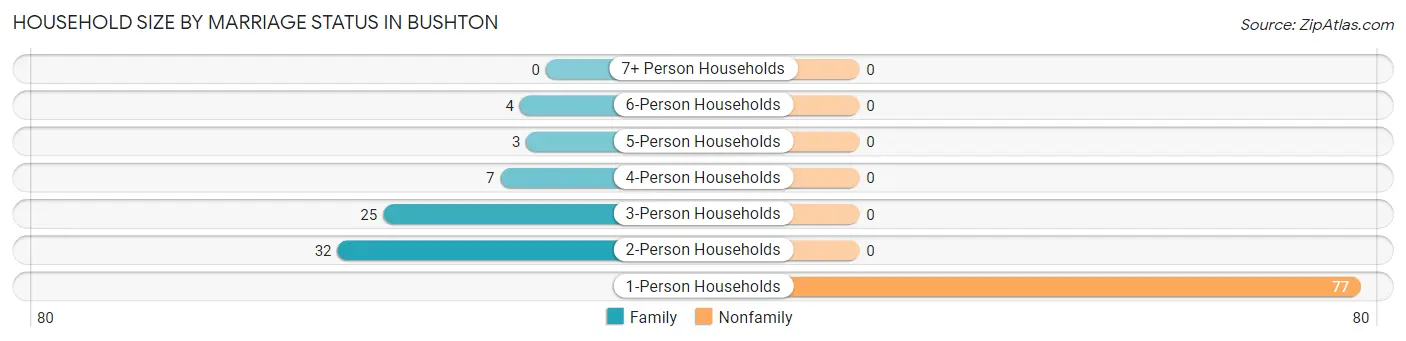
| Household Size | Family Households | Nonfamily Households |
| 1-Person Households | - | 77 (52.0%) |
| 2-Person Households | 32 (21.6%) | 0 (0.0%) |
| 3-Person Households | 25 (16.9%) | 0 (0.0%) |
| 4-Person Households | 7 (4.7%) | 0 (0.0%) |
| 5-Person Households | 3 (2.0%) | 0 (0.0%) |
| 6-Person Households | 4 (2.7%) | 0 (0.0%) |
| 7+ Person Households | 0 (0.0%) | 0 (0.0%) |
| Total | 71 (48.0%) | 77 (52.0%) |
Female Fertility in Bushton
Fertility by Age in Bushton
Average fertility rate in Bushton is 33.0 births per 1,000 women. Women in the age bracket of 20 to 34 years have the highest fertility rate with 50.0 births per 1,000 women. Women in the age bracket of 20 to 34 years acount for 100.0% of all women with births.
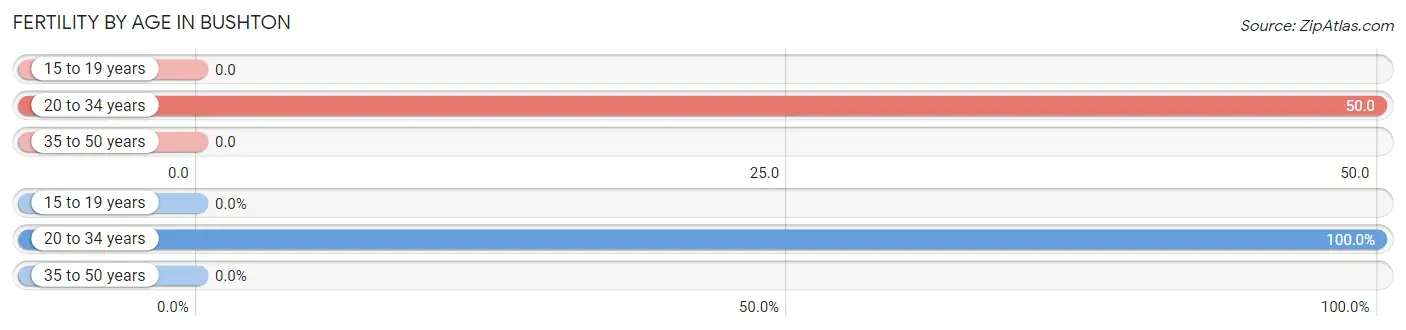
| Age Bracket | Women with Births | Births / 1,000 Women |
| 15 to 19 years | 0 (0.0%) | 0.0 |
| 20 to 34 years | 1 (100.0%) | 50.0 |
| 35 to 50 years | 0 (0.0%) | 0.0 |
| Total | 1 (100.0%) | 33.0 |
Fertility by Age by Marriage Status in Bushton
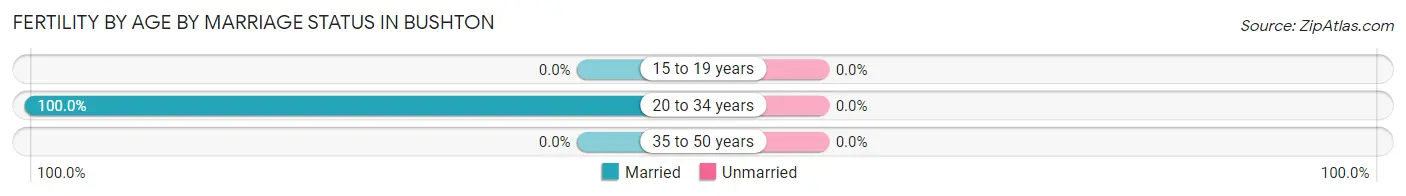
| Age Bracket | Married | Unmarried |
| 15 to 19 years | 0 (0.0%) | 0 (0.0%) |
| 20 to 34 years | 1 (100.0%) | 0 (0.0%) |
| 35 to 50 years | 0 (0.0%) | 0 (0.0%) |
| Total | 1 (100.0%) | 0 (0.0%) |
Fertility by Education in Bushton
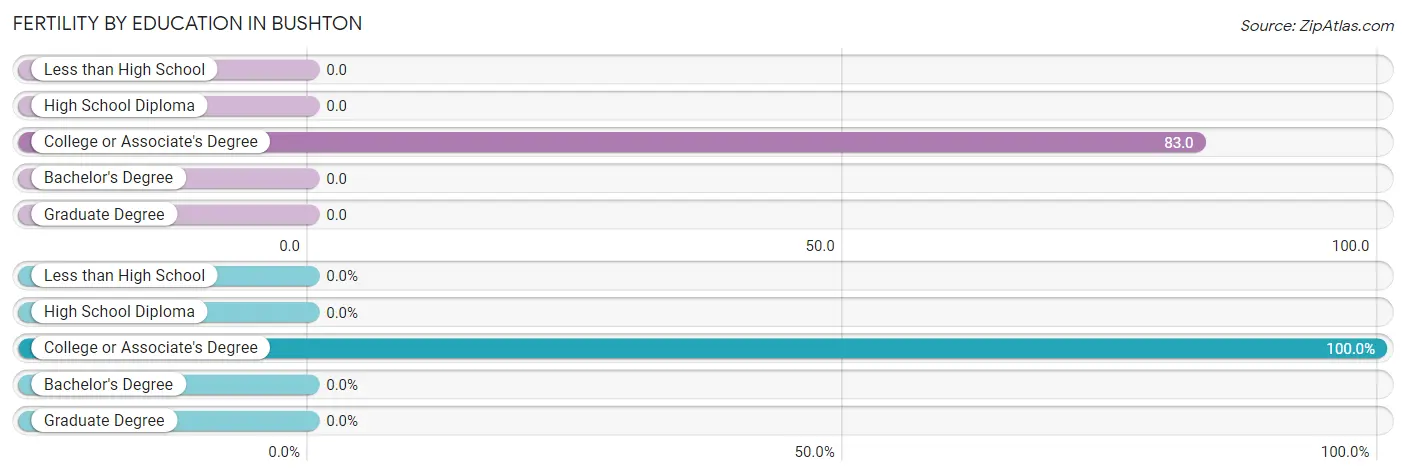
| Educational Attainment | Women with Births | Births / 1,000 Women |
| Less than High School | 0 (0.0%) | 0.0 |
| High School Diploma | 0 (0.0%) | 0.0 |
| College or Associate's Degree | 1 (100.0%) | 83.0 |
| Bachelor's Degree | 0 (0.0%) | 0.0 |
| Graduate Degree | 0 (0.0%) | 0.0 |
| Total | 1 (100.0%) | 33.0 |
Fertility by Education by Marriage Status in Bushton
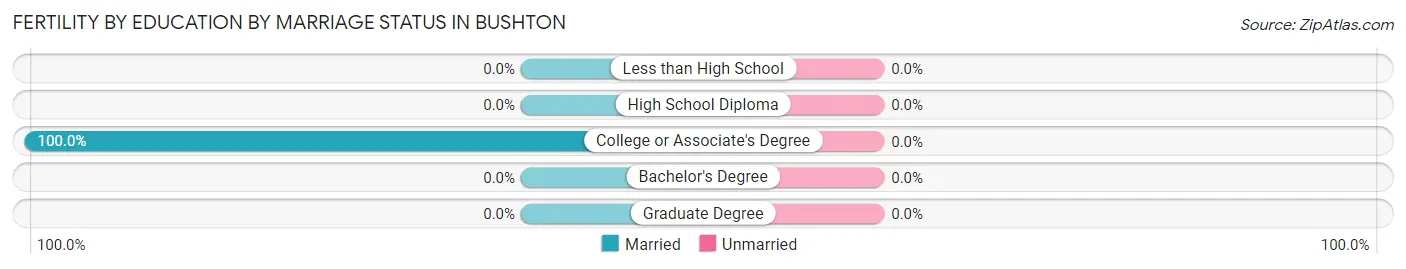
| Educational Attainment | Married | Unmarried |
| Less than High School | 0 (0.0%) | 0 (0.0%) |
| High School Diploma | 0 (0.0%) | 0 (0.0%) |
| College or Associate's Degree | 1 (100.0%) | 0 (0.0%) |
| Bachelor's Degree | 0 (0.0%) | 0 (0.0%) |
| Graduate Degree | 0 (0.0%) | 0 (0.0%) |
| Total | 1 (100.0%) | 0 (0.0%) |
Employment Characteristics in Bushton
Employment by Class of Employer in Bushton
Among the 91 employed individuals in Bushton, private company employees (51 | 56.0%), self-employed (not incorporated) (19 | 20.9%), and not-for-profit organizations (9 | 9.9%) make up the most common classes of employment.
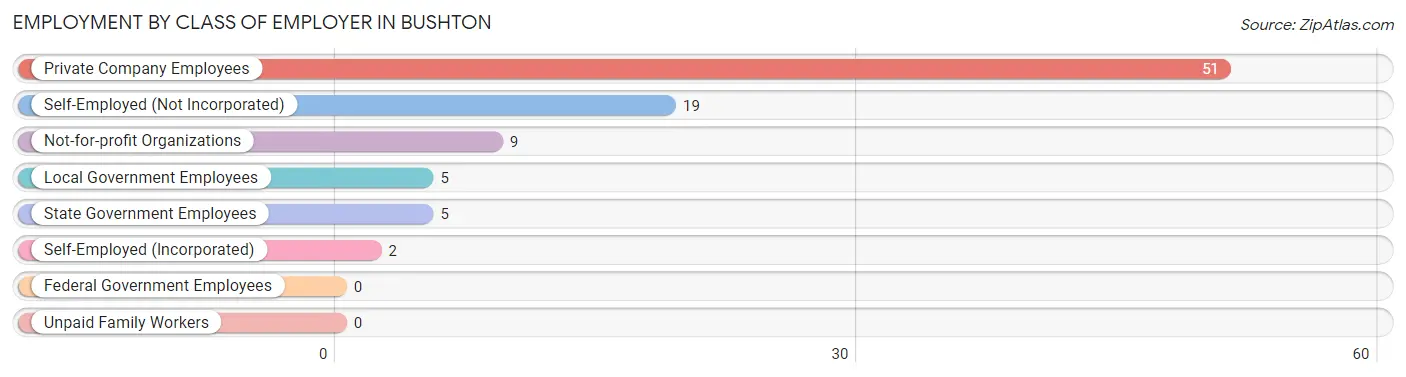
| Employer Class | # Employees | % Employees |
| Private Company Employees | 51 | 56.0% |
| Self-Employed (Incorporated) | 2 | 2.2% |
| Self-Employed (Not Incorporated) | 19 | 20.9% |
| Not-for-profit Organizations | 9 | 9.9% |
| Local Government Employees | 5 | 5.5% |
| State Government Employees | 5 | 5.5% |
| Federal Government Employees | 0 | 0.0% |
| Unpaid Family Workers | 0 | 0.0% |
| Total | 91 | 100.0% |
Employment Status by Age in Bushton
According to the labor force statistics for Bushton, out of the total population over 16 years of age (234), 39.3% or 92 individuals are in the labor force, with 1.1% or 1 of them unemployed. The age group with the highest labor force participation rate is 30 to 34 years, with 100.0% or 7 individuals in the labor force. Within the labor force, the 45 to 54 years age range has the highest percentage of unemployed individuals, with 5.3% or 1 of them being unemployed.
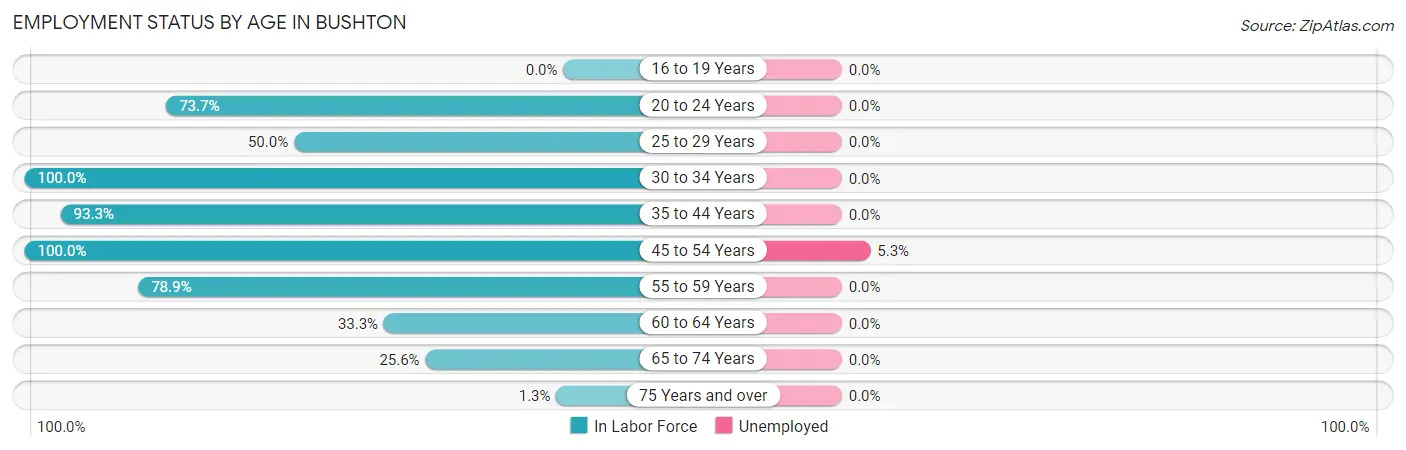
| Age Bracket | In Labor Force | Unemployed |
| 16 to 19 Years | 0 (0.0%) | 0 (0.0%) |
| 20 to 24 Years | 14 (73.7%) | 0 (0.0%) |
| 25 to 29 Years | 4 (50.0%) | 0 (0.0%) |
| 30 to 34 Years | 7 (100.0%) | 0 (0.0%) |
| 35 to 44 Years | 14 (93.3%) | 0 (0.0%) |
| 45 to 54 Years | 19 (100.0%) | 1 (5.3%) |
| 55 to 59 Years | 15 (78.9%) | 0 (0.0%) |
| 60 to 64 Years | 8 (33.3%) | 0 (0.0%) |
| 65 to 74 Years | 10 (25.6%) | 0 (0.0%) |
| 75 Years and over | 1 (1.3%) | 0 (0.0%) |
| Total | 92 (39.3%) | 1 (1.1%) |
Employment Status by Educational Attainment in Bushton
According to labor force statistics for Bushton, 72.8% of individuals (67) out of the total population between 25 and 64 years of age (92) are in the labor force, with 1.5% or 1 of them being unemployed. The group with the highest labor force participation rate are those with the educational attainment of less than high school, with 83.3% or 5 individuals in the labor force. Within the labor force, individuals with high school diploma education have the highest percentage of unemployment, with 4.3% or 1 of them being unemployed.
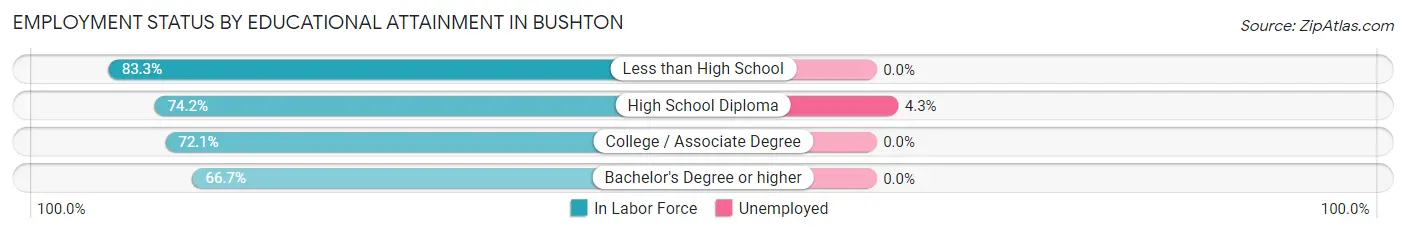
| Educational Attainment | In Labor Force | Unemployed |
| Less than High School | 5 (83.3%) | 0 (0.0%) |
| High School Diploma | 23 (74.2%) | 1 (4.3%) |
| College / Associate Degree | 31 (72.1%) | 0 (0.0%) |
| Bachelor's Degree or higher | 8 (66.7%) | 0 (0.0%) |
| Total | 67 (72.8%) | 1 (1.5%) |
Employment Occupations by Sex in Bushton
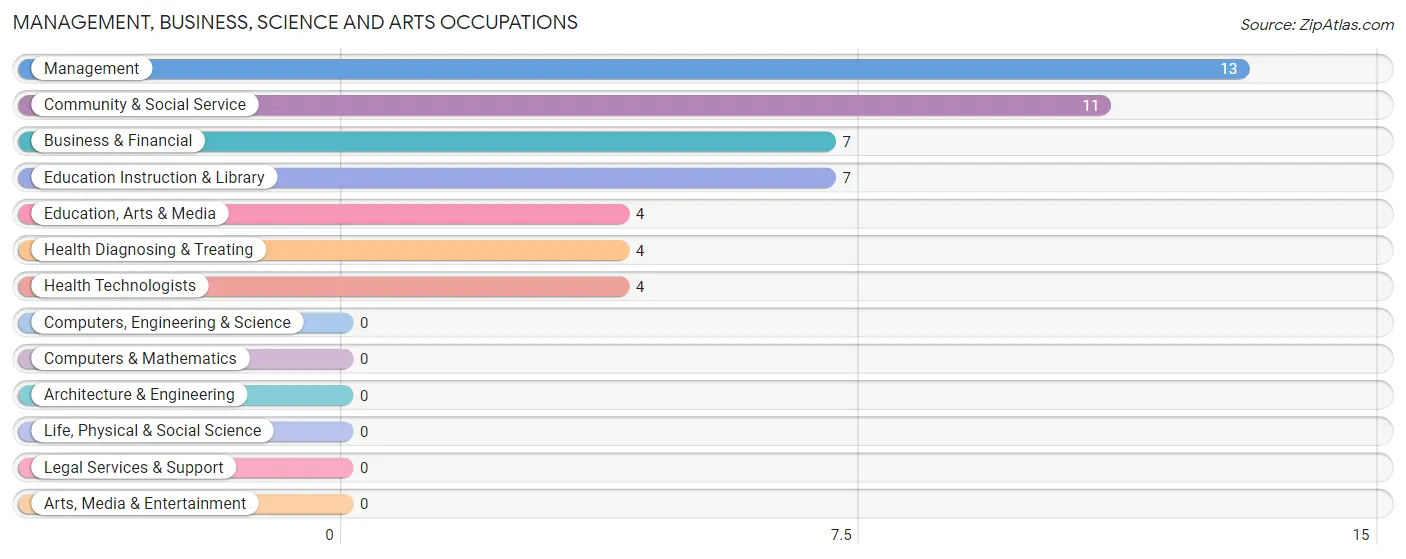
Management, Business, Science and Arts Occupations
The most common Management, Business, Science and Arts occupations in Bushton are Management (13 | 14.3%), Community & Social Service (11 | 12.1%), Business & Financial (7 | 7.7%), Education Instruction & Library (7 | 7.7%), and Education, Arts & Media (4 | 4.4%).
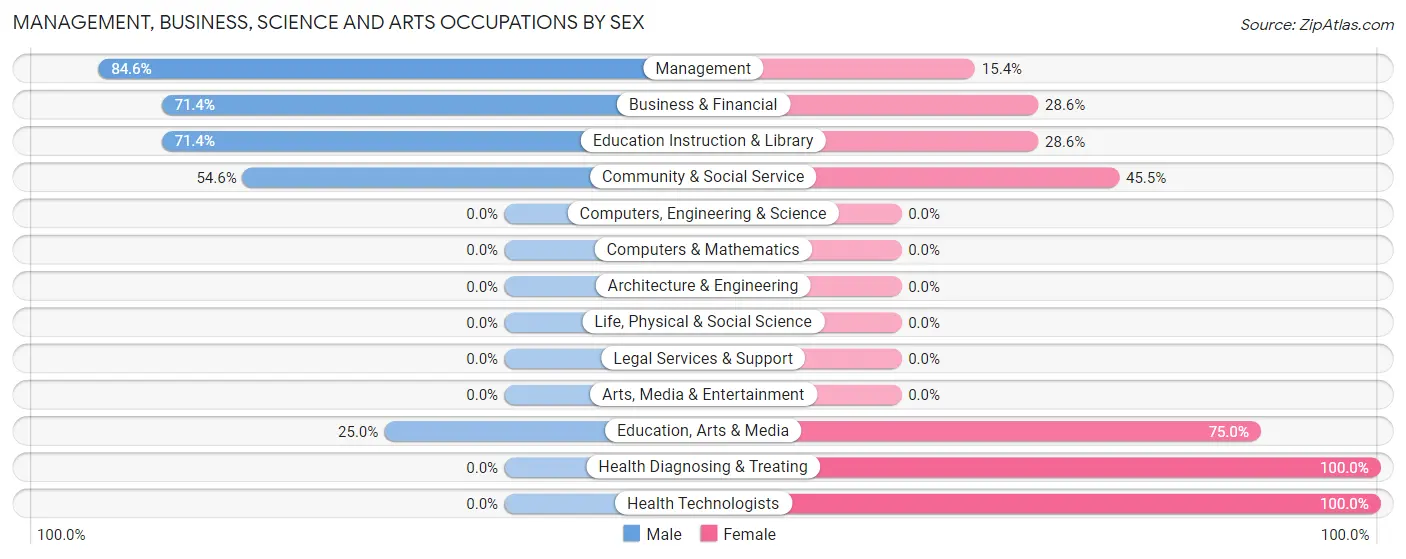
Management, Business, Science and Arts Occupations by Sex
Within the Management, Business, Science and Arts occupations in Bushton, the most male-oriented occupations are Management (84.6%), Business & Financial (71.4%), and Education Instruction & Library (71.4%), while the most female-oriented occupations are Health Diagnosing & Treating (100.0%), Health Technologists (100.0%), and Education, Arts & Media (75.0%).
| Occupation | Male | Female |
| Management | 11 (84.6%) | 2 (15.4%) |
| Business & Financial | 5 (71.4%) | 2 (28.6%) |
| Computers, Engineering & Science | 0 (0.0%) | 0 (0.0%) |
| Computers & Mathematics | 0 (0.0%) | 0 (0.0%) |
| Architecture & Engineering | 0 (0.0%) | 0 (0.0%) |
| Life, Physical & Social Science | 0 (0.0%) | 0 (0.0%) |
| Community & Social Service | 6 (54.5%) | 5 (45.5%) |
| Education, Arts & Media | 1 (25.0%) | 3 (75.0%) |
| Legal Services & Support | 0 (0.0%) | 0 (0.0%) |
| Education Instruction & Library | 5 (71.4%) | 2 (28.6%) |
| Arts, Media & Entertainment | 0 (0.0%) | 0 (0.0%) |
| Health Diagnosing & Treating | 0 (0.0%) | 4 (100.0%) |
| Health Technologists | 0 (0.0%) | 4 (100.0%) |
| Total (Category) | 22 (62.9%) | 13 (37.1%) |
| Total (Overall) | 47 (51.6%) | 44 (48.3%) |
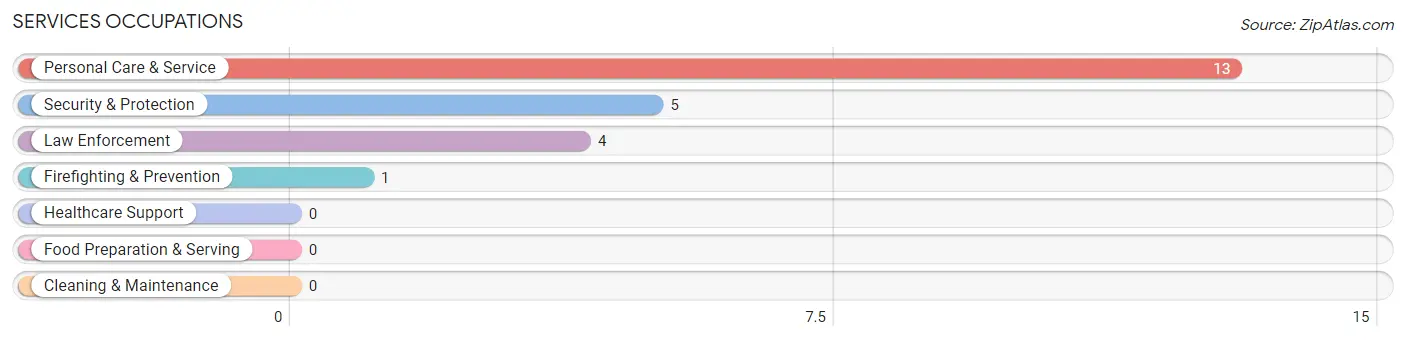
Services Occupations
The most common Services occupations in Bushton are Personal Care & Service (13 | 14.3%), Security & Protection (5 | 5.5%), Law Enforcement (4 | 4.4%), and Firefighting & Prevention (1 | 1.1%).
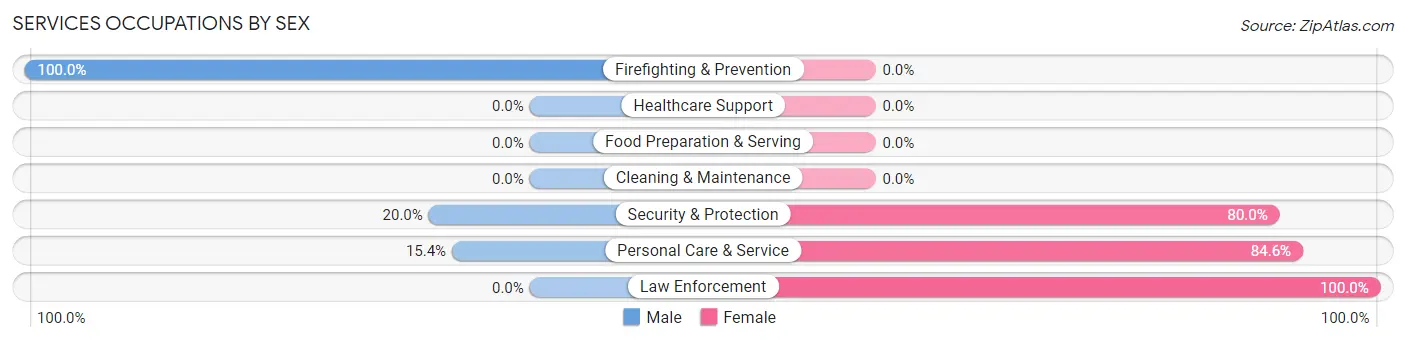
Services Occupations by Sex
Within the Services occupations in Bushton, the most male-oriented occupations are Firefighting & Prevention (100.0%), Security & Protection (20.0%), and Personal Care & Service (15.4%), while the most female-oriented occupations are Law Enforcement (100.0%), Personal Care & Service (84.6%), and Security & Protection (80.0%).
| Occupation | Male | Female |
| Healthcare Support | 0 (0.0%) | 0 (0.0%) |
| Security & Protection | 1 (20.0%) | 4 (80.0%) |
| Firefighting & Prevention | 1 (100.0%) | 0 (0.0%) |
| Law Enforcement | 0 (0.0%) | 4 (100.0%) |
| Food Preparation & Serving | 0 (0.0%) | 0 (0.0%) |
| Cleaning & Maintenance | 0 (0.0%) | 0 (0.0%) |
| Personal Care & Service | 2 (15.4%) | 11 (84.6%) |
| Total (Category) | 3 (16.7%) | 15 (83.3%) |
| Total (Overall) | 47 (51.6%) | 44 (48.3%) |
Sales and Office Occupations
The most common Sales and Office occupations in Bushton are Office & Administration (13 | 14.3%), and Sales & Related (5 | 5.5%).

Sales and Office Occupations by Sex

| Occupation | Male | Female |
| Sales & Related | 1 (20.0%) | 4 (80.0%) |
| Office & Administration | 2 (15.4%) | 11 (84.6%) |
| Total (Category) | 3 (16.7%) | 15 (83.3%) |
| Total (Overall) | 47 (51.6%) | 44 (48.3%) |
Natural Resources, Construction and Maintenance Occupations
The most common Natural Resources, Construction and Maintenance occupations in Bushton are Farming, Fishing & Forestry (6 | 6.6%), Construction & Extraction (2 | 2.2%), and Installation, Maintenance & Repair (1 | 1.1%).
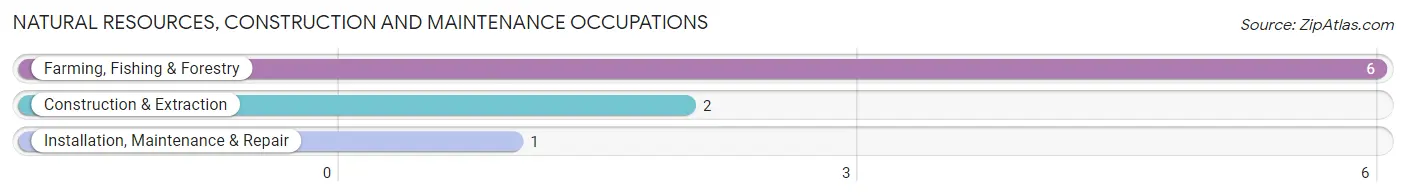
Natural Resources, Construction and Maintenance Occupations by Sex
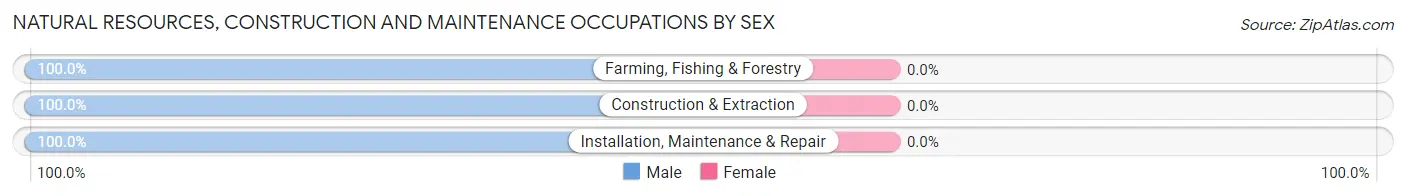
| Occupation | Male | Female |
| Farming, Fishing & Forestry | 6 (100.0%) | 0 (0.0%) |
| Construction & Extraction | 2 (100.0%) | 0 (0.0%) |
| Installation, Maintenance & Repair | 1 (100.0%) | 0 (0.0%) |
| Total (Category) | 9 (100.0%) | 0 (0.0%) |
| Total (Overall) | 47 (51.6%) | 44 (48.3%) |
Production, Transportation and Moving Occupations
The most common Production, Transportation and Moving occupations in Bushton are Transportation (6 | 6.6%), Material Moving (3 | 3.3%), and Production (2 | 2.2%).
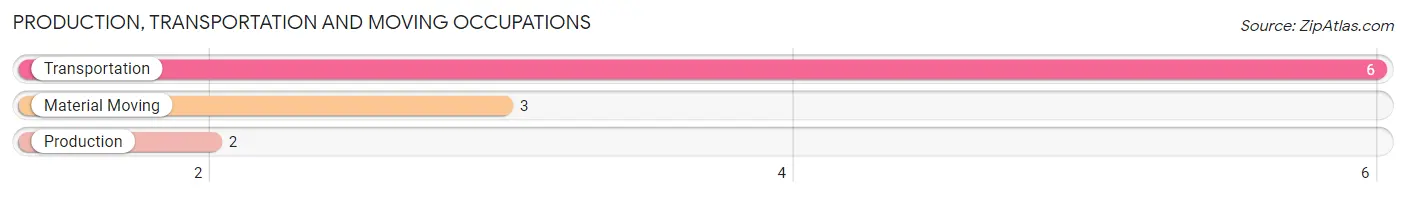
Production, Transportation and Moving Occupations by Sex
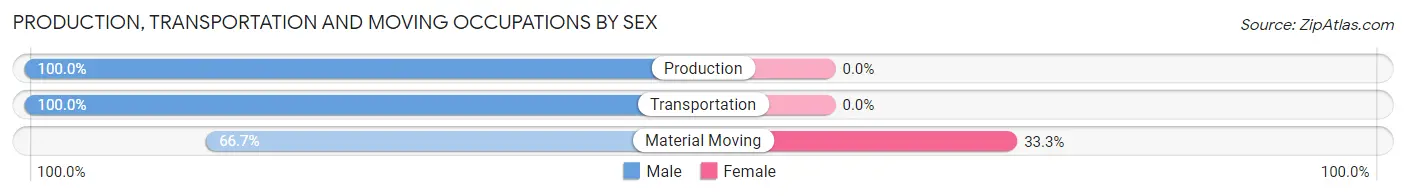
| Occupation | Male | Female |
| Production | 2 (100.0%) | 0 (0.0%) |
| Transportation | 6 (100.0%) | 0 (0.0%) |
| Material Moving | 2 (66.7%) | 1 (33.3%) |
| Total (Category) | 10 (90.9%) | 1 (9.1%) |
| Total (Overall) | 47 (51.6%) | 44 (48.3%) |
Employment Industries by Sex in Bushton
Employment Industries in Bushton
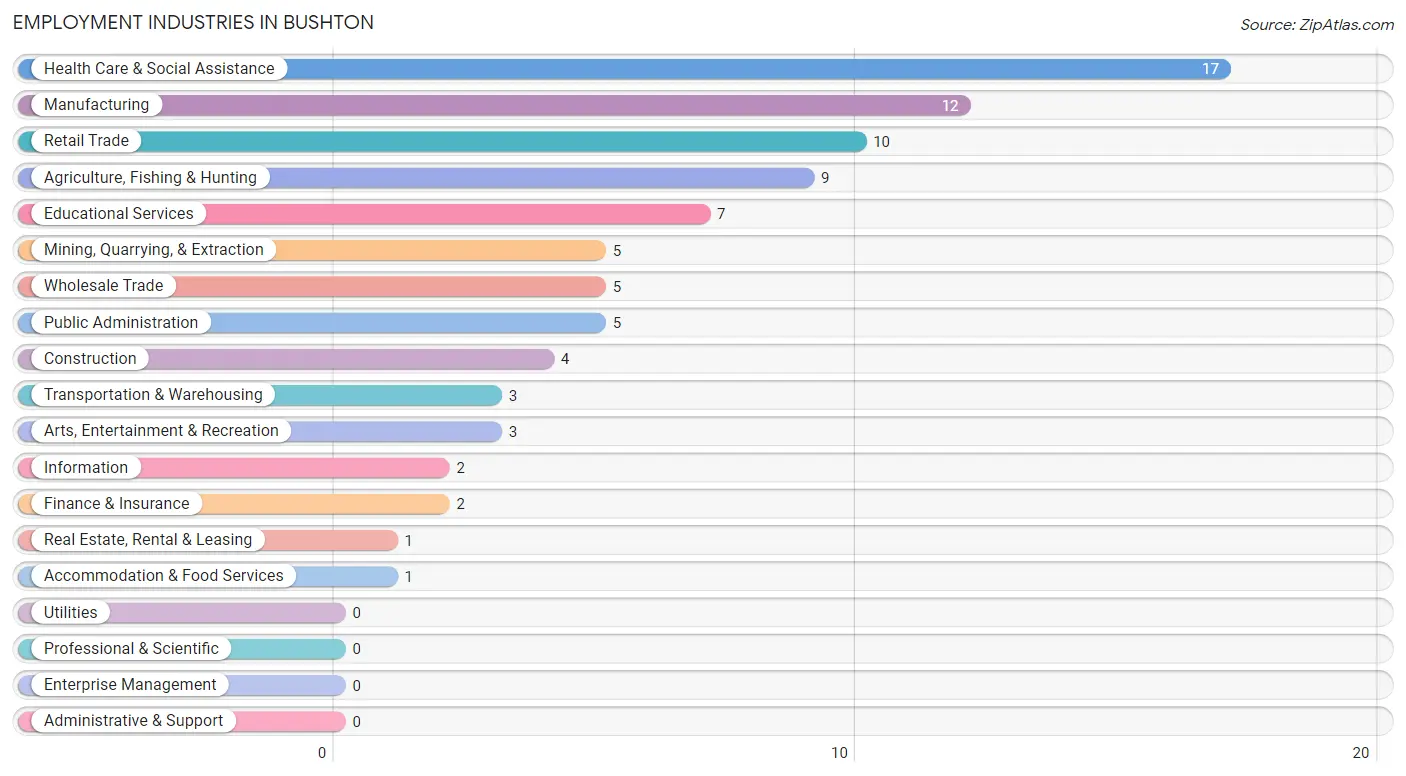
The major employment industries in Bushton include Health Care & Social Assistance (17 | 18.7%), Manufacturing (12 | 13.2%), Retail Trade (10 | 11.0%), Agriculture, Fishing & Hunting (9 | 9.9%), and Educational Services (7 | 7.7%).
Employment Industries by Sex in Bushton
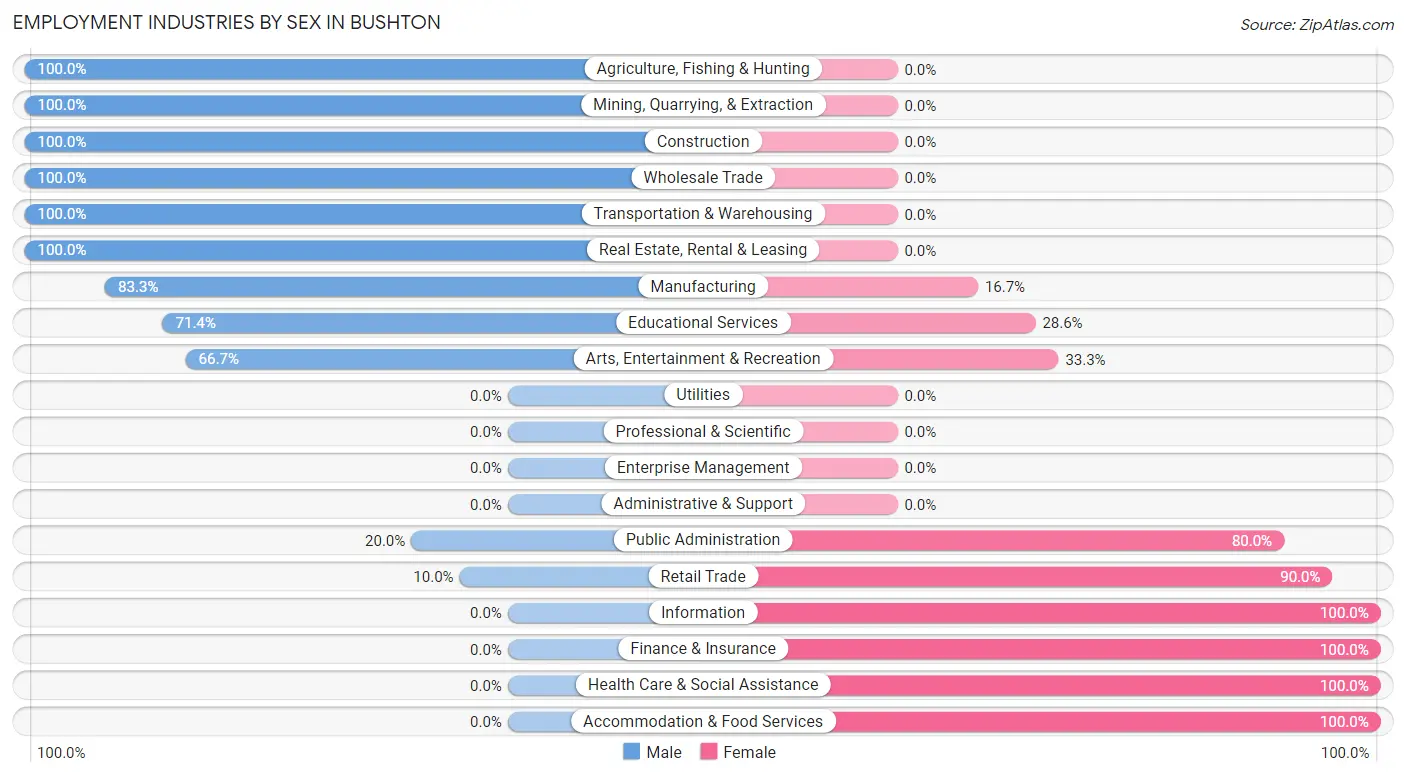
The Bushton industries that see more men than women are Agriculture, Fishing & Hunting (100.0%), Mining, Quarrying, & Extraction (100.0%), and Construction (100.0%), whereas the industries that tend to have a higher number of women are Information (100.0%), Finance & Insurance (100.0%), and Health Care & Social Assistance (100.0%).
| Industry | Male | Female |
| Agriculture, Fishing & Hunting | 9 (100.0%) | 0 (0.0%) |
| Mining, Quarrying, & Extraction | 5 (100.0%) | 0 (0.0%) |
| Construction | 4 (100.0%) | 0 (0.0%) |
| Manufacturing | 10 (83.3%) | 2 (16.7%) |
| Wholesale Trade | 5 (100.0%) | 0 (0.0%) |
| Retail Trade | 1 (10.0%) | 9 (90.0%) |
| Transportation & Warehousing | 3 (100.0%) | 0 (0.0%) |
| Utilities | 0 (0.0%) | 0 (0.0%) |
| Information | 0 (0.0%) | 2 (100.0%) |
| Finance & Insurance | 0 (0.0%) | 2 (100.0%) |
| Real Estate, Rental & Leasing | 1 (100.0%) | 0 (0.0%) |
| Professional & Scientific | 0 (0.0%) | 0 (0.0%) |
| Enterprise Management | 0 (0.0%) | 0 (0.0%) |
| Administrative & Support | 0 (0.0%) | 0 (0.0%) |
| Educational Services | 5 (71.4%) | 2 (28.6%) |
| Health Care & Social Assistance | 0 (0.0%) | 17 (100.0%) |
| Arts, Entertainment & Recreation | 2 (66.7%) | 1 (33.3%) |
| Accommodation & Food Services | 0 (0.0%) | 1 (100.0%) |
| Public Administration | 1 (20.0%) | 4 (80.0%) |
| Total | 47 (51.6%) | 44 (48.3%) |
Education in Bushton
School Enrollment in Bushton
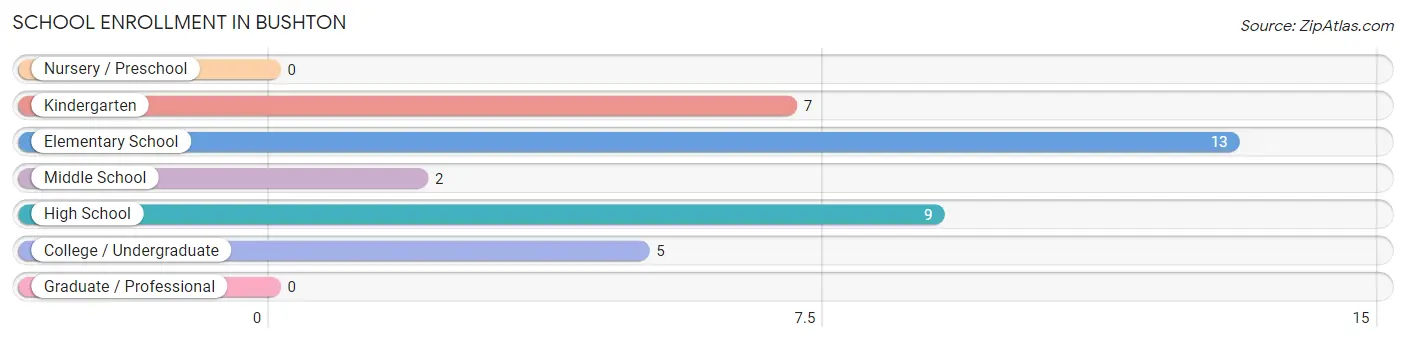
The most common levels of schooling among the 36 students in Bushton are elementary school (13 | 36.1%), high school (9 | 25.0%), and kindergarten (7 | 19.4%).
| School Level | # Students | % Students |
| Nursery / Preschool | 0 | 0.0% |
| Kindergarten | 7 | 19.4% |
| Elementary School | 13 | 36.1% |
| Middle School | 2 | 5.6% |
| High School | 9 | 25.0% |
| College / Undergraduate | 5 | 13.9% |
| Graduate / Professional | 0 | 0.0% |
| Total | 36 | 100.0% |
School Enrollment by Age by Funding Source in Bushton
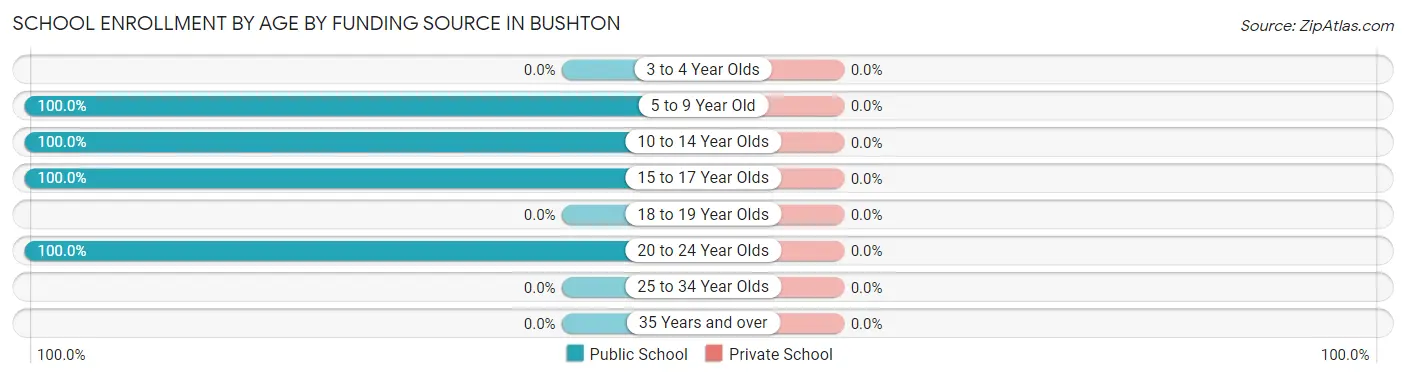
| Age Bracket | Public School | Private School |
| 3 to 4 Year Olds | 0 (0.0%) | 0 (0.0%) |
| 5 to 9 Year Old | 20 (100.0%) | 0 (0.0%) |
| 10 to 14 Year Olds | 2 (100.0%) | 0 (0.0%) |
| 15 to 17 Year Olds | 9 (100.0%) | 0 (0.0%) |
| 18 to 19 Year Olds | 0 (0.0%) | 0 (0.0%) |
| 20 to 24 Year Olds | 5 (100.0%) | 0 (0.0%) |
| 25 to 34 Year Olds | 0 (0.0%) | 0 (0.0%) |
| 35 Years and over | 0 (0.0%) | 0 (0.0%) |
| Total | 36 (100.0%) | 0 (0.0%) |
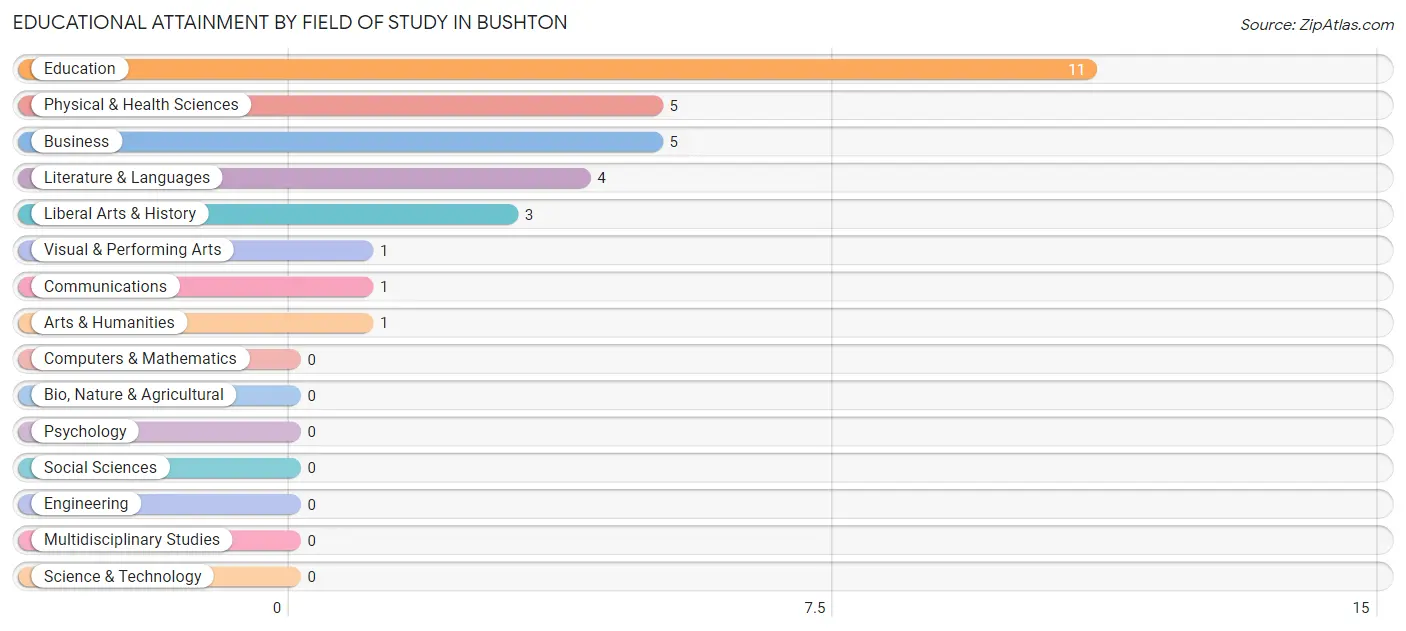
Educational Attainment by Field of Study in Bushton
Education (11 | 35.5%), physical & health sciences (5 | 16.1%), business (5 | 16.1%), literature & languages (4 | 12.9%), and liberal arts & history (3 | 9.7%) are the most common fields of study among 31 individuals in Bushton who have obtained a bachelor's degree or higher.
| Field of Study | # Graduates | % Graduates |
| Computers & Mathematics | 0 | 0.0% |
| Bio, Nature & Agricultural | 0 | 0.0% |
| Physical & Health Sciences | 5 | 16.1% |
| Psychology | 0 | 0.0% |
| Social Sciences | 0 | 0.0% |
| Engineering | 0 | 0.0% |
| Multidisciplinary Studies | 0 | 0.0% |
| Science & Technology | 0 | 0.0% |
| Business | 5 | 16.1% |
| Education | 11 | 35.5% |
| Literature & Languages | 4 | 12.9% |
| Liberal Arts & History | 3 | 9.7% |
| Visual & Performing Arts | 1 | 3.2% |
| Communications | 1 | 3.2% |
| Arts & Humanities | 1 | 3.2% |
| Total | 31 | 100.0% |
Transportation & Commute in Bushton
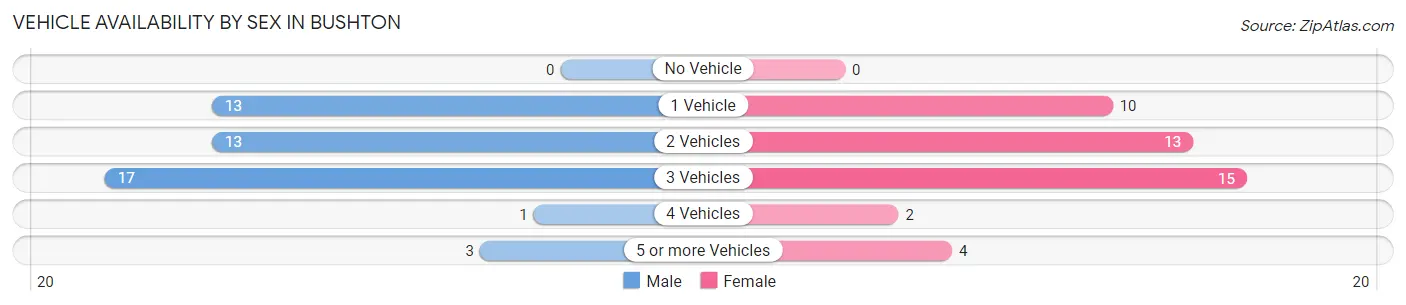
Vehicle Availability by Sex in Bushton
The most prevalent vehicle ownership categories in Bushton are males with 3 vehicles (17, accounting for 36.2%) and females with 3 vehicles (15, making up 38.6%).
| Vehicles Available | Male | Female |
| No Vehicle | 0 (0.0%) | 0 (0.0%) |
| 1 Vehicle | 13 (27.7%) | 10 (22.7%) |
| 2 Vehicles | 13 (27.7%) | 13 (29.5%) |
| 3 Vehicles | 17 (36.2%) | 15 (34.1%) |
| 4 Vehicles | 1 (2.1%) | 2 (4.5%) |
| 5 or more Vehicles | 3 (6.4%) | 4 (9.1%) |
| Total | 47 (100.0%) | 44 (100.0%) |
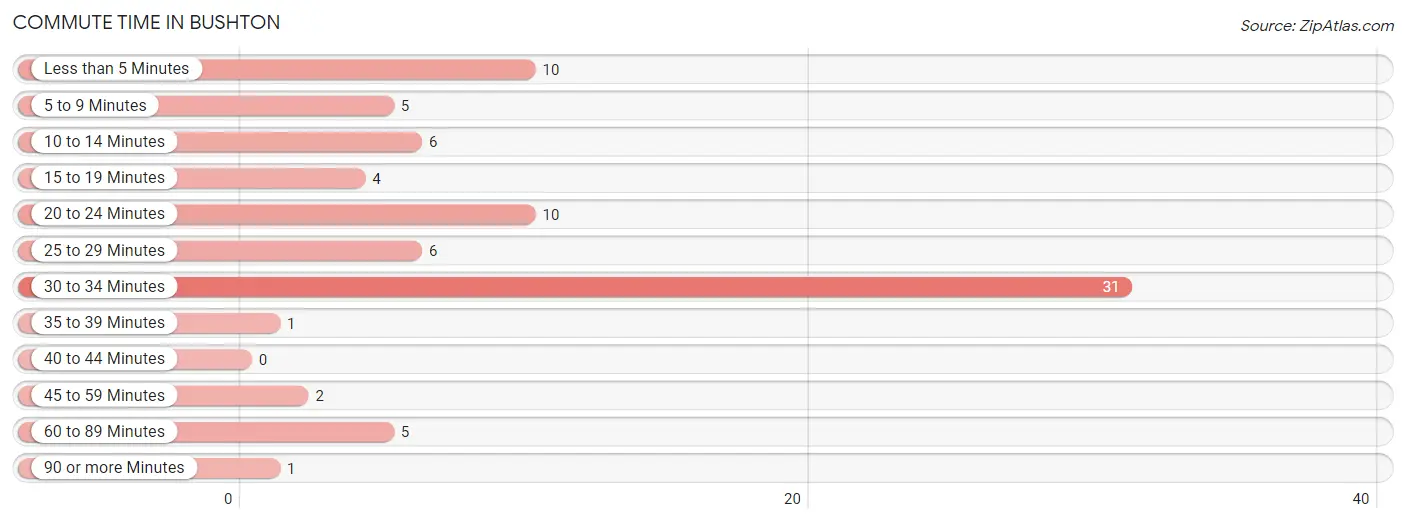
Commute Time in Bushton
The most frequently occuring commute durations in Bushton are 30 to 34 minutes (31 commuters, 38.3%), less than 5 minutes (10 commuters, 12.3%), and 20 to 24 minutes (10 commuters, 12.3%).
| Commute Time | # Commuters | % Commuters |
| Less than 5 Minutes | 10 | 12.3% |
| 5 to 9 Minutes | 5 | 6.2% |
| 10 to 14 Minutes | 6 | 7.4% |
| 15 to 19 Minutes | 4 | 4.9% |
| 20 to 24 Minutes | 10 | 12.3% |
| 25 to 29 Minutes | 6 | 7.4% |
| 30 to 34 Minutes | 31 | 38.3% |
| 35 to 39 Minutes | 1 | 1.2% |
| 40 to 44 Minutes | 0 | 0.0% |
| 45 to 59 Minutes | 2 | 2.5% |
| 60 to 89 Minutes | 5 | 6.2% |
| 90 or more Minutes | 1 | 1.2% |
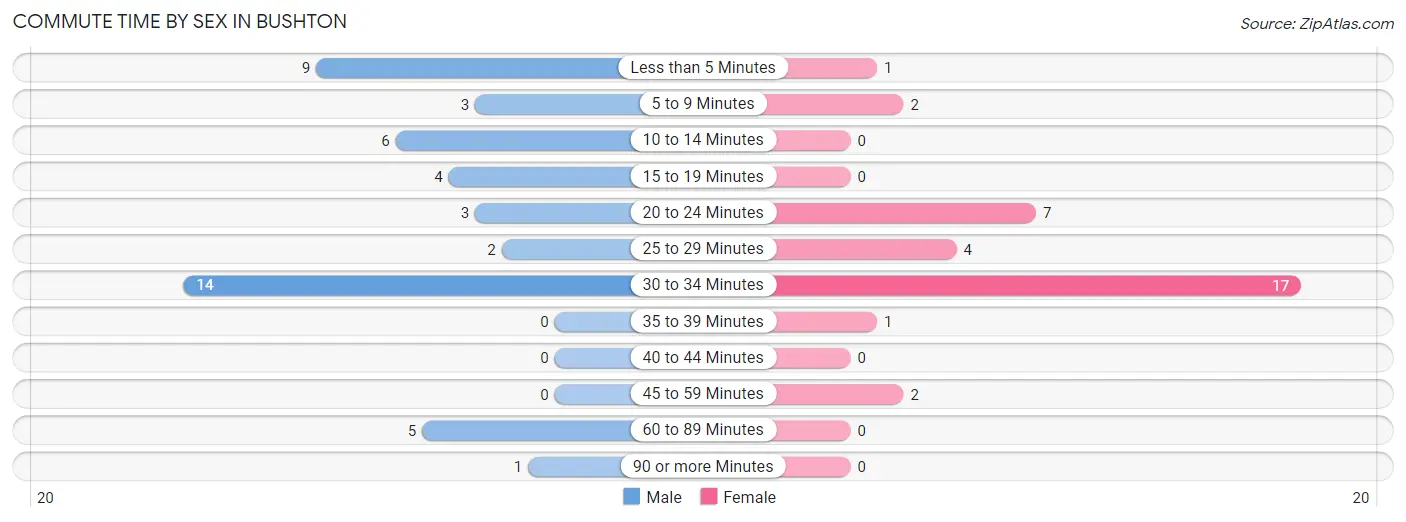
Commute Time by Sex in Bushton
The most common commute times in Bushton are 30 to 34 minutes (14 commuters, 29.8%) for males and 30 to 34 minutes (17 commuters, 50.0%) for females.
| Commute Time | Male | Female |
| Less than 5 Minutes | 9 (19.2%) | 1 (2.9%) |
| 5 to 9 Minutes | 3 (6.4%) | 2 (5.9%) |
| 10 to 14 Minutes | 6 (12.8%) | 0 (0.0%) |
| 15 to 19 Minutes | 4 (8.5%) | 0 (0.0%) |
| 20 to 24 Minutes | 3 (6.4%) | 7 (20.6%) |
| 25 to 29 Minutes | 2 (4.3%) | 4 (11.8%) |
| 30 to 34 Minutes | 14 (29.8%) | 17 (50.0%) |
| 35 to 39 Minutes | 0 (0.0%) | 1 (2.9%) |
| 40 to 44 Minutes | 0 (0.0%) | 0 (0.0%) |
| 45 to 59 Minutes | 0 (0.0%) | 2 (5.9%) |
| 60 to 89 Minutes | 5 (10.6%) | 0 (0.0%) |
| 90 or more Minutes | 1 (2.1%) | 0 (0.0%) |
Time of Departure to Work by Sex in Bushton
The most frequent times of departure to work in Bushton are 6:00 AM to 6:29 AM (12, 25.5%) for males and 7:00 AM to 7:29 AM (18, 52.9%) for females.
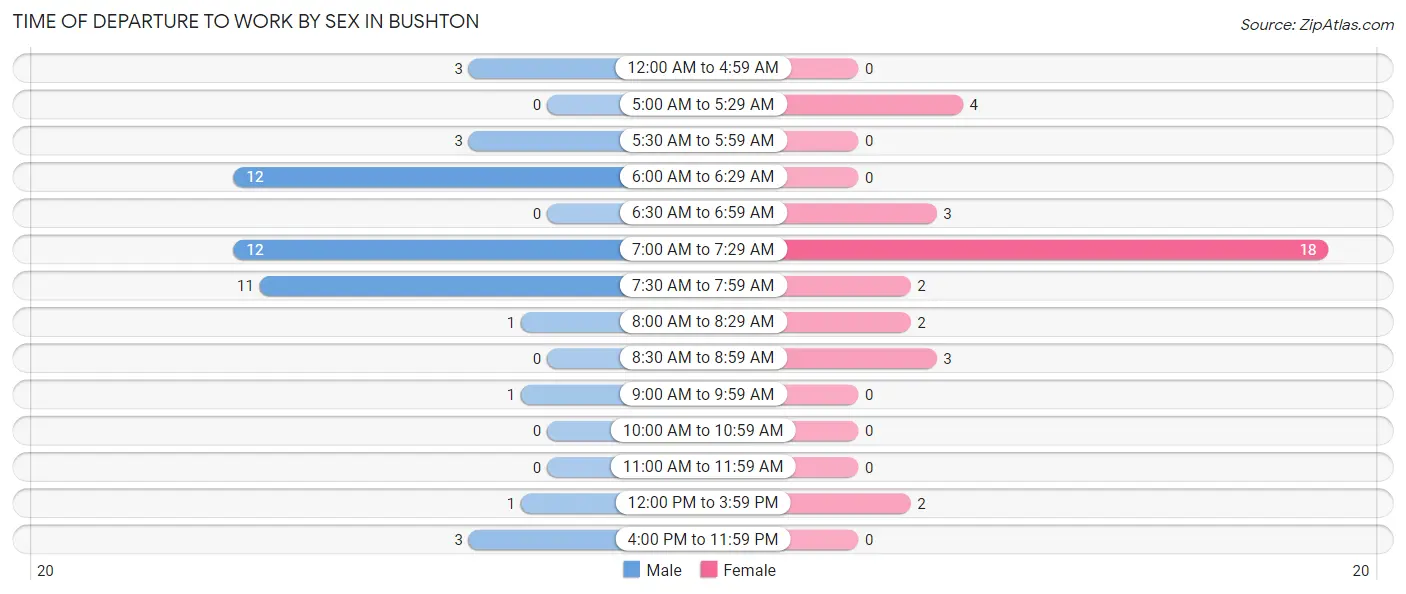
| Time of Departure | Male | Female |
| 12:00 AM to 4:59 AM | 3 (6.4%) | 0 (0.0%) |
| 5:00 AM to 5:29 AM | 0 (0.0%) | 4 (11.8%) |
| 5:30 AM to 5:59 AM | 3 (6.4%) | 0 (0.0%) |
| 6:00 AM to 6:29 AM | 12 (25.5%) | 0 (0.0%) |
| 6:30 AM to 6:59 AM | 0 (0.0%) | 3 (8.8%) |
| 7:00 AM to 7:29 AM | 12 (25.5%) | 18 (52.9%) |
| 7:30 AM to 7:59 AM | 11 (23.4%) | 2 (5.9%) |
| 8:00 AM to 8:29 AM | 1 (2.1%) | 2 (5.9%) |
| 8:30 AM to 8:59 AM | 0 (0.0%) | 3 (8.8%) |
| 9:00 AM to 9:59 AM | 1 (2.1%) | 0 (0.0%) |
| 10:00 AM to 10:59 AM | 0 (0.0%) | 0 (0.0%) |
| 11:00 AM to 11:59 AM | 0 (0.0%) | 0 (0.0%) |
| 12:00 PM to 3:59 PM | 1 (2.1%) | 2 (5.9%) |
| 4:00 PM to 11:59 PM | 3 (6.4%) | 0 (0.0%) |
| Total | 47 (100.0%) | 34 (100.0%) |
Housing Occupancy in Bushton
Occupancy by Ownership in Bushton
Of the total 148 dwellings in Bushton, owner-occupied units account for 133 (89.9%), while renter-occupied units make up 15 (10.1%).
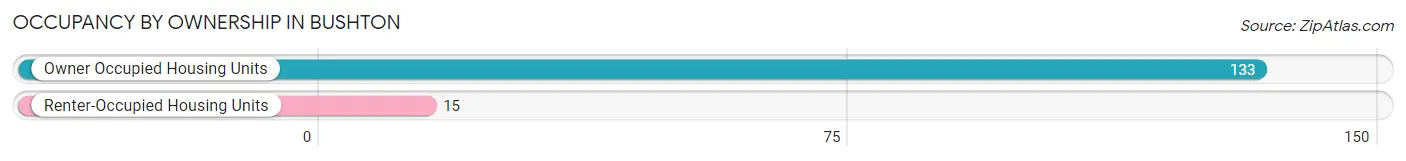
| Occupancy | # Housing Units | % Housing Units |
| Owner Occupied Housing Units | 133 | 89.9% |
| Renter-Occupied Housing Units | 15 | 10.1% |
| Total Occupied Housing Units | 148 | 100.0% |
Occupancy by Household Size in Bushton
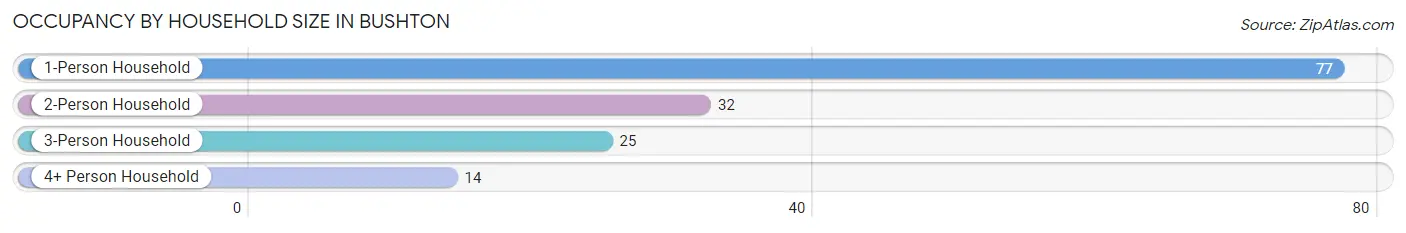
| Household Size | # Housing Units | % Housing Units |
| 1-Person Household | 77 | 52.0% |
| 2-Person Household | 32 | 21.6% |
| 3-Person Household | 25 | 16.9% |
| 4+ Person Household | 14 | 9.5% |
| Total Housing Units | 148 | 100.0% |
Occupancy by Ownership by Household Size in Bushton
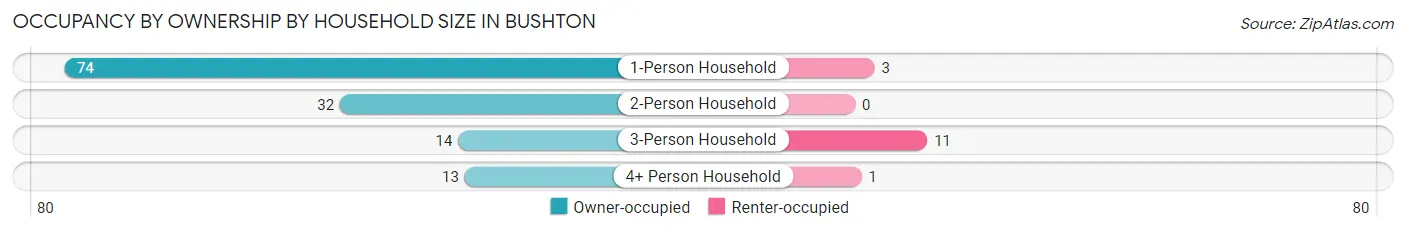
| Household Size | Owner-occupied | Renter-occupied |
| 1-Person Household | 74 (96.1%) | 3 (3.9%) |
| 2-Person Household | 32 (100.0%) | 0 (0.0%) |
| 3-Person Household | 14 (56.0%) | 11 (44.0%) |
| 4+ Person Household | 13 (92.9%) | 1 (7.1%) |
| Total Housing Units | 133 (89.9%) | 15 (10.1%) |
Occupancy by Educational Attainment in Bushton
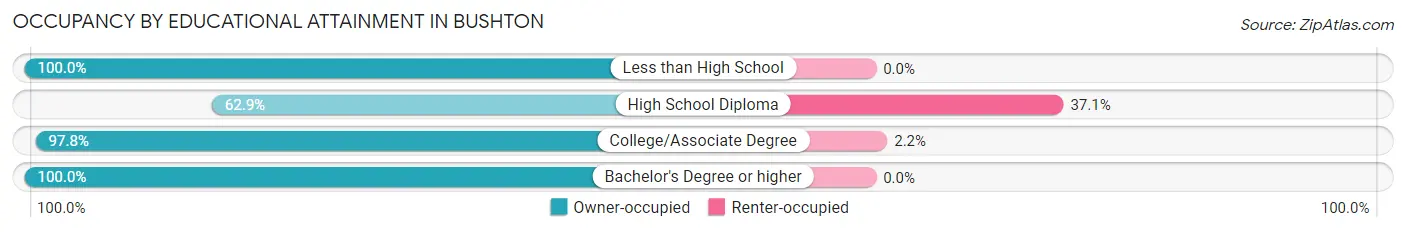
| Household Size | Owner-occupied | Renter-occupied |
| Less than High School | 4 (100.0%) | 0 (0.0%) |
| High School Diploma | 22 (62.9%) | 13 (37.1%) |
| College/Associate Degree | 89 (97.8%) | 2 (2.2%) |
| Bachelor's Degree or higher | 18 (100.0%) | 0 (0.0%) |
Occupancy by Age of Householder in Bushton
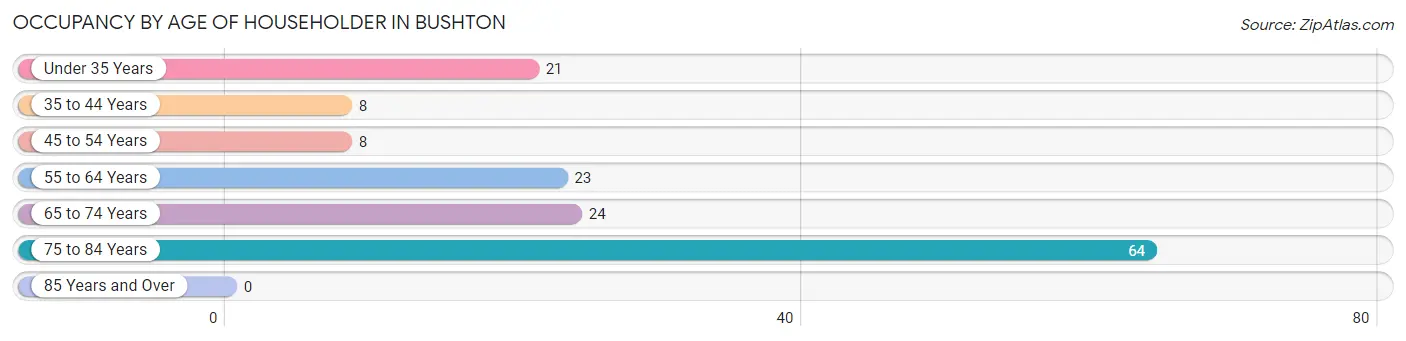
| Age Bracket | # Households | % Households |
| Under 35 Years | 21 | 14.2% |
| 35 to 44 Years | 8 | 5.4% |
| 45 to 54 Years | 8 | 5.4% |
| 55 to 64 Years | 23 | 15.5% |
| 65 to 74 Years | 24 | 16.2% |
| 75 to 84 Years | 64 | 43.2% |
| 85 Years and Over | 0 | 0.0% |
| Total | 148 | 100.0% |
Housing Finances in Bushton
Median Income by Occupancy in Bushton
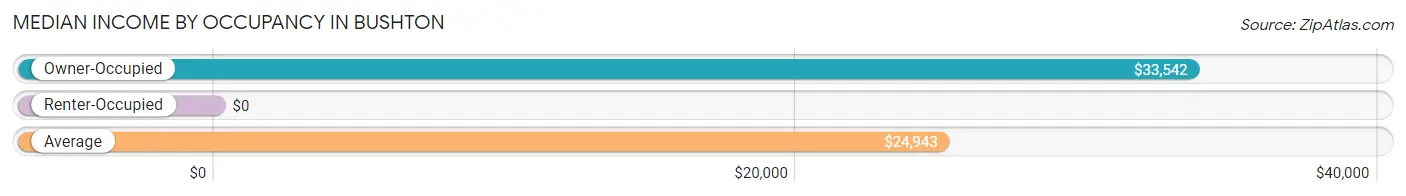
| Occupancy Type | # Households | Median Income |
| Owner-Occupied | 133 (89.9%) | $33,542 |
| Renter-Occupied | 15 (10.1%) | $0 |
| Average | 148 (100.0%) | $24,943 |
Occupancy by Householder Income Bracket in Bushton
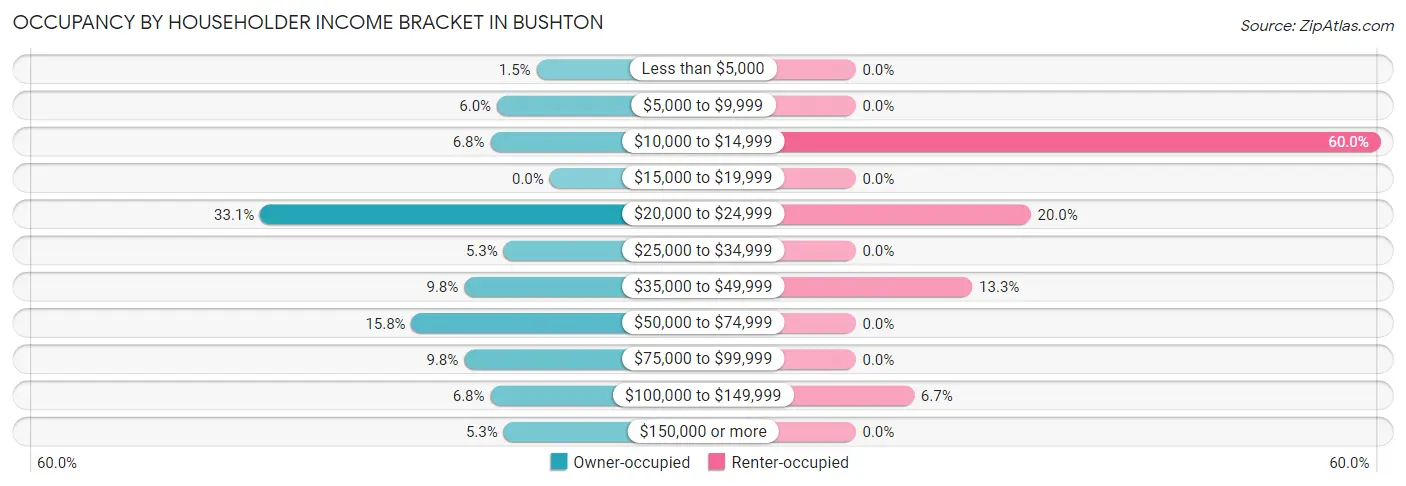
| Income Bracket | Owner-occupied | Renter-occupied |
| Less than $5,000 | 2 (1.5%) | 0 (0.0%) |
| $5,000 to $9,999 | 8 (6.0%) | 0 (0.0%) |
| $10,000 to $14,999 | 9 (6.8%) | 9 (60.0%) |
| $15,000 to $19,999 | 0 (0.0%) | 0 (0.0%) |
| $20,000 to $24,999 | 44 (33.1%) | 3 (20.0%) |
| $25,000 to $34,999 | 7 (5.3%) | 0 (0.0%) |
| $35,000 to $49,999 | 13 (9.8%) | 2 (13.3%) |
| $50,000 to $74,999 | 21 (15.8%) | 0 (0.0%) |
| $75,000 to $99,999 | 13 (9.8%) | 0 (0.0%) |
| $100,000 to $149,999 | 9 (6.8%) | 1 (6.7%) |
| $150,000 or more | 7 (5.3%) | 0 (0.0%) |
| Total | 133 (100.0%) | 15 (100.0%) |
Monthly Housing Cost Tiers in Bushton
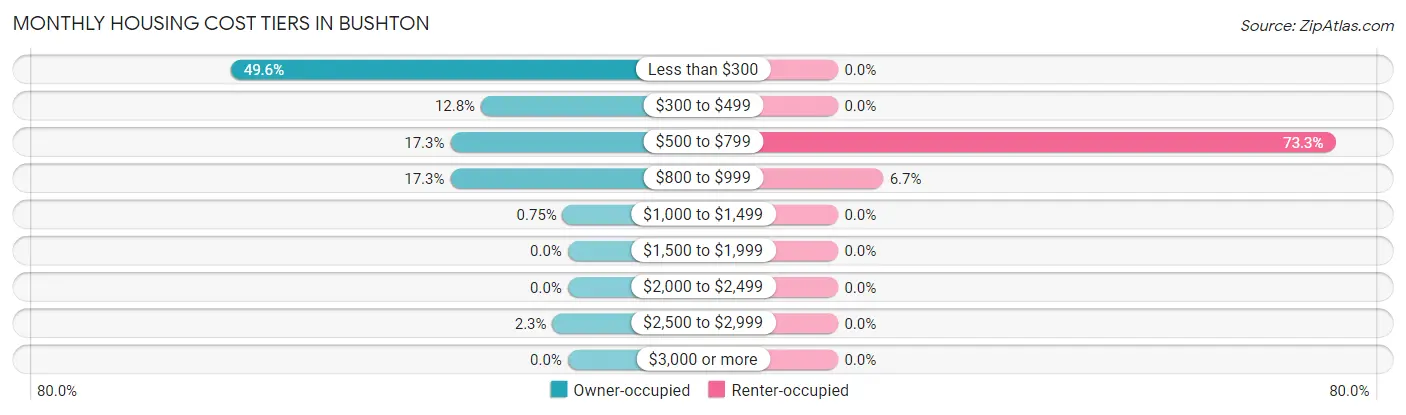
| Monthly Cost | Owner-occupied | Renter-occupied |
| Less than $300 | 66 (49.6%) | 0 (0.0%) |
| $300 to $499 | 17 (12.8%) | 0 (0.0%) |
| $500 to $799 | 23 (17.3%) | 11 (73.3%) |
| $800 to $999 | 23 (17.3%) | 1 (6.7%) |
| $1,000 to $1,499 | 1 (0.7%) | 0 (0.0%) |
| $1,500 to $1,999 | 0 (0.0%) | 0 (0.0%) |
| $2,000 to $2,499 | 0 (0.0%) | 0 (0.0%) |
| $2,500 to $2,999 | 3 (2.3%) | 0 (0.0%) |
| $3,000 or more | 0 (0.0%) | 0 (0.0%) |
| Total | 133 (100.0%) | 15 (100.0%) |
Physical Housing Characteristics in Bushton
Housing Structures in Bushton
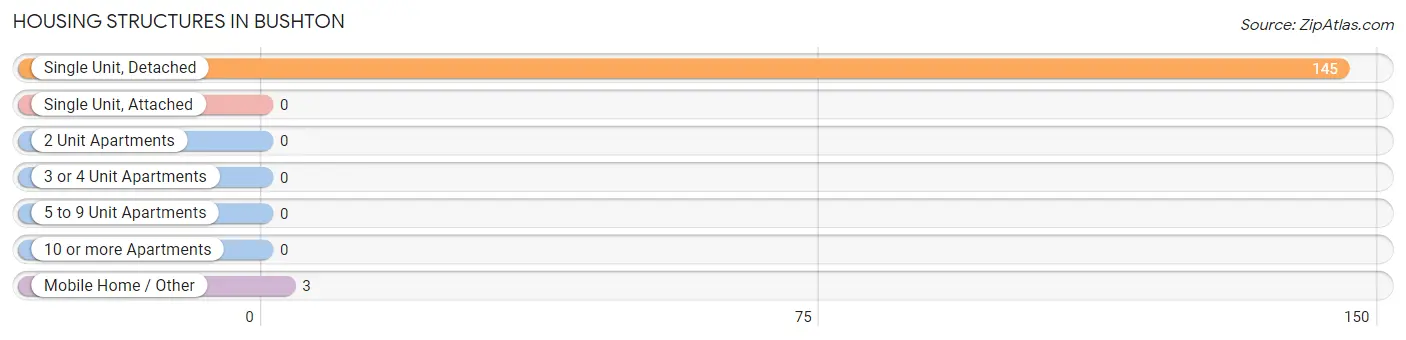
| Structure Type | # Housing Units | % Housing Units |
| Single Unit, Detached | 145 | 98.0% |
| Single Unit, Attached | 0 | 0.0% |
| 2 Unit Apartments | 0 | 0.0% |
| 3 or 4 Unit Apartments | 0 | 0.0% |
| 5 to 9 Unit Apartments | 0 | 0.0% |
| 10 or more Apartments | 0 | 0.0% |
| Mobile Home / Other | 3 | 2.0% |
| Total | 148 | 100.0% |
Housing Structures by Occupancy in Bushton
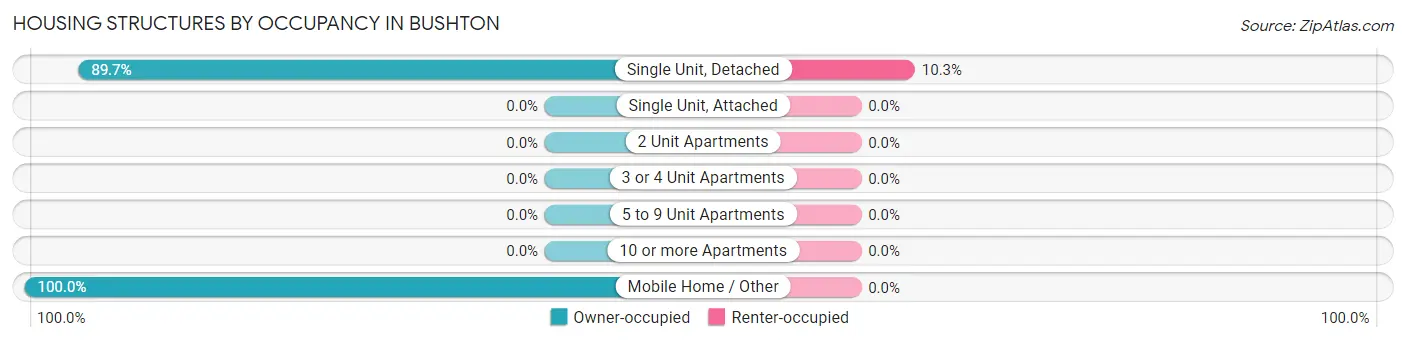
| Structure Type | Owner-occupied | Renter-occupied |
| Single Unit, Detached | 130 (89.7%) | 15 (10.3%) |
| Single Unit, Attached | 0 (0.0%) | 0 (0.0%) |
| 2 Unit Apartments | 0 (0.0%) | 0 (0.0%) |
| 3 or 4 Unit Apartments | 0 (0.0%) | 0 (0.0%) |
| 5 to 9 Unit Apartments | 0 (0.0%) | 0 (0.0%) |
| 10 or more Apartments | 0 (0.0%) | 0 (0.0%) |
| Mobile Home / Other | 3 (100.0%) | 0 (0.0%) |
| Total | 133 (89.9%) | 15 (10.1%) |
Housing Structures by Number of Rooms in Bushton
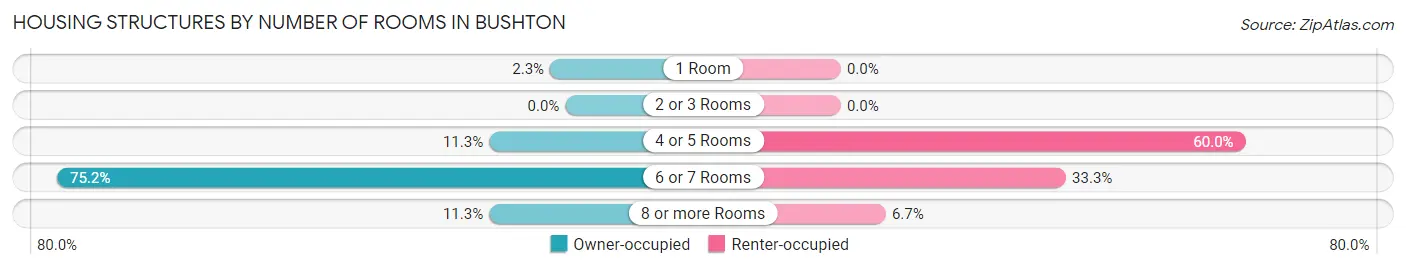
| Number of Rooms | Owner-occupied | Renter-occupied |
| 1 Room | 3 (2.3%) | 0 (0.0%) |
| 2 or 3 Rooms | 0 (0.0%) | 0 (0.0%) |
| 4 or 5 Rooms | 15 (11.3%) | 9 (60.0%) |
| 6 or 7 Rooms | 100 (75.2%) | 5 (33.3%) |
| 8 or more Rooms | 15 (11.3%) | 1 (6.7%) |
| Total | 133 (100.0%) | 15 (100.0%) |
Housing Structure by Heating Type in Bushton
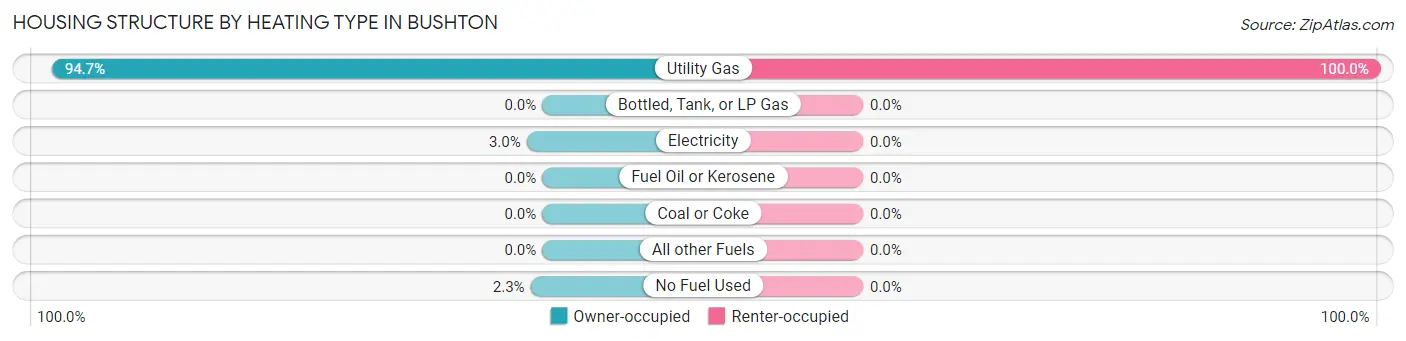
| Heating Type | Owner-occupied | Renter-occupied |
| Utility Gas | 126 (94.7%) | 15 (100.0%) |
| Bottled, Tank, or LP Gas | 0 (0.0%) | 0 (0.0%) |
| Electricity | 4 (3.0%) | 0 (0.0%) |
| Fuel Oil or Kerosene | 0 (0.0%) | 0 (0.0%) |
| Coal or Coke | 0 (0.0%) | 0 (0.0%) |
| All other Fuels | 0 (0.0%) | 0 (0.0%) |
| No Fuel Used | 3 (2.3%) | 0 (0.0%) |
| Total | 133 (100.0%) | 15 (100.0%) |
Household Vehicle Usage in Bushton
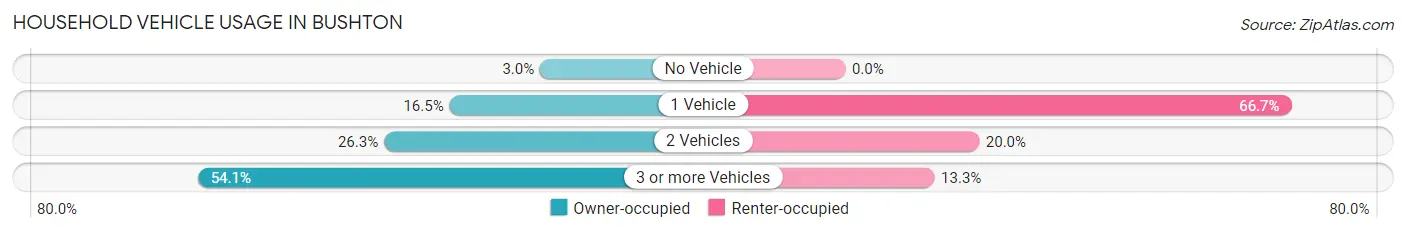
| Vehicles per Household | Owner-occupied | Renter-occupied |
| No Vehicle | 4 (3.0%) | 0 (0.0%) |
| 1 Vehicle | 22 (16.5%) | 10 (66.7%) |
| 2 Vehicles | 35 (26.3%) | 3 (20.0%) |
| 3 or more Vehicles | 72 (54.1%) | 2 (13.3%) |
| Total | 133 (100.0%) | 15 (100.0%) |
Real Estate & Mortgages in Bushton
Real Estate and Mortgage Overview in Bushton
| Characteristic | Without Mortgage | With Mortgage |
| Housing Units | 84 | 49 |
| Median Property Value | $23,400 | $53,600 |
| Median Household Income | $24,091 | $7 |
| Monthly Housing Costs | $277 | $0 |
| Real Estate Taxes | $354 | $0 |
Property Value by Mortgage Status in Bushton
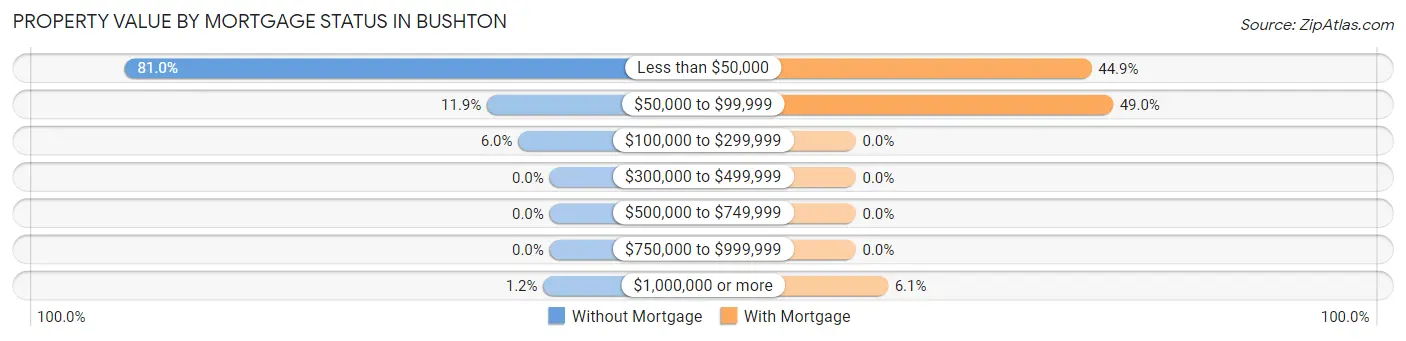
| Property Value | Without Mortgage | With Mortgage |
| Less than $50,000 | 68 (80.9%) | 22 (44.9%) |
| $50,000 to $99,999 | 10 (11.9%) | 24 (49.0%) |
| $100,000 to $299,999 | 5 (5.9%) | 0 (0.0%) |
| $300,000 to $499,999 | 0 (0.0%) | 0 (0.0%) |
| $500,000 to $749,999 | 0 (0.0%) | 0 (0.0%) |
| $750,000 to $999,999 | 0 (0.0%) | 0 (0.0%) |
| $1,000,000 or more | 1 (1.2%) | 3 (6.1%) |
| Total | 84 (100.0%) | 49 (100.0%) |
Household Income by Mortgage Status in Bushton
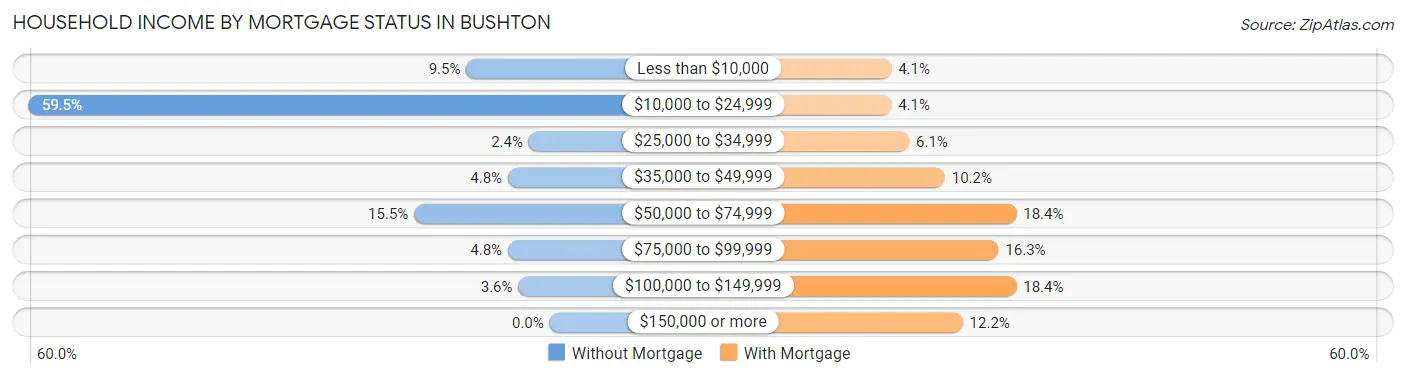
| Household Income | Without Mortgage | With Mortgage |
| Less than $10,000 | 8 (9.5%) | 2 (4.1%) |
| $10,000 to $24,999 | 50 (59.5%) | 2 (4.1%) |
| $25,000 to $34,999 | 2 (2.4%) | 3 (6.1%) |
| $35,000 to $49,999 | 4 (4.8%) | 5 (10.2%) |
| $50,000 to $74,999 | 13 (15.5%) | 9 (18.4%) |
| $75,000 to $99,999 | 4 (4.8%) | 8 (16.3%) |
| $100,000 to $149,999 | 3 (3.6%) | 9 (18.4%) |
| $150,000 or more | 0 (0.0%) | 6 (12.2%) |
| Total | 84 (100.0%) | 49 (100.0%) |
Property Value to Household Income Ratio in Bushton
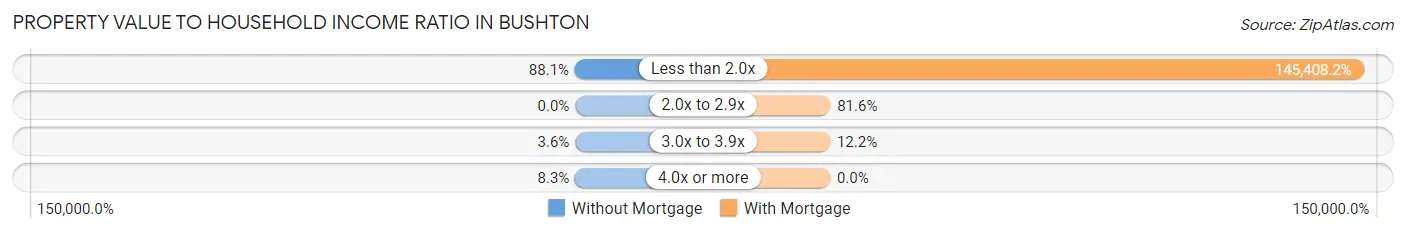
| Value-to-Income Ratio | Without Mortgage | With Mortgage |
| Less than 2.0x | 74 (88.1%) | 71,250 (145,408.2%) |
| 2.0x to 2.9x | 0 (0.0%) | 40 (81.6%) |
| 3.0x to 3.9x | 3 (3.6%) | 6 (12.2%) |
| 4.0x or more | 7 (8.3%) | 0 (0.0%) |
| Total | 84 (100.0%) | 49 (100.0%) |
Real Estate Taxes by Mortgage Status in Bushton

| Property Taxes | Without Mortgage | With Mortgage |
| Less than $800 | 70 (83.3%) | 0 (0.0%) |
| $800 to $1,499 | 14 (16.7%) | 10 (20.4%) |
| $800 to $1,499 | 0 (0.0%) | 31 (63.3%) |
| Total | 84 (100.0%) | 49 (100.0%) |
Health & Disability in Bushton
Health Insurance Coverage by Age in Bushton
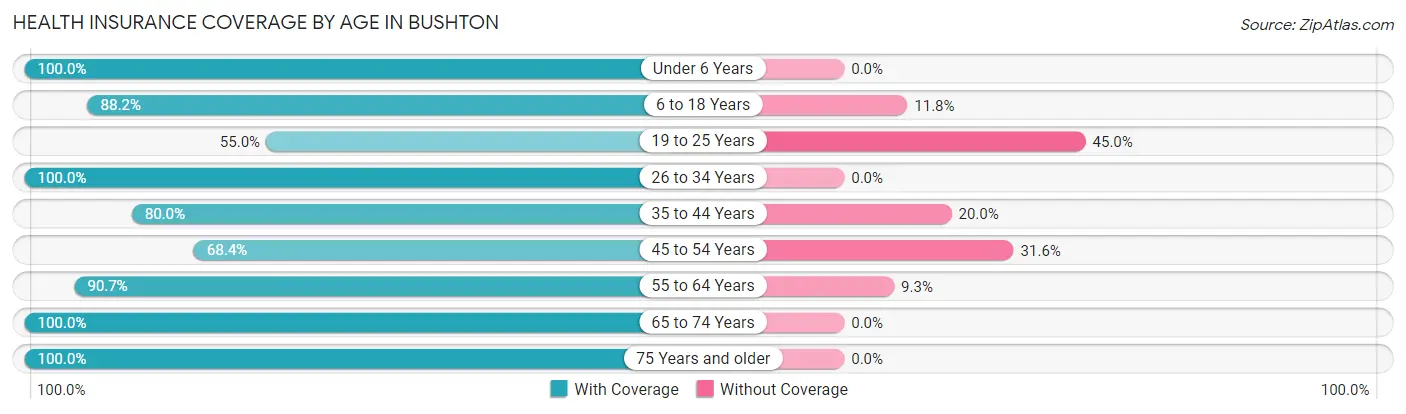
| Age Bracket | With Coverage | Without Coverage |
| Under 6 Years | 17 (100.0%) | 0 (0.0%) |
| 6 to 18 Years | 30 (88.2%) | 4 (11.8%) |
| 19 to 25 Years | 11 (55.0%) | 9 (45.0%) |
| 26 to 34 Years | 14 (100.0%) | 0 (0.0%) |
| 35 to 44 Years | 12 (80.0%) | 3 (20.0%) |
| 45 to 54 Years | 13 (68.4%) | 6 (31.6%) |
| 55 to 64 Years | 39 (90.7%) | 4 (9.3%) |
| 65 to 74 Years | 39 (100.0%) | 0 (0.0%) |
| 75 Years and older | 75 (100.0%) | 0 (0.0%) |
| Total | 250 (90.6%) | 26 (9.4%) |
Health Insurance Coverage by Citizenship Status in Bushton

| Citizenship Status | With Coverage | Without Coverage |
| Native Born | 17 (100.0%) | 0 (0.0%) |
| Foreign Born, Citizen | 30 (88.2%) | 4 (11.8%) |
| Foreign Born, not a Citizen | 11 (55.0%) | 9 (45.0%) |
Health Insurance Coverage by Household Income in Bushton
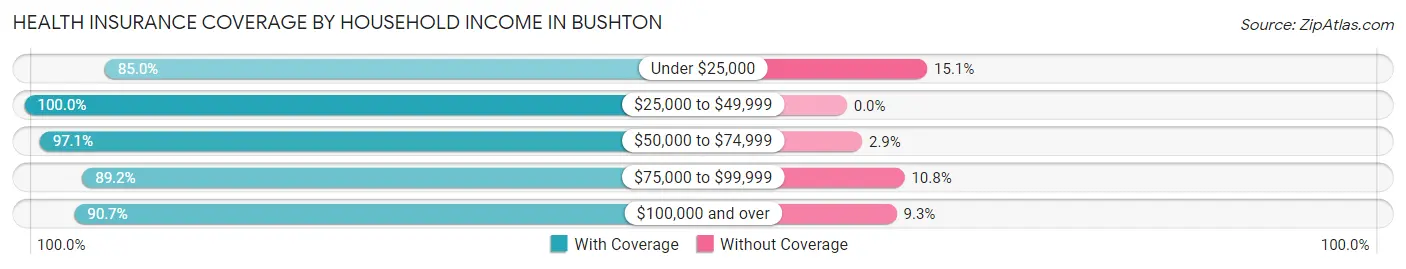
| Household Income | With Coverage | Without Coverage |
| Under $25,000 | 79 (85.0%) | 14 (15.0%) |
| $25,000 to $49,999 | 36 (100.0%) | 0 (0.0%) |
| $50,000 to $74,999 | 34 (97.1%) | 1 (2.9%) |
| $75,000 to $99,999 | 33 (89.2%) | 4 (10.8%) |
| $100,000 and over | 68 (90.7%) | 7 (9.3%) |
Public vs Private Health Insurance Coverage by Age in Bushton
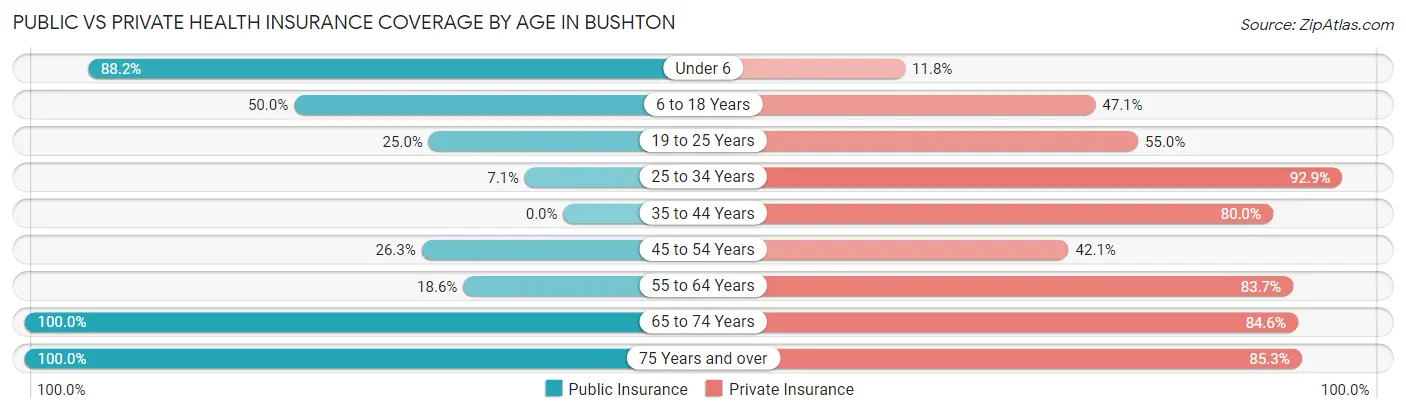
| Age Bracket | Public Insurance | Private Insurance |
| Under 6 | 15 (88.2%) | 2 (11.8%) |
| 6 to 18 Years | 17 (50.0%) | 16 (47.1%) |
| 19 to 25 Years | 5 (25.0%) | 11 (55.0%) |
| 25 to 34 Years | 1 (7.1%) | 13 (92.9%) |
| 35 to 44 Years | 0 (0.0%) | 12 (80.0%) |
| 45 to 54 Years | 5 (26.3%) | 8 (42.1%) |
| 55 to 64 Years | 8 (18.6%) | 36 (83.7%) |
| 65 to 74 Years | 39 (100.0%) | 33 (84.6%) |
| 75 Years and over | 75 (100.0%) | 64 (85.3%) |
| Total | 165 (59.8%) | 195 (70.7%) |
Disability Status by Sex by Age in Bushton
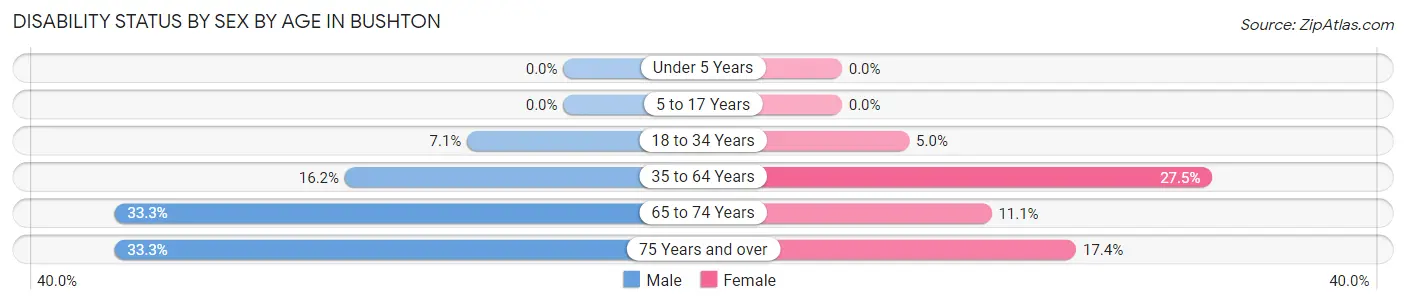
| Age Bracket | Male | Female |
| Under 5 Years | 0 (0.0%) | 0 (0.0%) |
| 5 to 17 Years | 0 (0.0%) | 0 (0.0%) |
| 18 to 34 Years | 1 (7.1%) | 1 (5.0%) |
| 35 to 64 Years | 6 (16.2%) | 11 (27.5%) |
| 65 to 74 Years | 7 (33.3%) | 2 (11.1%) |
| 75 Years and over | 2 (33.3%) | 12 (17.4%) |
Disability Class by Sex by Age in Bushton
Disability Class: Hearing Difficulty
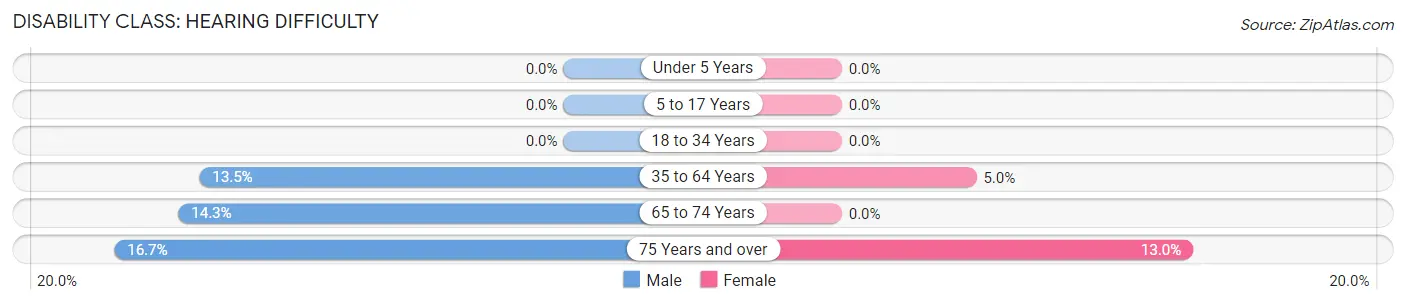
| Age Bracket | Male | Female |
| Under 5 Years | 0 (0.0%) | 0 (0.0%) |
| 5 to 17 Years | 0 (0.0%) | 0 (0.0%) |
| 18 to 34 Years | 0 (0.0%) | 0 (0.0%) |
| 35 to 64 Years | 5 (13.5%) | 2 (5.0%) |
| 65 to 74 Years | 3 (14.3%) | 0 (0.0%) |
| 75 Years and over | 1 (16.7%) | 9 (13.0%) |
Disability Class: Vision Difficulty
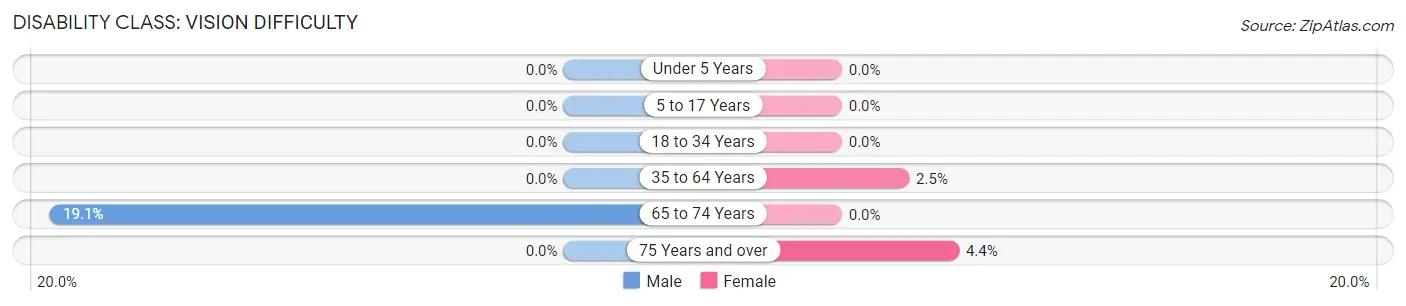
| Age Bracket | Male | Female |
| Under 5 Years | 0 (0.0%) | 0 (0.0%) |
| 5 to 17 Years | 0 (0.0%) | 0 (0.0%) |
| 18 to 34 Years | 0 (0.0%) | 0 (0.0%) |
| 35 to 64 Years | 0 (0.0%) | 1 (2.5%) |
| 65 to 74 Years | 4 (19.1%) | 0 (0.0%) |
| 75 Years and over | 0 (0.0%) | 3 (4.3%) |
Disability Class: Cognitive Difficulty
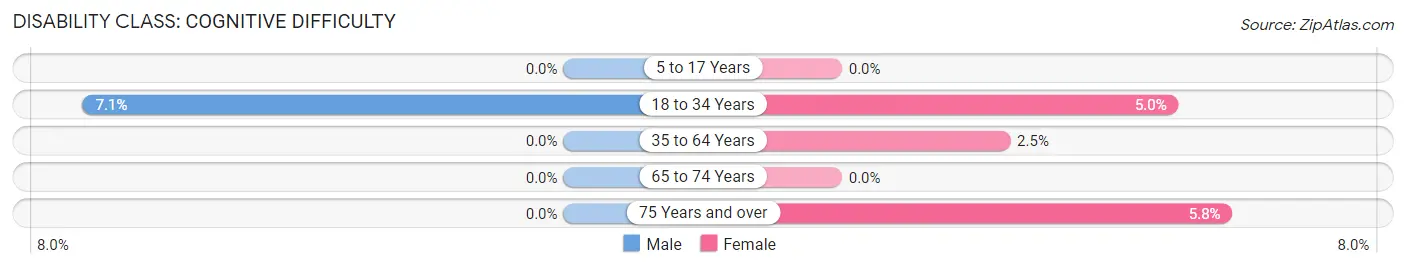
| Age Bracket | Male | Female |
| 5 to 17 Years | 0 (0.0%) | 0 (0.0%) |
| 18 to 34 Years | 1 (7.1%) | 1 (5.0%) |
| 35 to 64 Years | 0 (0.0%) | 1 (2.5%) |
| 65 to 74 Years | 0 (0.0%) | 0 (0.0%) |
| 75 Years and over | 0 (0.0%) | 4 (5.8%) |
Disability Class: Ambulatory Difficulty
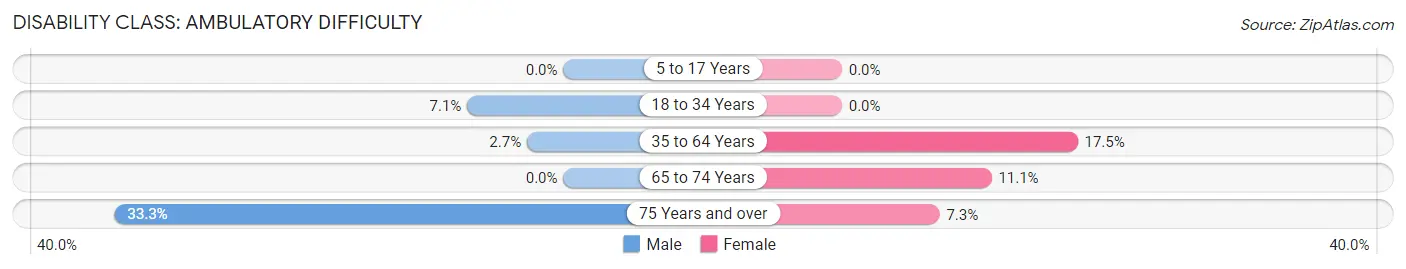
| Age Bracket | Male | Female |
| 5 to 17 Years | 0 (0.0%) | 0 (0.0%) |
| 18 to 34 Years | 1 (7.1%) | 0 (0.0%) |
| 35 to 64 Years | 1 (2.7%) | 7 (17.5%) |
| 65 to 74 Years | 0 (0.0%) | 2 (11.1%) |
| 75 Years and over | 2 (33.3%) | 5 (7.2%) |
Disability Class: Self-Care Difficulty
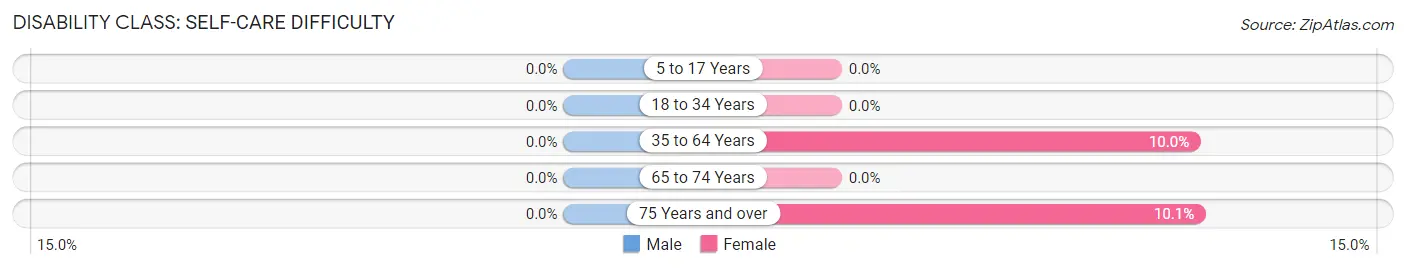
| Age Bracket | Male | Female |
| 5 to 17 Years | 0 (0.0%) | 0 (0.0%) |
| 18 to 34 Years | 0 (0.0%) | 0 (0.0%) |
| 35 to 64 Years | 0 (0.0%) | 4 (10.0%) |
| 65 to 74 Years | 0 (0.0%) | 0 (0.0%) |
| 75 Years and over | 0 (0.0%) | 7 (10.1%) |
Technology Access in Bushton
Computing Device Access in Bushton
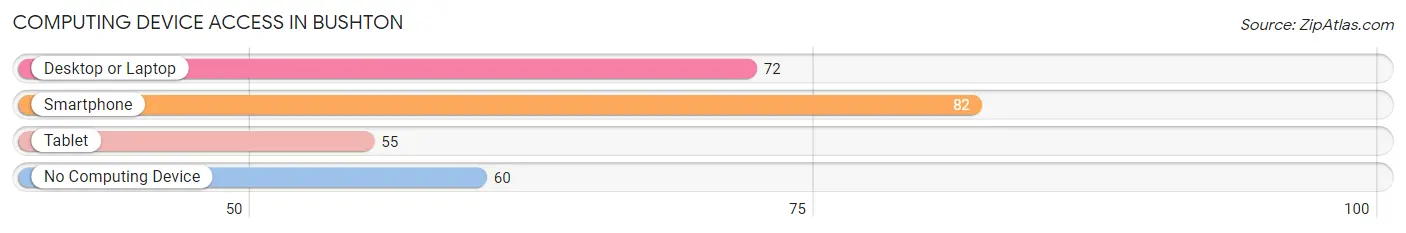
| Device Type | # Households | % Households |
| Desktop or Laptop | 72 | 48.6% |
| Smartphone | 82 | 55.4% |
| Tablet | 55 | 37.2% |
| No Computing Device | 60 | 40.5% |
| Total | 148 | 100.0% |
Internet Access in Bushton
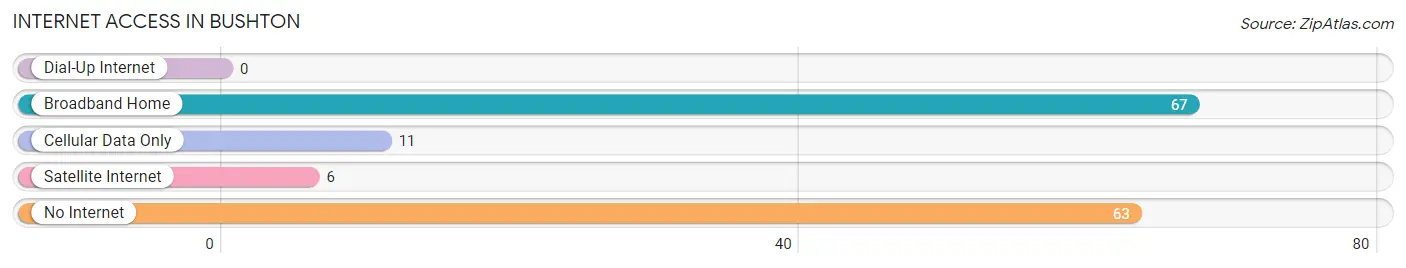
| Internet Type | # Households | % Households |
| Dial-Up Internet | 0 | 0.0% |
| Broadband Home | 67 | 45.3% |
| Cellular Data Only | 11 | 7.4% |
| Satellite Internet | 6 | 4.1% |
| No Internet | 63 | 42.6% |
| Total | 148 | 100.0% |
Bushton Summary
Bushton is a small town located in Rice County, Kansas, United States. The population was estimated to be around 200 people in 2020. The town was founded in 1887 and is named after the first settler, William Bush.
Geography
Bushton is located at 38°25'25" North, 98°14'45" West (38.423, -98.246). It is situated in the Central Plains region of Kansas, about 25 miles south of the city of Hutchinson. The town is located on the banks of the Little Arkansas River, which flows through the area. The terrain is mostly flat, with some rolling hills in the area. The average elevation is 1,400 feet above sea level.
Climate
Bushton has a humid continental climate, with hot summers and cold winters. The average annual temperature is around 54°F, with an average high of around 86°F in the summer and an average low of around 22°F in the winter. The average annual precipitation is around 28 inches, with most of it falling in the spring and summer months.
Demographics
As of the 2010 census, there were 200 people living in Bushton. The racial makeup of the town was 97.5% White, 0.5% African American, 0.5% Native American, 0.5% Asian, and 1.0% from two or more races. The median age was 44.7 years, with 24.5% of the population under the age of 18 and 11.5% over the age of 65. The median household income was $37,500, and the median family income was $41,250.
Economy
Bushton is a small, rural town with a limited economy. The main industries in the area are agriculture and tourism. The town is home to several small businesses, including a grocery store, a hardware store, and a few restaurants. The town also has a few small manufacturing companies that produce agricultural equipment and other products.
History
Bushton was founded in 1887 by William Bush, who was the first settler in the area. The town was originally called Bushtonville, but the name was changed to Bushton in 1895. The town was incorporated in 1901 and has remained a small, rural community ever since.
Bushton has a long history of agriculture, with the first settlers growing wheat, corn, and other crops. The town also had a thriving dairy industry in the early 1900s. In the 1950s, the town began to diversify its economy, with the opening of several small businesses.
Today, Bushton is a small, rural town with a limited economy. The town is home to several small businesses, including a grocery store, a hardware store, and a few restaurants. The town also has a few small manufacturing companies that produce agricultural equipment and other products.
Common Questions
What is Per Capita Income in Bushton?
Per Capita income in Bushton is $27,432.
What is the Median Family Income in Bushton?
Median Family Income in Bushton is $65,938.
What is the Median Household income in Bushton?
Median Household Income in Bushton is $24,943.
What is Income or Wage Gap in Bushton?
Income or Wage Gap in Bushton is 9.0%.
Women in Bushton earn 91.0 cents for every dollar earned by a man.
What is Inequality or Gini Index in Bushton?
Inequality or Gini Index in Bushton is 0.46.
What is the Total Population of Bushton?
Total Population of Bushton is 276.
What is the Total Male Population of Bushton?
Total Male Population of Bushton is 109.
What is the Total Female Population of Bushton?
Total Female Population of Bushton is 167.
What is the Ratio of Males per 100 Females in Bushton?
There are 65.27 Males per 100 Females in Bushton.
What is the Ratio of Females per 100 Males in Bushton?
There are 153.21 Females per 100 Males in Bushton.
What is the Median Population Age in Bushton?
Median Population Age in Bushton is 60.0 Years.
What is the Average Family Size in Bushton
Average Family Size in Bushton is 2.8 People.
What is the Average Household Size in Bushton
Average Household Size in Bushton is 1.9 People.
How Large is the Labor Force in Bushton?
There are 92 People in the Labor Forcein in Bushton.
What is the Percentage of People in the Labor Force in Bushton?
39.3% of People are in the Labor Force in Bushton.
What is the Unemployment Rate in Bushton?
Unemployment Rate in Bushton is 1.1%.