Burns, KS Map & Demographics
Burns Map
Burns Overview
$18,762
PER CAPITA INCOME
$63,750
AVG FAMILY INCOME
$43,125
AVG HOUSEHOLD INCOME
0.39
INEQUALITY / GINI INDEX
295
TOTAL POPULATION
174
MALE POPULATION
121
FEMALE POPULATION
143.80
MALES / 100 FEMALES
69.54
FEMALES / 100 MALES
26.5
MEDIAN AGE
4.2
AVG FAMILY SIZE
3.5
AVG HOUSEHOLD SIZE
136
LABOR FORCE [ PEOPLE ]
59.9%
PERCENT IN LABOR FORCE
10.3%
UNEMPLOYMENT RATE
Burns Zip Codes
Burns Area Codes
Income in Burns
Income Overview in Burns
Per Capita Income in Burns is $18,762, while median incomes of families and households are $63,750 and $43,125 respectively.
| Characteristic | Number | Measure |
| Per Capita Income | 295 | $18,762 |
| Median Family Income | 58 | $63,750 |
| Mean Family Income | 58 | $64,214 |
| Median Household Income | 84 | $43,125 |
| Mean Household Income | 84 | $54,960 |
| Income Deficit | 58 | $0 |
| Wage / Income Gap (%) | 295 | 0.00% |
| Wage / Income Gap ($) | 295 | 100.00¢ per $1 |
| Gini / Inequality Index | 295 | 0.39 |
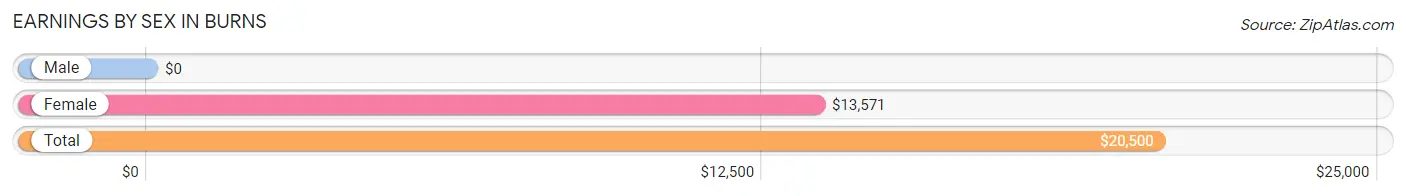
Earnings by Sex in Burns
| Sex | Number | Average Earnings |
| Male | 92 (61.3%) | $0 |
| Female | 58 (38.7%) | $13,571 |
| Total | 150 (100.0%) | $20,500 |
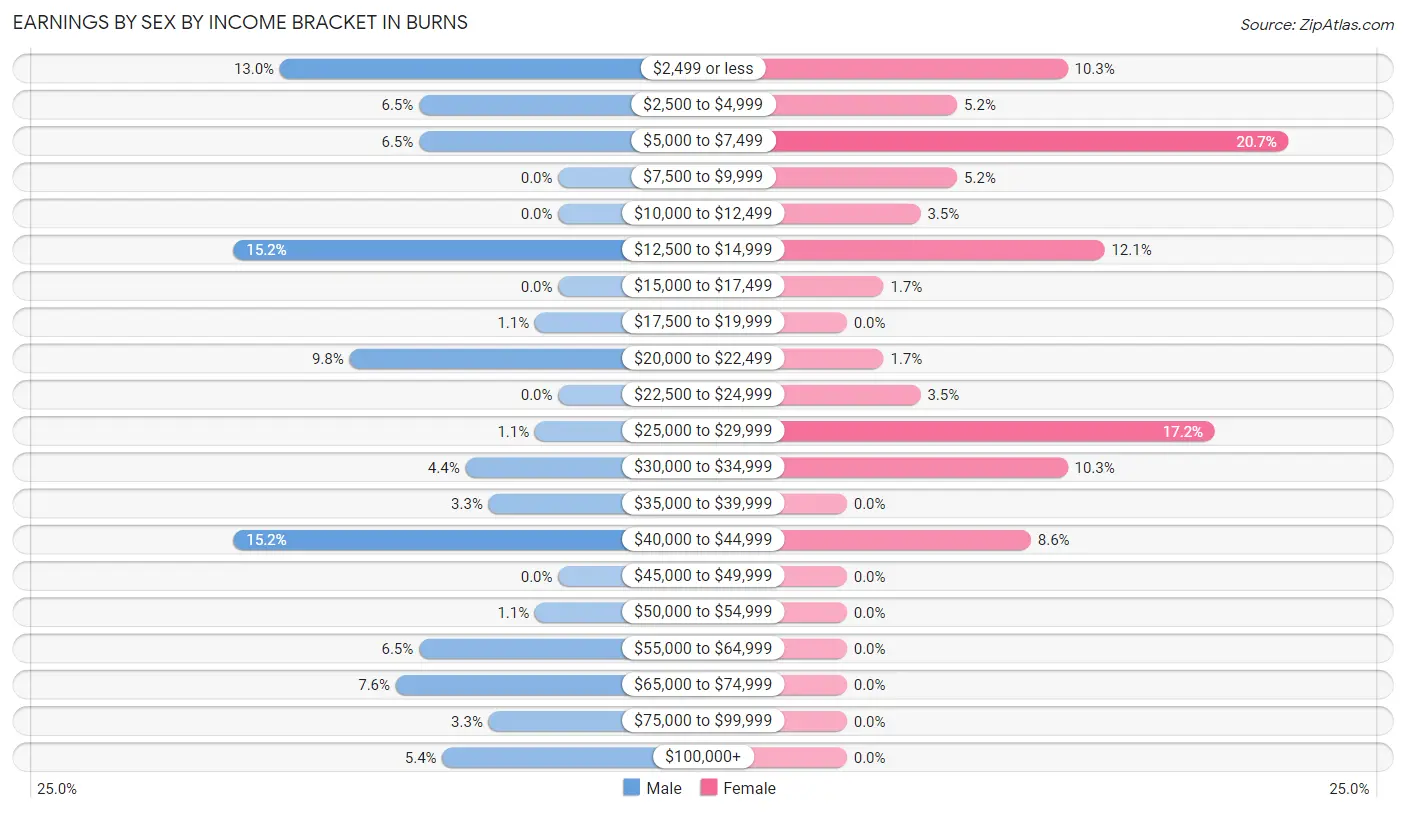
Earnings by Sex by Income Bracket in Burns
The most common earnings brackets in Burns are $12,500 to $14,999 for men (14 | 15.2%) and $5,000 to $7,499 for women (12 | 20.7%).
| Income | Male | Female |
| $2,499 or less | 12 (13.0%) | 6 (10.3%) |
| $2,500 to $4,999 | 6 (6.5%) | 3 (5.2%) |
| $5,000 to $7,499 | 6 (6.5%) | 12 (20.7%) |
| $7,500 to $9,999 | 0 (0.0%) | 3 (5.2%) |
| $10,000 to $12,499 | 0 (0.0%) | 2 (3.5%) |
| $12,500 to $14,999 | 14 (15.2%) | 7 (12.1%) |
| $15,000 to $17,499 | 0 (0.0%) | 1 (1.7%) |
| $17,500 to $19,999 | 1 (1.1%) | 0 (0.0%) |
| $20,000 to $22,499 | 9 (9.8%) | 1 (1.7%) |
| $22,500 to $24,999 | 0 (0.0%) | 2 (3.5%) |
| $25,000 to $29,999 | 1 (1.1%) | 10 (17.2%) |
| $30,000 to $34,999 | 4 (4.3%) | 6 (10.3%) |
| $35,000 to $39,999 | 3 (3.3%) | 0 (0.0%) |
| $40,000 to $44,999 | 14 (15.2%) | 5 (8.6%) |
| $45,000 to $49,999 | 0 (0.0%) | 0 (0.0%) |
| $50,000 to $54,999 | 1 (1.1%) | 0 (0.0%) |
| $55,000 to $64,999 | 6 (6.5%) | 0 (0.0%) |
| $65,000 to $74,999 | 7 (7.6%) | 0 (0.0%) |
| $75,000 to $99,999 | 3 (3.3%) | 0 (0.0%) |
| $100,000+ | 5 (5.4%) | 0 (0.0%) |
| Total | 92 (100.0%) | 58 (100.0%) |
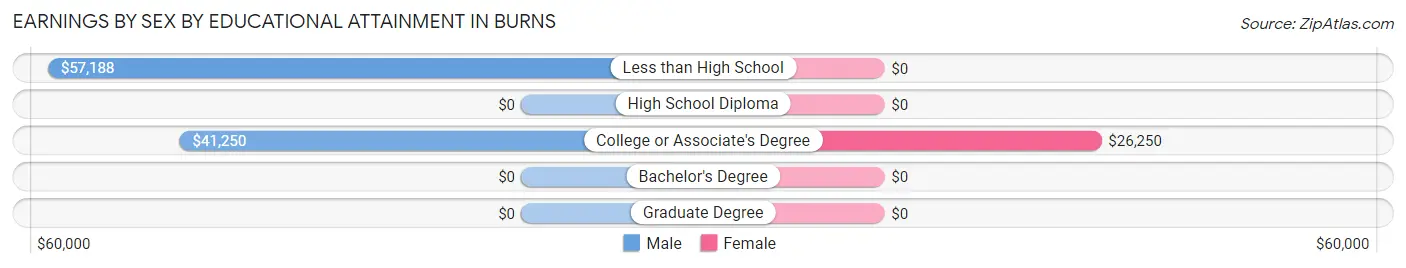
Earnings by Sex by Educational Attainment in Burns
Average earnings in Burns are $55,625 for men and $25,000 for women, a difference of 55.1%. Men with an educational attainment of less than high school enjoy the highest average annual earnings of $57,188, while those with college or associate's degree education earn the least with $41,250. Women with an educational attainment of college or associate's degree earn the most with the average annual earnings of $26,250, while those with college or associate's degree education have the smallest earnings of $26,250.
| Educational Attainment | Male Income | Female Income |
| Less than High School | $57,188 | $0 |
| High School Diploma | - | - |
| College or Associate's Degree | $41,250 | $26,250 |
| Bachelor's Degree | - | - |
| Graduate Degree | - | - |
| Total | $55,625 | $25,000 |
Family Income in Burns
Family Income Brackets in Burns
According to the Burns family income data, there are 16 families falling into the $15,000 to $24,999 income range, which is the most common income bracket and makes up 27.6% of all families.
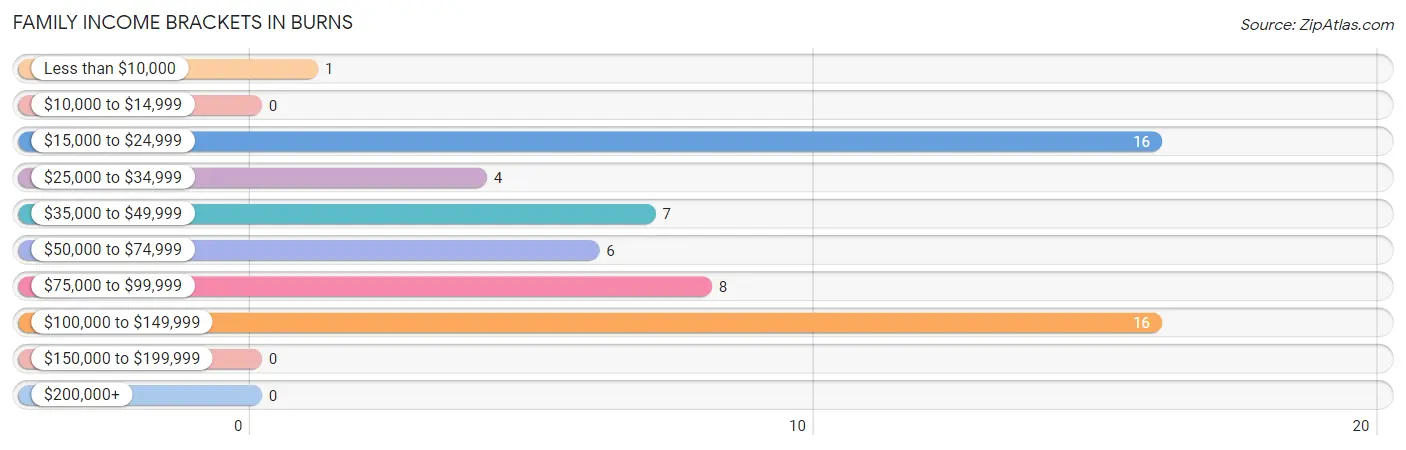
| Income Bracket | # Families | % Families |
| Less than $10,000 | 1 | 1.7% |
| $10,000 to $14,999 | 0 | 0.0% |
| $15,000 to $24,999 | 16 | 27.6% |
| $25,000 to $34,999 | 4 | 6.9% |
| $35,000 to $49,999 | 7 | 12.1% |
| $50,000 to $74,999 | 6 | 10.3% |
| $75,000 to $99,999 | 8 | 13.8% |
| $100,000 to $149,999 | 16 | 27.6% |
| $150,000 to $199,999 | 0 | 0.0% |
| $200,000+ | 0 | 0.0% |
Family Income by Famaliy Size in Burns
4-person families (11 | 19.0%) account for the highest median family income in Burns with $106,875 per family, while 2-person families (22 | 37.9%) have the highest median income of $36,750 per family member.
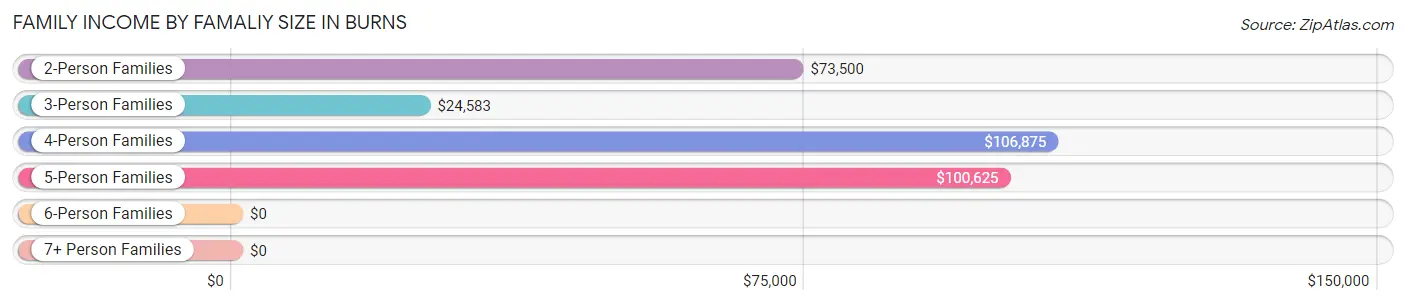
| Income Bracket | # Families | Median Income |
| 2-Person Families | 22 (37.9%) | $73,500 |
| 3-Person Families | 12 (20.7%) | $24,583 |
| 4-Person Families | 11 (19.0%) | $106,875 |
| 5-Person Families | 5 (8.6%) | $100,625 |
| 6-Person Families | 7 (12.1%) | $0 |
| 7+ Person Families | 1 (1.7%) | $0 |
| Total | 58 (100.0%) | $63,750 |
Family Income by Number of Earners in Burns
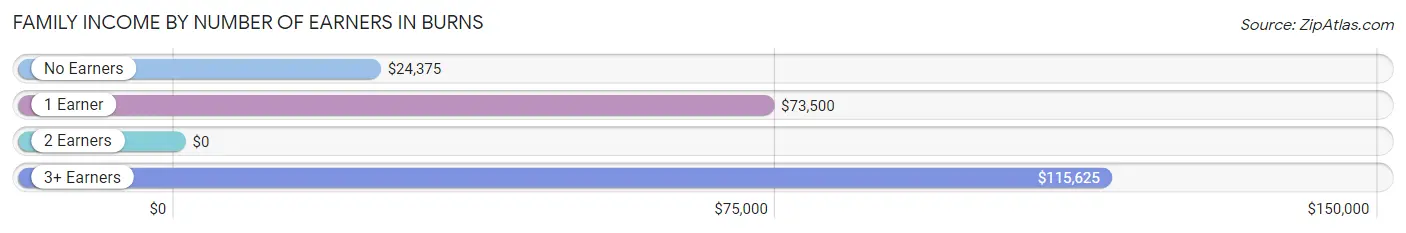
| Number of Earners | # Families | Median Income |
| No Earners | 14 (24.1%) | $24,375 |
| 1 Earner | 22 (37.9%) | $73,500 |
| 2 Earners | 10 (17.2%) | $0 |
| 3+ Earners | 12 (20.7%) | $115,625 |
| Total | 58 (100.0%) | $63,750 |
Household Income in Burns
Household Income Brackets in Burns
With 18 households falling in the category, the $15,000 to $24,999 income range is the most frequent in Burns, accounting for 21.4% of all households.
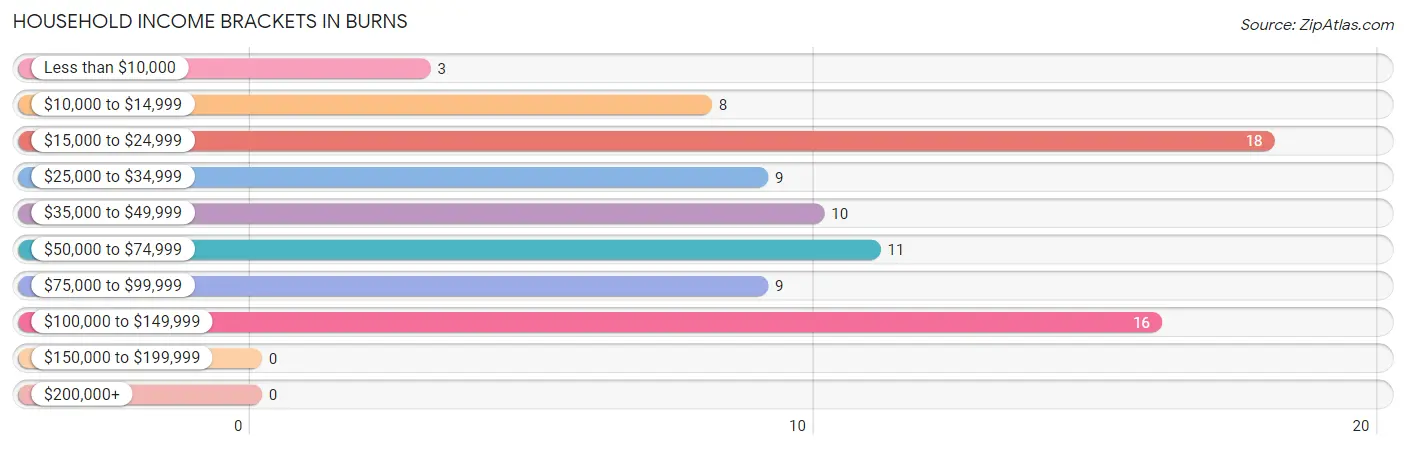
| Income Bracket | # Households | % Households |
| Less than $10,000 | 3 | 3.6% |
| $10,000 to $14,999 | 8 | 9.5% |
| $15,000 to $24,999 | 18 | 21.4% |
| $25,000 to $34,999 | 9 | 10.7% |
| $35,000 to $49,999 | 10 | 11.9% |
| $50,000 to $74,999 | 11 | 13.1% |
| $75,000 to $99,999 | 9 | 10.7% |
| $100,000 to $149,999 | 16 | 19.0% |
| $150,000 to $199,999 | 0 | 0.0% |
| $200,000+ | 0 | 0.0% |
Household Income by Householder Age in Burns
The median household income in Burns is $43,125, with the highest median household income of $87,500 found in the 45 to 64 years age bracket for the primary householder. A total of 36 households (42.9%) fall into this category. Meanwhile, the 15 to 24 years age bracket for the primary householder has the lowest median household income of $0, with 3 households (3.6%) in this group.
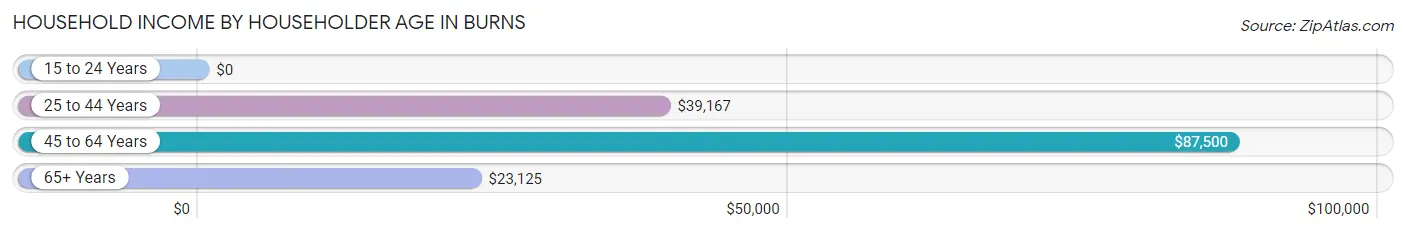
| Income Bracket | # Households | Median Income |
| 15 to 24 Years | 3 (3.6%) | $0 |
| 25 to 44 Years | 22 (26.2%) | $39,167 |
| 45 to 64 Years | 36 (42.9%) | $87,500 |
| 65+ Years | 23 (27.4%) | $23,125 |
| Total | 84 (100.0%) | $43,125 |
Poverty in Burns
Income Below Poverty by Sex and Age in Burns
With 27.8% poverty level for males and 39.7% for females among the residents of Burns, 16 and 17 year old males and under 5 year old females are the most vulnerable to poverty, with 8 males (80.0%) and 14 females (93.3%) in their respective age groups living below the poverty level.
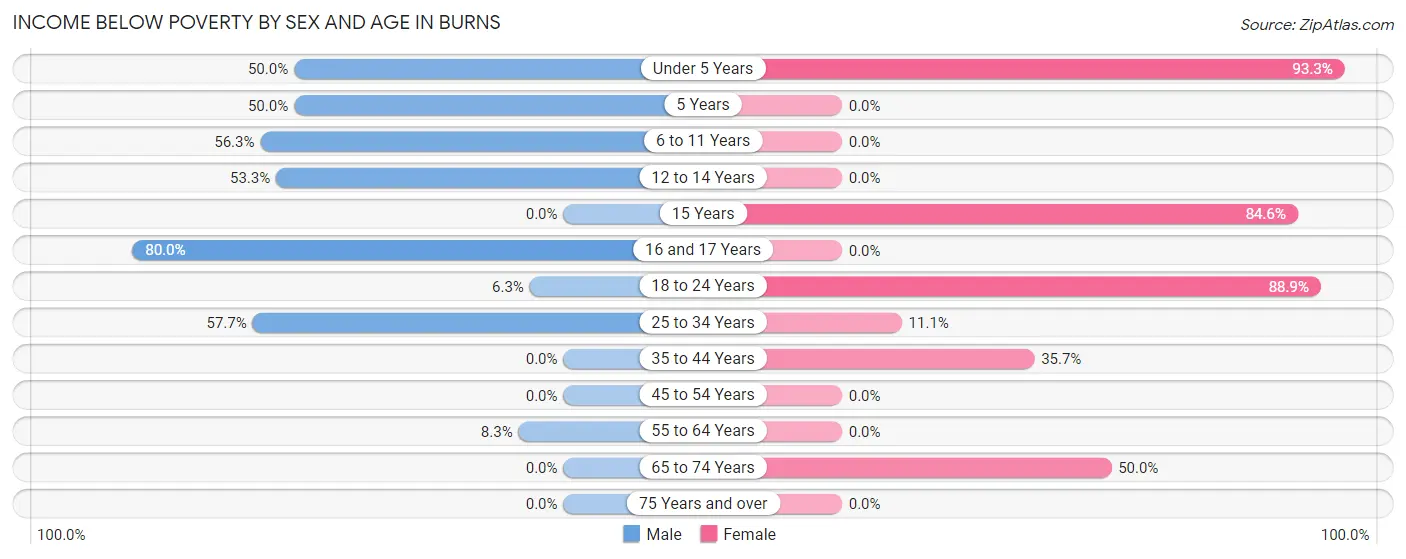
| Age Bracket | Male | Female |
| Under 5 Years | 1 (50.0%) | 14 (93.3%) |
| 5 Years | 2 (50.0%) | 0 (0.0%) |
| 6 to 11 Years | 9 (56.2%) | 0 (0.0%) |
| 12 to 14 Years | 8 (53.3%) | 0 (0.0%) |
| 15 Years | 0 (0.0%) | 11 (84.6%) |
| 16 and 17 Years | 8 (80.0%) | 0 (0.0%) |
| 18 to 24 Years | 3 (6.2%) | 8 (88.9%) |
| 25 to 34 Years | 15 (57.7%) | 2 (11.1%) |
| 35 to 44 Years | 0 (0.0%) | 5 (35.7%) |
| 45 to 54 Years | 0 (0.0%) | 0 (0.0%) |
| 55 to 64 Years | 2 (8.3%) | 0 (0.0%) |
| 65 to 74 Years | 0 (0.0%) | 8 (50.0%) |
| 75 Years and over | 0 (0.0%) | 0 (0.0%) |
| Total | 48 (27.8%) | 48 (39.7%) |
Income Above Poverty by Sex and Age in Burns
According to the poverty statistics in Burns, males aged 35 to 44 years and females aged 6 to 11 years are the age groups that are most secure financially, with 100.0% of males and 100.0% of females in these age groups living above the poverty line.
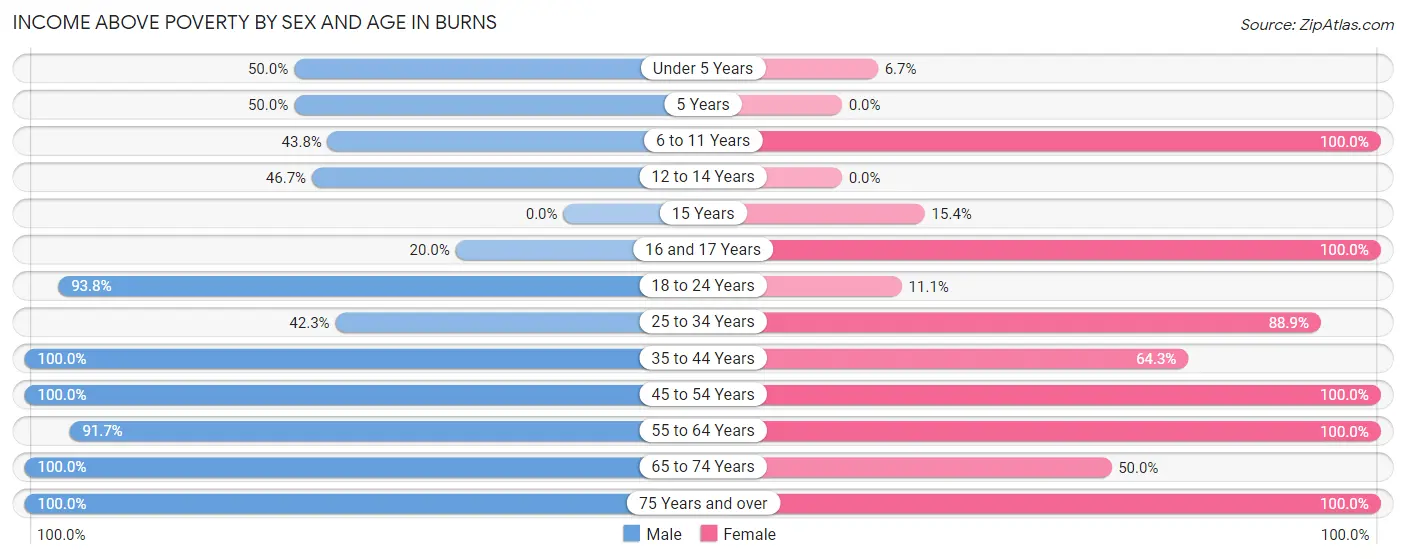
| Age Bracket | Male | Female |
| Under 5 Years | 1 (50.0%) | 1 (6.7%) |
| 5 Years | 2 (50.0%) | 0 (0.0%) |
| 6 to 11 Years | 7 (43.8%) | 2 (100.0%) |
| 12 to 14 Years | 7 (46.7%) | 0 (0.0%) |
| 15 Years | 0 (0.0%) | 2 (15.4%) |
| 16 and 17 Years | 2 (20.0%) | 7 (100.0%) |
| 18 to 24 Years | 45 (93.8%) | 1 (11.1%) |
| 25 to 34 Years | 11 (42.3%) | 16 (88.9%) |
| 35 to 44 Years | 5 (100.0%) | 9 (64.3%) |
| 45 to 54 Years | 10 (100.0%) | 16 (100.0%) |
| 55 to 64 Years | 22 (91.7%) | 6 (100.0%) |
| 65 to 74 Years | 11 (100.0%) | 8 (50.0%) |
| 75 Years and over | 2 (100.0%) | 5 (100.0%) |
| Total | 125 (72.3%) | 73 (60.3%) |
Income Below Poverty Among Married-Couple Families in Burns
The poverty statistics for married-couple families in Burns show that 5.3% or 2 of the total 38 families live below the poverty line. Families with 3 or 4 children have the highest poverty rate of 28.6%, comprising of 2 families. On the other hand, families with no children have the lowest poverty rate of 0.0%, which includes 0 families.
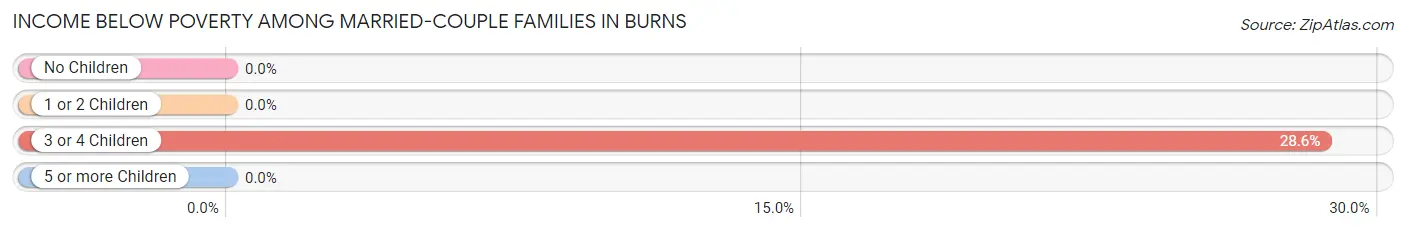
| Children | Above Poverty | Below Poverty |
| No Children | 26 (100.0%) | 0 (0.0%) |
| 1 or 2 Children | 5 (100.0%) | 0 (0.0%) |
| 3 or 4 Children | 5 (71.4%) | 2 (28.6%) |
| 5 or more Children | 0 (0.0%) | 0 (0.0%) |
| Total | 36 (94.7%) | 2 (5.3%) |
Income Below Poverty Among Single-Parent Households in Burns
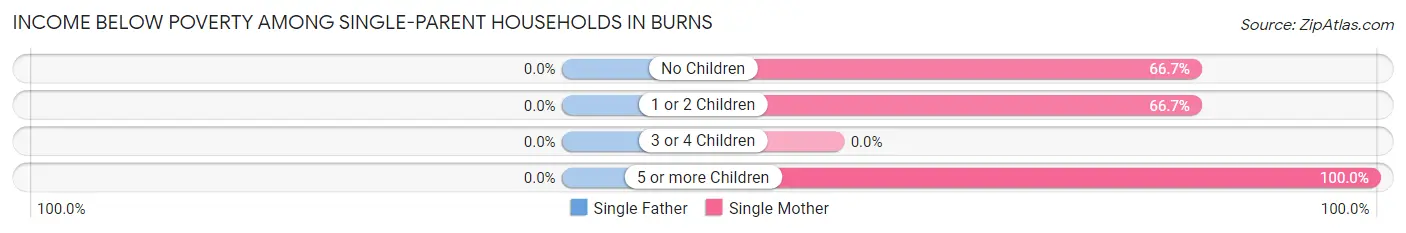
| Children | Single Father | Single Mother |
| No Children | 0 (0.0%) | 2 (66.7%) |
| 1 or 2 Children | 0 (0.0%) | 2 (66.7%) |
| 3 or 4 Children | 0 (0.0%) | 0 (0.0%) |
| 5 or more Children | 0 (0.0%) | 5 (100.0%) |
| Total | 0 (0.0%) | 9 (69.2%) |
Income Below Poverty Among Married-Couple vs Single-Parent Households in Burns
The poverty data for Burns shows that 2 of the married-couple family households (5.3%) and 9 of the single-parent households (45.0%) are living below the poverty level. Within the married-couple family households, those with 3 or 4 children have the highest poverty rate, with 2 households (28.6%) falling below the poverty line. Among the single-parent households, those with 5 or more children have the highest poverty rate, with 5 household (100.0%) living below poverty.
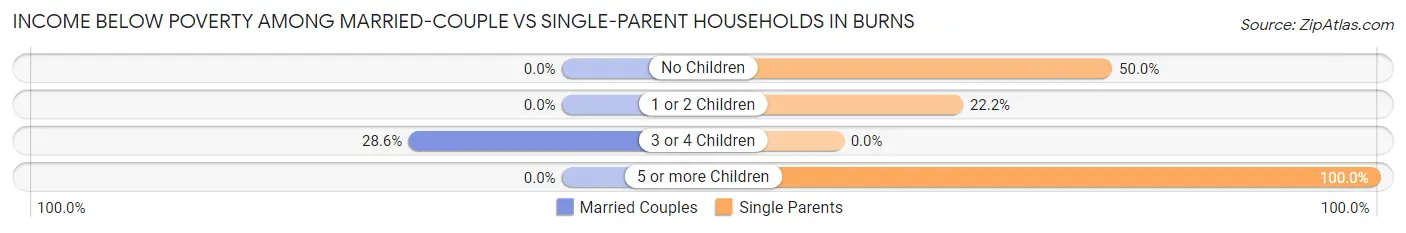
| Children | Married-Couple Families | Single-Parent Households |
| No Children | 0 (0.0%) | 2 (50.0%) |
| 1 or 2 Children | 0 (0.0%) | 2 (22.2%) |
| 3 or 4 Children | 2 (28.6%) | 0 (0.0%) |
| 5 or more Children | 0 (0.0%) | 5 (100.0%) |
| Total | 2 (5.3%) | 9 (45.0%) |
Race in Burns
The most populous races in Burns are White / Caucasian (284 | 96.3%), Hispanic or Latino (14 | 4.8%), and Some other Race (6 | 2.0%).
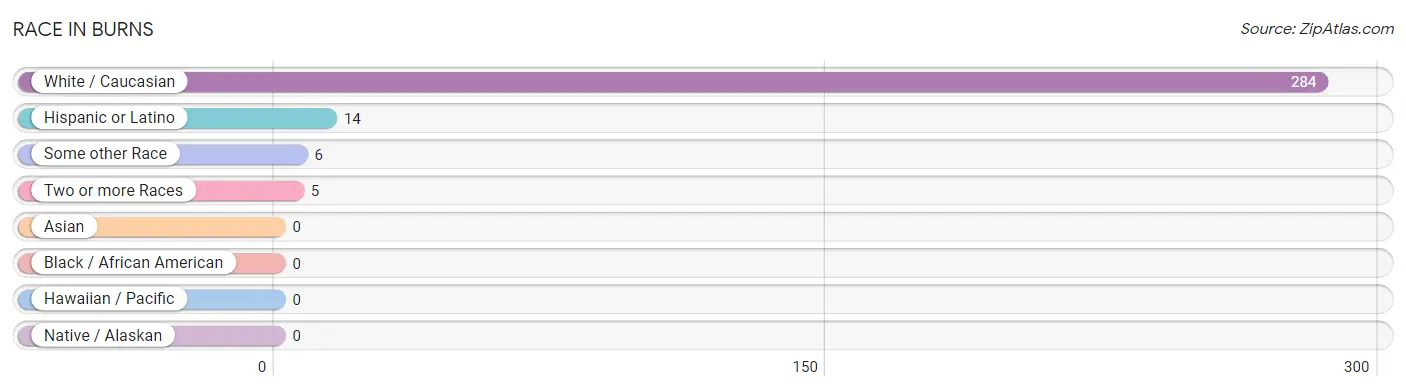
| Race | # Population | % Population |
| Asian | 0 | 0.0% |
| Black / African American | 0 | 0.0% |
| Hawaiian / Pacific | 0 | 0.0% |
| Hispanic or Latino | 14 | 4.8% |
| Native / Alaskan | 0 | 0.0% |
| White / Caucasian | 284 | 96.3% |
| Two or more Races | 5 | 1.7% |
| Some other Race | 6 | 2.0% |
| Total | 295 | 100.0% |
Ancestry in Burns
The most populous ancestries reported in Burns are German (62 | 21.0%), Irish (50 | 17.0%), English (31 | 10.5%), American (19 | 6.4%), and Russian (17 | 5.8%), together accounting for 60.7% of all Burns residents.
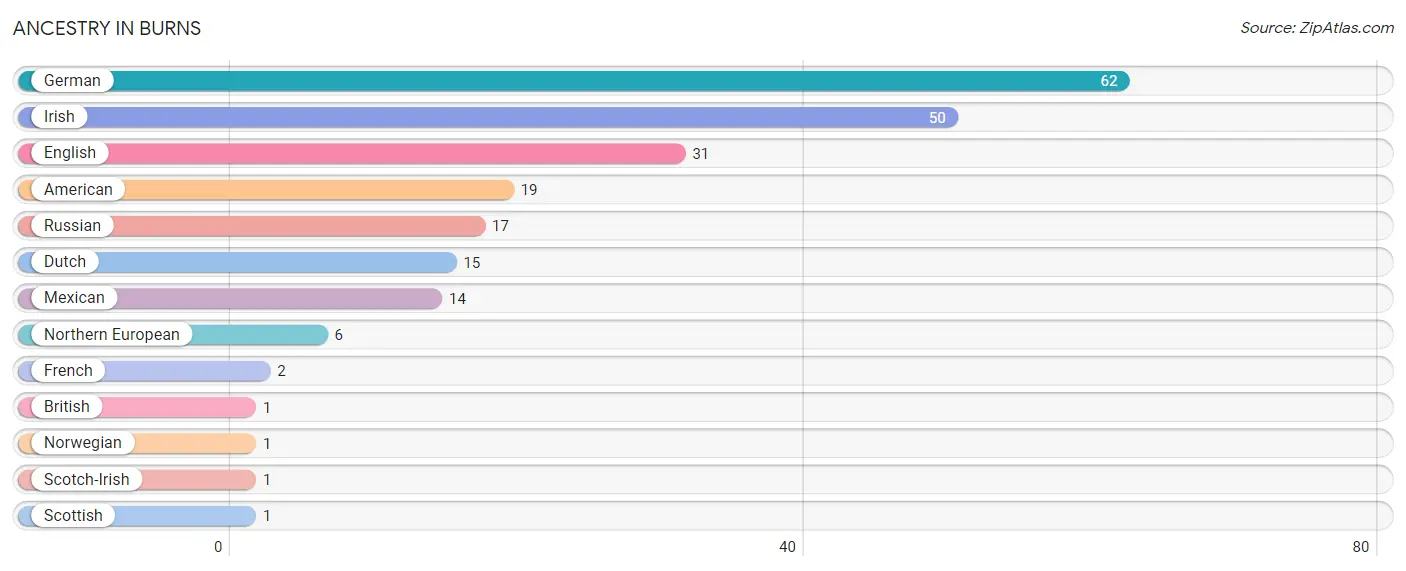
| Ancestry | # Population | % Population |
| American | 19 | 6.4% |
| British | 1 | 0.3% |
| Dutch | 15 | 5.1% |
| English | 31 | 10.5% |
| French | 2 | 0.7% |
| German | 62 | 21.0% |
| Irish | 50 | 17.0% |
| Mexican | 14 | 4.8% |
| Northern European | 6 | 2.0% |
| Norwegian | 1 | 0.3% |
| Russian | 17 | 5.8% |
| Scotch-Irish | 1 | 0.3% |
| Scottish | 1 | 0.3% | View All 13 Rows |
Immigrants in Burns

| Immigration Origin | # Population | % Population | View All 0 Rows |
Sex and Age in Burns
Sex and Age in Burns
The most populous age groups in Burns are 20 to 24 Years (34 | 19.5%) for men and 15 to 19 Years (22 | 18.2%) for women.
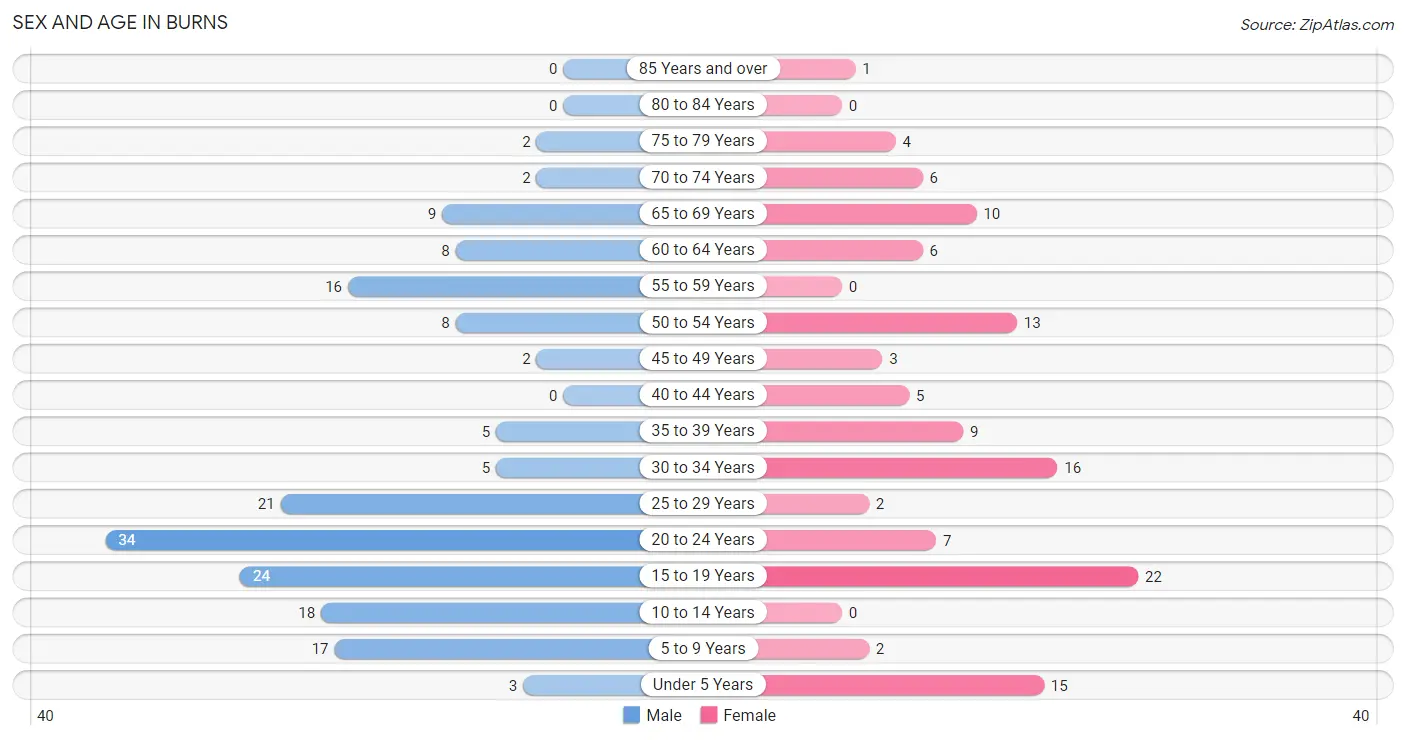
| Age Bracket | Male | Female |
| Under 5 Years | 3 (1.7%) | 15 (12.4%) |
| 5 to 9 Years | 17 (9.8%) | 2 (1.7%) |
| 10 to 14 Years | 18 (10.3%) | 0 (0.0%) |
| 15 to 19 Years | 24 (13.8%) | 22 (18.2%) |
| 20 to 24 Years | 34 (19.5%) | 7 (5.8%) |
| 25 to 29 Years | 21 (12.1%) | 2 (1.7%) |
| 30 to 34 Years | 5 (2.9%) | 16 (13.2%) |
| 35 to 39 Years | 5 (2.9%) | 9 (7.4%) |
| 40 to 44 Years | 0 (0.0%) | 5 (4.1%) |
| 45 to 49 Years | 2 (1.1%) | 3 (2.5%) |
| 50 to 54 Years | 8 (4.6%) | 13 (10.7%) |
| 55 to 59 Years | 16 (9.2%) | 0 (0.0%) |
| 60 to 64 Years | 8 (4.6%) | 6 (5.0%) |
| 65 to 69 Years | 9 (5.2%) | 10 (8.3%) |
| 70 to 74 Years | 2 (1.1%) | 6 (5.0%) |
| 75 to 79 Years | 2 (1.1%) | 4 (3.3%) |
| 80 to 84 Years | 0 (0.0%) | 0 (0.0%) |
| 85 Years and over | 0 (0.0%) | 1 (0.8%) |
| Total | 174 (100.0%) | 121 (100.0%) |
Families and Households in Burns
Median Family Size in Burns
The median family size in Burns is 4.24 persons per family, with single female/mother families (13 | 22.4%) accounting for the largest median family size of 5.85 persons per family. On the other hand, single male/father families (7 | 12.1%) represent the smallest median family size with 2.00 persons per family.
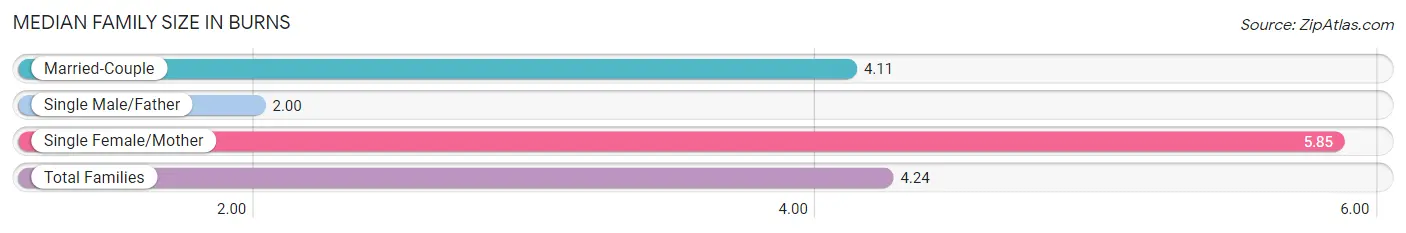
| Family Type | # Families | Family Size |
| Married-Couple | 38 (65.5%) | 4.11 |
| Single Male/Father | 7 (12.1%) | 2.00 |
| Single Female/Mother | 13 (22.4%) | 5.85 |
| Total Families | 58 (100.0%) | 4.24 |
Median Household Size in Burns
The median household size in Burns is 3.51 persons per household, with single female/mother households (13 | 15.5%) accounting for the largest median household size of 7 persons per household. non-family households (26 | 30.9%) represent the smallest median household size with 1.15 persons per household.
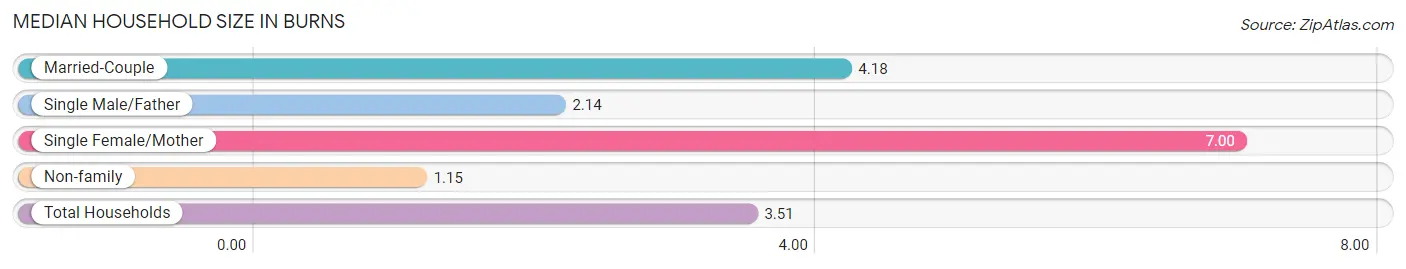
| Household Type | # Households | Household Size |
| Married-Couple | 38 (45.2%) | 4.18 |
| Single Male/Father | 7 (8.3%) | 2.14 |
| Single Female/Mother | 13 (15.5%) | 7.00 |
| Non-family | 26 (30.9%) | 1.15 |
| Total Households | 84 (100.0%) | 3.51 |
Household Size by Marriage Status in Burns
Out of a total of 84 households in Burns, 58 (69.1%) are family households, while 26 (30.9%) are nonfamily households. The most numerous type of family households are 3-person households, comprising 17, and the most common type of nonfamily households are 1-person households, comprising 24.
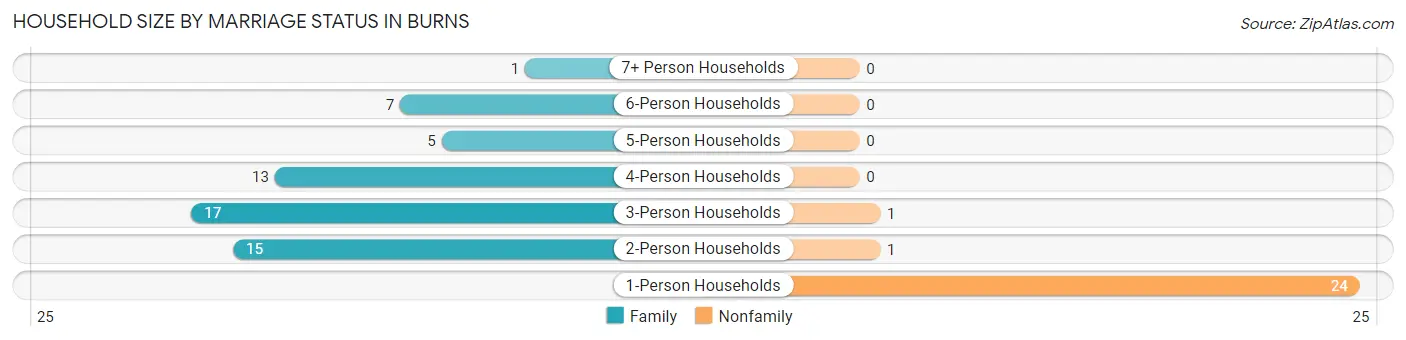
| Household Size | Family Households | Nonfamily Households |
| 1-Person Households | - | 24 (28.6%) |
| 2-Person Households | 15 (17.9%) | 1 (1.2%) |
| 3-Person Households | 17 (20.2%) | 1 (1.2%) |
| 4-Person Households | 13 (15.5%) | 0 (0.0%) |
| 5-Person Households | 5 (5.9%) | 0 (0.0%) |
| 6-Person Households | 7 (8.3%) | 0 (0.0%) |
| 7+ Person Households | 1 (1.2%) | 0 (0.0%) |
| Total | 58 (69.1%) | 26 (30.9%) |
Female Fertility in Burns
Fertility by Age in Burns
Average fertility rate in Burns is 31.0 births per 1,000 women. Women in the age bracket of 15 to 19 years have the highest fertility rate with 45.0 births per 1,000 women. Women in the age bracket of 15 to 19 years acount for 50.0% of all women with births.
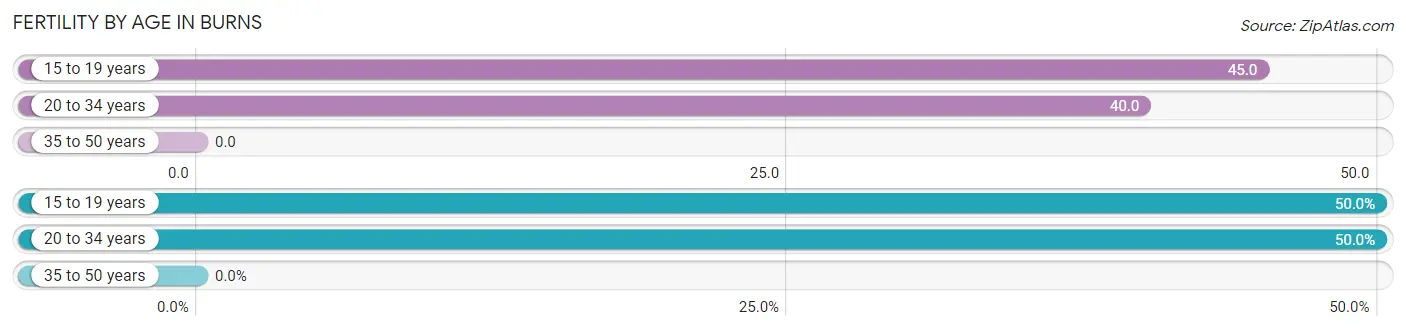
| Age Bracket | Women with Births | Births / 1,000 Women |
| 15 to 19 years | 1 (50.0%) | 45.0 |
| 20 to 34 years | 1 (50.0%) | 40.0 |
| 35 to 50 years | 0 (0.0%) | 0.0 |
| Total | 2 (100.0%) | 31.0 |
Fertility by Age by Marriage Status in Burns
50.0% of women with births (2) in Burns are married. The highest percentage of unmarried women with births falls into 15 to 19 years age bracket with 100.0% of them unmarried at the time of birth, while the lowest percentage of unmarried women with births belong to 20 to 34 years age bracket with 0.0% of them unmarried.
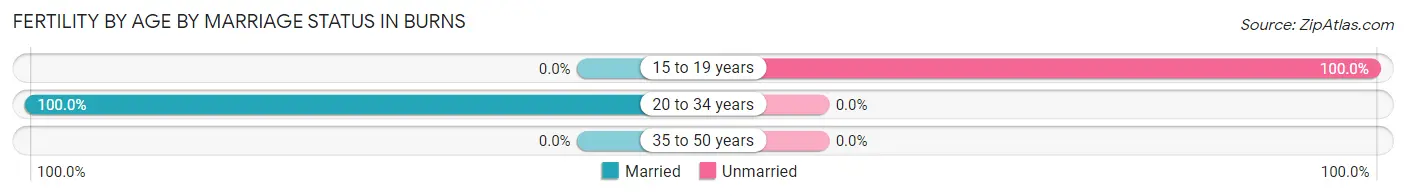
| Age Bracket | Married | Unmarried |
| 15 to 19 years | 0 (0.0%) | 1 (100.0%) |
| 20 to 34 years | 1 (100.0%) | 0 (0.0%) |
| 35 to 50 years | 0 (0.0%) | 0 (0.0%) |
| Total | 1 (50.0%) | 1 (50.0%) |
Fertility by Education in Burns
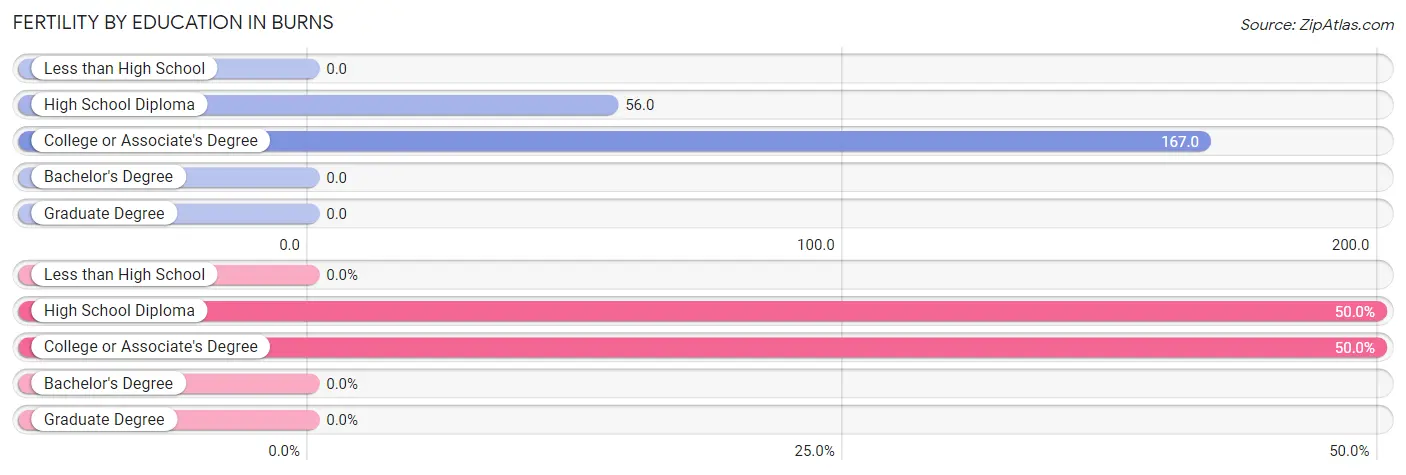
| Educational Attainment | Women with Births | Births / 1,000 Women |
| Less than High School | 0 (0.0%) | 0.0 |
| High School Diploma | 1 (50.0%) | 56.0 |
| College or Associate's Degree | 1 (50.0%) | 167.0 |
| Bachelor's Degree | 0 (0.0%) | 0.0 |
| Graduate Degree | 0 (0.0%) | 0.0 |
| Total | 2 (100.0%) | 31.0 |
Fertility by Education by Marriage Status in Burns
50.0% of women with births in Burns are unmarried. Women with the educational attainment of high school diploma are most likely to be married with 100.0% of them married at childbirth, while women with the educational attainment of college or associate's degree are least likely to be married with 100.0% of them unmarried at childbirth.
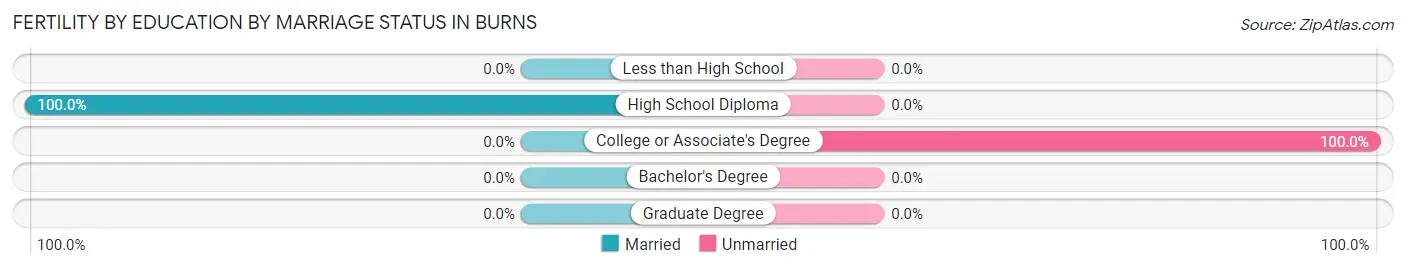
| Educational Attainment | Married | Unmarried |
| Less than High School | 0 (0.0%) | 0 (0.0%) |
| High School Diploma | 1 (100.0%) | 0 (0.0%) |
| College or Associate's Degree | 0 (0.0%) | 1 (100.0%) |
| Bachelor's Degree | 0 (0.0%) | 0 (0.0%) |
| Graduate Degree | 0 (0.0%) | 0 (0.0%) |
| Total | 1 (50.0%) | 1 (50.0%) |
Employment Characteristics in Burns
Employment by Class of Employer in Burns
Among the 119 employed individuals in Burns, private company employees (92 | 77.3%), not-for-profit organizations (14 | 11.8%), and local government employees (10 | 8.4%) make up the most common classes of employment.
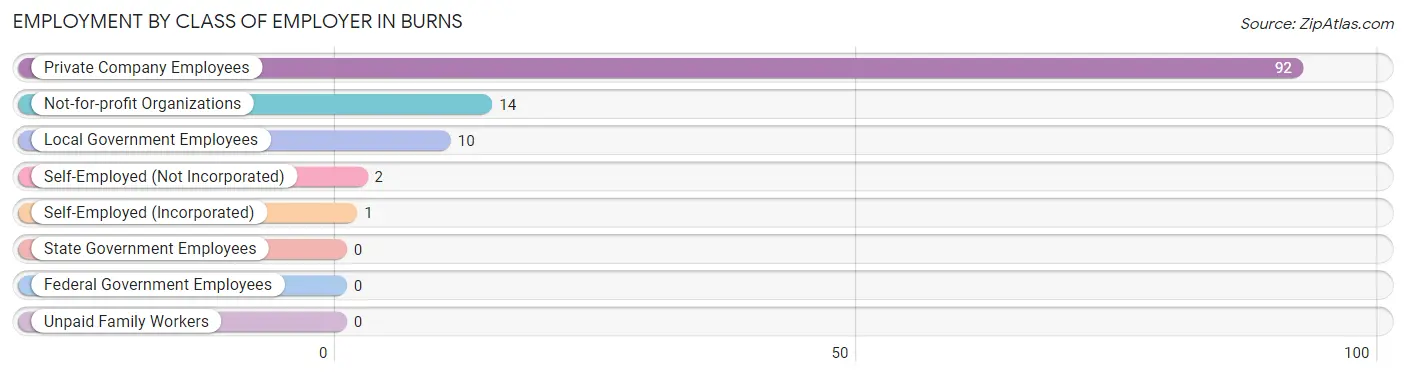
| Employer Class | # Employees | % Employees |
| Private Company Employees | 92 | 77.3% |
| Self-Employed (Incorporated) | 1 | 0.8% |
| Self-Employed (Not Incorporated) | 2 | 1.7% |
| Not-for-profit Organizations | 14 | 11.8% |
| Local Government Employees | 10 | 8.4% |
| State Government Employees | 0 | 0.0% |
| Federal Government Employees | 0 | 0.0% |
| Unpaid Family Workers | 0 | 0.0% |
| Total | 119 | 100.0% |
Employment Status by Age in Burns
According to the labor force statistics for Burns, out of the total population over 16 years of age (227), 59.9% or 136 individuals are in the labor force, with 10.3% or 14 of them unemployed. The age group with the highest labor force participation rate is 16 to 19 years, with 100.0% or 33 individuals in the labor force. Within the labor force, the 20 to 24 years age range has the highest percentage of unemployed individuals, with 43.8% or 14 of them being unemployed.
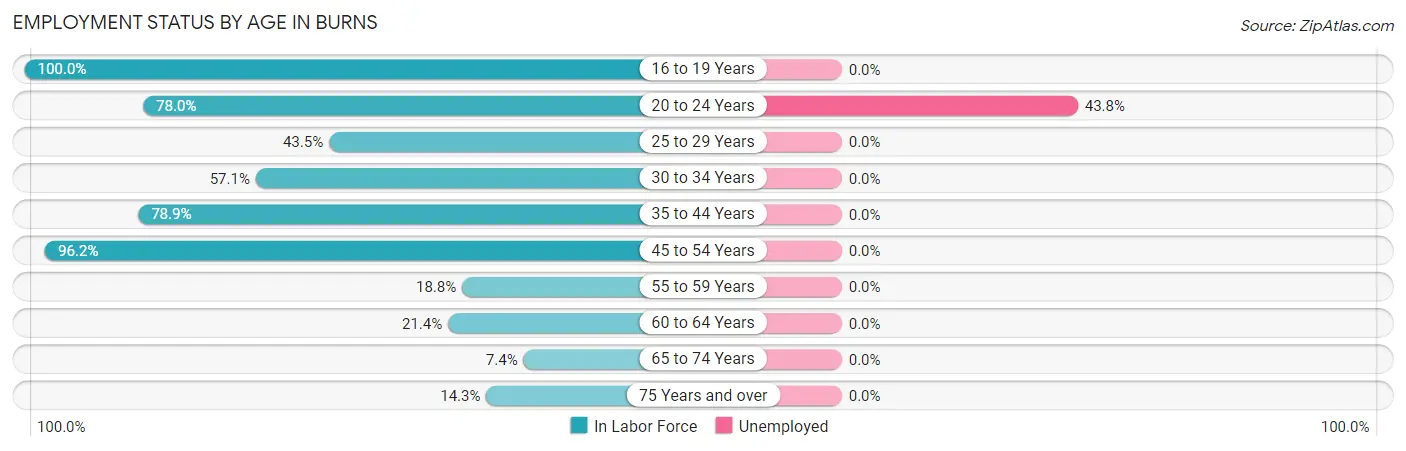
| Age Bracket | In Labor Force | Unemployed |
| 16 to 19 Years | 33 (100.0%) | 0 (0.0%) |
| 20 to 24 Years | 32 (78.0%) | 14 (43.8%) |
| 25 to 29 Years | 10 (43.5%) | 0 (0.0%) |
| 30 to 34 Years | 12 (57.1%) | 0 (0.0%) |
| 35 to 44 Years | 15 (78.9%) | 0 (0.0%) |
| 45 to 54 Years | 25 (96.2%) | 0 (0.0%) |
| 55 to 59 Years | 3 (18.8%) | 0 (0.0%) |
| 60 to 64 Years | 3 (21.4%) | 0 (0.0%) |
| 65 to 74 Years | 2 (7.4%) | 0 (0.0%) |
| 75 Years and over | 1 (14.3%) | 0 (0.0%) |
| Total | 136 (59.9%) | 14 (10.3%) |
Employment Status by Educational Attainment in Burns
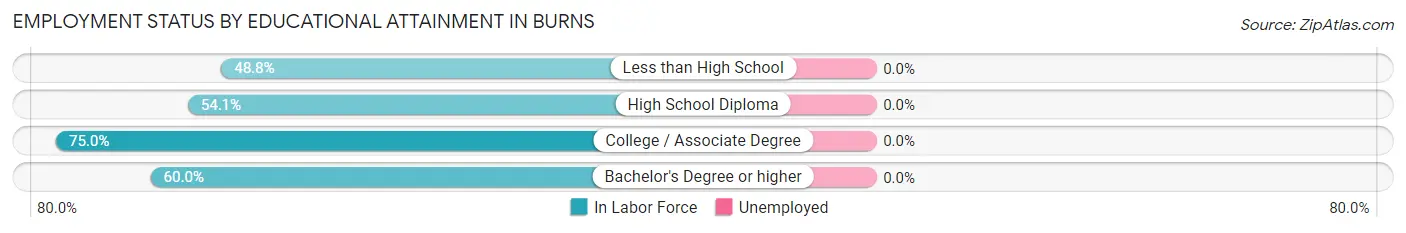
| Educational Attainment | In Labor Force | Unemployed |
| Less than High School | 21 (48.8%) | 0 (0.0%) |
| High School Diploma | 20 (54.1%) | 0 (0.0%) |
| College / Associate Degree | 18 (75.0%) | 0 (0.0%) |
| Bachelor's Degree or higher | 9 (60.0%) | 0 (0.0%) |
| Total | 68 (57.1%) | 0 (0.0%) |
Employment Occupations by Sex in Burns
Management, Business, Science and Arts Occupations
The most common Management, Business, Science and Arts occupations in Burns are Community & Social Service (21 | 17.2%), Education Instruction & Library (21 | 17.2%), Management (3 | 2.5%), Business & Financial (2 | 1.6%), and Computers, Engineering & Science (2 | 1.6%).
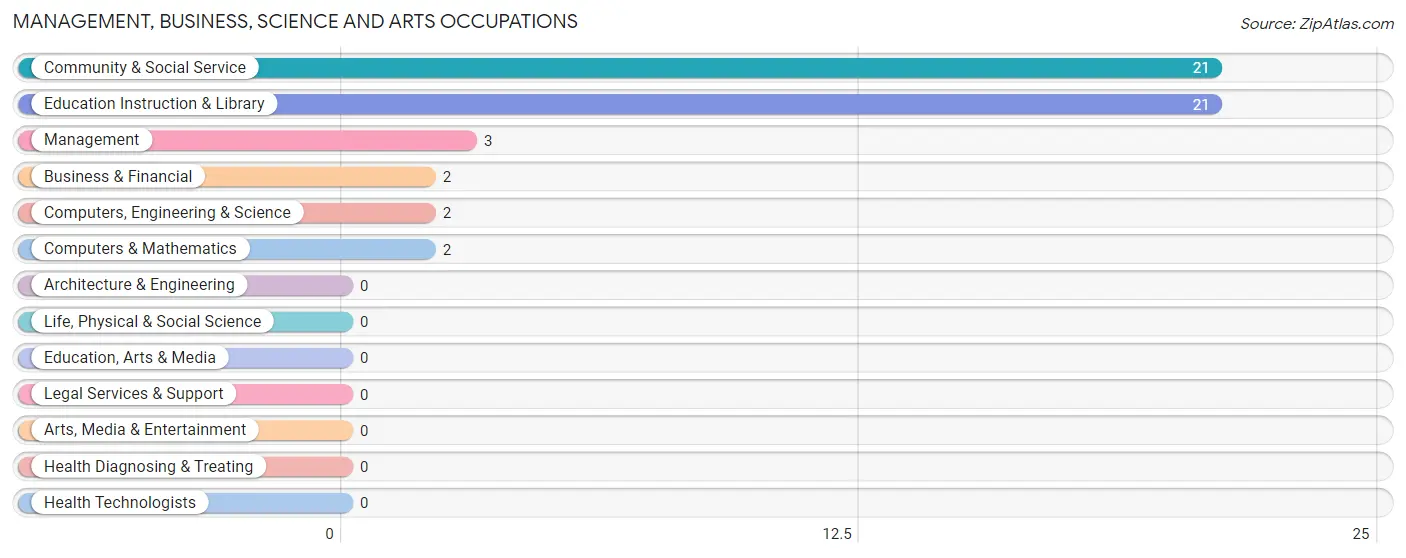
Management, Business, Science and Arts Occupations by Sex
Within the Management, Business, Science and Arts occupations in Burns, the most male-oriented occupations are Management (100.0%), Computers, Engineering & Science (100.0%), and Computers & Mathematics (100.0%), while the most female-oriented occupations are Business & Financial (100.0%), Community & Social Service (100.0%), and Education Instruction & Library (100.0%).
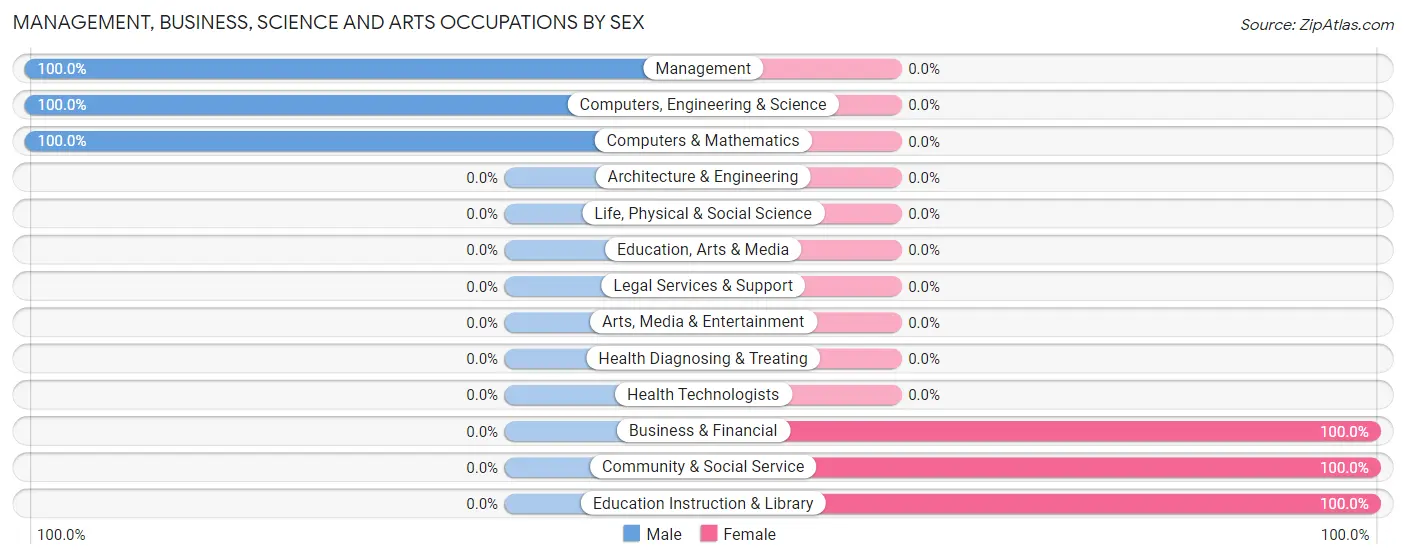
| Occupation | Male | Female |
| Management | 3 (100.0%) | 0 (0.0%) |
| Business & Financial | 0 (0.0%) | 2 (100.0%) |
| Computers, Engineering & Science | 2 (100.0%) | 0 (0.0%) |
| Computers & Mathematics | 2 (100.0%) | 0 (0.0%) |
| Architecture & Engineering | 0 (0.0%) | 0 (0.0%) |
| Life, Physical & Social Science | 0 (0.0%) | 0 (0.0%) |
| Community & Social Service | 0 (0.0%) | 21 (100.0%) |
| Education, Arts & Media | 0 (0.0%) | 0 (0.0%) |
| Legal Services & Support | 0 (0.0%) | 0 (0.0%) |
| Education Instruction & Library | 0 (0.0%) | 21 (100.0%) |
| Arts, Media & Entertainment | 0 (0.0%) | 0 (0.0%) |
| Health Diagnosing & Treating | 0 (0.0%) | 0 (0.0%) |
| Health Technologists | 0 (0.0%) | 0 (0.0%) |
| Total (Category) | 5 (17.9%) | 23 (82.1%) |
| Total (Overall) | 69 (56.6%) | 53 (43.4%) |
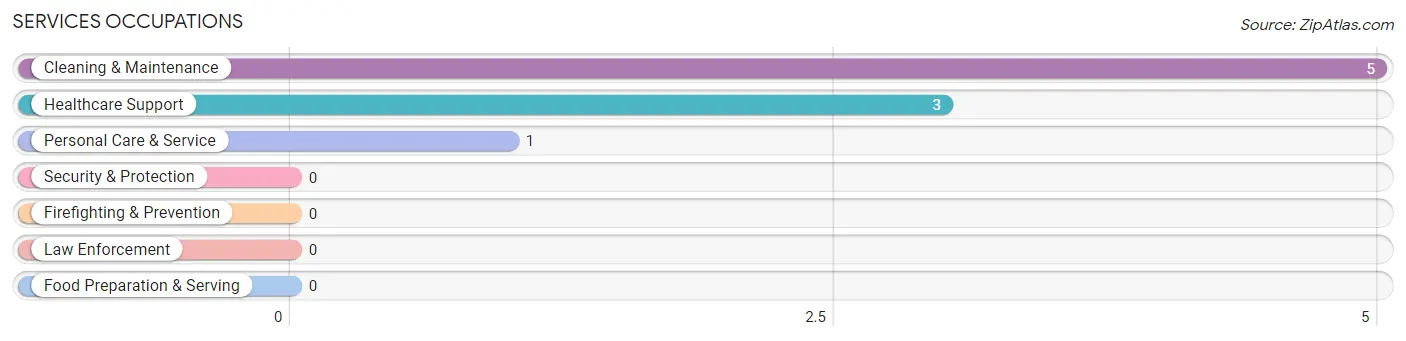
Services Occupations
The most common Services occupations in Burns are Cleaning & Maintenance (5 | 4.1%), Healthcare Support (3 | 2.5%), and Personal Care & Service (1 | 0.8%).
Services Occupations by Sex
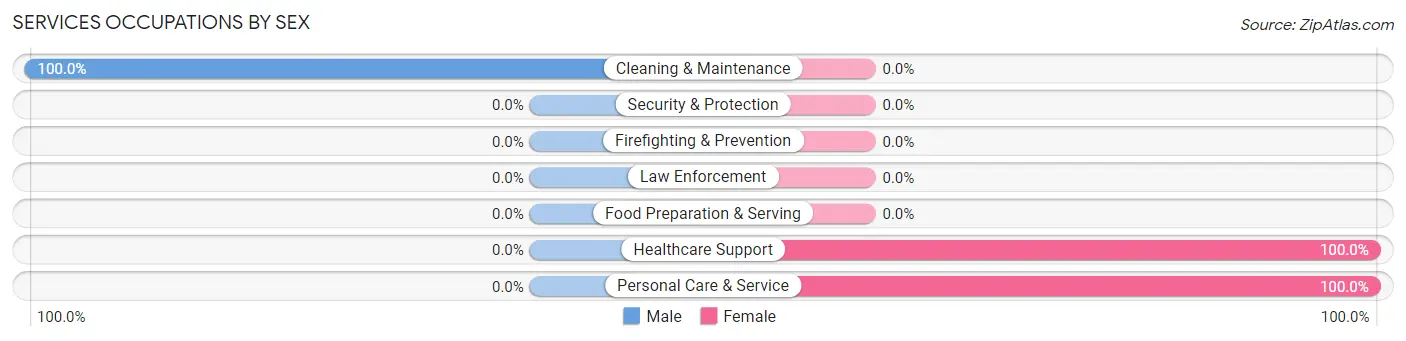
| Occupation | Male | Female |
| Healthcare Support | 0 (0.0%) | 3 (100.0%) |
| Security & Protection | 0 (0.0%) | 0 (0.0%) |
| Firefighting & Prevention | 0 (0.0%) | 0 (0.0%) |
| Law Enforcement | 0 (0.0%) | 0 (0.0%) |
| Food Preparation & Serving | 0 (0.0%) | 0 (0.0%) |
| Cleaning & Maintenance | 5 (100.0%) | 0 (0.0%) |
| Personal Care & Service | 0 (0.0%) | 1 (100.0%) |
| Total (Category) | 5 (55.6%) | 4 (44.4%) |
| Total (Overall) | 69 (56.6%) | 53 (43.4%) |
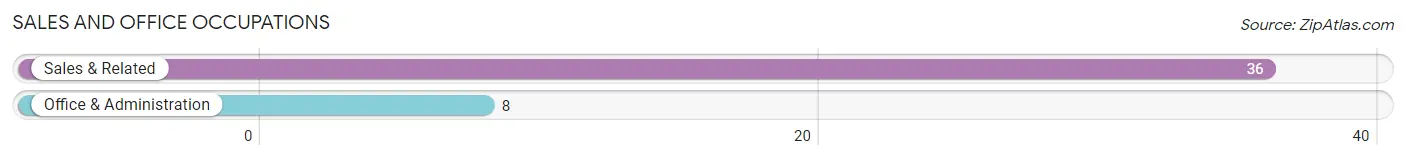
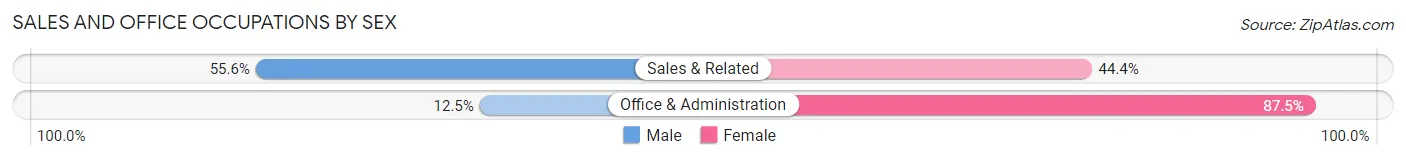
Sales and Office Occupations
The most common Sales and Office occupations in Burns are Sales & Related (36 | 29.5%), and Office & Administration (8 | 6.6%).
Sales and Office Occupations by Sex
| Occupation | Male | Female |
| Sales & Related | 20 (55.6%) | 16 (44.4%) |
| Office & Administration | 1 (12.5%) | 7 (87.5%) |
| Total (Category) | 21 (47.7%) | 23 (52.3%) |
| Total (Overall) | 69 (56.6%) | 53 (43.4%) |
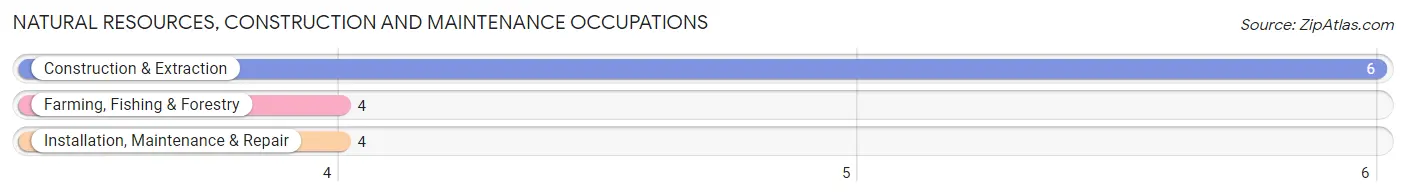
Natural Resources, Construction and Maintenance Occupations
The most common Natural Resources, Construction and Maintenance occupations in Burns are Construction & Extraction (6 | 4.9%), Farming, Fishing & Forestry (4 | 3.3%), and Installation, Maintenance & Repair (4 | 3.3%).
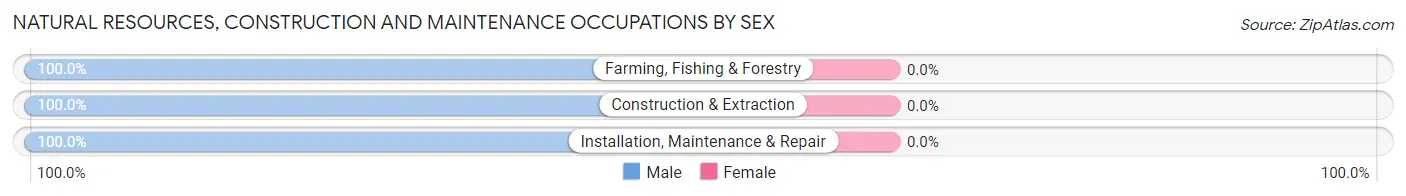
Natural Resources, Construction and Maintenance Occupations by Sex
| Occupation | Male | Female |
| Farming, Fishing & Forestry | 4 (100.0%) | 0 (0.0%) |
| Construction & Extraction | 6 (100.0%) | 0 (0.0%) |
| Installation, Maintenance & Repair | 4 (100.0%) | 0 (0.0%) |
| Total (Category) | 14 (100.0%) | 0 (0.0%) |
| Total (Overall) | 69 (56.6%) | 53 (43.4%) |
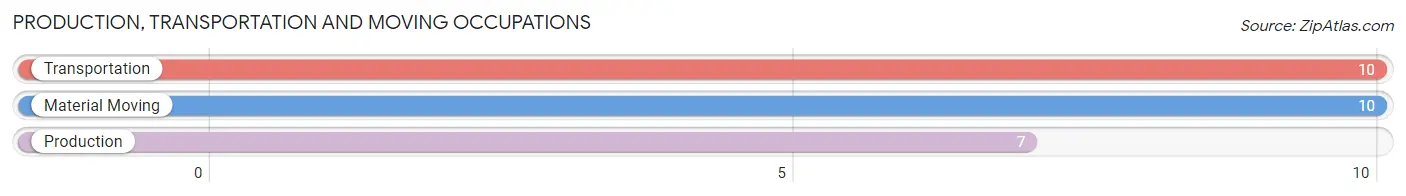
Production, Transportation and Moving Occupations
The most common Production, Transportation and Moving occupations in Burns are Transportation (10 | 8.2%), Material Moving (10 | 8.2%), and Production (7 | 5.7%).
Production, Transportation and Moving Occupations by Sex
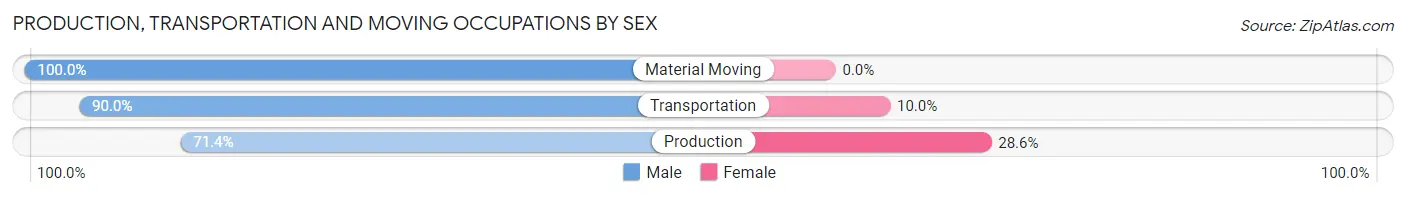
| Occupation | Male | Female |
| Production | 5 (71.4%) | 2 (28.6%) |
| Transportation | 9 (90.0%) | 1 (10.0%) |
| Material Moving | 10 (100.0%) | 0 (0.0%) |
| Total (Category) | 24 (88.9%) | 3 (11.1%) |
| Total (Overall) | 69 (56.6%) | 53 (43.4%) |
Employment Industries by Sex in Burns
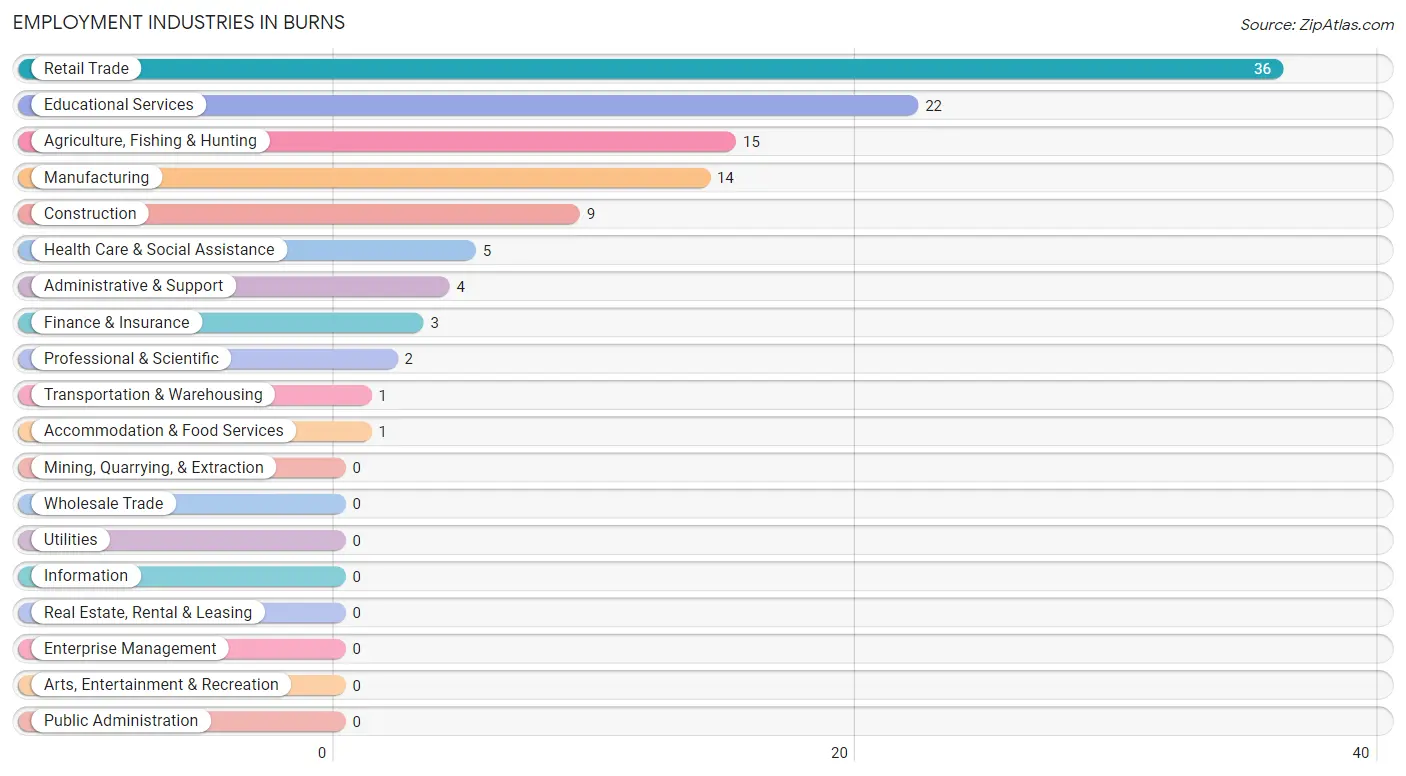
Employment Industries in Burns
The major employment industries in Burns include Retail Trade (36 | 29.5%), Educational Services (22 | 18.0%), Agriculture, Fishing & Hunting (15 | 12.3%), Manufacturing (14 | 11.5%), and Construction (9 | 7.4%).
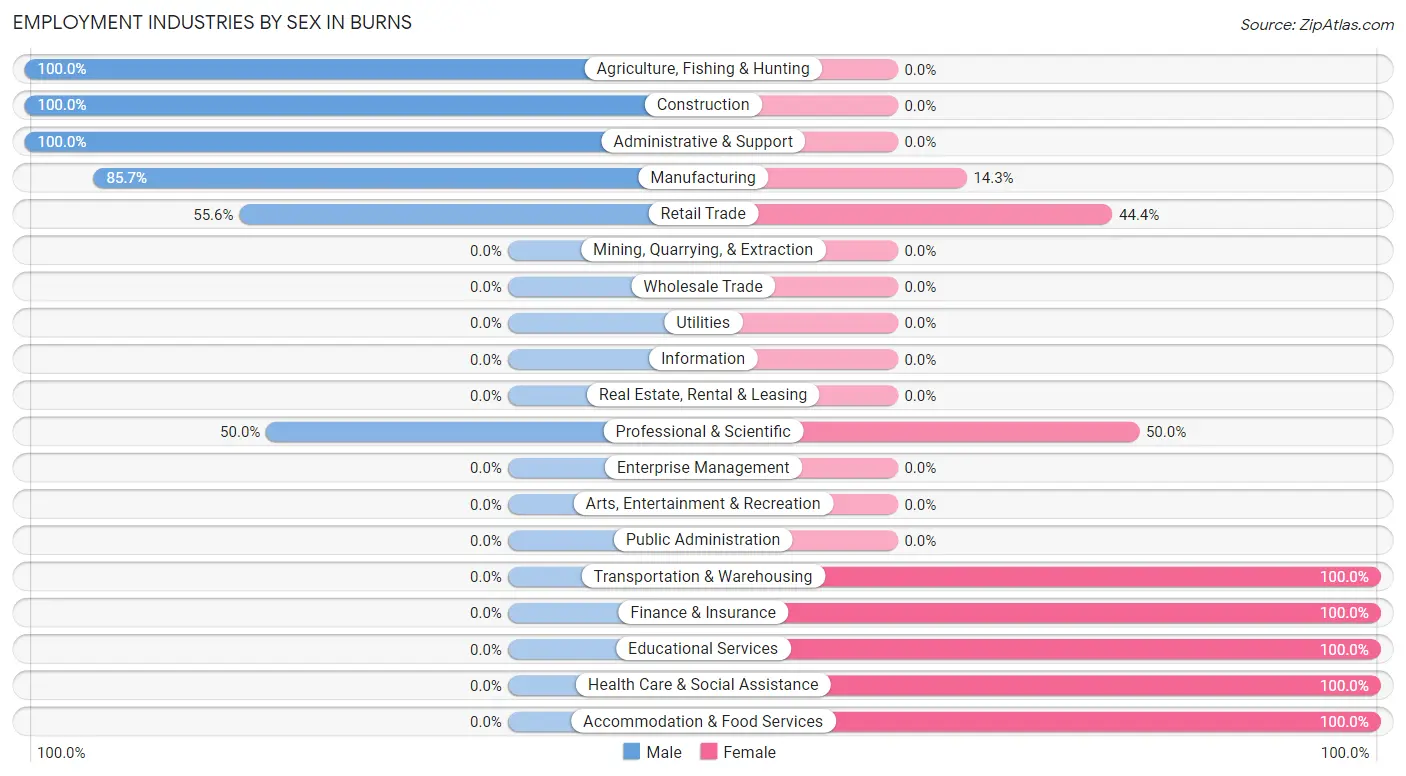
Employment Industries by Sex in Burns
The Burns industries that see more men than women are Agriculture, Fishing & Hunting (100.0%), Construction (100.0%), and Administrative & Support (100.0%), whereas the industries that tend to have a higher number of women are Transportation & Warehousing (100.0%), Finance & Insurance (100.0%), and Educational Services (100.0%).
| Industry | Male | Female |
| Agriculture, Fishing & Hunting | 15 (100.0%) | 0 (0.0%) |
| Mining, Quarrying, & Extraction | 0 (0.0%) | 0 (0.0%) |
| Construction | 9 (100.0%) | 0 (0.0%) |
| Manufacturing | 12 (85.7%) | 2 (14.3%) |
| Wholesale Trade | 0 (0.0%) | 0 (0.0%) |
| Retail Trade | 20 (55.6%) | 16 (44.4%) |
| Transportation & Warehousing | 0 (0.0%) | 1 (100.0%) |
| Utilities | 0 (0.0%) | 0 (0.0%) |
| Information | 0 (0.0%) | 0 (0.0%) |
| Finance & Insurance | 0 (0.0%) | 3 (100.0%) |
| Real Estate, Rental & Leasing | 0 (0.0%) | 0 (0.0%) |
| Professional & Scientific | 1 (50.0%) | 1 (50.0%) |
| Enterprise Management | 0 (0.0%) | 0 (0.0%) |
| Administrative & Support | 4 (100.0%) | 0 (0.0%) |
| Educational Services | 0 (0.0%) | 22 (100.0%) |
| Health Care & Social Assistance | 0 (0.0%) | 5 (100.0%) |
| Arts, Entertainment & Recreation | 0 (0.0%) | 0 (0.0%) |
| Accommodation & Food Services | 0 (0.0%) | 1 (100.0%) |
| Public Administration | 0 (0.0%) | 0 (0.0%) |
| Total | 69 (56.6%) | 53 (43.4%) |
Education in Burns
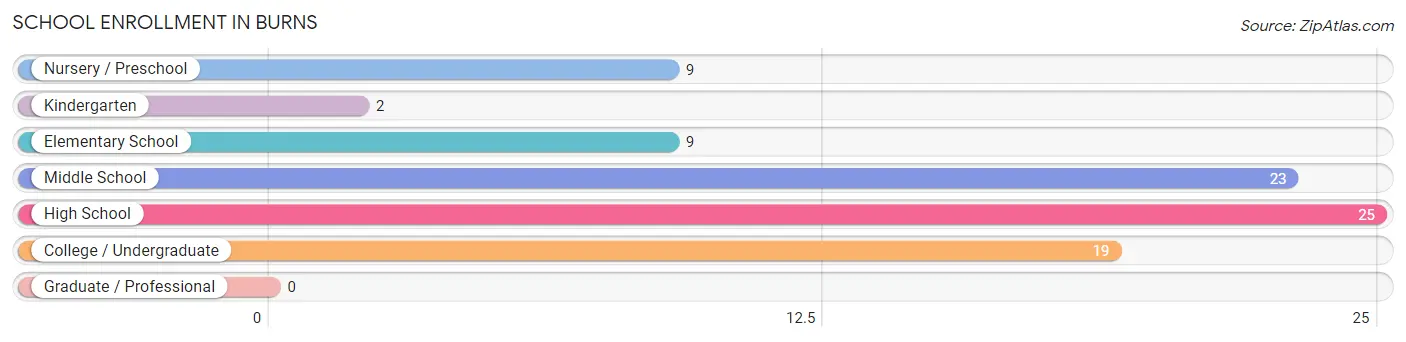
School Enrollment in Burns
The most common levels of schooling among the 87 students in Burns are high school (25 | 28.7%), middle school (23 | 26.4%), and college / undergraduate (19 | 21.8%).
| School Level | # Students | % Students |
| Nursery / Preschool | 9 | 10.3% |
| Kindergarten | 2 | 2.3% |
| Elementary School | 9 | 10.3% |
| Middle School | 23 | 26.4% |
| High School | 25 | 28.7% |
| College / Undergraduate | 19 | 21.8% |
| Graduate / Professional | 0 | 0.0% |
| Total | 87 | 100.0% |
School Enrollment by Age by Funding Source in Burns
Out of a total of 87 students who are enrolled in schools in Burns, 6 (6.9%) attend a private institution, while the remaining 81 (93.1%) are enrolled in public schools. The age group of 10 to 14 year olds has the highest likelihood of being enrolled in private schools, with 3 (17.6% in the age bracket) enrolled. Conversely, the age group of 3 to 4 year olds has the lowest likelihood of being enrolled in a private school, with 7 (100.0% in the age bracket) attending a public institution.
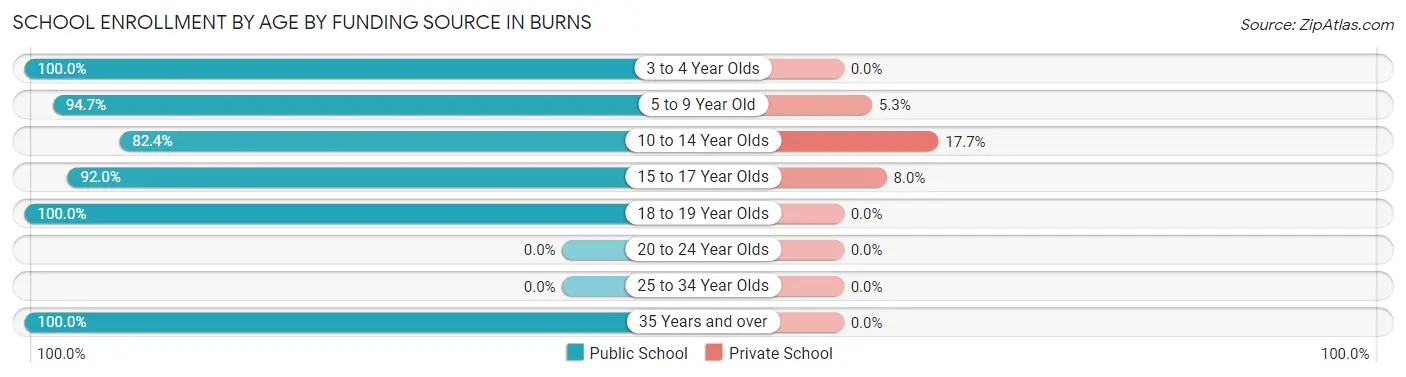
| Age Bracket | Public School | Private School |
| 3 to 4 Year Olds | 7 (100.0%) | 0 (0.0%) |
| 5 to 9 Year Old | 18 (94.7%) | 1 (5.3%) |
| 10 to 14 Year Olds | 14 (82.4%) | 3 (17.6%) |
| 15 to 17 Year Olds | 23 (92.0%) | 2 (8.0%) |
| 18 to 19 Year Olds | 14 (100.0%) | 0 (0.0%) |
| 20 to 24 Year Olds | 0 (0.0%) | 0 (0.0%) |
| 25 to 34 Year Olds | 0 (0.0%) | 0 (0.0%) |
| 35 Years and over | 5 (100.0%) | 0 (0.0%) |
| Total | 81 (93.1%) | 6 (6.9%) |
Educational Attainment by Field of Study in Burns
Liberal arts & history (6 | 40.0%), arts & humanities (5 | 33.3%), education (3 | 20.0%), and computers & mathematics (1 | 6.7%) are the most common fields of study among 15 individuals in Burns who have obtained a bachelor's degree or higher.
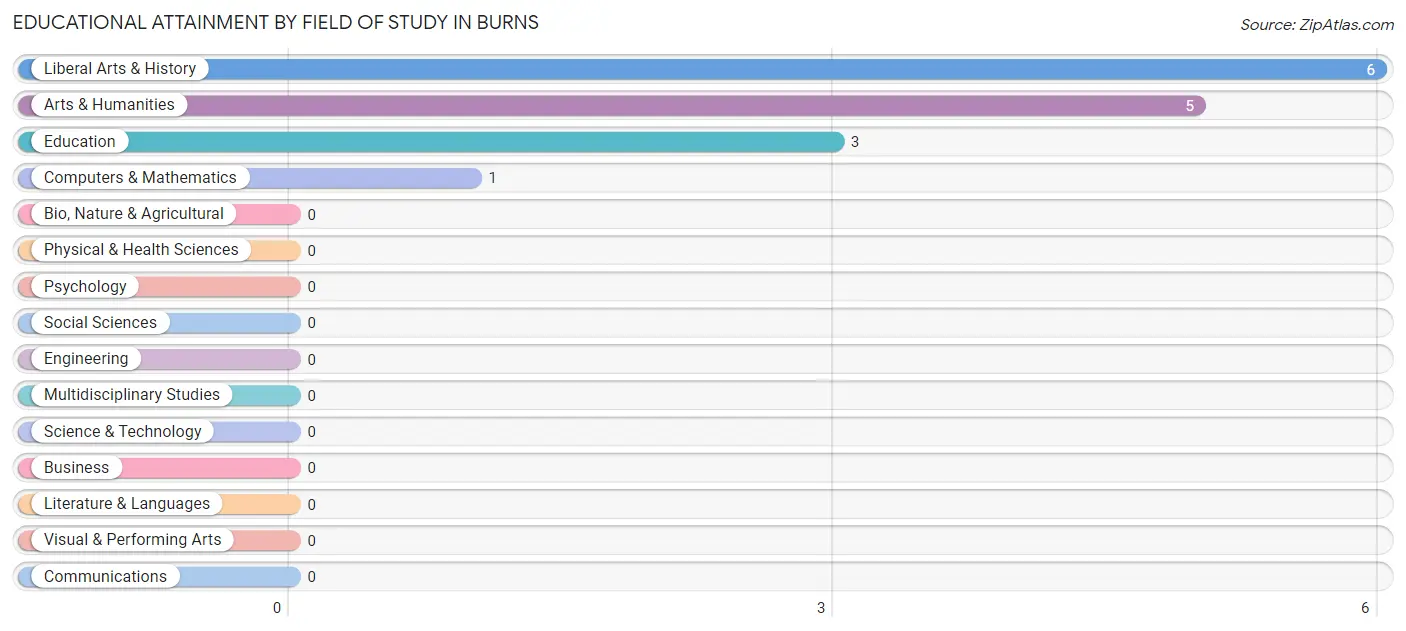
| Field of Study | # Graduates | % Graduates |
| Computers & Mathematics | 1 | 6.7% |
| Bio, Nature & Agricultural | 0 | 0.0% |
| Physical & Health Sciences | 0 | 0.0% |
| Psychology | 0 | 0.0% |
| Social Sciences | 0 | 0.0% |
| Engineering | 0 | 0.0% |
| Multidisciplinary Studies | 0 | 0.0% |
| Science & Technology | 0 | 0.0% |
| Business | 0 | 0.0% |
| Education | 3 | 20.0% |
| Literature & Languages | 0 | 0.0% |
| Liberal Arts & History | 6 | 40.0% |
| Visual & Performing Arts | 0 | 0.0% |
| Communications | 0 | 0.0% |
| Arts & Humanities | 5 | 33.3% |
| Total | 15 | 100.0% |
Transportation & Commute in Burns
Vehicle Availability by Sex in Burns
The most prevalent vehicle ownership categories in Burns are males with 4 vehicles (38, accounting for 56.7%) and females with 4 vehicles (24, making up 73.1%).
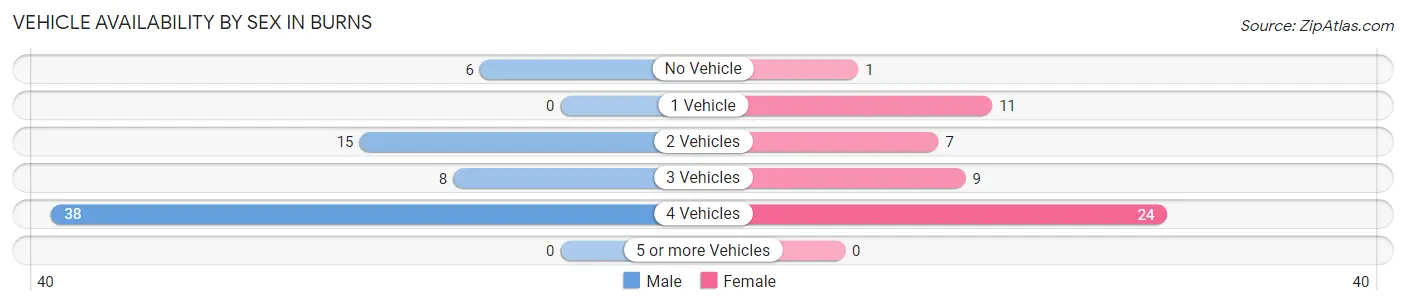
| Vehicles Available | Male | Female |
| No Vehicle | 6 (9.0%) | 1 (1.9%) |
| 1 Vehicle | 0 (0.0%) | 11 (21.1%) |
| 2 Vehicles | 15 (22.4%) | 7 (13.5%) |
| 3 Vehicles | 8 (11.9%) | 9 (17.3%) |
| 4 Vehicles | 38 (56.7%) | 24 (46.2%) |
| 5 or more Vehicles | 0 (0.0%) | 0 (0.0%) |
| Total | 67 (100.0%) | 52 (100.0%) |
Commute Time in Burns
The most frequently occuring commute durations in Burns are 30 to 34 minutes (28 commuters, 23.5%), 20 to 24 minutes (24 commuters, 20.2%), and 60 to 89 minutes (18 commuters, 15.1%).
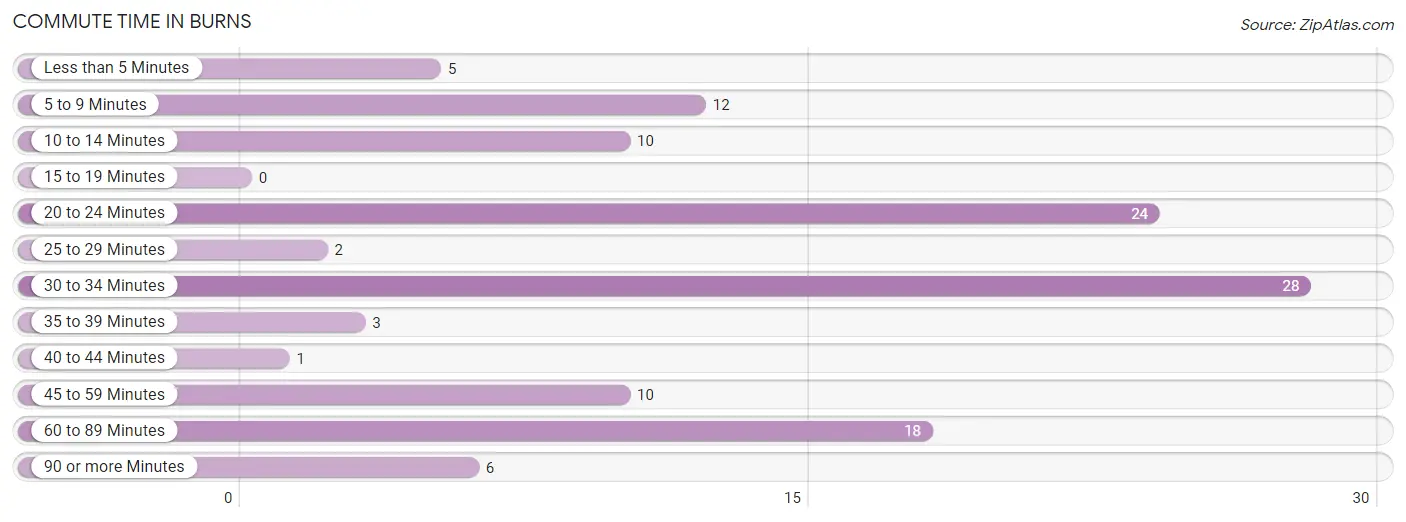
| Commute Time | # Commuters | % Commuters |
| Less than 5 Minutes | 5 | 4.2% |
| 5 to 9 Minutes | 12 | 10.1% |
| 10 to 14 Minutes | 10 | 8.4% |
| 15 to 19 Minutes | 0 | 0.0% |
| 20 to 24 Minutes | 24 | 20.2% |
| 25 to 29 Minutes | 2 | 1.7% |
| 30 to 34 Minutes | 28 | 23.5% |
| 35 to 39 Minutes | 3 | 2.5% |
| 40 to 44 Minutes | 1 | 0.8% |
| 45 to 59 Minutes | 10 | 8.4% |
| 60 to 89 Minutes | 18 | 15.1% |
| 90 or more Minutes | 6 | 5.0% |
Commute Time by Sex in Burns
The most common commute times in Burns are 30 to 34 minutes (20 commuters, 29.8%) for males and 5 to 9 minutes (12 commuters, 23.1%) for females.
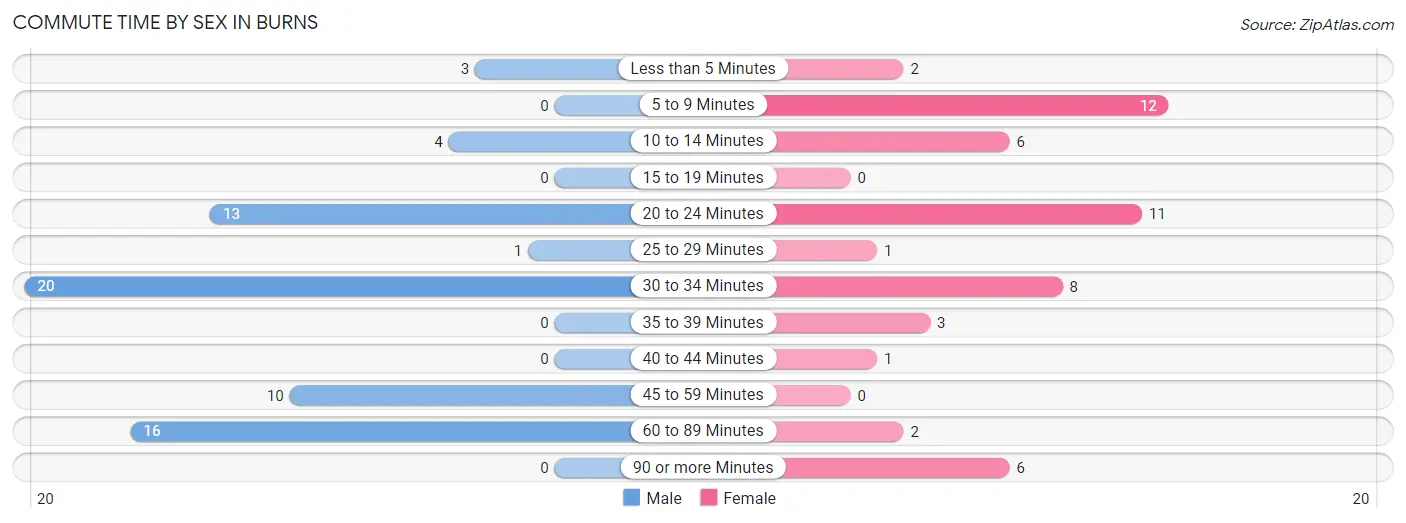
| Commute Time | Male | Female |
| Less than 5 Minutes | 3 (4.5%) | 2 (3.8%) |
| 5 to 9 Minutes | 0 (0.0%) | 12 (23.1%) |
| 10 to 14 Minutes | 4 (6.0%) | 6 (11.5%) |
| 15 to 19 Minutes | 0 (0.0%) | 0 (0.0%) |
| 20 to 24 Minutes | 13 (19.4%) | 11 (21.1%) |
| 25 to 29 Minutes | 1 (1.5%) | 1 (1.9%) |
| 30 to 34 Minutes | 20 (29.8%) | 8 (15.4%) |
| 35 to 39 Minutes | 0 (0.0%) | 3 (5.8%) |
| 40 to 44 Minutes | 0 (0.0%) | 1 (1.9%) |
| 45 to 59 Minutes | 10 (14.9%) | 0 (0.0%) |
| 60 to 89 Minutes | 16 (23.9%) | 2 (3.8%) |
| 90 or more Minutes | 0 (0.0%) | 6 (11.5%) |
Time of Departure to Work by Sex in Burns
The most frequent times of departure to work in Burns are 5:00 AM to 5:29 AM (29, 43.3%) for males and 7:30 AM to 7:59 AM (13, 25.0%) for females.
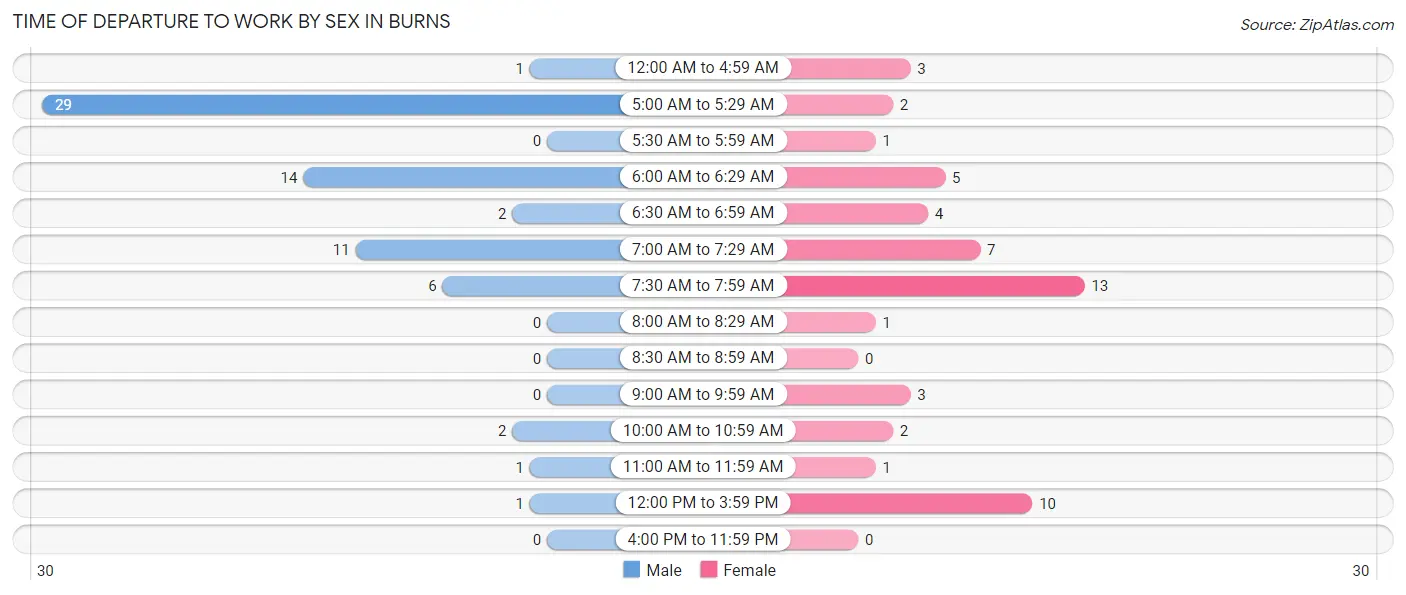
| Time of Departure | Male | Female |
| 12:00 AM to 4:59 AM | 1 (1.5%) | 3 (5.8%) |
| 5:00 AM to 5:29 AM | 29 (43.3%) | 2 (3.8%) |
| 5:30 AM to 5:59 AM | 0 (0.0%) | 1 (1.9%) |
| 6:00 AM to 6:29 AM | 14 (20.9%) | 5 (9.6%) |
| 6:30 AM to 6:59 AM | 2 (3.0%) | 4 (7.7%) |
| 7:00 AM to 7:29 AM | 11 (16.4%) | 7 (13.5%) |
| 7:30 AM to 7:59 AM | 6 (9.0%) | 13 (25.0%) |
| 8:00 AM to 8:29 AM | 0 (0.0%) | 1 (1.9%) |
| 8:30 AM to 8:59 AM | 0 (0.0%) | 0 (0.0%) |
| 9:00 AM to 9:59 AM | 0 (0.0%) | 3 (5.8%) |
| 10:00 AM to 10:59 AM | 2 (3.0%) | 2 (3.8%) |
| 11:00 AM to 11:59 AM | 1 (1.5%) | 1 (1.9%) |
| 12:00 PM to 3:59 PM | 1 (1.5%) | 10 (19.2%) |
| 4:00 PM to 11:59 PM | 0 (0.0%) | 0 (0.0%) |
| Total | 67 (100.0%) | 52 (100.0%) |
Housing Occupancy in Burns
Occupancy by Ownership in Burns
Of the total 84 dwellings in Burns, owner-occupied units account for 61 (72.6%), while renter-occupied units make up 23 (27.4%).
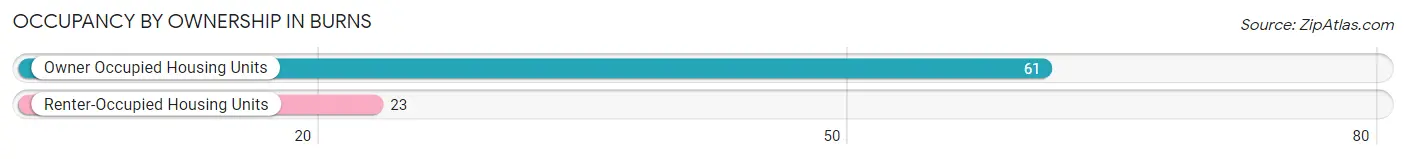
| Occupancy | # Housing Units | % Housing Units |
| Owner Occupied Housing Units | 61 | 72.6% |
| Renter-Occupied Housing Units | 23 | 27.4% |
| Total Occupied Housing Units | 84 | 100.0% |
Occupancy by Household Size in Burns
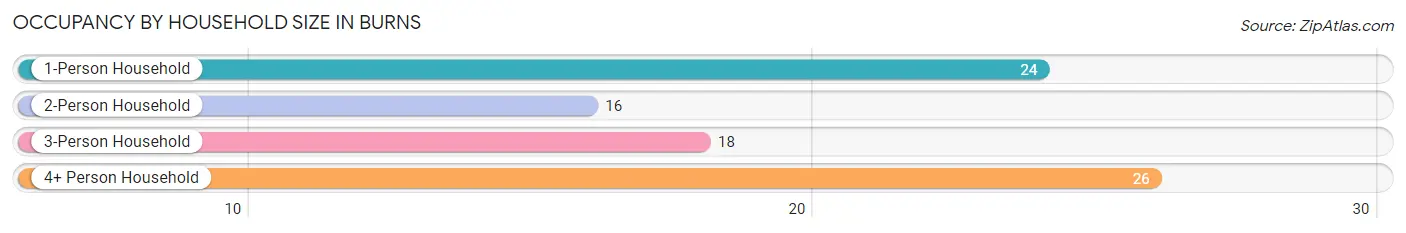
| Household Size | # Housing Units | % Housing Units |
| 1-Person Household | 24 | 28.6% |
| 2-Person Household | 16 | 19.1% |
| 3-Person Household | 18 | 21.4% |
| 4+ Person Household | 26 | 30.9% |
| Total Housing Units | 84 | 100.0% |
Occupancy by Ownership by Household Size in Burns
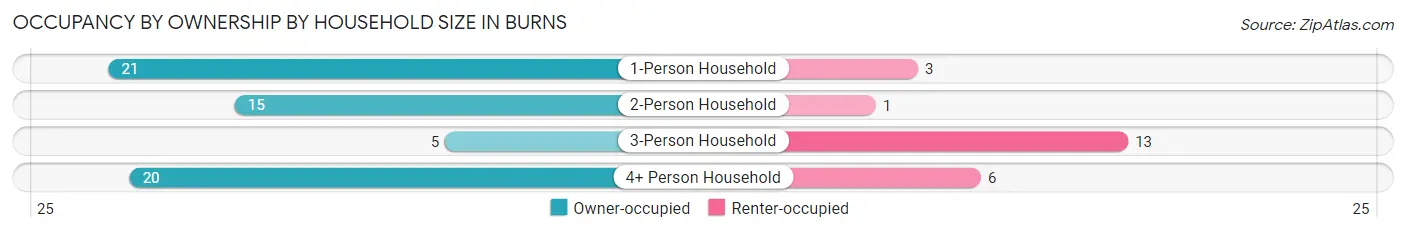
| Household Size | Owner-occupied | Renter-occupied |
| 1-Person Household | 21 (87.5%) | 3 (12.5%) |
| 2-Person Household | 15 (93.8%) | 1 (6.2%) |
| 3-Person Household | 5 (27.8%) | 13 (72.2%) |
| 4+ Person Household | 20 (76.9%) | 6 (23.1%) |
| Total Housing Units | 61 (72.6%) | 23 (27.4%) |
Occupancy by Educational Attainment in Burns
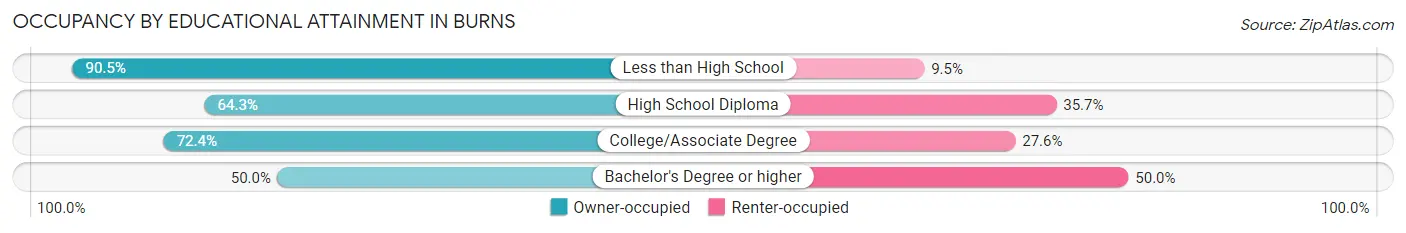
| Household Size | Owner-occupied | Renter-occupied |
| Less than High School | 19 (90.5%) | 2 (9.5%) |
| High School Diploma | 18 (64.3%) | 10 (35.7%) |
| College/Associate Degree | 21 (72.4%) | 8 (27.6%) |
| Bachelor's Degree or higher | 3 (50.0%) | 3 (50.0%) |
Occupancy by Age of Householder in Burns
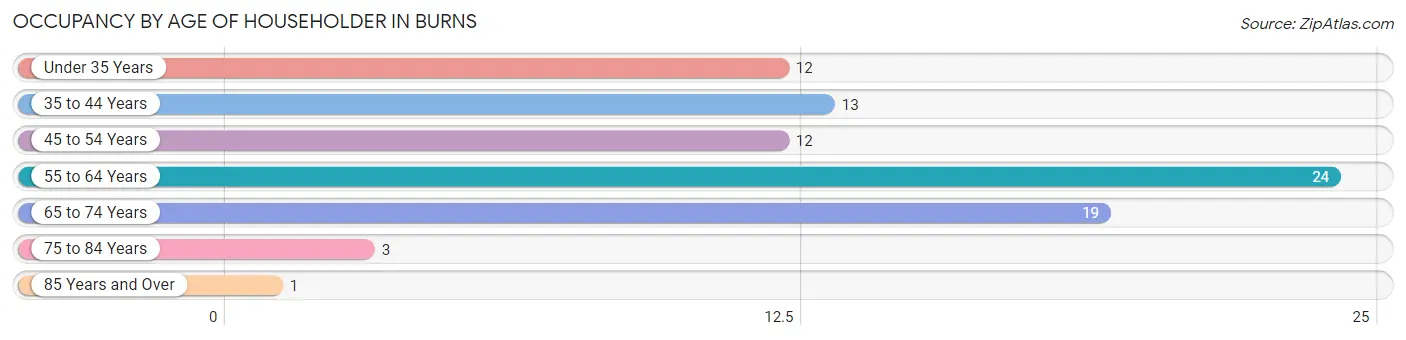
| Age Bracket | # Households | % Households |
| Under 35 Years | 12 | 14.3% |
| 35 to 44 Years | 13 | 15.5% |
| 45 to 54 Years | 12 | 14.3% |
| 55 to 64 Years | 24 | 28.6% |
| 65 to 74 Years | 19 | 22.6% |
| 75 to 84 Years | 3 | 3.6% |
| 85 Years and Over | 1 | 1.2% |
| Total | 84 | 100.0% |
Housing Finances in Burns
Median Income by Occupancy in Burns
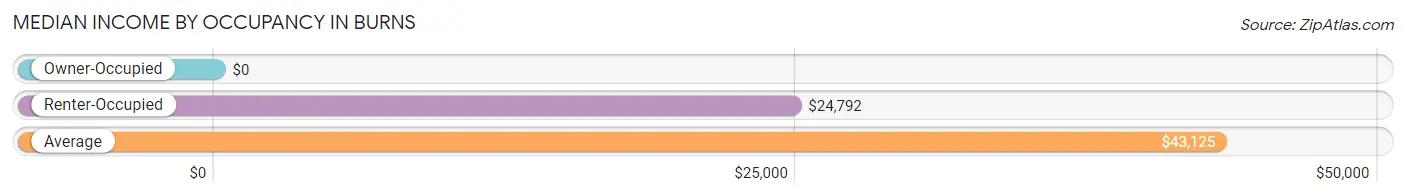
| Occupancy Type | # Households | Median Income |
| Owner-Occupied | 61 (72.6%) | $0 |
| Renter-Occupied | 23 (27.4%) | $24,792 |
| Average | 84 (100.0%) | $43,125 |
Occupancy by Householder Income Bracket in Burns
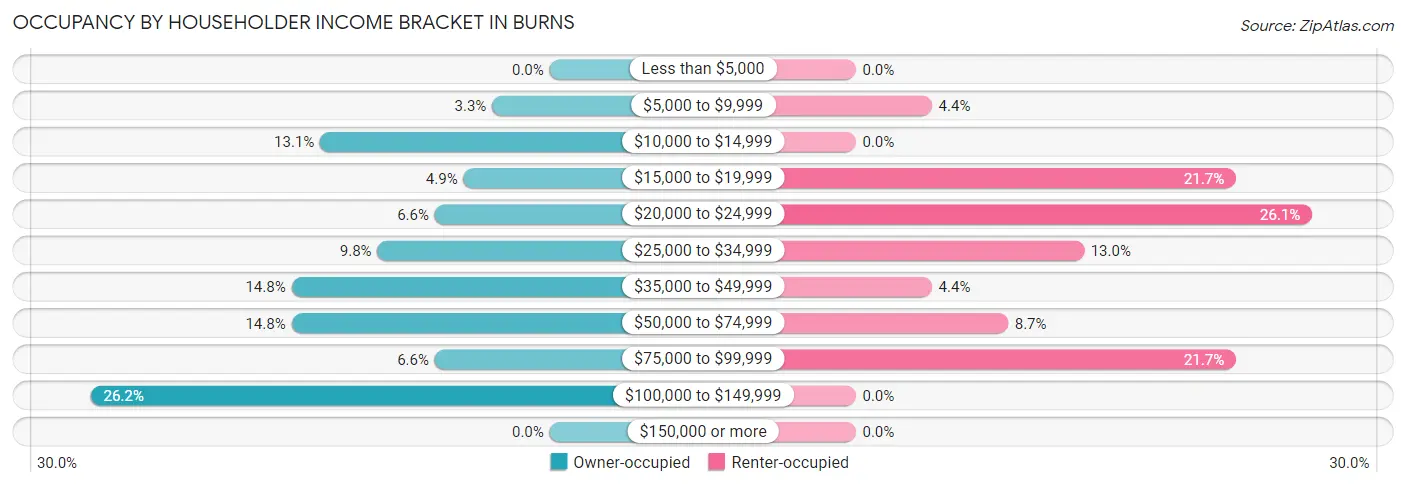
| Income Bracket | Owner-occupied | Renter-occupied |
| Less than $5,000 | 0 (0.0%) | 0 (0.0%) |
| $5,000 to $9,999 | 2 (3.3%) | 1 (4.3%) |
| $10,000 to $14,999 | 8 (13.1%) | 0 (0.0%) |
| $15,000 to $19,999 | 3 (4.9%) | 5 (21.7%) |
| $20,000 to $24,999 | 4 (6.6%) | 6 (26.1%) |
| $25,000 to $34,999 | 6 (9.8%) | 3 (13.0%) |
| $35,000 to $49,999 | 9 (14.7%) | 1 (4.3%) |
| $50,000 to $74,999 | 9 (14.7%) | 2 (8.7%) |
| $75,000 to $99,999 | 4 (6.6%) | 5 (21.7%) |
| $100,000 to $149,999 | 16 (26.2%) | 0 (0.0%) |
| $150,000 or more | 0 (0.0%) | 0 (0.0%) |
| Total | 61 (100.0%) | 23 (100.0%) |
Monthly Housing Cost Tiers in Burns
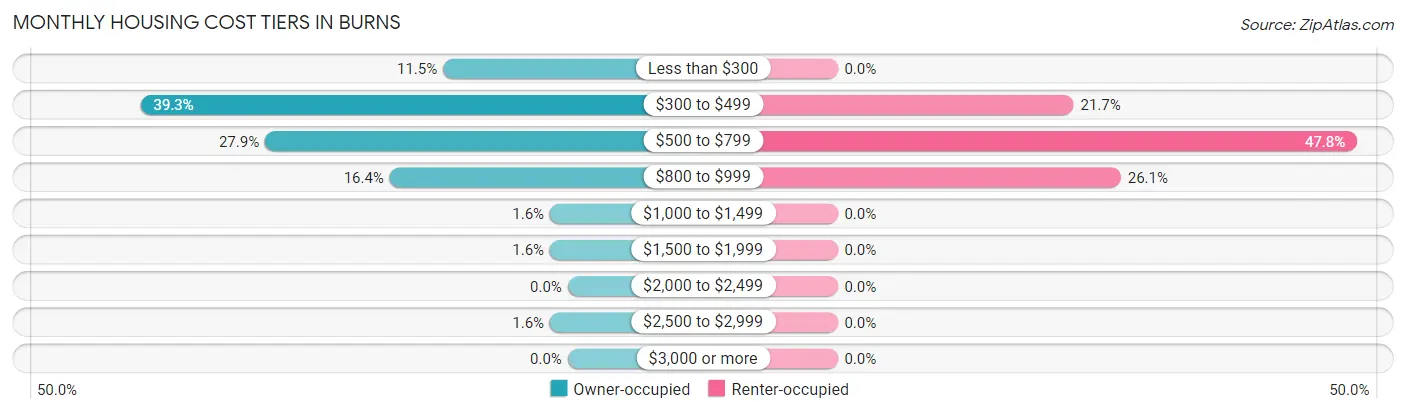
| Monthly Cost | Owner-occupied | Renter-occupied |
| Less than $300 | 7 (11.5%) | 0 (0.0%) |
| $300 to $499 | 24 (39.3%) | 5 (21.7%) |
| $500 to $799 | 17 (27.9%) | 11 (47.8%) |
| $800 to $999 | 10 (16.4%) | 6 (26.1%) |
| $1,000 to $1,499 | 1 (1.6%) | 0 (0.0%) |
| $1,500 to $1,999 | 1 (1.6%) | 0 (0.0%) |
| $2,000 to $2,499 | 0 (0.0%) | 0 (0.0%) |
| $2,500 to $2,999 | 1 (1.6%) | 0 (0.0%) |
| $3,000 or more | 0 (0.0%) | 0 (0.0%) |
| Total | 61 (100.0%) | 23 (100.0%) |
Physical Housing Characteristics in Burns
Housing Structures in Burns
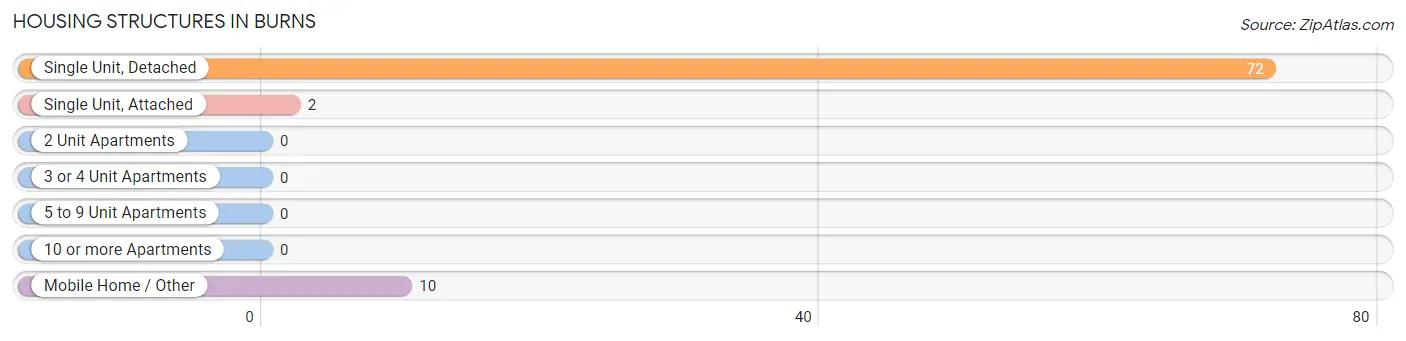
| Structure Type | # Housing Units | % Housing Units |
| Single Unit, Detached | 72 | 85.7% |
| Single Unit, Attached | 2 | 2.4% |
| 2 Unit Apartments | 0 | 0.0% |
| 3 or 4 Unit Apartments | 0 | 0.0% |
| 5 to 9 Unit Apartments | 0 | 0.0% |
| 10 or more Apartments | 0 | 0.0% |
| Mobile Home / Other | 10 | 11.9% |
| Total | 84 | 100.0% |
Housing Structures by Occupancy in Burns
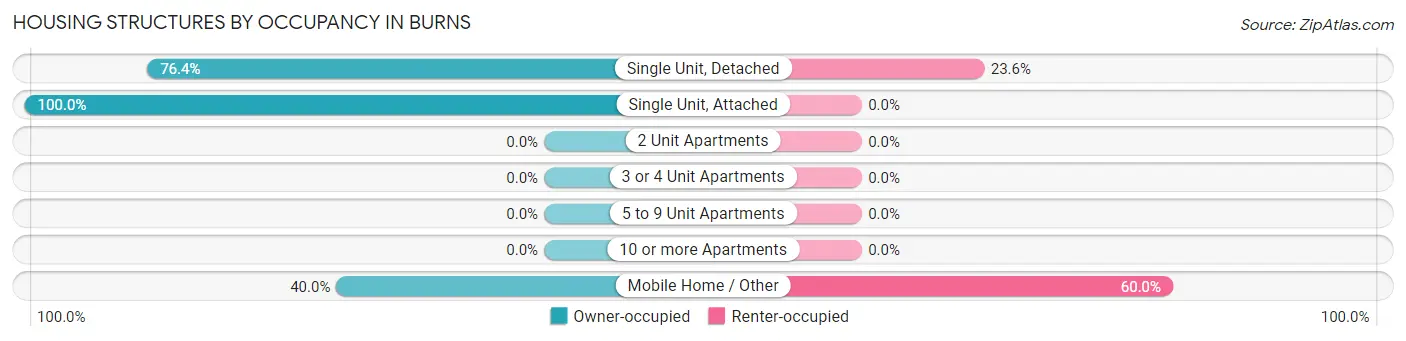
| Structure Type | Owner-occupied | Renter-occupied |
| Single Unit, Detached | 55 (76.4%) | 17 (23.6%) |
| Single Unit, Attached | 2 (100.0%) | 0 (0.0%) |
| 2 Unit Apartments | 0 (0.0%) | 0 (0.0%) |
| 3 or 4 Unit Apartments | 0 (0.0%) | 0 (0.0%) |
| 5 to 9 Unit Apartments | 0 (0.0%) | 0 (0.0%) |
| 10 or more Apartments | 0 (0.0%) | 0 (0.0%) |
| Mobile Home / Other | 4 (40.0%) | 6 (60.0%) |
| Total | 61 (72.6%) | 23 (27.4%) |
Housing Structures by Number of Rooms in Burns
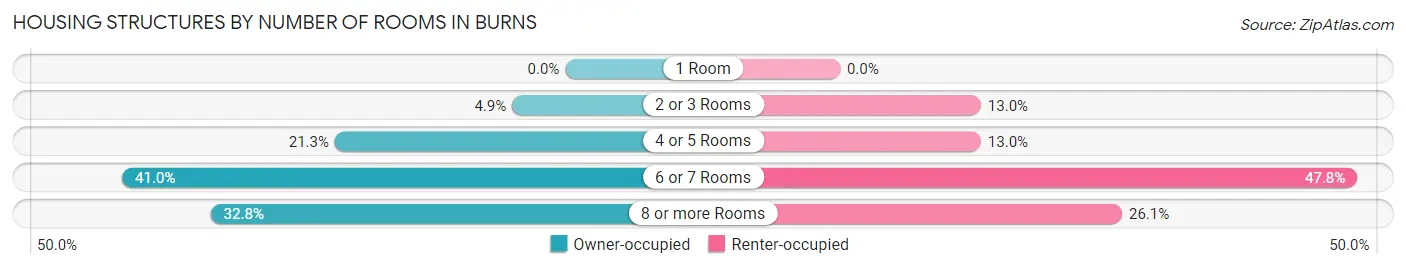
| Number of Rooms | Owner-occupied | Renter-occupied |
| 1 Room | 0 (0.0%) | 0 (0.0%) |
| 2 or 3 Rooms | 3 (4.9%) | 3 (13.0%) |
| 4 or 5 Rooms | 13 (21.3%) | 3 (13.0%) |
| 6 or 7 Rooms | 25 (41.0%) | 11 (47.8%) |
| 8 or more Rooms | 20 (32.8%) | 6 (26.1%) |
| Total | 61 (100.0%) | 23 (100.0%) |
Housing Structure by Heating Type in Burns
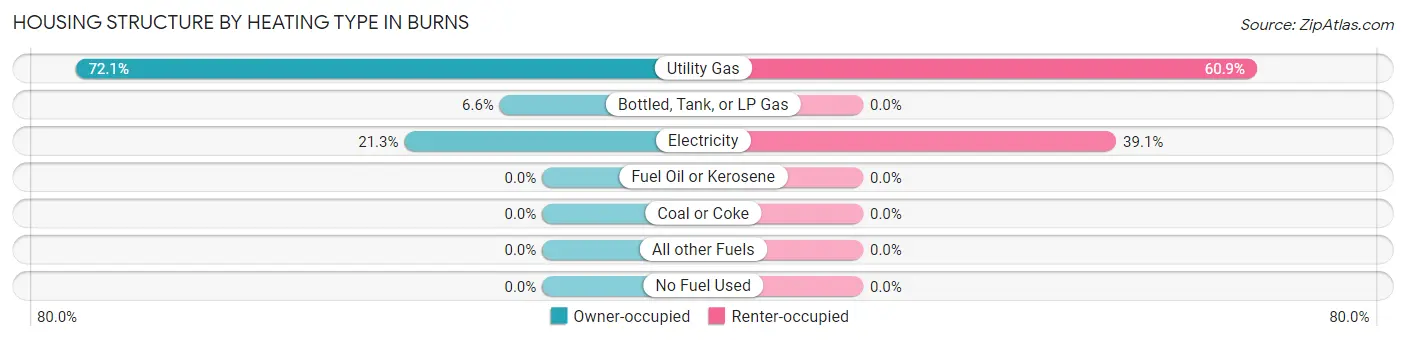
| Heating Type | Owner-occupied | Renter-occupied |
| Utility Gas | 44 (72.1%) | 14 (60.9%) |
| Bottled, Tank, or LP Gas | 4 (6.6%) | 0 (0.0%) |
| Electricity | 13 (21.3%) | 9 (39.1%) |
| Fuel Oil or Kerosene | 0 (0.0%) | 0 (0.0%) |
| Coal or Coke | 0 (0.0%) | 0 (0.0%) |
| All other Fuels | 0 (0.0%) | 0 (0.0%) |
| No Fuel Used | 0 (0.0%) | 0 (0.0%) |
| Total | 61 (100.0%) | 23 (100.0%) |
Household Vehicle Usage in Burns
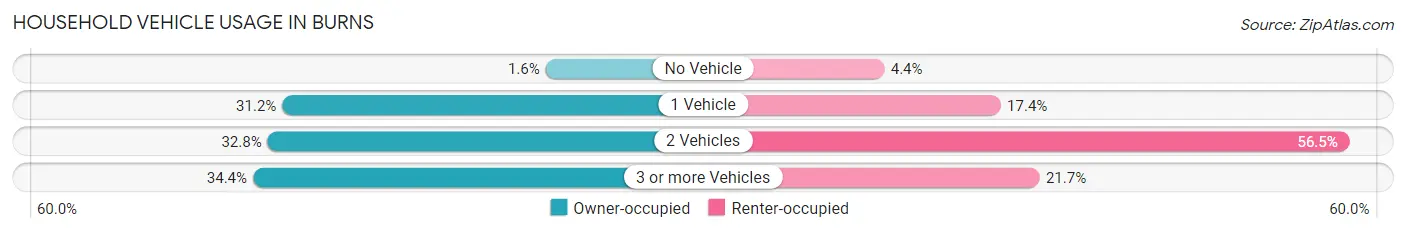
| Vehicles per Household | Owner-occupied | Renter-occupied |
| No Vehicle | 1 (1.6%) | 1 (4.3%) |
| 1 Vehicle | 19 (31.1%) | 4 (17.4%) |
| 2 Vehicles | 20 (32.8%) | 13 (56.5%) |
| 3 or more Vehicles | 21 (34.4%) | 5 (21.7%) |
| Total | 61 (100.0%) | 23 (100.0%) |
Real Estate & Mortgages in Burns
Real Estate and Mortgage Overview in Burns
| Characteristic | Without Mortgage | With Mortgage |
| Housing Units | 36 | 25 |
| Median Property Value | $56,000 | $45,600 |
| Median Household Income | $49,167 | $0 |
| Monthly Housing Costs | $386 | $0 |
| Real Estate Taxes | $960 | $0 |
Property Value by Mortgage Status in Burns
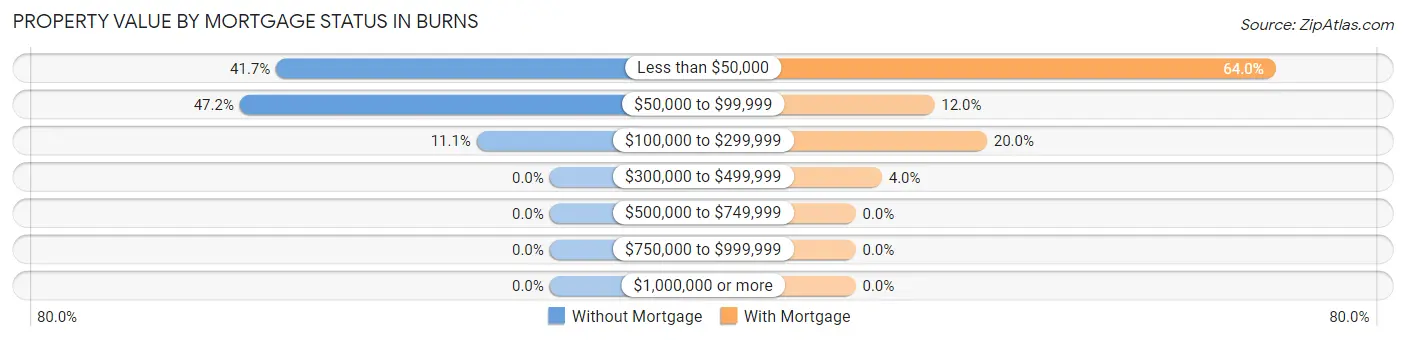
| Property Value | Without Mortgage | With Mortgage |
| Less than $50,000 | 15 (41.7%) | 16 (64.0%) |
| $50,000 to $99,999 | 17 (47.2%) | 3 (12.0%) |
| $100,000 to $299,999 | 4 (11.1%) | 5 (20.0%) |
| $300,000 to $499,999 | 0 (0.0%) | 1 (4.0%) |
| $500,000 to $749,999 | 0 (0.0%) | 0 (0.0%) |
| $750,000 to $999,999 | 0 (0.0%) | 0 (0.0%) |
| $1,000,000 or more | 0 (0.0%) | 0 (0.0%) |
| Total | 36 (100.0%) | 25 (100.0%) |
Household Income by Mortgage Status in Burns
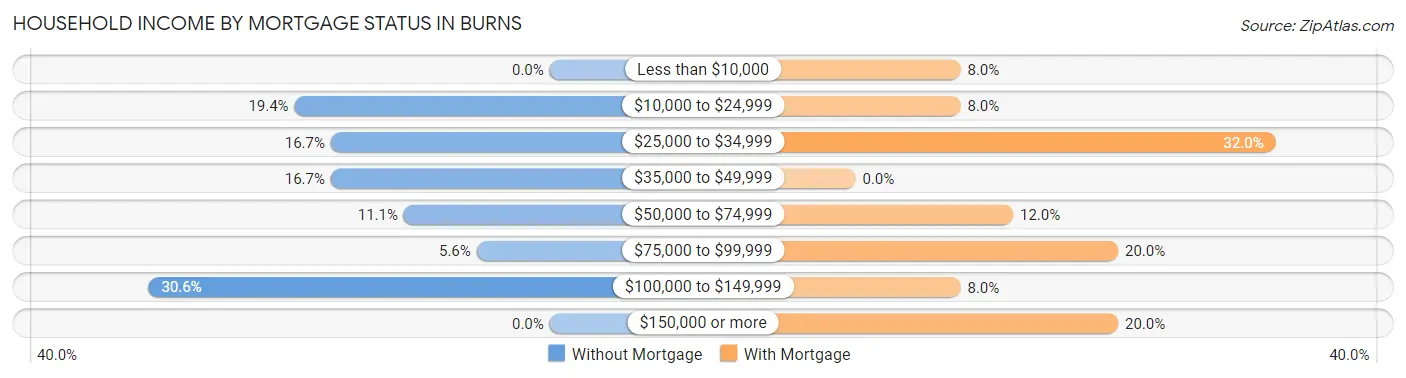
| Household Income | Without Mortgage | With Mortgage |
| Less than $10,000 | 0 (0.0%) | 2 (8.0%) |
| $10,000 to $24,999 | 7 (19.4%) | 2 (8.0%) |
| $25,000 to $34,999 | 6 (16.7%) | 8 (32.0%) |
| $35,000 to $49,999 | 6 (16.7%) | 0 (0.0%) |
| $50,000 to $74,999 | 4 (11.1%) | 3 (12.0%) |
| $75,000 to $99,999 | 2 (5.6%) | 5 (20.0%) |
| $100,000 to $149,999 | 11 (30.6%) | 2 (8.0%) |
| $150,000 or more | 0 (0.0%) | 5 (20.0%) |
| Total | 36 (100.0%) | 25 (100.0%) |
Property Value to Household Income Ratio in Burns
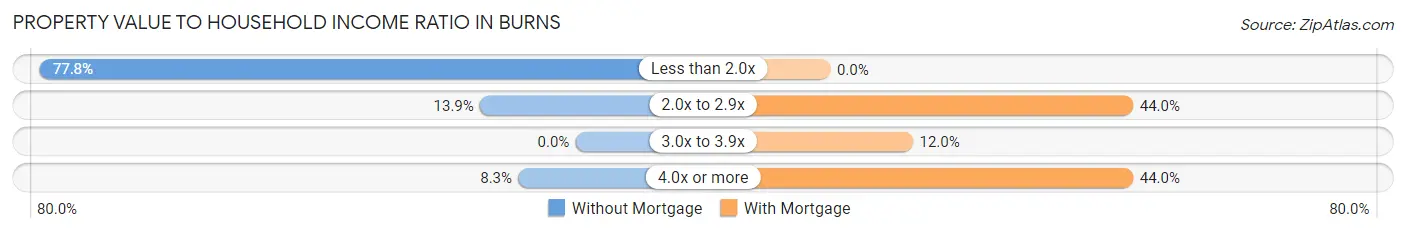
| Value-to-Income Ratio | Without Mortgage | With Mortgage |
| Less than 2.0x | 28 (77.8%) | 0 (0.0%) |
| 2.0x to 2.9x | 5 (13.9%) | 11 (44.0%) |
| 3.0x to 3.9x | 0 (0.0%) | 3 (12.0%) |
| 4.0x or more | 3 (8.3%) | 11 (44.0%) |
| Total | 36 (100.0%) | 25 (100.0%) |
Real Estate Taxes by Mortgage Status in Burns
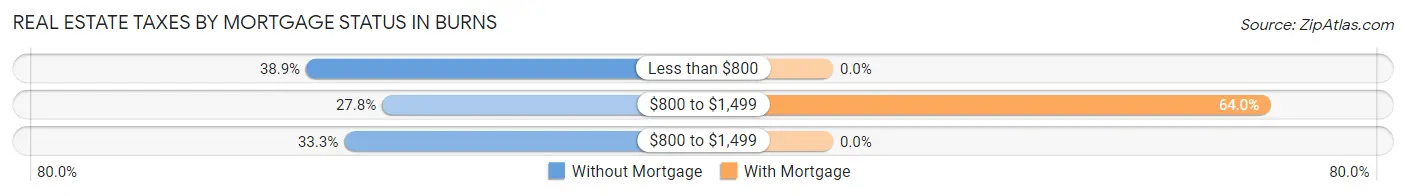
| Property Taxes | Without Mortgage | With Mortgage |
| Less than $800 | 14 (38.9%) | 0 (0.0%) |
| $800 to $1,499 | 10 (27.8%) | 16 (64.0%) |
| $800 to $1,499 | 12 (33.3%) | 0 (0.0%) |
| Total | 36 (100.0%) | 25 (100.0%) |
Health & Disability in Burns
Health Insurance Coverage by Age in Burns
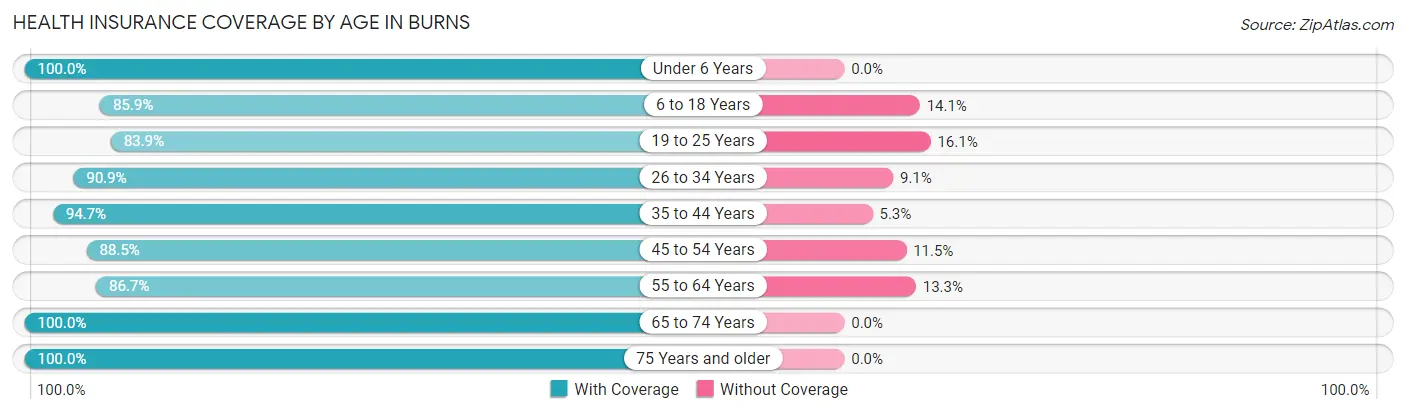
| Age Bracket | With Coverage | Without Coverage |
| Under 6 Years | 22 (100.0%) | 0 (0.0%) |
| 6 to 18 Years | 55 (85.9%) | 9 (14.1%) |
| 19 to 25 Years | 47 (83.9%) | 9 (16.1%) |
| 26 to 34 Years | 40 (90.9%) | 4 (9.1%) |
| 35 to 44 Years | 18 (94.7%) | 1 (5.3%) |
| 45 to 54 Years | 23 (88.5%) | 3 (11.5%) |
| 55 to 64 Years | 26 (86.7%) | 4 (13.3%) |
| 65 to 74 Years | 27 (100.0%) | 0 (0.0%) |
| 75 Years and older | 7 (100.0%) | 0 (0.0%) |
| Total | 265 (89.8%) | 30 (10.2%) |
Health Insurance Coverage by Citizenship Status in Burns
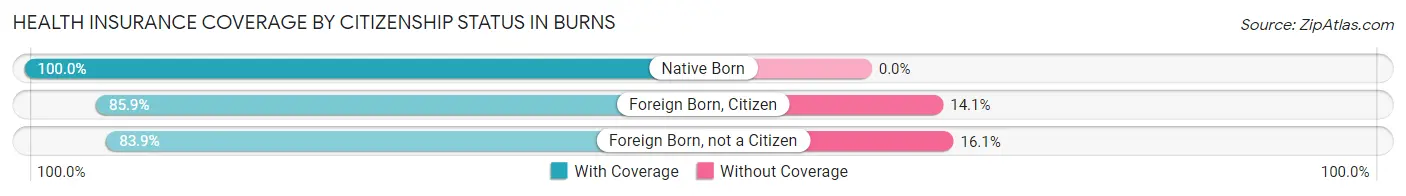
| Citizenship Status | With Coverage | Without Coverage |
| Native Born | 22 (100.0%) | 0 (0.0%) |
| Foreign Born, Citizen | 55 (85.9%) | 9 (14.1%) |
| Foreign Born, not a Citizen | 47 (83.9%) | 9 (16.1%) |
Health Insurance Coverage by Household Income in Burns
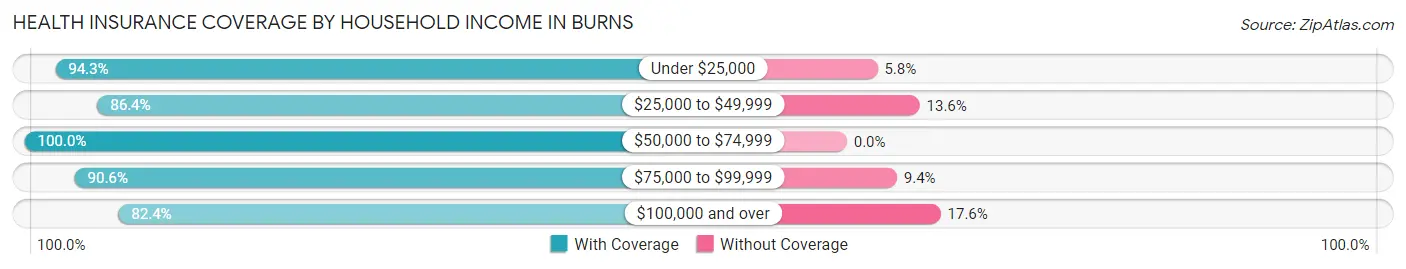
| Household Income | With Coverage | Without Coverage |
| Under $25,000 | 82 (94.3%) | 5 (5.8%) |
| $25,000 to $49,999 | 38 (86.4%) | 6 (13.6%) |
| $50,000 to $74,999 | 41 (100.0%) | 0 (0.0%) |
| $75,000 to $99,999 | 29 (90.6%) | 3 (9.4%) |
| $100,000 and over | 75 (82.4%) | 16 (17.6%) |
Public vs Private Health Insurance Coverage by Age in Burns
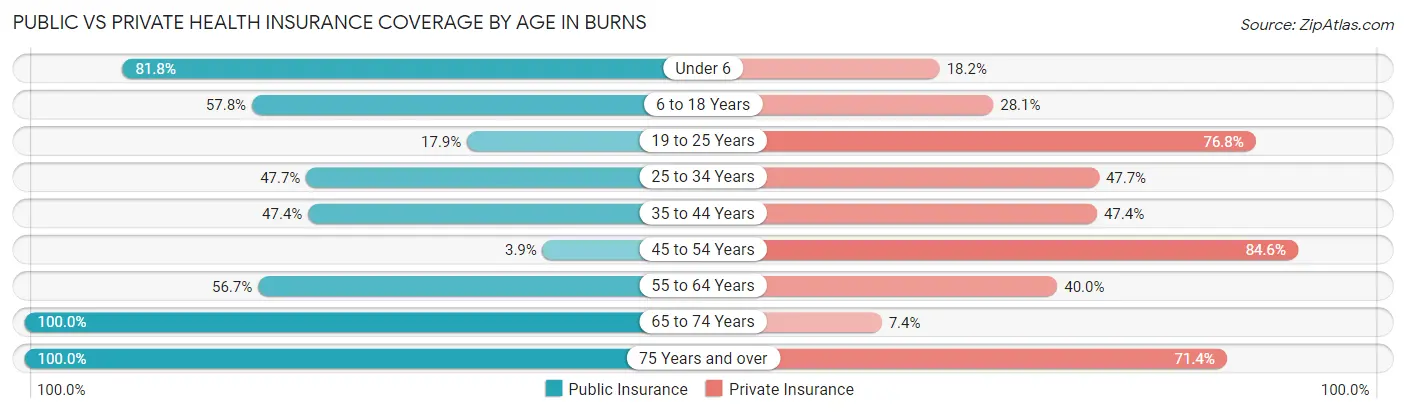
| Age Bracket | Public Insurance | Private Insurance |
| Under 6 | 18 (81.8%) | 4 (18.2%) |
| 6 to 18 Years | 37 (57.8%) | 18 (28.1%) |
| 19 to 25 Years | 10 (17.9%) | 43 (76.8%) |
| 25 to 34 Years | 21 (47.7%) | 21 (47.7%) |
| 35 to 44 Years | 9 (47.4%) | 9 (47.4%) |
| 45 to 54 Years | 1 (3.8%) | 22 (84.6%) |
| 55 to 64 Years | 17 (56.7%) | 12 (40.0%) |
| 65 to 74 Years | 27 (100.0%) | 2 (7.4%) |
| 75 Years and over | 7 (100.0%) | 5 (71.4%) |
| Total | 147 (49.8%) | 136 (46.1%) |
Disability Status by Sex by Age in Burns
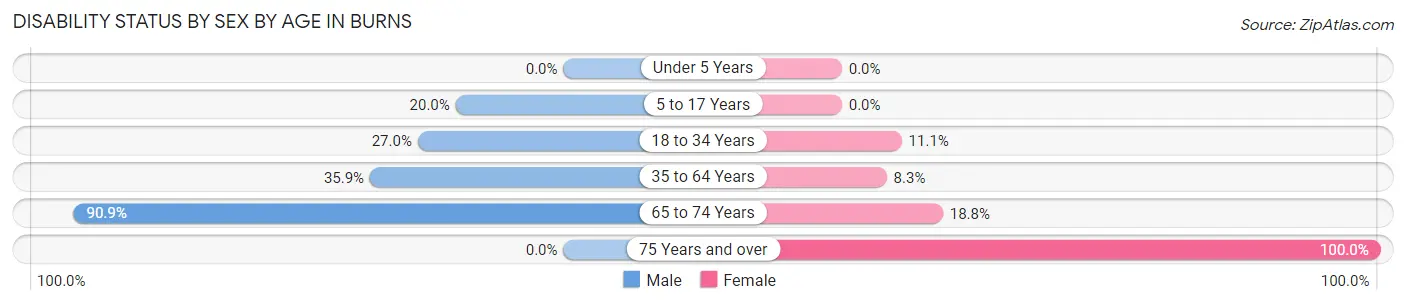
| Age Bracket | Male | Female |
| Under 5 Years | 0 (0.0%) | 0 (0.0%) |
| 5 to 17 Years | 9 (20.0%) | 0 (0.0%) |
| 18 to 34 Years | 20 (27.0%) | 3 (11.1%) |
| 35 to 64 Years | 14 (35.9%) | 3 (8.3%) |
| 65 to 74 Years | 10 (90.9%) | 3 (18.8%) |
| 75 Years and over | 0 (0.0%) | 5 (100.0%) |
Disability Class by Sex by Age in Burns
Disability Class: Hearing Difficulty
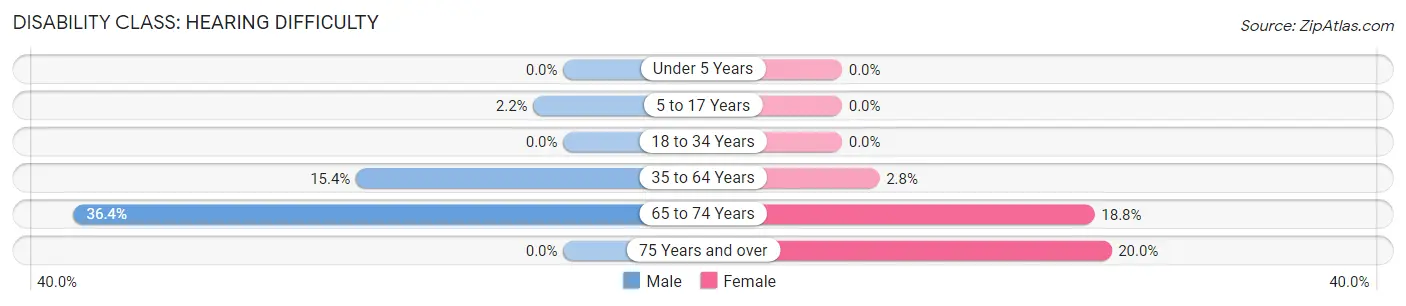
| Age Bracket | Male | Female |
| Under 5 Years | 0 (0.0%) | 0 (0.0%) |
| 5 to 17 Years | 1 (2.2%) | 0 (0.0%) |
| 18 to 34 Years | 0 (0.0%) | 0 (0.0%) |
| 35 to 64 Years | 6 (15.4%) | 1 (2.8%) |
| 65 to 74 Years | 4 (36.4%) | 3 (18.8%) |
| 75 Years and over | 0 (0.0%) | 1 (20.0%) |
Disability Class: Vision Difficulty
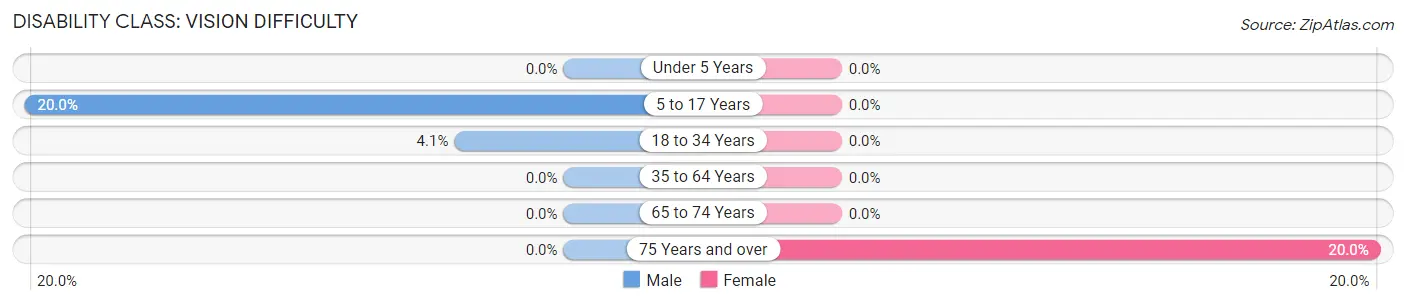
| Age Bracket | Male | Female |
| Under 5 Years | 0 (0.0%) | 0 (0.0%) |
| 5 to 17 Years | 9 (20.0%) | 0 (0.0%) |
| 18 to 34 Years | 3 (4.1%) | 0 (0.0%) |
| 35 to 64 Years | 0 (0.0%) | 0 (0.0%) |
| 65 to 74 Years | 0 (0.0%) | 0 (0.0%) |
| 75 Years and over | 0 (0.0%) | 1 (20.0%) |
Disability Class: Cognitive Difficulty
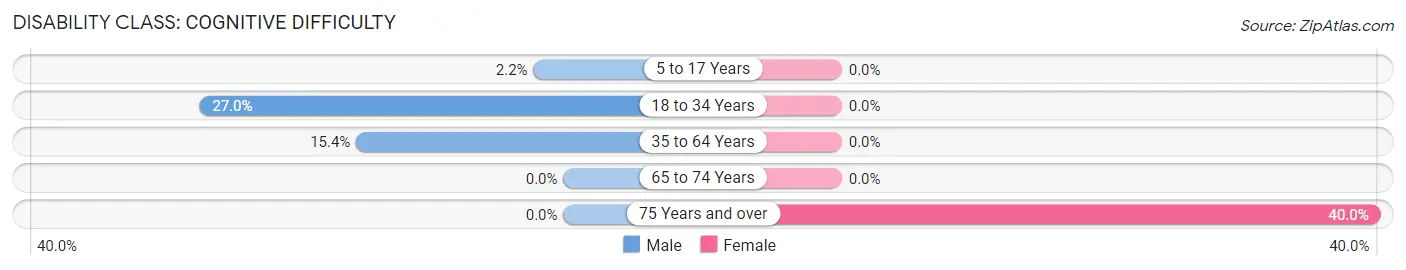
| Age Bracket | Male | Female |
| 5 to 17 Years | 1 (2.2%) | 0 (0.0%) |
| 18 to 34 Years | 20 (27.0%) | 0 (0.0%) |
| 35 to 64 Years | 6 (15.4%) | 0 (0.0%) |
| 65 to 74 Years | 0 (0.0%) | 0 (0.0%) |
| 75 Years and over | 0 (0.0%) | 2 (40.0%) |
Disability Class: Ambulatory Difficulty
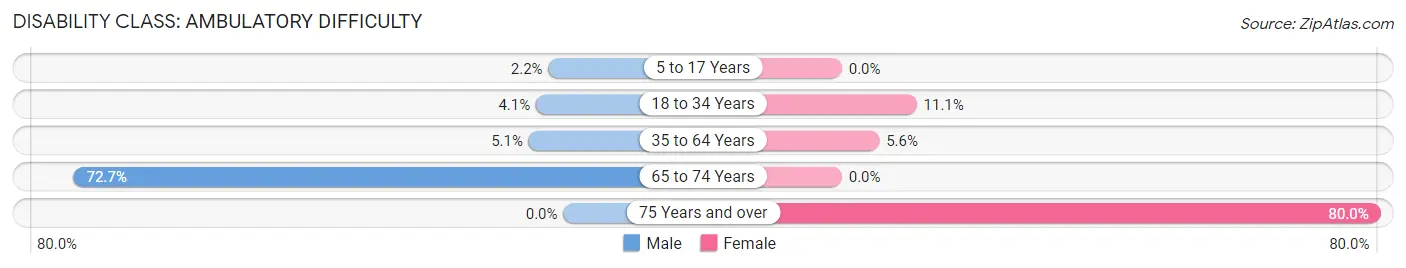
| Age Bracket | Male | Female |
| 5 to 17 Years | 1 (2.2%) | 0 (0.0%) |
| 18 to 34 Years | 3 (4.1%) | 3 (11.1%) |
| 35 to 64 Years | 2 (5.1%) | 2 (5.6%) |
| 65 to 74 Years | 8 (72.7%) | 0 (0.0%) |
| 75 Years and over | 0 (0.0%) | 4 (80.0%) |
Disability Class: Self-Care Difficulty
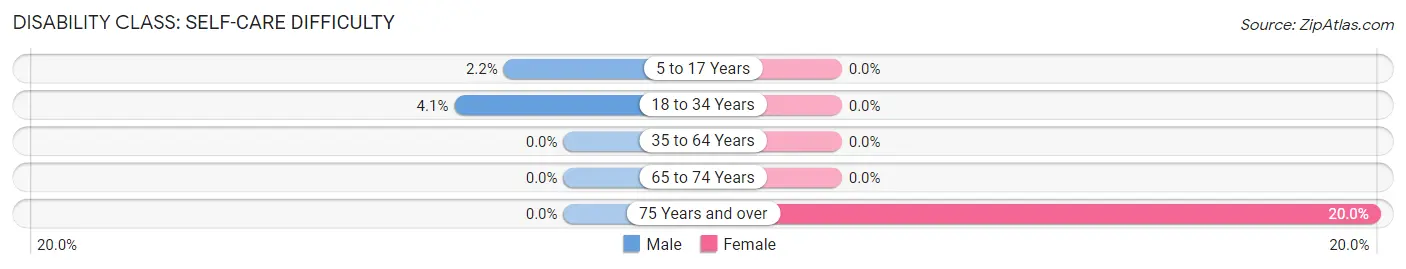
| Age Bracket | Male | Female |
| 5 to 17 Years | 1 (2.2%) | 0 (0.0%) |
| 18 to 34 Years | 3 (4.1%) | 0 (0.0%) |
| 35 to 64 Years | 0 (0.0%) | 0 (0.0%) |
| 65 to 74 Years | 0 (0.0%) | 0 (0.0%) |
| 75 Years and over | 0 (0.0%) | 1 (20.0%) |
Technology Access in Burns
Computing Device Access in Burns
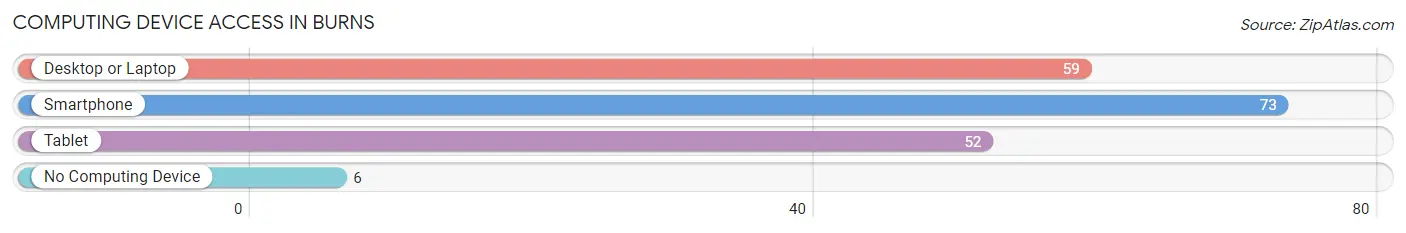
| Device Type | # Households | % Households |
| Desktop or Laptop | 59 | 70.2% |
| Smartphone | 73 | 86.9% |
| Tablet | 52 | 61.9% |
| No Computing Device | 6 | 7.1% |
| Total | 84 | 100.0% |
Internet Access in Burns
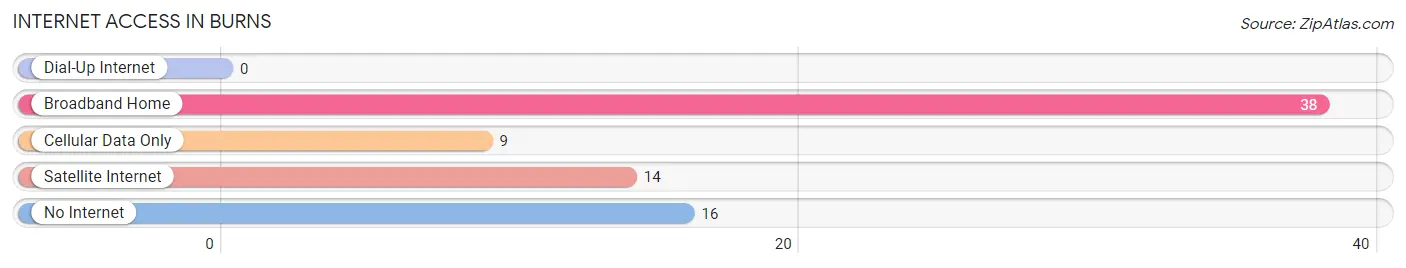
| Internet Type | # Households | % Households |
| Dial-Up Internet | 0 | 0.0% |
| Broadband Home | 38 | 45.2% |
| Cellular Data Only | 9 | 10.7% |
| Satellite Internet | 14 | 16.7% |
| No Internet | 16 | 19.1% |
| Total | 84 | 100.0% |
Burns Summary
Burns, Kansas is a small town located in the southeastern corner of the state, in the county of Labette. It is situated on the banks of the Neosho River, and is surrounded by rolling hills and farmland. The town was founded in 1871, and has a population of just over 1,000 people.
Burns is a rural community, and the economy is largely based on agriculture. The town is home to several small businesses, including a grocery store, a hardware store, and a few restaurants. The town also has a post office, a bank, and a library.
The geography of Burns is typical of the area, with rolling hills and farmland. The town is located in the Neosho River Valley, and is surrounded by the Osage Hills to the north and the Flint Hills to the south. The town is also located near the Kansas-Oklahoma border, and is close to the cities of Parsons and Coffeyville.
The climate in Burns is typical of the Midwest, with hot summers and cold winters. The average temperature in the summer is around 80 degrees Fahrenheit, and the average temperature in the winter is around 30 degrees Fahrenheit. The town receives an average of 40 inches of precipitation each year.
The demographics of Burns are largely white, with a small percentage of African Americans and Hispanics. The median household income is around $35,000, and the median home value is around $90,000. The town has a high school, and the nearest college is Pittsburg State University, located about 30 miles away.
Burns is a small town with a rich history and a strong sense of community. The town is home to several festivals and events throughout the year, including the annual Neosho River Festival and the Burns Harvest Festival. The town also has a number of parks and recreational areas, including the Burns City Park and the Neosho River Park.
Burns is a great place to live and work, and is a great place to raise a family. The town has a strong sense of community, and the people are friendly and welcoming. The town is a great place to visit, and offers a variety of activities and attractions for visitors.
Common Questions
What is Per Capita Income in Burns?
Per Capita income in Burns is $18,762.
What is the Median Family Income in Burns?
Median Family Income in Burns is $63,750.
What is the Median Household income in Burns?
Median Household Income in Burns is $43,125.
What is Inequality or Gini Index in Burns?
Inequality or Gini Index in Burns is 0.39.
What is the Total Population of Burns?
Total Population of Burns is 295.
What is the Total Male Population of Burns?
Total Male Population of Burns is 174.
What is the Total Female Population of Burns?
Total Female Population of Burns is 121.
What is the Ratio of Males per 100 Females in Burns?
There are 143.80 Males per 100 Females in Burns.
What is the Ratio of Females per 100 Males in Burns?
There are 69.54 Females per 100 Males in Burns.
What is the Median Population Age in Burns?
Median Population Age in Burns is 26.5 Years.
What is the Average Family Size in Burns
Average Family Size in Burns is 4.2 People.
What is the Average Household Size in Burns
Average Household Size in Burns is 3.5 People.
How Large is the Labor Force in Burns?
There are 136 People in the Labor Forcein in Burns.
What is the Percentage of People in the Labor Force in Burns?
59.9% of People are in the Labor Force in Burns.
What is the Unemployment Rate in Burns?
Unemployment Rate in Burns is 10.3%.