Bison, KS Map & Demographics
Bison Map
Bison Overview
$27,530
PER CAPITA INCOME
$63,092
AVG FAMILY INCOME
$61,875
AVG HOUSEHOLD INCOME
79.8%
WAGE / INCOME GAP [ % ]
20.2¢/ $1
WAGE / INCOME GAP [ $ ]
0.26
INEQUALITY / GINI INDEX
173
TOTAL POPULATION
103
MALE POPULATION
70
FEMALE POPULATION
147.14
MALES / 100 FEMALES
67.96
FEMALES / 100 MALES
47.8
MEDIAN AGE
2.6
AVG FAMILY SIZE
2.2
AVG HOUSEHOLD SIZE
113
LABOR FORCE [ PEOPLE ]
73.9%
PERCENT IN LABOR FORCE
20.4%
UNEMPLOYMENT RATE
Bison Zip Codes
Bison Area Codes
Income in Bison
Income Overview in Bison
Per Capita Income in Bison is $27,530, while median incomes of families and households are $63,092 and $61,875 respectively.
| Characteristic | Number | Measure |
| Per Capita Income | 173 | $27,530 |
| Median Family Income | 59 | $63,092 |
| Mean Family Income | 59 | $65,020 |
| Median Household Income | 80 | $61,875 |
| Mean Household Income | 80 | $59,751 |
| Income Deficit | 59 | $0 |
| Wage / Income Gap (%) | 173 | 79.81% |
| Wage / Income Gap ($) | 173 | 20.19¢ per $1 |
| Gini / Inequality Index | 173 | 0.26 |
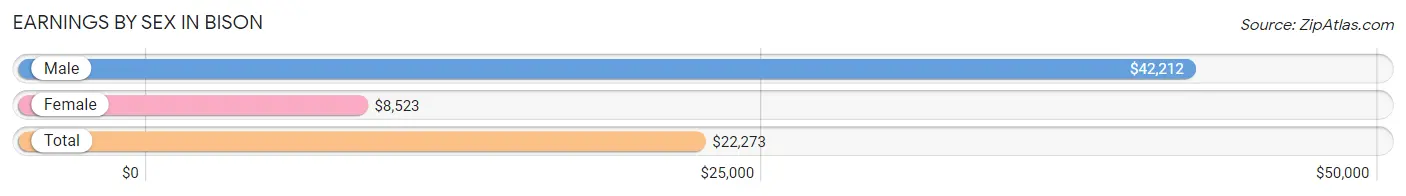
Earnings by Sex in Bison
Average Earnings in Bison are $22,273, $42,212 for men and $8,523 for women, a difference of 79.8%.
| Sex | Number | Average Earnings |
| Male | 71 (59.2%) | $42,212 |
| Female | 49 (40.8%) | $8,523 |
| Total | 120 (100.0%) | $22,273 |
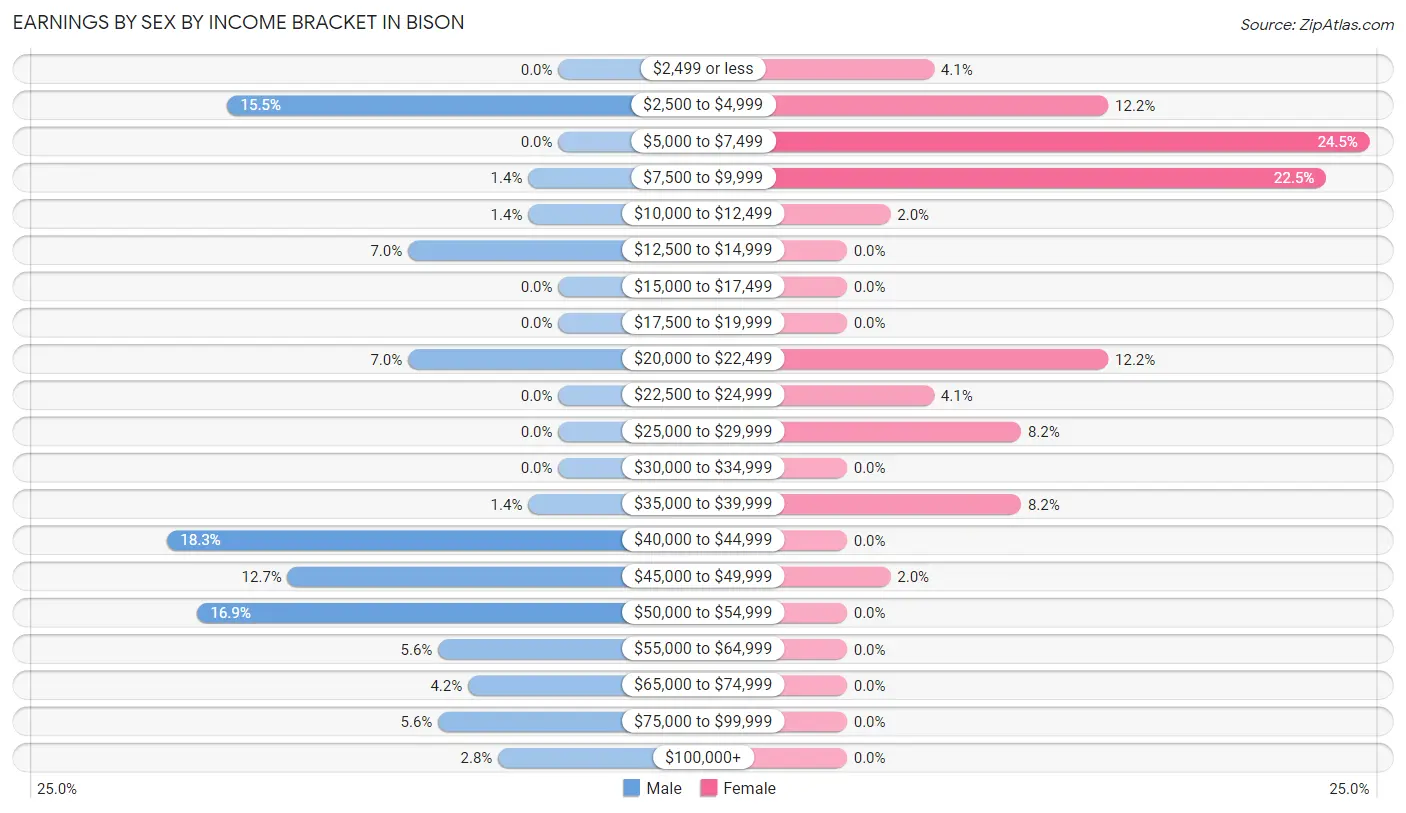
Earnings by Sex by Income Bracket in Bison
The most common earnings brackets in Bison are $40,000 to $44,999 for men (13 | 18.3%) and $5,000 to $7,499 for women (12 | 24.5%).
| Income | Male | Female |
| $2,499 or less | 0 (0.0%) | 2 (4.1%) |
| $2,500 to $4,999 | 11 (15.5%) | 6 (12.2%) |
| $5,000 to $7,499 | 0 (0.0%) | 12 (24.5%) |
| $7,500 to $9,999 | 1 (1.4%) | 11 (22.5%) |
| $10,000 to $12,499 | 1 (1.4%) | 1 (2.0%) |
| $12,500 to $14,999 | 5 (7.0%) | 0 (0.0%) |
| $15,000 to $17,499 | 0 (0.0%) | 0 (0.0%) |
| $17,500 to $19,999 | 0 (0.0%) | 0 (0.0%) |
| $20,000 to $22,499 | 5 (7.0%) | 6 (12.2%) |
| $22,500 to $24,999 | 0 (0.0%) | 2 (4.1%) |
| $25,000 to $29,999 | 0 (0.0%) | 4 (8.2%) |
| $30,000 to $34,999 | 0 (0.0%) | 0 (0.0%) |
| $35,000 to $39,999 | 1 (1.4%) | 4 (8.2%) |
| $40,000 to $44,999 | 13 (18.3%) | 0 (0.0%) |
| $45,000 to $49,999 | 9 (12.7%) | 1 (2.0%) |
| $50,000 to $54,999 | 12 (16.9%) | 0 (0.0%) |
| $55,000 to $64,999 | 4 (5.6%) | 0 (0.0%) |
| $65,000 to $74,999 | 3 (4.2%) | 0 (0.0%) |
| $75,000 to $99,999 | 4 (5.6%) | 0 (0.0%) |
| $100,000+ | 2 (2.8%) | 0 (0.0%) |
| Total | 71 (100.0%) | 49 (100.0%) |
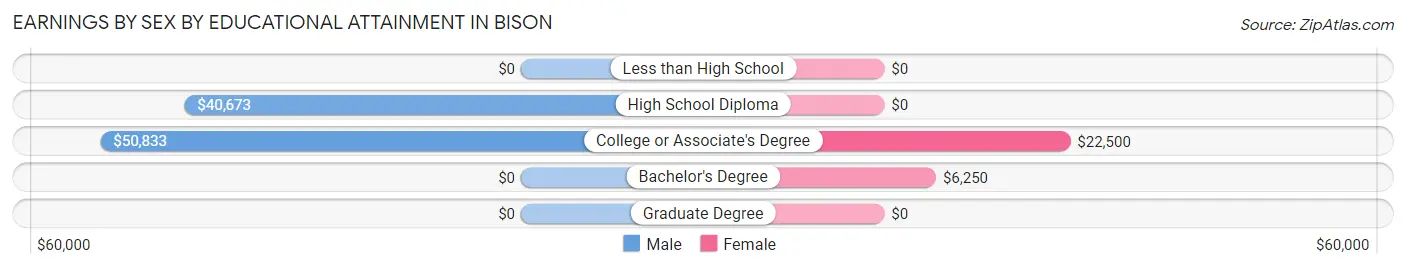
Earnings by Sex by Educational Attainment in Bison
| Educational Attainment | Male Income | Female Income |
| Less than High School | - | - |
| High School Diploma | $40,673 | $0 |
| College or Associate's Degree | $50,833 | $22,500 |
| Bachelor's Degree | - | - |
| Graduate Degree | - | - |
| Total | $46,111 | $0 |
Family Income in Bison
Family Income Brackets in Bison
According to the Bison family income data, there are 34 families falling into the $50,000 to $74,999 income range, which is the most common income bracket and makes up 57.6% of all families.
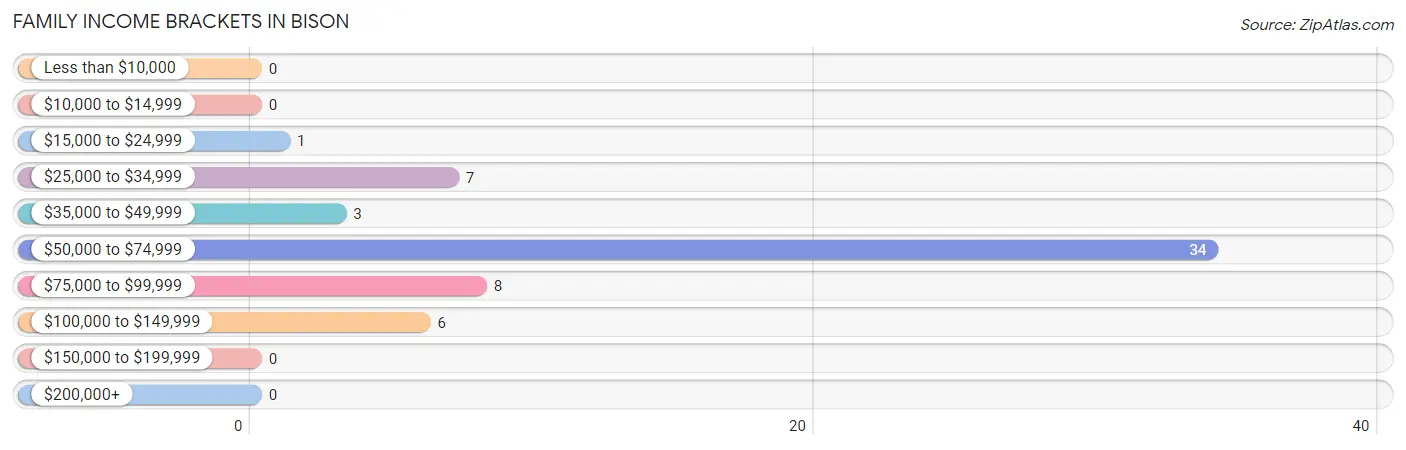
| Income Bracket | # Families | % Families |
| Less than $10,000 | 0 | 0.0% |
| $10,000 to $14,999 | 0 | 0.0% |
| $15,000 to $24,999 | 1 | 1.7% |
| $25,000 to $34,999 | 7 | 11.9% |
| $35,000 to $49,999 | 3 | 5.1% |
| $50,000 to $74,999 | 34 | 57.6% |
| $75,000 to $99,999 | 8 | 13.6% |
| $100,000 to $149,999 | 6 | 10.2% |
| $150,000 to $199,999 | 0 | 0.0% |
| $200,000+ | 0 | 0.0% |
Family Income by Famaliy Size in Bison
2-person families (39 | 66.1%) account for the highest median family income in Bison with $64,145 per family, while 2-person families (39 | 66.1%) have the highest median income of $32,072 per family member.
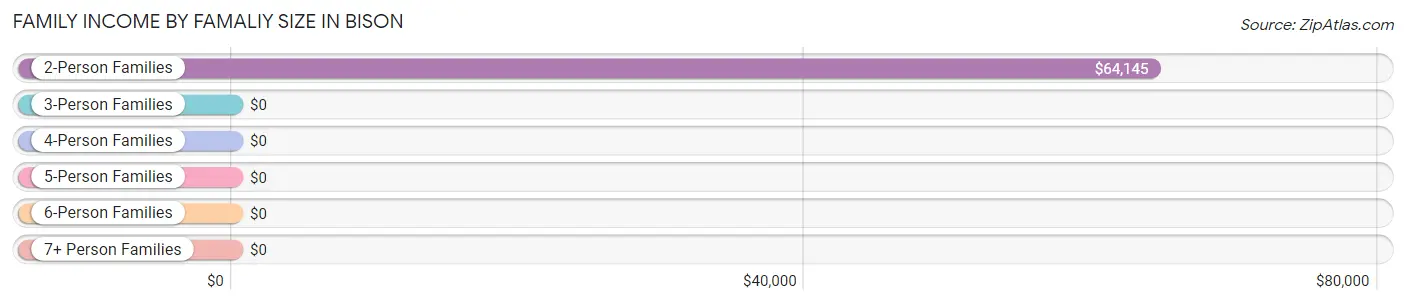
| Income Bracket | # Families | Median Income |
| 2-Person Families | 39 (66.1%) | $64,145 |
| 3-Person Families | 2 (3.4%) | $0 |
| 4-Person Families | 14 (23.7%) | $0 |
| 5-Person Families | 4 (6.8%) | $0 |
| 6-Person Families | 0 (0.0%) | $0 |
| 7+ Person Families | 0 (0.0%) | $0 |
| Total | 59 (100.0%) | $63,092 |
Family Income by Number of Earners in Bison
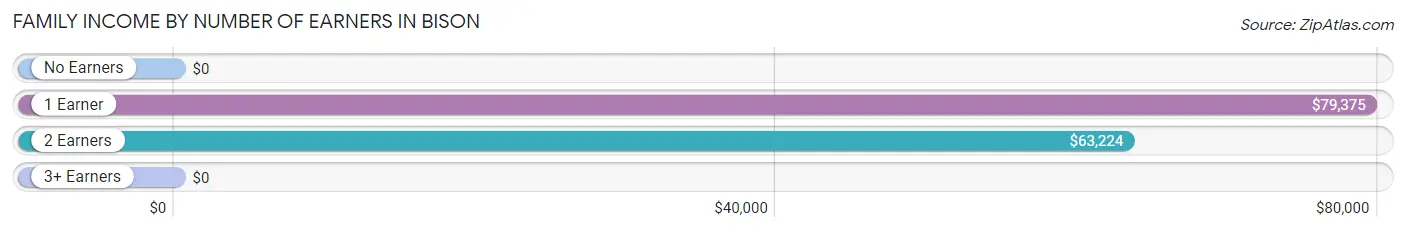
| Number of Earners | # Families | Median Income |
| No Earners | 7 (11.9%) | $0 |
| 1 Earner | 11 (18.6%) | $79,375 |
| 2 Earners | 37 (62.7%) | $63,224 |
| 3+ Earners | 4 (6.8%) | $0 |
| Total | 59 (100.0%) | $63,092 |
Household Income in Bison
Household Income Brackets in Bison
With 38 households falling in the category, the $50,000 to $74,999 income range is the most frequent in Bison, accounting for 47.5% of all households.
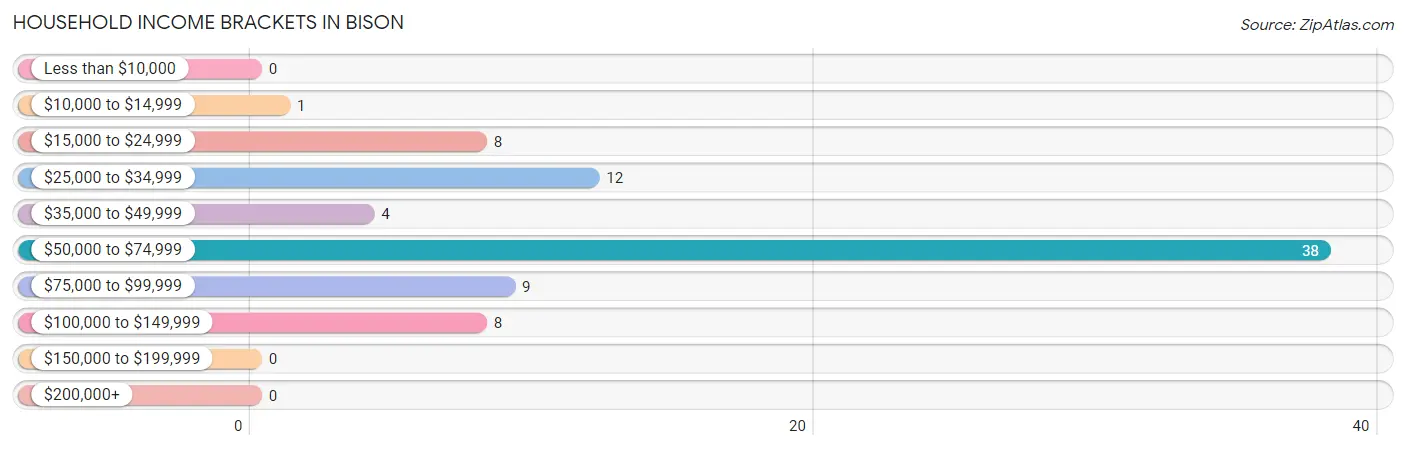
| Income Bracket | # Households | % Households |
| Less than $10,000 | 0 | 0.0% |
| $10,000 to $14,999 | 1 | 1.3% |
| $15,000 to $24,999 | 8 | 10.0% |
| $25,000 to $34,999 | 12 | 15.0% |
| $35,000 to $49,999 | 4 | 5.0% |
| $50,000 to $74,999 | 38 | 47.5% |
| $75,000 to $99,999 | 9 | 11.3% |
| $100,000 to $149,999 | 8 | 10.0% |
| $150,000 to $199,999 | 0 | 0.0% |
| $200,000+ | 0 | 0.0% |
Household Income by Householder Age in Bison
The median household income in Bison is $61,875, with the highest median household income of $63,365 found in the 45 to 64 years age bracket for the primary householder. A total of 35 households (43.8%) fall into this category.
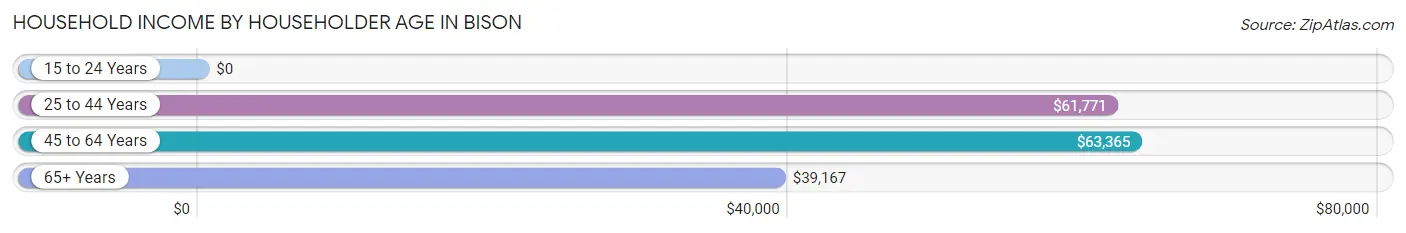
| Income Bracket | # Households | Median Income |
| 15 to 24 Years | 0 (0.0%) | $0 |
| 25 to 44 Years | 25 (31.2%) | $61,771 |
| 45 to 64 Years | 35 (43.8%) | $63,365 |
| 65+ Years | 20 (25.0%) | $39,167 |
| Total | 80 (100.0%) | $61,875 |
Poverty in Bison
Income Below Poverty by Sex and Age in Bison
With 19.4% poverty level for males and 24.3% for females among the residents of Bison, 6 to 11 year old males and 45 to 54 year old females are the most vulnerable to poverty, with 4 males (80.0%) and 12 females (75.0%) in their respective age groups living below the poverty level.
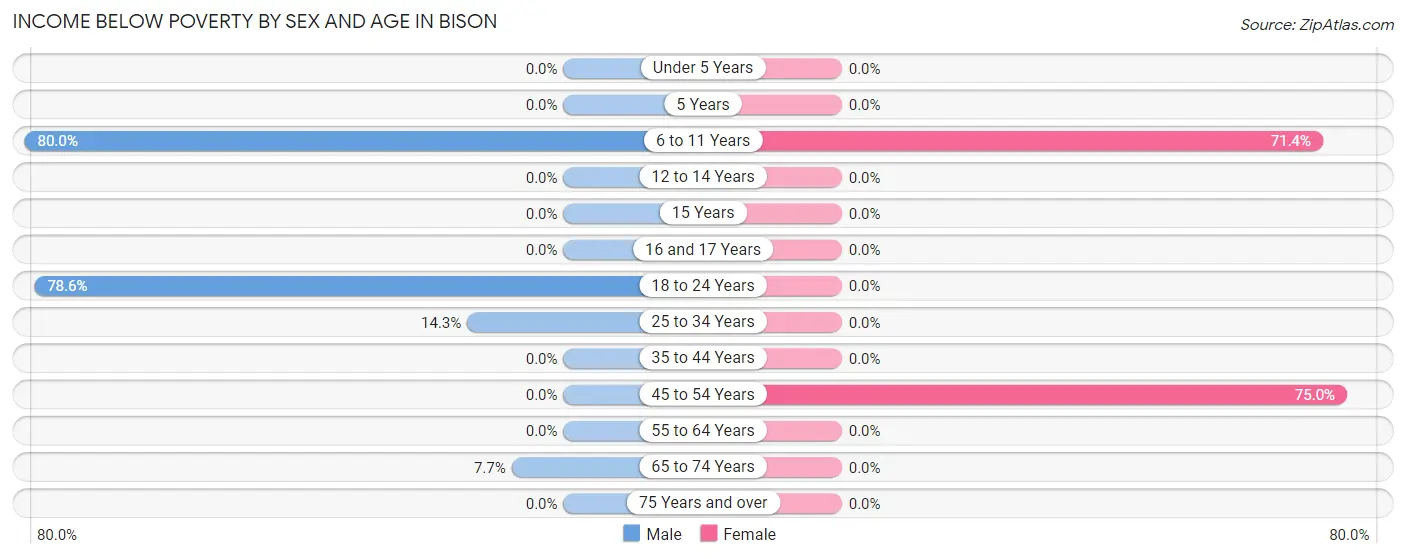
| Age Bracket | Male | Female |
| Under 5 Years | 0 (0.0%) | 0 (0.0%) |
| 5 Years | 0 (0.0%) | 0 (0.0%) |
| 6 to 11 Years | 4 (80.0%) | 5 (71.4%) |
| 12 to 14 Years | 0 (0.0%) | 0 (0.0%) |
| 15 Years | 0 (0.0%) | 0 (0.0%) |
| 16 and 17 Years | 0 (0.0%) | 0 (0.0%) |
| 18 to 24 Years | 11 (78.6%) | 0 (0.0%) |
| 25 to 34 Years | 4 (14.3%) | 0 (0.0%) |
| 35 to 44 Years | 0 (0.0%) | 0 (0.0%) |
| 45 to 54 Years | 0 (0.0%) | 12 (75.0%) |
| 55 to 64 Years | 0 (0.0%) | 0 (0.0%) |
| 65 to 74 Years | 1 (7.7%) | 0 (0.0%) |
| 75 Years and over | 0 (0.0%) | 0 (0.0%) |
| Total | 20 (19.4%) | 17 (24.3%) |
Income Above Poverty by Sex and Age in Bison
According to the poverty statistics in Bison, males aged under 5 years and females aged under 5 years are the age groups that are most secure financially, with 100.0% of males and 100.0% of females in these age groups living above the poverty line.
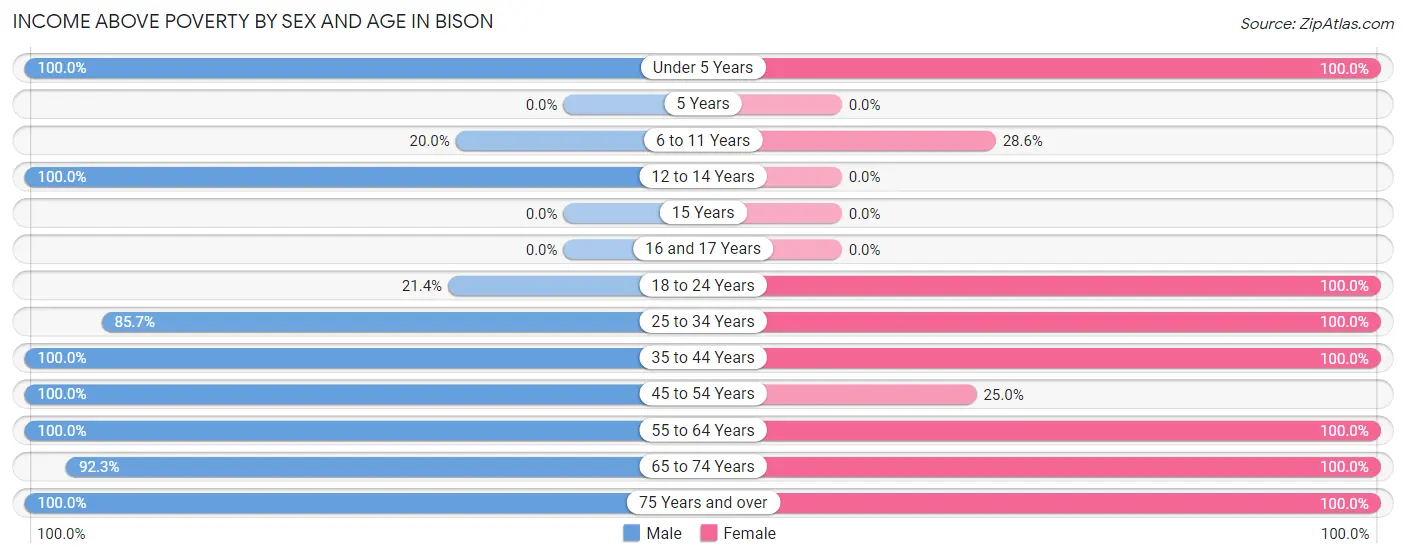
| Age Bracket | Male | Female |
| Under 5 Years | 5 (100.0%) | 2 (100.0%) |
| 5 Years | 0 (0.0%) | 0 (0.0%) |
| 6 to 11 Years | 1 (20.0%) | 2 (28.6%) |
| 12 to 14 Years | 1 (100.0%) | 0 (0.0%) |
| 15 Years | 0 (0.0%) | 0 (0.0%) |
| 16 and 17 Years | 0 (0.0%) | 0 (0.0%) |
| 18 to 24 Years | 3 (21.4%) | 11 (100.0%) |
| 25 to 34 Years | 24 (85.7%) | 6 (100.0%) |
| 35 to 44 Years | 2 (100.0%) | 2 (100.0%) |
| 45 to 54 Years | 2 (100.0%) | 4 (25.0%) |
| 55 to 64 Years | 29 (100.0%) | 15 (100.0%) |
| 65 to 74 Years | 12 (92.3%) | 8 (100.0%) |
| 75 Years and over | 4 (100.0%) | 3 (100.0%) |
| Total | 83 (80.6%) | 53 (75.7%) |
Income Below Poverty Among Married-Couple Families in Bison
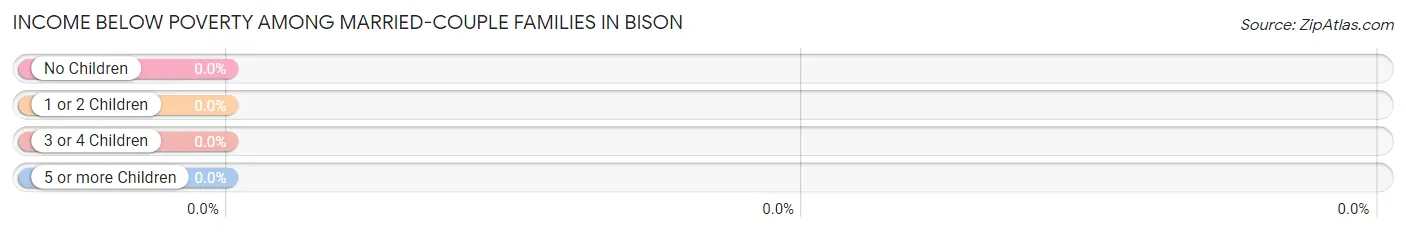
| Children | Above Poverty | Below Poverty |
| No Children | 37 (100.0%) | 0 (0.0%) |
| 1 or 2 Children | 14 (100.0%) | 0 (0.0%) |
| 3 or 4 Children | 0 (0.0%) | 0 (0.0%) |
| 5 or more Children | 0 (0.0%) | 0 (0.0%) |
| Total | 51 (100.0%) | 0 (0.0%) |
Income Below Poverty Among Single-Parent Households in Bison
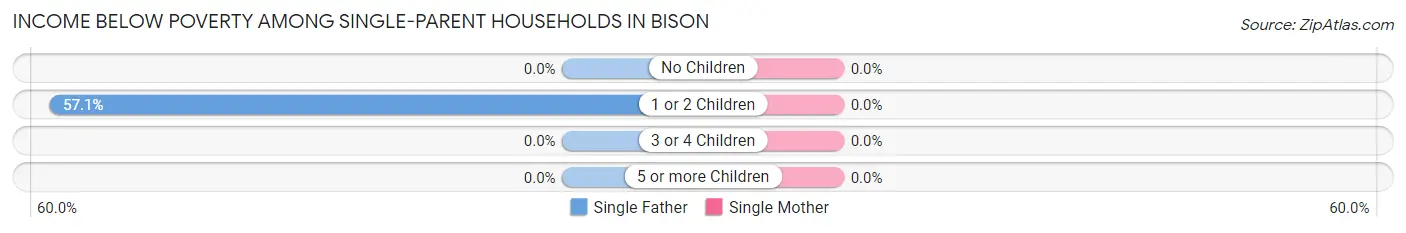
| Children | Single Father | Single Mother |
| No Children | 0 (0.0%) | 0 (0.0%) |
| 1 or 2 Children | 4 (57.1%) | 0 (0.0%) |
| 3 or 4 Children | 0 (0.0%) | 0 (0.0%) |
| 5 or more Children | 0 (0.0%) | 0 (0.0%) |
| Total | 4 (57.1%) | 0 (0.0%) |
Income Below Poverty Among Married-Couple vs Single-Parent Households in Bison
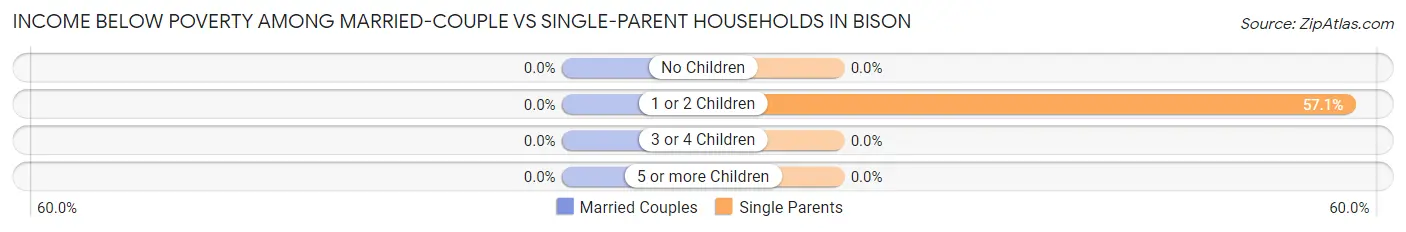
| Children | Married-Couple Families | Single-Parent Households |
| No Children | 0 (0.0%) | 0 (0.0%) |
| 1 or 2 Children | 0 (0.0%) | 4 (57.1%) |
| 3 or 4 Children | 0 (0.0%) | 0 (0.0%) |
| 5 or more Children | 0 (0.0%) | 0 (0.0%) |
| Total | 0 (0.0%) | 4 (50.0%) |
Race in Bison
The most populous races in Bison are White / Caucasian (152 | 87.9%), Hispanic or Latino (29 | 16.8%), and Two or more Races (21 | 12.1%).
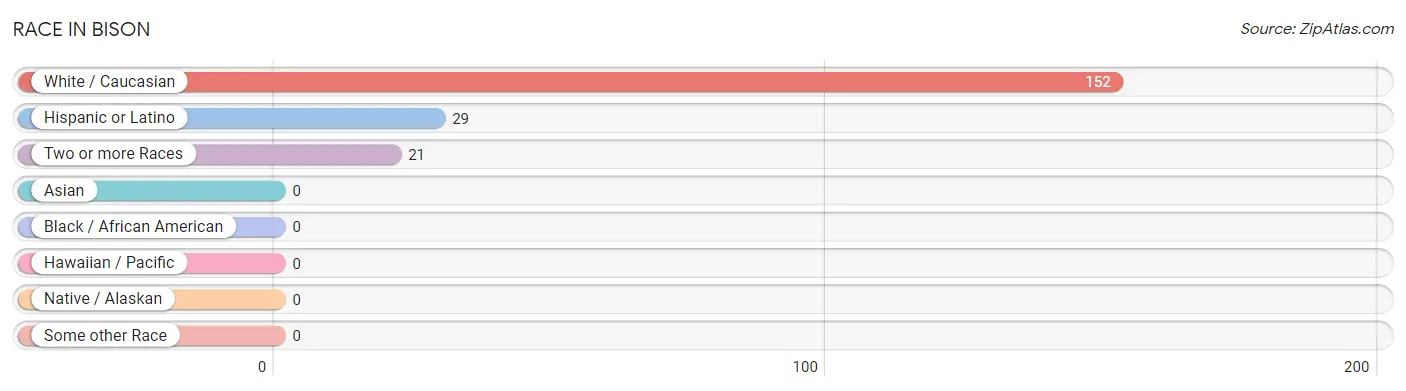
| Race | # Population | % Population |
| Asian | 0 | 0.0% |
| Black / African American | 0 | 0.0% |
| Hawaiian / Pacific | 0 | 0.0% |
| Hispanic or Latino | 29 | 16.8% |
| Native / Alaskan | 0 | 0.0% |
| White / Caucasian | 152 | 87.9% |
| Two or more Races | 21 | 12.1% |
| Some other Race | 0 | 0.0% |
| Total | 173 | 100.0% |
Ancestry in Bison
The most populous ancestries reported in Bison are German (68 | 39.3%), Mexican (27 | 15.6%), Czech (16 | 9.2%), Irish (15 | 8.7%), and English (12 | 6.9%), together accounting for 79.8% of all Bison residents.
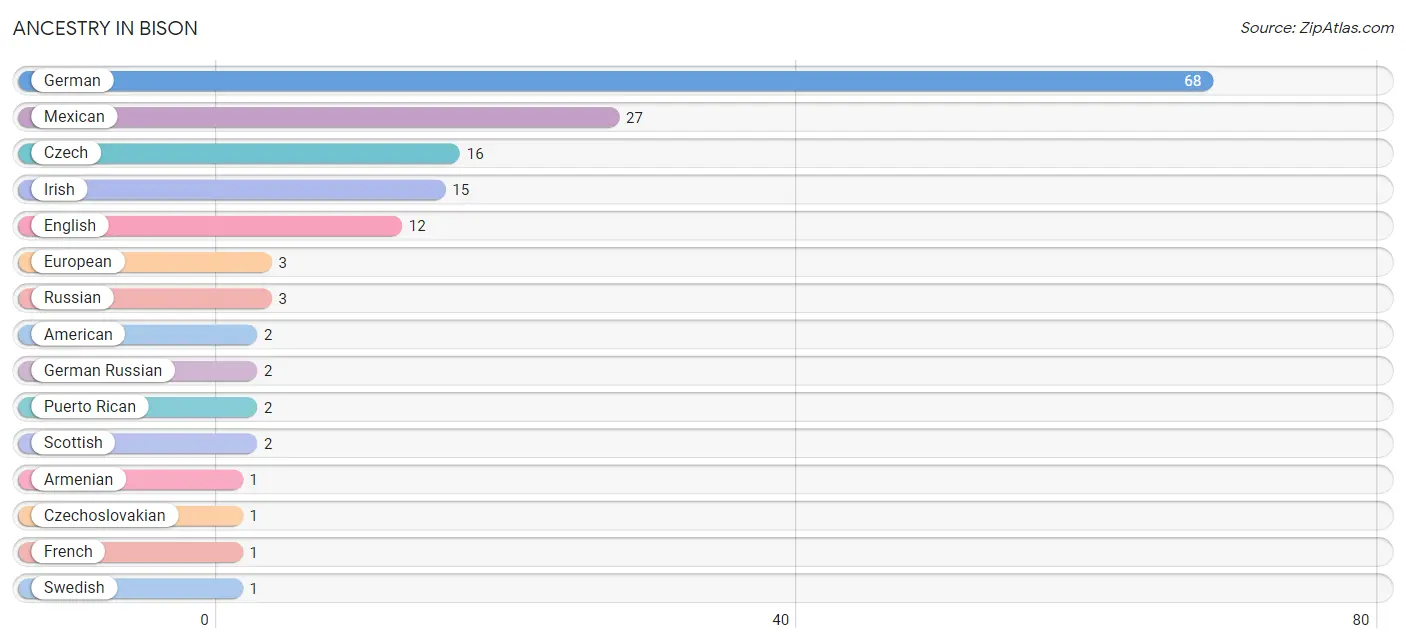
| Ancestry | # Population | % Population |
| American | 2 | 1.2% |
| Armenian | 1 | 0.6% |
| Czech | 16 | 9.2% |
| Czechoslovakian | 1 | 0.6% |
| English | 12 | 6.9% |
| European | 3 | 1.7% |
| French | 1 | 0.6% |
| German | 68 | 39.3% |
| German Russian | 2 | 1.2% |
| Irish | 15 | 8.7% |
| Mexican | 27 | 15.6% |
| Puerto Rican | 2 | 1.2% |
| Russian | 3 | 1.7% |
| Scottish | 2 | 1.2% |
| Swedish | 1 | 0.6% |
| Welsh | 1 | 0.6% | View All 16 Rows |
Immigrants in Bison

| Immigration Origin | # Population | % Population | View All 0 Rows |
Sex and Age in Bison
Sex and Age in Bison
The most populous age groups in Bison are 60 to 64 Years (27 | 26.2%) for men and 50 to 54 Years (12 | 17.1%) for women.
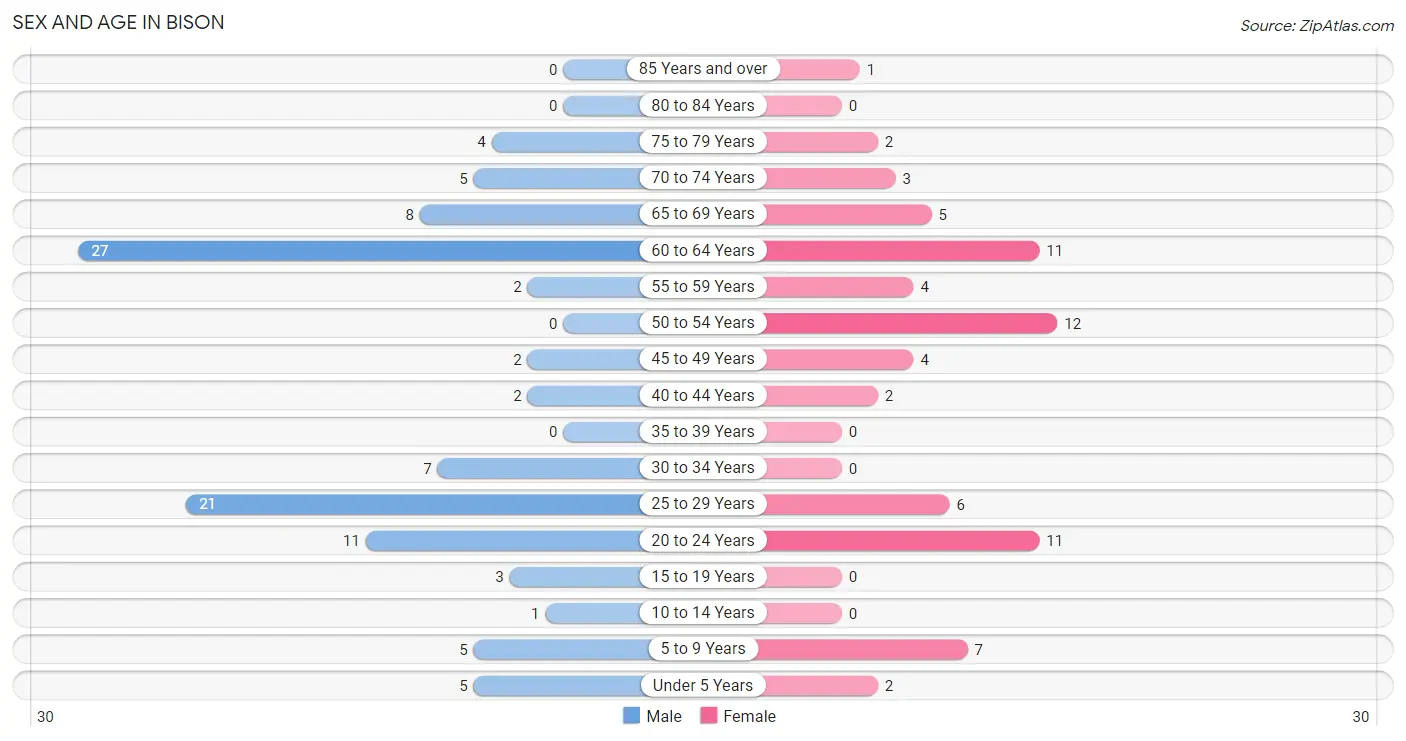
| Age Bracket | Male | Female |
| Under 5 Years | 5 (4.9%) | 2 (2.9%) |
| 5 to 9 Years | 5 (4.9%) | 7 (10.0%) |
| 10 to 14 Years | 1 (1.0%) | 0 (0.0%) |
| 15 to 19 Years | 3 (2.9%) | 0 (0.0%) |
| 20 to 24 Years | 11 (10.7%) | 11 (15.7%) |
| 25 to 29 Years | 21 (20.4%) | 6 (8.6%) |
| 30 to 34 Years | 7 (6.8%) | 0 (0.0%) |
| 35 to 39 Years | 0 (0.0%) | 0 (0.0%) |
| 40 to 44 Years | 2 (1.9%) | 2 (2.9%) |
| 45 to 49 Years | 2 (1.9%) | 4 (5.7%) |
| 50 to 54 Years | 0 (0.0%) | 12 (17.1%) |
| 55 to 59 Years | 2 (1.9%) | 4 (5.7%) |
| 60 to 64 Years | 27 (26.2%) | 11 (15.7%) |
| 65 to 69 Years | 8 (7.8%) | 5 (7.1%) |
| 70 to 74 Years | 5 (4.9%) | 3 (4.3%) |
| 75 to 79 Years | 4 (3.9%) | 2 (2.9%) |
| 80 to 84 Years | 0 (0.0%) | 0 (0.0%) |
| 85 Years and over | 0 (0.0%) | 1 (1.4%) |
| Total | 103 (100.0%) | 70 (100.0%) |
Families and Households in Bison
Median Family Size in Bison
The median family size in Bison is 2.56 persons per family, with single male/father families (7 | 11.9%) accounting for the largest median family size of 6.43 persons per family. On the other hand, married-couple families (51 | 86.4%) represent the smallest median family size with 2.02 persons per family.
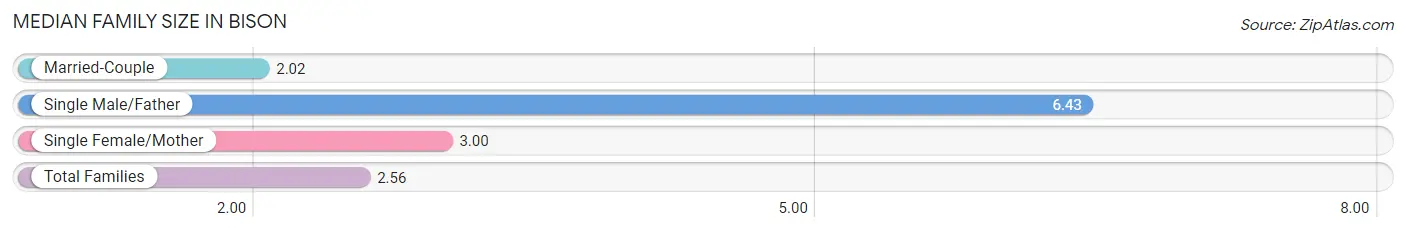
| Family Type | # Families | Family Size |
| Married-Couple | 51 (86.4%) | 2.02 |
| Single Male/Father | 7 (11.9%) | 6.43 |
| Single Female/Mother | 1 (1.7%) | 3.00 |
| Total Families | 59 (100.0%) | 2.56 |
Median Household Size in Bison
The median household size in Bison is 2.16 persons per household, with single male/father households (7 | 8.7%) accounting for the largest median household size of 6.43 persons per household. non-family households (21 | 26.3%) represent the smallest median household size with 1.05 persons per household.
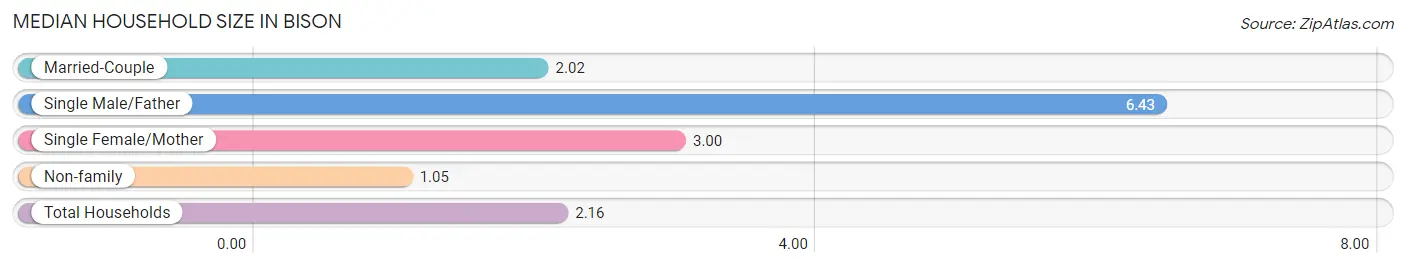
| Household Type | # Households | Household Size |
| Married-Couple | 51 (63.7%) | 2.02 |
| Single Male/Father | 7 (8.7%) | 6.43 |
| Single Female/Mother | 1 (1.3%) | 3.00 |
| Non-family | 21 (26.3%) | 1.05 |
| Total Households | 80 (100.0%) | 2.16 |
Household Size by Marriage Status in Bison
Out of a total of 80 households in Bison, 59 (73.8%) are family households, while 21 (26.3%) are nonfamily households. The most numerous type of family households are 2-person households, comprising 39, and the most common type of nonfamily households are 1-person households, comprising 20.
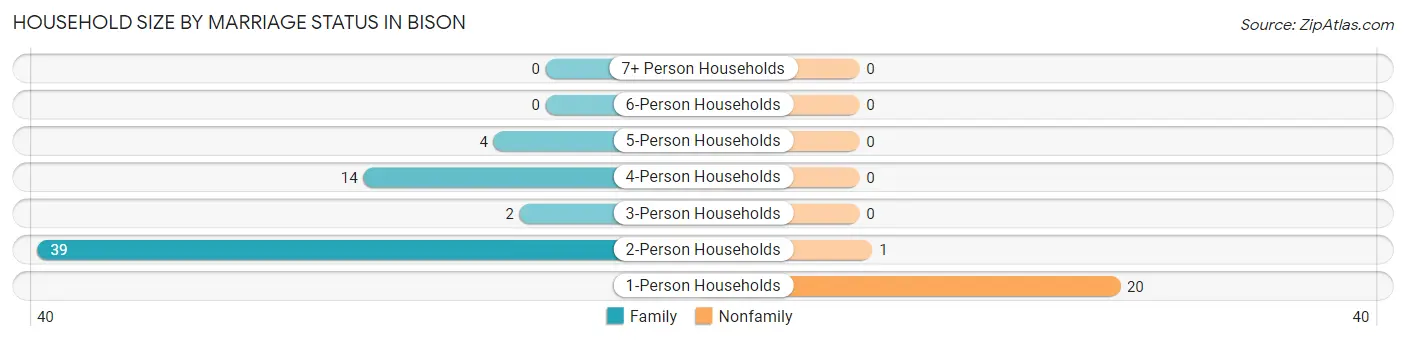
| Household Size | Family Households | Nonfamily Households |
| 1-Person Households | - | 20 (25.0%) |
| 2-Person Households | 39 (48.7%) | 1 (1.3%) |
| 3-Person Households | 2 (2.5%) | 0 (0.0%) |
| 4-Person Households | 14 (17.5%) | 0 (0.0%) |
| 5-Person Households | 4 (5.0%) | 0 (0.0%) |
| 6-Person Households | 0 (0.0%) | 0 (0.0%) |
| 7+ Person Households | 0 (0.0%) | 0 (0.0%) |
| Total | 59 (73.8%) | 21 (26.3%) |
Female Fertility in Bison
Fertility by Age in Bison
| Age Bracket | Women with Births | Births / 1,000 Women |
| 15 to 19 years | 0 (0.0%) | 0.0 |
| 20 to 34 years | 0 (0.0%) | 0.0 |
| 35 to 50 years | 0 (0.0%) | 0.0 |
| Total | 0 (0.0%) | 0.0 |
Fertility by Age by Marriage Status in Bison
| Age Bracket | Married | Unmarried |
| 15 to 19 years | 0 (0.0%) | 0 (0.0%) |
| 20 to 34 years | 0 (0.0%) | 0 (0.0%) |
| 35 to 50 years | 0 (0.0%) | 0 (0.0%) |
| Total | 0 (0.0%) | 0 (0.0%) |
Fertility by Education in Bison
| Educational Attainment | Women with Births | Births / 1,000 Women |
| Less than High School | 0 (0.0%) | 0.0 |
| High School Diploma | 0 (0.0%) | 0.0 |
| College or Associate's Degree | 0 (0.0%) | 0.0 |
| Bachelor's Degree | 0 (0.0%) | 0.0 |
| Graduate Degree | 0 (0.0%) | 0.0 |
| Total | 0 (0.0%) | 0.0 |
Fertility by Education by Marriage Status in Bison
| Educational Attainment | Married | Unmarried |
| Less than High School | 0 (0.0%) | 0 (0.0%) |
| High School Diploma | 0 (0.0%) | 0 (0.0%) |
| College or Associate's Degree | 0 (0.0%) | 0 (0.0%) |
| Bachelor's Degree | 0 (0.0%) | 0 (0.0%) |
| Graduate Degree | 0 (0.0%) | 0 (0.0%) |
| Total | 0 (0.0%) | 0 (0.0%) |
Employment Characteristics in Bison
Employment by Class of Employer in Bison
Among the 90 employed individuals in Bison, private company employees (75 | 83.3%), not-for-profit organizations (8 | 8.9%), and local government employees (5 | 5.6%) make up the most common classes of employment.
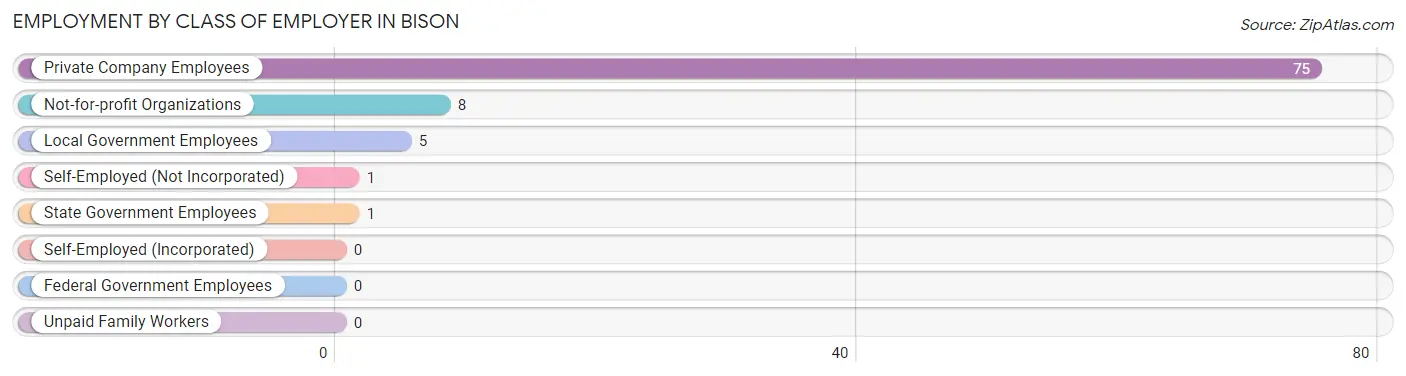
| Employer Class | # Employees | % Employees |
| Private Company Employees | 75 | 83.3% |
| Self-Employed (Incorporated) | 0 | 0.0% |
| Self-Employed (Not Incorporated) | 1 | 1.1% |
| Not-for-profit Organizations | 8 | 8.9% |
| Local Government Employees | 5 | 5.6% |
| State Government Employees | 1 | 1.1% |
| Federal Government Employees | 0 | 0.0% |
| Unpaid Family Workers | 0 | 0.0% |
| Total | 90 | 100.0% |
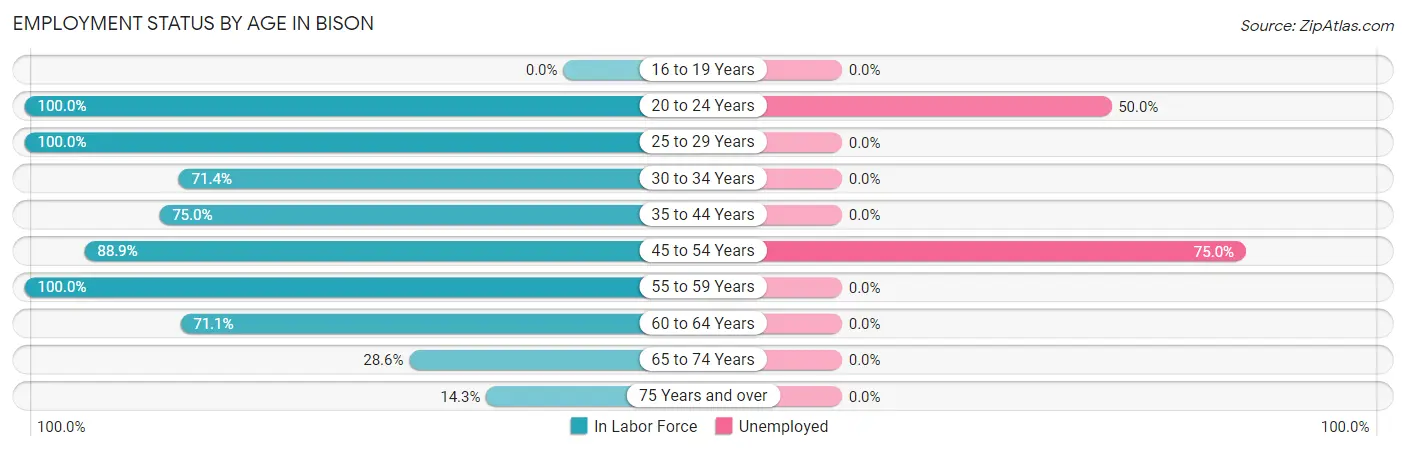
Employment Status by Age in Bison
According to the labor force statistics for Bison, out of the total population over 16 years of age (153), 73.9% or 113 individuals are in the labor force, with 20.4% or 23 of them unemployed. The age group with the highest labor force participation rate is 20 to 24 years, with 100.0% or 22 individuals in the labor force. Within the labor force, the 45 to 54 years age range has the highest percentage of unemployed individuals, with 75.0% or 12 of them being unemployed.
| Age Bracket | In Labor Force | Unemployed |
| 16 to 19 Years | 0 (0.0%) | 0 (0.0%) |
| 20 to 24 Years | 22 (100.0%) | 11 (50.0%) |
| 25 to 29 Years | 27 (100.0%) | 0 (0.0%) |
| 30 to 34 Years | 5 (71.4%) | 0 (0.0%) |
| 35 to 44 Years | 3 (75.0%) | 0 (0.0%) |
| 45 to 54 Years | 16 (88.9%) | 12 (75.0%) |
| 55 to 59 Years | 6 (100.0%) | 0 (0.0%) |
| 60 to 64 Years | 27 (71.1%) | 0 (0.0%) |
| 65 to 74 Years | 6 (28.6%) | 0 (0.0%) |
| 75 Years and over | 1 (14.3%) | 0 (0.0%) |
| Total | 113 (73.9%) | 23 (20.4%) |
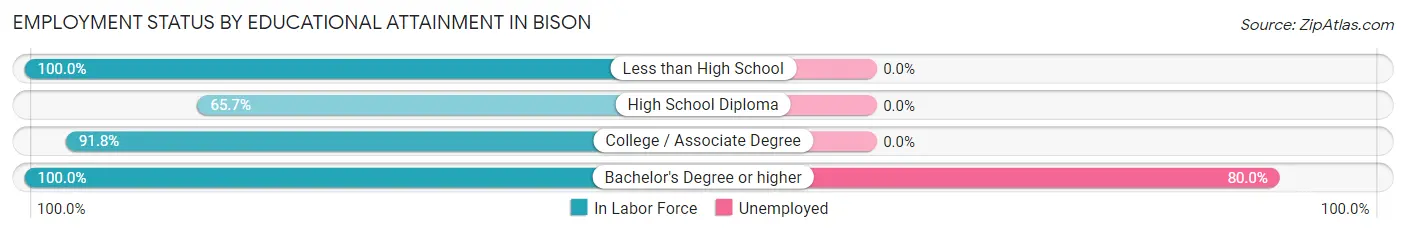
Employment Status by Educational Attainment in Bison
According to labor force statistics for Bison, 84.0% of individuals (84) out of the total population between 25 and 64 years of age (100) are in the labor force, with 14.3% or 12 of them being unemployed. The group with the highest labor force participation rate are those with the educational attainment of less than high school, with 100.0% or 1 individuals in the labor force. Within the labor force, individuals with bachelor's degree or higher education have the highest percentage of unemployment, with 80.0% or 12 of them being unemployed.
| Educational Attainment | In Labor Force | Unemployed |
| Less than High School | 1 (100.0%) | 0 (0.0%) |
| High School Diploma | 23 (65.7%) | 0 (0.0%) |
| College / Associate Degree | 45 (91.8%) | 0 (0.0%) |
| Bachelor's Degree or higher | 15 (100.0%) | 12 (80.0%) |
| Total | 84 (84.0%) | 14 (14.3%) |
Employment Occupations by Sex in Bison
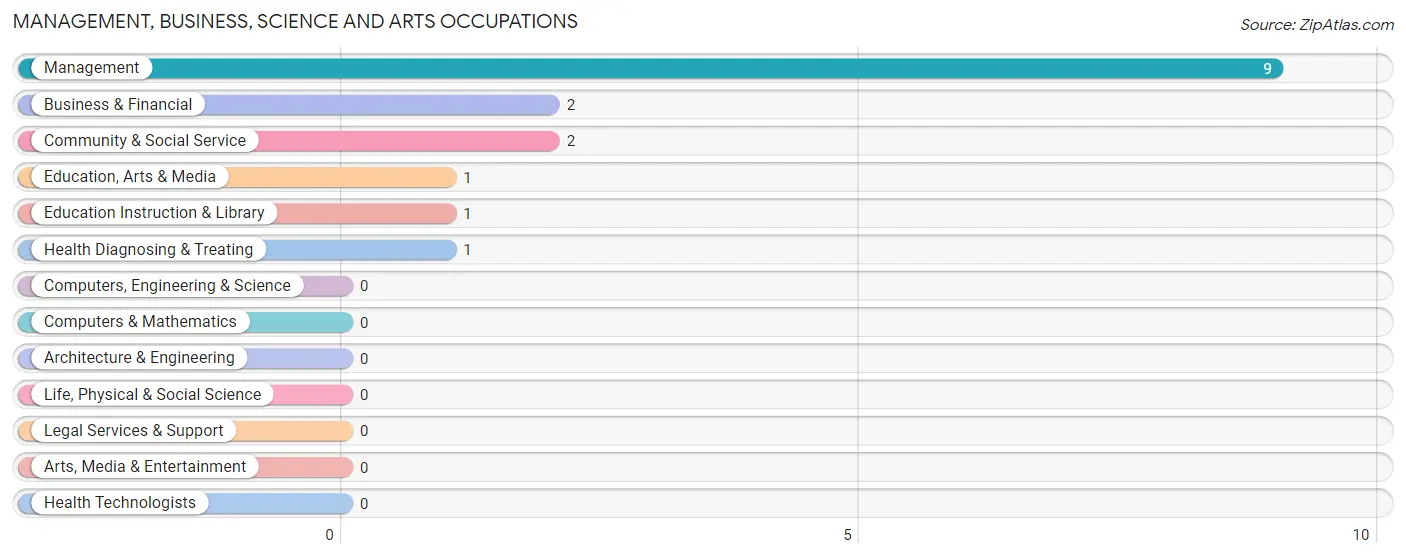
Management, Business, Science and Arts Occupations
The most common Management, Business, Science and Arts occupations in Bison are Management (9 | 10.0%), Business & Financial (2 | 2.2%), Community & Social Service (2 | 2.2%), Education, Arts & Media (1 | 1.1%), and Education Instruction & Library (1 | 1.1%).
Management, Business, Science and Arts Occupations by Sex
Within the Management, Business, Science and Arts occupations in Bison, the most male-oriented occupations are Education Instruction & Library (100.0%), Business & Financial (50.0%), and Community & Social Service (50.0%), while the most female-oriented occupations are Education, Arts & Media (100.0%), Health Diagnosing & Treating (100.0%), and Management (77.8%).
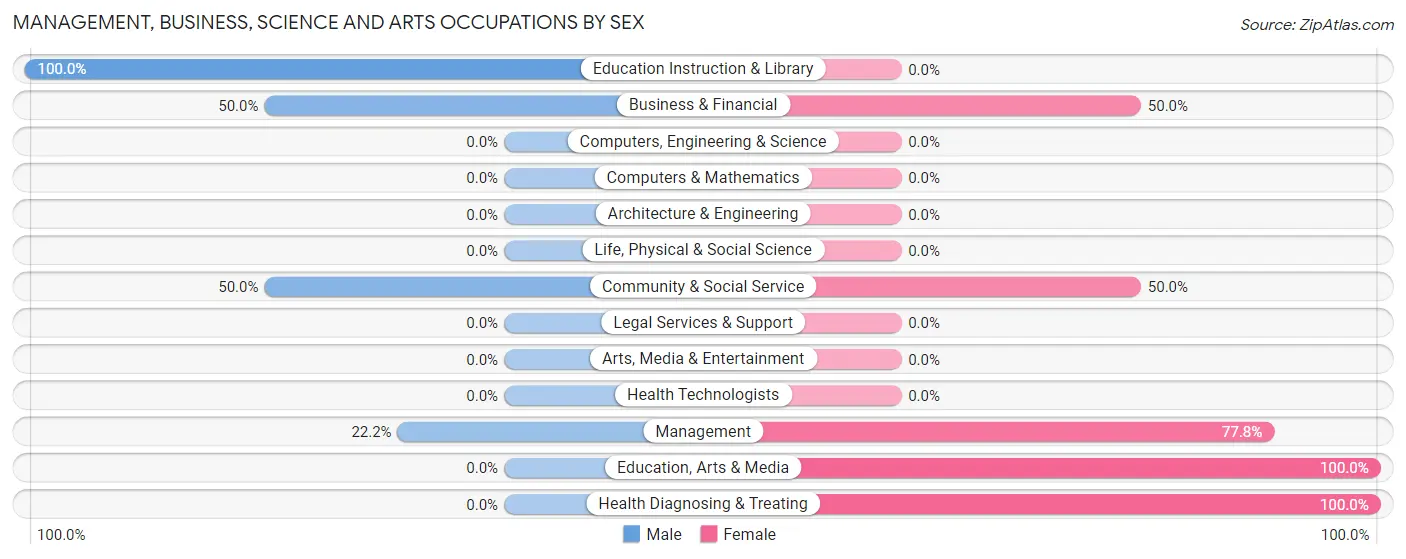
| Occupation | Male | Female |
| Management | 2 (22.2%) | 7 (77.8%) |
| Business & Financial | 1 (50.0%) | 1 (50.0%) |
| Computers, Engineering & Science | 0 (0.0%) | 0 (0.0%) |
| Computers & Mathematics | 0 (0.0%) | 0 (0.0%) |
| Architecture & Engineering | 0 (0.0%) | 0 (0.0%) |
| Life, Physical & Social Science | 0 (0.0%) | 0 (0.0%) |
| Community & Social Service | 1 (50.0%) | 1 (50.0%) |
| Education, Arts & Media | 0 (0.0%) | 1 (100.0%) |
| Legal Services & Support | 0 (0.0%) | 0 (0.0%) |
| Education Instruction & Library | 1 (100.0%) | 0 (0.0%) |
| Arts, Media & Entertainment | 0 (0.0%) | 0 (0.0%) |
| Health Diagnosing & Treating | 0 (0.0%) | 1 (100.0%) |
| Health Technologists | 0 (0.0%) | 0 (0.0%) |
| Total (Category) | 4 (28.6%) | 10 (71.4%) |
| Total (Overall) | 54 (60.0%) | 36 (40.0%) |
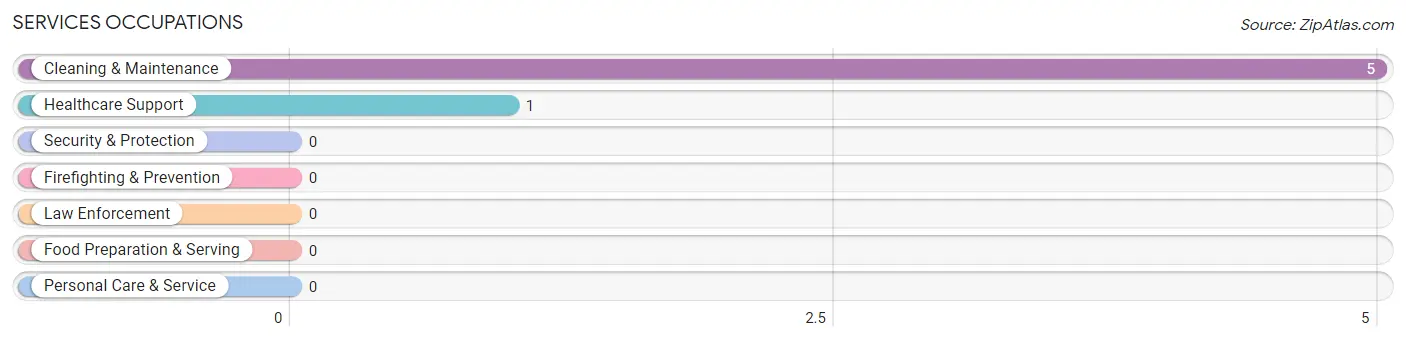
Services Occupations
The most common Services occupations in Bison are Cleaning & Maintenance (5 | 5.6%), and Healthcare Support (1 | 1.1%).
Services Occupations by Sex
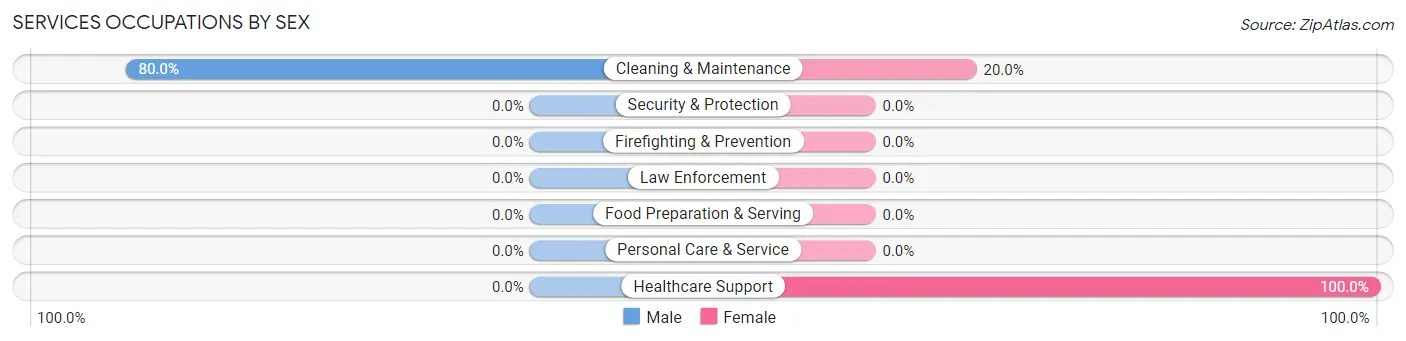
| Occupation | Male | Female |
| Healthcare Support | 0 (0.0%) | 1 (100.0%) |
| Security & Protection | 0 (0.0%) | 0 (0.0%) |
| Firefighting & Prevention | 0 (0.0%) | 0 (0.0%) |
| Law Enforcement | 0 (0.0%) | 0 (0.0%) |
| Food Preparation & Serving | 0 (0.0%) | 0 (0.0%) |
| Cleaning & Maintenance | 4 (80.0%) | 1 (20.0%) |
| Personal Care & Service | 0 (0.0%) | 0 (0.0%) |
| Total (Category) | 4 (66.7%) | 2 (33.3%) |
| Total (Overall) | 54 (60.0%) | 36 (40.0%) |
Sales and Office Occupations
The most common Sales and Office occupations in Bison are Office & Administration (11 | 12.2%), and Sales & Related (4 | 4.4%).

Sales and Office Occupations by Sex

| Occupation | Male | Female |
| Sales & Related | 2 (50.0%) | 2 (50.0%) |
| Office & Administration | 0 (0.0%) | 11 (100.0%) |
| Total (Category) | 2 (13.3%) | 13 (86.7%) |
| Total (Overall) | 54 (60.0%) | 36 (40.0%) |
Natural Resources, Construction and Maintenance Occupations
The most common Natural Resources, Construction and Maintenance occupations in Bison are Construction & Extraction (10 | 11.1%), and Farming, Fishing & Forestry (2 | 2.2%).
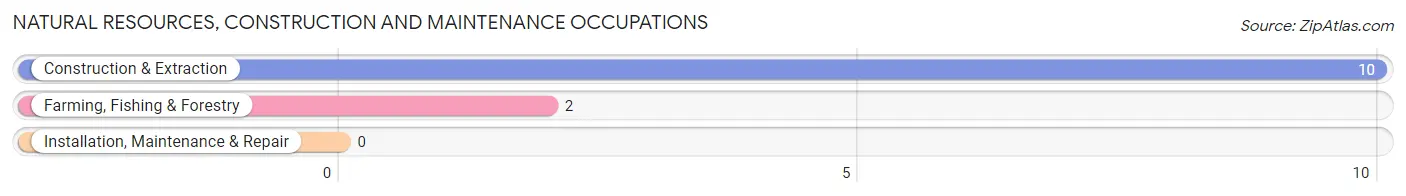
Natural Resources, Construction and Maintenance Occupations by Sex
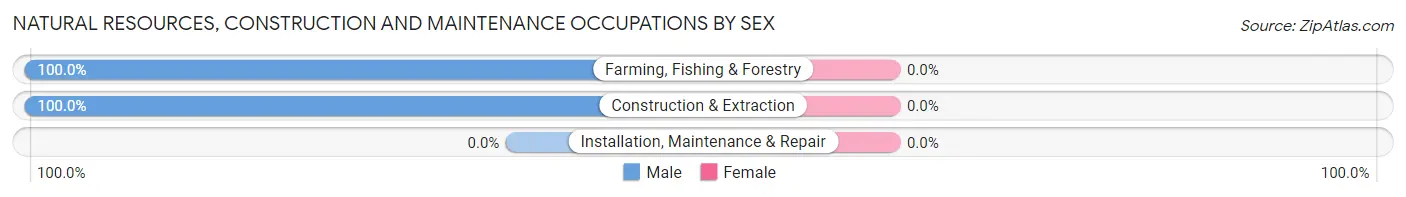
| Occupation | Male | Female |
| Farming, Fishing & Forestry | 2 (100.0%) | 0 (0.0%) |
| Construction & Extraction | 10 (100.0%) | 0 (0.0%) |
| Installation, Maintenance & Repair | 0 (0.0%) | 0 (0.0%) |
| Total (Category) | 12 (100.0%) | 0 (0.0%) |
| Total (Overall) | 54 (60.0%) | 36 (40.0%) |
Production, Transportation and Moving Occupations
The most common Production, Transportation and Moving occupations in Bison are Material Moving (24 | 26.7%), Production (15 | 16.7%), and Transportation (4 | 4.4%).
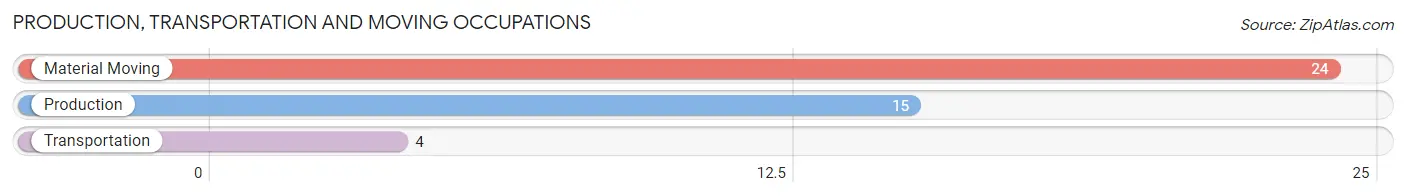
Production, Transportation and Moving Occupations by Sex
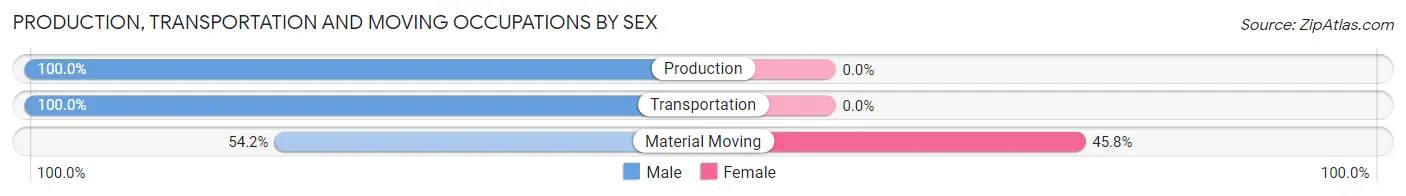
| Occupation | Male | Female |
| Production | 15 (100.0%) | 0 (0.0%) |
| Transportation | 4 (100.0%) | 0 (0.0%) |
| Material Moving | 13 (54.2%) | 11 (45.8%) |
| Total (Category) | 32 (74.4%) | 11 (25.6%) |
| Total (Overall) | 54 (60.0%) | 36 (40.0%) |
Employment Industries by Sex in Bison
Employment Industries in Bison
The major employment industries in Bison include Manufacturing (27 | 30.0%), Transportation & Warehousing (12 | 13.3%), Health Care & Social Assistance (11 | 12.2%), Construction (9 | 10.0%), and Information (7 | 7.8%).
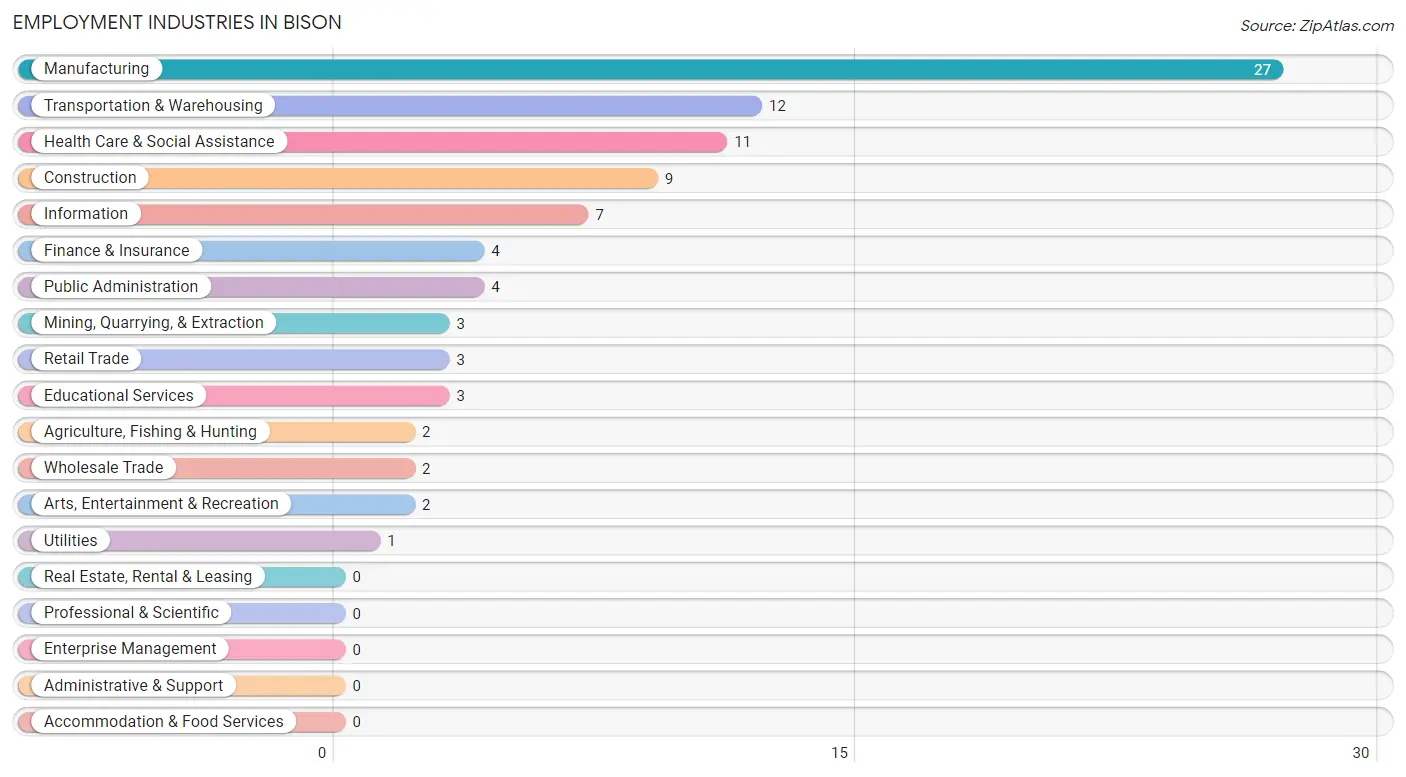
Employment Industries by Sex in Bison
The Bison industries that see more men than women are Agriculture, Fishing & Hunting (100.0%), Mining, Quarrying, & Extraction (100.0%), and Construction (100.0%), whereas the industries that tend to have a higher number of women are Utilities (100.0%), Information (100.0%), and Finance & Insurance (100.0%).
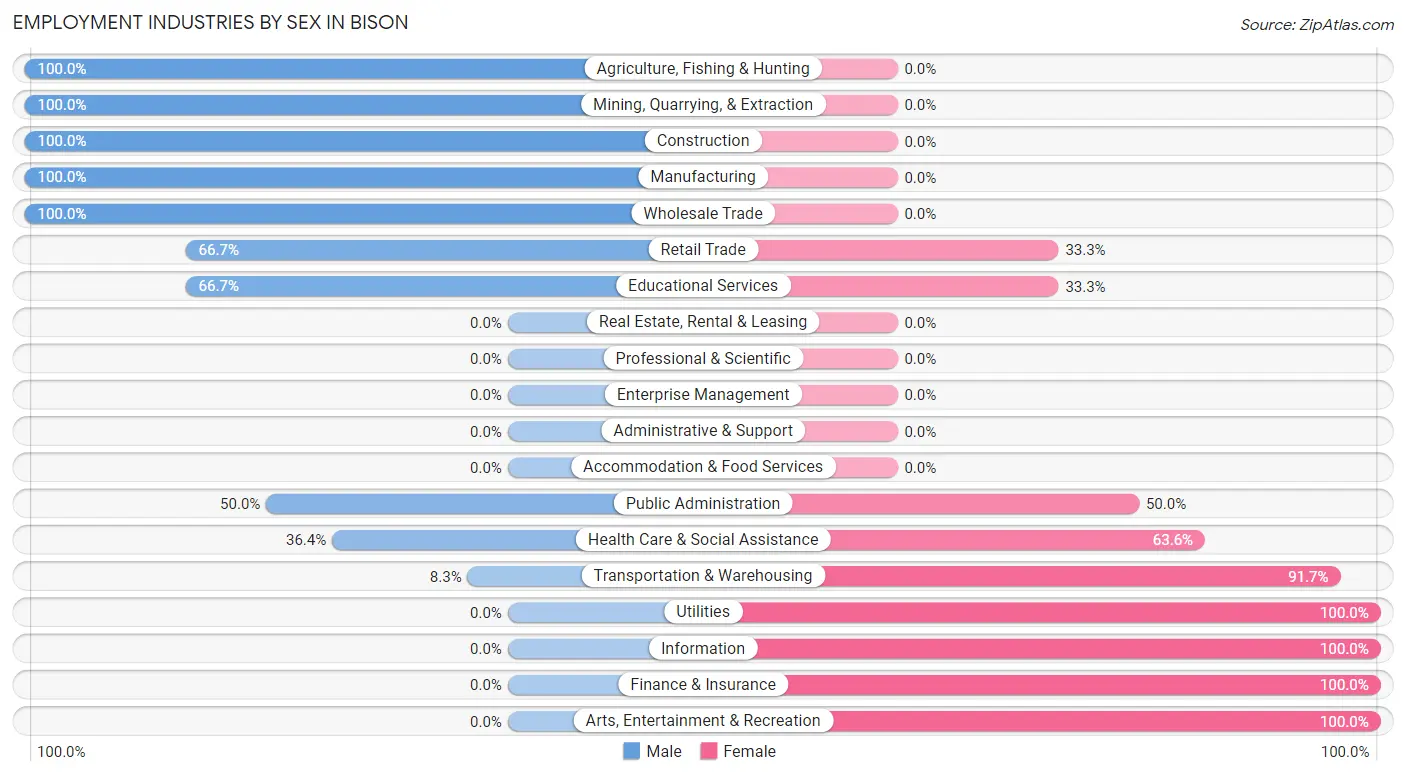
| Industry | Male | Female |
| Agriculture, Fishing & Hunting | 2 (100.0%) | 0 (0.0%) |
| Mining, Quarrying, & Extraction | 3 (100.0%) | 0 (0.0%) |
| Construction | 9 (100.0%) | 0 (0.0%) |
| Manufacturing | 27 (100.0%) | 0 (0.0%) |
| Wholesale Trade | 2 (100.0%) | 0 (0.0%) |
| Retail Trade | 2 (66.7%) | 1 (33.3%) |
| Transportation & Warehousing | 1 (8.3%) | 11 (91.7%) |
| Utilities | 0 (0.0%) | 1 (100.0%) |
| Information | 0 (0.0%) | 7 (100.0%) |
| Finance & Insurance | 0 (0.0%) | 4 (100.0%) |
| Real Estate, Rental & Leasing | 0 (0.0%) | 0 (0.0%) |
| Professional & Scientific | 0 (0.0%) | 0 (0.0%) |
| Enterprise Management | 0 (0.0%) | 0 (0.0%) |
| Administrative & Support | 0 (0.0%) | 0 (0.0%) |
| Educational Services | 2 (66.7%) | 1 (33.3%) |
| Health Care & Social Assistance | 4 (36.4%) | 7 (63.6%) |
| Arts, Entertainment & Recreation | 0 (0.0%) | 2 (100.0%) |
| Accommodation & Food Services | 0 (0.0%) | 0 (0.0%) |
| Public Administration | 2 (50.0%) | 2 (50.0%) |
| Total | 54 (60.0%) | 36 (40.0%) |
Education in Bison
School Enrollment in Bison
The most common levels of schooling among the 18 students in Bison are elementary school (10 | 55.6%), high school (3 | 16.7%), and nursery / preschool (2 | 11.1%).
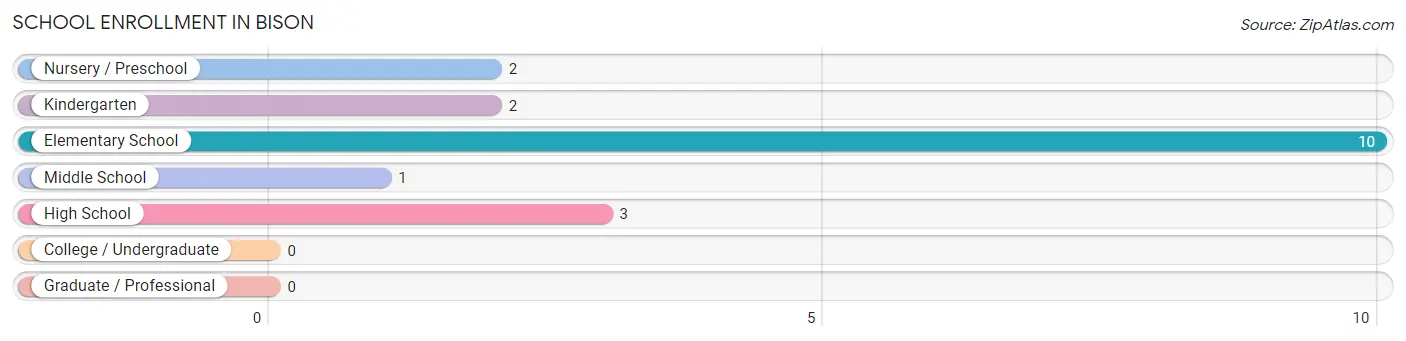
| School Level | # Students | % Students |
| Nursery / Preschool | 2 | 11.1% |
| Kindergarten | 2 | 11.1% |
| Elementary School | 10 | 55.6% |
| Middle School | 1 | 5.6% |
| High School | 3 | 16.7% |
| College / Undergraduate | 0 | 0.0% |
| Graduate / Professional | 0 | 0.0% |
| Total | 18 | 100.0% |
School Enrollment by Age by Funding Source in Bison
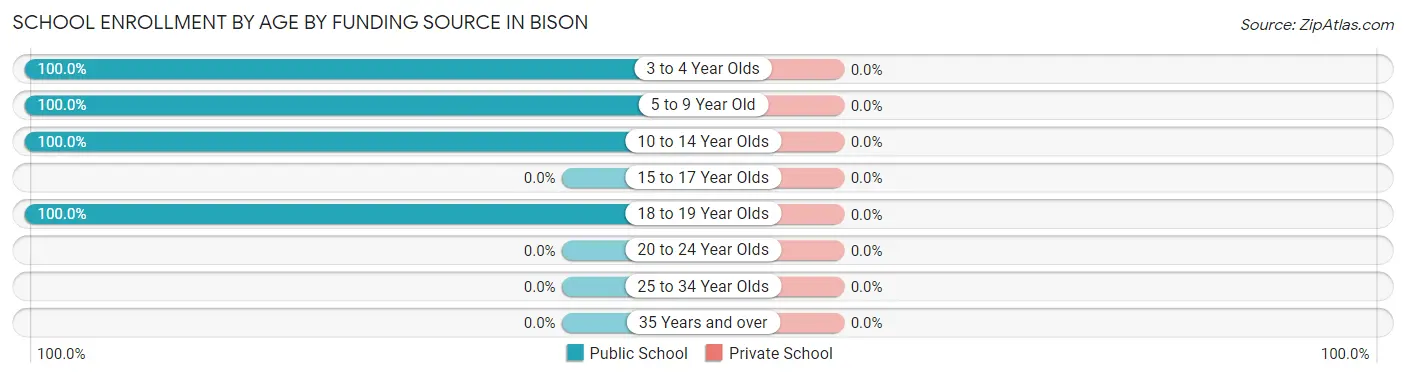
| Age Bracket | Public School | Private School |
| 3 to 4 Year Olds | 2 (100.0%) | 0 (0.0%) |
| 5 to 9 Year Old | 12 (100.0%) | 0 (0.0%) |
| 10 to 14 Year Olds | 1 (100.0%) | 0 (0.0%) |
| 15 to 17 Year Olds | 0 (0.0%) | 0 (0.0%) |
| 18 to 19 Year Olds | 3 (100.0%) | 0 (0.0%) |
| 20 to 24 Year Olds | 0 (0.0%) | 0 (0.0%) |
| 25 to 34 Year Olds | 0 (0.0%) | 0 (0.0%) |
| 35 Years and over | 0 (0.0%) | 0 (0.0%) |
| Total | 18 (100.0%) | 0 (0.0%) |
Educational Attainment by Field of Study in Bison
Social sciences (12 | 48.0%), education (6 | 24.0%), bio, nature & agricultural (2 | 8.0%), liberal arts & history (2 | 8.0%), and computers & mathematics (1 | 4.0%) are the most common fields of study among 25 individuals in Bison who have obtained a bachelor's degree or higher.
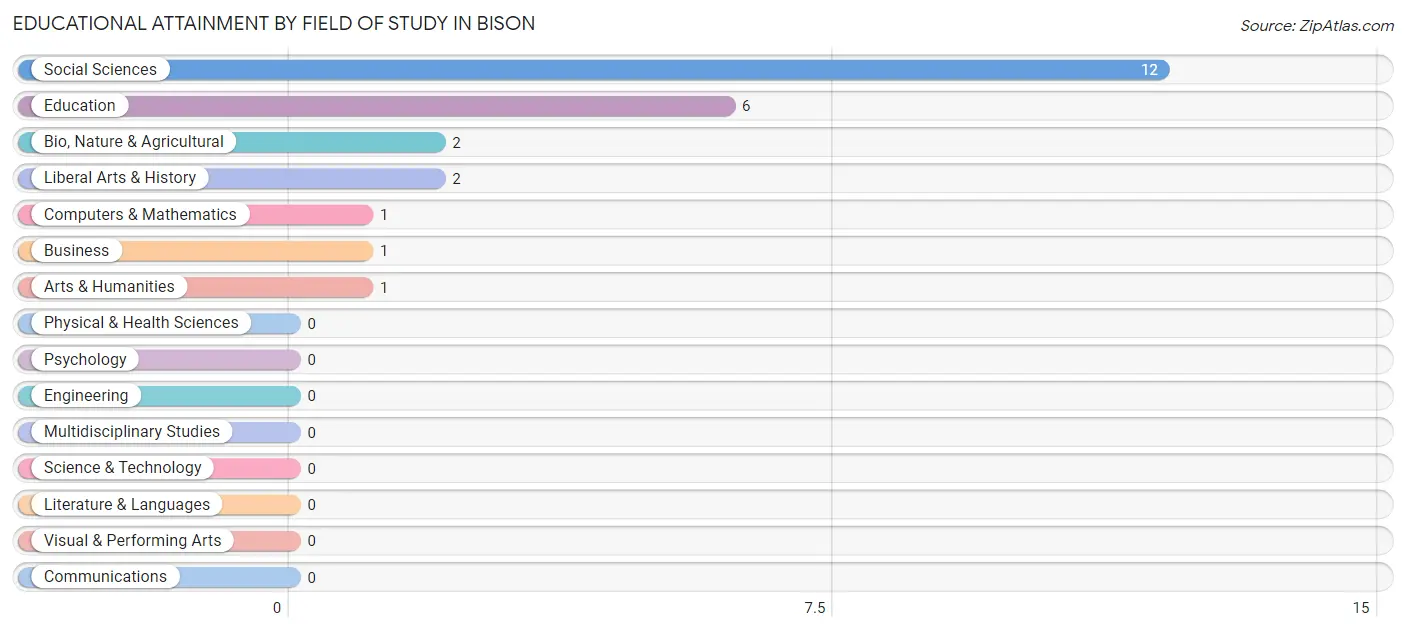
| Field of Study | # Graduates | % Graduates |
| Computers & Mathematics | 1 | 4.0% |
| Bio, Nature & Agricultural | 2 | 8.0% |
| Physical & Health Sciences | 0 | 0.0% |
| Psychology | 0 | 0.0% |
| Social Sciences | 12 | 48.0% |
| Engineering | 0 | 0.0% |
| Multidisciplinary Studies | 0 | 0.0% |
| Science & Technology | 0 | 0.0% |
| Business | 1 | 4.0% |
| Education | 6 | 24.0% |
| Literature & Languages | 0 | 0.0% |
| Liberal Arts & History | 2 | 8.0% |
| Visual & Performing Arts | 0 | 0.0% |
| Communications | 0 | 0.0% |
| Arts & Humanities | 1 | 4.0% |
| Total | 25 | 100.0% |
Transportation & Commute in Bison
Vehicle Availability by Sex in Bison
The most prevalent vehicle ownership categories in Bison are males with 3 vehicles (18, accounting for 33.3%) and females with 3 vehicles (15, making up 50.0%).
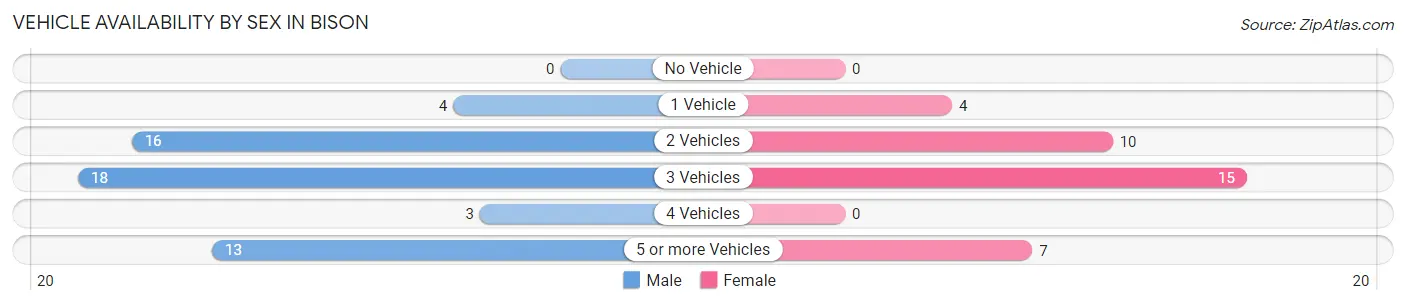
| Vehicles Available | Male | Female |
| No Vehicle | 0 (0.0%) | 0 (0.0%) |
| 1 Vehicle | 4 (7.4%) | 4 (11.1%) |
| 2 Vehicles | 16 (29.6%) | 10 (27.8%) |
| 3 Vehicles | 18 (33.3%) | 15 (41.7%) |
| 4 Vehicles | 3 (5.6%) | 0 (0.0%) |
| 5 or more Vehicles | 13 (24.1%) | 7 (19.4%) |
| Total | 54 (100.0%) | 36 (100.0%) |
Commute Time in Bison
The most frequently occuring commute durations in Bison are 30 to 34 minutes (40 commuters, 44.4%), 10 to 14 minutes (28 commuters, 31.1%), and less than 5 minutes (8 commuters, 8.9%).
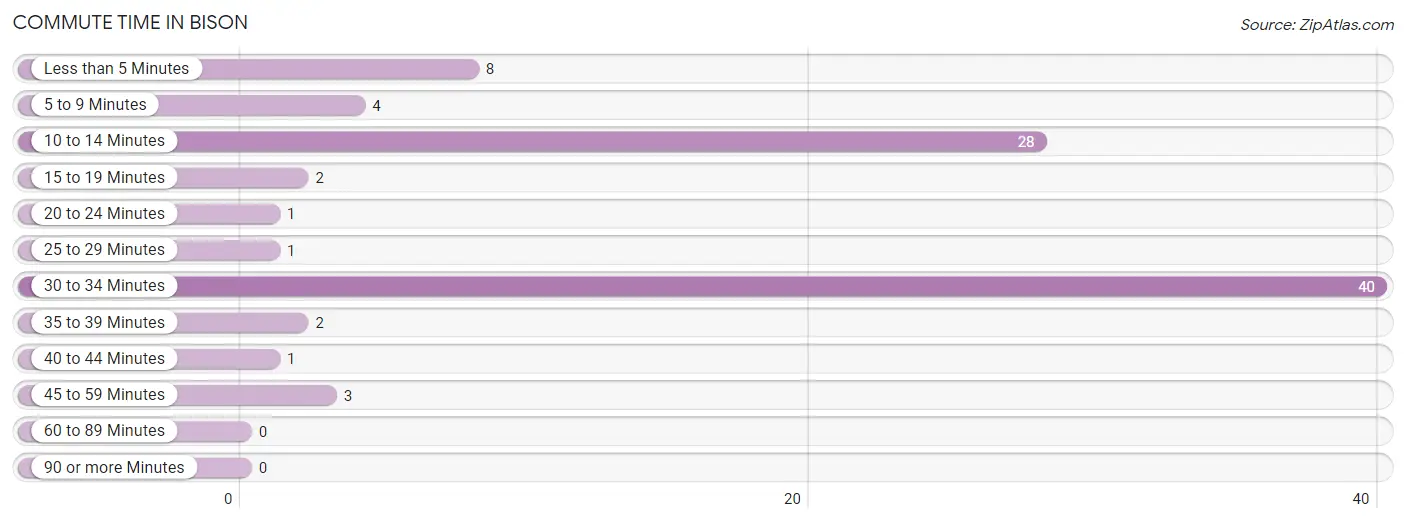
| Commute Time | # Commuters | % Commuters |
| Less than 5 Minutes | 8 | 8.9% |
| 5 to 9 Minutes | 4 | 4.4% |
| 10 to 14 Minutes | 28 | 31.1% |
| 15 to 19 Minutes | 2 | 2.2% |
| 20 to 24 Minutes | 1 | 1.1% |
| 25 to 29 Minutes | 1 | 1.1% |
| 30 to 34 Minutes | 40 | 44.4% |
| 35 to 39 Minutes | 2 | 2.2% |
| 40 to 44 Minutes | 1 | 1.1% |
| 45 to 59 Minutes | 3 | 3.3% |
| 60 to 89 Minutes | 0 | 0.0% |
| 90 or more Minutes | 0 | 0.0% |
Commute Time by Sex in Bison
The most common commute times in Bison are 10 to 14 minutes (27 commuters, 50.0%) for males and 30 to 34 minutes (21 commuters, 58.3%) for females.
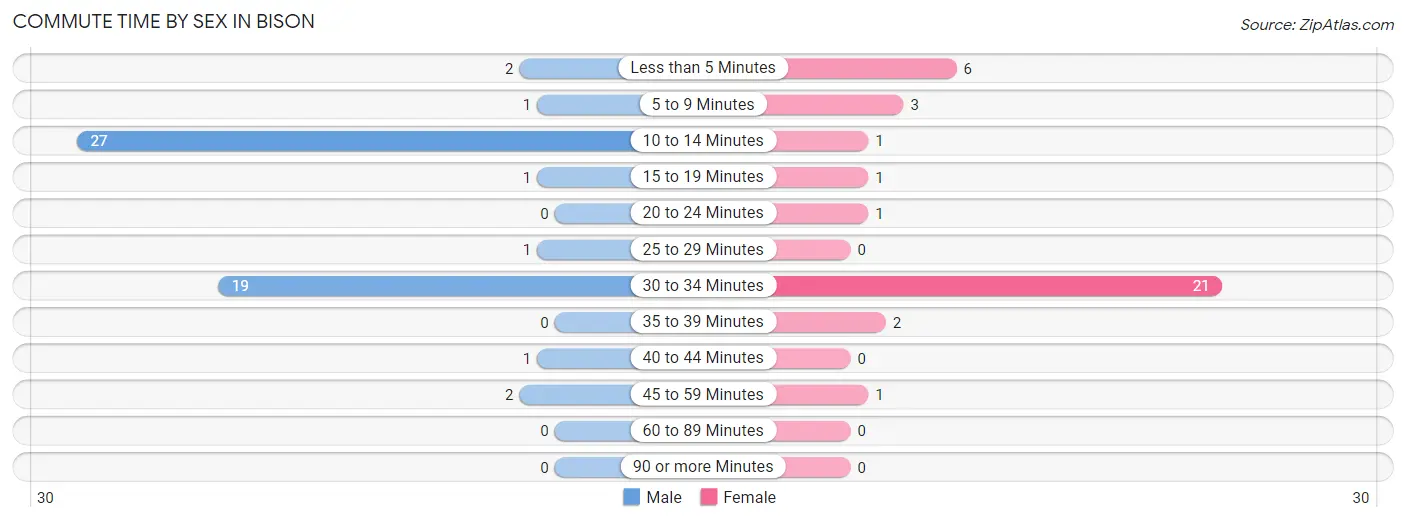
| Commute Time | Male | Female |
| Less than 5 Minutes | 2 (3.7%) | 6 (16.7%) |
| 5 to 9 Minutes | 1 (1.8%) | 3 (8.3%) |
| 10 to 14 Minutes | 27 (50.0%) | 1 (2.8%) |
| 15 to 19 Minutes | 1 (1.8%) | 1 (2.8%) |
| 20 to 24 Minutes | 0 (0.0%) | 1 (2.8%) |
| 25 to 29 Minutes | 1 (1.8%) | 0 (0.0%) |
| 30 to 34 Minutes | 19 (35.2%) | 21 (58.3%) |
| 35 to 39 Minutes | 0 (0.0%) | 2 (5.6%) |
| 40 to 44 Minutes | 1 (1.8%) | 0 (0.0%) |
| 45 to 59 Minutes | 2 (3.7%) | 1 (2.8%) |
| 60 to 89 Minutes | 0 (0.0%) | 0 (0.0%) |
| 90 or more Minutes | 0 (0.0%) | 0 (0.0%) |
Time of Departure to Work by Sex in Bison
The most frequent times of departure to work in Bison are 12:00 PM to 3:59 PM (34, 63.0%) for males and 7:00 AM to 7:29 AM (20, 55.6%) for females.
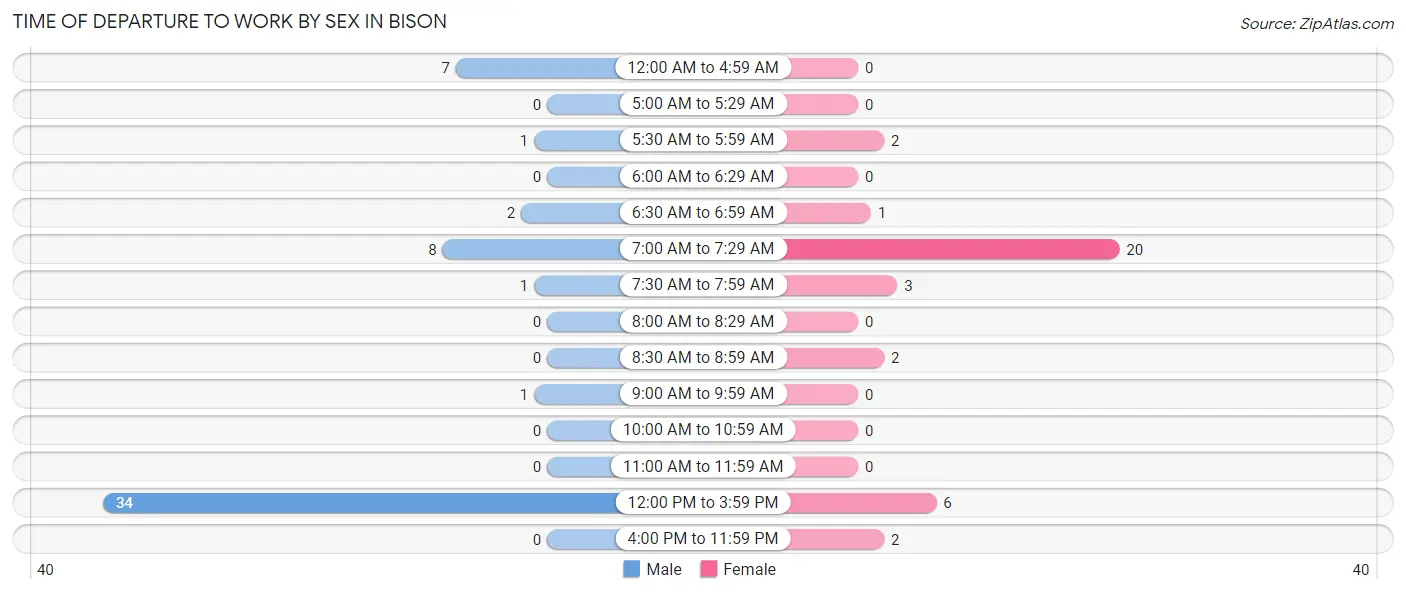
| Time of Departure | Male | Female |
| 12:00 AM to 4:59 AM | 7 (13.0%) | 0 (0.0%) |
| 5:00 AM to 5:29 AM | 0 (0.0%) | 0 (0.0%) |
| 5:30 AM to 5:59 AM | 1 (1.8%) | 2 (5.6%) |
| 6:00 AM to 6:29 AM | 0 (0.0%) | 0 (0.0%) |
| 6:30 AM to 6:59 AM | 2 (3.7%) | 1 (2.8%) |
| 7:00 AM to 7:29 AM | 8 (14.8%) | 20 (55.6%) |
| 7:30 AM to 7:59 AM | 1 (1.8%) | 3 (8.3%) |
| 8:00 AM to 8:29 AM | 0 (0.0%) | 0 (0.0%) |
| 8:30 AM to 8:59 AM | 0 (0.0%) | 2 (5.6%) |
| 9:00 AM to 9:59 AM | 1 (1.8%) | 0 (0.0%) |
| 10:00 AM to 10:59 AM | 0 (0.0%) | 0 (0.0%) |
| 11:00 AM to 11:59 AM | 0 (0.0%) | 0 (0.0%) |
| 12:00 PM to 3:59 PM | 34 (63.0%) | 6 (16.7%) |
| 4:00 PM to 11:59 PM | 0 (0.0%) | 2 (5.6%) |
| Total | 54 (100.0%) | 36 (100.0%) |
Housing Occupancy in Bison
Occupancy by Ownership in Bison
Of the total 80 dwellings in Bison, owner-occupied units account for 78 (97.5%), while renter-occupied units make up 2 (2.5%).
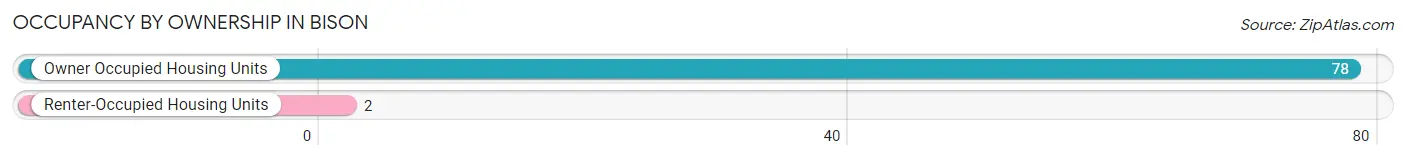
| Occupancy | # Housing Units | % Housing Units |
| Owner Occupied Housing Units | 78 | 97.5% |
| Renter-Occupied Housing Units | 2 | 2.5% |
| Total Occupied Housing Units | 80 | 100.0% |
Occupancy by Household Size in Bison
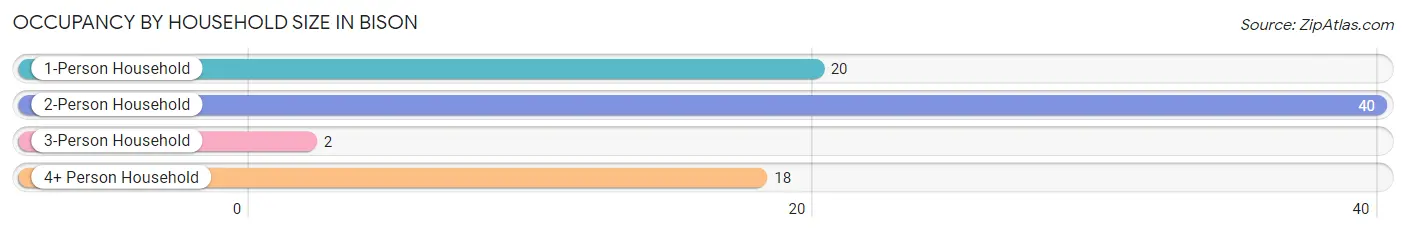
| Household Size | # Housing Units | % Housing Units |
| 1-Person Household | 20 | 25.0% |
| 2-Person Household | 40 | 50.0% |
| 3-Person Household | 2 | 2.5% |
| 4+ Person Household | 18 | 22.5% |
| Total Housing Units | 80 | 100.0% |
Occupancy by Ownership by Household Size in Bison
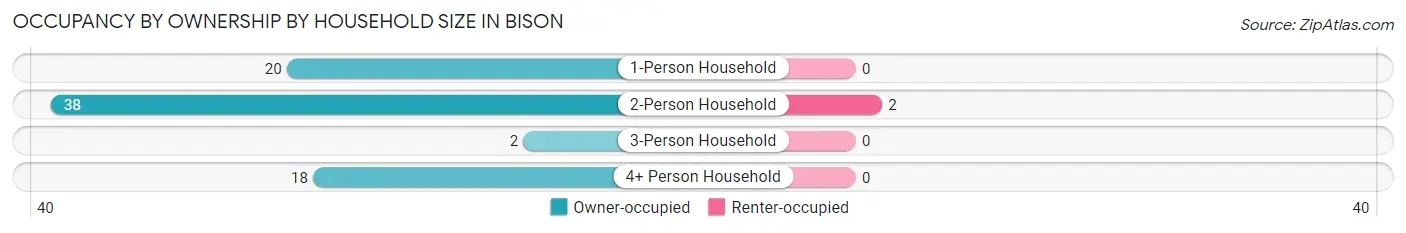
| Household Size | Owner-occupied | Renter-occupied |
| 1-Person Household | 20 (100.0%) | 0 (0.0%) |
| 2-Person Household | 38 (95.0%) | 2 (5.0%) |
| 3-Person Household | 2 (100.0%) | 0 (0.0%) |
| 4+ Person Household | 18 (100.0%) | 0 (0.0%) |
| Total Housing Units | 78 (97.5%) | 2 (2.5%) |
Occupancy by Educational Attainment in Bison
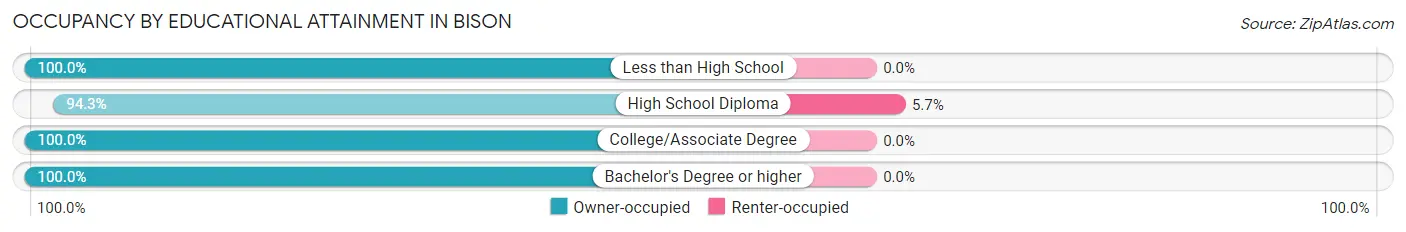
| Household Size | Owner-occupied | Renter-occupied |
| Less than High School | 2 (100.0%) | 0 (0.0%) |
| High School Diploma | 33 (94.3%) | 2 (5.7%) |
| College/Associate Degree | 34 (100.0%) | 0 (0.0%) |
| Bachelor's Degree or higher | 9 (100.0%) | 0 (0.0%) |
Occupancy by Age of Householder in Bison
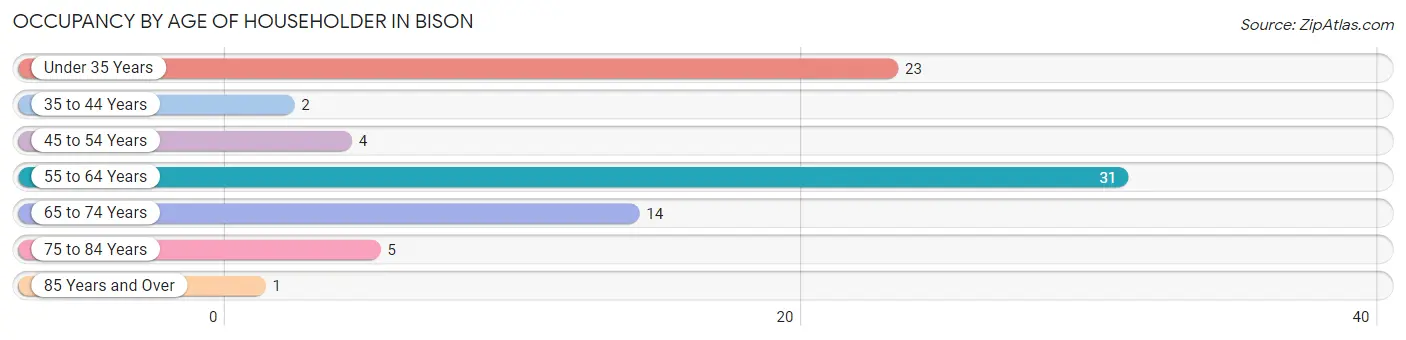
| Age Bracket | # Households | % Households |
| Under 35 Years | 23 | 28.7% |
| 35 to 44 Years | 2 | 2.5% |
| 45 to 54 Years | 4 | 5.0% |
| 55 to 64 Years | 31 | 38.8% |
| 65 to 74 Years | 14 | 17.5% |
| 75 to 84 Years | 5 | 6.2% |
| 85 Years and Over | 1 | 1.3% |
| Total | 80 | 100.0% |
Housing Finances in Bison
Median Income by Occupancy in Bison
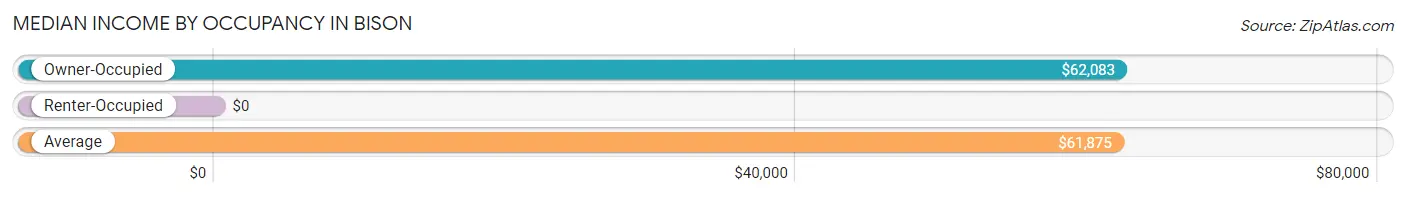
| Occupancy Type | # Households | Median Income |
| Owner-Occupied | 78 (97.5%) | $62,083 |
| Renter-Occupied | 2 (2.5%) | $0 |
| Average | 80 (100.0%) | $61,875 |
Occupancy by Householder Income Bracket in Bison
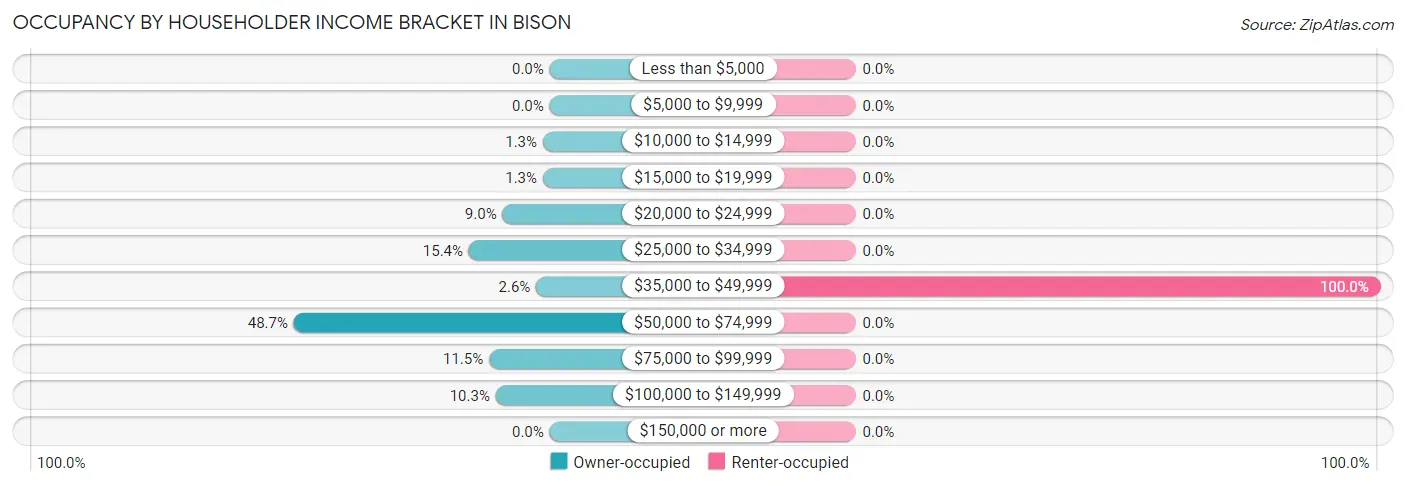
| Income Bracket | Owner-occupied | Renter-occupied |
| Less than $5,000 | 0 (0.0%) | 0 (0.0%) |
| $5,000 to $9,999 | 0 (0.0%) | 0 (0.0%) |
| $10,000 to $14,999 | 1 (1.3%) | 0 (0.0%) |
| $15,000 to $19,999 | 1 (1.3%) | 0 (0.0%) |
| $20,000 to $24,999 | 7 (9.0%) | 0 (0.0%) |
| $25,000 to $34,999 | 12 (15.4%) | 0 (0.0%) |
| $35,000 to $49,999 | 2 (2.6%) | 2 (100.0%) |
| $50,000 to $74,999 | 38 (48.7%) | 0 (0.0%) |
| $75,000 to $99,999 | 9 (11.5%) | 0 (0.0%) |
| $100,000 to $149,999 | 8 (10.3%) | 0 (0.0%) |
| $150,000 or more | 0 (0.0%) | 0 (0.0%) |
| Total | 78 (100.0%) | 2 (100.0%) |
Monthly Housing Cost Tiers in Bison
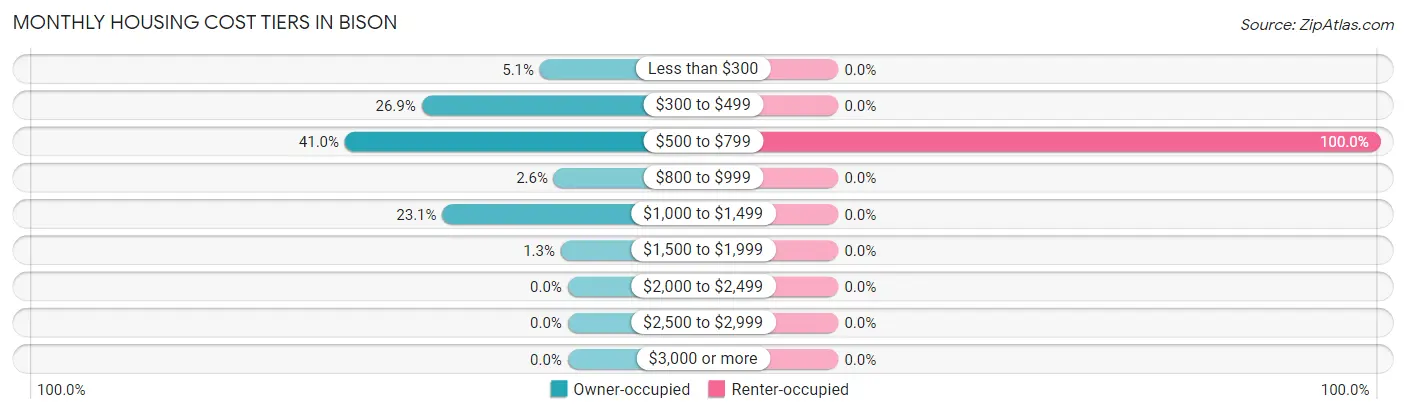
| Monthly Cost | Owner-occupied | Renter-occupied |
| Less than $300 | 4 (5.1%) | 0 (0.0%) |
| $300 to $499 | 21 (26.9%) | 0 (0.0%) |
| $500 to $799 | 32 (41.0%) | 2 (100.0%) |
| $800 to $999 | 2 (2.6%) | 0 (0.0%) |
| $1,000 to $1,499 | 18 (23.1%) | 0 (0.0%) |
| $1,500 to $1,999 | 1 (1.3%) | 0 (0.0%) |
| $2,000 to $2,499 | 0 (0.0%) | 0 (0.0%) |
| $2,500 to $2,999 | 0 (0.0%) | 0 (0.0%) |
| $3,000 or more | 0 (0.0%) | 0 (0.0%) |
| Total | 78 (100.0%) | 2 (100.0%) |
Physical Housing Characteristics in Bison
Housing Structures in Bison
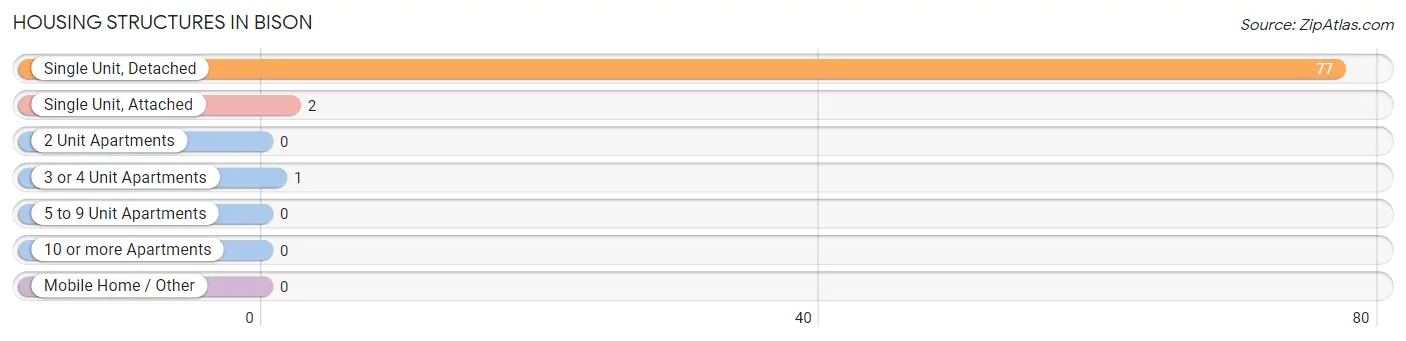
| Structure Type | # Housing Units | % Housing Units |
| Single Unit, Detached | 77 | 96.3% |
| Single Unit, Attached | 2 | 2.5% |
| 2 Unit Apartments | 0 | 0.0% |
| 3 or 4 Unit Apartments | 1 | 1.3% |
| 5 to 9 Unit Apartments | 0 | 0.0% |
| 10 or more Apartments | 0 | 0.0% |
| Mobile Home / Other | 0 | 0.0% |
| Total | 80 | 100.0% |
Housing Structures by Occupancy in Bison
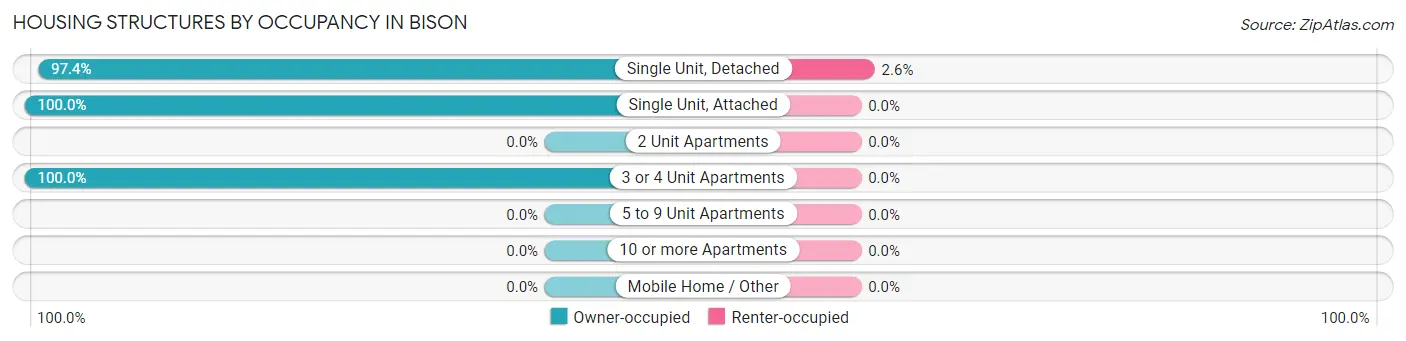
| Structure Type | Owner-occupied | Renter-occupied |
| Single Unit, Detached | 75 (97.4%) | 2 (2.6%) |
| Single Unit, Attached | 2 (100.0%) | 0 (0.0%) |
| 2 Unit Apartments | 0 (0.0%) | 0 (0.0%) |
| 3 or 4 Unit Apartments | 1 (100.0%) | 0 (0.0%) |
| 5 to 9 Unit Apartments | 0 (0.0%) | 0 (0.0%) |
| 10 or more Apartments | 0 (0.0%) | 0 (0.0%) |
| Mobile Home / Other | 0 (0.0%) | 0 (0.0%) |
| Total | 78 (97.5%) | 2 (2.5%) |
Housing Structures by Number of Rooms in Bison
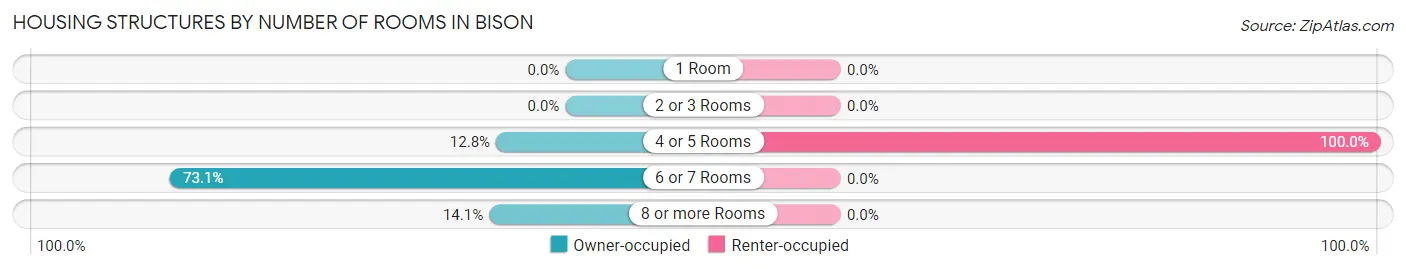
| Number of Rooms | Owner-occupied | Renter-occupied |
| 1 Room | 0 (0.0%) | 0 (0.0%) |
| 2 or 3 Rooms | 0 (0.0%) | 0 (0.0%) |
| 4 or 5 Rooms | 10 (12.8%) | 2 (100.0%) |
| 6 or 7 Rooms | 57 (73.1%) | 0 (0.0%) |
| 8 or more Rooms | 11 (14.1%) | 0 (0.0%) |
| Total | 78 (100.0%) | 2 (100.0%) |
Housing Structure by Heating Type in Bison
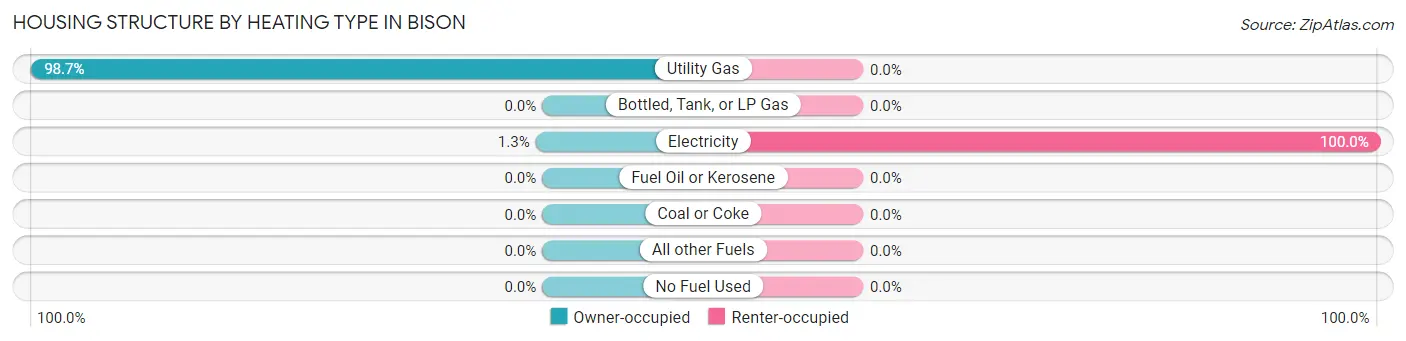
| Heating Type | Owner-occupied | Renter-occupied |
| Utility Gas | 77 (98.7%) | 0 (0.0%) |
| Bottled, Tank, or LP Gas | 0 (0.0%) | 0 (0.0%) |
| Electricity | 1 (1.3%) | 2 (100.0%) |
| Fuel Oil or Kerosene | 0 (0.0%) | 0 (0.0%) |
| Coal or Coke | 0 (0.0%) | 0 (0.0%) |
| All other Fuels | 0 (0.0%) | 0 (0.0%) |
| No Fuel Used | 0 (0.0%) | 0 (0.0%) |
| Total | 78 (100.0%) | 2 (100.0%) |
Household Vehicle Usage in Bison
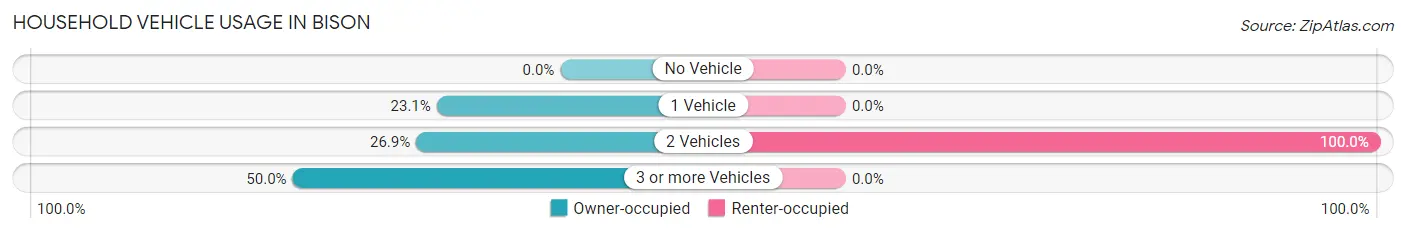
| Vehicles per Household | Owner-occupied | Renter-occupied |
| No Vehicle | 0 (0.0%) | 0 (0.0%) |
| 1 Vehicle | 18 (23.1%) | 0 (0.0%) |
| 2 Vehicles | 21 (26.9%) | 2 (100.0%) |
| 3 or more Vehicles | 39 (50.0%) | 0 (0.0%) |
| Total | 78 (100.0%) | 2 (100.0%) |
Real Estate & Mortgages in Bison
Real Estate and Mortgage Overview in Bison
| Characteristic | Without Mortgage | With Mortgage |
| Housing Units | 38 | 40 |
| Median Property Value | $56,400 | $45,000 |
| Median Household Income | $36,250 | $0 |
| Monthly Housing Costs | $450 | $0 |
| Real Estate Taxes | $1,050 | $0 |
Property Value by Mortgage Status in Bison
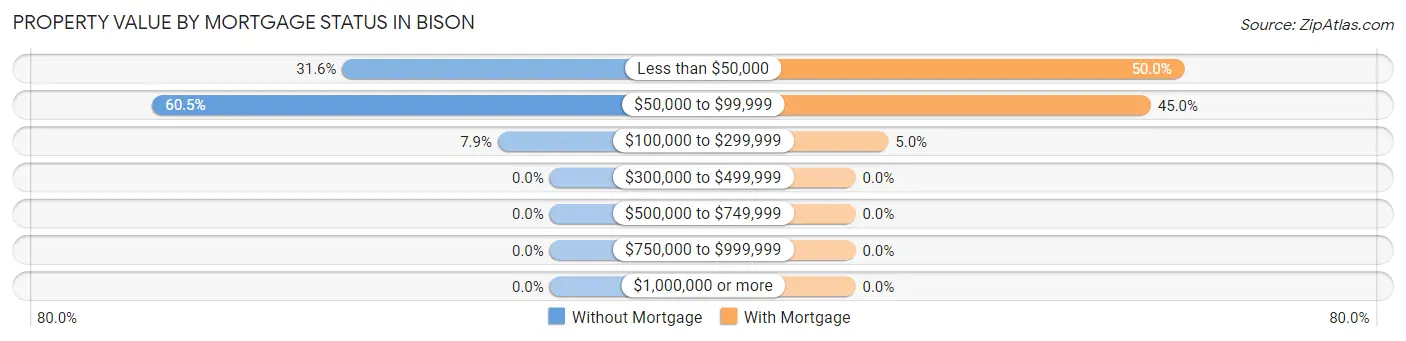
| Property Value | Without Mortgage | With Mortgage |
| Less than $50,000 | 12 (31.6%) | 20 (50.0%) |
| $50,000 to $99,999 | 23 (60.5%) | 18 (45.0%) |
| $100,000 to $299,999 | 3 (7.9%) | 2 (5.0%) |
| $300,000 to $499,999 | 0 (0.0%) | 0 (0.0%) |
| $500,000 to $749,999 | 0 (0.0%) | 0 (0.0%) |
| $750,000 to $999,999 | 0 (0.0%) | 0 (0.0%) |
| $1,000,000 or more | 0 (0.0%) | 0 (0.0%) |
| Total | 38 (100.0%) | 40 (100.0%) |
Household Income by Mortgage Status in Bison
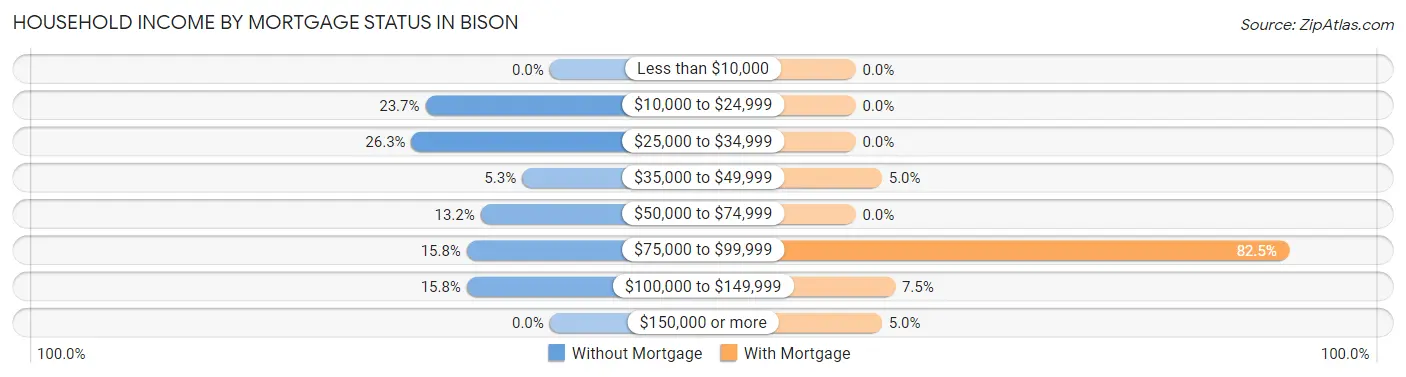
| Household Income | Without Mortgage | With Mortgage |
| Less than $10,000 | 0 (0.0%) | 0 (0.0%) |
| $10,000 to $24,999 | 9 (23.7%) | 0 (0.0%) |
| $25,000 to $34,999 | 10 (26.3%) | 0 (0.0%) |
| $35,000 to $49,999 | 2 (5.3%) | 2 (5.0%) |
| $50,000 to $74,999 | 5 (13.2%) | 0 (0.0%) |
| $75,000 to $99,999 | 6 (15.8%) | 33 (82.5%) |
| $100,000 to $149,999 | 6 (15.8%) | 3 (7.5%) |
| $150,000 or more | 0 (0.0%) | 2 (5.0%) |
| Total | 38 (100.0%) | 40 (100.0%) |
Property Value to Household Income Ratio in Bison
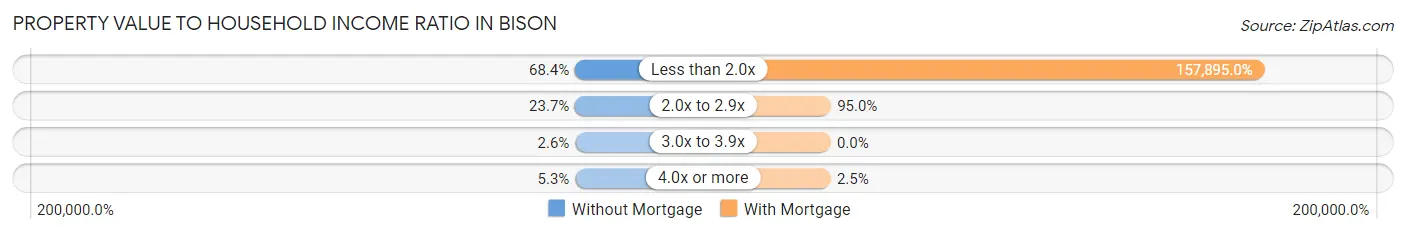
| Value-to-Income Ratio | Without Mortgage | With Mortgage |
| Less than 2.0x | 26 (68.4%) | 63,158 (157,895.0%) |
| 2.0x to 2.9x | 9 (23.7%) | 38 (95.0%) |
| 3.0x to 3.9x | 1 (2.6%) | 0 (0.0%) |
| 4.0x or more | 2 (5.3%) | 1 (2.5%) |
| Total | 38 (100.0%) | 40 (100.0%) |
Real Estate Taxes by Mortgage Status in Bison
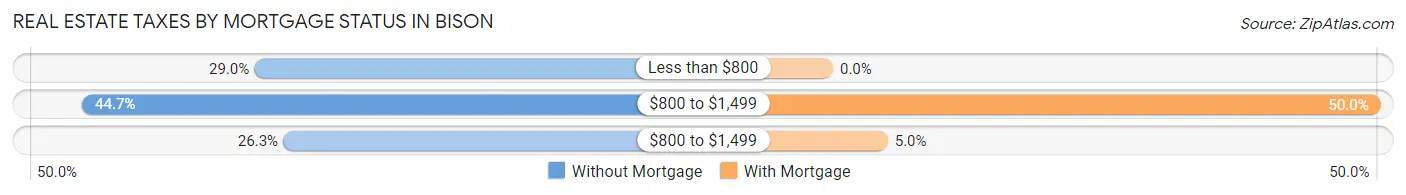
| Property Taxes | Without Mortgage | With Mortgage |
| Less than $800 | 11 (28.9%) | 0 (0.0%) |
| $800 to $1,499 | 17 (44.7%) | 20 (50.0%) |
| $800 to $1,499 | 10 (26.3%) | 2 (5.0%) |
| Total | 38 (100.0%) | 40 (100.0%) |
Health & Disability in Bison
Health Insurance Coverage by Age in Bison
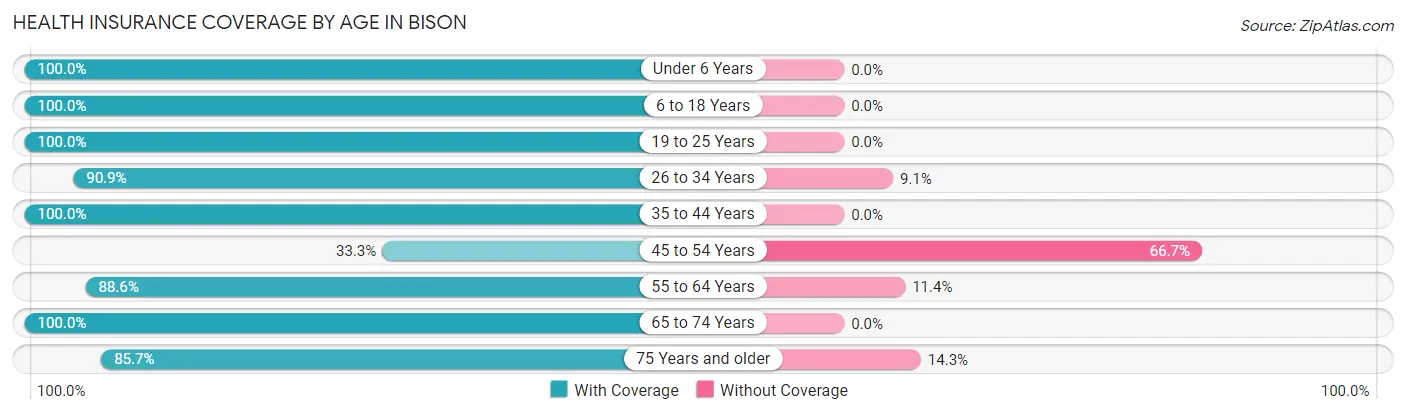
| Age Bracket | With Coverage | Without Coverage |
| Under 6 Years | 7 (100.0%) | 0 (0.0%) |
| 6 to 18 Years | 16 (100.0%) | 0 (0.0%) |
| 19 to 25 Years | 34 (100.0%) | 0 (0.0%) |
| 26 to 34 Years | 20 (90.9%) | 2 (9.1%) |
| 35 to 44 Years | 4 (100.0%) | 0 (0.0%) |
| 45 to 54 Years | 6 (33.3%) | 12 (66.7%) |
| 55 to 64 Years | 39 (88.6%) | 5 (11.4%) |
| 65 to 74 Years | 21 (100.0%) | 0 (0.0%) |
| 75 Years and older | 6 (85.7%) | 1 (14.3%) |
| Total | 153 (88.4%) | 20 (11.6%) |
Health Insurance Coverage by Citizenship Status in Bison
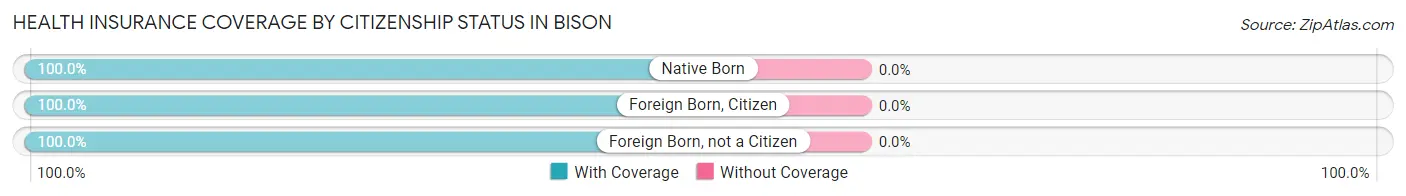
| Citizenship Status | With Coverage | Without Coverage |
| Native Born | 7 (100.0%) | 0 (0.0%) |
| Foreign Born, Citizen | 16 (100.0%) | 0 (0.0%) |
| Foreign Born, not a Citizen | 34 (100.0%) | 0 (0.0%) |
Health Insurance Coverage by Household Income in Bison
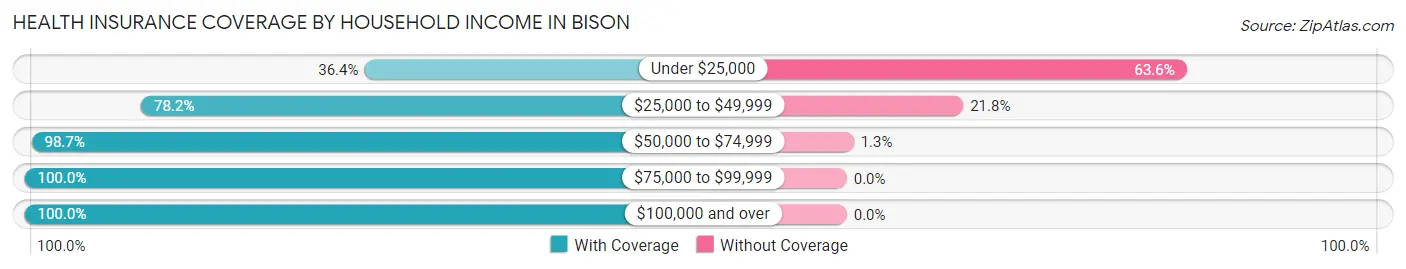
| Household Income | With Coverage | Without Coverage |
| Under $25,000 | 4 (36.4%) | 7 (63.6%) |
| $25,000 to $49,999 | 43 (78.2%) | 12 (21.8%) |
| $50,000 to $74,999 | 76 (98.7%) | 1 (1.3%) |
| $75,000 to $99,999 | 16 (100.0%) | 0 (0.0%) |
| $100,000 and over | 14 (100.0%) | 0 (0.0%) |
Public vs Private Health Insurance Coverage by Age in Bison
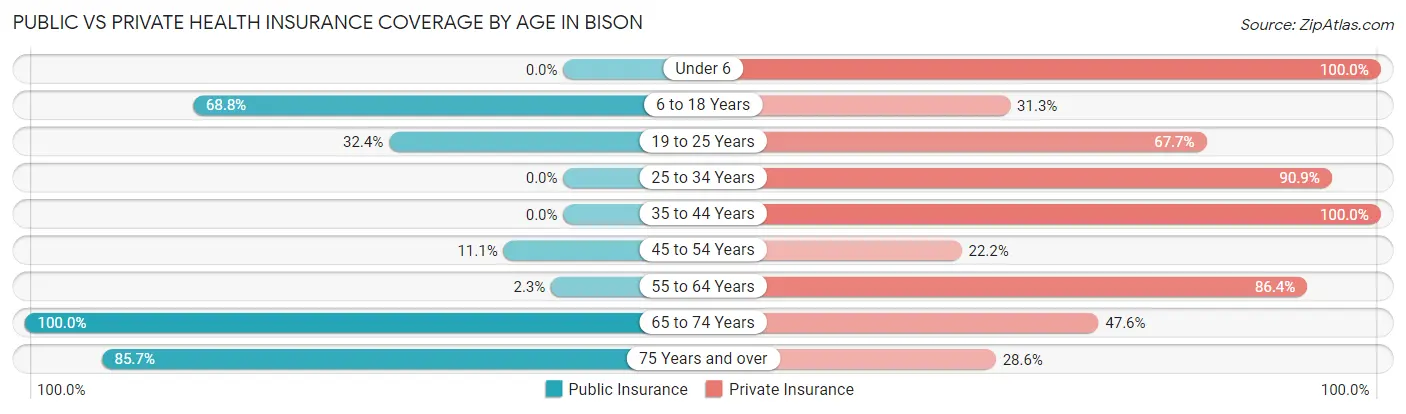
| Age Bracket | Public Insurance | Private Insurance |
| Under 6 | 0 (0.0%) | 7 (100.0%) |
| 6 to 18 Years | 11 (68.8%) | 5 (31.2%) |
| 19 to 25 Years | 11 (32.4%) | 23 (67.6%) |
| 25 to 34 Years | 0 (0.0%) | 20 (90.9%) |
| 35 to 44 Years | 0 (0.0%) | 4 (100.0%) |
| 45 to 54 Years | 2 (11.1%) | 4 (22.2%) |
| 55 to 64 Years | 1 (2.3%) | 38 (86.4%) |
| 65 to 74 Years | 21 (100.0%) | 10 (47.6%) |
| 75 Years and over | 6 (85.7%) | 2 (28.6%) |
| Total | 52 (30.1%) | 113 (65.3%) |
Disability Status by Sex by Age in Bison
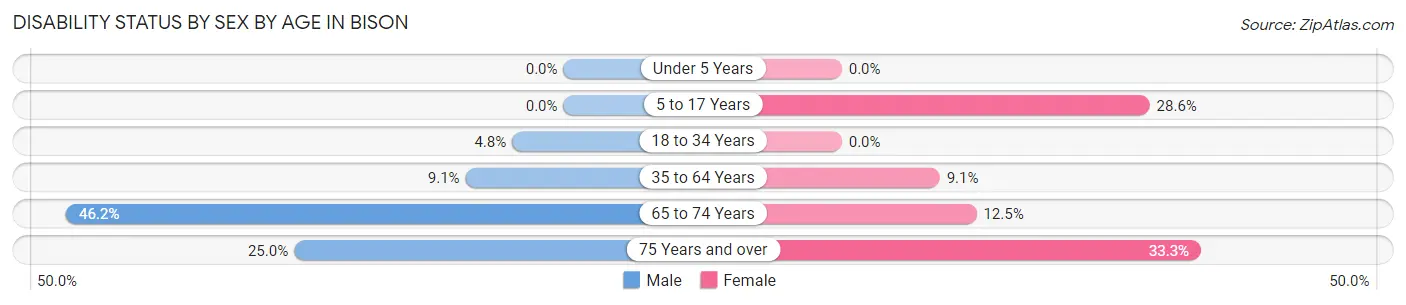
| Age Bracket | Male | Female |
| Under 5 Years | 0 (0.0%) | 0 (0.0%) |
| 5 to 17 Years | 0 (0.0%) | 2 (28.6%) |
| 18 to 34 Years | 2 (4.8%) | 0 (0.0%) |
| 35 to 64 Years | 3 (9.1%) | 3 (9.1%) |
| 65 to 74 Years | 6 (46.2%) | 1 (12.5%) |
| 75 Years and over | 1 (25.0%) | 1 (33.3%) |
Disability Class by Sex by Age in Bison
Disability Class: Hearing Difficulty
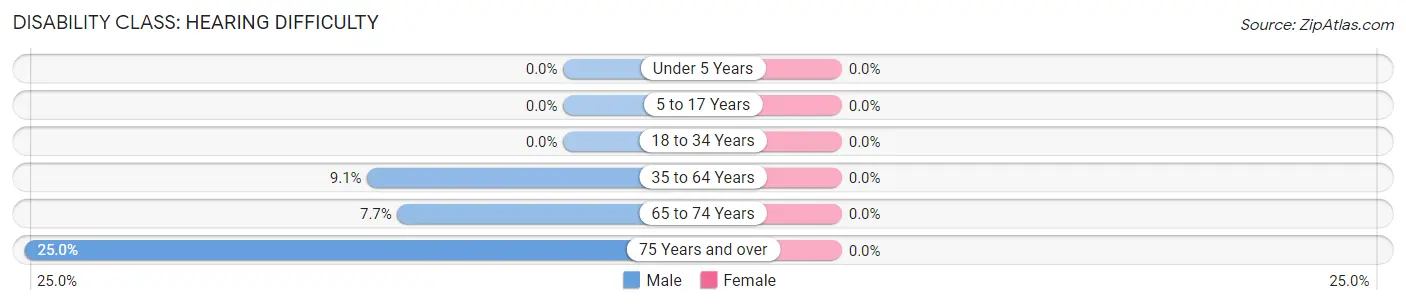
| Age Bracket | Male | Female |
| Under 5 Years | 0 (0.0%) | 0 (0.0%) |
| 5 to 17 Years | 0 (0.0%) | 0 (0.0%) |
| 18 to 34 Years | 0 (0.0%) | 0 (0.0%) |
| 35 to 64 Years | 3 (9.1%) | 0 (0.0%) |
| 65 to 74 Years | 1 (7.7%) | 0 (0.0%) |
| 75 Years and over | 1 (25.0%) | 0 (0.0%) |
Disability Class: Vision Difficulty
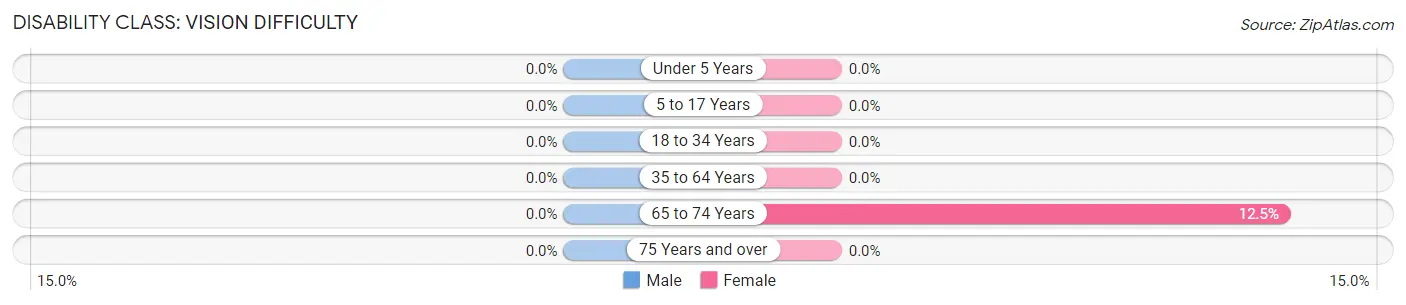
| Age Bracket | Male | Female |
| Under 5 Years | 0 (0.0%) | 0 (0.0%) |
| 5 to 17 Years | 0 (0.0%) | 0 (0.0%) |
| 18 to 34 Years | 0 (0.0%) | 0 (0.0%) |
| 35 to 64 Years | 0 (0.0%) | 0 (0.0%) |
| 65 to 74 Years | 0 (0.0%) | 1 (12.5%) |
| 75 Years and over | 0 (0.0%) | 0 (0.0%) |
Disability Class: Cognitive Difficulty
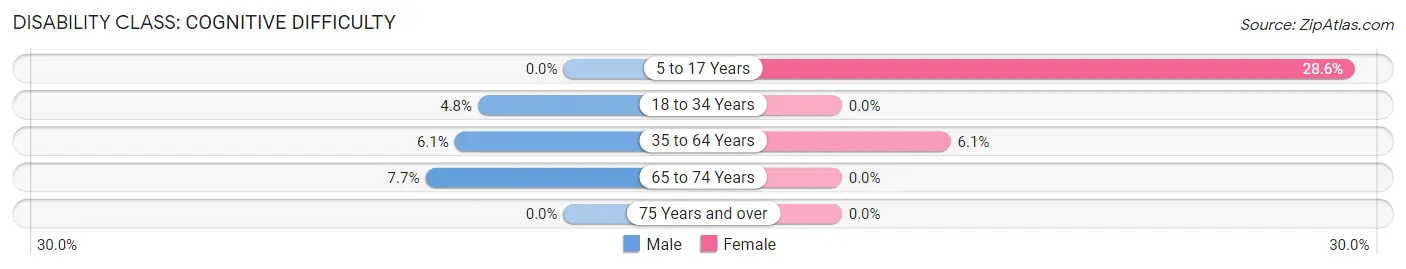
| Age Bracket | Male | Female |
| 5 to 17 Years | 0 (0.0%) | 2 (28.6%) |
| 18 to 34 Years | 2 (4.8%) | 0 (0.0%) |
| 35 to 64 Years | 2 (6.1%) | 2 (6.1%) |
| 65 to 74 Years | 1 (7.7%) | 0 (0.0%) |
| 75 Years and over | 0 (0.0%) | 0 (0.0%) |
Disability Class: Ambulatory Difficulty
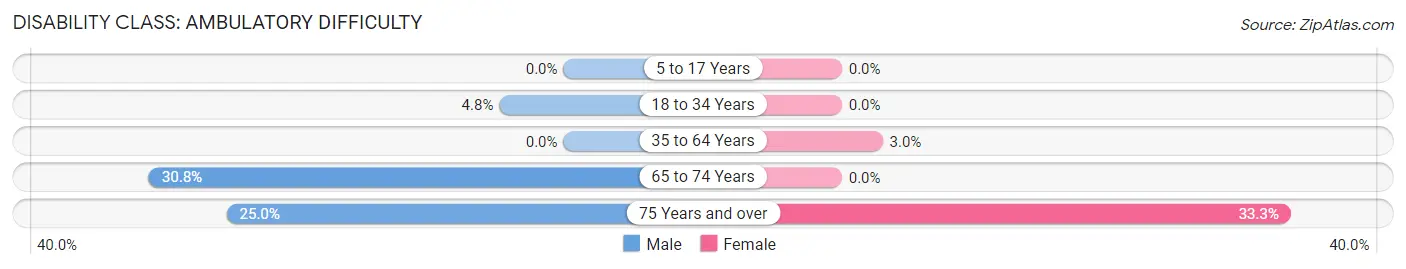
| Age Bracket | Male | Female |
| 5 to 17 Years | 0 (0.0%) | 0 (0.0%) |
| 18 to 34 Years | 2 (4.8%) | 0 (0.0%) |
| 35 to 64 Years | 0 (0.0%) | 1 (3.0%) |
| 65 to 74 Years | 4 (30.8%) | 0 (0.0%) |
| 75 Years and over | 1 (25.0%) | 1 (33.3%) |
Disability Class: Self-Care Difficulty
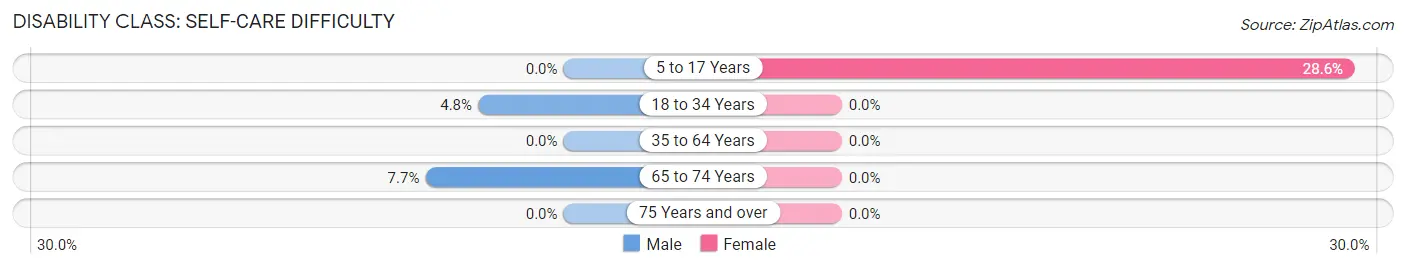
| Age Bracket | Male | Female |
| 5 to 17 Years | 0 (0.0%) | 2 (28.6%) |
| 18 to 34 Years | 2 (4.8%) | 0 (0.0%) |
| 35 to 64 Years | 0 (0.0%) | 0 (0.0%) |
| 65 to 74 Years | 1 (7.7%) | 0 (0.0%) |
| 75 Years and over | 0 (0.0%) | 0 (0.0%) |
Technology Access in Bison
Computing Device Access in Bison
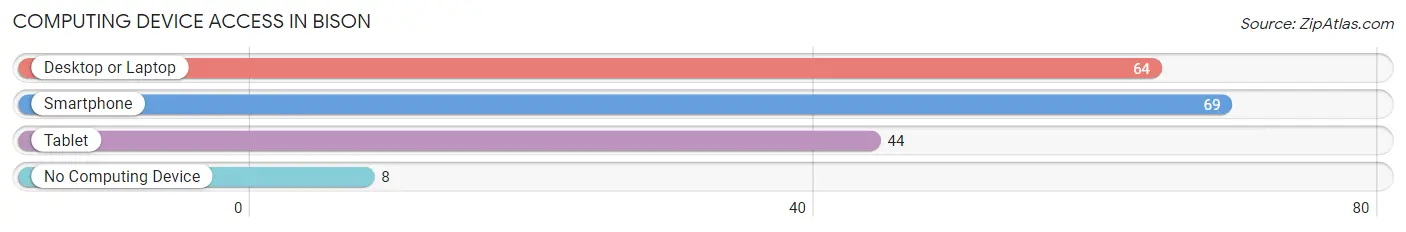
| Device Type | # Households | % Households |
| Desktop or Laptop | 64 | 80.0% |
| Smartphone | 69 | 86.3% |
| Tablet | 44 | 55.0% |
| No Computing Device | 8 | 10.0% |
| Total | 80 | 100.0% |
Internet Access in Bison
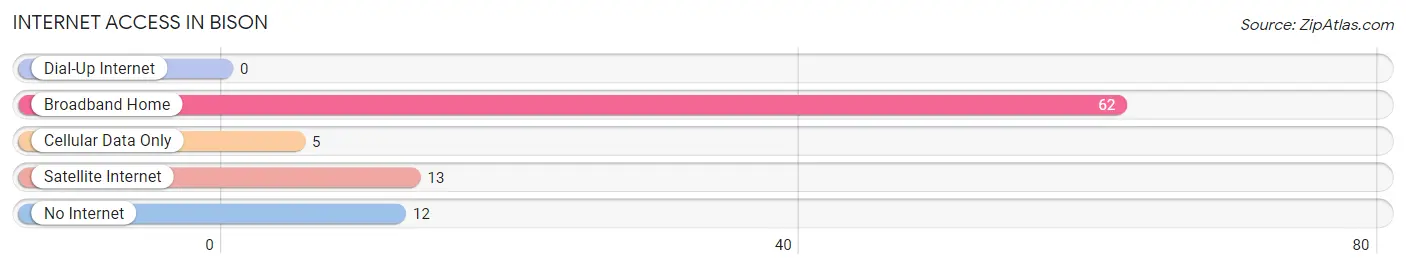
| Internet Type | # Households | % Households |
| Dial-Up Internet | 0 | 0.0% |
| Broadband Home | 62 | 77.5% |
| Cellular Data Only | 5 | 6.2% |
| Satellite Internet | 13 | 16.3% |
| No Internet | 12 | 15.0% |
| Total | 80 | 100.0% |
Bison Summary
Bison, Kansas is a small town located in the western part of the state, in Rush County. It is situated on the banks of the Arkansas River, and is surrounded by rolling hills and prairies. The town was founded in 1887, and has a population of just over 500 people.
Geography
Bison is located in the western part of Kansas, in Rush County. It is situated on the banks of the Arkansas River, and is surrounded by rolling hills and prairies. The town is located at an elevation of 1,845 feet above sea level. The climate in Bison is semi-arid, with hot summers and cold winters. The average annual temperature is around 55 degrees Fahrenheit.
Economy
The economy of Bison is largely based on agriculture. The town is home to several farms, which produce a variety of crops, including wheat, corn, and soybeans. The town also has a few small businesses, including a grocery store, a hardware store, and a few restaurants.
Demographics
As of the 2010 census, the population of Bison was 514. The racial makeup of the town was 97.3% White, 0.6% African American, 0.2% Native American, 0.2% Asian, 0.2% from other races, and 1.7% from two or more races. The median household income was $37,500, and the median family income was $45,000.
History
Bison was founded in 1887, when the first settlers arrived in the area. The town was named after the bison that roamed the area. The town grew slowly, and by the early 1900s, it had a population of around 200 people. The town was incorporated in 1911, and the population continued to grow.
In the 1920s, the town was home to several businesses, including a bank, a hotel, a general store, and a blacksmith shop. The town also had a school, which was built in 1921. The school was later expanded to include a high school.
In the 1950s, the town began to decline, as many of the businesses closed and the population began to decline. The town was hit hard by the Great Depression, and many of the businesses closed. The population continued to decline until the 1980s, when the town began to experience a resurgence.
Today, Bison is a small, rural town with a population of just over 500 people. The town is home to several small businesses, and the economy is largely based on agriculture. The town is also home to a few historic sites, including the old schoolhouse and the old blacksmith shop.
Common Questions
What is Per Capita Income in Bison?
Per Capita income in Bison is $27,530.
What is the Median Family Income in Bison?
Median Family Income in Bison is $63,092.
What is the Median Household income in Bison?
Median Household Income in Bison is $61,875.
What is Income or Wage Gap in Bison?
Income or Wage Gap in Bison is 79.8%.
Women in Bison earn 20.2 cents for every dollar earned by a man.
What is Inequality or Gini Index in Bison?
Inequality or Gini Index in Bison is 0.26.
What is the Total Population of Bison?
Total Population of Bison is 173.
What is the Total Male Population of Bison?
Total Male Population of Bison is 103.
What is the Total Female Population of Bison?
Total Female Population of Bison is 70.
What is the Ratio of Males per 100 Females in Bison?
There are 147.14 Males per 100 Females in Bison.
What is the Ratio of Females per 100 Males in Bison?
There are 67.96 Females per 100 Males in Bison.
What is the Median Population Age in Bison?
Median Population Age in Bison is 47.8 Years.
What is the Average Family Size in Bison
Average Family Size in Bison is 2.6 People.
What is the Average Household Size in Bison
Average Household Size in Bison is 2.2 People.
How Large is the Labor Force in Bison?
There are 113 People in the Labor Forcein in Bison.
What is the Percentage of People in the Labor Force in Bison?
73.9% of People are in the Labor Force in Bison.
What is the Unemployment Rate in Bison?
Unemployment Rate in Bison is 20.4%.