Bazine, KS Map & Demographics
Bazine Map
Bazine Overview
$24,204
PER CAPITA INCOME
$54,485
AVG FAMILY INCOME
$53,860
AVG HOUSEHOLD INCOME
87.5%
WAGE / INCOME GAP [ % ]
12.5¢/ $1
WAGE / INCOME GAP [ $ ]
0.29
INEQUALITY / GINI INDEX
438
TOTAL POPULATION
218
MALE POPULATION
220
FEMALE POPULATION
99.09
MALES / 100 FEMALES
100.92
FEMALES / 100 MALES
25.5
MEDIAN AGE
3.0
AVG FAMILY SIZE
2.7
AVG HOUSEHOLD SIZE
166
LABOR FORCE [ PEOPLE ]
50.3%
PERCENT IN LABOR FORCE
1.8%
UNEMPLOYMENT RATE
Bazine Zip Codes
Bazine Area Codes
Income in Bazine
Income Overview in Bazine
Per Capita Income in Bazine is $24,204, while median incomes of families and households are $54,485 and $53,860 respectively.
| Characteristic | Number | Measure |
| Per Capita Income | 438 | $24,204 |
| Median Family Income | 138 | $54,485 |
| Mean Family Income | 138 | $63,319 |
| Median Household Income | 161 | $53,860 |
| Mean Household Income | 161 | $59,237 |
| Income Deficit | 138 | $0 |
| Wage / Income Gap (%) | 438 | 87.46% |
| Wage / Income Gap ($) | 438 | 12.54¢ per $1 |
| Gini / Inequality Index | 438 | 0.29 |
Earnings by Sex in Bazine
Average Earnings in Bazine are $36,667, $55,804 for men and $7,000 for women, a difference of 87.5%.
| Sex | Number | Average Earnings |
| Male | 128 (61.0%) | $55,804 |
| Female | 82 (39.1%) | $7,000 |
| Total | 210 (100.0%) | $36,667 |
Earnings by Sex by Income Bracket in Bazine
The most common earnings brackets in Bazine are $55,000 to $64,999 for men (57 | 44.5%) and $2,499 or less for women (33 | 40.2%).
| Income | Male | Female |
| $2,499 or less | 8 (6.2%) | 33 (40.2%) |
| $2,500 to $4,999 | 0 (0.0%) | 0 (0.0%) |
| $5,000 to $7,499 | 0 (0.0%) | 10 (12.2%) |
| $7,500 to $9,999 | 0 (0.0%) | 11 (13.4%) |
| $10,000 to $12,499 | 4 (3.1%) | 0 (0.0%) |
| $12,500 to $14,999 | 1 (0.8%) | 0 (0.0%) |
| $15,000 to $17,499 | 2 (1.6%) | 11 (13.4%) |
| $17,500 to $19,999 | 4 (3.1%) | 0 (0.0%) |
| $20,000 to $22,499 | 0 (0.0%) | 0 (0.0%) |
| $22,500 to $24,999 | 0 (0.0%) | 3 (3.7%) |
| $25,000 to $29,999 | 1 (0.8%) | 3 (3.7%) |
| $30,000 to $34,999 | 5 (3.9%) | 1 (1.2%) |
| $35,000 to $39,999 | 9 (7.0%) | 4 (4.9%) |
| $40,000 to $44,999 | 6 (4.7%) | 0 (0.0%) |
| $45,000 to $49,999 | 3 (2.3%) | 0 (0.0%) |
| $50,000 to $54,999 | 3 (2.3%) | 1 (1.2%) |
| $55,000 to $64,999 | 57 (44.5%) | 1 (1.2%) |
| $65,000 to $74,999 | 9 (7.0%) | 1 (1.2%) |
| $75,000 to $99,999 | 12 (9.4%) | 1 (1.2%) |
| $100,000+ | 4 (3.1%) | 2 (2.4%) |
| Total | 128 (100.0%) | 82 (100.0%) |
Earnings by Sex by Educational Attainment in Bazine
| Educational Attainment | Male Income | Female Income |
| Less than High School | $75,500 | $0 |
| High School Diploma | $45,000 | $0 |
| College or Associate's Degree | - | - |
| Bachelor's Degree | - | - |
| Graduate Degree | - | - |
| Total | $43,750 | $16,136 |
Family Income in Bazine
Family Income Brackets in Bazine
According to the Bazine family income data, there are 65 families falling into the $50,000 to $74,999 income range, which is the most common income bracket and makes up 47.1% of all families.
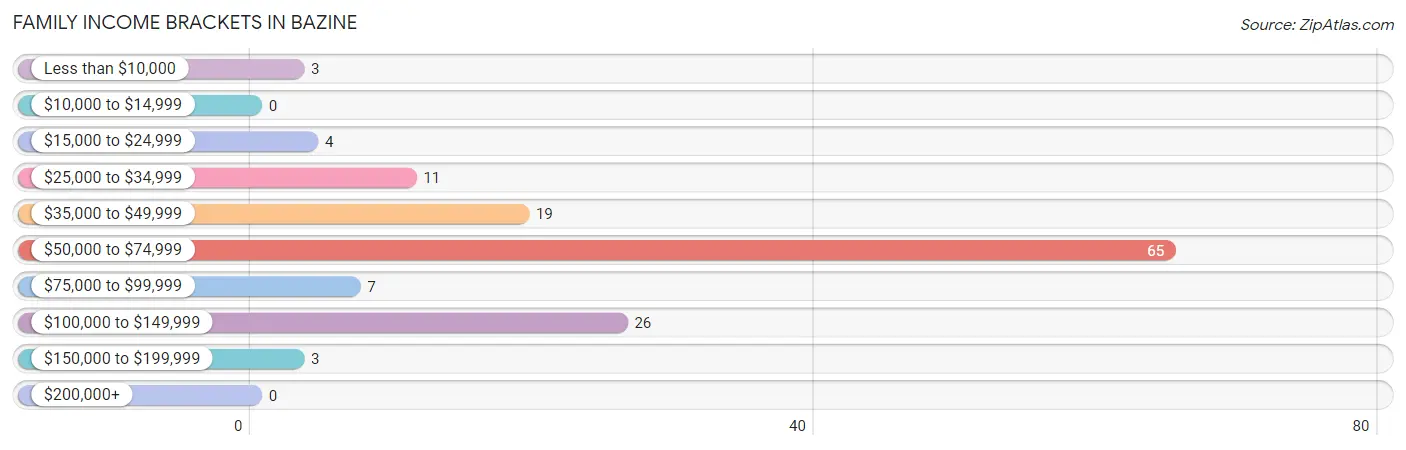
| Income Bracket | # Families | % Families |
| Less than $10,000 | 3 | 2.2% |
| $10,000 to $14,999 | 0 | 0.0% |
| $15,000 to $24,999 | 4 | 2.9% |
| $25,000 to $34,999 | 11 | 8.0% |
| $35,000 to $49,999 | 19 | 13.8% |
| $50,000 to $74,999 | 65 | 47.1% |
| $75,000 to $99,999 | 7 | 5.1% |
| $100,000 to $149,999 | 26 | 18.8% |
| $150,000 to $199,999 | 3 | 2.2% |
| $200,000+ | 0 | 0.0% |
Family Income by Famaliy Size in Bazine
3-person families (14 | 10.1%) account for the highest median family income in Bazine with $73,750 per family, while 2-person families (81 | 58.7%) have the highest median income of $27,298 per family member.
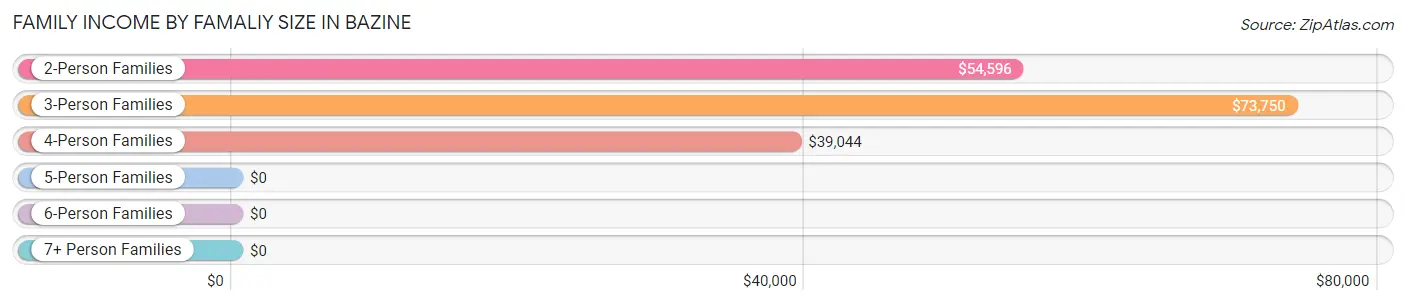
| Income Bracket | # Families | Median Income |
| 2-Person Families | 81 (58.7%) | $54,596 |
| 3-Person Families | 14 (10.1%) | $73,750 |
| 4-Person Families | 21 (15.2%) | $39,044 |
| 5-Person Families | 6 (4.3%) | $0 |
| 6-Person Families | 15 (10.9%) | $0 |
| 7+ Person Families | 1 (0.7%) | $0 |
| Total | 138 (100.0%) | $54,485 |
Family Income by Number of Earners in Bazine
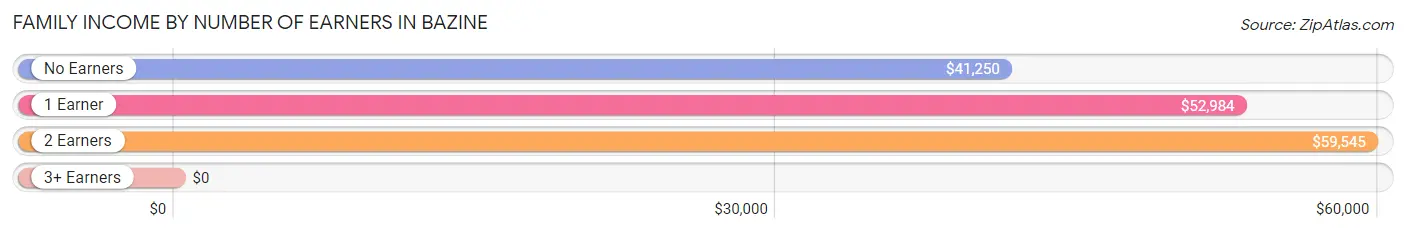
| Number of Earners | # Families | Median Income |
| No Earners | 12 (8.7%) | $41,250 |
| 1 Earner | 64 (46.4%) | $52,984 |
| 2 Earners | 54 (39.1%) | $59,545 |
| 3+ Earners | 8 (5.8%) | $0 |
| Total | 138 (100.0%) | $54,485 |
Household Income in Bazine
Household Income Brackets in Bazine
With 65 households falling in the category, the $50,000 to $74,999 income range is the most frequent in Bazine, accounting for 40.4% of all households.
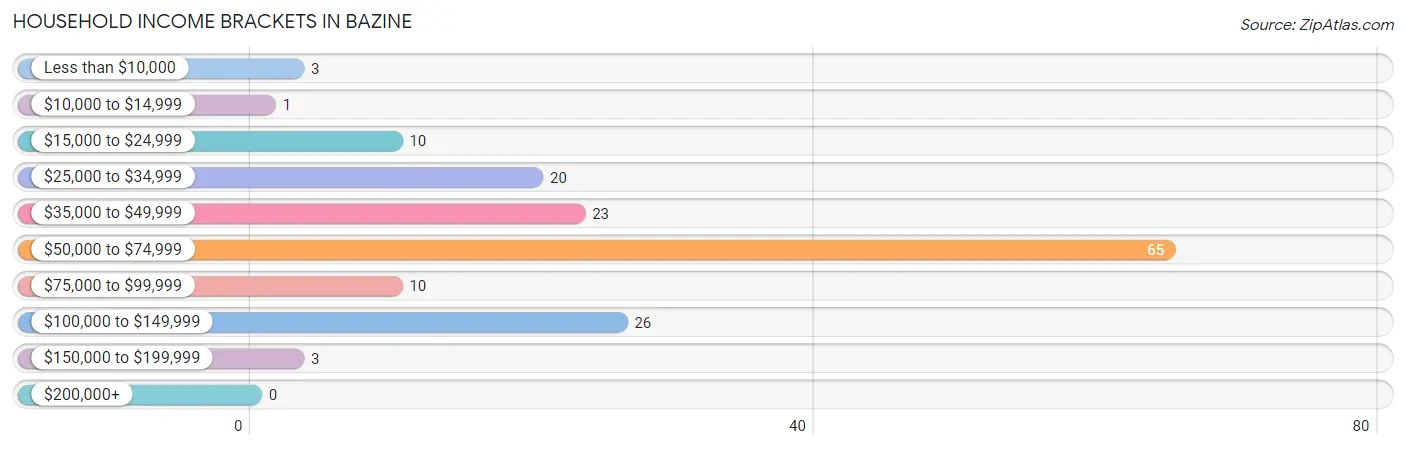
| Income Bracket | # Households | % Households |
| Less than $10,000 | 3 | 1.9% |
| $10,000 to $14,999 | 1 | 0.6% |
| $15,000 to $24,999 | 10 | 6.2% |
| $25,000 to $34,999 | 20 | 12.4% |
| $35,000 to $49,999 | 23 | 14.3% |
| $50,000 to $74,999 | 65 | 40.4% |
| $75,000 to $99,999 | 10 | 6.2% |
| $100,000 to $149,999 | 26 | 16.1% |
| $150,000 to $199,999 | 3 | 1.9% |
| $200,000+ | 0 | 0.0% |
Household Income by Householder Age in Bazine
The median household income in Bazine is $53,860, with the highest median household income of $78,750 found in the 25 to 44 years age bracket for the primary householder. A total of 43 households (26.7%) fall into this category. Meanwhile, the 15 to 24 years age bracket for the primary householder has the lowest median household income of $0, with 25 households (15.5%) in this group.
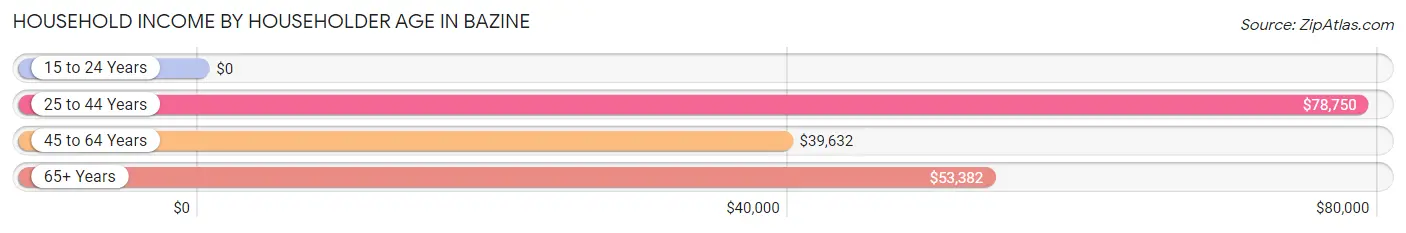
| Income Bracket | # Households | Median Income |
| 15 to 24 Years | 25 (15.5%) | $0 |
| 25 to 44 Years | 43 (26.7%) | $78,750 |
| 45 to 64 Years | 35 (21.7%) | $39,632 |
| 65+ Years | 58 (36.0%) | $53,382 |
| Total | 161 (100.0%) | $53,860 |
Poverty in Bazine
Income Below Poverty by Sex and Age in Bazine
With 9.6% poverty level for males and 23.2% for females among the residents of Bazine, 12 to 14 year old males and 45 to 54 year old females are the most vulnerable to poverty, with 3 males (100.0%) and 1 females (100.0%) in their respective age groups living below the poverty level.
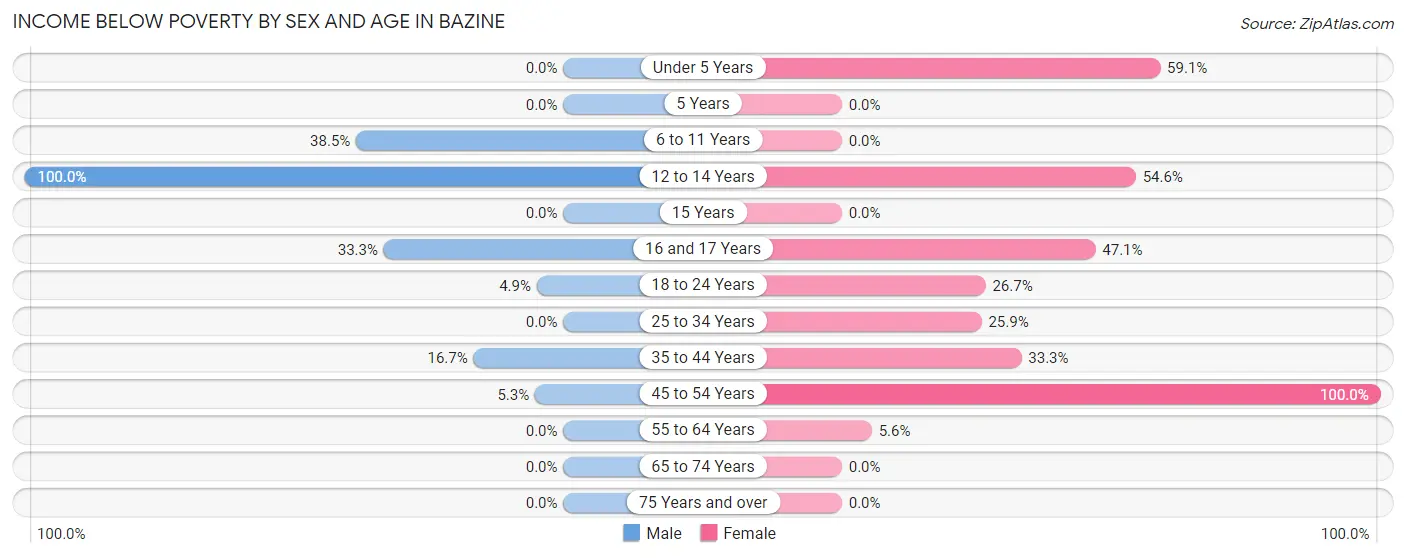
| Age Bracket | Male | Female |
| Under 5 Years | 0 (0.0%) | 13 (59.1%) |
| 5 Years | 0 (0.0%) | 0 (0.0%) |
| 6 to 11 Years | 10 (38.5%) | 0 (0.0%) |
| 12 to 14 Years | 3 (100.0%) | 6 (54.5%) |
| 15 Years | 0 (0.0%) | 0 (0.0%) |
| 16 and 17 Years | 1 (33.3%) | 8 (47.1%) |
| 18 to 24 Years | 3 (4.9%) | 8 (26.7%) |
| 25 to 34 Years | 0 (0.0%) | 7 (25.9%) |
| 35 to 44 Years | 3 (16.7%) | 7 (33.3%) |
| 45 to 54 Years | 1 (5.3%) | 1 (100.0%) |
| 55 to 64 Years | 0 (0.0%) | 1 (5.6%) |
| 65 to 74 Years | 0 (0.0%) | 0 (0.0%) |
| 75 Years and over | 0 (0.0%) | 0 (0.0%) |
| Total | 21 (9.6%) | 51 (23.2%) |
Income Above Poverty by Sex and Age in Bazine
According to the poverty statistics in Bazine, males aged under 5 years and females aged 6 to 11 years are the age groups that are most secure financially, with 100.0% of males and 100.0% of females in these age groups living above the poverty line.
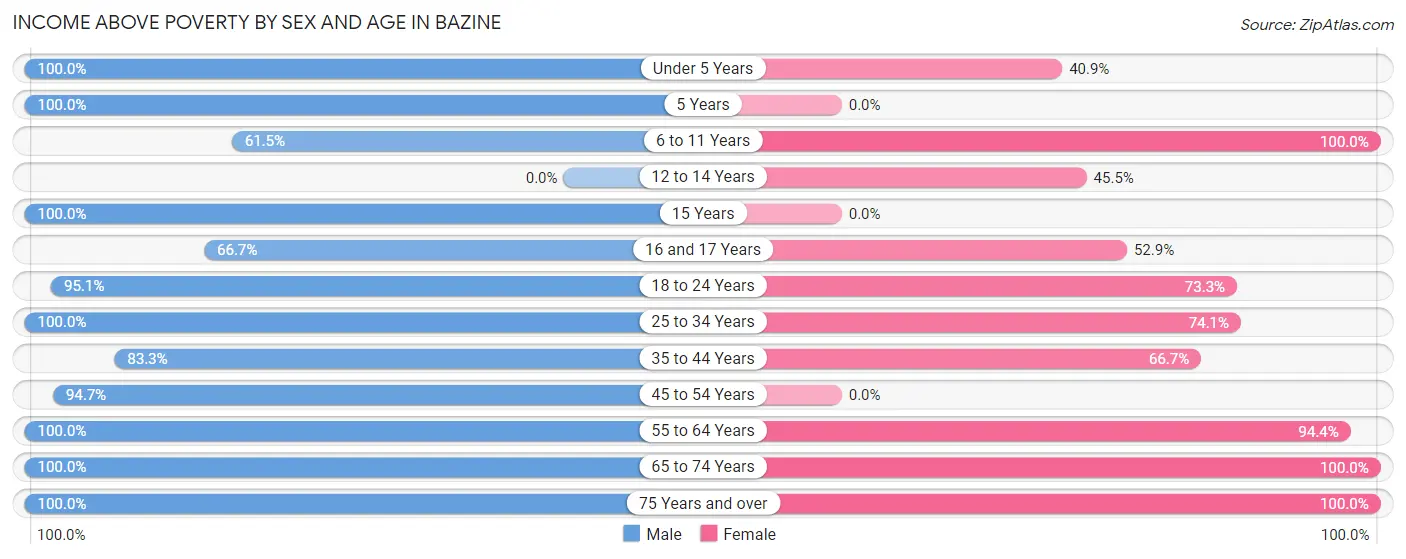
| Age Bracket | Male | Female |
| Under 5 Years | 7 (100.0%) | 9 (40.9%) |
| 5 Years | 7 (100.0%) | 0 (0.0%) |
| 6 to 11 Years | 16 (61.5%) | 24 (100.0%) |
| 12 to 14 Years | 0 (0.0%) | 5 (45.5%) |
| 15 Years | 8 (100.0%) | 0 (0.0%) |
| 16 and 17 Years | 2 (66.7%) | 9 (52.9%) |
| 18 to 24 Years | 58 (95.1%) | 22 (73.3%) |
| 25 to 34 Years | 11 (100.0%) | 20 (74.1%) |
| 35 to 44 Years | 15 (83.3%) | 14 (66.7%) |
| 45 to 54 Years | 18 (94.7%) | 0 (0.0%) |
| 55 to 64 Years | 19 (100.0%) | 17 (94.4%) |
| 65 to 74 Years | 26 (100.0%) | 41 (100.0%) |
| 75 Years and over | 10 (100.0%) | 8 (100.0%) |
| Total | 197 (90.4%) | 169 (76.8%) |
Income Below Poverty Among Married-Couple Families in Bazine
The poverty statistics for married-couple families in Bazine show that 7.7% or 10 of the total 129 families live below the poverty line. Families with 3 or 4 children have the highest poverty rate of 52.6%, comprising of 10 families. On the other hand, families with no children have the lowest poverty rate of 0.0%, which includes 0 families.
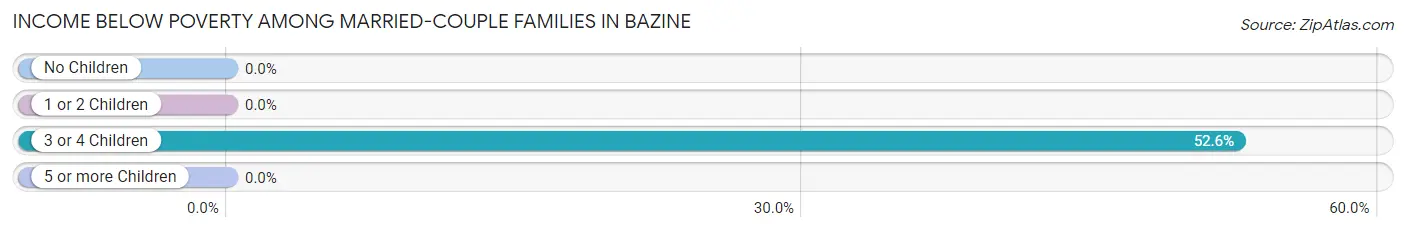
| Children | Above Poverty | Below Poverty |
| No Children | 83 (100.0%) | 0 (0.0%) |
| 1 or 2 Children | 26 (100.0%) | 0 (0.0%) |
| 3 or 4 Children | 9 (47.4%) | 10 (52.6%) |
| 5 or more Children | 1 (100.0%) | 0 (0.0%) |
| Total | 119 (92.2%) | 10 (7.7%) |
Income Below Poverty Among Single-Parent Households in Bazine
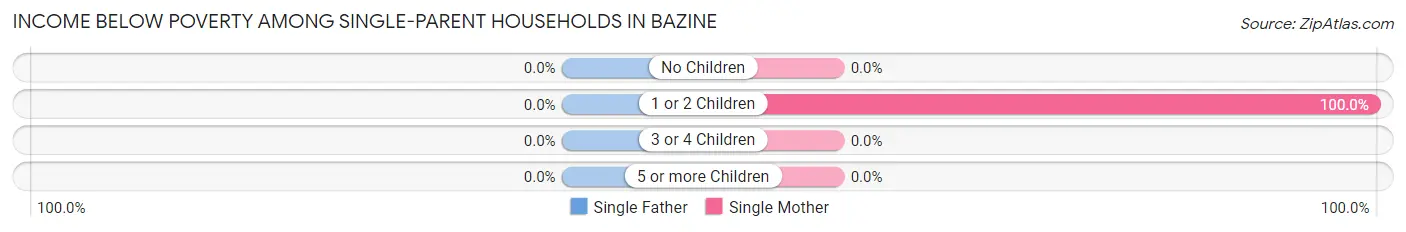
| Children | Single Father | Single Mother |
| No Children | 0 (0.0%) | 0 (0.0%) |
| 1 or 2 Children | 0 (0.0%) | 3 (100.0%) |
| 3 or 4 Children | 0 (0.0%) | 0 (0.0%) |
| 5 or more Children | 0 (0.0%) | 0 (0.0%) |
| Total | 0 (0.0%) | 3 (100.0%) |
Income Below Poverty Among Married-Couple vs Single-Parent Households in Bazine
The poverty data for Bazine shows that 10 of the married-couple family households (7.7%) and 3 of the single-parent households (33.3%) are living below the poverty level. Within the married-couple family households, those with 3 or 4 children have the highest poverty rate, with 10 households (52.6%) falling below the poverty line. Among the single-parent households, those with 1 or 2 children have the highest poverty rate, with 3 household (33.3%) living below poverty.
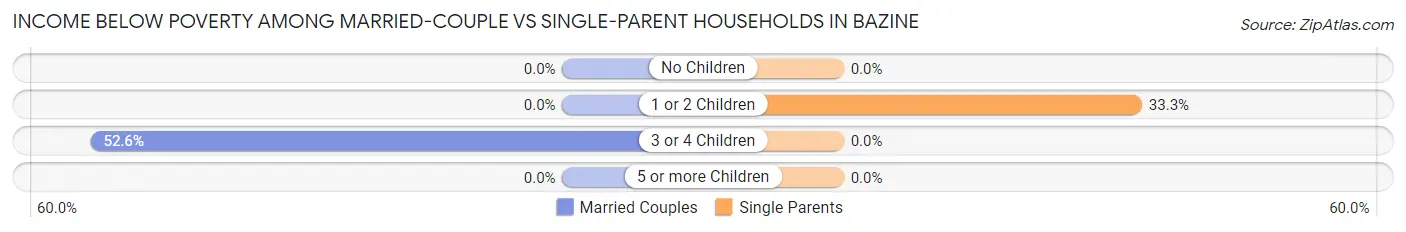
| Children | Married-Couple Families | Single-Parent Households |
| No Children | 0 (0.0%) | 0 (0.0%) |
| 1 or 2 Children | 0 (0.0%) | 3 (33.3%) |
| 3 or 4 Children | 10 (52.6%) | 0 (0.0%) |
| 5 or more Children | 0 (0.0%) | 0 (0.0%) |
| Total | 10 (7.7%) | 3 (33.3%) |
Race in Bazine
The most populous races in Bazine are Some other Race (215 | 49.1%), Hispanic or Latino (214 | 48.9%), and White / Caucasian (195 | 44.5%).
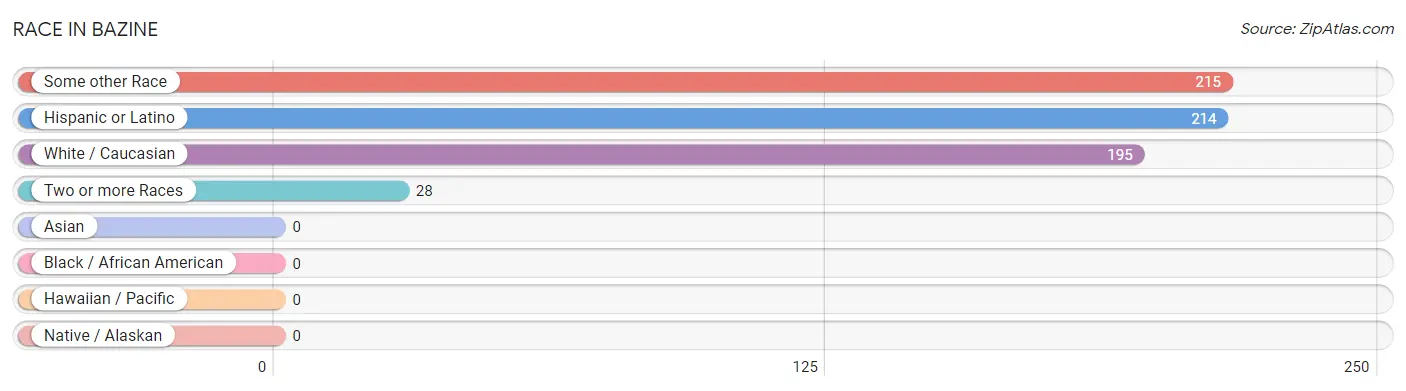
| Race | # Population | % Population |
| Asian | 0 | 0.0% |
| Black / African American | 0 | 0.0% |
| Hawaiian / Pacific | 0 | 0.0% |
| Hispanic or Latino | 214 | 48.9% |
| Native / Alaskan | 0 | 0.0% |
| White / Caucasian | 195 | 44.5% |
| Two or more Races | 28 | 6.4% |
| Some other Race | 215 | 49.1% |
| Total | 438 | 100.0% |
Ancestry in Bazine
The most populous ancestries reported in Bazine are Mexican (200 | 45.7%), German (84 | 19.2%), American (39 | 8.9%), Cherokee (27 | 6.2%), and Irish (26 | 5.9%), together accounting for 85.8% of all Bazine residents.
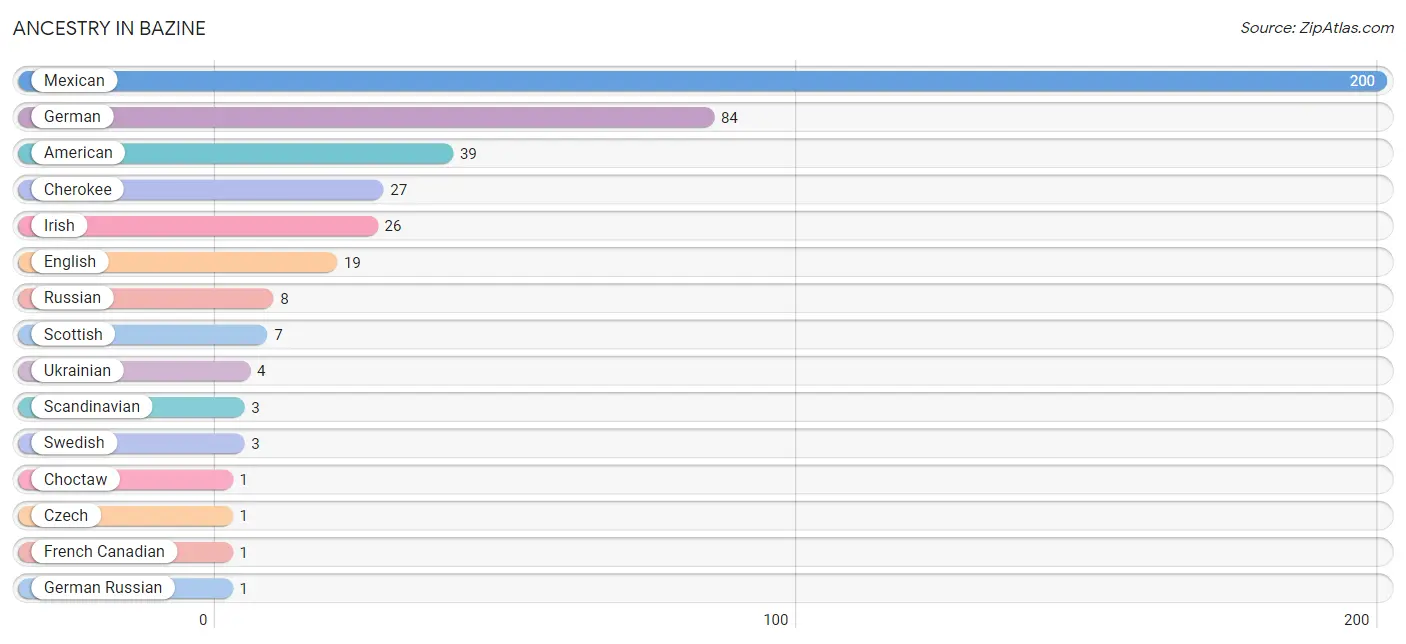
| Ancestry | # Population | % Population |
| American | 39 | 8.9% |
| Cherokee | 27 | 6.2% |
| Choctaw | 1 | 0.2% |
| Czech | 1 | 0.2% |
| English | 19 | 4.3% |
| French Canadian | 1 | 0.2% |
| German | 84 | 19.2% |
| German Russian | 1 | 0.2% |
| Irish | 26 | 5.9% |
| Mexican | 200 | 45.7% |
| Pennsylvania German | 1 | 0.2% |
| Russian | 8 | 1.8% |
| Scandinavian | 3 | 0.7% |
| Scottish | 7 | 1.6% |
| Swedish | 3 | 0.7% |
| Ukrainian | 4 | 0.9% | View All 16 Rows |
Immigrants in Bazine
The most numerous immigrant groups reported in Bazine came from Central America (63 | 14.4%), Latin America (63 | 14.4%), and Mexico (63 | 14.4%), together accounting for 43.1% of all Bazine residents.
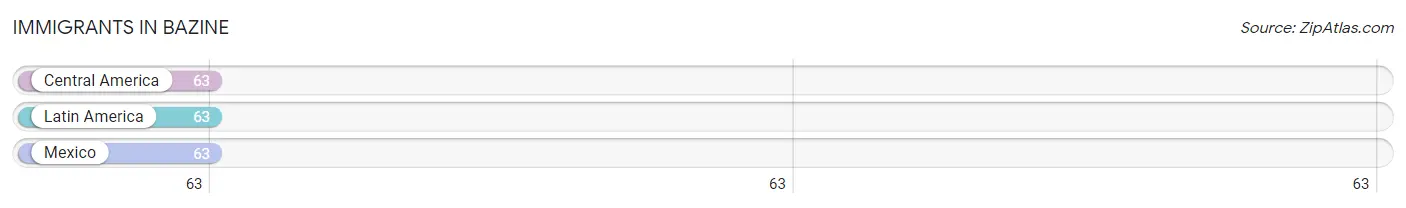
| Immigration Origin | # Population | % Population |
| Central America | 63 | 14.4% |
| Latin America | 63 | 14.4% |
| Mexico | 63 | 14.4% | View All 3 Rows |
Sex and Age in Bazine
Sex and Age in Bazine
The most populous age groups in Bazine are 20 to 24 Years (59 | 27.1%) for men and 15 to 19 Years (39 | 17.7%) for women.
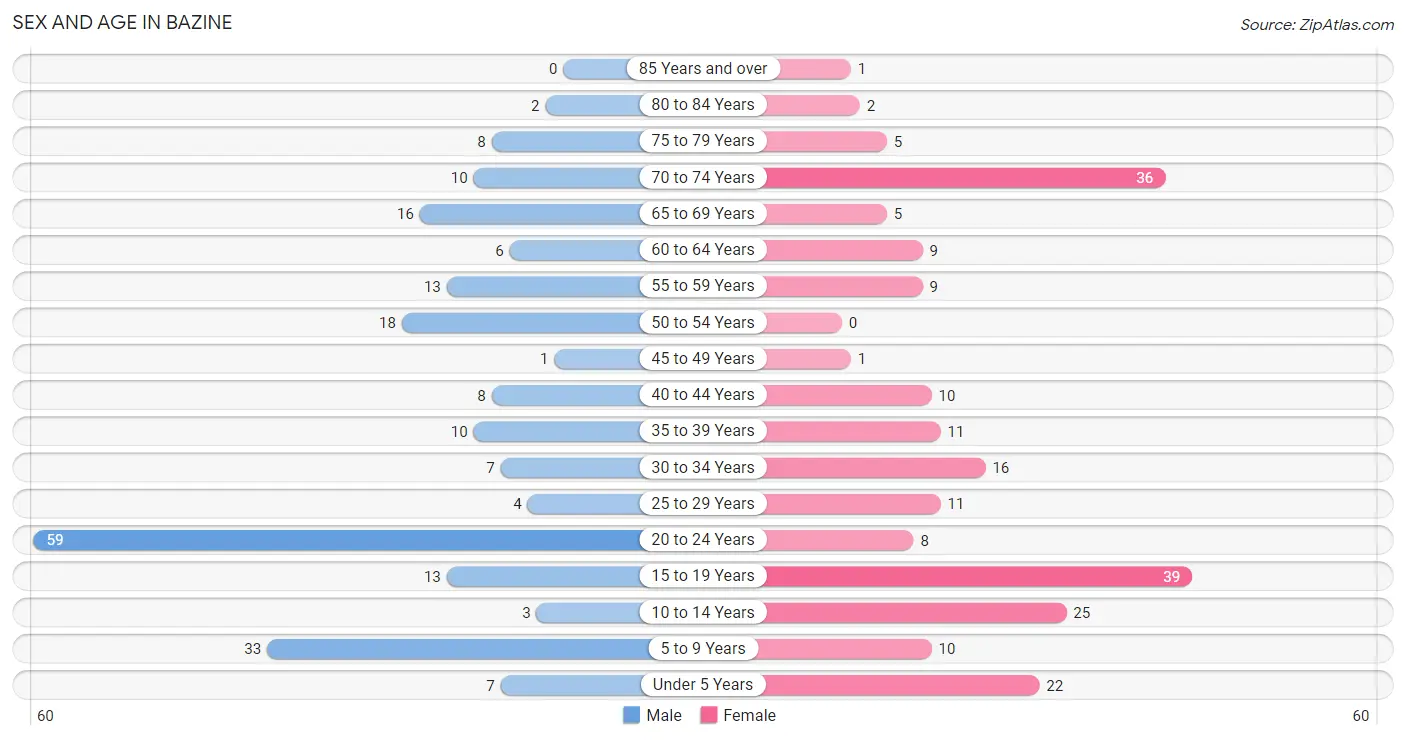
| Age Bracket | Male | Female |
| Under 5 Years | 7 (3.2%) | 22 (10.0%) |
| 5 to 9 Years | 33 (15.1%) | 10 (4.5%) |
| 10 to 14 Years | 3 (1.4%) | 25 (11.4%) |
| 15 to 19 Years | 13 (6.0%) | 39 (17.7%) |
| 20 to 24 Years | 59 (27.1%) | 8 (3.6%) |
| 25 to 29 Years | 4 (1.8%) | 11 (5.0%) |
| 30 to 34 Years | 7 (3.2%) | 16 (7.3%) |
| 35 to 39 Years | 10 (4.6%) | 11 (5.0%) |
| 40 to 44 Years | 8 (3.7%) | 10 (4.5%) |
| 45 to 49 Years | 1 (0.5%) | 1 (0.4%) |
| 50 to 54 Years | 18 (8.3%) | 0 (0.0%) |
| 55 to 59 Years | 13 (6.0%) | 9 (4.1%) |
| 60 to 64 Years | 6 (2.8%) | 9 (4.1%) |
| 65 to 69 Years | 16 (7.3%) | 5 (2.3%) |
| 70 to 74 Years | 10 (4.6%) | 36 (16.4%) |
| 75 to 79 Years | 8 (3.7%) | 5 (2.3%) |
| 80 to 84 Years | 2 (0.9%) | 2 (0.9%) |
| 85 Years and over | 0 (0.0%) | 1 (0.4%) |
| Total | 218 (100.0%) | 220 (100.0%) |
Families and Households in Bazine
Median Family Size in Bazine
The median family size in Bazine is 2.96 persons per family, with single male/father families (6 | 4.3%) accounting for the largest median family size of 3.33 persons per family. On the other hand, married-couple families (129 | 93.5%) represent the smallest median family size with 2.95 persons per family.
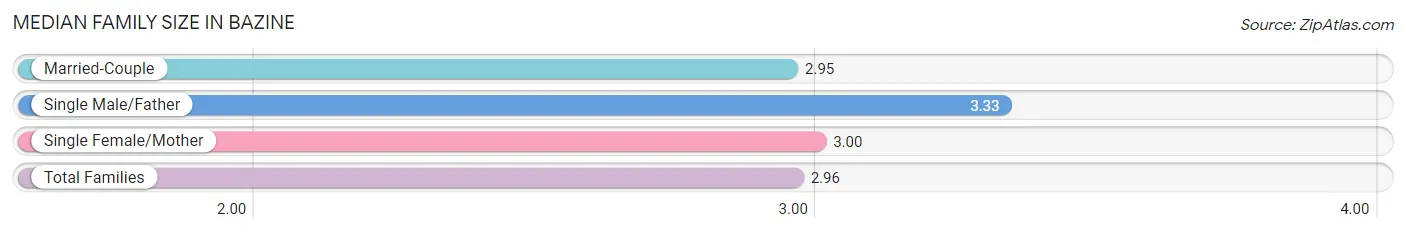
| Family Type | # Families | Family Size |
| Married-Couple | 129 (93.5%) | 2.95 |
| Single Male/Father | 6 (4.3%) | 3.33 |
| Single Female/Mother | 3 (2.2%) | 3.00 |
| Total Families | 138 (100.0%) | 2.96 |
Median Household Size in Bazine
The median household size in Bazine is 2.72 persons per household, with single male/father households (6 | 3.7%) accounting for the largest median household size of 4.17 persons per household. non-family households (23 | 14.3%) represent the smallest median household size with 1.04 persons per household.
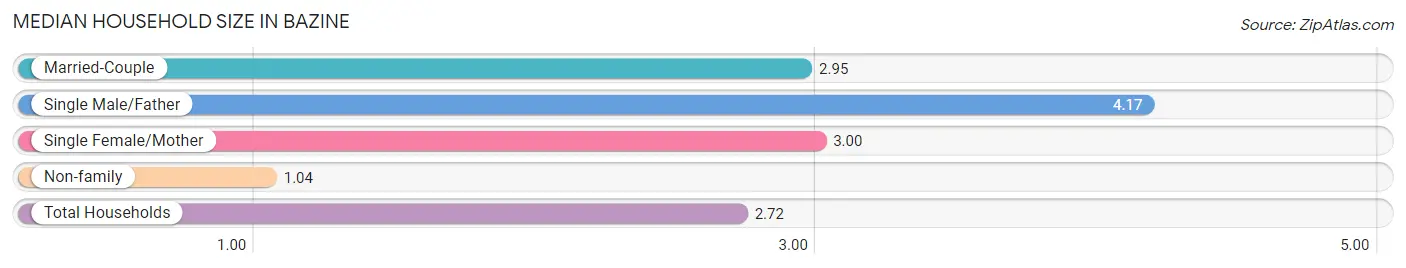
| Household Type | # Households | Household Size |
| Married-Couple | 129 (80.1%) | 2.95 |
| Single Male/Father | 6 (3.7%) | 4.17 |
| Single Female/Mother | 3 (1.9%) | 3.00 |
| Non-family | 23 (14.3%) | 1.04 |
| Total Households | 161 (100.0%) | 2.72 |
Household Size by Marriage Status in Bazine
Out of a total of 161 households in Bazine, 138 (85.7%) are family households, while 23 (14.3%) are nonfamily households. The most numerous type of family households are 2-person households, comprising 81, and the most common type of nonfamily households are 1-person households, comprising 22.
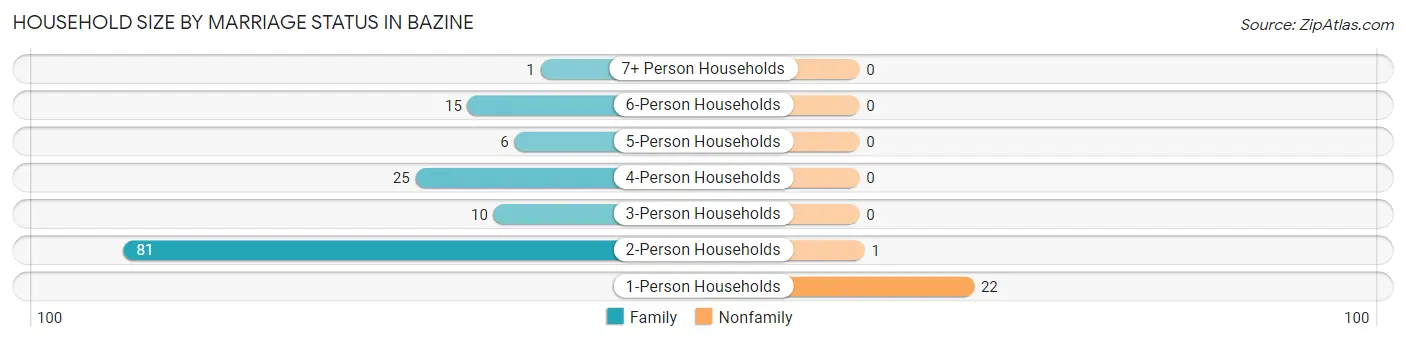
| Household Size | Family Households | Nonfamily Households |
| 1-Person Households | - | 22 (13.7%) |
| 2-Person Households | 81 (50.3%) | 1 (0.6%) |
| 3-Person Households | 10 (6.2%) | 0 (0.0%) |
| 4-Person Households | 25 (15.5%) | 0 (0.0%) |
| 5-Person Households | 6 (3.7%) | 0 (0.0%) |
| 6-Person Households | 15 (9.3%) | 0 (0.0%) |
| 7+ Person Households | 1 (0.6%) | 0 (0.0%) |
| Total | 138 (85.7%) | 23 (14.3%) |
Female Fertility in Bazine
Fertility by Age in Bazine
Average fertility rate in Bazine is 31.0 births per 1,000 women. Women in the age bracket of 20 to 34 years have the highest fertility rate with 86.0 births per 1,000 women. Women in the age bracket of 20 to 34 years acount for 100.0% of all women with births.
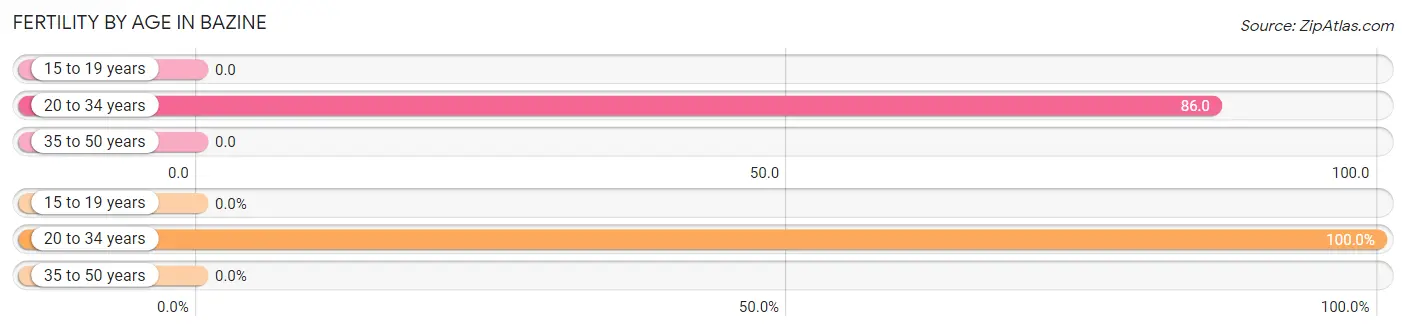
| Age Bracket | Women with Births | Births / 1,000 Women |
| 15 to 19 years | 0 (0.0%) | 0.0 |
| 20 to 34 years | 3 (100.0%) | 86.0 |
| 35 to 50 years | 0 (0.0%) | 0.0 |
| Total | 3 (100.0%) | 31.0 |
Fertility by Age by Marriage Status in Bazine
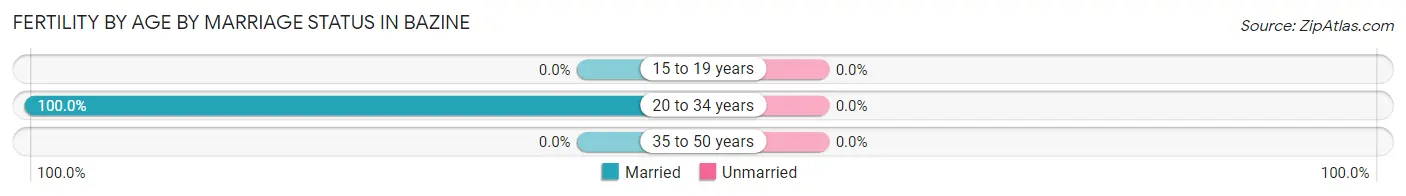
| Age Bracket | Married | Unmarried |
| 15 to 19 years | 0 (0.0%) | 0 (0.0%) |
| 20 to 34 years | 3 (100.0%) | 0 (0.0%) |
| 35 to 50 years | 0 (0.0%) | 0 (0.0%) |
| Total | 3 (100.0%) | 0 (0.0%) |
Fertility by Education in Bazine
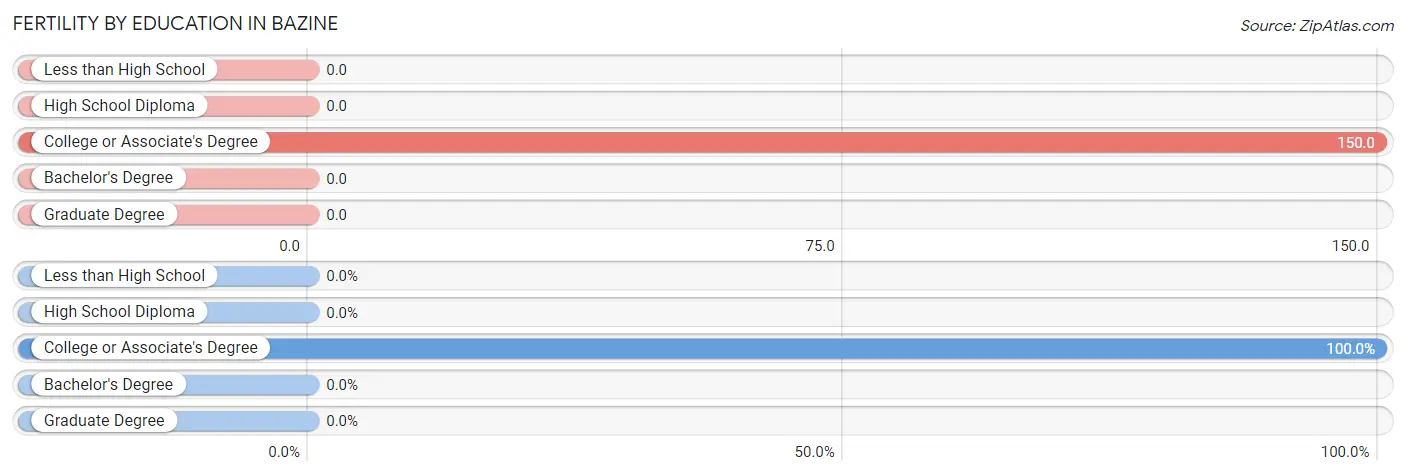
| Educational Attainment | Women with Births | Births / 1,000 Women |
| Less than High School | 0 (0.0%) | 0.0 |
| High School Diploma | 0 (0.0%) | 0.0 |
| College or Associate's Degree | 3 (100.0%) | 150.0 |
| Bachelor's Degree | 0 (0.0%) | 0.0 |
| Graduate Degree | 0 (0.0%) | 0.0 |
| Total | 3 (100.0%) | 31.0 |
Fertility by Education by Marriage Status in Bazine
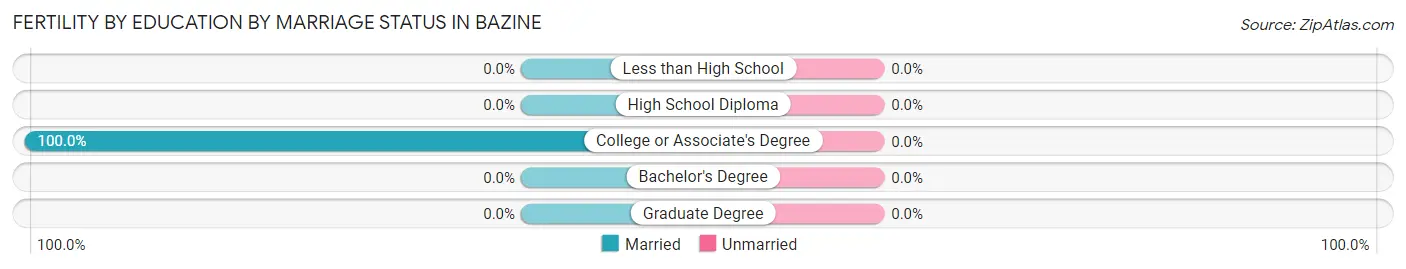
| Educational Attainment | Married | Unmarried |
| Less than High School | 0 (0.0%) | 0 (0.0%) |
| High School Diploma | 0 (0.0%) | 0 (0.0%) |
| College or Associate's Degree | 3 (100.0%) | 0 (0.0%) |
| Bachelor's Degree | 0 (0.0%) | 0 (0.0%) |
| Graduate Degree | 0 (0.0%) | 0 (0.0%) |
| Total | 3 (100.0%) | 0 (0.0%) |
Employment Characteristics in Bazine
Employment by Class of Employer in Bazine
Among the 163 employed individuals in Bazine, private company employees (68 | 41.7%), not-for-profit organizations (61 | 37.4%), and local government employees (15 | 9.2%) make up the most common classes of employment.
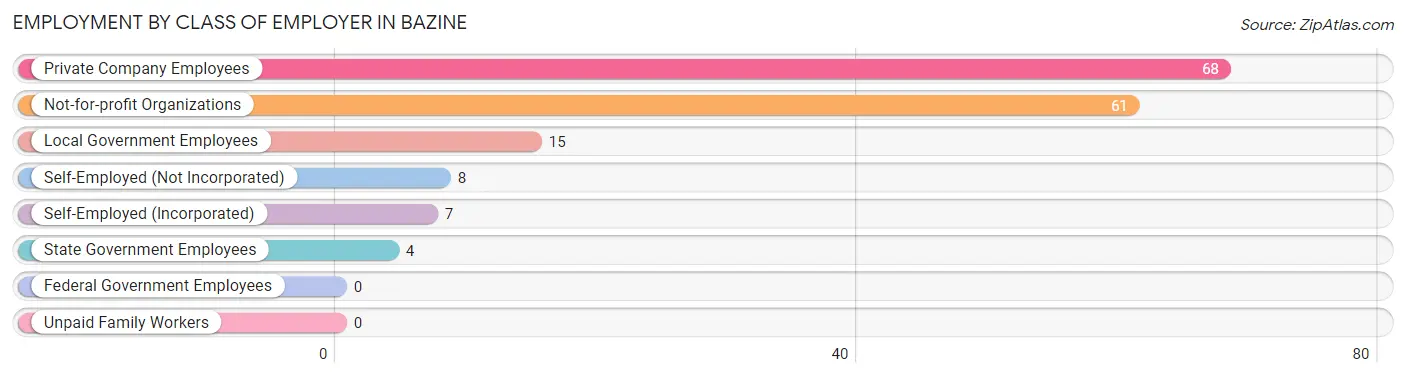
| Employer Class | # Employees | % Employees |
| Private Company Employees | 68 | 41.7% |
| Self-Employed (Incorporated) | 7 | 4.3% |
| Self-Employed (Not Incorporated) | 8 | 4.9% |
| Not-for-profit Organizations | 61 | 37.4% |
| Local Government Employees | 15 | 9.2% |
| State Government Employees | 4 | 2.5% |
| Federal Government Employees | 0 | 0.0% |
| Unpaid Family Workers | 0 | 0.0% |
| Total | 163 | 100.0% |
Employment Status by Age in Bazine
According to the labor force statistics for Bazine, out of the total population over 16 years of age (330), 50.3% or 166 individuals are in the labor force, with 1.8% or 3 of them unemployed. The age group with the highest labor force participation rate is 55 to 59 years, with 100.0% or 22 individuals in the labor force. Within the labor force, the 20 to 24 years age range has the highest percentage of unemployed individuals, with 4.8% or 3 of them being unemployed.
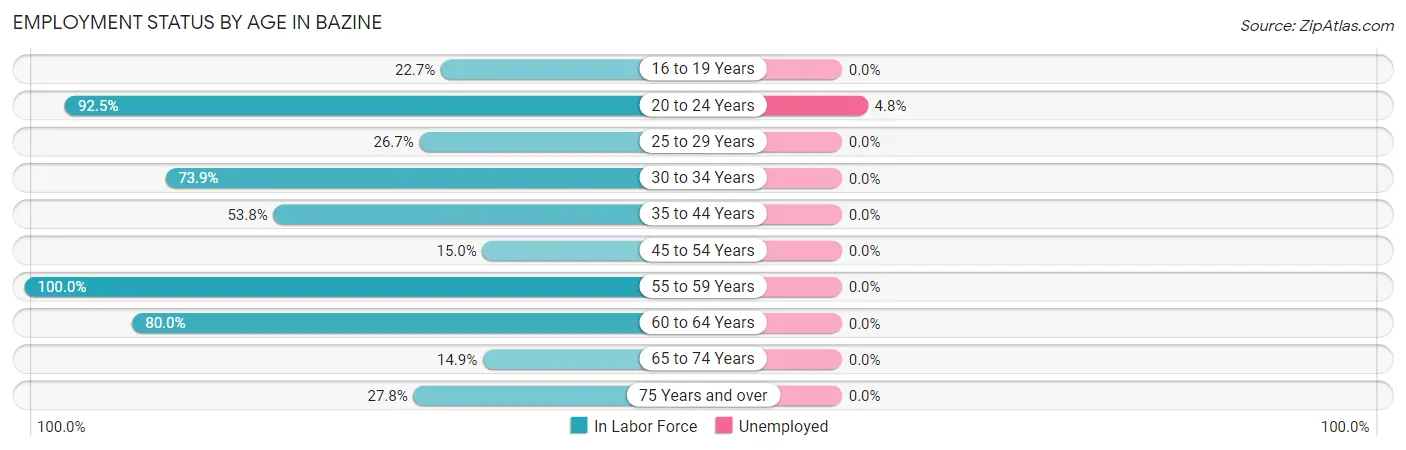
| Age Bracket | In Labor Force | Unemployed |
| 16 to 19 Years | 10 (22.7%) | 0 (0.0%) |
| 20 to 24 Years | 62 (92.5%) | 3 (4.8%) |
| 25 to 29 Years | 4 (26.7%) | 0 (0.0%) |
| 30 to 34 Years | 17 (73.9%) | 0 (0.0%) |
| 35 to 44 Years | 21 (53.8%) | 0 (0.0%) |
| 45 to 54 Years | 3 (15.0%) | 0 (0.0%) |
| 55 to 59 Years | 22 (100.0%) | 0 (0.0%) |
| 60 to 64 Years | 12 (80.0%) | 0 (0.0%) |
| 65 to 74 Years | 10 (14.9%) | 0 (0.0%) |
| 75 Years and over | 5 (27.8%) | 0 (0.0%) |
| Total | 166 (50.3%) | 3 (1.8%) |
Employment Status by Educational Attainment in Bazine
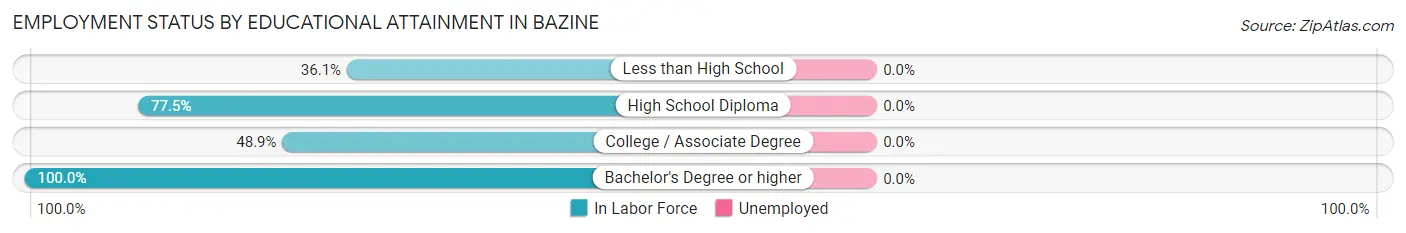
| Educational Attainment | In Labor Force | Unemployed |
| Less than High School | 13 (36.1%) | 0 (0.0%) |
| High School Diploma | 31 (77.5%) | 0 (0.0%) |
| College / Associate Degree | 22 (48.9%) | 0 (0.0%) |
| Bachelor's Degree or higher | 13 (100.0%) | 0 (0.0%) |
| Total | 79 (59.0%) | 0 (0.0%) |
Employment Occupations by Sex in Bazine
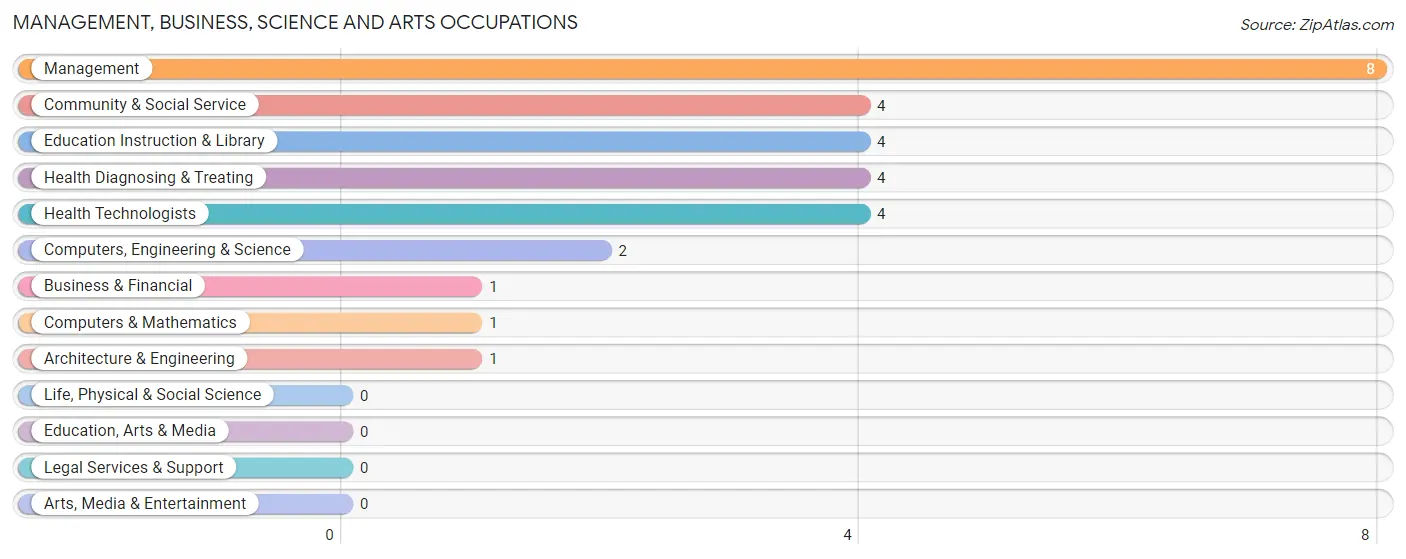
Management, Business, Science and Arts Occupations
The most common Management, Business, Science and Arts occupations in Bazine are Management (8 | 4.9%), Community & Social Service (4 | 2.5%), Education Instruction & Library (4 | 2.5%), Health Diagnosing & Treating (4 | 2.5%), and Health Technologists (4 | 2.5%).
Management, Business, Science and Arts Occupations by Sex
Within the Management, Business, Science and Arts occupations in Bazine, the most male-oriented occupations are Computers, Engineering & Science (100.0%), Computers & Mathematics (100.0%), and Architecture & Engineering (100.0%), while the most female-oriented occupations are Business & Financial (100.0%), Community & Social Service (100.0%), and Education Instruction & Library (100.0%).
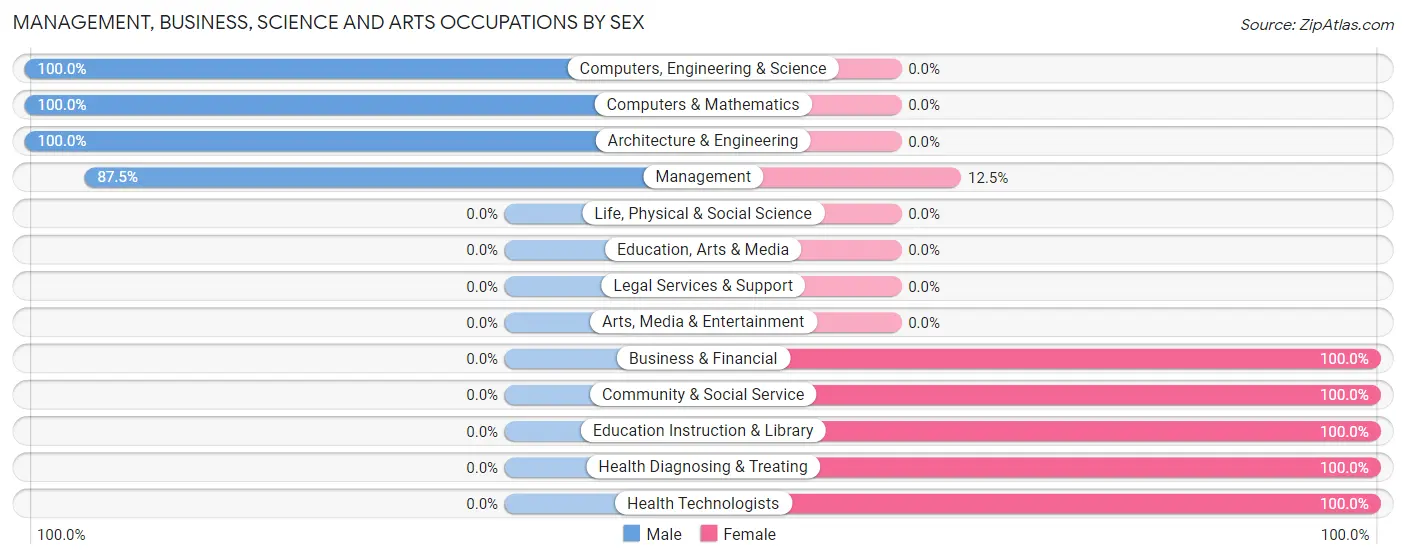
| Occupation | Male | Female |
| Management | 7 (87.5%) | 1 (12.5%) |
| Business & Financial | 0 (0.0%) | 1 (100.0%) |
| Computers, Engineering & Science | 2 (100.0%) | 0 (0.0%) |
| Computers & Mathematics | 1 (100.0%) | 0 (0.0%) |
| Architecture & Engineering | 1 (100.0%) | 0 (0.0%) |
| Life, Physical & Social Science | 0 (0.0%) | 0 (0.0%) |
| Community & Social Service | 0 (0.0%) | 4 (100.0%) |
| Education, Arts & Media | 0 (0.0%) | 0 (0.0%) |
| Legal Services & Support | 0 (0.0%) | 0 (0.0%) |
| Education Instruction & Library | 0 (0.0%) | 4 (100.0%) |
| Arts, Media & Entertainment | 0 (0.0%) | 0 (0.0%) |
| Health Diagnosing & Treating | 0 (0.0%) | 4 (100.0%) |
| Health Technologists | 0 (0.0%) | 4 (100.0%) |
| Total (Category) | 9 (47.4%) | 10 (52.6%) |
| Total (Overall) | 120 (73.6%) | 43 (26.4%) |
Services Occupations
The most common Services occupations in Bazine are Healthcare Support (10 | 6.1%), Personal Care & Service (8 | 4.9%), and Food Preparation & Serving (3 | 1.8%).
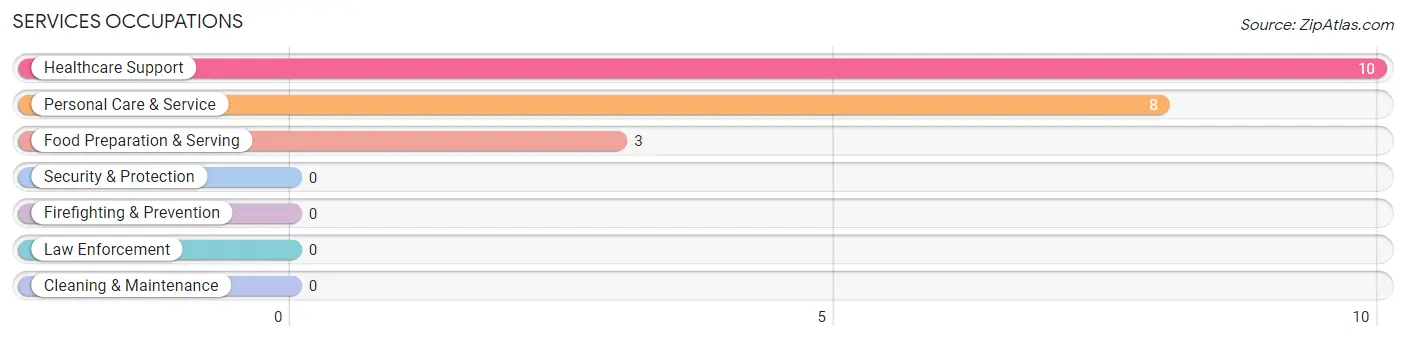
Services Occupations by Sex
Within the Services occupations in Bazine, the most male-oriented occupations are Personal Care & Service (37.5%), and Food Preparation & Serving (33.3%), while the most female-oriented occupations are Healthcare Support (100.0%), Food Preparation & Serving (66.7%), and Personal Care & Service (62.5%).
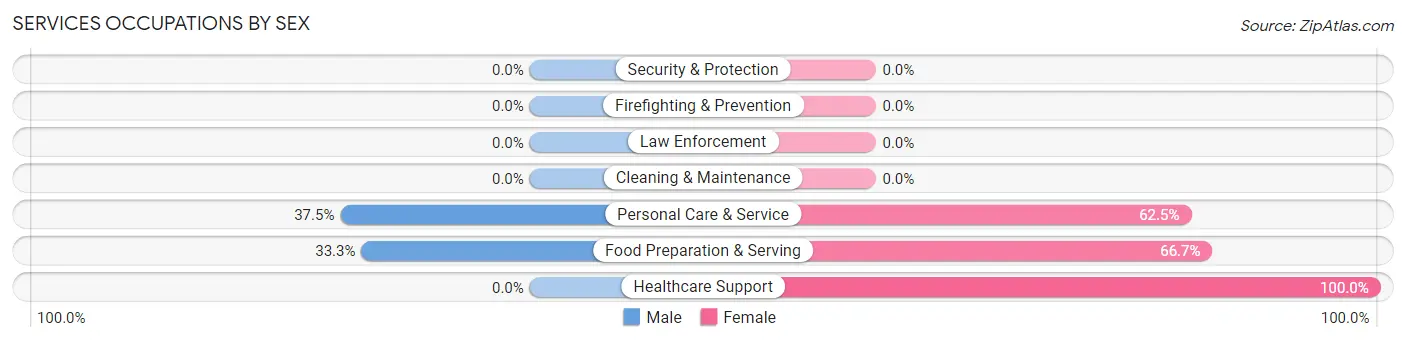
| Occupation | Male | Female |
| Healthcare Support | 0 (0.0%) | 10 (100.0%) |
| Security & Protection | 0 (0.0%) | 0 (0.0%) |
| Firefighting & Prevention | 0 (0.0%) | 0 (0.0%) |
| Law Enforcement | 0 (0.0%) | 0 (0.0%) |
| Food Preparation & Serving | 1 (33.3%) | 2 (66.7%) |
| Cleaning & Maintenance | 0 (0.0%) | 0 (0.0%) |
| Personal Care & Service | 3 (37.5%) | 5 (62.5%) |
| Total (Category) | 4 (19.1%) | 17 (80.9%) |
| Total (Overall) | 120 (73.6%) | 43 (26.4%) |
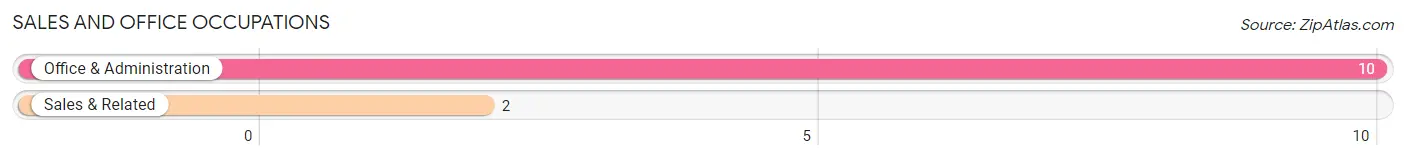
Sales and Office Occupations
The most common Sales and Office occupations in Bazine are Office & Administration (10 | 6.1%), and Sales & Related (2 | 1.2%).
Sales and Office Occupations by Sex
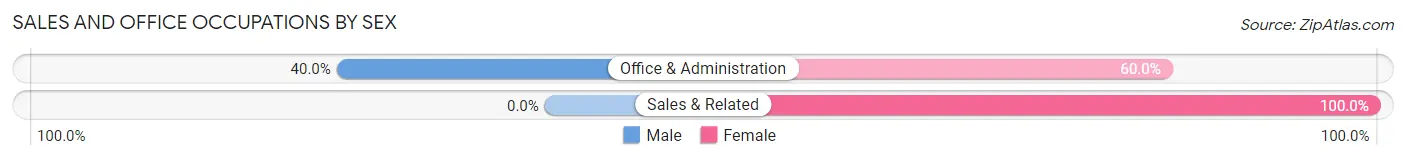
| Occupation | Male | Female |
| Sales & Related | 0 (0.0%) | 2 (100.0%) |
| Office & Administration | 4 (40.0%) | 6 (60.0%) |
| Total (Category) | 4 (33.3%) | 8 (66.7%) |
| Total (Overall) | 120 (73.6%) | 43 (26.4%) |
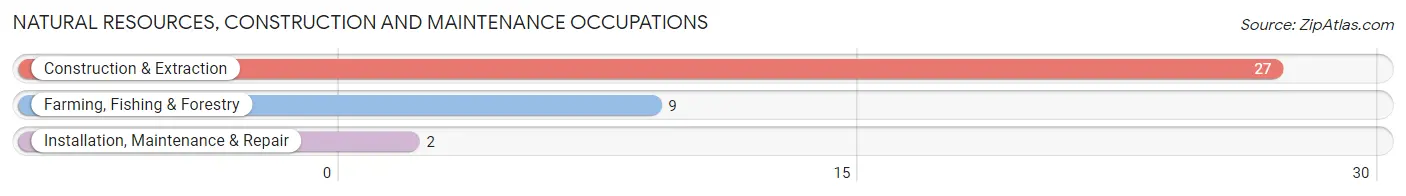
Natural Resources, Construction and Maintenance Occupations
The most common Natural Resources, Construction and Maintenance occupations in Bazine are Construction & Extraction (27 | 16.6%), Farming, Fishing & Forestry (9 | 5.5%), and Installation, Maintenance & Repair (2 | 1.2%).
Natural Resources, Construction and Maintenance Occupations by Sex
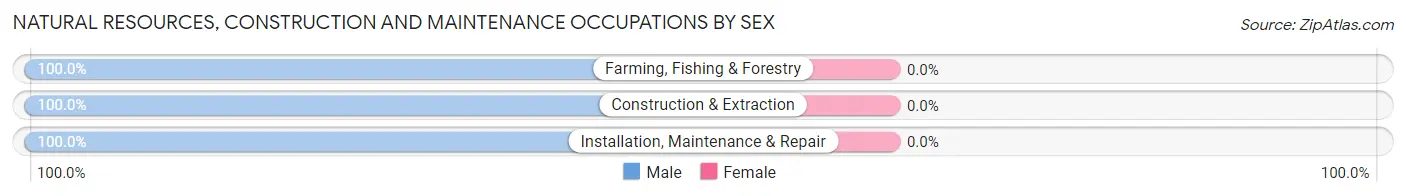
| Occupation | Male | Female |
| Farming, Fishing & Forestry | 9 (100.0%) | 0 (0.0%) |
| Construction & Extraction | 27 (100.0%) | 0 (0.0%) |
| Installation, Maintenance & Repair | 2 (100.0%) | 0 (0.0%) |
| Total (Category) | 38 (100.0%) | 0 (0.0%) |
| Total (Overall) | 120 (73.6%) | 43 (26.4%) |
Production, Transportation and Moving Occupations
The most common Production, Transportation and Moving occupations in Bazine are , and Transportation (73 | 44.8%).
Production, Transportation and Moving Occupations by Sex
| Occupation | Male | Female |
| Production | 0 (0.0%) | 0 (0.0%) |
| Transportation | 65 (89.0%) | 8 (11.0%) |
| Material Moving | 0 (0.0%) | 0 (0.0%) |
| Total (Category) | 65 (89.0%) | 8 (11.0%) |
| Total (Overall) | 120 (73.6%) | 43 (26.4%) |
Employment Industries by Sex in Bazine
Employment Industries in Bazine
The major employment industries in Bazine include Mining, Quarrying, & Extraction (22 | 13.5%), Health Care & Social Assistance (20 | 12.3%), Construction (12 | 7.4%), Agriculture, Fishing & Hunting (10 | 6.1%), and Transportation & Warehousing (9 | 5.5%).
Employment Industries by Sex in Bazine
The Bazine industries that see more men than women are Agriculture, Fishing & Hunting (100.0%), Mining, Quarrying, & Extraction (100.0%), and Construction (100.0%), whereas the industries that tend to have a higher number of women are Finance & Insurance (100.0%), Educational Services (100.0%), and Health Care & Social Assistance (100.0%).
| Industry | Male | Female |
| Agriculture, Fishing & Hunting | 10 (100.0%) | 0 (0.0%) |
| Mining, Quarrying, & Extraction | 22 (100.0%) | 0 (0.0%) |
| Construction | 12 (100.0%) | 0 (0.0%) |
| Manufacturing | 4 (100.0%) | 0 (0.0%) |
| Wholesale Trade | 4 (100.0%) | 0 (0.0%) |
| Retail Trade | 1 (33.3%) | 2 (66.7%) |
| Transportation & Warehousing | 4 (44.4%) | 5 (55.6%) |
| Utilities | 1 (100.0%) | 0 (0.0%) |
| Information | 0 (0.0%) | 0 (0.0%) |
| Finance & Insurance | 0 (0.0%) | 5 (100.0%) |
| Real Estate, Rental & Leasing | 0 (0.0%) | 0 (0.0%) |
| Professional & Scientific | 2 (100.0%) | 0 (0.0%) |
| Enterprise Management | 0 (0.0%) | 0 (0.0%) |
| Administrative & Support | 0 (0.0%) | 0 (0.0%) |
| Educational Services | 0 (0.0%) | 9 (100.0%) |
| Health Care & Social Assistance | 0 (0.0%) | 20 (100.0%) |
| Arts, Entertainment & Recreation | 0 (0.0%) | 0 (0.0%) |
| Accommodation & Food Services | 1 (50.0%) | 1 (50.0%) |
| Public Administration | 0 (0.0%) | 1 (100.0%) |
| Total | 120 (73.6%) | 43 (26.4%) |
Education in Bazine
School Enrollment in Bazine
The most common levels of schooling among the 139 students in Bazine are high school (50 | 36.0%), elementary school (49 | 35.2%), and middle school (15 | 10.8%).
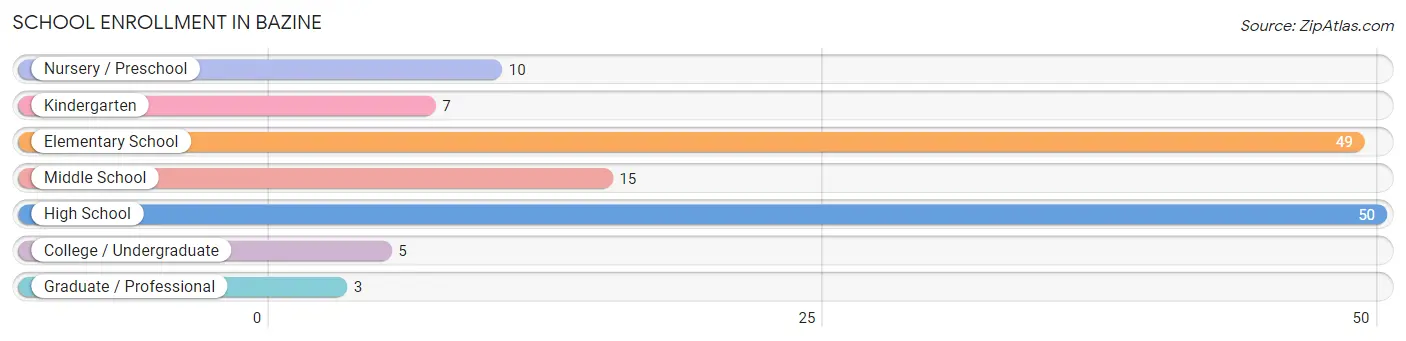
| School Level | # Students | % Students |
| Nursery / Preschool | 10 | 7.2% |
| Kindergarten | 7 | 5.0% |
| Elementary School | 49 | 35.2% |
| Middle School | 15 | 10.8% |
| High School | 50 | 36.0% |
| College / Undergraduate | 5 | 3.6% |
| Graduate / Professional | 3 | 2.2% |
| Total | 139 | 100.0% |
School Enrollment by Age by Funding Source in Bazine
Out of a total of 139 students who are enrolled in schools in Bazine, 11 (7.9%) attend a private institution, while the remaining 128 (92.1%) are enrolled in public schools. The age group of 10 to 14 year olds has the highest likelihood of being enrolled in private schools, with 5 (17.9% in the age bracket) enrolled. Conversely, the age group of 3 to 4 year olds has the lowest likelihood of being enrolled in a private school, with 10 (100.0% in the age bracket) attending a public institution.
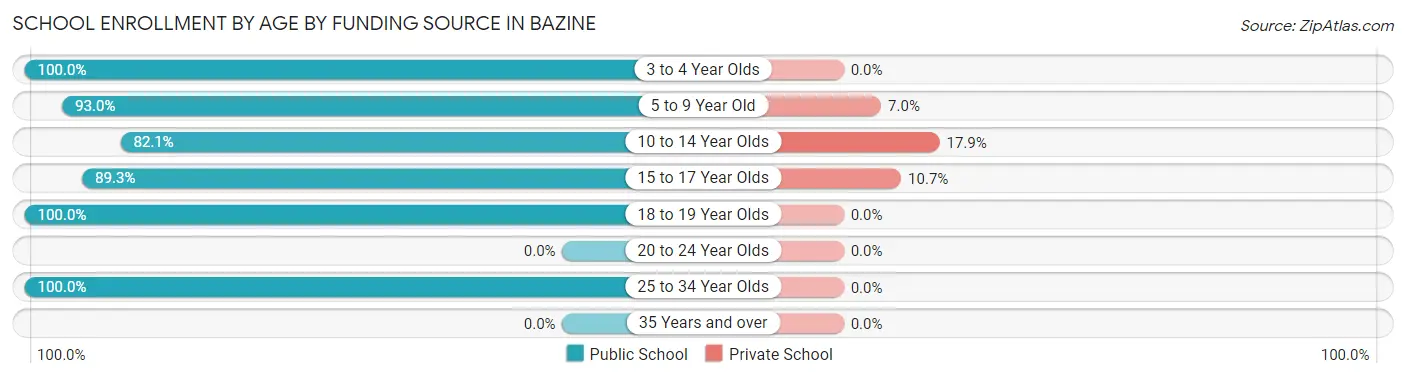
| Age Bracket | Public School | Private School |
| 3 to 4 Year Olds | 10 (100.0%) | 0 (0.0%) |
| 5 to 9 Year Old | 40 (93.0%) | 3 (7.0%) |
| 10 to 14 Year Olds | 23 (82.1%) | 5 (17.9%) |
| 15 to 17 Year Olds | 25 (89.3%) | 3 (10.7%) |
| 18 to 19 Year Olds | 22 (100.0%) | 0 (0.0%) |
| 20 to 24 Year Olds | 0 (0.0%) | 0 (0.0%) |
| 25 to 34 Year Olds | 8 (100.0%) | 0 (0.0%) |
| 35 Years and over | 0 (0.0%) | 0 (0.0%) |
| Total | 128 (92.1%) | 11 (7.9%) |
Educational Attainment by Field of Study in Bazine
Psychology (29 | 67.4%), bio, nature & agricultural (4 | 9.3%), science & technology (3 | 7.0%), visual & performing arts (3 | 7.0%), and business (2 | 4.6%) are the most common fields of study among 43 individuals in Bazine who have obtained a bachelor's degree or higher.
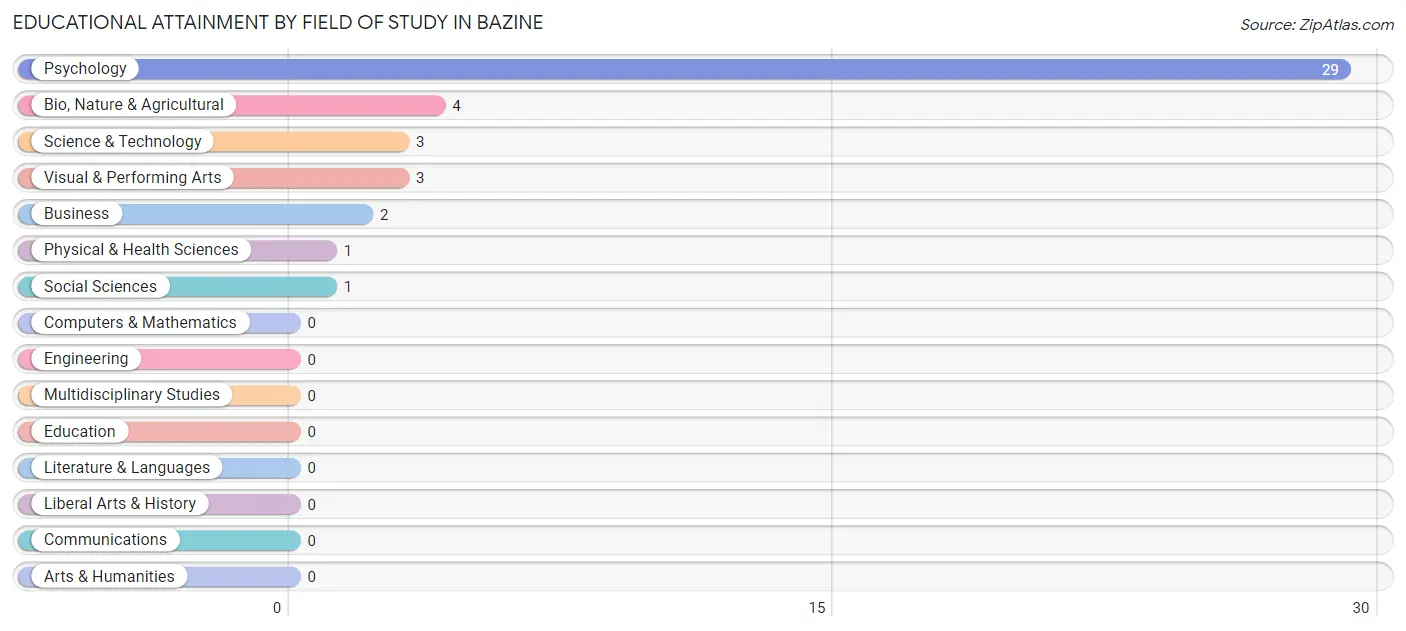
| Field of Study | # Graduates | % Graduates |
| Computers & Mathematics | 0 | 0.0% |
| Bio, Nature & Agricultural | 4 | 9.3% |
| Physical & Health Sciences | 1 | 2.3% |
| Psychology | 29 | 67.4% |
| Social Sciences | 1 | 2.3% |
| Engineering | 0 | 0.0% |
| Multidisciplinary Studies | 0 | 0.0% |
| Science & Technology | 3 | 7.0% |
| Business | 2 | 4.6% |
| Education | 0 | 0.0% |
| Literature & Languages | 0 | 0.0% |
| Liberal Arts & History | 0 | 0.0% |
| Visual & Performing Arts | 3 | 7.0% |
| Communications | 0 | 0.0% |
| Arts & Humanities | 0 | 0.0% |
| Total | 43 | 100.0% |
Transportation & Commute in Bazine
Vehicle Availability by Sex in Bazine
The most prevalent vehicle ownership categories in Bazine are males with 2 vehicles (75, accounting for 62.5%) and females with 2 vehicles (11, making up 174.4%).
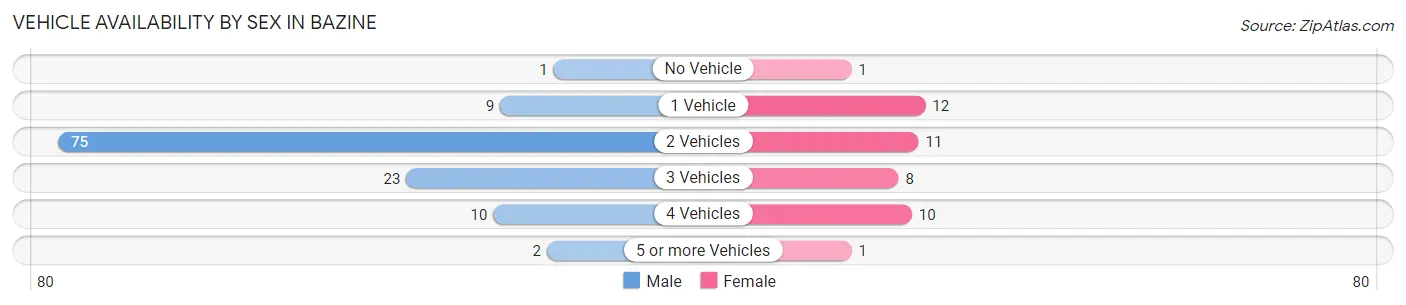
| Vehicles Available | Male | Female |
| No Vehicle | 1 (0.8%) | 1 (2.3%) |
| 1 Vehicle | 9 (7.5%) | 12 (27.9%) |
| 2 Vehicles | 75 (62.5%) | 11 (25.6%) |
| 3 Vehicles | 23 (19.2%) | 8 (18.6%) |
| 4 Vehicles | 10 (8.3%) | 10 (23.3%) |
| 5 or more Vehicles | 2 (1.7%) | 1 (2.3%) |
| Total | 120 (100.0%) | 43 (100.0%) |
Commute Time in Bazine
The most frequently occuring commute durations in Bazine are 15 to 19 minutes (73 commuters, 47.4%), less than 5 minutes (30 commuters, 19.5%), and 5 to 9 minutes (15 commuters, 9.7%).
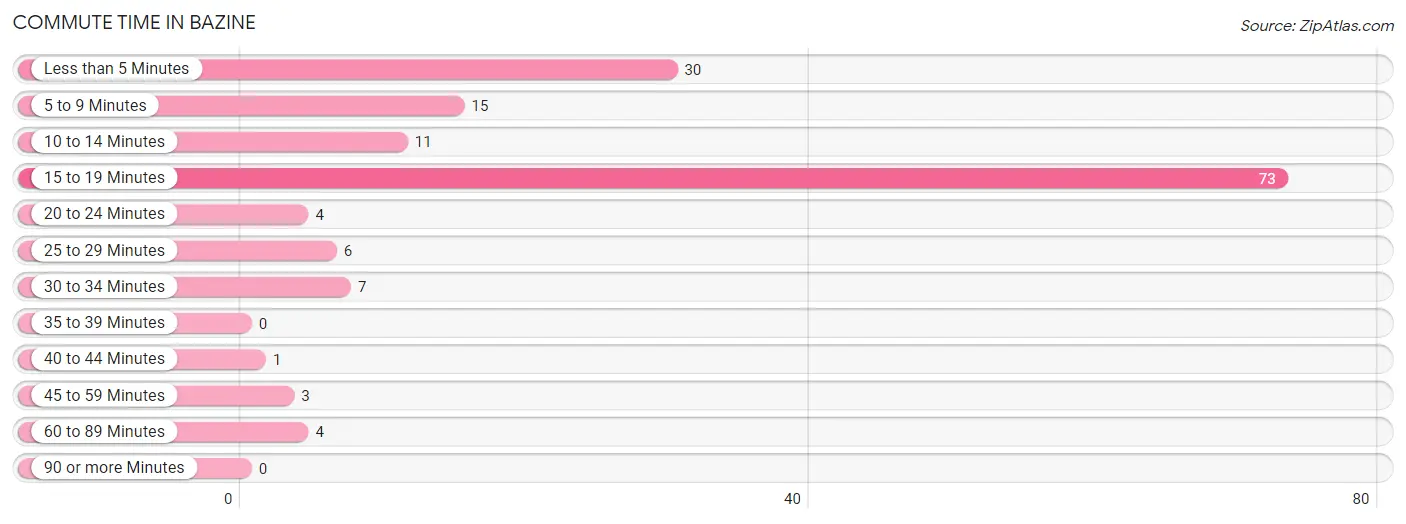
| Commute Time | # Commuters | % Commuters |
| Less than 5 Minutes | 30 | 19.5% |
| 5 to 9 Minutes | 15 | 9.7% |
| 10 to 14 Minutes | 11 | 7.1% |
| 15 to 19 Minutes | 73 | 47.4% |
| 20 to 24 Minutes | 4 | 2.6% |
| 25 to 29 Minutes | 6 | 3.9% |
| 30 to 34 Minutes | 7 | 4.5% |
| 35 to 39 Minutes | 0 | 0.0% |
| 40 to 44 Minutes | 1 | 0.6% |
| 45 to 59 Minutes | 3 | 1.9% |
| 60 to 89 Minutes | 4 | 2.6% |
| 90 or more Minutes | 0 | 0.0% |
Commute Time by Sex in Bazine
The most common commute times in Bazine are 15 to 19 minutes (66 commuters, 55.5%) for males and 15 to 19 minutes (7 commuters, 20.0%) for females.
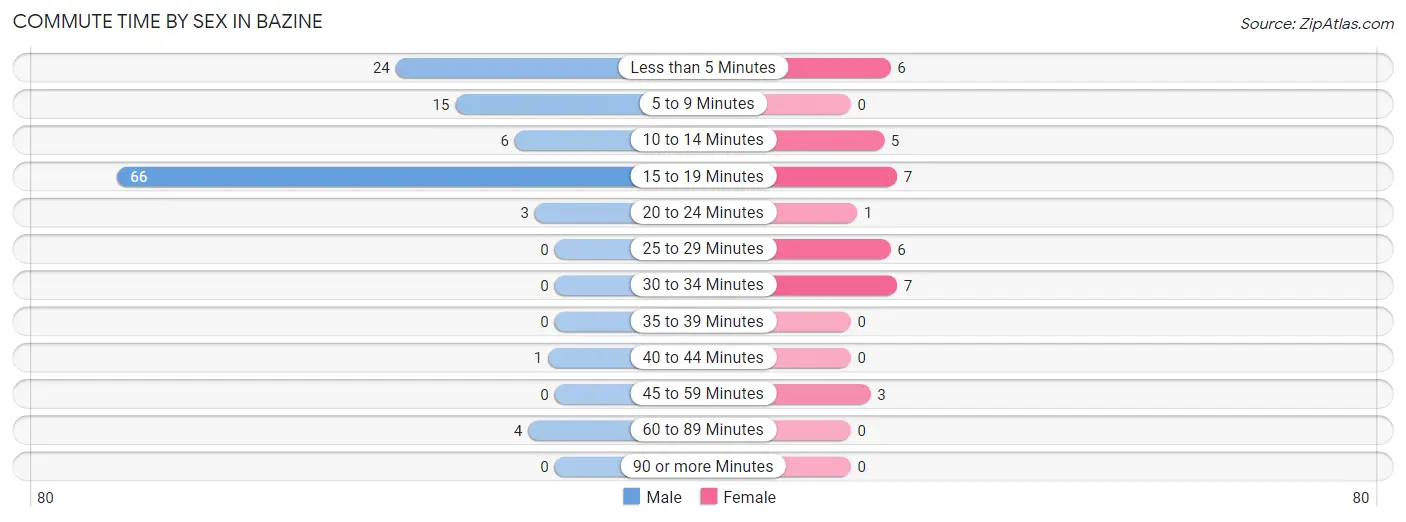
| Commute Time | Male | Female |
| Less than 5 Minutes | 24 (20.2%) | 6 (17.1%) |
| 5 to 9 Minutes | 15 (12.6%) | 0 (0.0%) |
| 10 to 14 Minutes | 6 (5.0%) | 5 (14.3%) |
| 15 to 19 Minutes | 66 (55.5%) | 7 (20.0%) |
| 20 to 24 Minutes | 3 (2.5%) | 1 (2.9%) |
| 25 to 29 Minutes | 0 (0.0%) | 6 (17.1%) |
| 30 to 34 Minutes | 0 (0.0%) | 7 (20.0%) |
| 35 to 39 Minutes | 0 (0.0%) | 0 (0.0%) |
| 40 to 44 Minutes | 1 (0.8%) | 0 (0.0%) |
| 45 to 59 Minutes | 0 (0.0%) | 3 (8.6%) |
| 60 to 89 Minutes | 4 (3.4%) | 0 (0.0%) |
| 90 or more Minutes | 0 (0.0%) | 0 (0.0%) |
Time of Departure to Work by Sex in Bazine
The most frequent times of departure to work in Bazine are 6:30 AM to 6:59 AM (70, 58.8%) for males and 7:00 AM to 7:29 AM (13, 37.1%) for females.
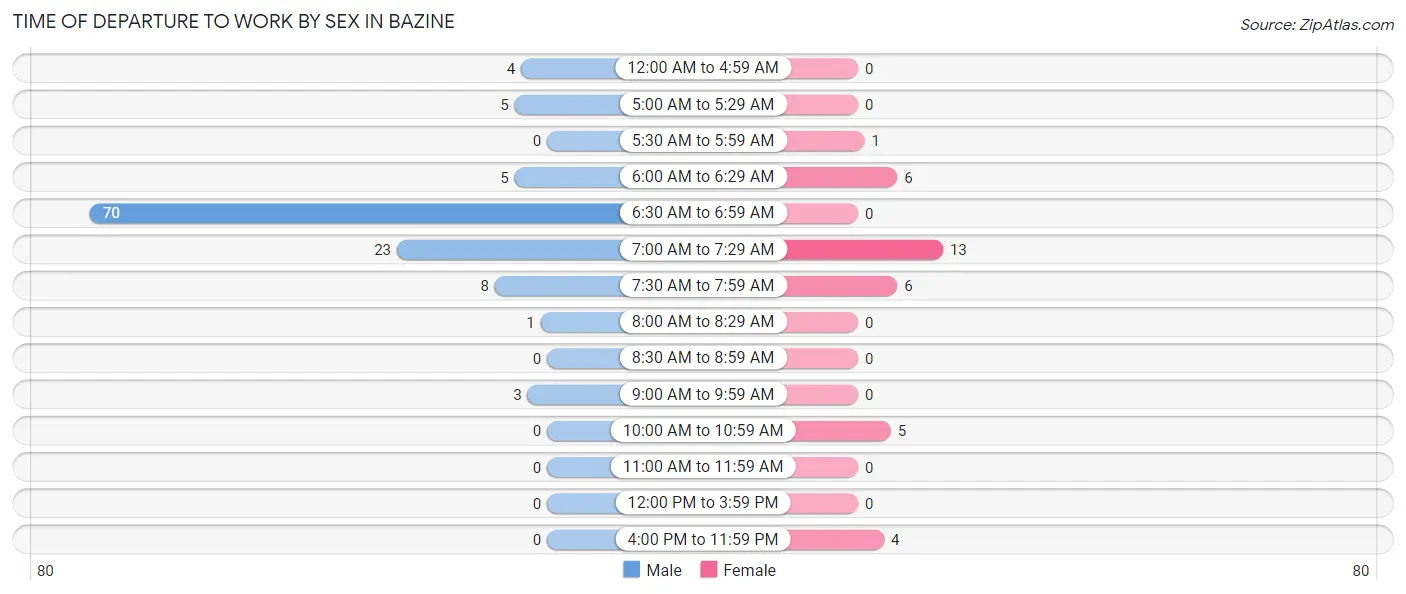
| Time of Departure | Male | Female |
| 12:00 AM to 4:59 AM | 4 (3.4%) | 0 (0.0%) |
| 5:00 AM to 5:29 AM | 5 (4.2%) | 0 (0.0%) |
| 5:30 AM to 5:59 AM | 0 (0.0%) | 1 (2.9%) |
| 6:00 AM to 6:29 AM | 5 (4.2%) | 6 (17.1%) |
| 6:30 AM to 6:59 AM | 70 (58.8%) | 0 (0.0%) |
| 7:00 AM to 7:29 AM | 23 (19.3%) | 13 (37.1%) |
| 7:30 AM to 7:59 AM | 8 (6.7%) | 6 (17.1%) |
| 8:00 AM to 8:29 AM | 1 (0.8%) | 0 (0.0%) |
| 8:30 AM to 8:59 AM | 0 (0.0%) | 0 (0.0%) |
| 9:00 AM to 9:59 AM | 3 (2.5%) | 0 (0.0%) |
| 10:00 AM to 10:59 AM | 0 (0.0%) | 5 (14.3%) |
| 11:00 AM to 11:59 AM | 0 (0.0%) | 0 (0.0%) |
| 12:00 PM to 3:59 PM | 0 (0.0%) | 0 (0.0%) |
| 4:00 PM to 11:59 PM | 0 (0.0%) | 4 (11.4%) |
| Total | 119 (100.0%) | 35 (100.0%) |
Housing Occupancy in Bazine
Occupancy by Ownership in Bazine
Of the total 161 dwellings in Bazine, owner-occupied units account for 112 (69.6%), while renter-occupied units make up 49 (30.4%).
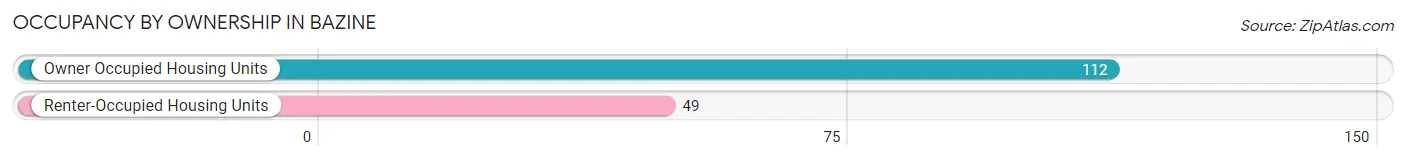
| Occupancy | # Housing Units | % Housing Units |
| Owner Occupied Housing Units | 112 | 69.6% |
| Renter-Occupied Housing Units | 49 | 30.4% |
| Total Occupied Housing Units | 161 | 100.0% |
Occupancy by Household Size in Bazine
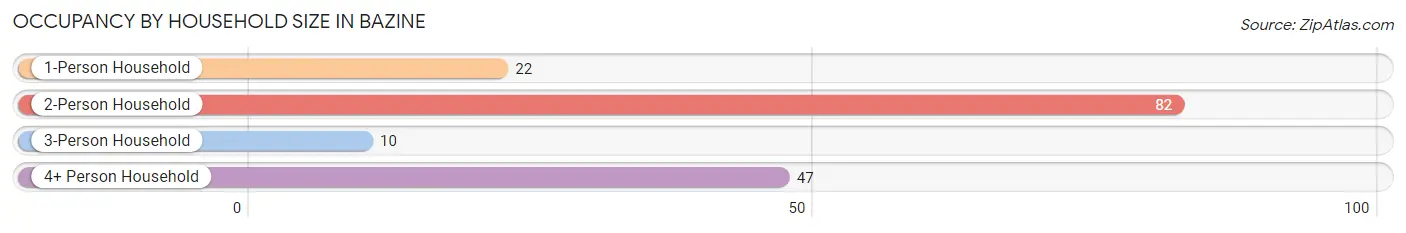
| Household Size | # Housing Units | % Housing Units |
| 1-Person Household | 22 | 13.7% |
| 2-Person Household | 82 | 50.9% |
| 3-Person Household | 10 | 6.2% |
| 4+ Person Household | 47 | 29.2% |
| Total Housing Units | 161 | 100.0% |
Occupancy by Ownership by Household Size in Bazine
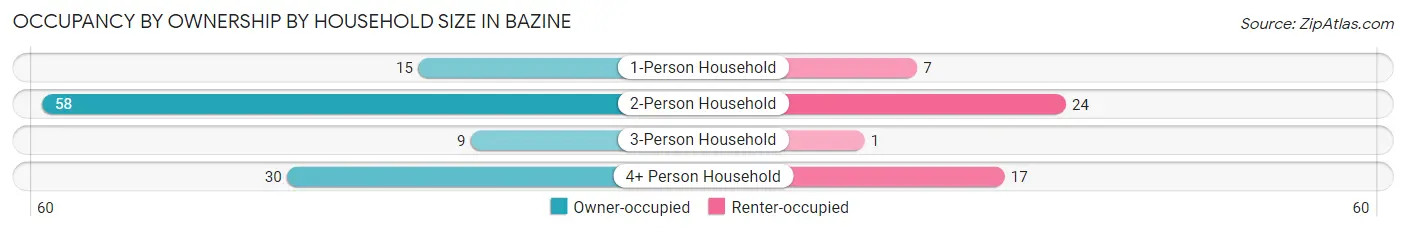
| Household Size | Owner-occupied | Renter-occupied |
| 1-Person Household | 15 (68.2%) | 7 (31.8%) |
| 2-Person Household | 58 (70.7%) | 24 (29.3%) |
| 3-Person Household | 9 (90.0%) | 1 (10.0%) |
| 4+ Person Household | 30 (63.8%) | 17 (36.2%) |
| Total Housing Units | 112 (69.6%) | 49 (30.4%) |
Occupancy by Educational Attainment in Bazine
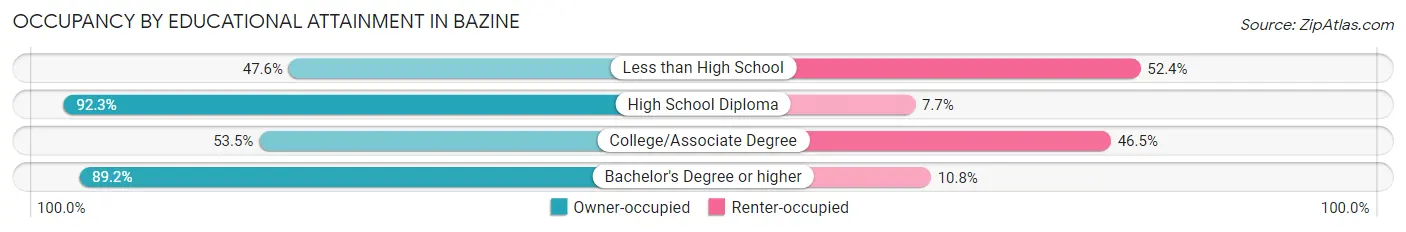
| Household Size | Owner-occupied | Renter-occupied |
| Less than High School | 20 (47.6%) | 22 (52.4%) |
| High School Diploma | 36 (92.3%) | 3 (7.7%) |
| College/Associate Degree | 23 (53.5%) | 20 (46.5%) |
| Bachelor's Degree or higher | 33 (89.2%) | 4 (10.8%) |
Occupancy by Age of Householder in Bazine
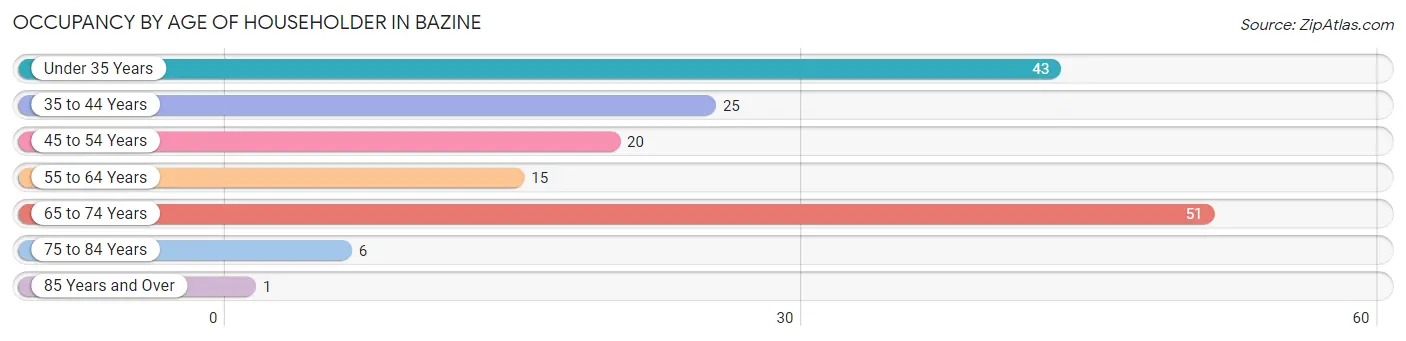
| Age Bracket | # Households | % Households |
| Under 35 Years | 43 | 26.7% |
| 35 to 44 Years | 25 | 15.5% |
| 45 to 54 Years | 20 | 12.4% |
| 55 to 64 Years | 15 | 9.3% |
| 65 to 74 Years | 51 | 31.7% |
| 75 to 84 Years | 6 | 3.7% |
| 85 Years and Over | 1 | 0.6% |
| Total | 161 | 100.0% |
Housing Finances in Bazine
Median Income by Occupancy in Bazine
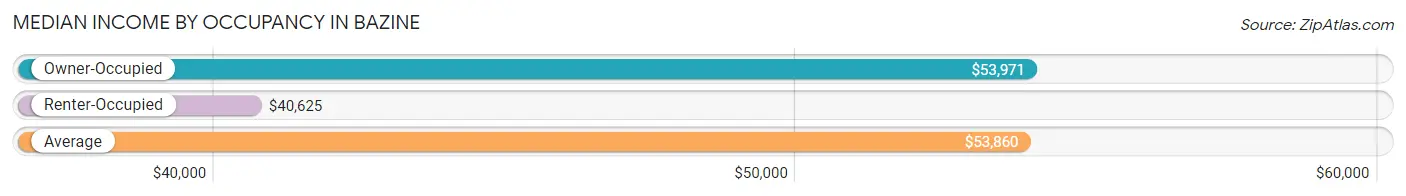
| Occupancy Type | # Households | Median Income |
| Owner-Occupied | 112 (69.6%) | $53,971 |
| Renter-Occupied | 49 (30.4%) | $40,625 |
| Average | 161 (100.0%) | $53,860 |
Occupancy by Householder Income Bracket in Bazine
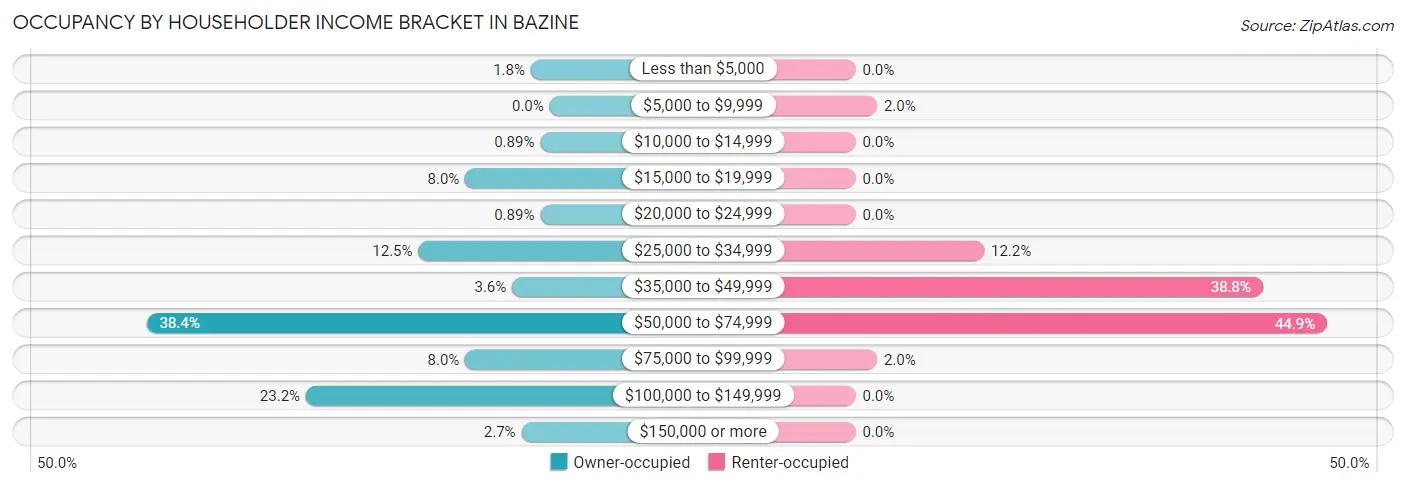
| Income Bracket | Owner-occupied | Renter-occupied |
| Less than $5,000 | 2 (1.8%) | 0 (0.0%) |
| $5,000 to $9,999 | 0 (0.0%) | 1 (2.0%) |
| $10,000 to $14,999 | 1 (0.9%) | 0 (0.0%) |
| $15,000 to $19,999 | 9 (8.0%) | 0 (0.0%) |
| $20,000 to $24,999 | 1 (0.9%) | 0 (0.0%) |
| $25,000 to $34,999 | 14 (12.5%) | 6 (12.2%) |
| $35,000 to $49,999 | 4 (3.6%) | 19 (38.8%) |
| $50,000 to $74,999 | 43 (38.4%) | 22 (44.9%) |
| $75,000 to $99,999 | 9 (8.0%) | 1 (2.0%) |
| $100,000 to $149,999 | 26 (23.2%) | 0 (0.0%) |
| $150,000 or more | 3 (2.7%) | 0 (0.0%) |
| Total | 112 (100.0%) | 49 (100.0%) |
Monthly Housing Cost Tiers in Bazine
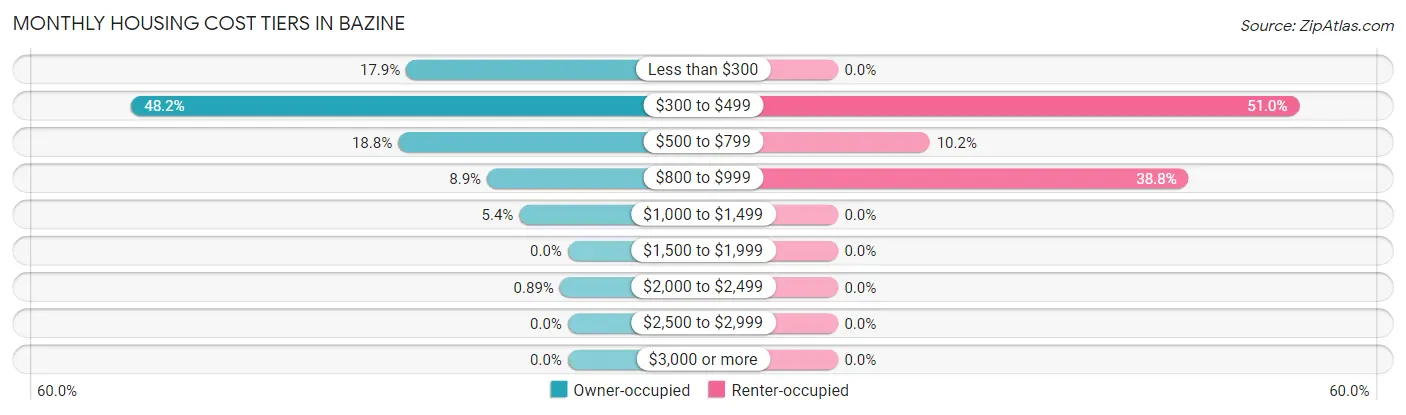
| Monthly Cost | Owner-occupied | Renter-occupied |
| Less than $300 | 20 (17.9%) | 0 (0.0%) |
| $300 to $499 | 54 (48.2%) | 25 (51.0%) |
| $500 to $799 | 21 (18.8%) | 5 (10.2%) |
| $800 to $999 | 10 (8.9%) | 19 (38.8%) |
| $1,000 to $1,499 | 6 (5.4%) | 0 (0.0%) |
| $1,500 to $1,999 | 0 (0.0%) | 0 (0.0%) |
| $2,000 to $2,499 | 1 (0.9%) | 0 (0.0%) |
| $2,500 to $2,999 | 0 (0.0%) | 0 (0.0%) |
| $3,000 or more | 0 (0.0%) | 0 (0.0%) |
| Total | 112 (100.0%) | 49 (100.0%) |
Physical Housing Characteristics in Bazine
Housing Structures in Bazine
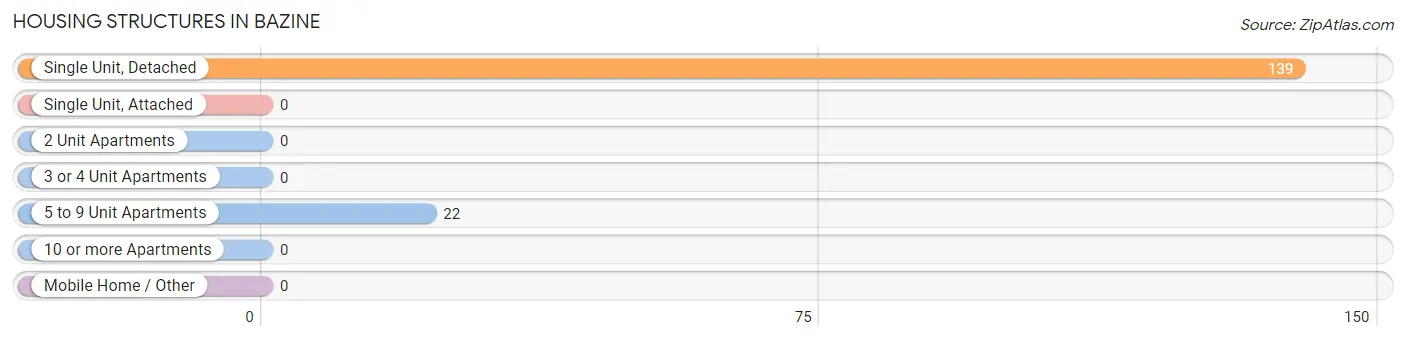
| Structure Type | # Housing Units | % Housing Units |
| Single Unit, Detached | 139 | 86.3% |
| Single Unit, Attached | 0 | 0.0% |
| 2 Unit Apartments | 0 | 0.0% |
| 3 or 4 Unit Apartments | 0 | 0.0% |
| 5 to 9 Unit Apartments | 22 | 13.7% |
| 10 or more Apartments | 0 | 0.0% |
| Mobile Home / Other | 0 | 0.0% |
| Total | 161 | 100.0% |
Housing Structures by Occupancy in Bazine
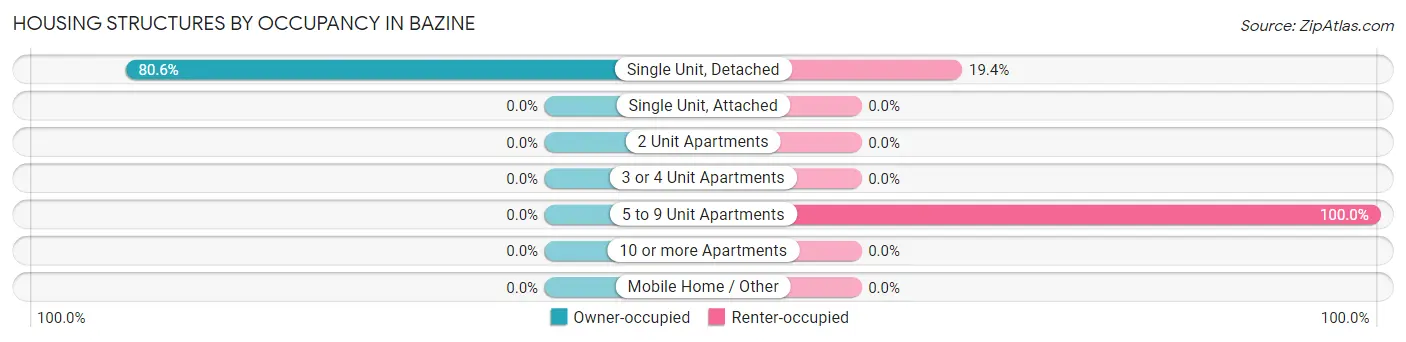
| Structure Type | Owner-occupied | Renter-occupied |
| Single Unit, Detached | 112 (80.6%) | 27 (19.4%) |
| Single Unit, Attached | 0 (0.0%) | 0 (0.0%) |
| 2 Unit Apartments | 0 (0.0%) | 0 (0.0%) |
| 3 or 4 Unit Apartments | 0 (0.0%) | 0 (0.0%) |
| 5 to 9 Unit Apartments | 0 (0.0%) | 22 (100.0%) |
| 10 or more Apartments | 0 (0.0%) | 0 (0.0%) |
| Mobile Home / Other | 0 (0.0%) | 0 (0.0%) |
| Total | 112 (69.6%) | 49 (30.4%) |
Housing Structures by Number of Rooms in Bazine
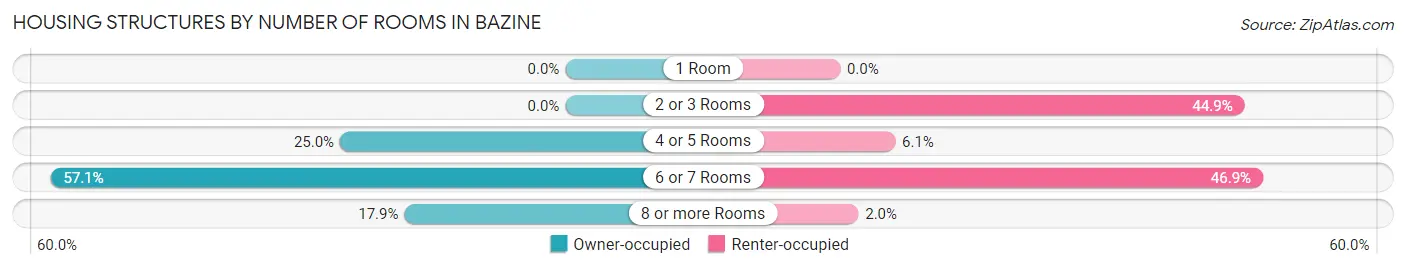
| Number of Rooms | Owner-occupied | Renter-occupied |
| 1 Room | 0 (0.0%) | 0 (0.0%) |
| 2 or 3 Rooms | 0 (0.0%) | 22 (44.9%) |
| 4 or 5 Rooms | 28 (25.0%) | 3 (6.1%) |
| 6 or 7 Rooms | 64 (57.1%) | 23 (46.9%) |
| 8 or more Rooms | 20 (17.9%) | 1 (2.0%) |
| Total | 112 (100.0%) | 49 (100.0%) |
Housing Structure by Heating Type in Bazine
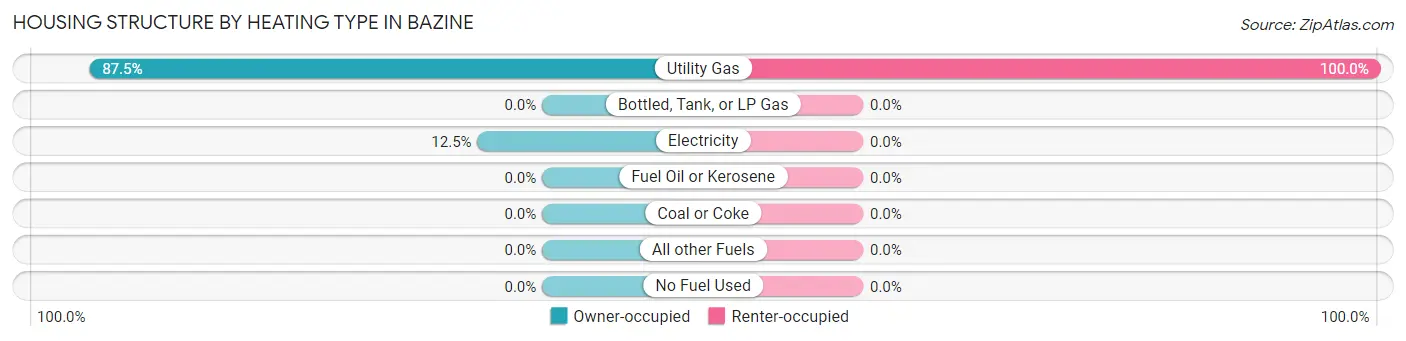
| Heating Type | Owner-occupied | Renter-occupied |
| Utility Gas | 98 (87.5%) | 49 (100.0%) |
| Bottled, Tank, or LP Gas | 0 (0.0%) | 0 (0.0%) |
| Electricity | 14 (12.5%) | 0 (0.0%) |
| Fuel Oil or Kerosene | 0 (0.0%) | 0 (0.0%) |
| Coal or Coke | 0 (0.0%) | 0 (0.0%) |
| All other Fuels | 0 (0.0%) | 0 (0.0%) |
| No Fuel Used | 0 (0.0%) | 0 (0.0%) |
| Total | 112 (100.0%) | 49 (100.0%) |
Household Vehicle Usage in Bazine
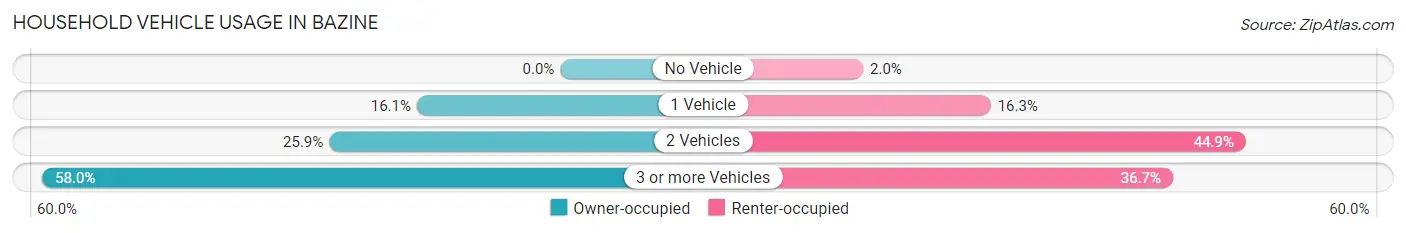
| Vehicles per Household | Owner-occupied | Renter-occupied |
| No Vehicle | 0 (0.0%) | 1 (2.0%) |
| 1 Vehicle | 18 (16.1%) | 8 (16.3%) |
| 2 Vehicles | 29 (25.9%) | 22 (44.9%) |
| 3 or more Vehicles | 65 (58.0%) | 18 (36.7%) |
| Total | 112 (100.0%) | 49 (100.0%) |
Real Estate & Mortgages in Bazine
Real Estate and Mortgage Overview in Bazine
| Characteristic | Without Mortgage | With Mortgage |
| Housing Units | 92 | 20 |
| Median Property Value | $50,000 | $55,000 |
| Median Household Income | $53,456 | $2 |
| Monthly Housing Costs | $436 | $0 |
| Real Estate Taxes | $1,357 | $0 |
Property Value by Mortgage Status in Bazine
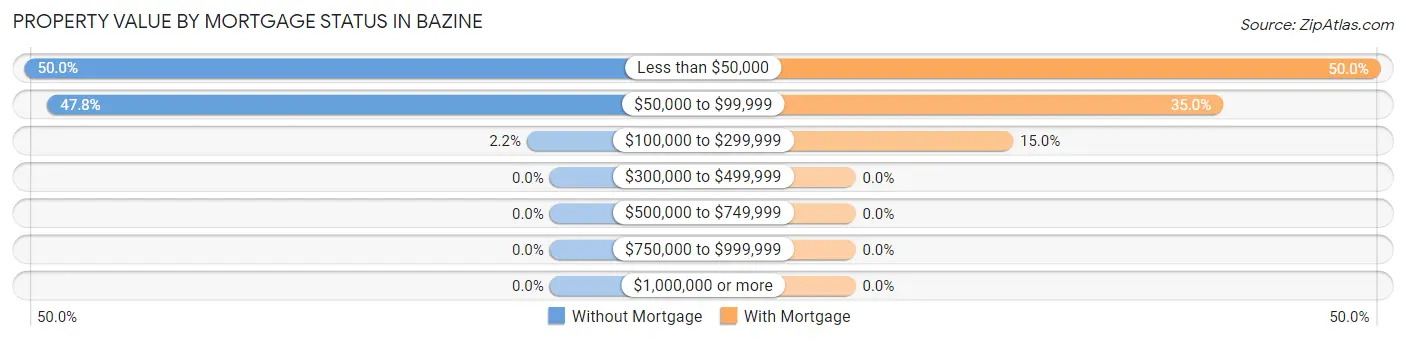
| Property Value | Without Mortgage | With Mortgage |
| Less than $50,000 | 46 (50.0%) | 10 (50.0%) |
| $50,000 to $99,999 | 44 (47.8%) | 7 (35.0%) |
| $100,000 to $299,999 | 2 (2.2%) | 3 (15.0%) |
| $300,000 to $499,999 | 0 (0.0%) | 0 (0.0%) |
| $500,000 to $749,999 | 0 (0.0%) | 0 (0.0%) |
| $750,000 to $999,999 | 0 (0.0%) | 0 (0.0%) |
| $1,000,000 or more | 0 (0.0%) | 0 (0.0%) |
| Total | 92 (100.0%) | 20 (100.0%) |
Household Income by Mortgage Status in Bazine
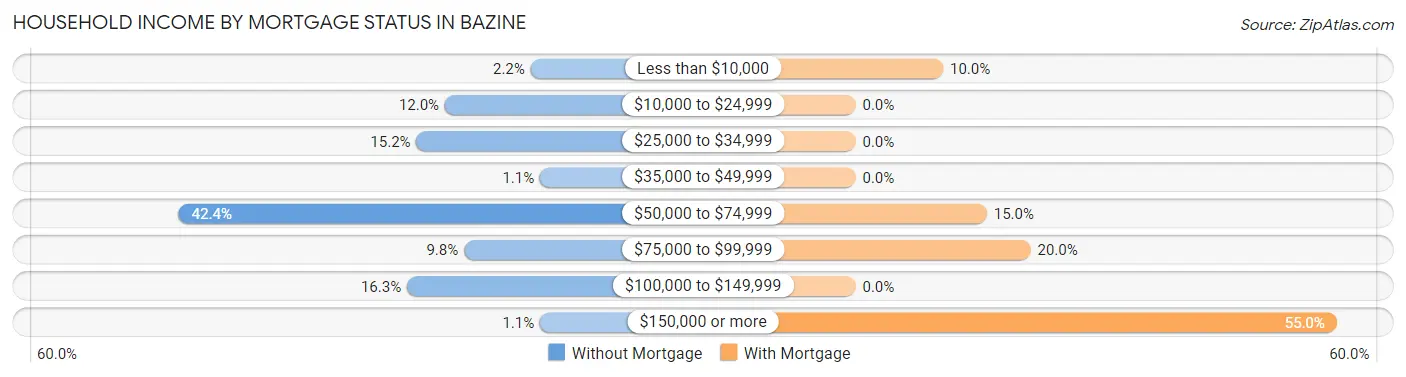
| Household Income | Without Mortgage | With Mortgage |
| Less than $10,000 | 2 (2.2%) | 2 (10.0%) |
| $10,000 to $24,999 | 11 (12.0%) | 0 (0.0%) |
| $25,000 to $34,999 | 14 (15.2%) | 0 (0.0%) |
| $35,000 to $49,999 | 1 (1.1%) | 0 (0.0%) |
| $50,000 to $74,999 | 39 (42.4%) | 3 (15.0%) |
| $75,000 to $99,999 | 9 (9.8%) | 4 (20.0%) |
| $100,000 to $149,999 | 15 (16.3%) | 0 (0.0%) |
| $150,000 or more | 1 (1.1%) | 11 (55.0%) |
| Total | 92 (100.0%) | 20 (100.0%) |
Property Value to Household Income Ratio in Bazine
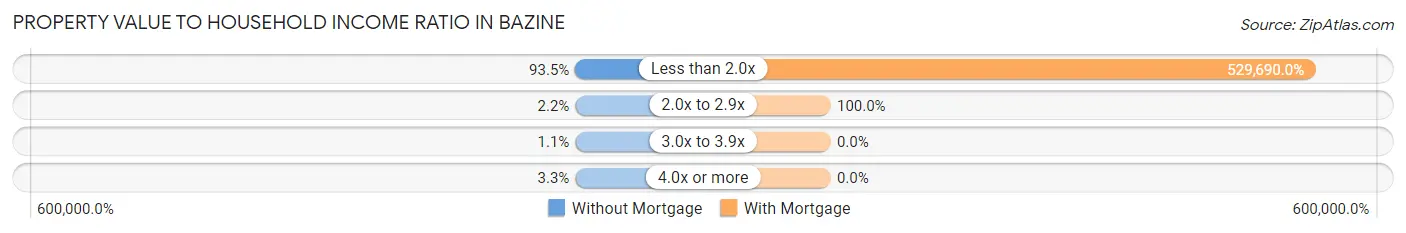
| Value-to-Income Ratio | Without Mortgage | With Mortgage |
| Less than 2.0x | 86 (93.5%) | 105,938 (529,690.0%) |
| 2.0x to 2.9x | 2 (2.2%) | 20 (100.0%) |
| 3.0x to 3.9x | 1 (1.1%) | 0 (0.0%) |
| 4.0x or more | 3 (3.3%) | 0 (0.0%) |
| Total | 92 (100.0%) | 20 (100.0%) |
Real Estate Taxes by Mortgage Status in Bazine
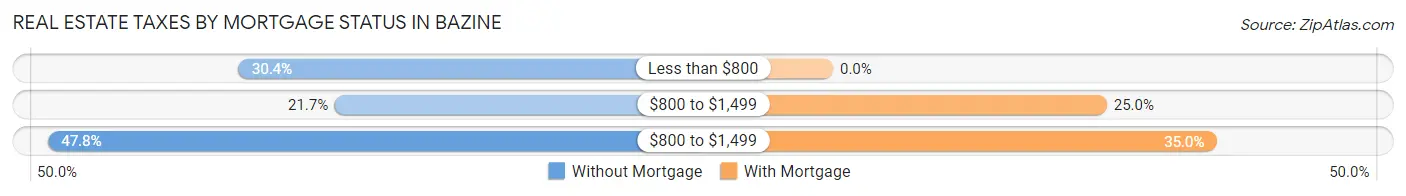
| Property Taxes | Without Mortgage | With Mortgage |
| Less than $800 | 28 (30.4%) | 0 (0.0%) |
| $800 to $1,499 | 20 (21.7%) | 5 (25.0%) |
| $800 to $1,499 | 44 (47.8%) | 7 (35.0%) |
| Total | 92 (100.0%) | 20 (100.0%) |
Health & Disability in Bazine
Health Insurance Coverage by Age in Bazine
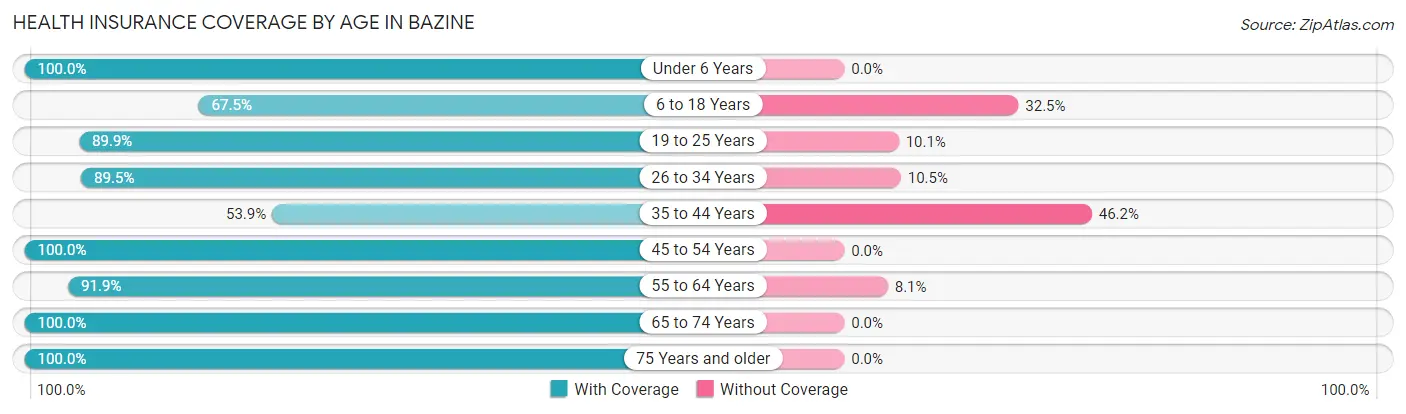
| Age Bracket | With Coverage | Without Coverage |
| Under 6 Years | 36 (100.0%) | 0 (0.0%) |
| 6 to 18 Years | 77 (67.5%) | 37 (32.5%) |
| 19 to 25 Years | 62 (89.9%) | 7 (10.1%) |
| 26 to 34 Years | 34 (89.5%) | 4 (10.5%) |
| 35 to 44 Years | 21 (53.8%) | 18 (46.2%) |
| 45 to 54 Years | 20 (100.0%) | 0 (0.0%) |
| 55 to 64 Years | 34 (91.9%) | 3 (8.1%) |
| 65 to 74 Years | 67 (100.0%) | 0 (0.0%) |
| 75 Years and older | 18 (100.0%) | 0 (0.0%) |
| Total | 369 (84.3%) | 69 (15.8%) |
Health Insurance Coverage by Citizenship Status in Bazine
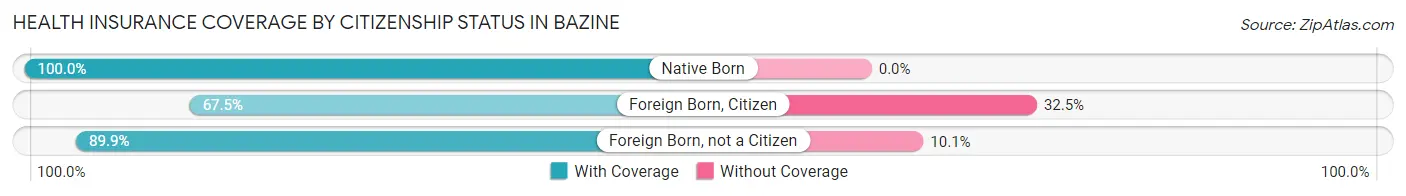
| Citizenship Status | With Coverage | Without Coverage |
| Native Born | 36 (100.0%) | 0 (0.0%) |
| Foreign Born, Citizen | 77 (67.5%) | 37 (32.5%) |
| Foreign Born, not a Citizen | 62 (89.9%) | 7 (10.1%) |
Health Insurance Coverage by Household Income in Bazine
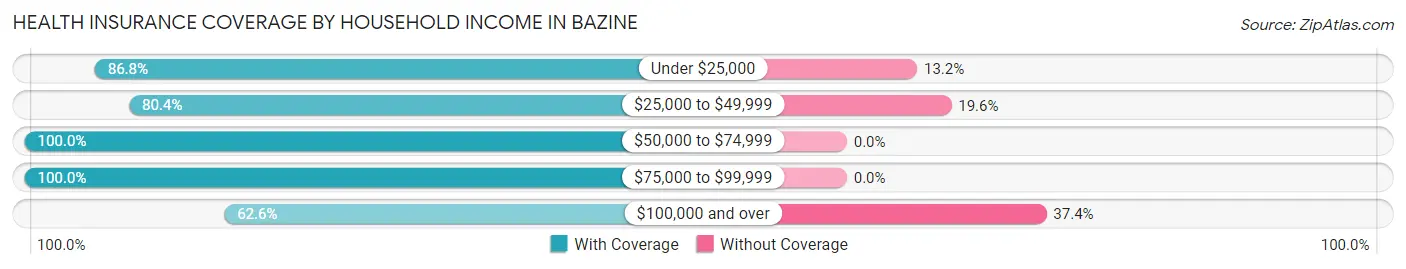
| Household Income | With Coverage | Without Coverage |
| Under $25,000 | 33 (86.8%) | 5 (13.2%) |
| $25,000 to $49,999 | 74 (80.4%) | 18 (19.6%) |
| $50,000 to $74,999 | 154 (100.0%) | 0 (0.0%) |
| $75,000 to $99,999 | 31 (100.0%) | 0 (0.0%) |
| $100,000 and over | 77 (62.6%) | 46 (37.4%) |
Public vs Private Health Insurance Coverage by Age in Bazine
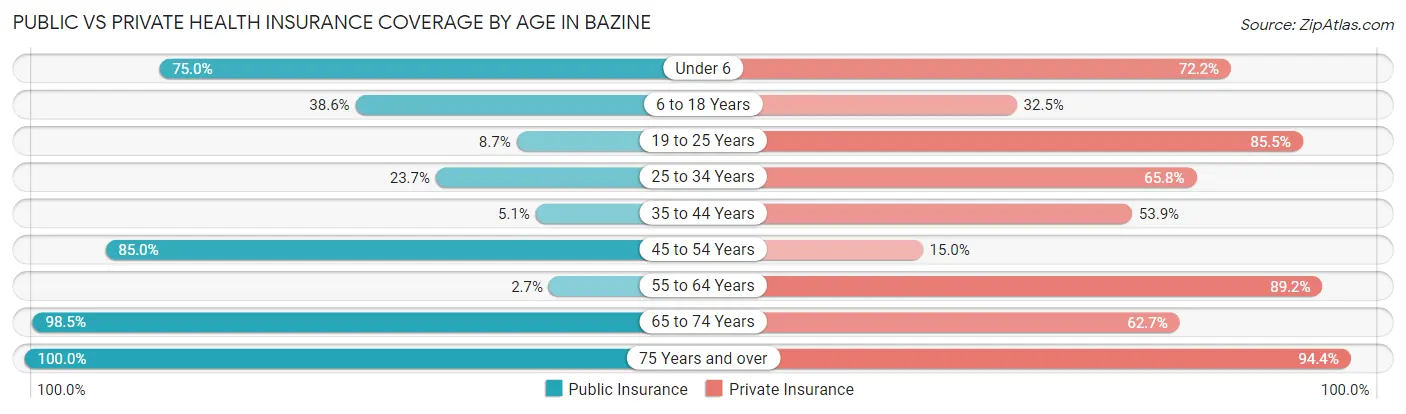
| Age Bracket | Public Insurance | Private Insurance |
| Under 6 | 27 (75.0%) | 26 (72.2%) |
| 6 to 18 Years | 44 (38.6%) | 37 (32.5%) |
| 19 to 25 Years | 6 (8.7%) | 59 (85.5%) |
| 25 to 34 Years | 9 (23.7%) | 25 (65.8%) |
| 35 to 44 Years | 2 (5.1%) | 21 (53.8%) |
| 45 to 54 Years | 17 (85.0%) | 3 (15.0%) |
| 55 to 64 Years | 1 (2.7%) | 33 (89.2%) |
| 65 to 74 Years | 66 (98.5%) | 42 (62.7%) |
| 75 Years and over | 18 (100.0%) | 17 (94.4%) |
| Total | 190 (43.4%) | 263 (60.1%) |
Disability Status by Sex by Age in Bazine
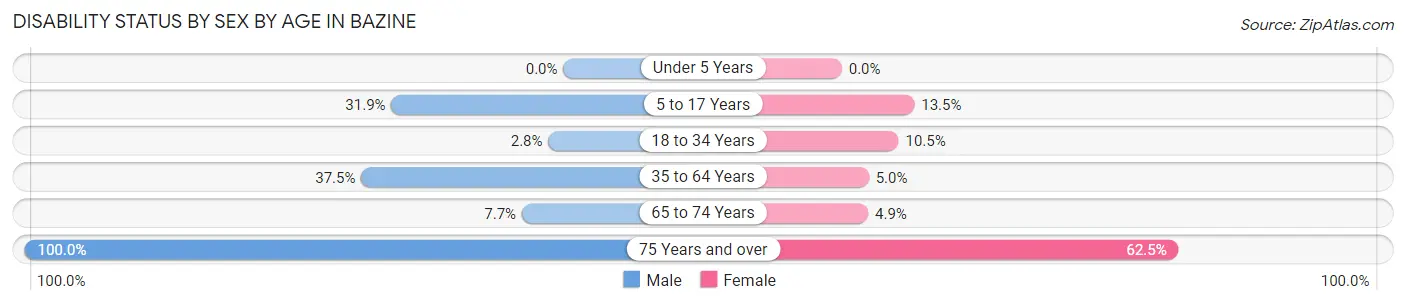
| Age Bracket | Male | Female |
| Under 5 Years | 0 (0.0%) | 0 (0.0%) |
| 5 to 17 Years | 15 (31.9%) | 7 (13.5%) |
| 18 to 34 Years | 2 (2.8%) | 6 (10.5%) |
| 35 to 64 Years | 21 (37.5%) | 2 (5.0%) |
| 65 to 74 Years | 2 (7.7%) | 2 (4.9%) |
| 75 Years and over | 10 (100.0%) | 5 (62.5%) |
Disability Class by Sex by Age in Bazine
Disability Class: Hearing Difficulty
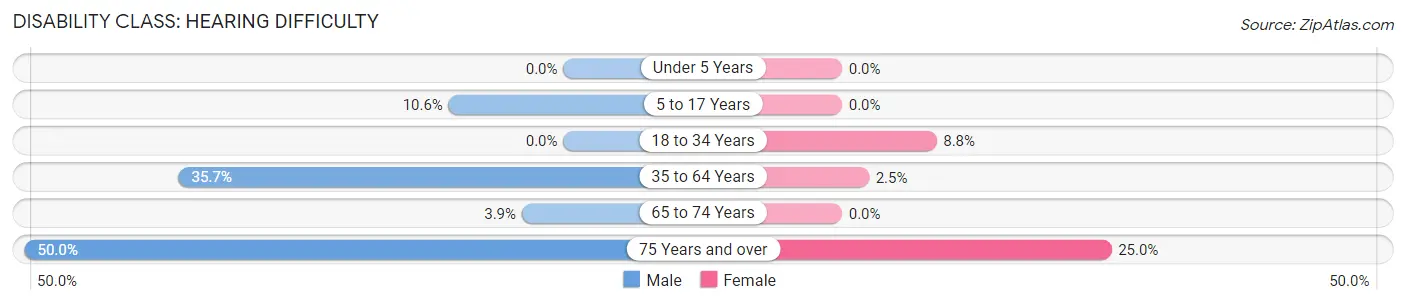
| Age Bracket | Male | Female |
| Under 5 Years | 0 (0.0%) | 0 (0.0%) |
| 5 to 17 Years | 5 (10.6%) | 0 (0.0%) |
| 18 to 34 Years | 0 (0.0%) | 5 (8.8%) |
| 35 to 64 Years | 20 (35.7%) | 1 (2.5%) |
| 65 to 74 Years | 1 (3.8%) | 0 (0.0%) |
| 75 Years and over | 5 (50.0%) | 2 (25.0%) |
Disability Class: Vision Difficulty
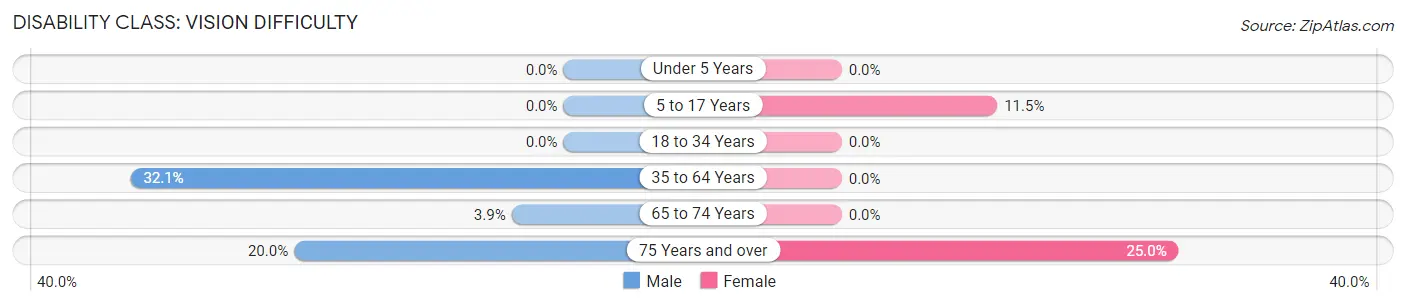
| Age Bracket | Male | Female |
| Under 5 Years | 0 (0.0%) | 0 (0.0%) |
| 5 to 17 Years | 0 (0.0%) | 6 (11.5%) |
| 18 to 34 Years | 0 (0.0%) | 0 (0.0%) |
| 35 to 64 Years | 18 (32.1%) | 0 (0.0%) |
| 65 to 74 Years | 1 (3.8%) | 0 (0.0%) |
| 75 Years and over | 2 (20.0%) | 2 (25.0%) |
Disability Class: Cognitive Difficulty
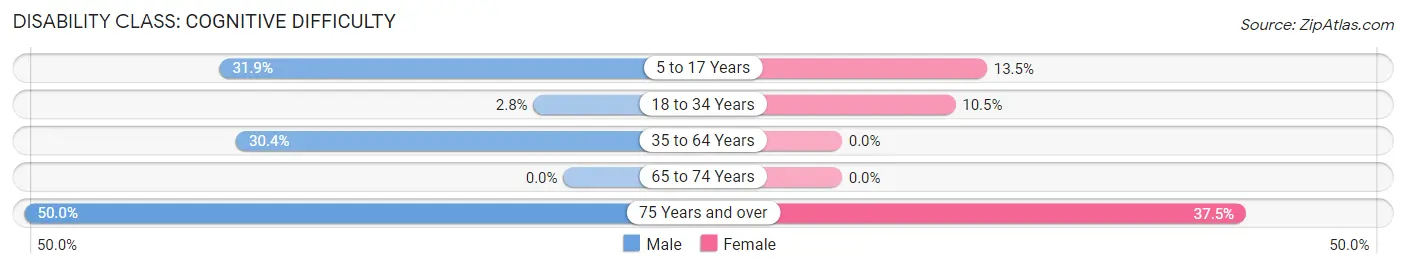
| Age Bracket | Male | Female |
| 5 to 17 Years | 15 (31.9%) | 7 (13.5%) |
| 18 to 34 Years | 2 (2.8%) | 6 (10.5%) |
| 35 to 64 Years | 17 (30.4%) | 0 (0.0%) |
| 65 to 74 Years | 0 (0.0%) | 0 (0.0%) |
| 75 Years and over | 5 (50.0%) | 3 (37.5%) |
Disability Class: Ambulatory Difficulty
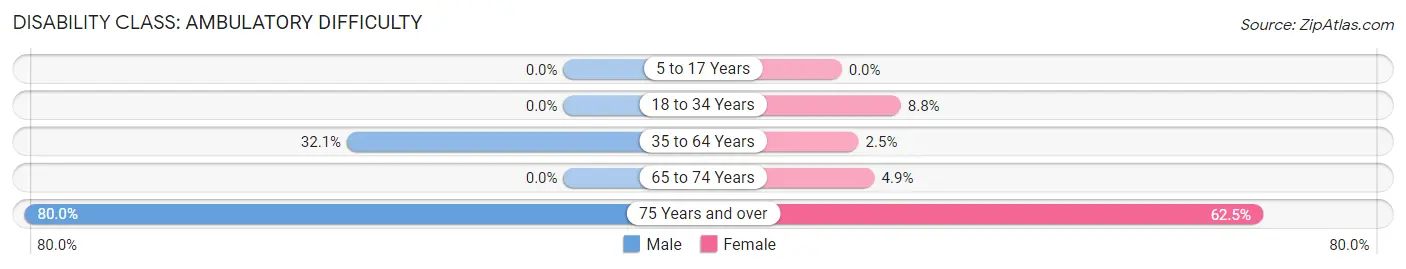
| Age Bracket | Male | Female |
| 5 to 17 Years | 0 (0.0%) | 0 (0.0%) |
| 18 to 34 Years | 0 (0.0%) | 5 (8.8%) |
| 35 to 64 Years | 18 (32.1%) | 1 (2.5%) |
| 65 to 74 Years | 0 (0.0%) | 2 (4.9%) |
| 75 Years and over | 8 (80.0%) | 5 (62.5%) |
Disability Class: Self-Care Difficulty
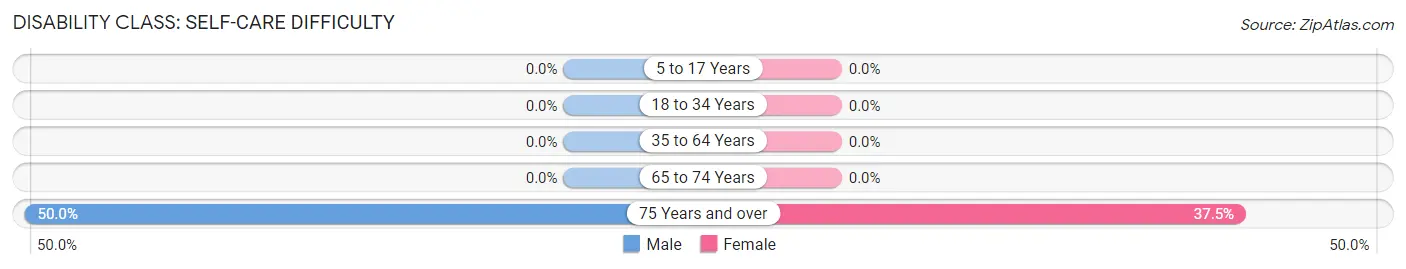
| Age Bracket | Male | Female |
| 5 to 17 Years | 0 (0.0%) | 0 (0.0%) |
| 18 to 34 Years | 0 (0.0%) | 0 (0.0%) |
| 35 to 64 Years | 0 (0.0%) | 0 (0.0%) |
| 65 to 74 Years | 0 (0.0%) | 0 (0.0%) |
| 75 Years and over | 5 (50.0%) | 3 (37.5%) |
Technology Access in Bazine
Computing Device Access in Bazine
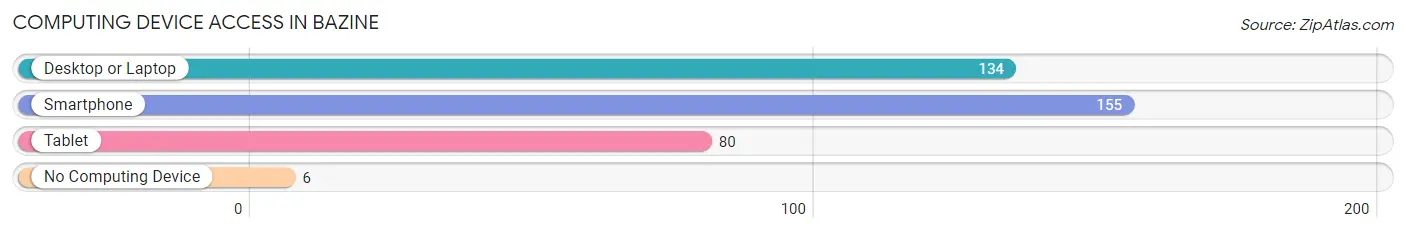
| Device Type | # Households | % Households |
| Desktop or Laptop | 134 | 83.2% |
| Smartphone | 155 | 96.3% |
| Tablet | 80 | 49.7% |
| No Computing Device | 6 | 3.7% |
| Total | 161 | 100.0% |
Internet Access in Bazine
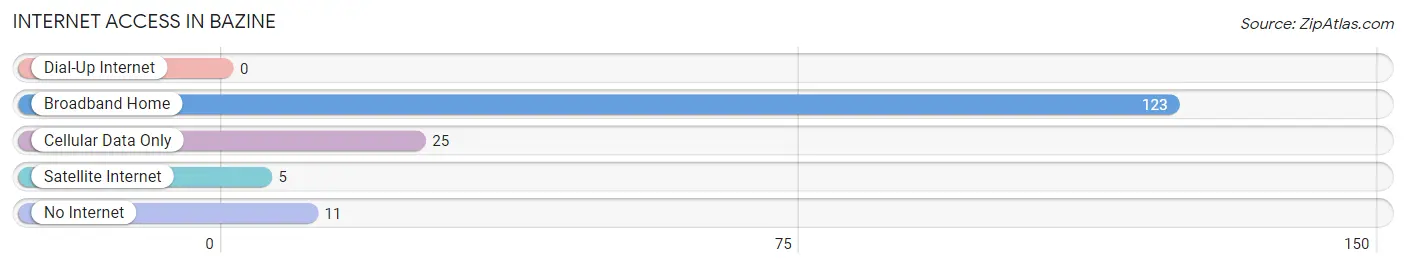
| Internet Type | # Households | % Households |
| Dial-Up Internet | 0 | 0.0% |
| Broadband Home | 123 | 76.4% |
| Cellular Data Only | 25 | 15.5% |
| Satellite Internet | 5 | 3.1% |
| No Internet | 11 | 6.8% |
| Total | 161 | 100.0% |
Bazine Summary
Bazine is a small town located in Ness County, Kansas, United States. The population was estimated to be around 200 people in 2020. The town was founded in 1885 and is named after a nearby creek.
Geography
Bazine is located at 38°45'25" North, 99°45'25" West (38.756944, -99.756944). It is situated at an elevation of 2,717 feet (828 m).
Bazine is located in the High Plains region of Kansas. The town is surrounded by rolling hills and grasslands. The nearest major city is Garden City, which is about 50 miles (80 km) to the south.
Climate
Bazine has a semi-arid climate, with hot summers and cold winters. The average annual temperature is 54°F (12°C). The average annual precipitation is 20 inches (508 mm).
Demographics
As of the 2010 census, there were 199 people living in Bazine. The racial makeup of the town was 97.5% White, 0.5% African American, 0.5% Native American, 0.5% Asian, and 1.0% from two or more races.
Economy
The economy of Bazine is largely based on agriculture. The town is home to several farms and ranches, which produce wheat, corn, and other crops. The town also has a few small businesses, including a gas station, a grocery store, and a restaurant.
History
Bazine was founded in 1885 by a group of settlers from Germany. The town was named after a nearby creek. The first post office was established in 1887.
In the early 1900s, Bazine was a thriving agricultural community. The town had a bank, a hotel, a blacksmith shop, and several other businesses.
In the 1950s, the town began to decline as many of its residents moved away in search of better economic opportunities. By the 1970s, the population had dropped to just over 100 people.
In recent years, Bazine has seen a resurgence in population as people have moved back to the area. The town now has a population of around 200 people.
Conclusion
Bazine is a small town located in Ness County, Kansas. The town was founded in 1885 and is named after a nearby creek. Bazine has a semi-arid climate, with hot summers and cold winters. The economy of Bazine is largely based on agriculture. The town has a population of around 200 people. Bazine has seen a resurgence in population in recent years as people have moved back to the area.
Common Questions
What is Per Capita Income in Bazine?
Per Capita income in Bazine is $24,204.
What is the Median Family Income in Bazine?
Median Family Income in Bazine is $54,485.
What is the Median Household income in Bazine?
Median Household Income in Bazine is $53,860.
What is Income or Wage Gap in Bazine?
Income or Wage Gap in Bazine is 87.5%.
Women in Bazine earn 12.5 cents for every dollar earned by a man.
What is Inequality or Gini Index in Bazine?
Inequality or Gini Index in Bazine is 0.29.
What is the Total Population of Bazine?
Total Population of Bazine is 438.
What is the Total Male Population of Bazine?
Total Male Population of Bazine is 218.
What is the Total Female Population of Bazine?
Total Female Population of Bazine is 220.
What is the Ratio of Males per 100 Females in Bazine?
There are 99.09 Males per 100 Females in Bazine.
What is the Ratio of Females per 100 Males in Bazine?
There are 100.92 Females per 100 Males in Bazine.
What is the Median Population Age in Bazine?
Median Population Age in Bazine is 25.5 Years.
What is the Average Family Size in Bazine
Average Family Size in Bazine is 3.0 People.
What is the Average Household Size in Bazine
Average Household Size in Bazine is 2.7 People.
How Large is the Labor Force in Bazine?
There are 166 People in the Labor Forcein in Bazine.
What is the Percentage of People in the Labor Force in Bazine?
50.3% of People are in the Labor Force in Bazine.
What is the Unemployment Rate in Bazine?
Unemployment Rate in Bazine is 1.8%.