Baxter Springs, KS Map & Demographics
Baxter Springs Map
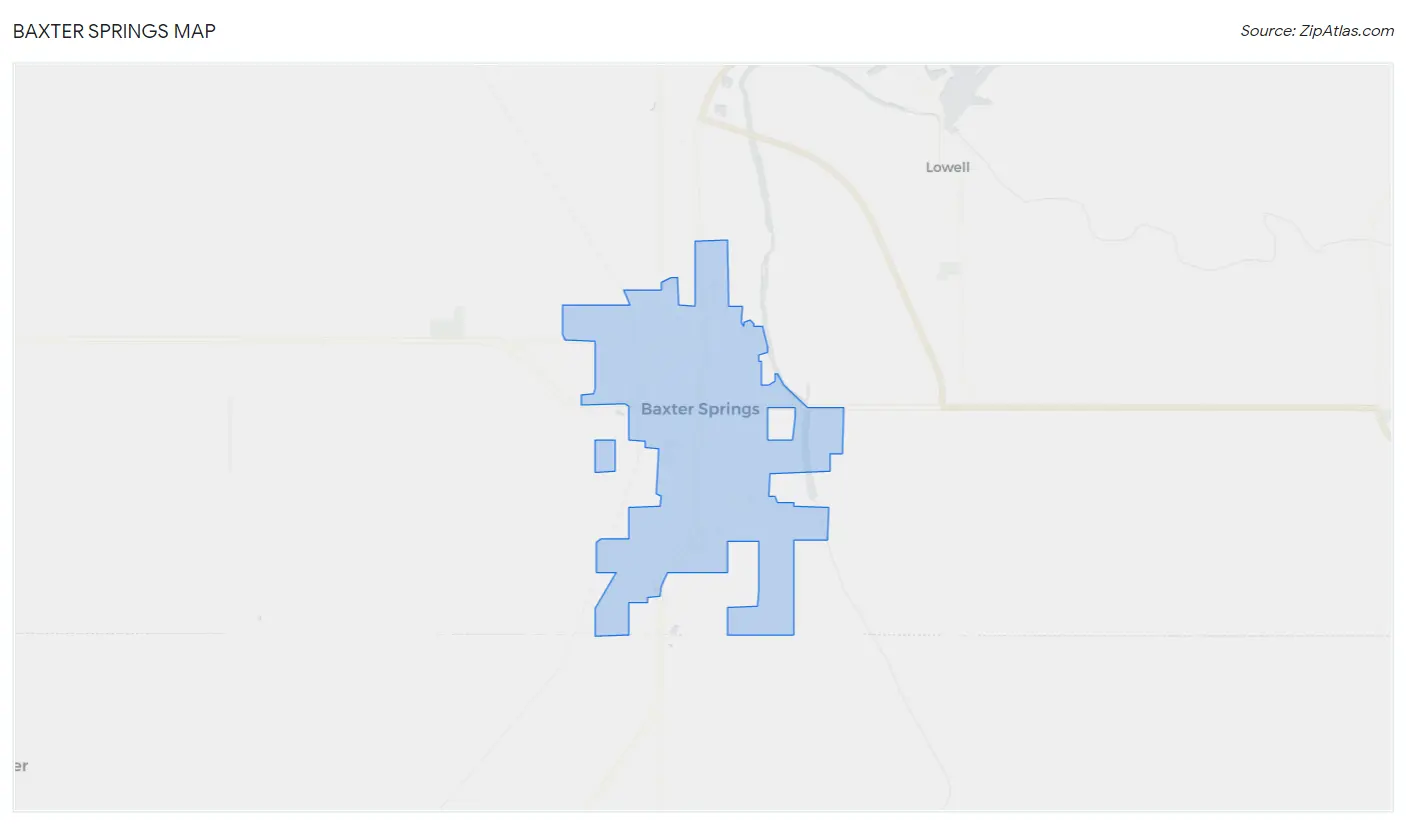
Baxter Springs Overview
$23,249
PER CAPITA INCOME
$60,139
AVG FAMILY INCOME
$47,727
AVG HOUSEHOLD INCOME
2.0%
WAGE / INCOME GAP [ % ]
98.0¢/ $1
WAGE / INCOME GAP [ $ ]
0.42
INEQUALITY / GINI INDEX
3,901
TOTAL POPULATION
1,922
MALE POPULATION
1,979
FEMALE POPULATION
97.12
MALES / 100 FEMALES
102.97
FEMALES / 100 MALES
37.5
MEDIAN AGE
3.4
AVG FAMILY SIZE
2.7
AVG HOUSEHOLD SIZE
1,897
LABOR FORCE [ PEOPLE ]
63.8%
PERCENT IN LABOR FORCE
2.7%
UNEMPLOYMENT RATE
Baxter Springs Zip Codes
Baxter Springs Area Codes
Income in Baxter Springs
Income Overview in Baxter Springs
Per Capita Income in Baxter Springs is $23,249, while median incomes of families and households are $60,139 and $47,727 respectively.
| Characteristic | Number | Measure |
| Per Capita Income | 3,901 | $23,249 |
| Median Family Income | 917 | $60,139 |
| Mean Family Income | 917 | $71,830 |
| Median Household Income | 1,450 | $47,727 |
| Mean Household Income | 1,450 | $57,748 |
| Income Deficit | 917 | $0 |
| Wage / Income Gap (%) | 3,901 | 1.99% |
| Wage / Income Gap ($) | 3,901 | 98.01¢ per $1 |
| Gini / Inequality Index | 3,901 | 0.42 |
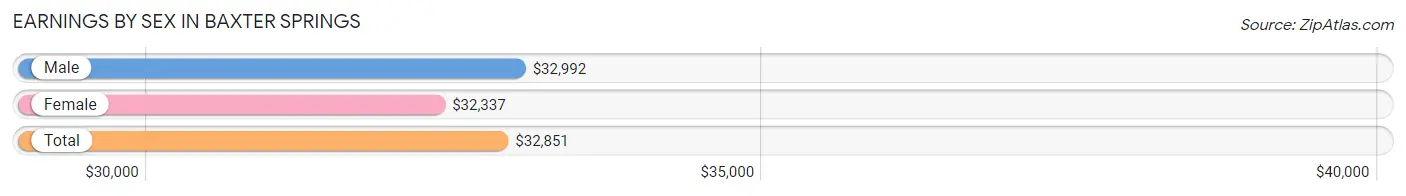
Earnings by Sex in Baxter Springs
Average Earnings in Baxter Springs are $32,851, $32,992 for men and $32,337 for women, a difference of 2.0%.
| Sex | Number | Average Earnings |
| Male | 970 (47.9%) | $32,992 |
| Female | 1,055 (52.1%) | $32,337 |
| Total | 2,025 (100.0%) | $32,851 |
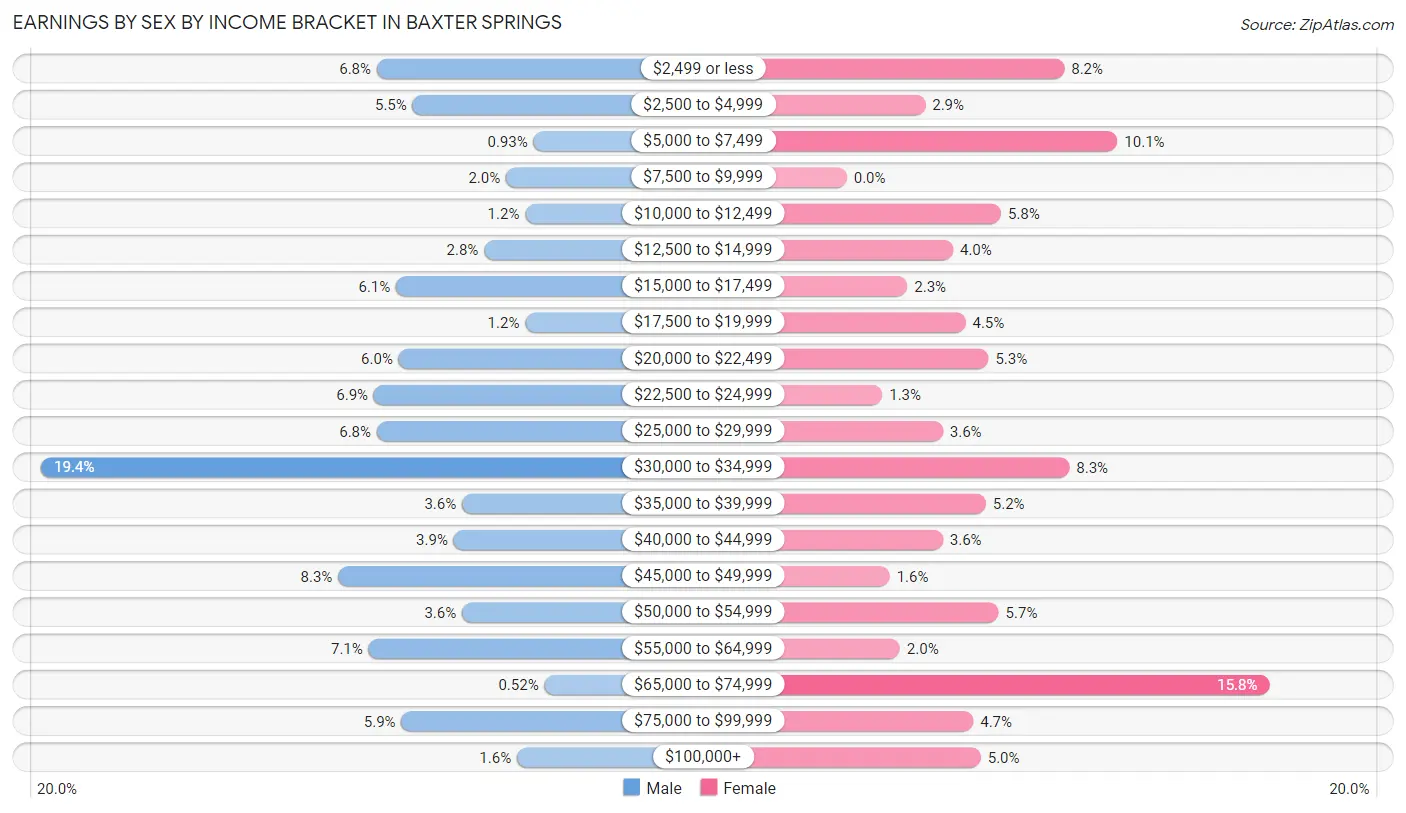
Earnings by Sex by Income Bracket in Baxter Springs
The most common earnings brackets in Baxter Springs are $30,000 to $34,999 for men (188 | 19.4%) and $65,000 to $74,999 for women (167 | 15.8%).
| Income | Male | Female |
| $2,499 or less | 66 (6.8%) | 86 (8.2%) |
| $2,500 to $4,999 | 53 (5.5%) | 31 (2.9%) |
| $5,000 to $7,499 | 9 (0.9%) | 107 (10.1%) |
| $7,500 to $9,999 | 19 (2.0%) | 0 (0.0%) |
| $10,000 to $12,499 | 12 (1.2%) | 61 (5.8%) |
| $12,500 to $14,999 | 27 (2.8%) | 42 (4.0%) |
| $15,000 to $17,499 | 59 (6.1%) | 24 (2.3%) |
| $17,500 to $19,999 | 12 (1.2%) | 47 (4.4%) |
| $20,000 to $22,499 | 58 (6.0%) | 56 (5.3%) |
| $22,500 to $24,999 | 67 (6.9%) | 14 (1.3%) |
| $25,000 to $29,999 | 66 (6.8%) | 38 (3.6%) |
| $30,000 to $34,999 | 188 (19.4%) | 88 (8.3%) |
| $35,000 to $39,999 | 35 (3.6%) | 55 (5.2%) |
| $40,000 to $44,999 | 38 (3.9%) | 38 (3.6%) |
| $45,000 to $49,999 | 80 (8.3%) | 17 (1.6%) |
| $50,000 to $54,999 | 35 (3.6%) | 60 (5.7%) |
| $55,000 to $64,999 | 69 (7.1%) | 21 (2.0%) |
| $65,000 to $74,999 | 5 (0.5%) | 167 (15.8%) |
| $75,000 to $99,999 | 57 (5.9%) | 50 (4.7%) |
| $100,000+ | 15 (1.5%) | 53 (5.0%) |
| Total | 970 (100.0%) | 1,055 (100.0%) |
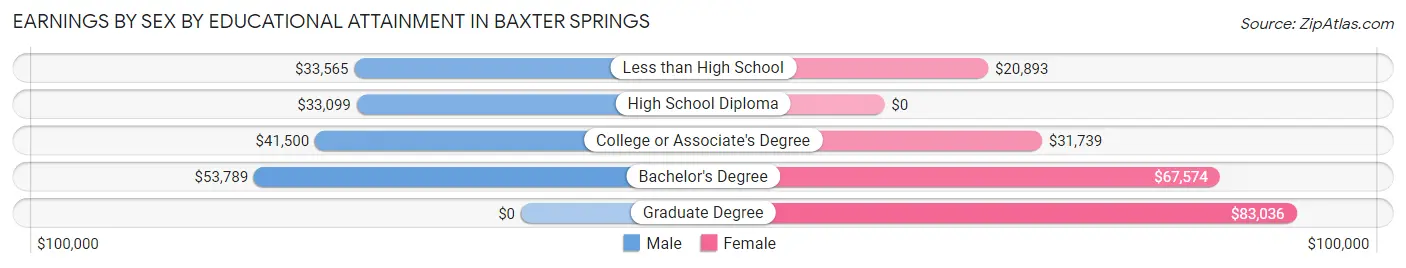
Earnings by Sex by Educational Attainment in Baxter Springs
Average earnings in Baxter Springs are $34,195 for men and $37,125 for women, a difference of 7.9%. Men with an educational attainment of bachelor's degree enjoy the highest average annual earnings of $53,789, while those with high school diploma education earn the least with $33,099. Women with an educational attainment of graduate degree earn the most with the average annual earnings of $83,036, while those with less than high school education have the smallest earnings of $20,893.
| Educational Attainment | Male Income | Female Income |
| Less than High School | $33,565 | $20,893 |
| High School Diploma | $33,099 | $0 |
| College or Associate's Degree | $41,500 | $31,739 |
| Bachelor's Degree | $53,789 | $67,574 |
| Graduate Degree | - | - |
| Total | $34,195 | $37,125 |
Family Income in Baxter Springs
Family Income Brackets in Baxter Springs
According to the Baxter Springs family income data, there are 218 families falling into the $50,000 to $74,999 income range, which is the most common income bracket and makes up 23.8% of all families. Conversely, the less than $10,000 income bracket is the least frequent group with only 10 families (1.1%) belonging to this category.
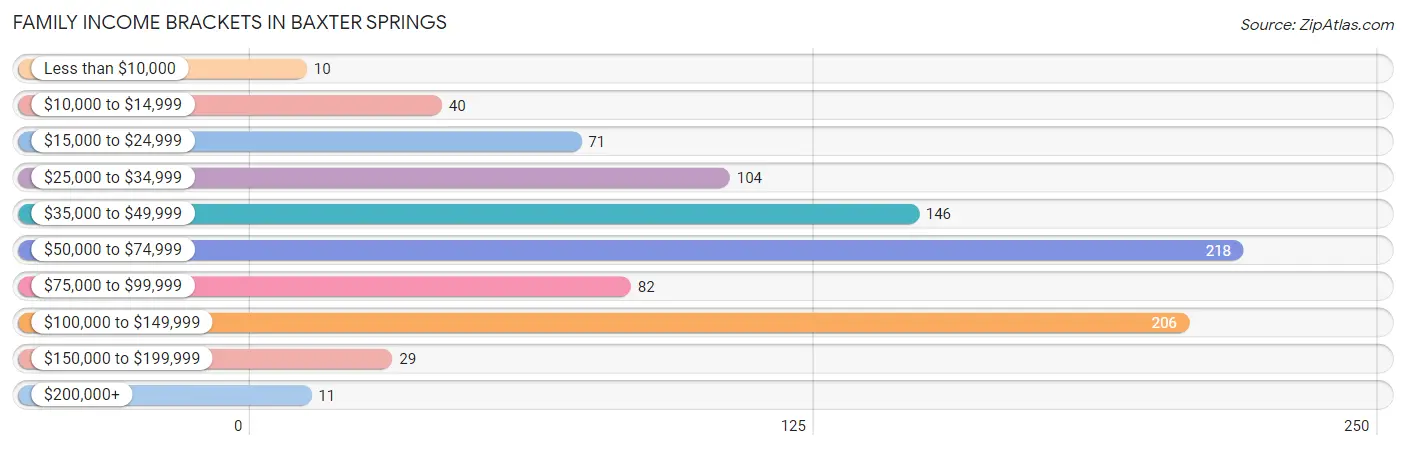
| Income Bracket | # Families | % Families |
| Less than $10,000 | 10 | 1.1% |
| $10,000 to $14,999 | 40 | 4.4% |
| $15,000 to $24,999 | 71 | 7.7% |
| $25,000 to $34,999 | 104 | 11.3% |
| $35,000 to $49,999 | 146 | 15.9% |
| $50,000 to $74,999 | 218 | 23.8% |
| $75,000 to $99,999 | 82 | 8.9% |
| $100,000 to $149,999 | 206 | 22.5% |
| $150,000 to $199,999 | 29 | 3.2% |
| $200,000+ | 11 | 1.2% |
Family Income by Famaliy Size in Baxter Springs
5-person families (46 | 5.0%) account for the highest median family income in Baxter Springs with $114,231 per family, while 2-person families (444 | 48.4%) have the highest median income of $30,364 per family member.
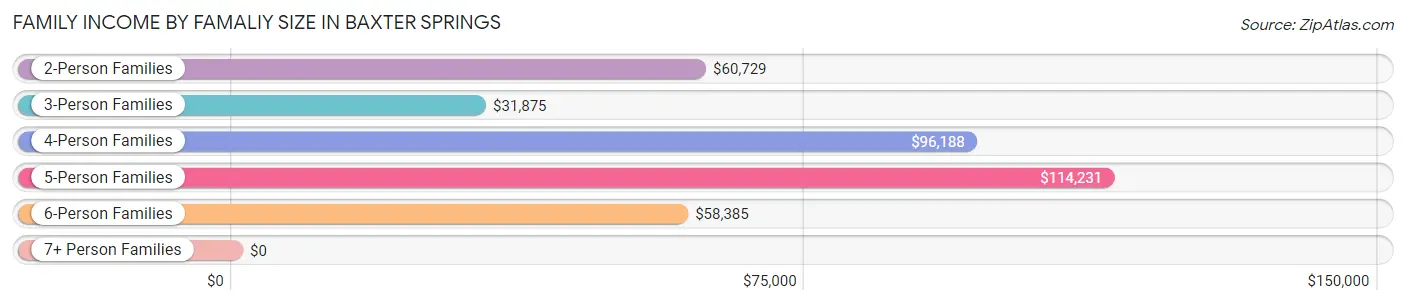
| Income Bracket | # Families | Median Income |
| 2-Person Families | 444 (48.4%) | $60,729 |
| 3-Person Families | 172 (18.8%) | $31,875 |
| 4-Person Families | 149 (16.3%) | $96,188 |
| 5-Person Families | 46 (5.0%) | $114,231 |
| 6-Person Families | 106 (11.6%) | $58,385 |
| 7+ Person Families | 0 (0.0%) | $0 |
| Total | 917 (100.0%) | $60,139 |
Family Income by Number of Earners in Baxter Springs
The median family income in Baxter Springs is $60,139, with families comprising 3+ earners (96) having the highest median family income of $115,313, while families with no earners (73) have the lowest median family income of $14,205, accounting for 10.5% and 8.0% of families, respectively.
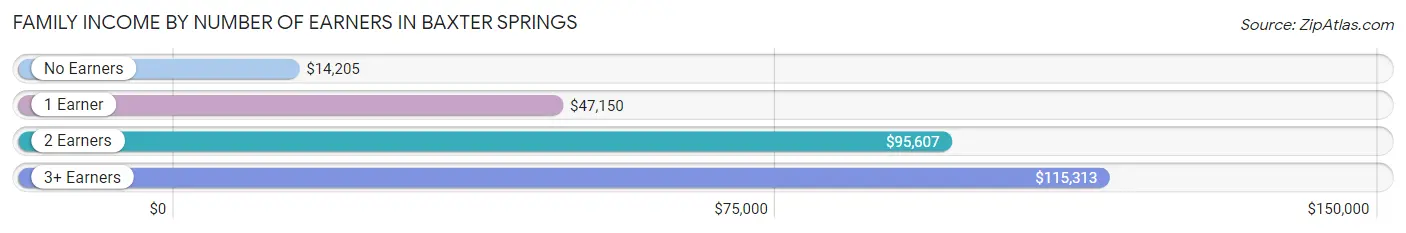
| Number of Earners | # Families | Median Income |
| No Earners | 73 (8.0%) | $14,205 |
| 1 Earner | 349 (38.1%) | $47,150 |
| 2 Earners | 399 (43.5%) | $95,607 |
| 3+ Earners | 96 (10.5%) | $115,313 |
| Total | 917 (100.0%) | $60,139 |
Household Income in Baxter Springs
Household Income Brackets in Baxter Springs
With 297 households falling in the category, the $50,000 to $74,999 income range is the most frequent in Baxter Springs, accounting for 20.5% of all households. In contrast, only 12 households (0.8%) fall into the $200,000+ income bracket, making it the least populous group.
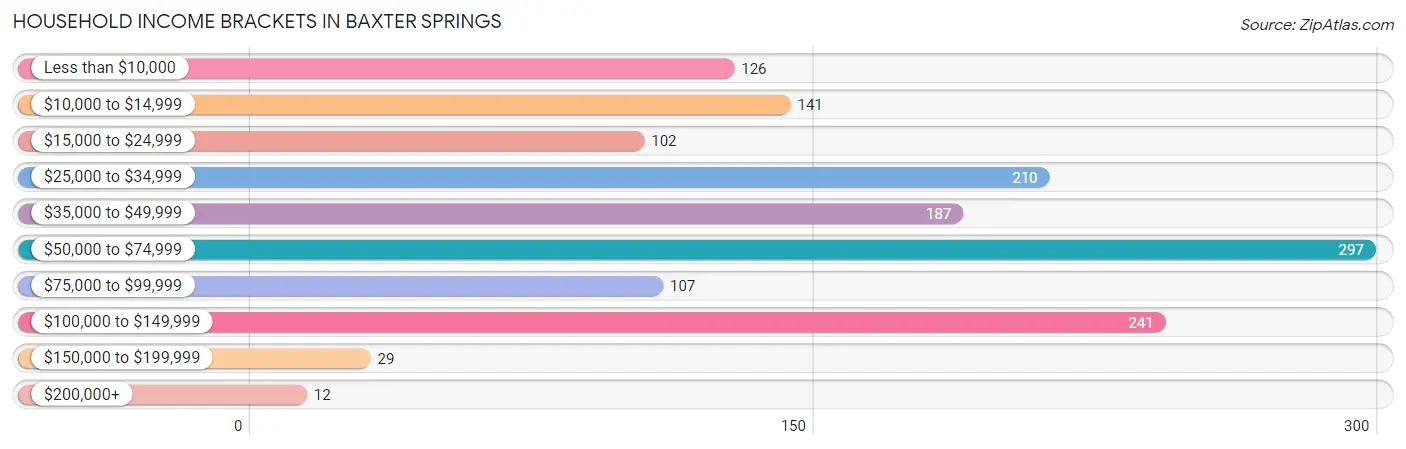
| Income Bracket | # Households | % Households |
| Less than $10,000 | 126 | 8.7% |
| $10,000 to $14,999 | 141 | 9.7% |
| $15,000 to $24,999 | 102 | 7.0% |
| $25,000 to $34,999 | 210 | 14.5% |
| $35,000 to $49,999 | 187 | 12.9% |
| $50,000 to $74,999 | 297 | 20.5% |
| $75,000 to $99,999 | 107 | 7.4% |
| $100,000 to $149,999 | 241 | 16.6% |
| $150,000 to $199,999 | 29 | 2.0% |
| $200,000+ | 12 | 0.8% |
Household Income by Householder Age in Baxter Springs
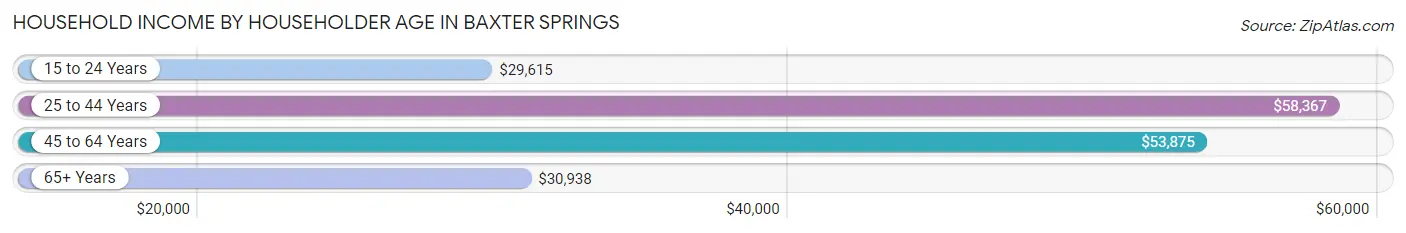
The median household income in Baxter Springs is $47,727, with the highest median household income of $58,367 found in the 25 to 44 years age bracket for the primary householder. A total of 441 households (30.4%) fall into this category. Meanwhile, the 15 to 24 years age bracket for the primary householder has the lowest median household income of $29,615, with 54 households (3.7%) in this group.
| Income Bracket | # Households | Median Income |
| 15 to 24 Years | 54 (3.7%) | $29,615 |
| 25 to 44 Years | 441 (30.4%) | $58,367 |
| 45 to 64 Years | 601 (41.4%) | $53,875 |
| 65+ Years | 354 (24.4%) | $30,938 |
| Total | 1,450 (100.0%) | $47,727 |
Poverty in Baxter Springs
Income Below Poverty by Sex and Age in Baxter Springs
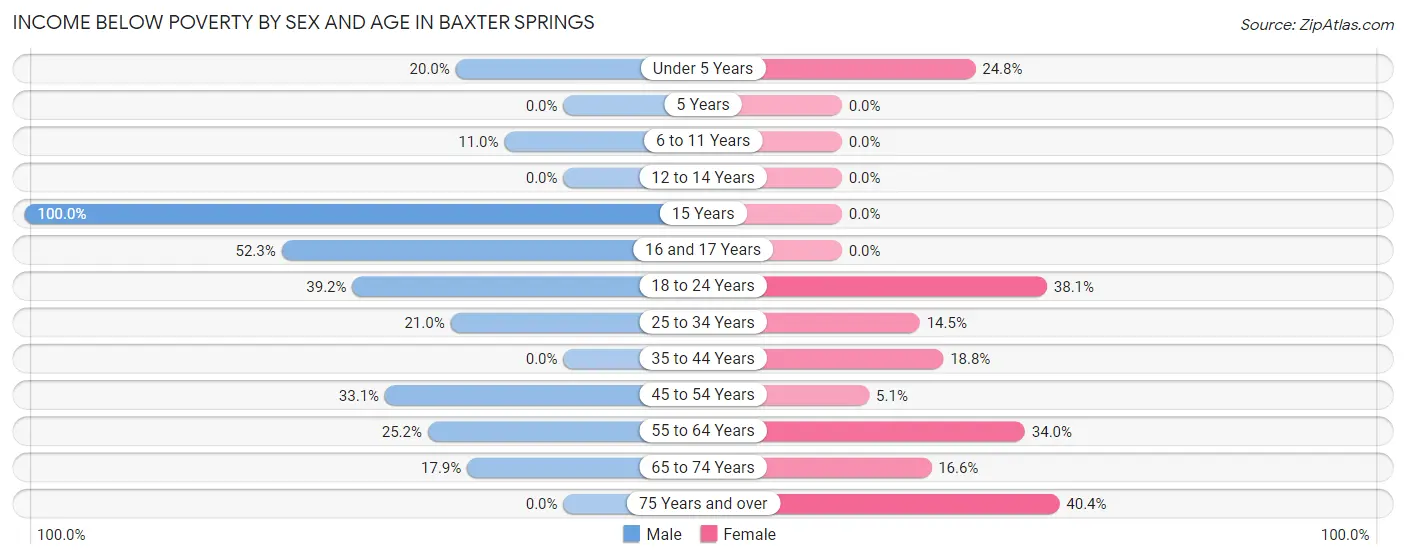
With 20.9% poverty level for males and 17.9% for females among the residents of Baxter Springs, 15 year old males and 75 year old and over females are the most vulnerable to poverty, with 29 males (100.0%) and 21 females (40.4%) in their respective age groups living below the poverty level.
| Age Bracket | Male | Female |
| Under 5 Years | 29 (20.0%) | 28 (24.8%) |
| 5 Years | 0 (0.0%) | 0 (0.0%) |
| 6 to 11 Years | 15 (11.0%) | 0 (0.0%) |
| 12 to 14 Years | 0 (0.0%) | 0 (0.0%) |
| 15 Years | 29 (100.0%) | 0 (0.0%) |
| 16 and 17 Years | 34 (52.3%) | 0 (0.0%) |
| 18 to 24 Years | 65 (39.2%) | 59 (38.1%) |
| 25 to 34 Years | 53 (20.9%) | 23 (14.5%) |
| 35 to 44 Years | 0 (0.0%) | 54 (18.8%) |
| 45 to 54 Years | 53 (33.1%) | 9 (5.1%) |
| 55 to 64 Years | 81 (25.2%) | 123 (34.0%) |
| 65 to 74 Years | 35 (17.9%) | 34 (16.6%) |
| 75 Years and over | 0 (0.0%) | 21 (40.4%) |
| Total | 394 (20.9%) | 351 (17.9%) |
Income Above Poverty by Sex and Age in Baxter Springs
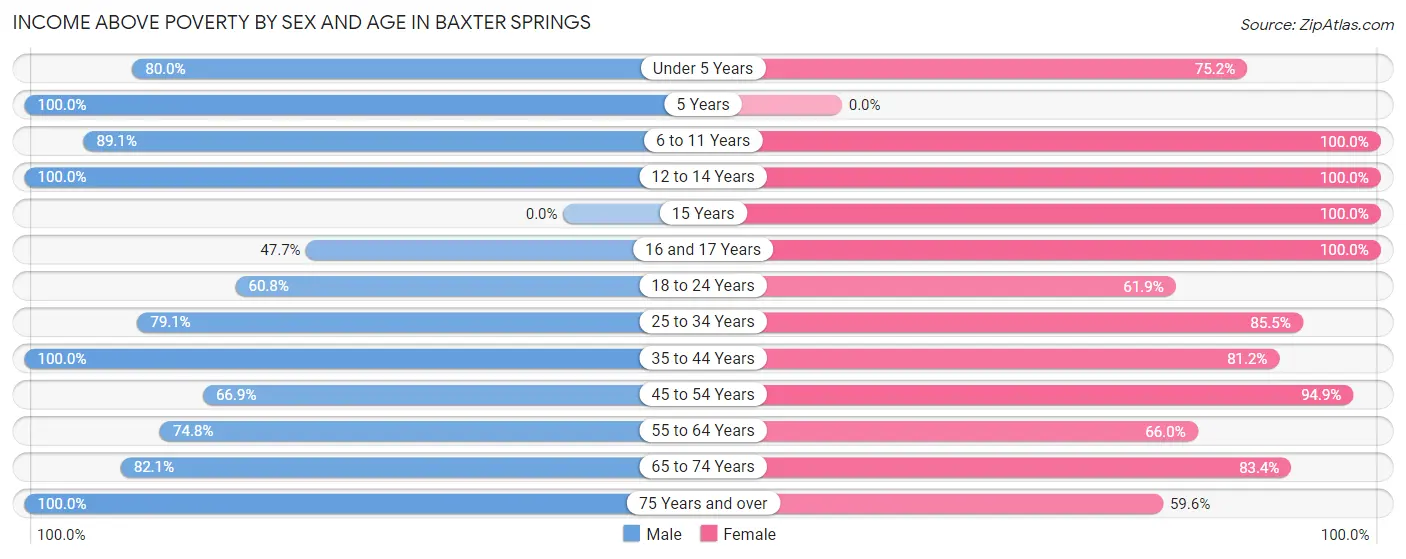
According to the poverty statistics in Baxter Springs, males aged 5 years and females aged 6 to 11 years are the age groups that are most secure financially, with 100.0% of males and 100.0% of females in these age groups living above the poverty line.
| Age Bracket | Male | Female |
| Under 5 Years | 116 (80.0%) | 85 (75.2%) |
| 5 Years | 60 (100.0%) | 0 (0.0%) |
| 6 to 11 Years | 122 (89.0%) | 323 (100.0%) |
| 12 to 14 Years | 44 (100.0%) | 31 (100.0%) |
| 15 Years | 0 (0.0%) | 37 (100.0%) |
| 16 and 17 Years | 31 (47.7%) | 55 (100.0%) |
| 18 to 24 Years | 101 (60.8%) | 96 (61.9%) |
| 25 to 34 Years | 200 (79.0%) | 136 (85.5%) |
| 35 to 44 Years | 261 (100.0%) | 233 (81.2%) |
| 45 to 54 Years | 107 (66.9%) | 168 (94.9%) |
| 55 to 64 Years | 241 (74.8%) | 239 (66.0%) |
| 65 to 74 Years | 161 (82.1%) | 171 (83.4%) |
| 75 Years and over | 49 (100.0%) | 31 (59.6%) |
| Total | 1,493 (79.1%) | 1,605 (82.1%) |
Income Below Poverty Among Married-Couple Families in Baxter Springs
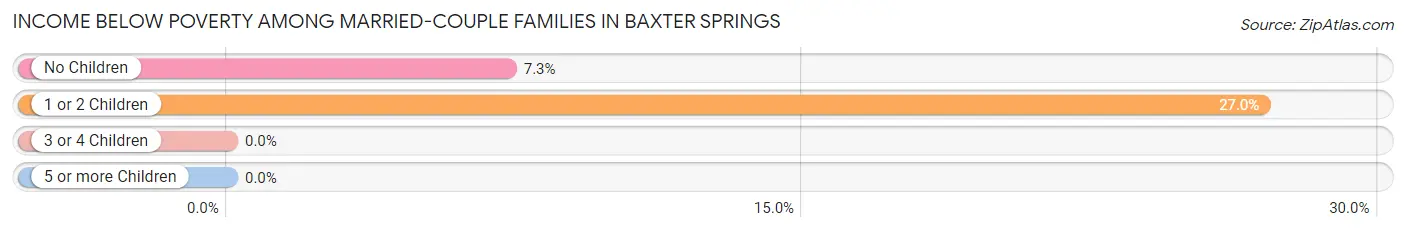
The poverty statistics for married-couple families in Baxter Springs show that 9.4% or 64 of the total 678 families live below the poverty line. Families with 1 or 2 children have the highest poverty rate of 27.0%, comprising of 34 families. On the other hand, families with 3 or 4 children have the lowest poverty rate of 0.0%, which includes 0 families.
| Children | Above Poverty | Below Poverty |
| No Children | 382 (92.7%) | 30 (7.3%) |
| 1 or 2 Children | 92 (73.0%) | 34 (27.0%) |
| 3 or 4 Children | 140 (100.0%) | 0 (0.0%) |
| 5 or more Children | 0 (0.0%) | 0 (0.0%) |
| Total | 614 (90.6%) | 64 (9.4%) |
Income Below Poverty Among Single-Parent Households in Baxter Springs
According to the poverty data in Baxter Springs, 38.5% or 25 single-father households and 24.7% or 43 single-mother households are living below the poverty line. Among single-father households, those with 1 or 2 children have the highest poverty rate, with 25 households (43.9%) experiencing poverty. Likewise, among single-mother households, those with no children have the highest poverty rate, with 29 households (72.5%) falling below the poverty line.
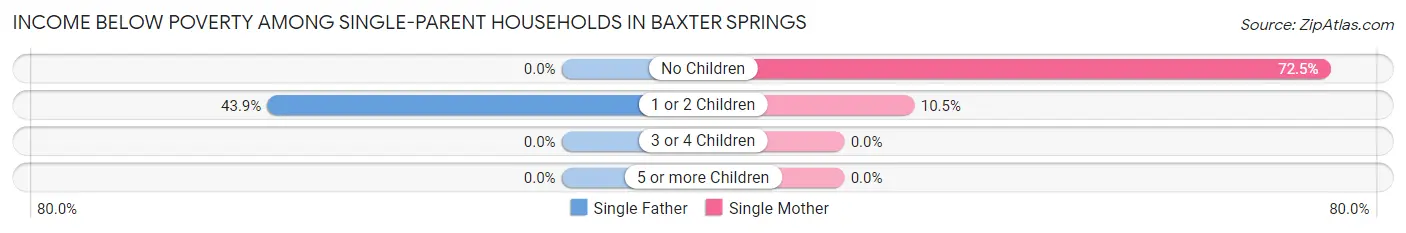
| Children | Single Father | Single Mother |
| No Children | 0 (0.0%) | 29 (72.5%) |
| 1 or 2 Children | 25 (43.9%) | 14 (10.4%) |
| 3 or 4 Children | 0 (0.0%) | 0 (0.0%) |
| 5 or more Children | 0 (0.0%) | 0 (0.0%) |
| Total | 25 (38.5%) | 43 (24.7%) |
Income Below Poverty Among Married-Couple vs Single-Parent Households in Baxter Springs
The poverty data for Baxter Springs shows that 64 of the married-couple family households (9.4%) and 68 of the single-parent households (28.4%) are living below the poverty level. Within the married-couple family households, those with 1 or 2 children have the highest poverty rate, with 34 households (27.0%) falling below the poverty line. Among the single-parent households, those with no children have the highest poverty rate, with 29 household (60.4%) living below poverty.
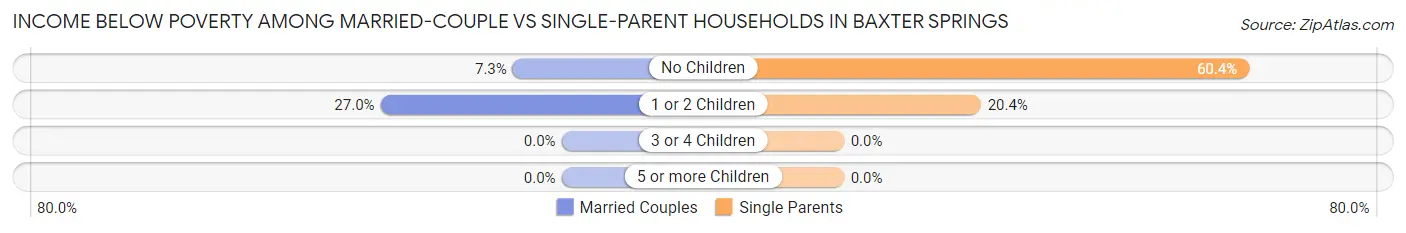
| Children | Married-Couple Families | Single-Parent Households |
| No Children | 30 (7.3%) | 29 (60.4%) |
| 1 or 2 Children | 34 (27.0%) | 39 (20.4%) |
| 3 or 4 Children | 0 (0.0%) | 0 (0.0%) |
| 5 or more Children | 0 (0.0%) | 0 (0.0%) |
| Total | 64 (9.4%) | 68 (28.4%) |
Race in Baxter Springs
The most populous races in Baxter Springs are White / Caucasian (3,461 | 88.7%), Hispanic or Latino (357 | 9.1%), and Two or more Races (290 | 7.4%).
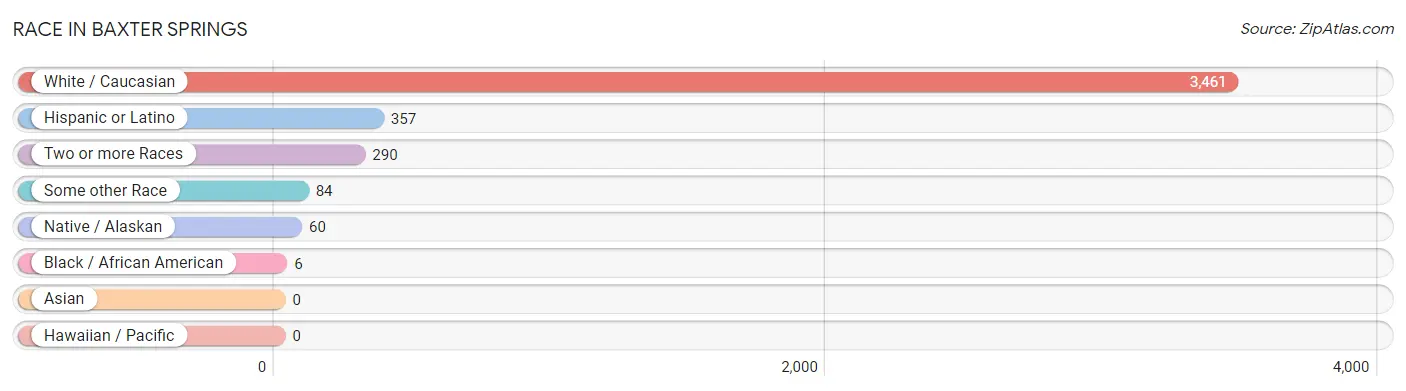
| Race | # Population | % Population |
| Asian | 0 | 0.0% |
| Black / African American | 6 | 0.2% |
| Hawaiian / Pacific | 0 | 0.0% |
| Hispanic or Latino | 357 | 9.1% |
| Native / Alaskan | 60 | 1.5% |
| White / Caucasian | 3,461 | 88.7% |
| Two or more Races | 290 | 7.4% |
| Some other Race | 84 | 2.1% |
| Total | 3,901 | 100.0% |
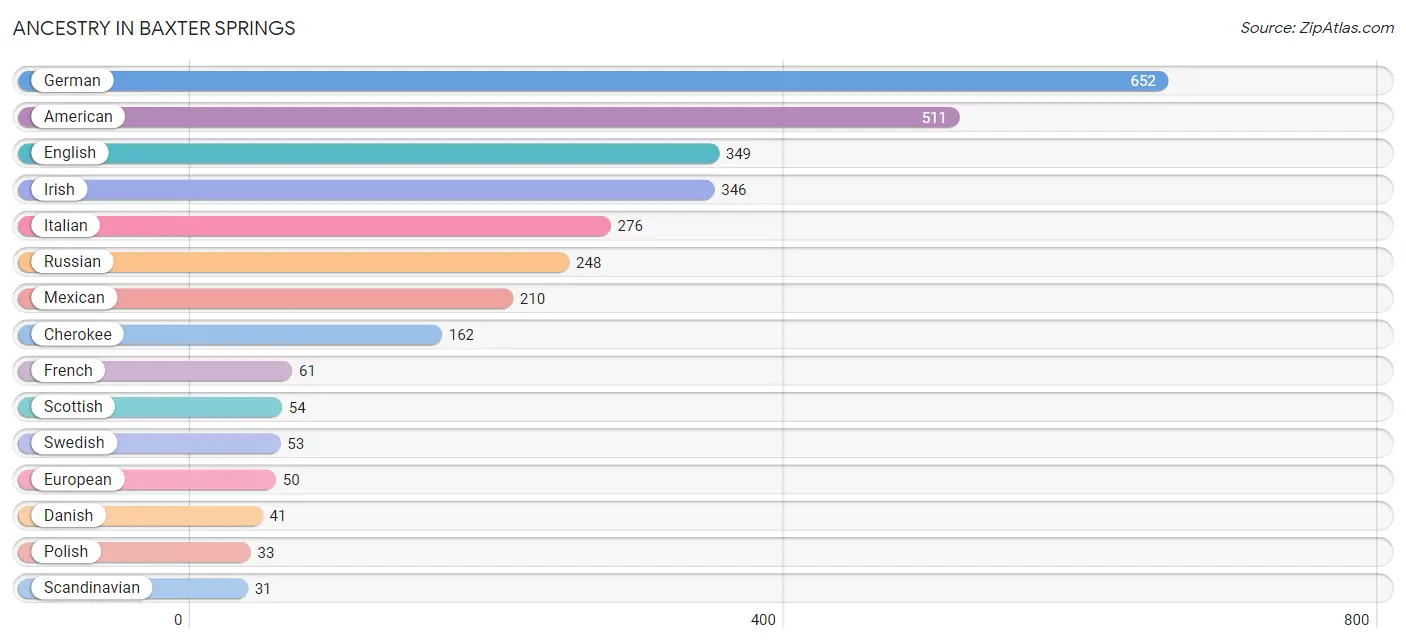
Ancestry in Baxter Springs
The most populous ancestries reported in Baxter Springs are German (652 | 16.7%), American (511 | 13.1%), English (349 | 8.9%), Irish (346 | 8.9%), and Italian (276 | 7.1%), together accounting for 54.7% of all Baxter Springs residents.
| Ancestry | # Population | % Population |
| American | 511 | 13.1% |
| Apache | 16 | 0.4% |
| Australian | 14 | 0.4% |
| Austrian | 4 | 0.1% |
| Central American | 28 | 0.7% |
| Cherokee | 162 | 4.2% |
| Chippewa | 3 | 0.1% |
| Choctaw | 3 | 0.1% |
| Comanche | 24 | 0.6% |
| Danish | 41 | 1.1% |
| Dutch | 27 | 0.7% |
| Eastern European | 9 | 0.2% |
| English | 349 | 8.9% |
| European | 50 | 1.3% |
| French | 61 | 1.6% |
| French Canadian | 22 | 0.6% |
| German | 652 | 16.7% |
| Guatemalan | 27 | 0.7% |
| Hungarian | 18 | 0.5% |
| Irish | 346 | 8.9% |
| Iroquois | 3 | 0.1% |
| Italian | 276 | 7.1% |
| Kiowa | 9 | 0.2% |
| Korean | 11 | 0.3% |
| Mexican | 210 | 5.4% |
| Navajo | 9 | 0.2% |
| Northern European | 7 | 0.2% |
| Norwegian | 7 | 0.2% |
| Panamanian | 1 | 0.0% |
| Polish | 33 | 0.9% |
| Russian | 248 | 6.4% |
| Scandinavian | 31 | 0.8% |
| Scotch-Irish | 29 | 0.7% |
| Scottish | 54 | 1.4% |
| Spanish | 3 | 0.1% |
| Swedish | 53 | 1.4% |
| Welsh | 26 | 0.7% | View All 37 Rows |
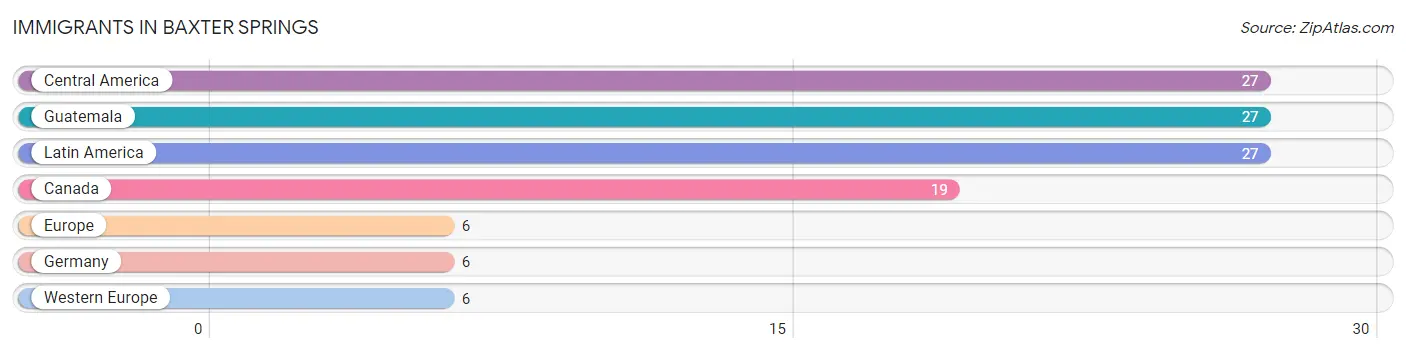
Immigrants in Baxter Springs
The most numerous immigrant groups reported in Baxter Springs came from Central America (27 | 0.7%), Guatemala (27 | 0.7%), Latin America (27 | 0.7%), Canada (19 | 0.5%), and Europe (6 | 0.2%), together accounting for 2.7% of all Baxter Springs residents.
| Immigration Origin | # Population | % Population |
| Canada | 19 | 0.5% |
| Central America | 27 | 0.7% |
| Europe | 6 | 0.2% |
| Germany | 6 | 0.2% |
| Guatemala | 27 | 0.7% |
| Latin America | 27 | 0.7% |
| Western Europe | 6 | 0.2% | View All 7 Rows |
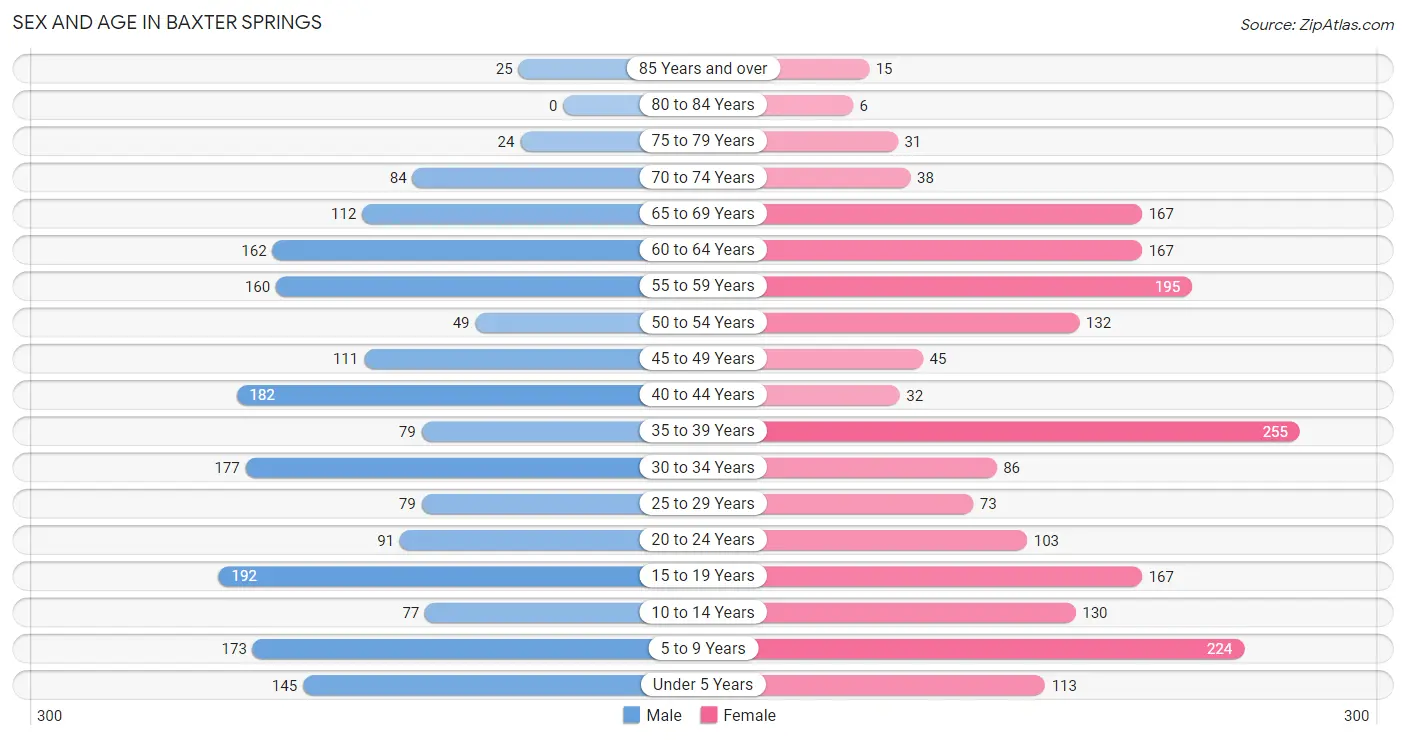
Sex and Age in Baxter Springs
Sex and Age in Baxter Springs
The most populous age groups in Baxter Springs are 15 to 19 Years (192 | 10.0%) for men and 35 to 39 Years (255 | 12.9%) for women.
| Age Bracket | Male | Female |
| Under 5 Years | 145 (7.5%) | 113 (5.7%) |
| 5 to 9 Years | 173 (9.0%) | 224 (11.3%) |
| 10 to 14 Years | 77 (4.0%) | 130 (6.6%) |
| 15 to 19 Years | 192 (10.0%) | 167 (8.4%) |
| 20 to 24 Years | 91 (4.7%) | 103 (5.2%) |
| 25 to 29 Years | 79 (4.1%) | 73 (3.7%) |
| 30 to 34 Years | 177 (9.2%) | 86 (4.3%) |
| 35 to 39 Years | 79 (4.1%) | 255 (12.9%) |
| 40 to 44 Years | 182 (9.5%) | 32 (1.6%) |
| 45 to 49 Years | 111 (5.8%) | 45 (2.3%) |
| 50 to 54 Years | 49 (2.5%) | 132 (6.7%) |
| 55 to 59 Years | 160 (8.3%) | 195 (9.9%) |
| 60 to 64 Years | 162 (8.4%) | 167 (8.4%) |
| 65 to 69 Years | 112 (5.8%) | 167 (8.4%) |
| 70 to 74 Years | 84 (4.4%) | 38 (1.9%) |
| 75 to 79 Years | 24 (1.3%) | 31 (1.6%) |
| 80 to 84 Years | 0 (0.0%) | 6 (0.3%) |
| 85 Years and over | 25 (1.3%) | 15 (0.8%) |
| Total | 1,922 (100.0%) | 1,979 (100.0%) |
Families and Households in Baxter Springs
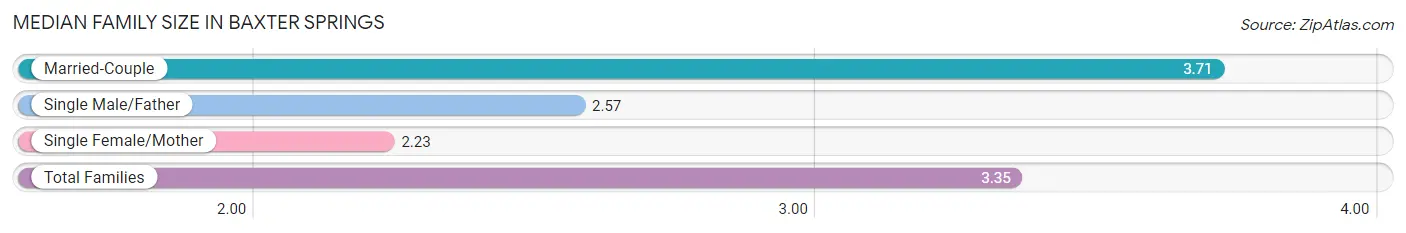
Median Family Size in Baxter Springs
The median family size in Baxter Springs is 3.35 persons per family, with married-couple families (678 | 73.9%) accounting for the largest median family size of 3.71 persons per family. On the other hand, single female/mother families (174 | 19.0%) represent the smallest median family size with 2.23 persons per family.
| Family Type | # Families | Family Size |
| Married-Couple | 678 (73.9%) | 3.71 |
| Single Male/Father | 65 (7.1%) | 2.57 |
| Single Female/Mother | 174 (19.0%) | 2.23 |
| Total Families | 917 (100.0%) | 3.35 |
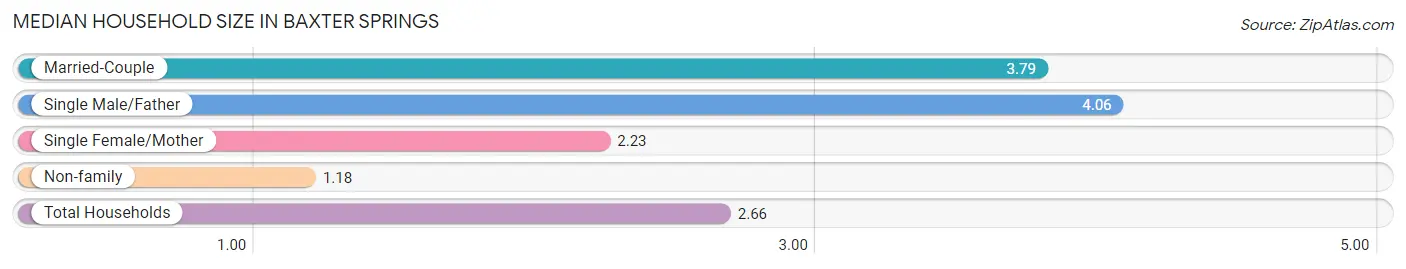
Median Household Size in Baxter Springs
The median household size in Baxter Springs is 2.66 persons per household, with single male/father households (65 | 4.5%) accounting for the largest median household size of 4.06 persons per household. non-family households (533 | 36.8%) represent the smallest median household size with 1.18 persons per household.
| Household Type | # Households | Household Size |
| Married-Couple | 678 (46.8%) | 3.79 |
| Single Male/Father | 65 (4.5%) | 4.06 |
| Single Female/Mother | 174 (12.0%) | 2.23 |
| Non-family | 533 (36.8%) | 1.18 |
| Total Households | 1,450 (100.0%) | 2.66 |
Household Size by Marriage Status in Baxter Springs
Out of a total of 1,450 households in Baxter Springs, 917 (63.2%) are family households, while 533 (36.8%) are nonfamily households. The most numerous type of family households are 2-person households, comprising 426, and the most common type of nonfamily households are 1-person households, comprising 454.
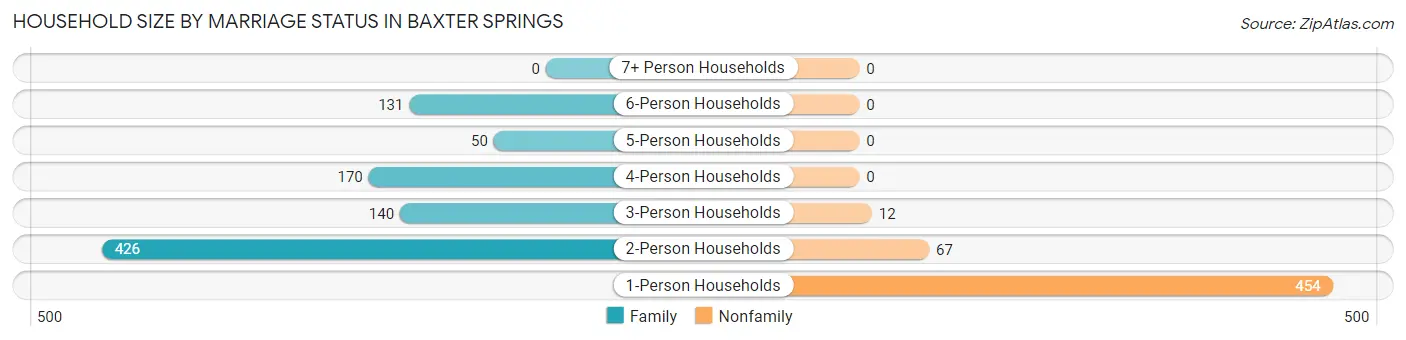
| Household Size | Family Households | Nonfamily Households |
| 1-Person Households | - | 454 (31.3%) |
| 2-Person Households | 426 (29.4%) | 67 (4.6%) |
| 3-Person Households | 140 (9.7%) | 12 (0.8%) |
| 4-Person Households | 170 (11.7%) | 0 (0.0%) |
| 5-Person Households | 50 (3.5%) | 0 (0.0%) |
| 6-Person Households | 131 (9.0%) | 0 (0.0%) |
| 7+ Person Households | 0 (0.0%) | 0 (0.0%) |
| Total | 917 (63.2%) | 533 (36.8%) |
Female Fertility in Baxter Springs
Fertility by Age in Baxter Springs
Average fertility rate in Baxter Springs is 60.0 births per 1,000 women. Women in the age bracket of 20 to 34 years have the highest fertility rate with 176.0 births per 1,000 women. Women in the age bracket of 20 to 34 years acount for 100.0% of all women with births.
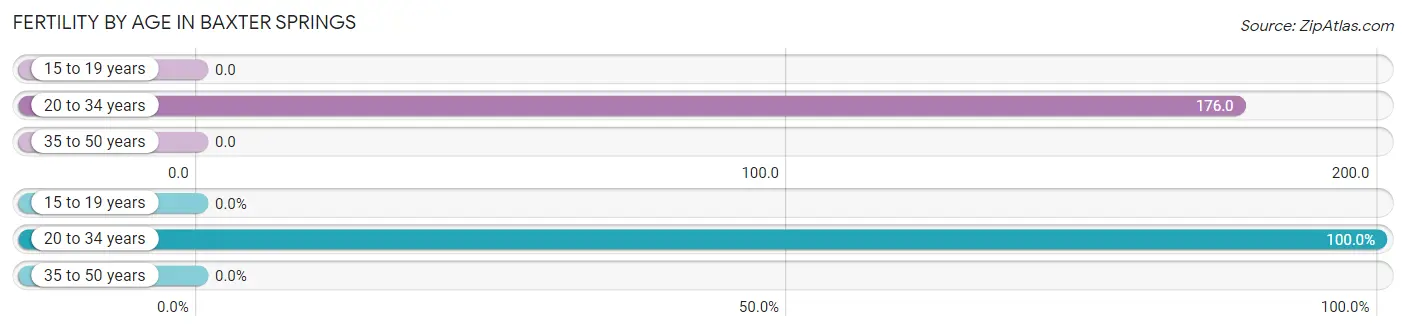
| Age Bracket | Women with Births | Births / 1,000 Women |
| 15 to 19 years | 0 (0.0%) | 0.0 |
| 20 to 34 years | 46 (100.0%) | 176.0 |
| 35 to 50 years | 0 (0.0%) | 0.0 |
| Total | 46 (100.0%) | 60.0 |
Fertility by Age by Marriage Status in Baxter Springs
58.7% of women with births (46) in Baxter Springs are married. The highest percentage of unmarried women with births falls into 20 to 34 years age bracket with 41.3% of them unmarried at the time of birth, while the lowest percentage of unmarried women with births belong to 20 to 34 years age bracket with 41.3% of them unmarried.
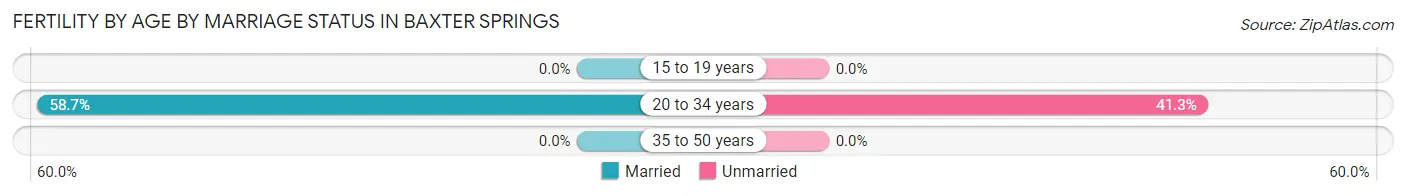
| Age Bracket | Married | Unmarried |
| 15 to 19 years | 0 (0.0%) | 0 (0.0%) |
| 20 to 34 years | 27 (58.7%) | 19 (41.3%) |
| 35 to 50 years | 0 (0.0%) | 0 (0.0%) |
| Total | 27 (58.7%) | 19 (41.3%) |
Fertility by Education in Baxter Springs
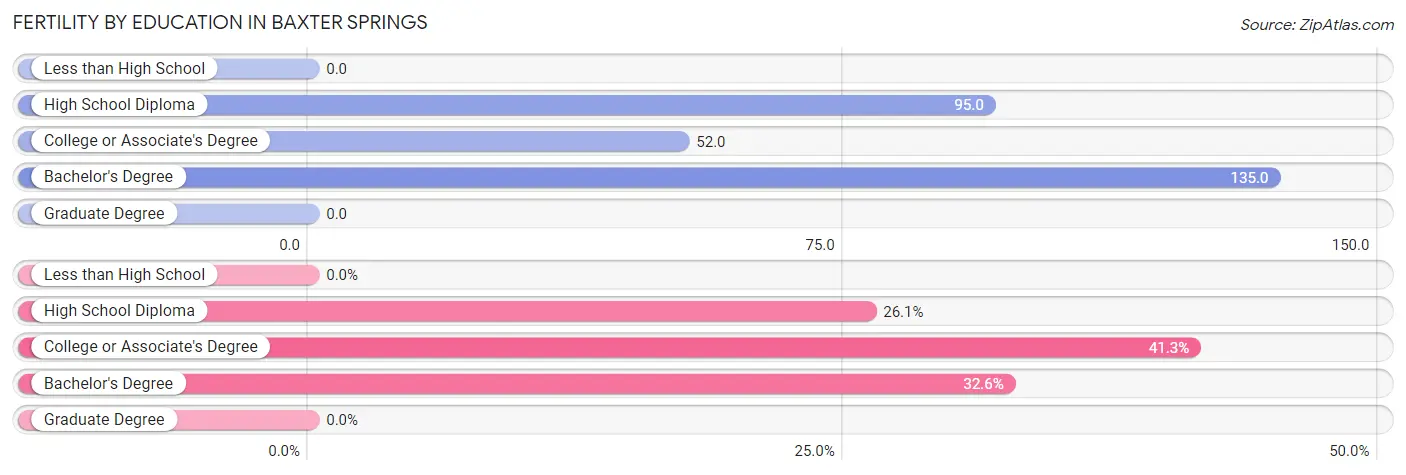
| Educational Attainment | Women with Births | Births / 1,000 Women |
| Less than High School | 0 (0.0%) | 0.0 |
| High School Diploma | 12 (26.1%) | 95.0 |
| College or Associate's Degree | 19 (41.3%) | 52.0 |
| Bachelor's Degree | 15 (32.6%) | 135.0 |
| Graduate Degree | 0 (0.0%) | 0.0 |
| Total | 46 (100.0%) | 60.0 |
Fertility by Education by Marriage Status in Baxter Springs
41.3% of women with births in Baxter Springs are unmarried. Women with the educational attainment of high school diploma are most likely to be married with 100.0% of them married at childbirth, while women with the educational attainment of college or associate's degree are least likely to be married with 100.0% of them unmarried at childbirth.
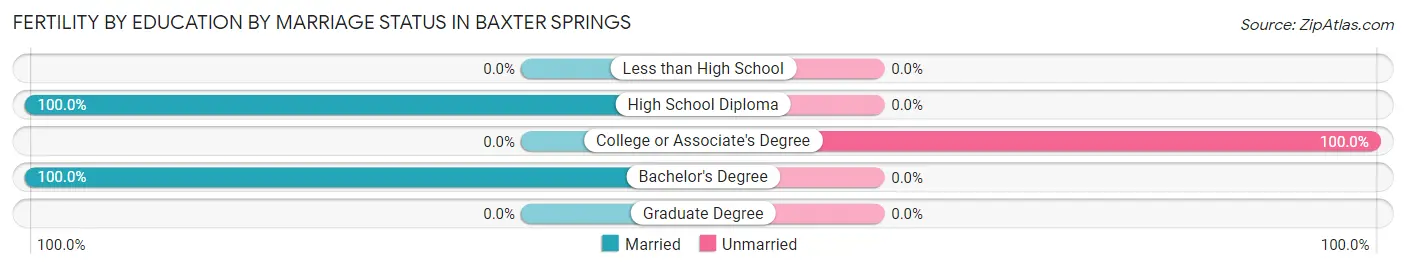
| Educational Attainment | Married | Unmarried |
| Less than High School | 0 (0.0%) | 0 (0.0%) |
| High School Diploma | 12 (100.0%) | 0 (0.0%) |
| College or Associate's Degree | 0 (0.0%) | 19 (100.0%) |
| Bachelor's Degree | 15 (100.0%) | 0 (0.0%) |
| Graduate Degree | 0 (0.0%) | 0 (0.0%) |
| Total | 27 (58.7%) | 19 (41.3%) |
Employment Characteristics in Baxter Springs
Employment by Class of Employer in Baxter Springs
Among the 1,848 employed individuals in Baxter Springs, private company employees (1,203 | 65.1%), local government employees (227 | 12.3%), and not-for-profit organizations (160 | 8.7%) make up the most common classes of employment.
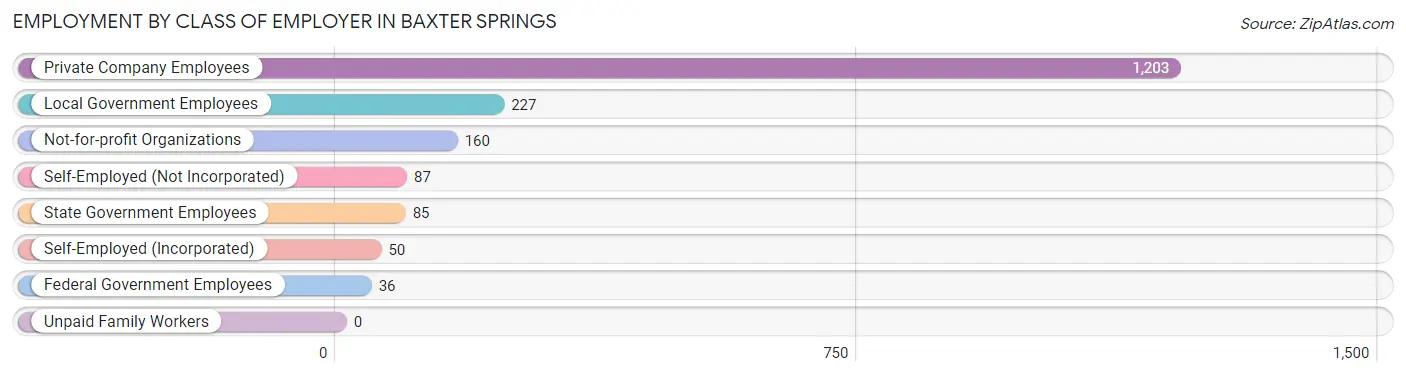
| Employer Class | # Employees | % Employees |
| Private Company Employees | 1,203 | 65.1% |
| Self-Employed (Incorporated) | 50 | 2.7% |
| Self-Employed (Not Incorporated) | 87 | 4.7% |
| Not-for-profit Organizations | 160 | 8.7% |
| Local Government Employees | 227 | 12.3% |
| State Government Employees | 85 | 4.6% |
| Federal Government Employees | 36 | 1.9% |
| Unpaid Family Workers | 0 | 0.0% |
| Total | 1,848 | 100.0% |
Employment Status by Age in Baxter Springs
According to the labor force statistics for Baxter Springs, out of the total population over 16 years of age (2,973), 63.8% or 1,897 individuals are in the labor force, with 2.7% or 51 of them unemployed. The age group with the highest labor force participation rate is 35 to 44 years, with 97.6% or 535 individuals in the labor force. Within the labor force, the 35 to 44 years age range has the highest percentage of unemployed individuals, with 7.7% or 41 of them being unemployed.
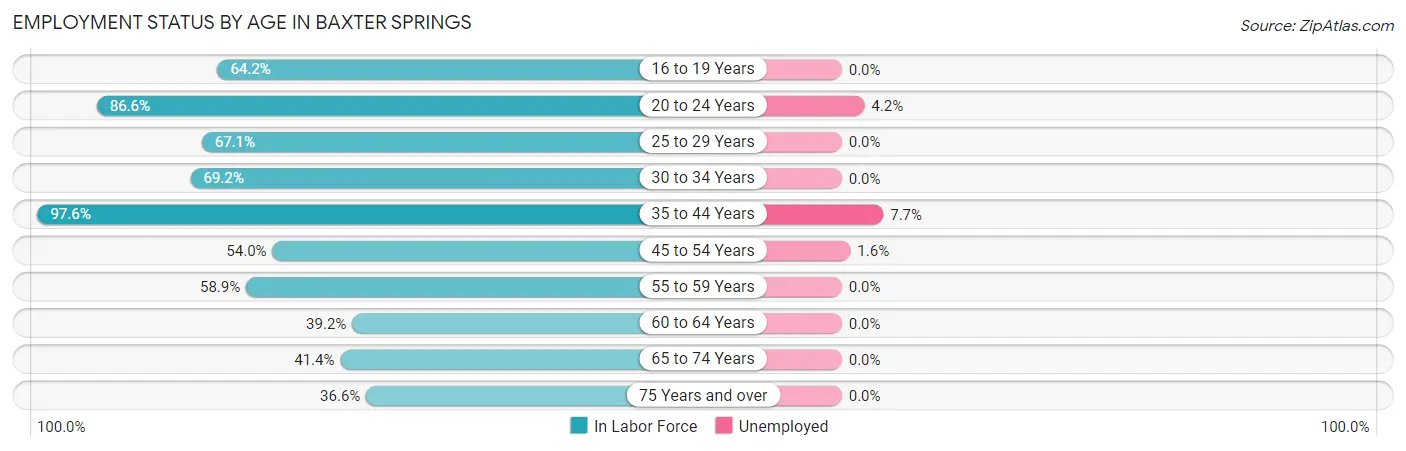
| Age Bracket | In Labor Force | Unemployed |
| 16 to 19 Years | 188 (64.2%) | 0 (0.0%) |
| 20 to 24 Years | 168 (86.6%) | 7 (4.2%) |
| 25 to 29 Years | 102 (67.1%) | 0 (0.0%) |
| 30 to 34 Years | 182 (69.2%) | 0 (0.0%) |
| 35 to 44 Years | 535 (97.6%) | 41 (7.7%) |
| 45 to 54 Years | 182 (54.0%) | 3 (1.6%) |
| 55 to 59 Years | 209 (58.9%) | 0 (0.0%) |
| 60 to 64 Years | 129 (39.2%) | 0 (0.0%) |
| 65 to 74 Years | 166 (41.4%) | 0 (0.0%) |
| 75 Years and over | 37 (36.6%) | 0 (0.0%) |
| Total | 1,897 (63.8%) | 51 (2.7%) |
Employment Status by Educational Attainment in Baxter Springs
According to labor force statistics for Baxter Springs, 67.5% of individuals (1,339) out of the total population between 25 and 64 years of age (1,984) are in the labor force, with 3.3% or 44 of them being unemployed. The group with the highest labor force participation rate are those with the educational attainment of bachelor's degree or higher, with 84.2% or 346 individuals in the labor force. Within the labor force, individuals with college / associate degree education have the highest percentage of unemployment, with 7.6% or 44 of them being unemployed.
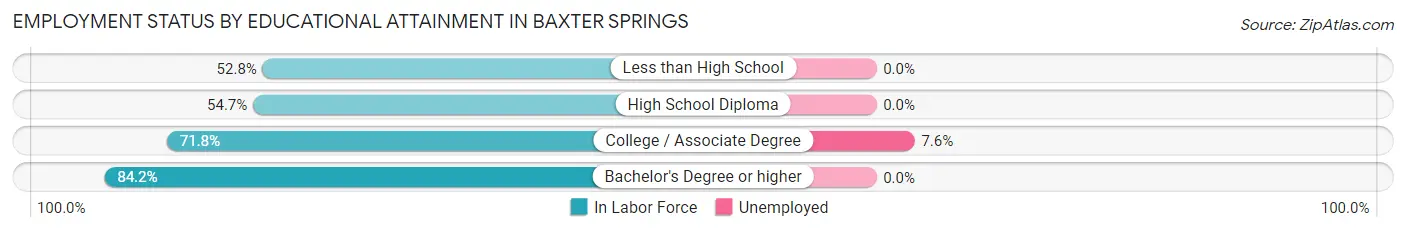
| Educational Attainment | In Labor Force | Unemployed |
| Less than High School | 162 (52.8%) | 0 (0.0%) |
| High School Diploma | 249 (54.7%) | 0 (0.0%) |
| College / Associate Degree | 582 (71.8%) | 62 (7.6%) |
| Bachelor's Degree or higher | 346 (84.2%) | 0 (0.0%) |
| Total | 1,339 (67.5%) | 65 (3.3%) |
Employment Occupations by Sex in Baxter Springs
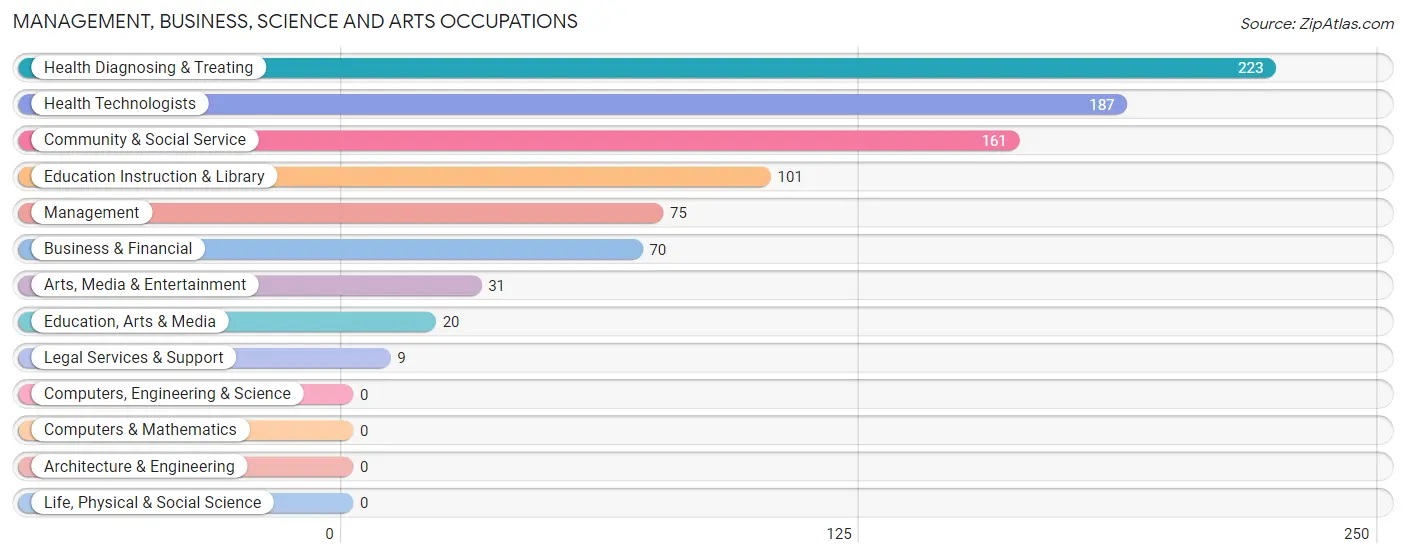
Management, Business, Science and Arts Occupations
The most common Management, Business, Science and Arts occupations in Baxter Springs are Health Diagnosing & Treating (223 | 12.2%), Health Technologists (187 | 10.2%), Community & Social Service (161 | 8.8%), Education Instruction & Library (101 | 5.5%), and Management (75 | 4.1%).
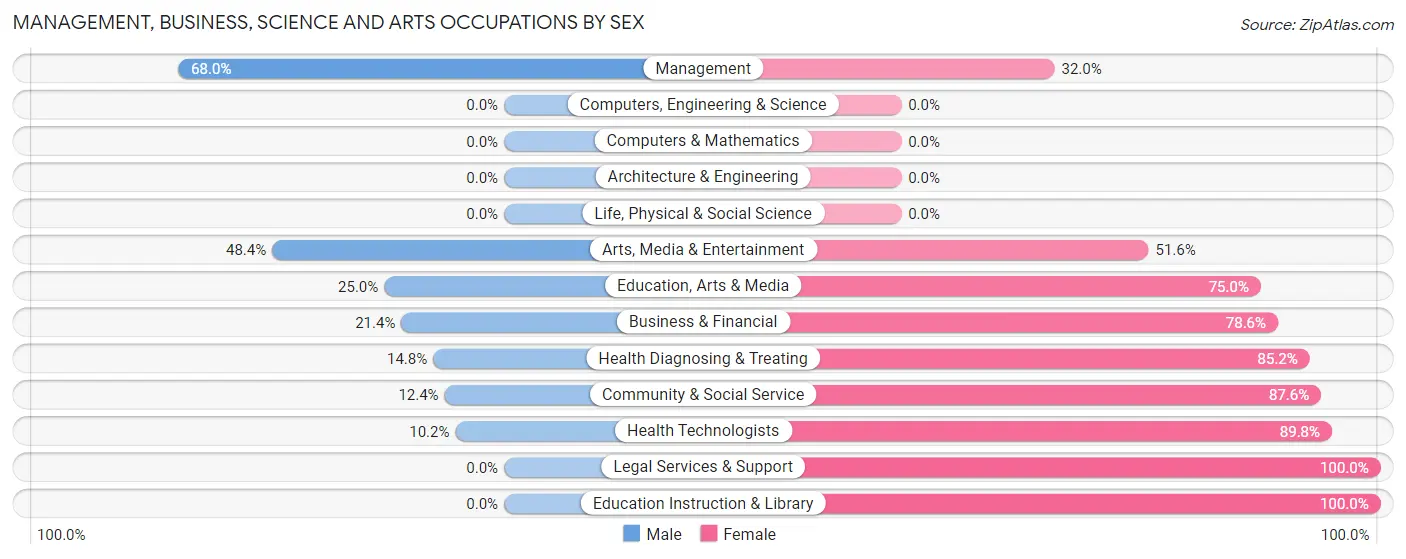
Management, Business, Science and Arts Occupations by Sex
Within the Management, Business, Science and Arts occupations in Baxter Springs, the most male-oriented occupations are Management (68.0%), Arts, Media & Entertainment (48.4%), and Education, Arts & Media (25.0%), while the most female-oriented occupations are Legal Services & Support (100.0%), Education Instruction & Library (100.0%), and Health Technologists (89.8%).
| Occupation | Male | Female |
| Management | 51 (68.0%) | 24 (32.0%) |
| Business & Financial | 15 (21.4%) | 55 (78.6%) |
| Computers, Engineering & Science | 0 (0.0%) | 0 (0.0%) |
| Computers & Mathematics | 0 (0.0%) | 0 (0.0%) |
| Architecture & Engineering | 0 (0.0%) | 0 (0.0%) |
| Life, Physical & Social Science | 0 (0.0%) | 0 (0.0%) |
| Community & Social Service | 20 (12.4%) | 141 (87.6%) |
| Education, Arts & Media | 5 (25.0%) | 15 (75.0%) |
| Legal Services & Support | 0 (0.0%) | 9 (100.0%) |
| Education Instruction & Library | 0 (0.0%) | 101 (100.0%) |
| Arts, Media & Entertainment | 15 (48.4%) | 16 (51.6%) |
| Health Diagnosing & Treating | 33 (14.8%) | 190 (85.2%) |
| Health Technologists | 19 (10.2%) | 168 (89.8%) |
| Total (Category) | 119 (22.5%) | 410 (77.5%) |
| Total (Overall) | 878 (48.0%) | 952 (52.0%) |
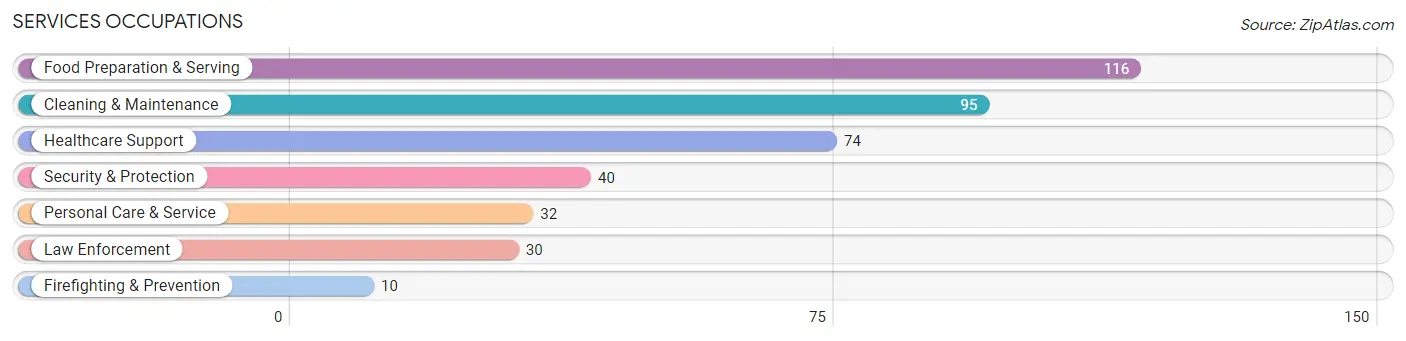
Services Occupations
The most common Services occupations in Baxter Springs are Food Preparation & Serving (116 | 6.3%), Cleaning & Maintenance (95 | 5.2%), Healthcare Support (74 | 4.0%), Security & Protection (40 | 2.2%), and Personal Care & Service (32 | 1.8%).
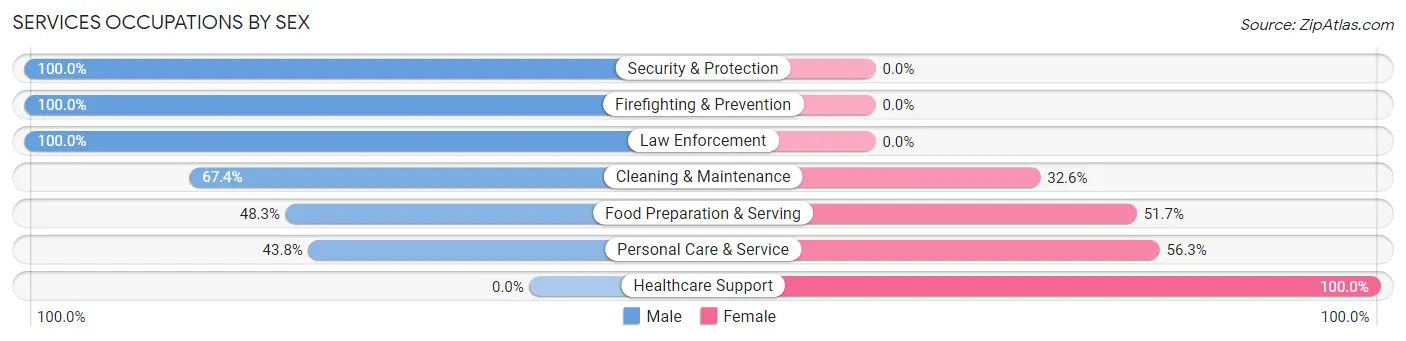
Services Occupations by Sex
Within the Services occupations in Baxter Springs, the most male-oriented occupations are Security & Protection (100.0%), Firefighting & Prevention (100.0%), and Law Enforcement (100.0%), while the most female-oriented occupations are Healthcare Support (100.0%), Personal Care & Service (56.2%), and Food Preparation & Serving (51.7%).
| Occupation | Male | Female |
| Healthcare Support | 0 (0.0%) | 74 (100.0%) |
| Security & Protection | 40 (100.0%) | 0 (0.0%) |
| Firefighting & Prevention | 10 (100.0%) | 0 (0.0%) |
| Law Enforcement | 30 (100.0%) | 0 (0.0%) |
| Food Preparation & Serving | 56 (48.3%) | 60 (51.7%) |
| Cleaning & Maintenance | 64 (67.4%) | 31 (32.6%) |
| Personal Care & Service | 14 (43.8%) | 18 (56.2%) |
| Total (Category) | 174 (48.7%) | 183 (51.3%) |
| Total (Overall) | 878 (48.0%) | 952 (52.0%) |
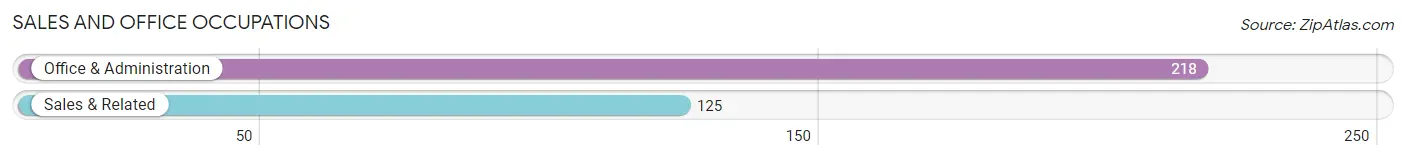
Sales and Office Occupations
The most common Sales and Office occupations in Baxter Springs are Office & Administration (218 | 11.9%), and Sales & Related (125 | 6.8%).
Sales and Office Occupations by Sex
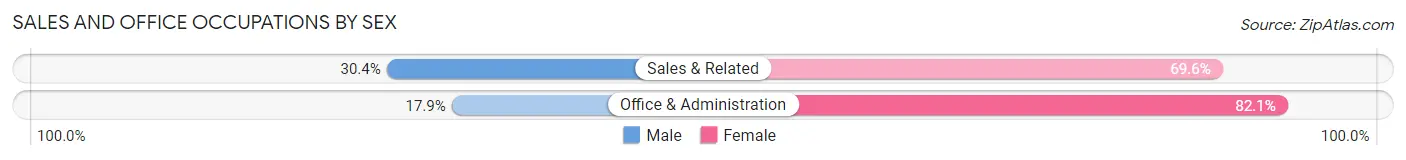
| Occupation | Male | Female |
| Sales & Related | 38 (30.4%) | 87 (69.6%) |
| Office & Administration | 39 (17.9%) | 179 (82.1%) |
| Total (Category) | 77 (22.5%) | 266 (77.5%) |
| Total (Overall) | 878 (48.0%) | 952 (52.0%) |
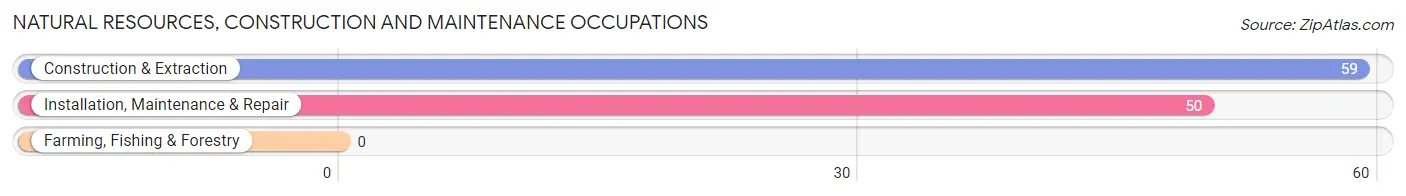
Natural Resources, Construction and Maintenance Occupations
The most common Natural Resources, Construction and Maintenance occupations in Baxter Springs are Construction & Extraction (59 | 3.2%), and Installation, Maintenance & Repair (50 | 2.7%).
Natural Resources, Construction and Maintenance Occupations by Sex
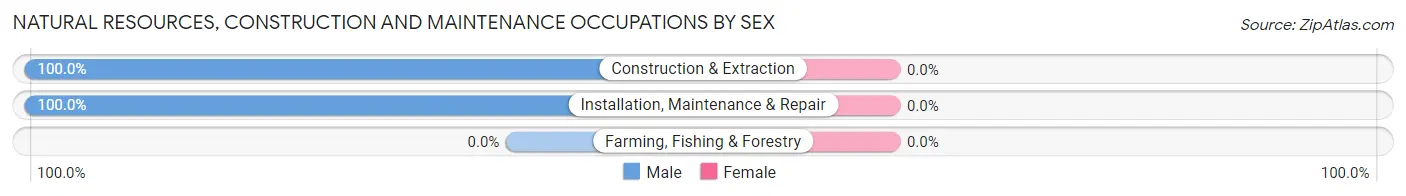
| Occupation | Male | Female |
| Farming, Fishing & Forestry | 0 (0.0%) | 0 (0.0%) |
| Construction & Extraction | 59 (100.0%) | 0 (0.0%) |
| Installation, Maintenance & Repair | 50 (100.0%) | 0 (0.0%) |
| Total (Category) | 109 (100.0%) | 0 (0.0%) |
| Total (Overall) | 878 (48.0%) | 952 (52.0%) |
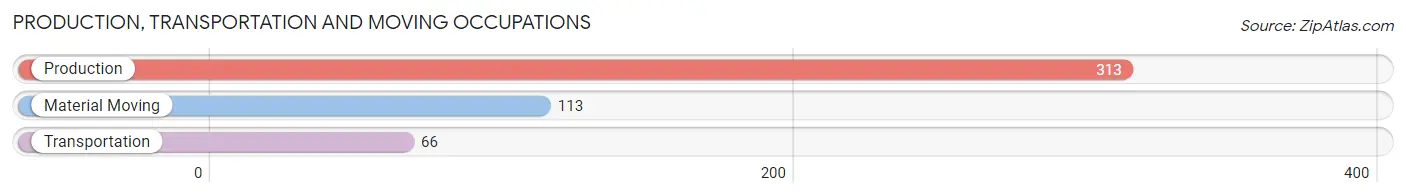
Production, Transportation and Moving Occupations
The most common Production, Transportation and Moving occupations in Baxter Springs are Production (313 | 17.1%), Material Moving (113 | 6.2%), and Transportation (66 | 3.6%).
Production, Transportation and Moving Occupations by Sex
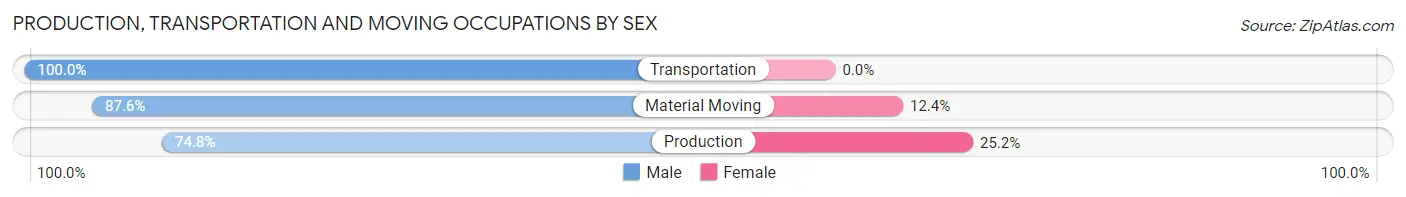
| Occupation | Male | Female |
| Production | 234 (74.8%) | 79 (25.2%) |
| Transportation | 66 (100.0%) | 0 (0.0%) |
| Material Moving | 99 (87.6%) | 14 (12.4%) |
| Total (Category) | 399 (81.1%) | 93 (18.9%) |
| Total (Overall) | 878 (48.0%) | 952 (52.0%) |
Employment Industries by Sex in Baxter Springs
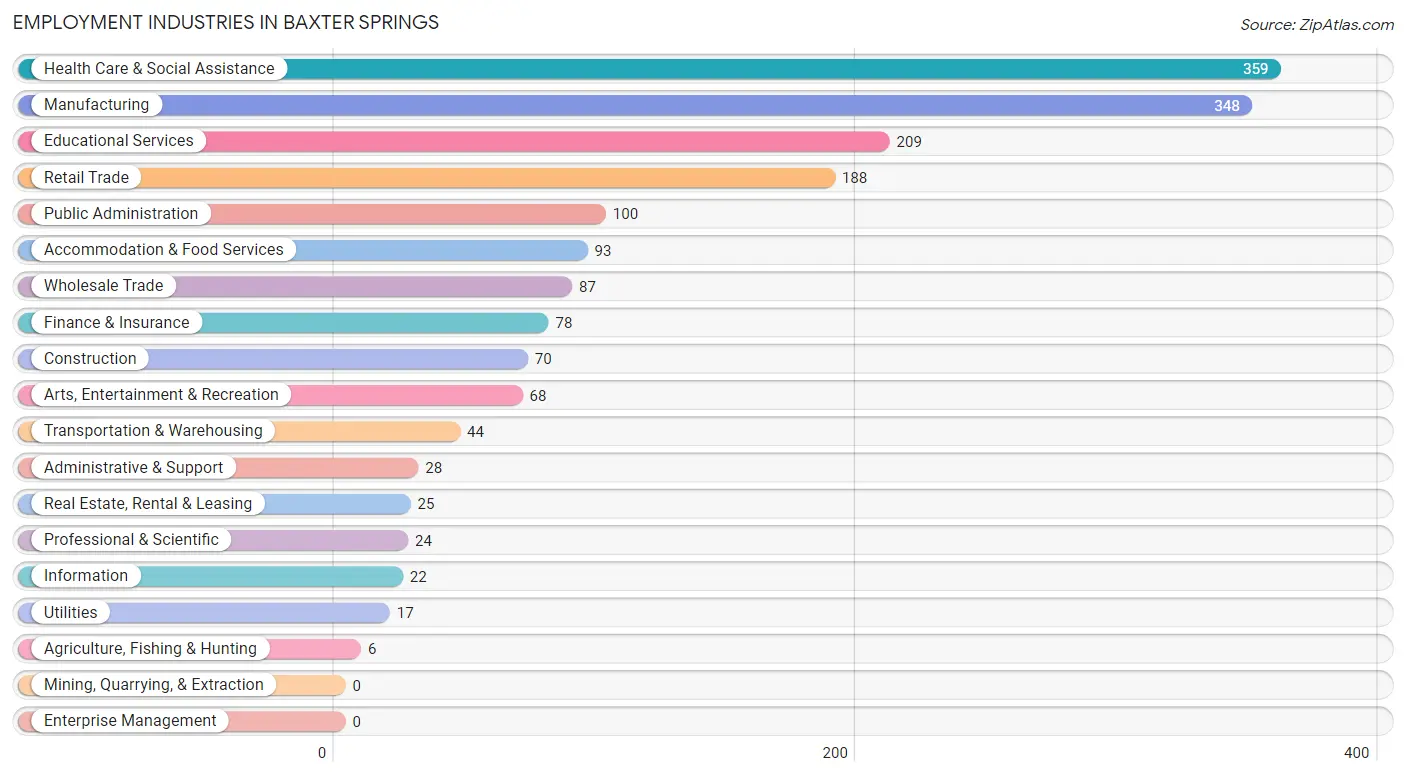
Employment Industries in Baxter Springs
The major employment industries in Baxter Springs include Health Care & Social Assistance (359 | 19.6%), Manufacturing (348 | 19.0%), Educational Services (209 | 11.4%), Retail Trade (188 | 10.3%), and Public Administration (100 | 5.5%).
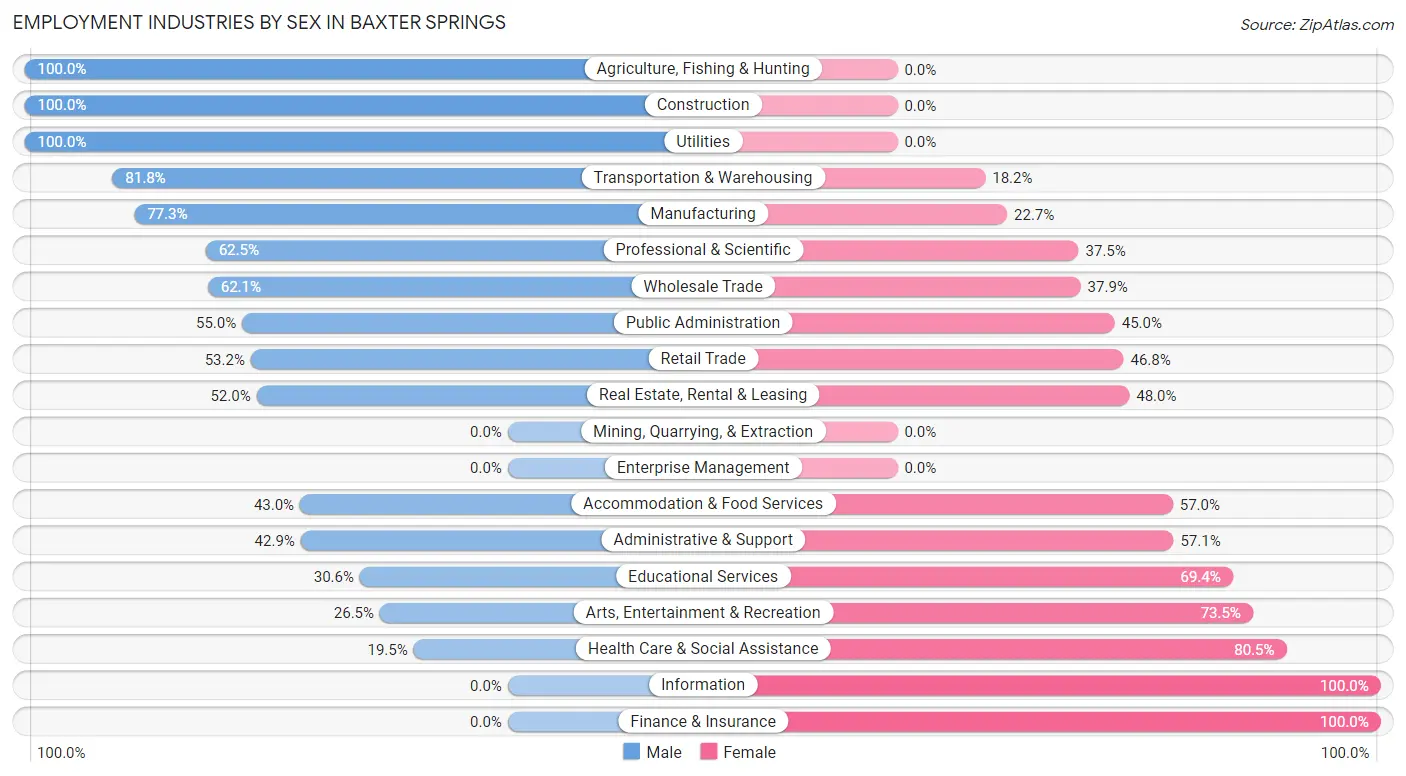
Employment Industries by Sex in Baxter Springs
The Baxter Springs industries that see more men than women are Agriculture, Fishing & Hunting (100.0%), Construction (100.0%), and Utilities (100.0%), whereas the industries that tend to have a higher number of women are Information (100.0%), Finance & Insurance (100.0%), and Health Care & Social Assistance (80.5%).
| Industry | Male | Female |
| Agriculture, Fishing & Hunting | 6 (100.0%) | 0 (0.0%) |
| Mining, Quarrying, & Extraction | 0 (0.0%) | 0 (0.0%) |
| Construction | 70 (100.0%) | 0 (0.0%) |
| Manufacturing | 269 (77.3%) | 79 (22.7%) |
| Wholesale Trade | 54 (62.1%) | 33 (37.9%) |
| Retail Trade | 100 (53.2%) | 88 (46.8%) |
| Transportation & Warehousing | 36 (81.8%) | 8 (18.2%) |
| Utilities | 17 (100.0%) | 0 (0.0%) |
| Information | 0 (0.0%) | 22 (100.0%) |
| Finance & Insurance | 0 (0.0%) | 78 (100.0%) |
| Real Estate, Rental & Leasing | 13 (52.0%) | 12 (48.0%) |
| Professional & Scientific | 15 (62.5%) | 9 (37.5%) |
| Enterprise Management | 0 (0.0%) | 0 (0.0%) |
| Administrative & Support | 12 (42.9%) | 16 (57.1%) |
| Educational Services | 64 (30.6%) | 145 (69.4%) |
| Health Care & Social Assistance | 70 (19.5%) | 289 (80.5%) |
| Arts, Entertainment & Recreation | 18 (26.5%) | 50 (73.5%) |
| Accommodation & Food Services | 40 (43.0%) | 53 (57.0%) |
| Public Administration | 55 (55.0%) | 45 (45.0%) |
| Total | 878 (48.0%) | 952 (52.0%) |
Education in Baxter Springs
School Enrollment in Baxter Springs
The most common levels of schooling among the 1,024 students in Baxter Springs are elementary school (317 | 31.0%), high school (247 | 24.1%), and middle school (160 | 15.6%).
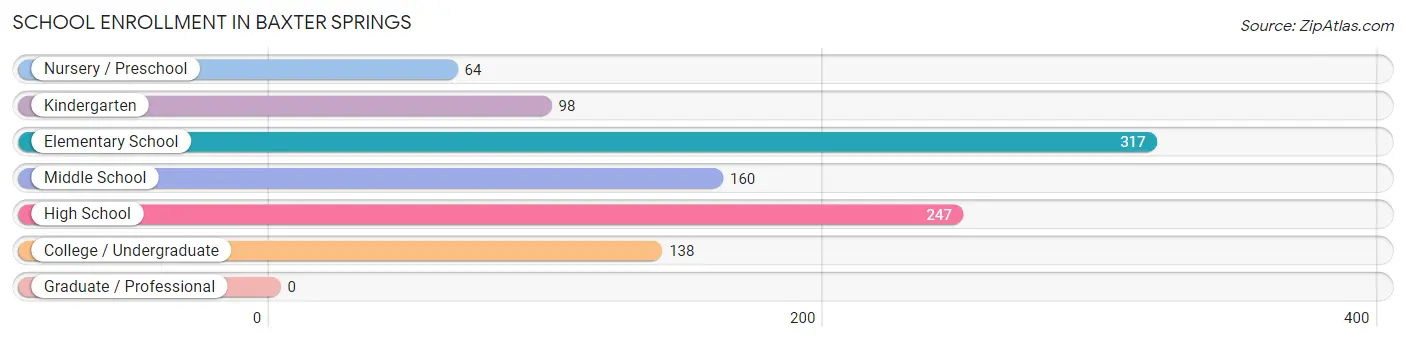
| School Level | # Students | % Students |
| Nursery / Preschool | 64 | 6.2% |
| Kindergarten | 98 | 9.6% |
| Elementary School | 317 | 31.0% |
| Middle School | 160 | 15.6% |
| High School | 247 | 24.1% |
| College / Undergraduate | 138 | 13.5% |
| Graduate / Professional | 0 | 0.0% |
| Total | 1,024 | 100.0% |
School Enrollment by Age by Funding Source in Baxter Springs
Out of a total of 1,024 students who are enrolled in schools in Baxter Springs, 66 (6.4%) attend a private institution, while the remaining 958 (93.6%) are enrolled in public schools. The age group of 20 to 24 year olds has the highest likelihood of being enrolled in private schools, with 8 (18.6% in the age bracket) enrolled. Conversely, the age group of 10 to 14 year olds has the lowest likelihood of being enrolled in a private school, with 207 (100.0% in the age bracket) attending a public institution.
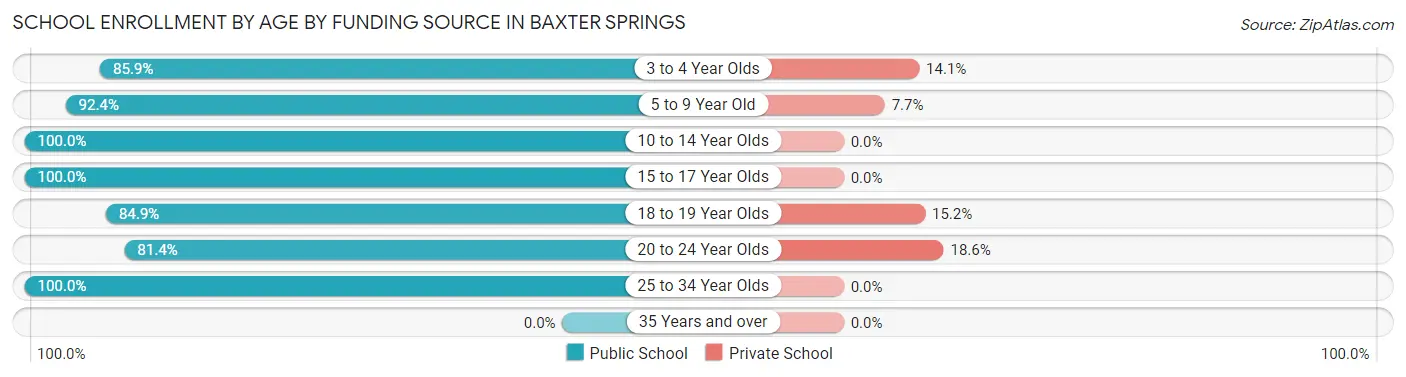
| Age Bracket | Public School | Private School |
| 3 to 4 Year Olds | 55 (85.9%) | 9 (14.1%) |
| 5 to 9 Year Old | 350 (92.3%) | 29 (7.6%) |
| 10 to 14 Year Olds | 207 (100.0%) | 0 (0.0%) |
| 15 to 17 Year Olds | 186 (100.0%) | 0 (0.0%) |
| 18 to 19 Year Olds | 112 (84.9%) | 20 (15.1%) |
| 20 to 24 Year Olds | 35 (81.4%) | 8 (18.6%) |
| 25 to 34 Year Olds | 13 (100.0%) | 0 (0.0%) |
| 35 Years and over | 0 (0.0%) | 0 (0.0%) |
| Total | 958 (93.6%) | 66 (6.4%) |
Educational Attainment by Field of Study in Baxter Springs
Science & technology (156 | 34.1%), liberal arts & history (76 | 16.6%), education (45 | 9.9%), psychology (39 | 8.5%), and business (37 | 8.1%) are the most common fields of study among 457 individuals in Baxter Springs who have obtained a bachelor's degree or higher.
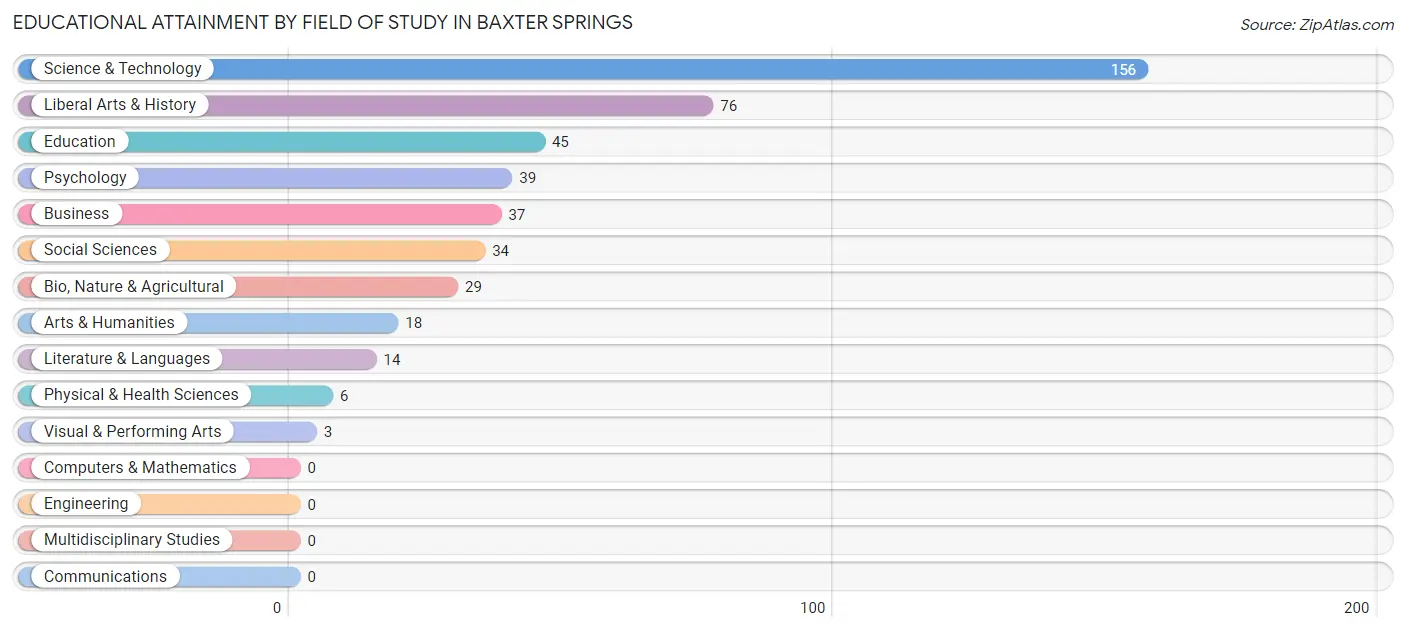
| Field of Study | # Graduates | % Graduates |
| Computers & Mathematics | 0 | 0.0% |
| Bio, Nature & Agricultural | 29 | 6.4% |
| Physical & Health Sciences | 6 | 1.3% |
| Psychology | 39 | 8.5% |
| Social Sciences | 34 | 7.4% |
| Engineering | 0 | 0.0% |
| Multidisciplinary Studies | 0 | 0.0% |
| Science & Technology | 156 | 34.1% |
| Business | 37 | 8.1% |
| Education | 45 | 9.9% |
| Literature & Languages | 14 | 3.1% |
| Liberal Arts & History | 76 | 16.6% |
| Visual & Performing Arts | 3 | 0.7% |
| Communications | 0 | 0.0% |
| Arts & Humanities | 18 | 3.9% |
| Total | 457 | 100.0% |
Transportation & Commute in Baxter Springs
Vehicle Availability by Sex in Baxter Springs
The most prevalent vehicle ownership categories in Baxter Springs are males with 2 vehicles (436, accounting for 50.6%) and females with 2 vehicles (432, making up 46.0%).
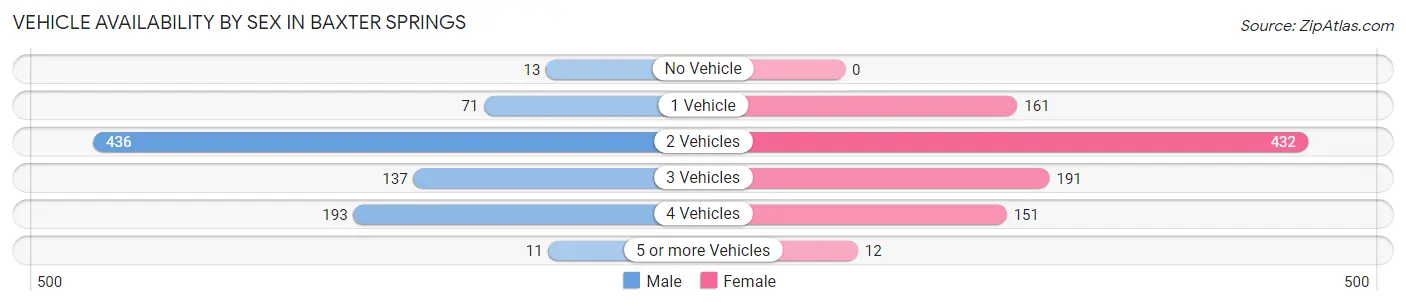
| Vehicles Available | Male | Female |
| No Vehicle | 13 (1.5%) | 0 (0.0%) |
| 1 Vehicle | 71 (8.3%) | 161 (17.0%) |
| 2 Vehicles | 436 (50.6%) | 432 (45.6%) |
| 3 Vehicles | 137 (15.9%) | 191 (20.2%) |
| 4 Vehicles | 193 (22.4%) | 151 (16.0%) |
| 5 or more Vehicles | 11 (1.3%) | 12 (1.3%) |
| Total | 861 (100.0%) | 947 (100.0%) |
Commute Time in Baxter Springs
The most frequently occuring commute durations in Baxter Springs are 20 to 24 minutes (517 commuters, 29.2%), 30 to 34 minutes (363 commuters, 20.5%), and 5 to 9 minutes (210 commuters, 11.9%).
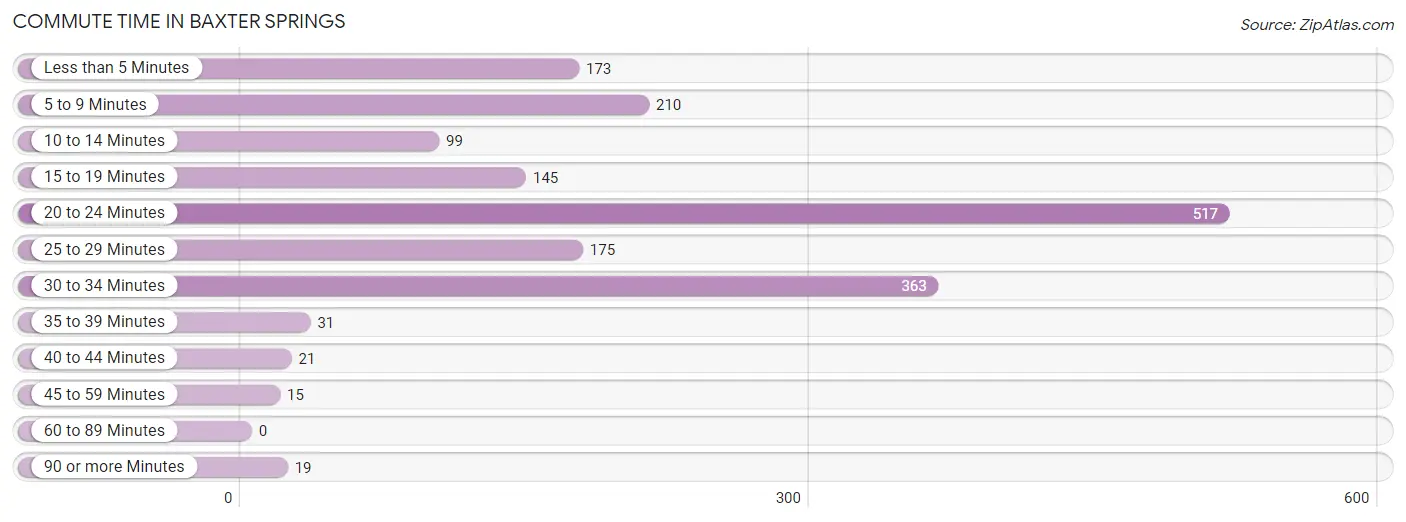
| Commute Time | # Commuters | % Commuters |
| Less than 5 Minutes | 173 | 9.8% |
| 5 to 9 Minutes | 210 | 11.9% |
| 10 to 14 Minutes | 99 | 5.6% |
| 15 to 19 Minutes | 145 | 8.2% |
| 20 to 24 Minutes | 517 | 29.2% |
| 25 to 29 Minutes | 175 | 9.9% |
| 30 to 34 Minutes | 363 | 20.5% |
| 35 to 39 Minutes | 31 | 1.8% |
| 40 to 44 Minutes | 21 | 1.2% |
| 45 to 59 Minutes | 15 | 0.9% |
| 60 to 89 Minutes | 0 | 0.0% |
| 90 or more Minutes | 19 | 1.1% |
Commute Time by Sex in Baxter Springs
The most common commute times in Baxter Springs are 20 to 24 minutes (228 commuters, 27.0%) for males and 20 to 24 minutes (289 commuters, 31.3%) for females.
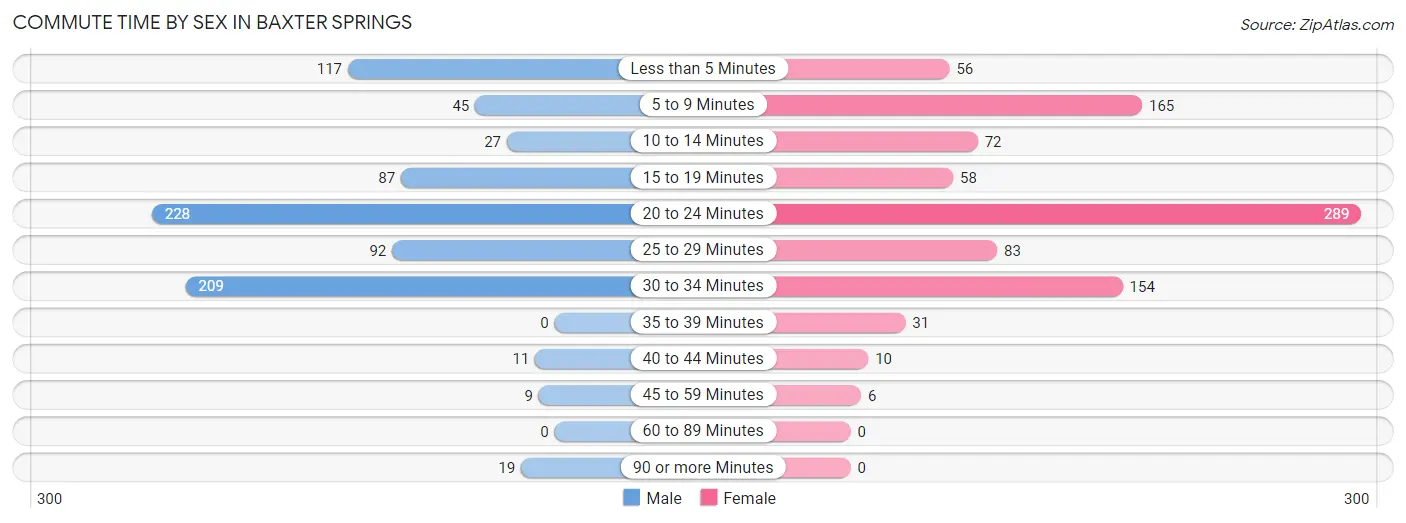
| Commute Time | Male | Female |
| Less than 5 Minutes | 117 (13.9%) | 56 (6.1%) |
| 5 to 9 Minutes | 45 (5.3%) | 165 (17.9%) |
| 10 to 14 Minutes | 27 (3.2%) | 72 (7.8%) |
| 15 to 19 Minutes | 87 (10.3%) | 58 (6.3%) |
| 20 to 24 Minutes | 228 (27.0%) | 289 (31.3%) |
| 25 to 29 Minutes | 92 (10.9%) | 83 (9.0%) |
| 30 to 34 Minutes | 209 (24.8%) | 154 (16.7%) |
| 35 to 39 Minutes | 0 (0.0%) | 31 (3.4%) |
| 40 to 44 Minutes | 11 (1.3%) | 10 (1.1%) |
| 45 to 59 Minutes | 9 (1.1%) | 6 (0.6%) |
| 60 to 89 Minutes | 0 (0.0%) | 0 (0.0%) |
| 90 or more Minutes | 19 (2.2%) | 0 (0.0%) |
Time of Departure to Work by Sex in Baxter Springs
The most frequent times of departure to work in Baxter Springs are 12:00 PM to 3:59 PM (176, 20.8%) for males and 6:30 AM to 6:59 AM (183, 19.8%) for females.
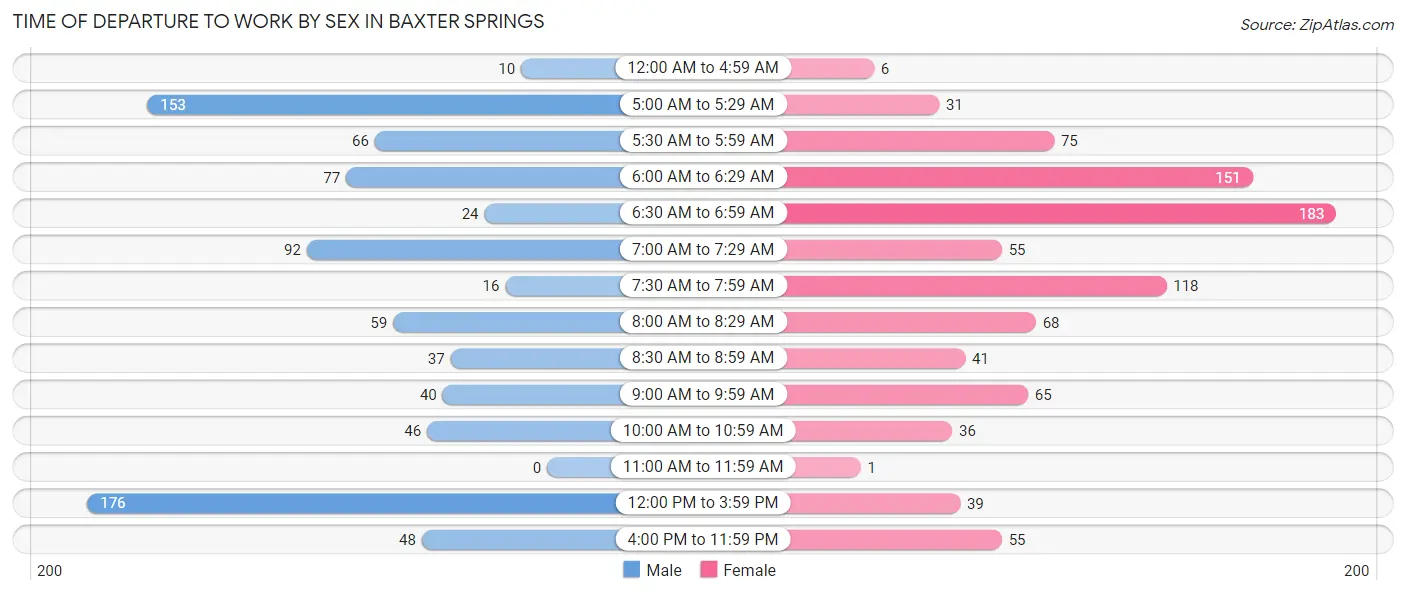
| Time of Departure | Male | Female |
| 12:00 AM to 4:59 AM | 10 (1.2%) | 6 (0.6%) |
| 5:00 AM to 5:29 AM | 153 (18.1%) | 31 (3.4%) |
| 5:30 AM to 5:59 AM | 66 (7.8%) | 75 (8.1%) |
| 6:00 AM to 6:29 AM | 77 (9.1%) | 151 (16.3%) |
| 6:30 AM to 6:59 AM | 24 (2.8%) | 183 (19.8%) |
| 7:00 AM to 7:29 AM | 92 (10.9%) | 55 (5.9%) |
| 7:30 AM to 7:59 AM | 16 (1.9%) | 118 (12.8%) |
| 8:00 AM to 8:29 AM | 59 (7.0%) | 68 (7.4%) |
| 8:30 AM to 8:59 AM | 37 (4.4%) | 41 (4.4%) |
| 9:00 AM to 9:59 AM | 40 (4.7%) | 65 (7.0%) |
| 10:00 AM to 10:59 AM | 46 (5.4%) | 36 (3.9%) |
| 11:00 AM to 11:59 AM | 0 (0.0%) | 1 (0.1%) |
| 12:00 PM to 3:59 PM | 176 (20.8%) | 39 (4.2%) |
| 4:00 PM to 11:59 PM | 48 (5.7%) | 55 (5.9%) |
| Total | 844 (100.0%) | 924 (100.0%) |
Housing Occupancy in Baxter Springs
Occupancy by Ownership in Baxter Springs
Of the total 1,450 dwellings in Baxter Springs, owner-occupied units account for 977 (67.4%), while renter-occupied units make up 473 (32.6%).
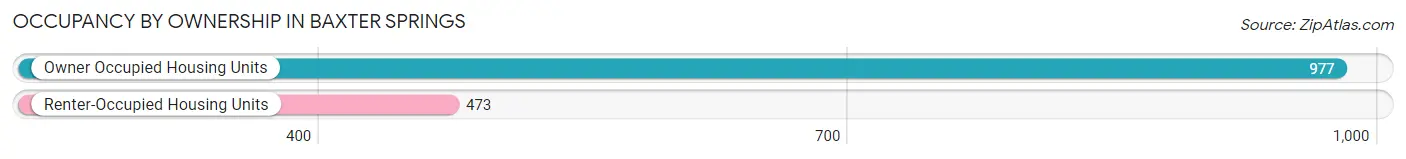
| Occupancy | # Housing Units | % Housing Units |
| Owner Occupied Housing Units | 977 | 67.4% |
| Renter-Occupied Housing Units | 473 | 32.6% |
| Total Occupied Housing Units | 1,450 | 100.0% |
Occupancy by Household Size in Baxter Springs
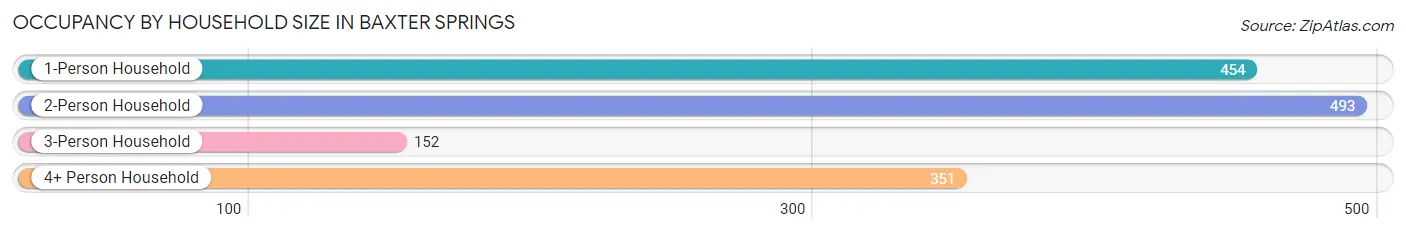
| Household Size | # Housing Units | % Housing Units |
| 1-Person Household | 454 | 31.3% |
| 2-Person Household | 493 | 34.0% |
| 3-Person Household | 152 | 10.5% |
| 4+ Person Household | 351 | 24.2% |
| Total Housing Units | 1,450 | 100.0% |
Occupancy by Ownership by Household Size in Baxter Springs
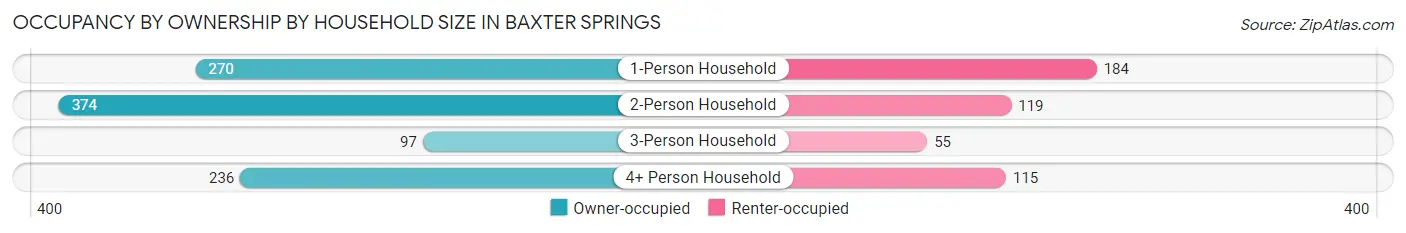
| Household Size | Owner-occupied | Renter-occupied |
| 1-Person Household | 270 (59.5%) | 184 (40.5%) |
| 2-Person Household | 374 (75.9%) | 119 (24.1%) |
| 3-Person Household | 97 (63.8%) | 55 (36.2%) |
| 4+ Person Household | 236 (67.2%) | 115 (32.8%) |
| Total Housing Units | 977 (67.4%) | 473 (32.6%) |
Occupancy by Educational Attainment in Baxter Springs
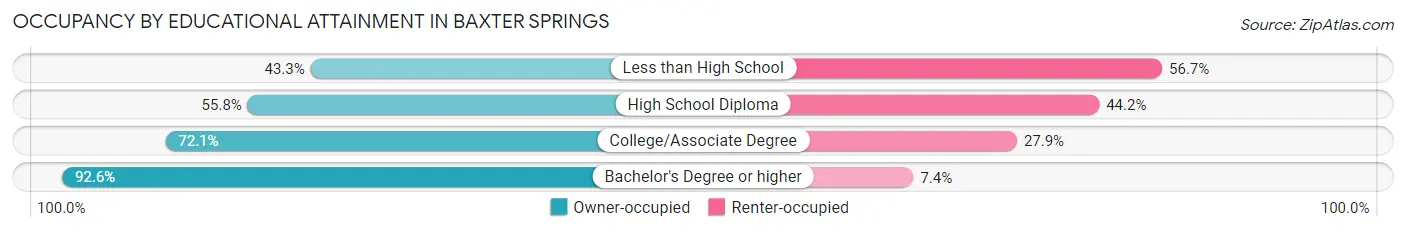
| Household Size | Owner-occupied | Renter-occupied |
| Less than High School | 55 (43.3%) | 72 (56.7%) |
| High School Diploma | 203 (55.8%) | 161 (44.2%) |
| College/Associate Degree | 594 (72.1%) | 230 (27.9%) |
| Bachelor's Degree or higher | 125 (92.6%) | 10 (7.4%) |
Occupancy by Age of Householder in Baxter Springs
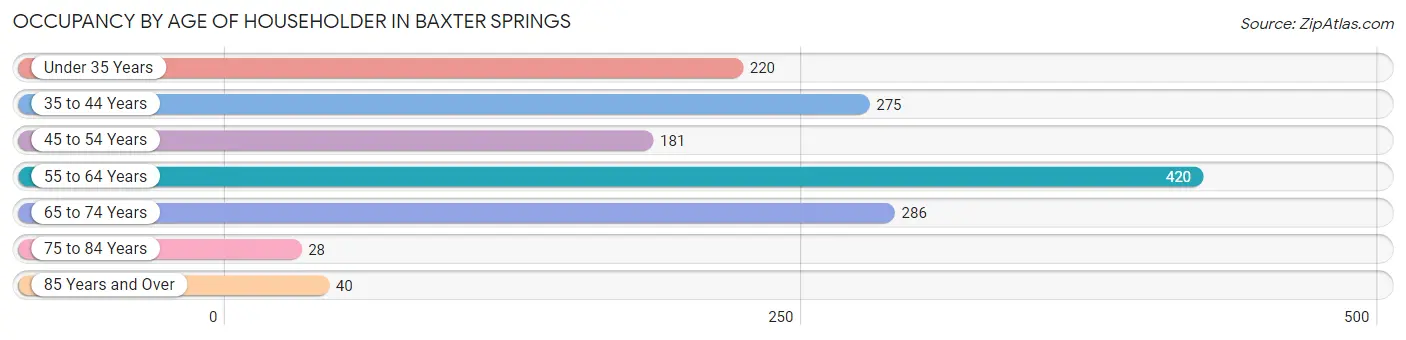
| Age Bracket | # Households | % Households |
| Under 35 Years | 220 | 15.2% |
| 35 to 44 Years | 275 | 19.0% |
| 45 to 54 Years | 181 | 12.5% |
| 55 to 64 Years | 420 | 29.0% |
| 65 to 74 Years | 286 | 19.7% |
| 75 to 84 Years | 28 | 1.9% |
| 85 Years and Over | 40 | 2.8% |
| Total | 1,450 | 100.0% |
Housing Finances in Baxter Springs
Median Income by Occupancy in Baxter Springs
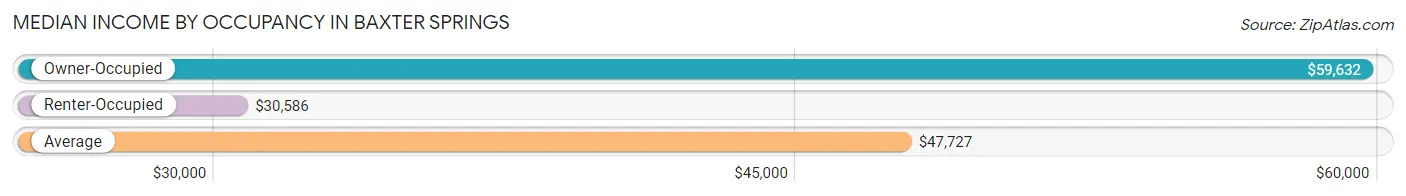
| Occupancy Type | # Households | Median Income |
| Owner-Occupied | 977 (67.4%) | $59,632 |
| Renter-Occupied | 473 (32.6%) | $30,586 |
| Average | 1,450 (100.0%) | $47,727 |
Occupancy by Householder Income Bracket in Baxter Springs
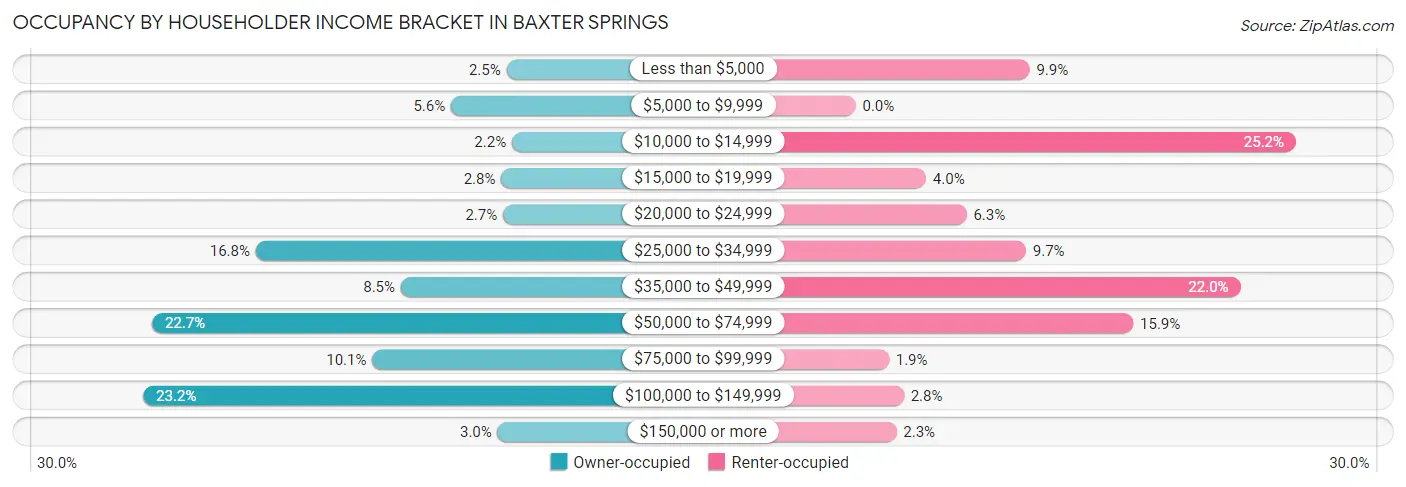
| Income Bracket | Owner-occupied | Renter-occupied |
| Less than $5,000 | 24 (2.5%) | 47 (9.9%) |
| $5,000 to $9,999 | 55 (5.6%) | 0 (0.0%) |
| $10,000 to $14,999 | 21 (2.1%) | 119 (25.2%) |
| $15,000 to $19,999 | 27 (2.8%) | 19 (4.0%) |
| $20,000 to $24,999 | 26 (2.7%) | 30 (6.3%) |
| $25,000 to $34,999 | 164 (16.8%) | 46 (9.7%) |
| $35,000 to $49,999 | 83 (8.5%) | 104 (22.0%) |
| $50,000 to $74,999 | 222 (22.7%) | 75 (15.9%) |
| $75,000 to $99,999 | 99 (10.1%) | 9 (1.9%) |
| $100,000 to $149,999 | 227 (23.2%) | 13 (2.8%) |
| $150,000 or more | 29 (3.0%) | 11 (2.3%) |
| Total | 977 (100.0%) | 473 (100.0%) |
Monthly Housing Cost Tiers in Baxter Springs
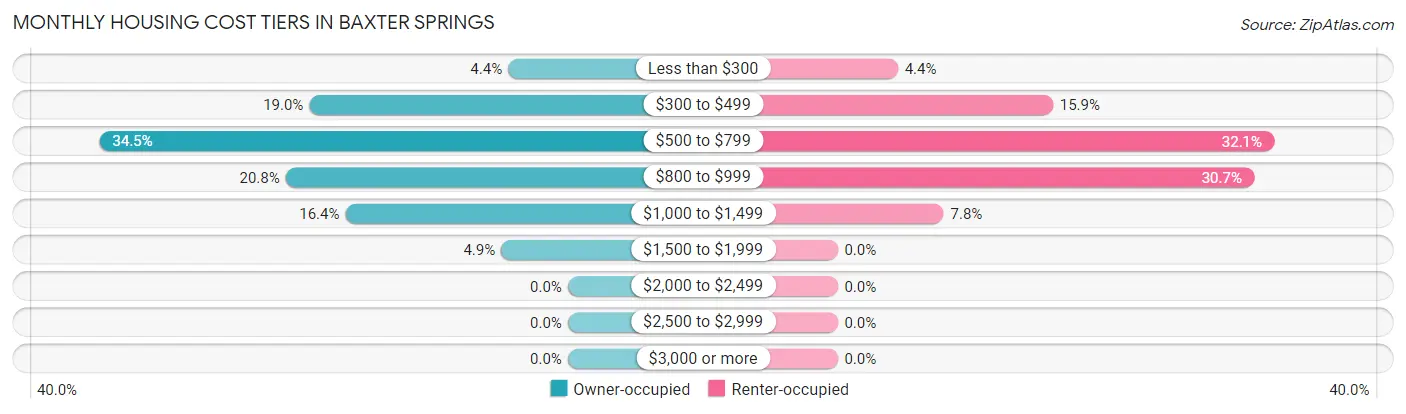
| Monthly Cost | Owner-occupied | Renter-occupied |
| Less than $300 | 43 (4.4%) | 21 (4.4%) |
| $300 to $499 | 186 (19.0%) | 75 (15.9%) |
| $500 to $799 | 337 (34.5%) | 152 (32.1%) |
| $800 to $999 | 203 (20.8%) | 145 (30.7%) |
| $1,000 to $1,499 | 160 (16.4%) | 37 (7.8%) |
| $1,500 to $1,999 | 48 (4.9%) | 0 (0.0%) |
| $2,000 to $2,499 | 0 (0.0%) | 0 (0.0%) |
| $2,500 to $2,999 | 0 (0.0%) | 0 (0.0%) |
| $3,000 or more | 0 (0.0%) | 0 (0.0%) |
| Total | 977 (100.0%) | 473 (100.0%) |
Physical Housing Characteristics in Baxter Springs
Housing Structures in Baxter Springs
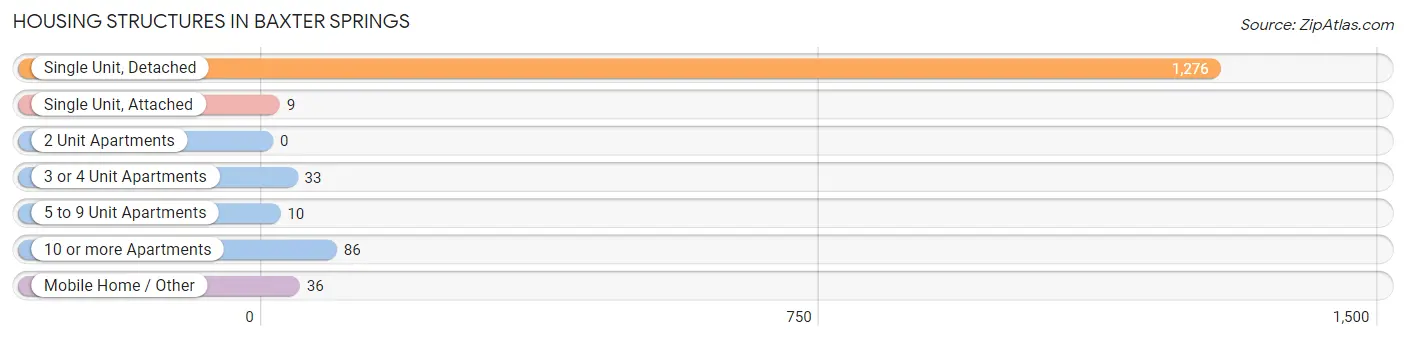
| Structure Type | # Housing Units | % Housing Units |
| Single Unit, Detached | 1,276 | 88.0% |
| Single Unit, Attached | 9 | 0.6% |
| 2 Unit Apartments | 0 | 0.0% |
| 3 or 4 Unit Apartments | 33 | 2.3% |
| 5 to 9 Unit Apartments | 10 | 0.7% |
| 10 or more Apartments | 86 | 5.9% |
| Mobile Home / Other | 36 | 2.5% |
| Total | 1,450 | 100.0% |
Housing Structures by Occupancy in Baxter Springs

| Structure Type | Owner-occupied | Renter-occupied |
| Single Unit, Detached | 950 (74.5%) | 326 (25.6%) |
| Single Unit, Attached | 0 (0.0%) | 9 (100.0%) |
| 2 Unit Apartments | 0 (0.0%) | 0 (0.0%) |
| 3 or 4 Unit Apartments | 0 (0.0%) | 33 (100.0%) |
| 5 to 9 Unit Apartments | 0 (0.0%) | 10 (100.0%) |
| 10 or more Apartments | 0 (0.0%) | 86 (100.0%) |
| Mobile Home / Other | 27 (75.0%) | 9 (25.0%) |
| Total | 977 (67.4%) | 473 (32.6%) |
Housing Structures by Number of Rooms in Baxter Springs
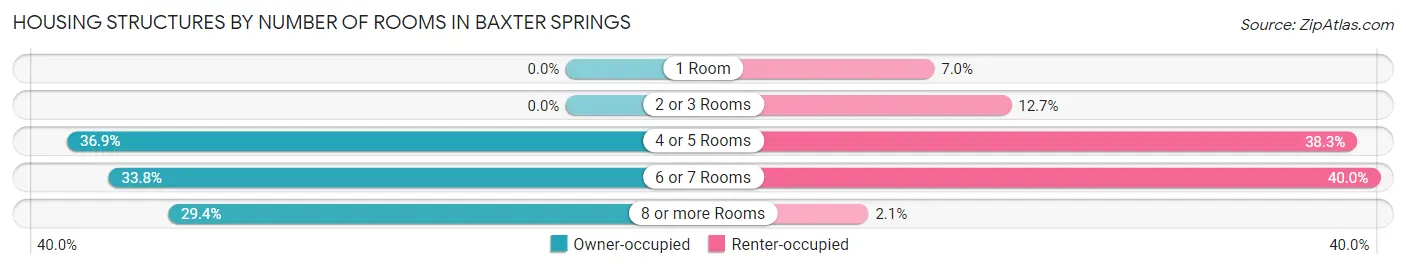
| Number of Rooms | Owner-occupied | Renter-occupied |
| 1 Room | 0 (0.0%) | 33 (7.0%) |
| 2 or 3 Rooms | 0 (0.0%) | 60 (12.7%) |
| 4 or 5 Rooms | 360 (36.8%) | 181 (38.3%) |
| 6 or 7 Rooms | 330 (33.8%) | 189 (40.0%) |
| 8 or more Rooms | 287 (29.4%) | 10 (2.1%) |
| Total | 977 (100.0%) | 473 (100.0%) |
Housing Structure by Heating Type in Baxter Springs
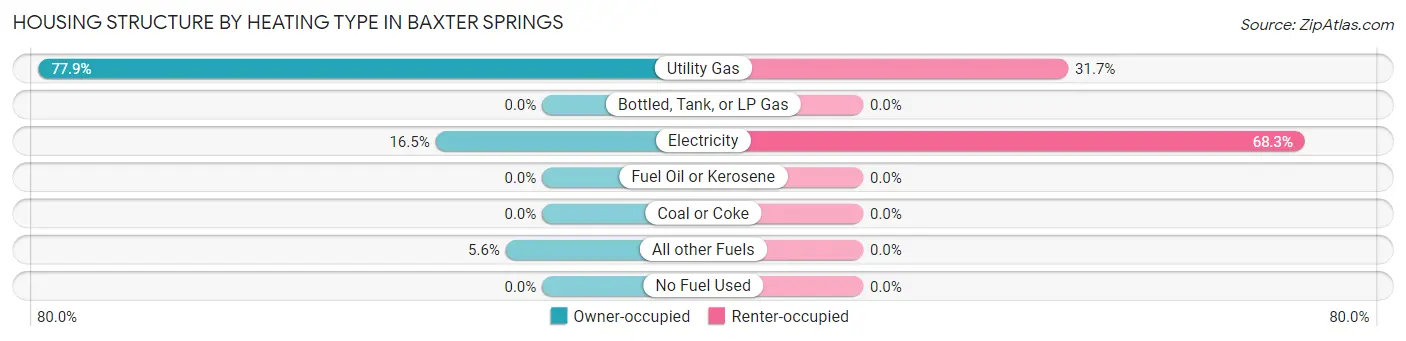
| Heating Type | Owner-occupied | Renter-occupied |
| Utility Gas | 761 (77.9%) | 150 (31.7%) |
| Bottled, Tank, or LP Gas | 0 (0.0%) | 0 (0.0%) |
| Electricity | 161 (16.5%) | 323 (68.3%) |
| Fuel Oil or Kerosene | 0 (0.0%) | 0 (0.0%) |
| Coal or Coke | 0 (0.0%) | 0 (0.0%) |
| All other Fuels | 55 (5.6%) | 0 (0.0%) |
| No Fuel Used | 0 (0.0%) | 0 (0.0%) |
| Total | 977 (100.0%) | 473 (100.0%) |
Household Vehicle Usage in Baxter Springs
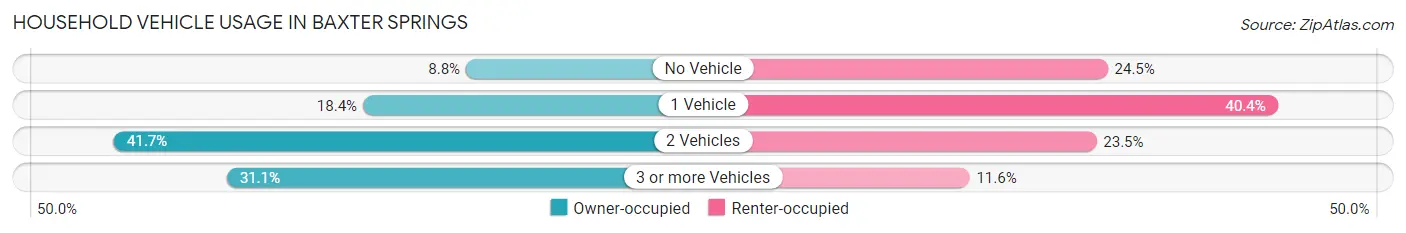
| Vehicles per Household | Owner-occupied | Renter-occupied |
| No Vehicle | 86 (8.8%) | 116 (24.5%) |
| 1 Vehicle | 180 (18.4%) | 191 (40.4%) |
| 2 Vehicles | 407 (41.7%) | 111 (23.5%) |
| 3 or more Vehicles | 304 (31.1%) | 55 (11.6%) |
| Total | 977 (100.0%) | 473 (100.0%) |
Real Estate & Mortgages in Baxter Springs
Real Estate and Mortgage Overview in Baxter Springs
| Characteristic | Without Mortgage | With Mortgage |
| Housing Units | 481 | 496 |
| Median Property Value | $82,900 | $89,500 |
| Median Household Income | $58,808 | $29 |
| Monthly Housing Costs | $517 | $0 |
| Real Estate Taxes | $996 | $9 |
Property Value by Mortgage Status in Baxter Springs
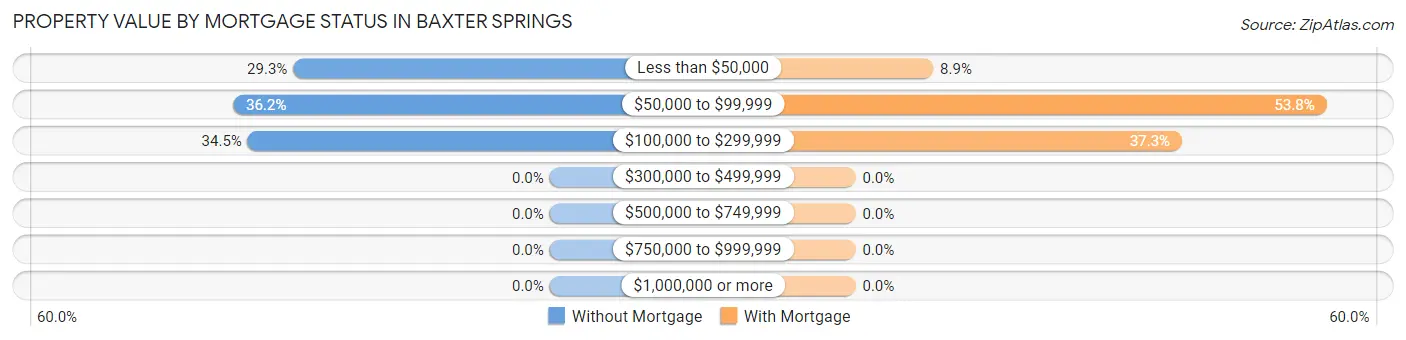
| Property Value | Without Mortgage | With Mortgage |
| Less than $50,000 | 141 (29.3%) | 44 (8.9%) |
| $50,000 to $99,999 | 174 (36.2%) | 267 (53.8%) |
| $100,000 to $299,999 | 166 (34.5%) | 185 (37.3%) |
| $300,000 to $499,999 | 0 (0.0%) | 0 (0.0%) |
| $500,000 to $749,999 | 0 (0.0%) | 0 (0.0%) |
| $750,000 to $999,999 | 0 (0.0%) | 0 (0.0%) |
| $1,000,000 or more | 0 (0.0%) | 0 (0.0%) |
| Total | 481 (100.0%) | 496 (100.0%) |
Household Income by Mortgage Status in Baxter Springs
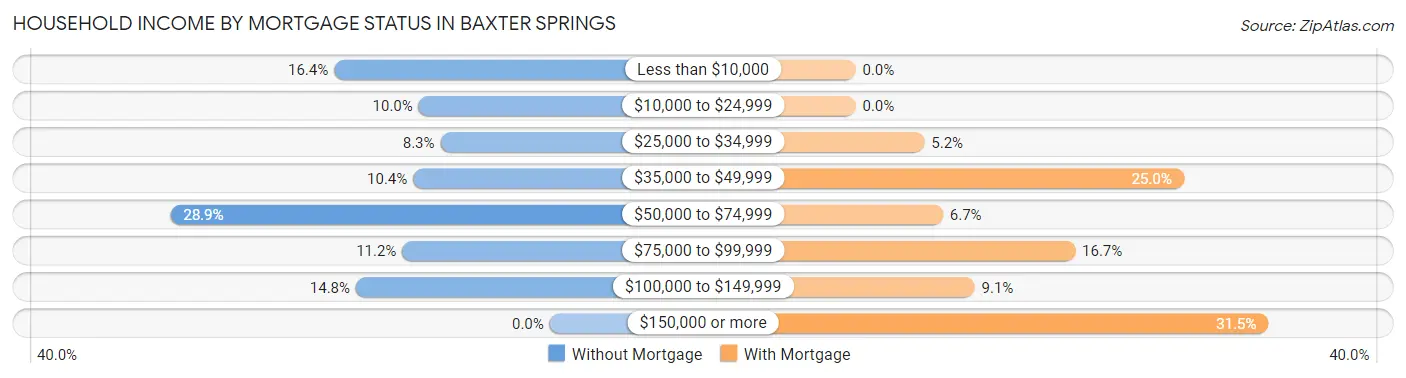
| Household Income | Without Mortgage | With Mortgage |
| Less than $10,000 | 79 (16.4%) | 0 (0.0%) |
| $10,000 to $24,999 | 48 (10.0%) | 0 (0.0%) |
| $25,000 to $34,999 | 40 (8.3%) | 26 (5.2%) |
| $35,000 to $49,999 | 50 (10.4%) | 124 (25.0%) |
| $50,000 to $74,999 | 139 (28.9%) | 33 (6.7%) |
| $75,000 to $99,999 | 54 (11.2%) | 83 (16.7%) |
| $100,000 to $149,999 | 71 (14.8%) | 45 (9.1%) |
| $150,000 or more | 0 (0.0%) | 156 (31.5%) |
| Total | 481 (100.0%) | 496 (100.0%) |
Property Value to Household Income Ratio in Baxter Springs
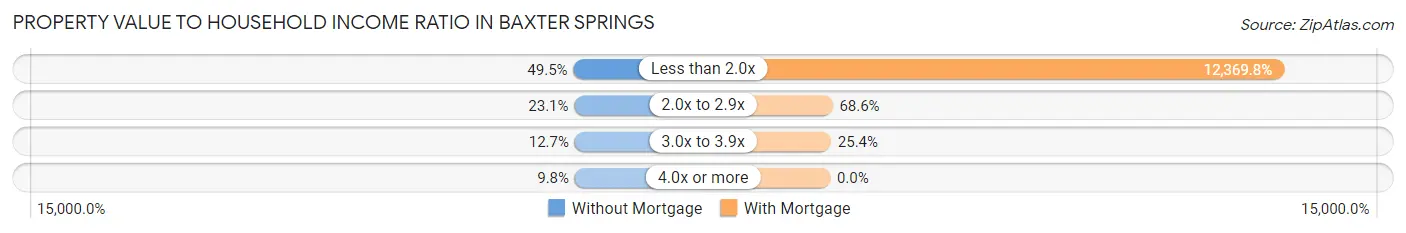
| Value-to-Income Ratio | Without Mortgage | With Mortgage |
| Less than 2.0x | 238 (49.5%) | 61,354 (12,369.8%) |
| 2.0x to 2.9x | 111 (23.1%) | 340 (68.5%) |
| 3.0x to 3.9x | 61 (12.7%) | 126 (25.4%) |
| 4.0x or more | 47 (9.8%) | 0 (0.0%) |
| Total | 481 (100.0%) | 496 (100.0%) |
Real Estate Taxes by Mortgage Status in Baxter Springs
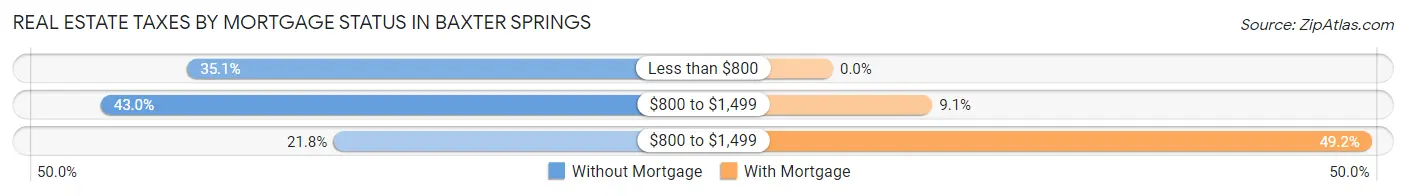
| Property Taxes | Without Mortgage | With Mortgage |
| Less than $800 | 169 (35.1%) | 0 (0.0%) |
| $800 to $1,499 | 207 (43.0%) | 45 (9.1%) |
| $800 to $1,499 | 105 (21.8%) | 244 (49.2%) |
| Total | 481 (100.0%) | 496 (100.0%) |
Health & Disability in Baxter Springs
Health Insurance Coverage by Age in Baxter Springs
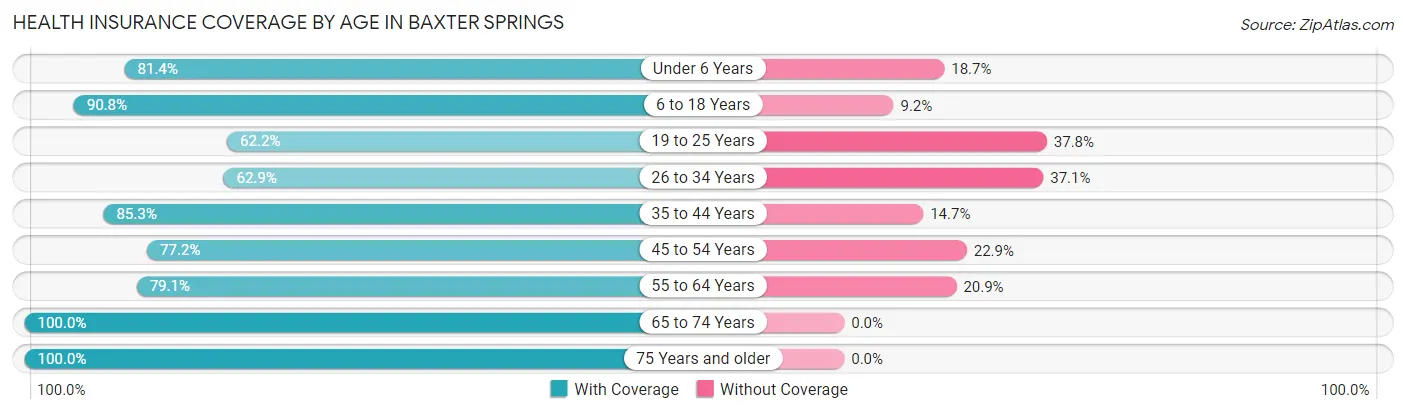
| Age Bracket | With Coverage | Without Coverage |
| Under 6 Years | 266 (81.4%) | 61 (18.6%) |
| 6 to 18 Years | 772 (90.8%) | 78 (9.2%) |
| 19 to 25 Years | 168 (62.2%) | 102 (37.8%) |
| 26 to 34 Years | 239 (62.9%) | 141 (37.1%) |
| 35 to 44 Years | 452 (85.3%) | 78 (14.7%) |
| 45 to 54 Years | 260 (77.1%) | 77 (22.9%) |
| 55 to 64 Years | 541 (79.1%) | 143 (20.9%) |
| 65 to 74 Years | 401 (100.0%) | 0 (0.0%) |
| 75 Years and older | 101 (100.0%) | 0 (0.0%) |
| Total | 3,200 (82.5%) | 680 (17.5%) |
Health Insurance Coverage by Citizenship Status in Baxter Springs
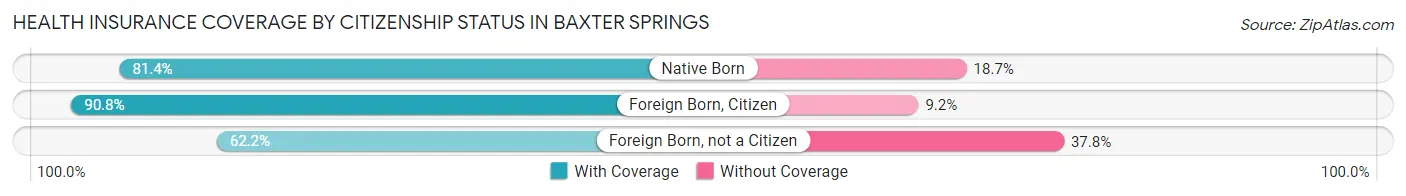
| Citizenship Status | With Coverage | Without Coverage |
| Native Born | 266 (81.4%) | 61 (18.6%) |
| Foreign Born, Citizen | 772 (90.8%) | 78 (9.2%) |
| Foreign Born, not a Citizen | 168 (62.2%) | 102 (37.8%) |
Health Insurance Coverage by Household Income in Baxter Springs
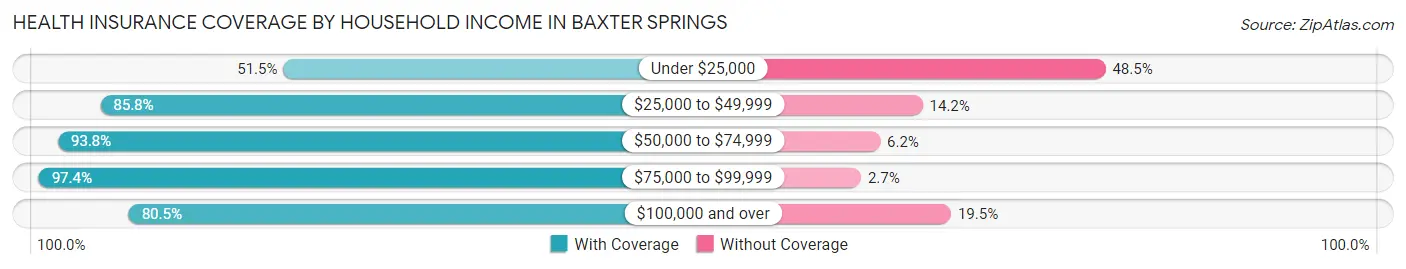
| Household Income | With Coverage | Without Coverage |
| Under $25,000 | 303 (51.5%) | 285 (48.5%) |
| $25,000 to $49,999 | 828 (85.8%) | 137 (14.2%) |
| $50,000 to $74,999 | 917 (93.8%) | 61 (6.2%) |
| $75,000 to $99,999 | 331 (97.4%) | 9 (2.6%) |
| $100,000 and over | 775 (80.5%) | 188 (19.5%) |
Public vs Private Health Insurance Coverage by Age in Baxter Springs
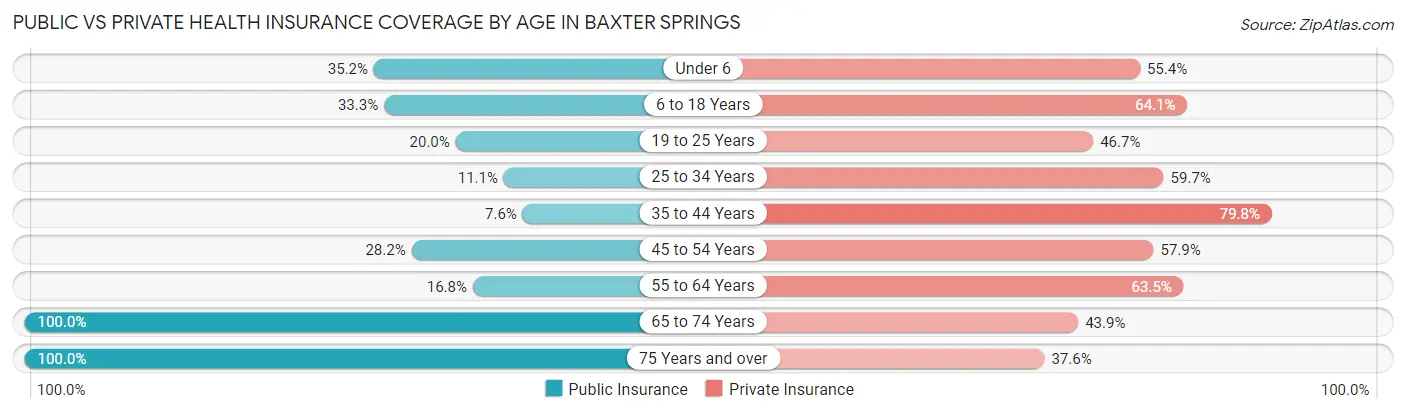
| Age Bracket | Public Insurance | Private Insurance |
| Under 6 | 115 (35.2%) | 181 (55.3%) |
| 6 to 18 Years | 283 (33.3%) | 545 (64.1%) |
| 19 to 25 Years | 54 (20.0%) | 126 (46.7%) |
| 25 to 34 Years | 42 (11.1%) | 227 (59.7%) |
| 35 to 44 Years | 40 (7.5%) | 423 (79.8%) |
| 45 to 54 Years | 95 (28.2%) | 195 (57.9%) |
| 55 to 64 Years | 115 (16.8%) | 434 (63.4%) |
| 65 to 74 Years | 401 (100.0%) | 176 (43.9%) |
| 75 Years and over | 101 (100.0%) | 38 (37.6%) |
| Total | 1,246 (32.1%) | 2,345 (60.4%) |
Disability Status by Sex by Age in Baxter Springs
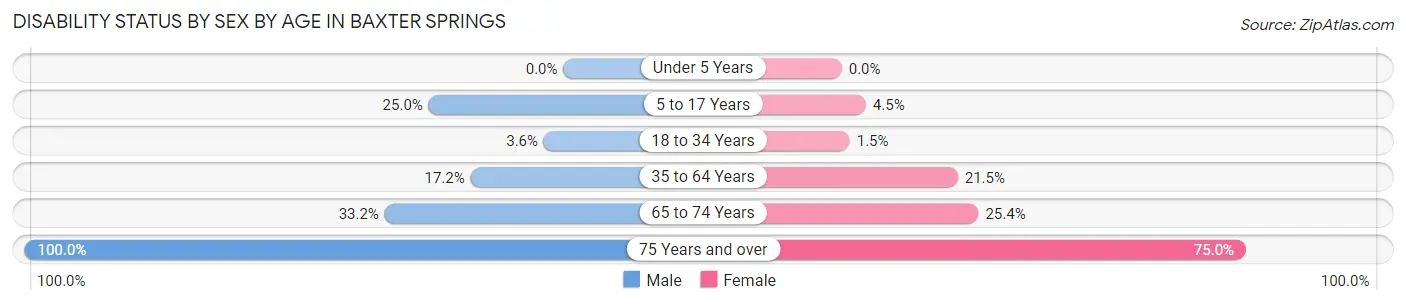
| Age Bracket | Male | Female |
| Under 5 Years | 0 (0.0%) | 0 (0.0%) |
| 5 to 17 Years | 86 (25.0%) | 20 (4.5%) |
| 18 to 34 Years | 16 (3.6%) | 5 (1.5%) |
| 35 to 64 Years | 128 (17.2%) | 174 (21.5%) |
| 65 to 74 Years | 65 (33.2%) | 52 (25.4%) |
| 75 Years and over | 49 (100.0%) | 39 (75.0%) |
Disability Class by Sex by Age in Baxter Springs
Disability Class: Hearing Difficulty
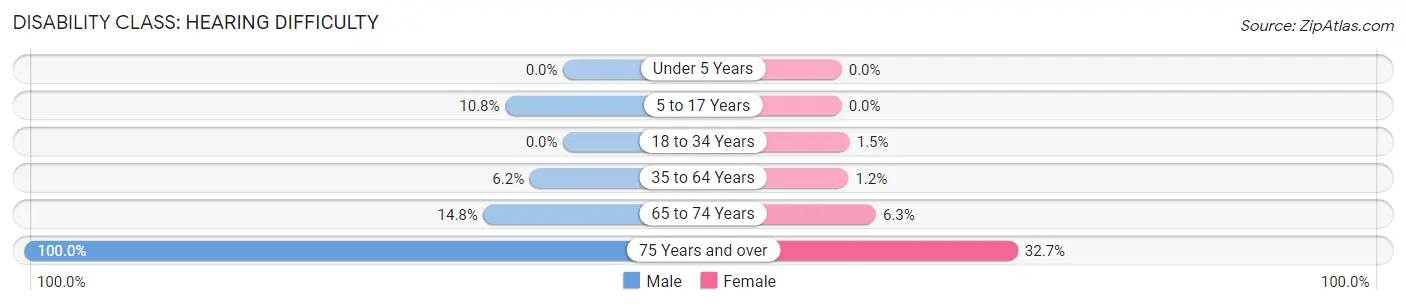
| Age Bracket | Male | Female |
| Under 5 Years | 0 (0.0%) | 0 (0.0%) |
| 5 to 17 Years | 37 (10.8%) | 0 (0.0%) |
| 18 to 34 Years | 0 (0.0%) | 5 (1.5%) |
| 35 to 64 Years | 46 (6.2%) | 10 (1.2%) |
| 65 to 74 Years | 29 (14.8%) | 13 (6.3%) |
| 75 Years and over | 49 (100.0%) | 17 (32.7%) |
Disability Class: Vision Difficulty
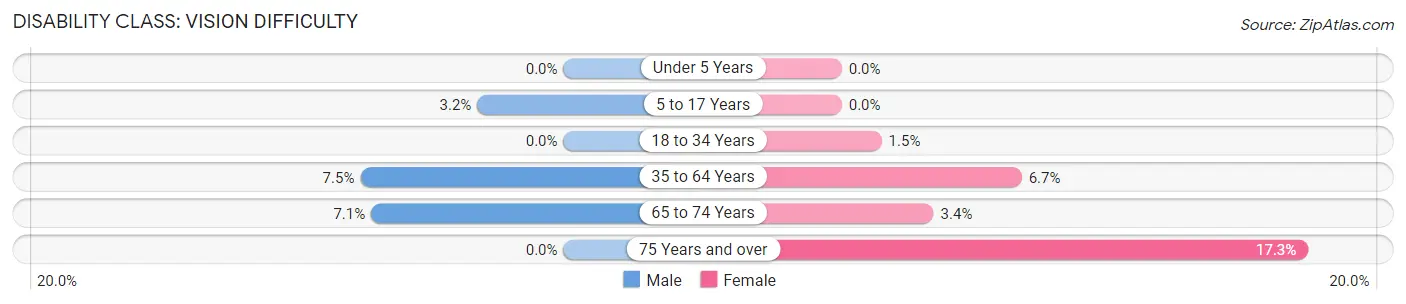
| Age Bracket | Male | Female |
| Under 5 Years | 0 (0.0%) | 0 (0.0%) |
| 5 to 17 Years | 11 (3.2%) | 0 (0.0%) |
| 18 to 34 Years | 0 (0.0%) | 5 (1.5%) |
| 35 to 64 Years | 56 (7.5%) | 54 (6.7%) |
| 65 to 74 Years | 14 (7.1%) | 7 (3.4%) |
| 75 Years and over | 0 (0.0%) | 9 (17.3%) |
Disability Class: Cognitive Difficulty
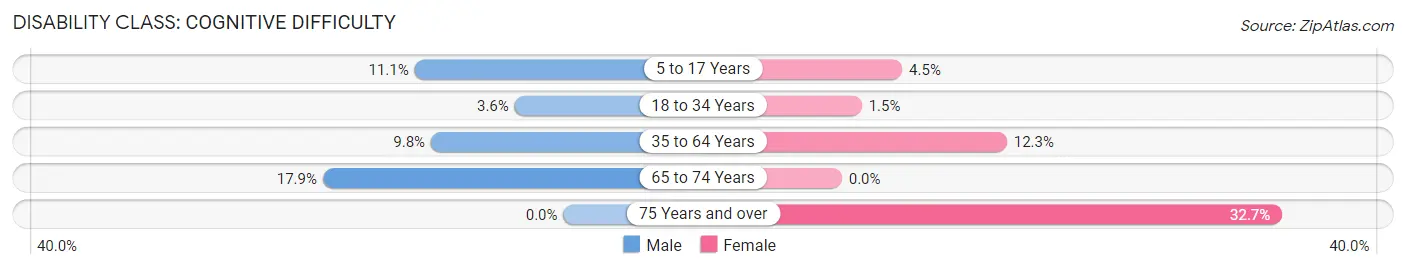
| Age Bracket | Male | Female |
| 5 to 17 Years | 38 (11.1%) | 20 (4.5%) |
| 18 to 34 Years | 16 (3.6%) | 5 (1.5%) |
| 35 to 64 Years | 73 (9.8%) | 99 (12.2%) |
| 65 to 74 Years | 35 (17.9%) | 0 (0.0%) |
| 75 Years and over | 0 (0.0%) | 17 (32.7%) |
Disability Class: Ambulatory Difficulty
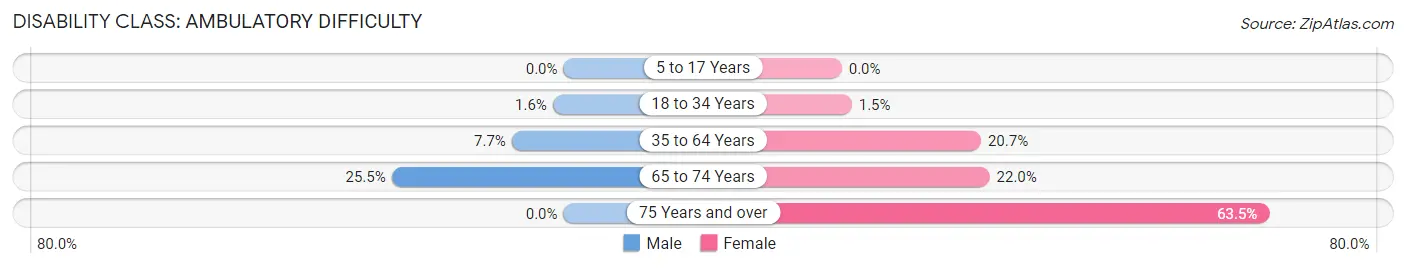
| Age Bracket | Male | Female |
| 5 to 17 Years | 0 (0.0%) | 0 (0.0%) |
| 18 to 34 Years | 7 (1.6%) | 5 (1.5%) |
| 35 to 64 Years | 57 (7.7%) | 167 (20.7%) |
| 65 to 74 Years | 50 (25.5%) | 45 (22.0%) |
| 75 Years and over | 0 (0.0%) | 33 (63.5%) |
Disability Class: Self-Care Difficulty
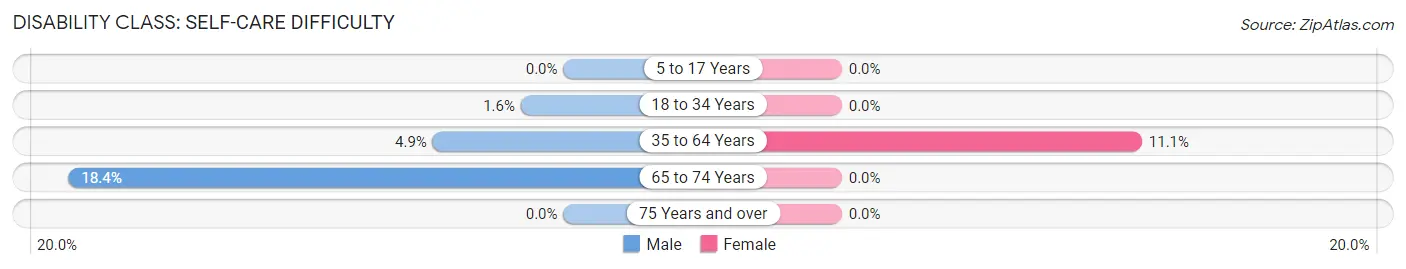
| Age Bracket | Male | Female |
| 5 to 17 Years | 0 (0.0%) | 0 (0.0%) |
| 18 to 34 Years | 7 (1.6%) | 0 (0.0%) |
| 35 to 64 Years | 36 (4.9%) | 90 (11.1%) |
| 65 to 74 Years | 36 (18.4%) | 0 (0.0%) |
| 75 Years and over | 0 (0.0%) | 0 (0.0%) |
Technology Access in Baxter Springs
Computing Device Access in Baxter Springs
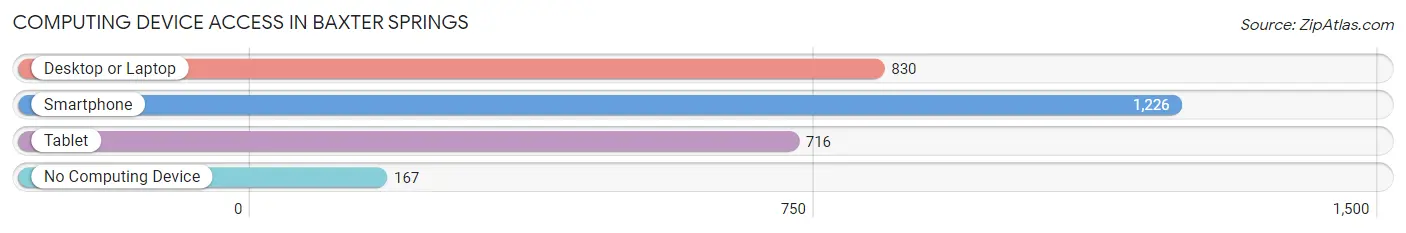
| Device Type | # Households | % Households |
| Desktop or Laptop | 830 | 57.2% |
| Smartphone | 1,226 | 84.6% |
| Tablet | 716 | 49.4% |
| No Computing Device | 167 | 11.5% |
| Total | 1,450 | 100.0% |
Internet Access in Baxter Springs
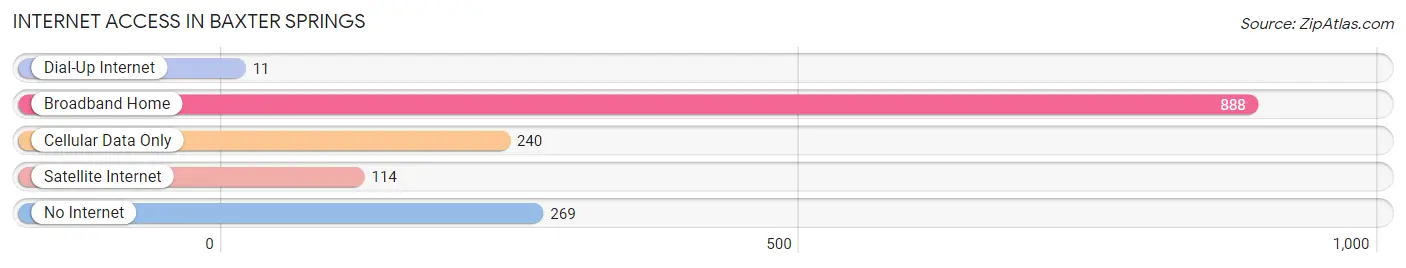
| Internet Type | # Households | % Households |
| Dial-Up Internet | 11 | 0.8% |
| Broadband Home | 888 | 61.2% |
| Cellular Data Only | 240 | 16.6% |
| Satellite Internet | 114 | 7.9% |
| No Internet | 269 | 18.5% |
| Total | 1,450 | 100.0% |
Baxter Springs Summary
Baxter Springs, Kansas is a small city located in Cherokee County in the southeastern corner of the state. It is situated on the banks of the Spring River, which is a tributary of the Neosho River. The city is located approximately 10 miles north of the Oklahoma border and is part of the Joplin, Missouri metropolitan area. The population of Baxter Springs was 4,238 at the 2010 census, making it the largest city in Cherokee County.
History
Baxter Springs was founded in 1847 by George Baxter, a former Missouri state senator. The city was originally known as Baxter Springs Station, and was a stop on the Butterfield Overland Mail route. During the Civil War, the city was a major supply center for the Union Army and was the site of several battles. In 1863, the Battle of Baxter Springs was fought in the city, and was the first battle in which African-American troops fought for the Union.
In the late 19th century, Baxter Springs became a major center for the cattle industry, and was known as the "Cattle Capital of Kansas". The city was also a major stop on the Ozark Trail, a popular route for travelers heading west.
Geography
Baxter Springs is located at 37°1'25" North, 94°44'25" West (37.02361, -94.74028). The city is situated on the banks of the Spring River, which is a tributary of the Neosho River. The city is located approximately 10 miles north of the Oklahoma border and is part of the Joplin, Missouri metropolitan area.
The city has a total area of 4.2 square miles, all of which is land. The city is located in the Ozark Plateau region of the state, and is characterized by rolling hills and wooded areas.
Economy
Baxter Springs is a small city with a diverse economy. The city is home to several manufacturing companies, including a steel mill, a paper mill, and a plastics plant. The city is also home to several retail stores, restaurants, and other businesses.
The city is also home to several tourist attractions, including the Baxter Springs Heritage Center, which is a museum dedicated to the history of the city. The city is also home to the Baxter Springs Independent School District, which serves the city and surrounding areas.
Demographics
As of the 2010 census, there were 4,238 people, 1,717 households, and 1,093 families residing in the city. The population density was 1,006.2 people per square mile. The racial makeup of the city was 87.2% White, 8.2% African American, 0.7% Native American, 0.4% Asian, 0.1% Pacific Islander, 0.9% from other races, and 2.5% from two or more races. Hispanic or Latino of any race were 3.2% of the population.
The median income for a household in the city was $30,938, and the median income for a family was $37,917. The per capita income for the city was $16,845. About 17.2% of families and 20.2% of the population were below the poverty line, including 28.2% of those under age 18 and 11.2% of those age 65 or over.
Common Questions
What is Per Capita Income in Baxter Springs?
Per Capita income in Baxter Springs is $23,249.
What is the Median Family Income in Baxter Springs?
Median Family Income in Baxter Springs is $60,139.
What is the Median Household income in Baxter Springs?
Median Household Income in Baxter Springs is $47,727.
What is Income or Wage Gap in Baxter Springs?
Income or Wage Gap in Baxter Springs is 2.0%.
Women in Baxter Springs earn 98.0 cents for every dollar earned by a man.
What is Inequality or Gini Index in Baxter Springs?
Inequality or Gini Index in Baxter Springs is 0.42.
What is the Total Population of Baxter Springs?
Total Population of Baxter Springs is 3,901.
What is the Total Male Population of Baxter Springs?
Total Male Population of Baxter Springs is 1,922.
What is the Total Female Population of Baxter Springs?
Total Female Population of Baxter Springs is 1,979.
What is the Ratio of Males per 100 Females in Baxter Springs?
There are 97.12 Males per 100 Females in Baxter Springs.
What is the Ratio of Females per 100 Males in Baxter Springs?
There are 102.97 Females per 100 Males in Baxter Springs.
What is the Median Population Age in Baxter Springs?
Median Population Age in Baxter Springs is 37.5 Years.
What is the Average Family Size in Baxter Springs
Average Family Size in Baxter Springs is 3.4 People.
What is the Average Household Size in Baxter Springs
Average Household Size in Baxter Springs is 2.7 People.
How Large is the Labor Force in Baxter Springs?
There are 1,897 People in the Labor Forcein in Baxter Springs.
What is the Percentage of People in the Labor Force in Baxter Springs?
63.8% of People are in the Labor Force in Baxter Springs.
What is the Unemployment Rate in Baxter Springs?
Unemployment Rate in Baxter Springs is 2.7%.