Aurora, KS Map & Demographics
Aurora Map
Aurora Overview
$29,535
PER CAPITA INCOME
$62,500
AVG FAMILY INCOME
$53,750
AVG HOUSEHOLD INCOME
0.30
INEQUALITY / GINI INDEX
66
TOTAL POPULATION
35
MALE POPULATION
31
FEMALE POPULATION
112.90
MALES / 100 FEMALES
88.57
FEMALES / 100 MALES
30.5
MEDIAN AGE
3.8
AVG FAMILY SIZE
2.1
AVG HOUSEHOLD SIZE
35
LABOR FORCE [ PEOPLE ]
74.5%
PERCENT IN LABOR FORCE
Aurora Zip Codes
Aurora Area Codes
Income in Aurora
Income Overview in Aurora
Per Capita Income in Aurora is $29,535, while median incomes of families and households are $62,500 and $53,750 respectively.
| Characteristic | Number | Measure |
| Per Capita Income | 66 | $29,535 |
| Median Family Income | 12 | $62,500 |
| Mean Family Income | 12 | $74,692 |
| Median Household Income | 32 | $53,750 |
| Mean Household Income | 32 | $58,275 |
| Income Deficit | 12 | $0 |
| Wage / Income Gap (%) | 66 | 0.00% |
| Wage / Income Gap ($) | 66 | 100.00¢ per $1 |
| Gini / Inequality Index | 66 | 0.30 |
Earnings by Sex in Aurora
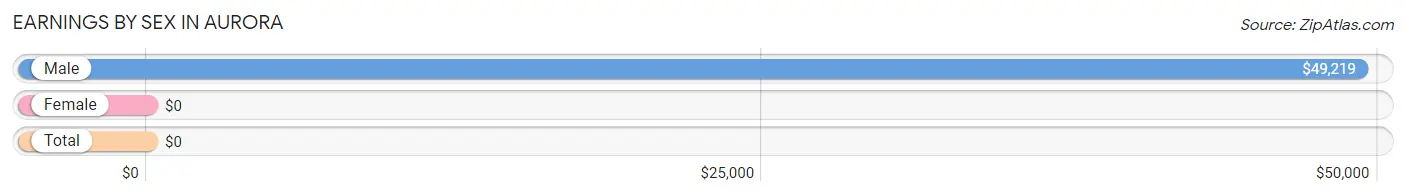
| Sex | Number | Average Earnings |
| Male | 25 (71.4%) | $49,219 |
| Female | 10 (28.6%) | $0 |
| Total | 35 (100.0%) | $0 |
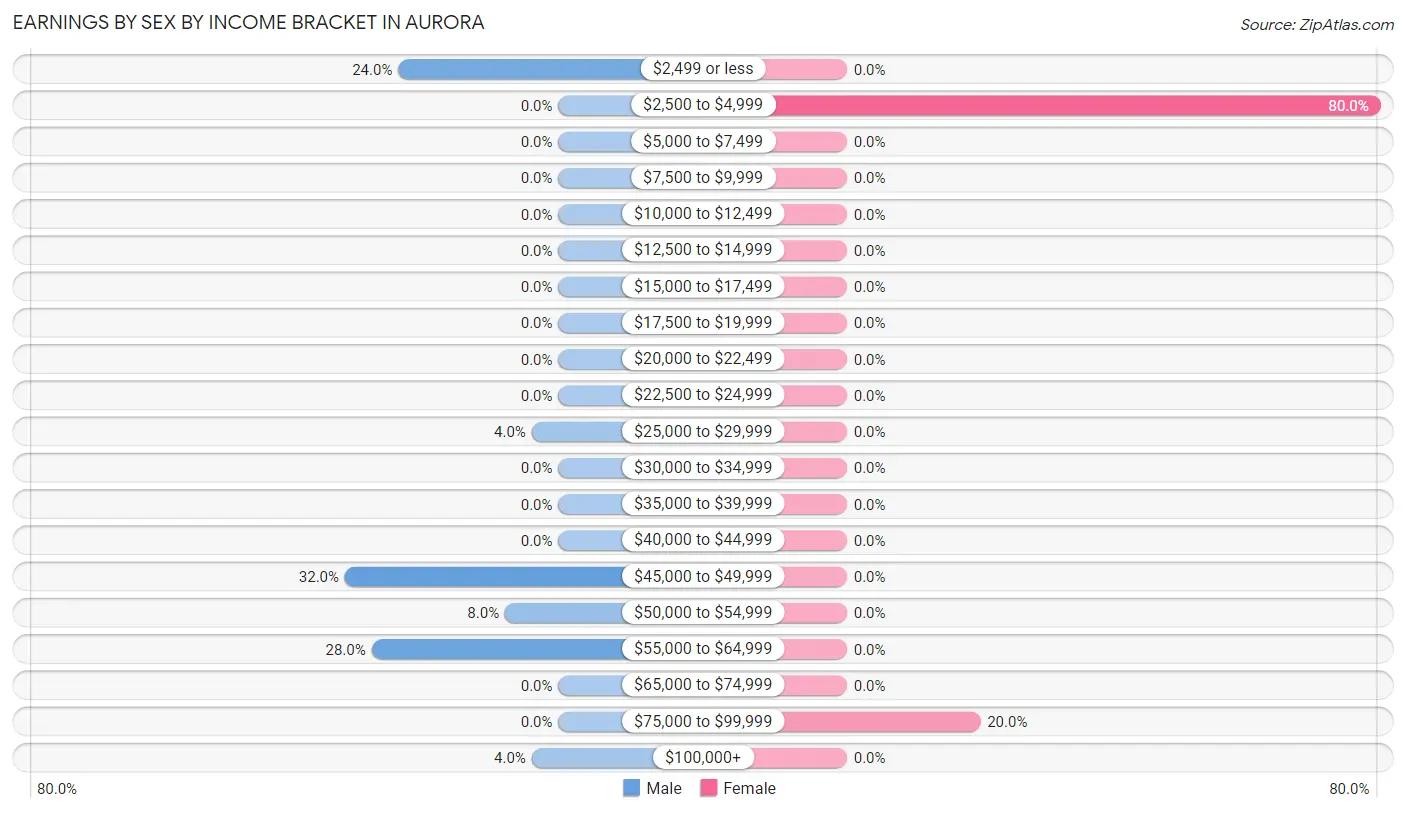
Earnings by Sex by Income Bracket in Aurora
The most common earnings brackets in Aurora are $45,000 to $49,999 for men (8 | 32.0%) and $2,500 to $4,999 for women (8 | 80.0%).
| Income | Male | Female |
| $2,499 or less | 6 (24.0%) | 0 (0.0%) |
| $2,500 to $4,999 | 0 (0.0%) | 8 (80.0%) |
| $5,000 to $7,499 | 0 (0.0%) | 0 (0.0%) |
| $7,500 to $9,999 | 0 (0.0%) | 0 (0.0%) |
| $10,000 to $12,499 | 0 (0.0%) | 0 (0.0%) |
| $12,500 to $14,999 | 0 (0.0%) | 0 (0.0%) |
| $15,000 to $17,499 | 0 (0.0%) | 0 (0.0%) |
| $17,500 to $19,999 | 0 (0.0%) | 0 (0.0%) |
| $20,000 to $22,499 | 0 (0.0%) | 0 (0.0%) |
| $22,500 to $24,999 | 0 (0.0%) | 0 (0.0%) |
| $25,000 to $29,999 | 1 (4.0%) | 0 (0.0%) |
| $30,000 to $34,999 | 0 (0.0%) | 0 (0.0%) |
| $35,000 to $39,999 | 0 (0.0%) | 0 (0.0%) |
| $40,000 to $44,999 | 0 (0.0%) | 0 (0.0%) |
| $45,000 to $49,999 | 8 (32.0%) | 0 (0.0%) |
| $50,000 to $54,999 | 2 (8.0%) | 0 (0.0%) |
| $55,000 to $64,999 | 7 (28.0%) | 0 (0.0%) |
| $65,000 to $74,999 | 0 (0.0%) | 0 (0.0%) |
| $75,000 to $99,999 | 0 (0.0%) | 2 (20.0%) |
| $100,000+ | 1 (4.0%) | 0 (0.0%) |
| Total | 25 (100.0%) | 10 (100.0%) |
Earnings by Sex by Educational Attainment in Aurora
| Educational Attainment | Male Income | Female Income |
| Less than High School | - | - |
| High School Diploma | - | - |
| College or Associate's Degree | - | - |
| Bachelor's Degree | - | - |
| Graduate Degree | - | - |
| Total | $49,219 | $0 |
Family Income in Aurora
Family Income Brackets in Aurora
According to the Aurora family income data, there are 7 families falling into the $50,000 to $74,999 income range, which is the most common income bracket and makes up 58.3% of all families.
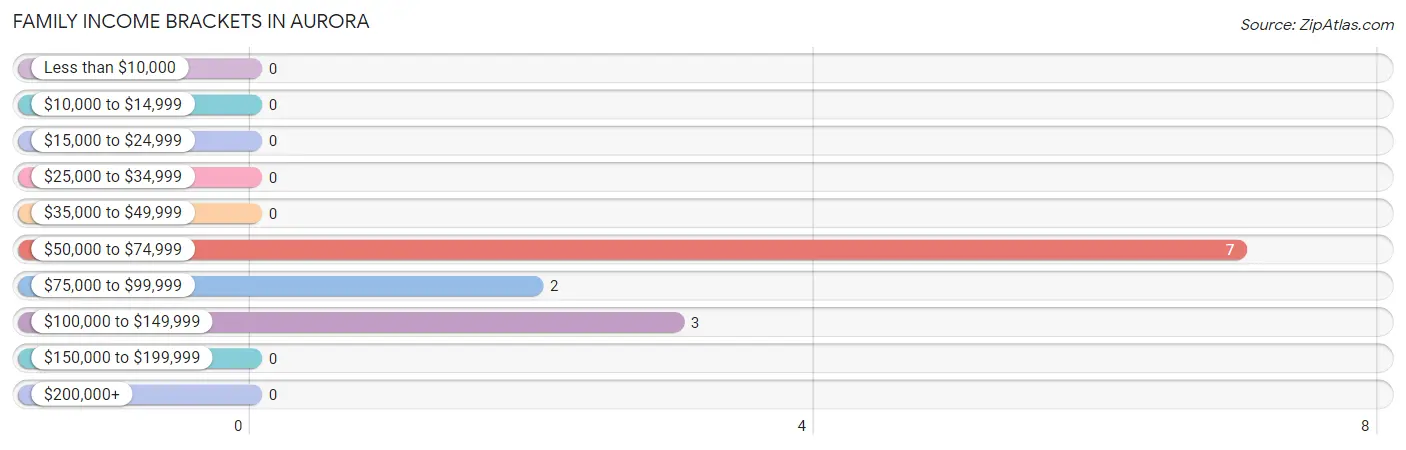
| Income Bracket | # Families | % Families |
| Less than $10,000 | 0 | 0.0% |
| $10,000 to $14,999 | 0 | 0.0% |
| $15,000 to $24,999 | 0 | 0.0% |
| $25,000 to $34,999 | 0 | 0.0% |
| $35,000 to $49,999 | 0 | 0.0% |
| $50,000 to $74,999 | 7 | 58.3% |
| $75,000 to $99,999 | 2 | 16.7% |
| $100,000 to $149,999 | 3 | 25.0% |
| $150,000 to $199,999 | 0 | 0.0% |
| $200,000+ | 0 | 0.0% |
Family Income by Famaliy Size in Aurora
2-person families (4 | 33.3%) account for the highest median family income in Aurora with $76,250 per family, while 2-person families (4 | 33.3%) have the highest median income of $38,125 per family member.
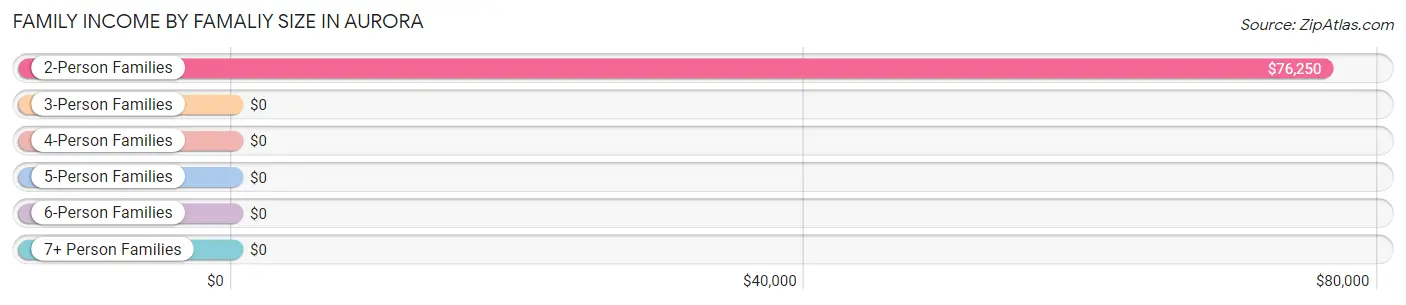
| Income Bracket | # Families | Median Income |
| 2-Person Families | 4 (33.3%) | $76,250 |
| 3-Person Families | 0 (0.0%) | $0 |
| 4-Person Families | 2 (16.7%) | $0 |
| 5-Person Families | 6 (50.0%) | $0 |
| 6-Person Families | 0 (0.0%) | $0 |
| 7+ Person Families | 0 (0.0%) | $0 |
| Total | 12 (100.0%) | $62,500 |
Family Income by Number of Earners in Aurora
| Number of Earners | # Families | Median Income |
| No Earners | 3 (25.0%) | $0 |
| 1 Earner | 1 (8.3%) | $0 |
| 2 Earners | 8 (66.7%) | $0 |
| 3+ Earners | 0 (0.0%) | $0 |
| Total | 12 (100.0%) | $62,500 |
Household Income in Aurora
Household Income Brackets in Aurora
With 16 households falling in the category, the $50,000 to $74,999 income range is the most frequent in Aurora, accounting for 50.0% of all households.
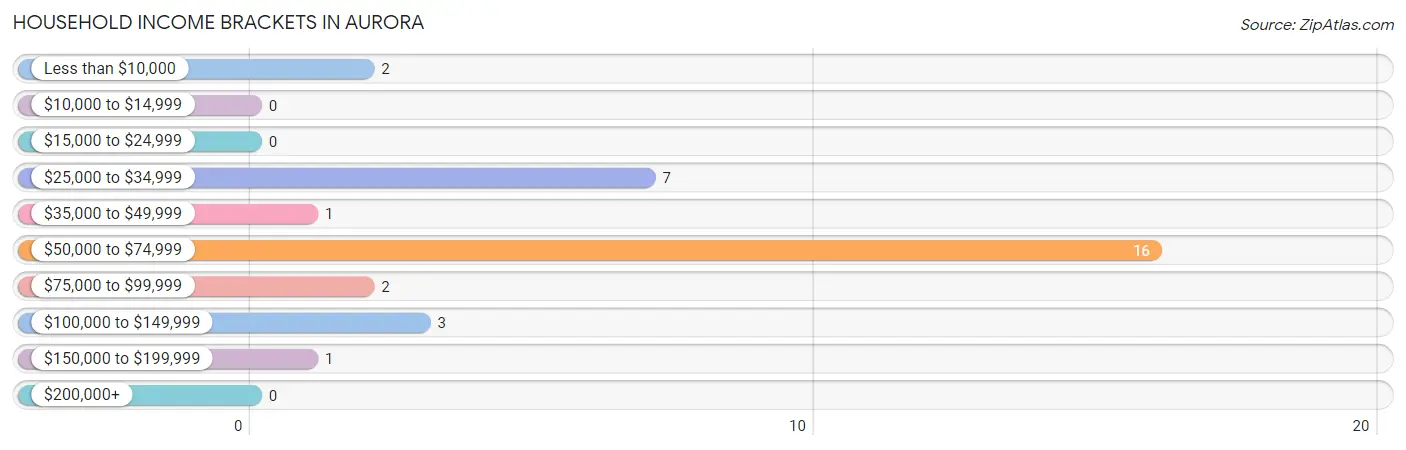
| Income Bracket | # Households | % Households |
| Less than $10,000 | 2 | 6.3% |
| $10,000 to $14,999 | 0 | 0.0% |
| $15,000 to $24,999 | 0 | 0.0% |
| $25,000 to $34,999 | 7 | 21.9% |
| $35,000 to $49,999 | 1 | 3.1% |
| $50,000 to $74,999 | 16 | 50.0% |
| $75,000 to $99,999 | 2 | 6.3% |
| $100,000 to $149,999 | 3 | 9.4% |
| $150,000 to $199,999 | 1 | 3.1% |
| $200,000+ | 0 | 0.0% |
Household Income by Householder Age in Aurora
The median household income in Aurora is $53,750, with the highest median household income of $56,250 found in the 65+ years age bracket for the primary householder. A total of 8 households (25.0%) fall into this category.
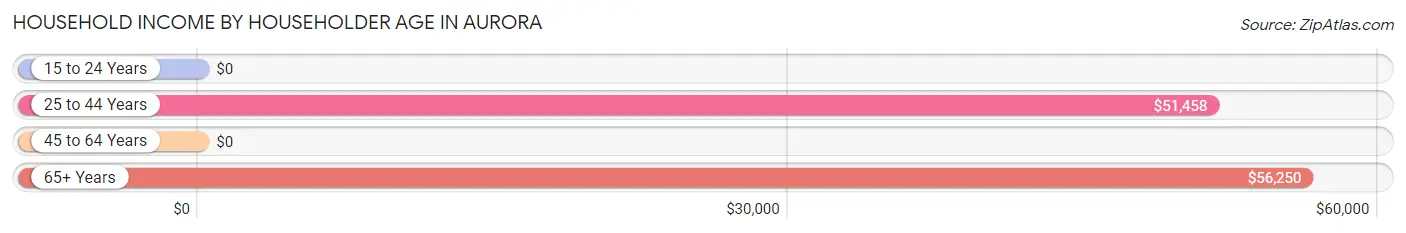
| Income Bracket | # Households | Median Income |
| 15 to 24 Years | 0 (0.0%) | $0 |
| 25 to 44 Years | 19 (59.4%) | $51,458 |
| 45 to 64 Years | 5 (15.6%) | $0 |
| 65+ Years | 8 (25.0%) | $56,250 |
| Total | 32 (100.0%) | $53,750 |
Poverty in Aurora
Income Below Poverty by Sex and Age in Aurora
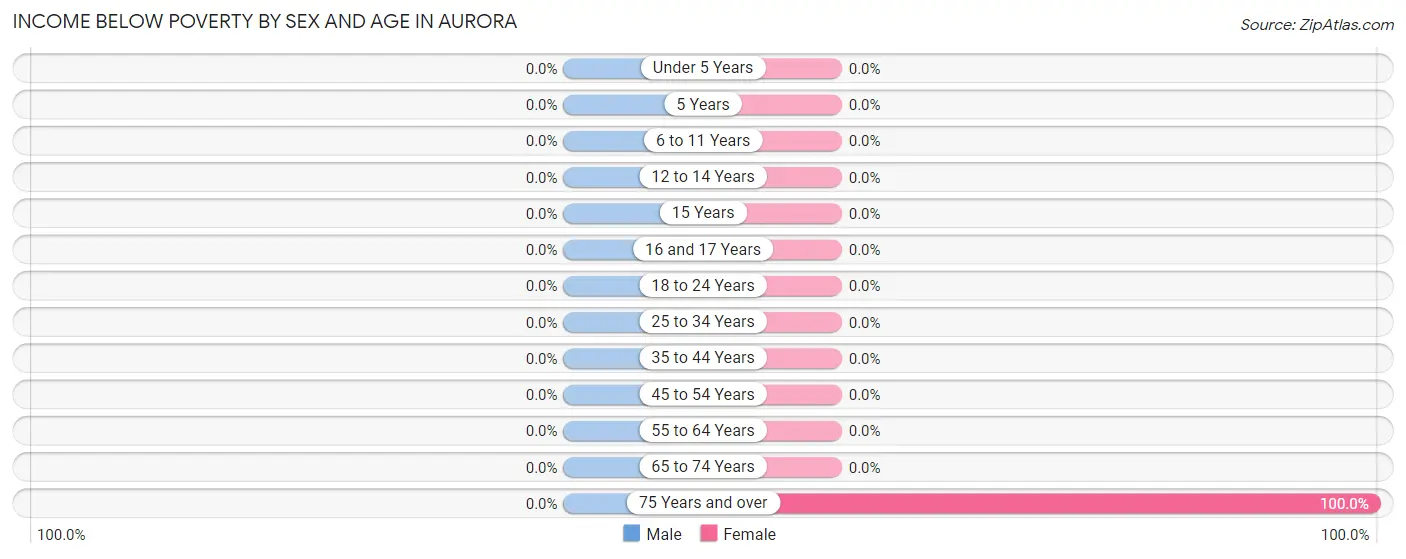
| Age Bracket | Male | Female |
| Under 5 Years | 0 (0.0%) | 0 (0.0%) |
| 5 Years | 0 (0.0%) | 0 (0.0%) |
| 6 to 11 Years | 0 (0.0%) | 0 (0.0%) |
| 12 to 14 Years | 0 (0.0%) | 0 (0.0%) |
| 15 Years | 0 (0.0%) | 0 (0.0%) |
| 16 and 17 Years | 0 (0.0%) | 0 (0.0%) |
| 18 to 24 Years | 0 (0.0%) | 0 (0.0%) |
| 25 to 34 Years | 0 (0.0%) | 0 (0.0%) |
| 35 to 44 Years | 0 (0.0%) | 0 (0.0%) |
| 45 to 54 Years | 0 (0.0%) | 0 (0.0%) |
| 55 to 64 Years | 0 (0.0%) | 0 (0.0%) |
| 65 to 74 Years | 0 (0.0%) | 0 (0.0%) |
| 75 Years and over | 0 (0.0%) | 2 (100.0%) |
| Total | 0 (0.0%) | 2 (6.5%) |
Income Above Poverty by Sex and Age in Aurora
According to the poverty statistics in Aurora, males aged under 5 years and females aged under 5 years are the age groups that are most secure financially, with 100.0% of males and 100.0% of females in these age groups living above the poverty line.
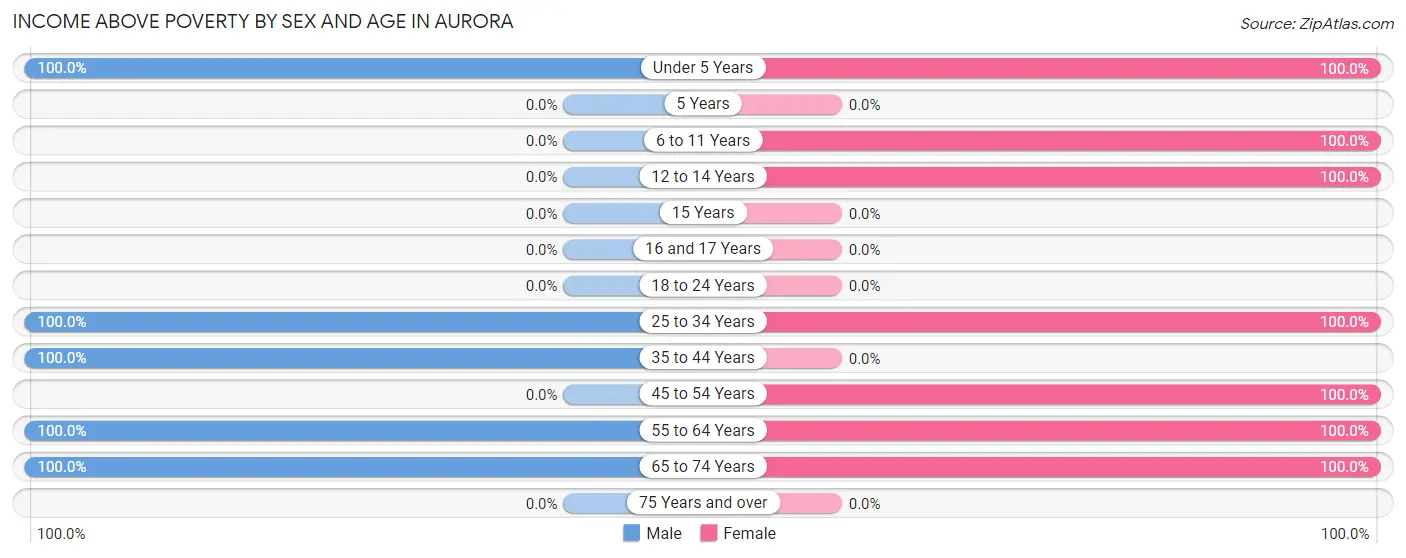
| Age Bracket | Male | Female |
| Under 5 Years | 6 (100.0%) | 6 (100.0%) |
| 5 Years | 0 (0.0%) | 0 (0.0%) |
| 6 to 11 Years | 0 (0.0%) | 3 (100.0%) |
| 12 to 14 Years | 0 (0.0%) | 4 (100.0%) |
| 15 Years | 0 (0.0%) | 0 (0.0%) |
| 16 and 17 Years | 0 (0.0%) | 0 (0.0%) |
| 18 to 24 Years | 0 (0.0%) | 0 (0.0%) |
| 25 to 34 Years | 8 (100.0%) | 10 (100.0%) |
| 35 to 44 Years | 11 (100.0%) | 0 (0.0%) |
| 45 to 54 Years | 0 (0.0%) | 2 (100.0%) |
| 55 to 64 Years | 4 (100.0%) | 1 (100.0%) |
| 65 to 74 Years | 6 (100.0%) | 3 (100.0%) |
| 75 Years and over | 0 (0.0%) | 0 (0.0%) |
| Total | 35 (100.0%) | 29 (93.5%) |
Income Below Poverty Among Married-Couple Families in Aurora
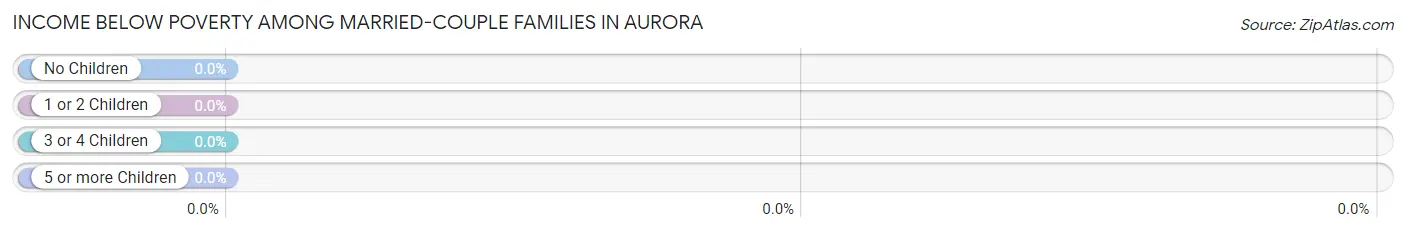
| Children | Above Poverty | Below Poverty |
| No Children | 4 (100.0%) | 0 (0.0%) |
| 1 or 2 Children | 2 (100.0%) | 0 (0.0%) |
| 3 or 4 Children | 6 (100.0%) | 0 (0.0%) |
| 5 or more Children | 0 (0.0%) | 0 (0.0%) |
| Total | 12 (100.0%) | 0 (0.0%) |
Income Below Poverty Among Single-Parent Households in Aurora
| Children | Single Father | Single Mother |
| No Children | 0 (0.0%) | 0 (0.0%) |
| 1 or 2 Children | 0 (0.0%) | 0 (0.0%) |
| 3 or 4 Children | 0 (0.0%) | 0 (0.0%) |
| 5 or more Children | 0 (0.0%) | 0 (0.0%) |
| Total | 0 (0.0%) | 0 (0.0%) |
Income Below Poverty Among Married-Couple vs Single-Parent Households in Aurora
| Children | Married-Couple Families | Single-Parent Households |
| No Children | 0 (0.0%) | 0 (0.0%) |
| 1 or 2 Children | 0 (0.0%) | 0 (0.0%) |
| 3 or 4 Children | 0 (0.0%) | 0 (0.0%) |
| 5 or more Children | 0 (0.0%) | 0 (0.0%) |
| Total | 0 (0.0%) | 0 (0.0%) |
Race in Aurora
The most populous races in Aurora are , and White / Caucasian (66 | 100.0%).
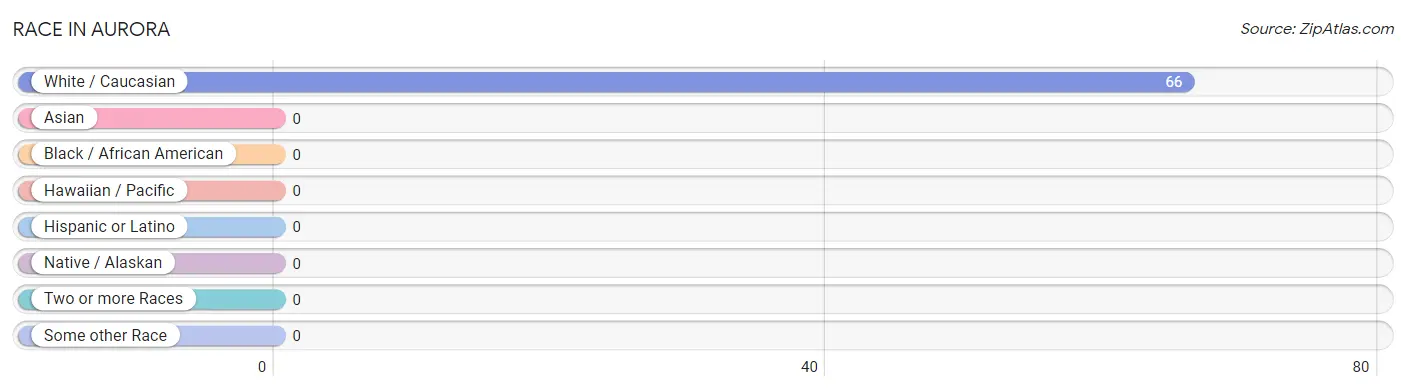
| Race | # Population | % Population |
| Asian | 0 | 0.0% |
| Black / African American | 0 | 0.0% |
| Hawaiian / Pacific | 0 | 0.0% |
| Hispanic or Latino | 0 | 0.0% |
| Native / Alaskan | 0 | 0.0% |
| White / Caucasian | 66 | 100.0% |
| Two or more Races | 0 | 0.0% |
| Some other Race | 0 | 0.0% |
| Total | 66 | 100.0% |
Ancestry in Aurora
The most populous ancestries reported in Aurora are German (9 | 13.6%), French (8 | 12.1%), American (5 | 7.6%), Swedish (3 | 4.5%), and Dutch (2 | 3.0%), together accounting for 40.9% of all Aurora residents.
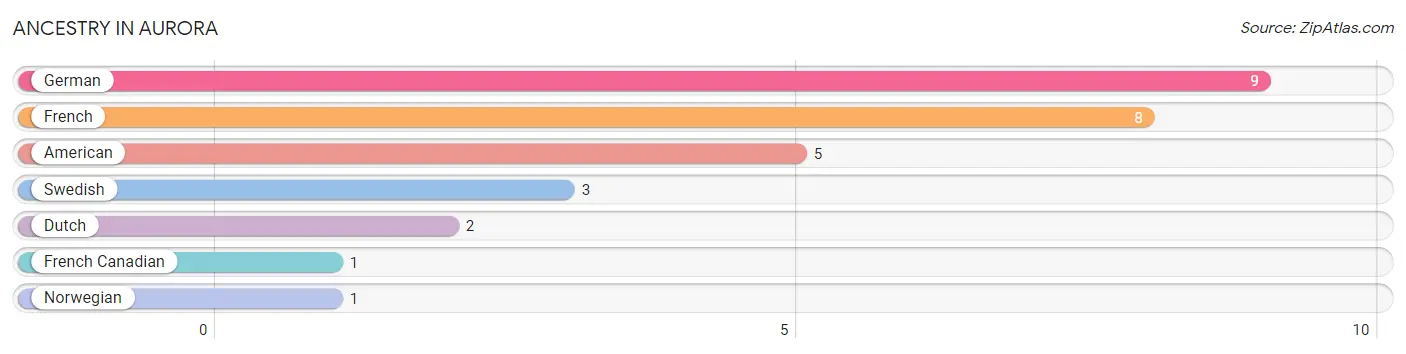
| Ancestry | # Population | % Population |
| American | 5 | 7.6% |
| Dutch | 2 | 3.0% |
| French | 8 | 12.1% |
| French Canadian | 1 | 1.5% |
| German | 9 | 13.6% |
| Norwegian | 1 | 1.5% |
| Swedish | 3 | 4.5% | View All 7 Rows |
Immigrants in Aurora

| Immigration Origin | # Population | % Population | View All 0 Rows |
Sex and Age in Aurora
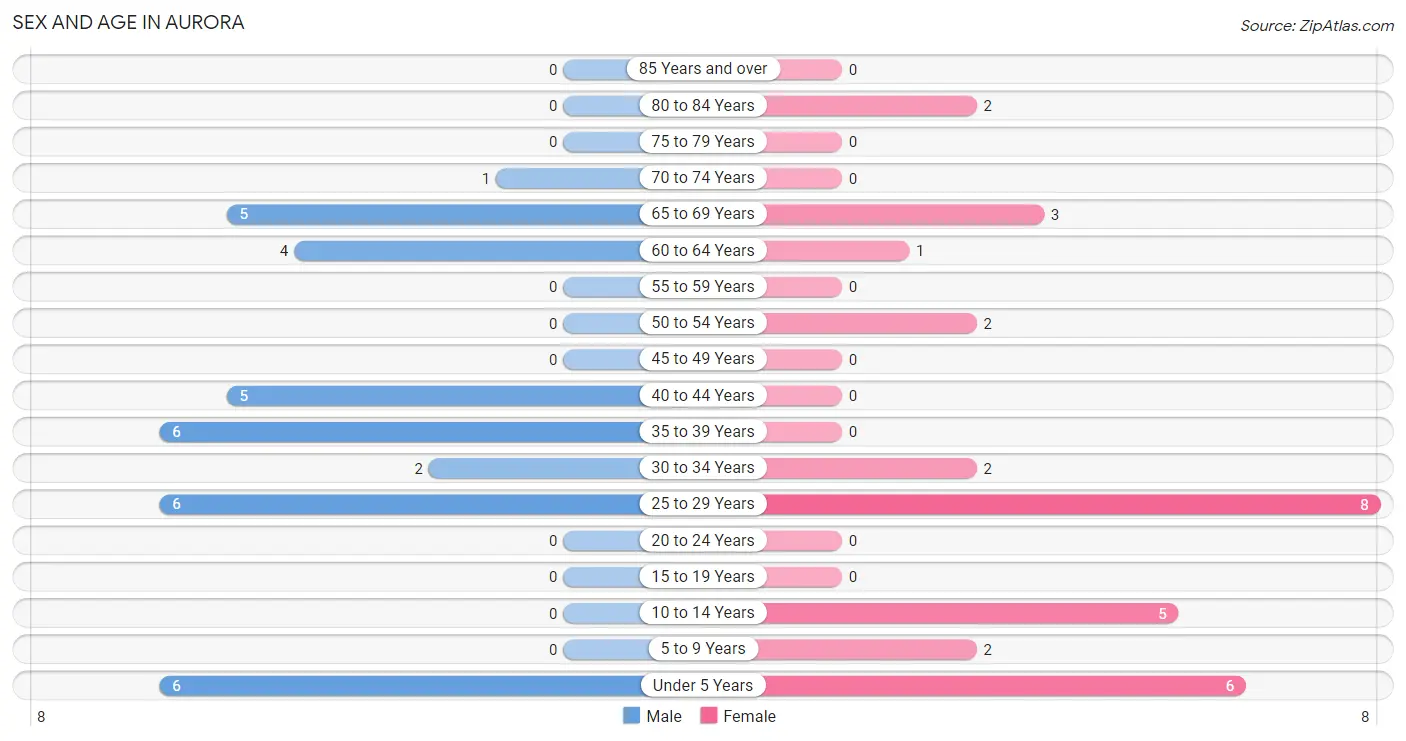
Sex and Age in Aurora
The most populous age groups in Aurora are Under 5 Years (6 | 17.1%) for men and 25 to 29 Years (8 | 25.8%) for women.
| Age Bracket | Male | Female |
| Under 5 Years | 6 (17.1%) | 6 (19.4%) |
| 5 to 9 Years | 0 (0.0%) | 2 (6.5%) |
| 10 to 14 Years | 0 (0.0%) | 5 (16.1%) |
| 15 to 19 Years | 0 (0.0%) | 0 (0.0%) |
| 20 to 24 Years | 0 (0.0%) | 0 (0.0%) |
| 25 to 29 Years | 6 (17.1%) | 8 (25.8%) |
| 30 to 34 Years | 2 (5.7%) | 2 (6.5%) |
| 35 to 39 Years | 6 (17.1%) | 0 (0.0%) |
| 40 to 44 Years | 5 (14.3%) | 0 (0.0%) |
| 45 to 49 Years | 0 (0.0%) | 0 (0.0%) |
| 50 to 54 Years | 0 (0.0%) | 2 (6.5%) |
| 55 to 59 Years | 0 (0.0%) | 0 (0.0%) |
| 60 to 64 Years | 4 (11.4%) | 1 (3.2%) |
| 65 to 69 Years | 5 (14.3%) | 3 (9.7%) |
| 70 to 74 Years | 1 (2.9%) | 0 (0.0%) |
| 75 to 79 Years | 0 (0.0%) | 0 (0.0%) |
| 80 to 84 Years | 0 (0.0%) | 2 (6.5%) |
| 85 Years and over | 0 (0.0%) | 0 (0.0%) |
| Total | 35 (100.0%) | 31 (100.0%) |
Families and Households in Aurora
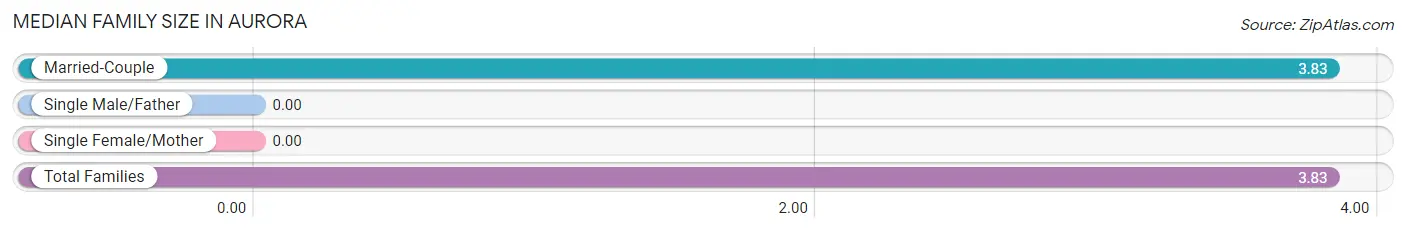
Median Family Size in Aurora
| Family Type | # Families | Family Size |
| Married-Couple | 12 (100.0%) | 3.83 |
| Single Male/Father | 0 (0.0%) | - |
| Single Female/Mother | 0 (0.0%) | - |
| Total Families | 12 (100.0%) | 3.83 |
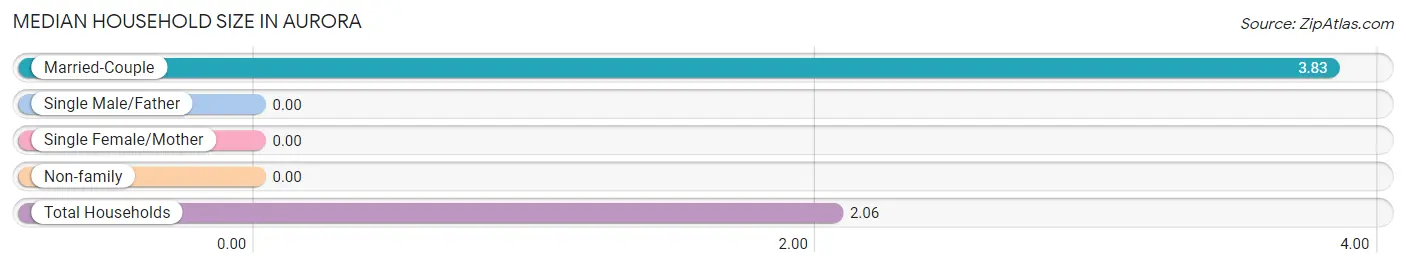
Median Household Size in Aurora
| Household Type | # Households | Household Size |
| Married-Couple | 12 (37.5%) | 3.83 |
| Single Male/Father | 0 (0.0%) | - |
| Single Female/Mother | 0 (0.0%) | - |
| Non-family | 20 (62.5%) | - |
| Total Households | 32 (100.0%) | 2.06 |
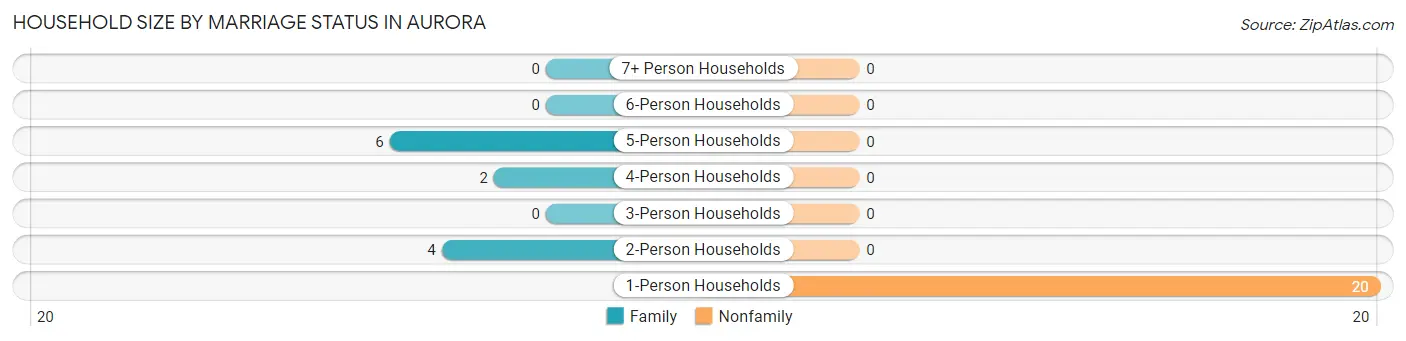
Household Size by Marriage Status in Aurora
Out of a total of 32 households in Aurora, 12 (37.5%) are family households, while 20 (62.5%) are nonfamily households. The most numerous type of family households are 5-person households, comprising 6, and the most common type of nonfamily households are 1-person households, comprising 20.
| Household Size | Family Households | Nonfamily Households |
| 1-Person Households | - | 20 (62.5%) |
| 2-Person Households | 4 (12.5%) | 0 (0.0%) |
| 3-Person Households | 0 (0.0%) | 0 (0.0%) |
| 4-Person Households | 2 (6.2%) | 0 (0.0%) |
| 5-Person Households | 6 (18.8%) | 0 (0.0%) |
| 6-Person Households | 0 (0.0%) | 0 (0.0%) |
| 7+ Person Households | 0 (0.0%) | 0 (0.0%) |
| Total | 12 (37.5%) | 20 (62.5%) |
Female Fertility in Aurora
Fertility by Age in Aurora
Average fertility rate in Aurora is 800.0 births per 1,000 women. Women in the age bracket of 20 to 34 years have the highest fertility rate with 800.0 births per 1,000 women. Women in the age bracket of 20 to 34 years acount for 100.0% of all women with births.
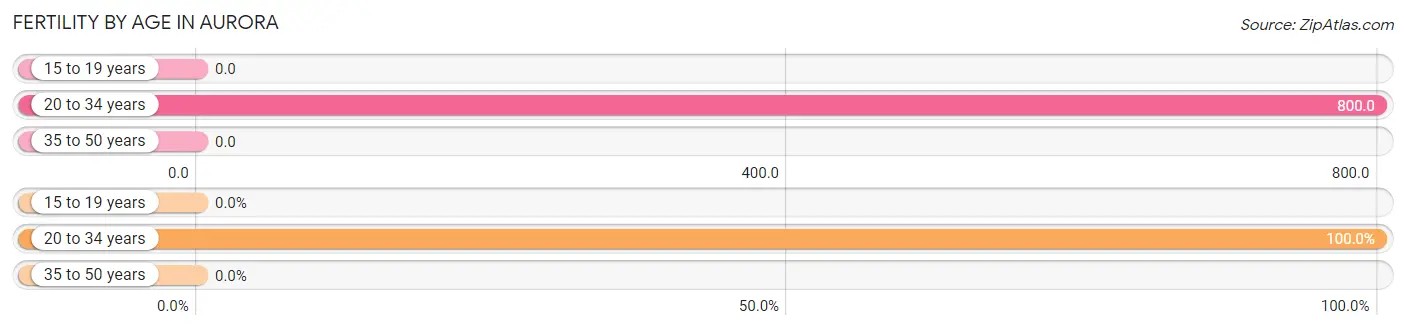
| Age Bracket | Women with Births | Births / 1,000 Women |
| 15 to 19 years | 0 (0.0%) | 0.0 |
| 20 to 34 years | 8 (100.0%) | 800.0 |
| 35 to 50 years | 0 (0.0%) | 0.0 |
| Total | 8 (100.0%) | 800.0 |
Fertility by Age by Marriage Status in Aurora
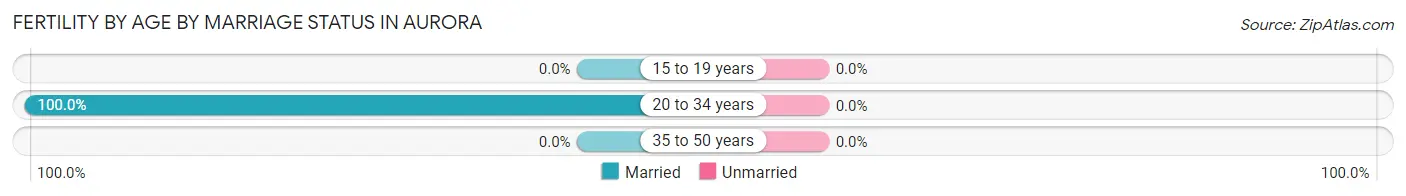
| Age Bracket | Married | Unmarried |
| 15 to 19 years | 0 (0.0%) | 0 (0.0%) |
| 20 to 34 years | 8 (100.0%) | 0 (0.0%) |
| 35 to 50 years | 0 (0.0%) | 0 (0.0%) |
| Total | 8 (100.0%) | 0 (0.0%) |
Fertility by Education in Aurora
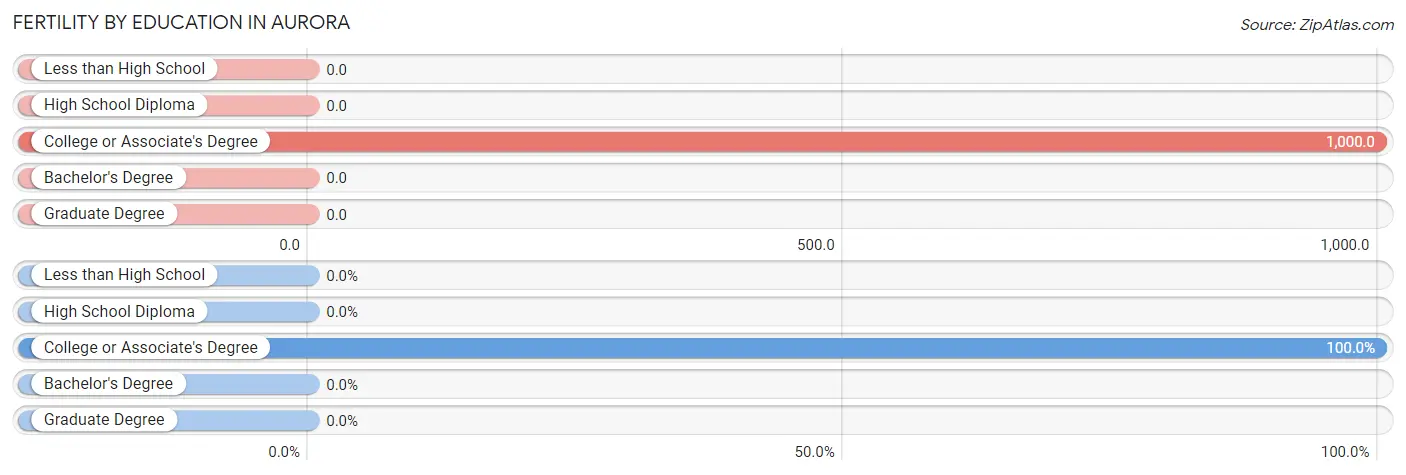
| Educational Attainment | Women with Births | Births / 1,000 Women |
| Less than High School | 0 (0.0%) | 0.0 |
| High School Diploma | 0 (0.0%) | 0.0 |
| College or Associate's Degree | 8 (100.0%) | 1,000.0 |
| Bachelor's Degree | 0 (0.0%) | 0.0 |
| Graduate Degree | 0 (0.0%) | 0.0 |
| Total | 8 (100.0%) | 800.0 |
Fertility by Education by Marriage Status in Aurora
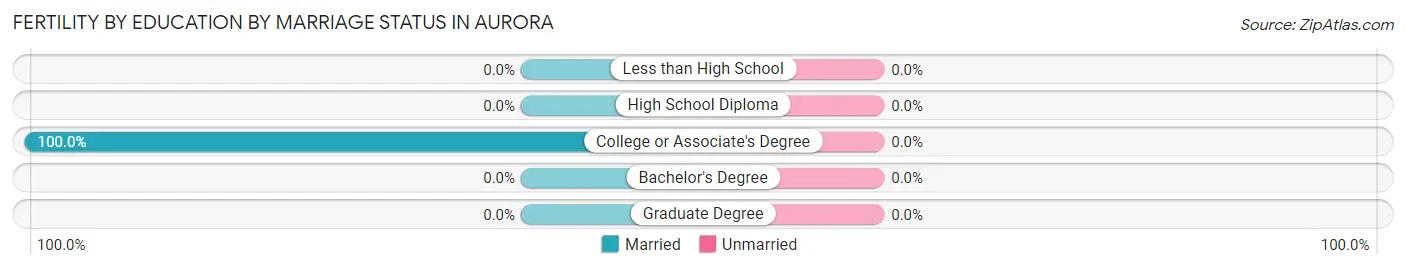
| Educational Attainment | Married | Unmarried |
| Less than High School | 0 (0.0%) | 0 (0.0%) |
| High School Diploma | 0 (0.0%) | 0 (0.0%) |
| College or Associate's Degree | 8 (100.0%) | 0 (0.0%) |
| Bachelor's Degree | 0 (0.0%) | 0 (0.0%) |
| Graduate Degree | 0 (0.0%) | 0 (0.0%) |
| Total | 8 (100.0%) | 0 (0.0%) |
Employment Characteristics in Aurora
Employment by Class of Employer in Aurora
Among the 35 employed individuals in Aurora, private company employees (23 | 65.7%), self-employed (not incorporated) (7 | 20.0%), and self-employed (incorporated) (2 | 5.7%) make up the most common classes of employment.
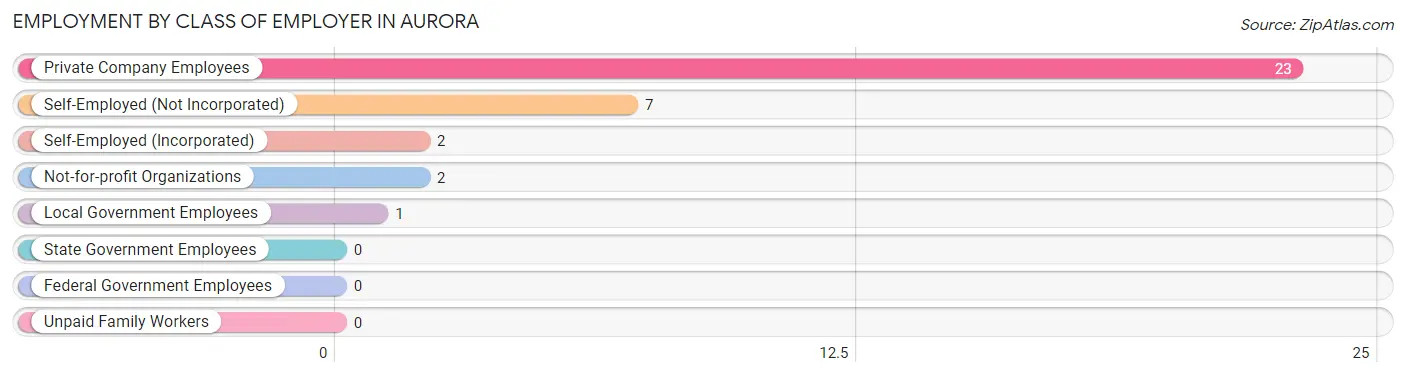
| Employer Class | # Employees | % Employees |
| Private Company Employees | 23 | 65.7% |
| Self-Employed (Incorporated) | 2 | 5.7% |
| Self-Employed (Not Incorporated) | 7 | 20.0% |
| Not-for-profit Organizations | 2 | 5.7% |
| Local Government Employees | 1 | 2.9% |
| State Government Employees | 0 | 0.0% |
| Federal Government Employees | 0 | 0.0% |
| Unpaid Family Workers | 0 | 0.0% |
| Total | 35 | 100.0% |
Employment Status by Age in Aurora
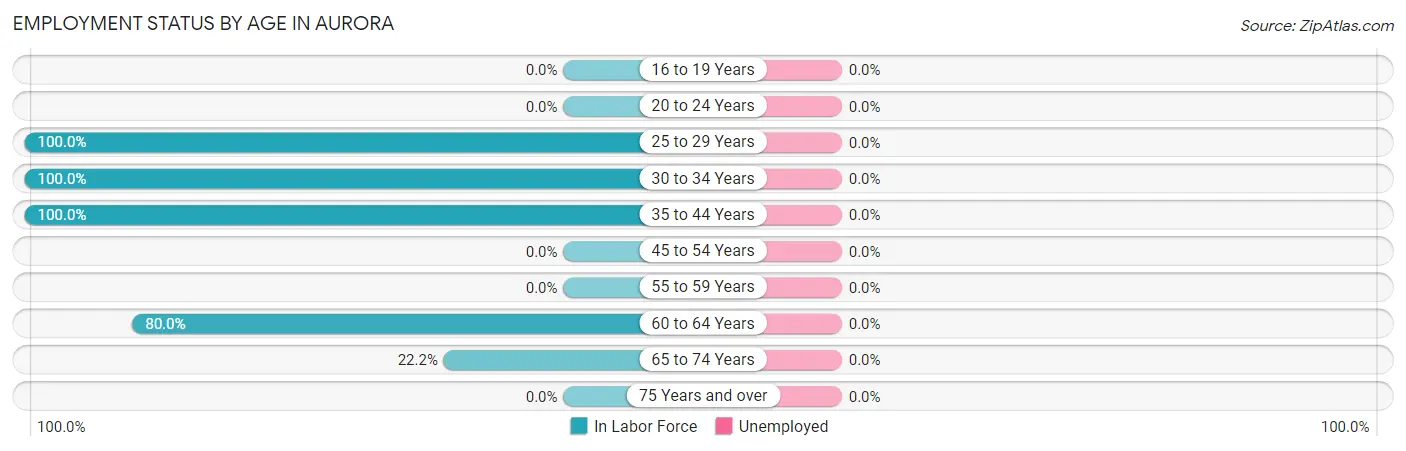
| Age Bracket | In Labor Force | Unemployed |
| 16 to 19 Years | 0 (0.0%) | 0 (0.0%) |
| 20 to 24 Years | 0 (0.0%) | 0 (0.0%) |
| 25 to 29 Years | 14 (100.0%) | 0 (0.0%) |
| 30 to 34 Years | 4 (100.0%) | 0 (0.0%) |
| 35 to 44 Years | 11 (100.0%) | 0 (0.0%) |
| 45 to 54 Years | 0 (0.0%) | 0 (0.0%) |
| 55 to 59 Years | 0 (0.0%) | 0 (0.0%) |
| 60 to 64 Years | 4 (80.0%) | 0 (0.0%) |
| 65 to 74 Years | 2 (22.2%) | 0 (0.0%) |
| 75 Years and over | 0 (0.0%) | 0 (0.0%) |
| Total | 35 (74.5%) | 0 (0.0%) |
Employment Status by Educational Attainment in Aurora
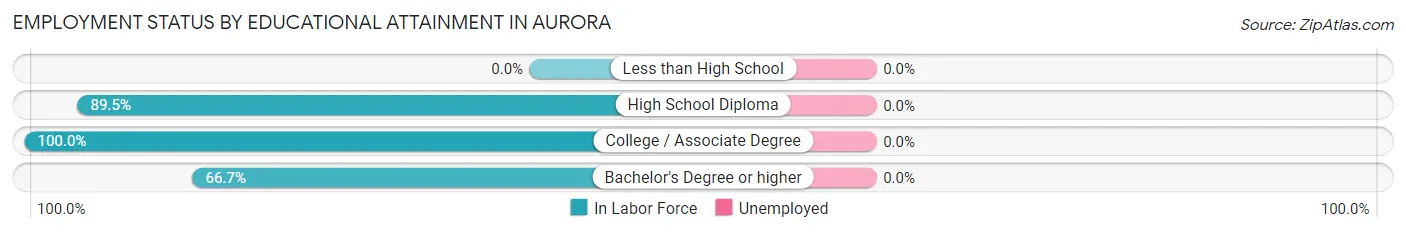
| Educational Attainment | In Labor Force | Unemployed |
| Less than High School | 0 (0.0%) | 0 (0.0%) |
| High School Diploma | 17 (89.5%) | 0 (0.0%) |
| College / Associate Degree | 14 (100.0%) | 0 (0.0%) |
| Bachelor's Degree or higher | 2 (66.7%) | 0 (0.0%) |
| Total | 33 (91.7%) | 0 (0.0%) |
Employment Occupations by Sex in Aurora
Management, Business, Science and Arts Occupations
The most common Management, Business, Science and Arts occupations in Aurora are , and Management (9 | 25.7%).
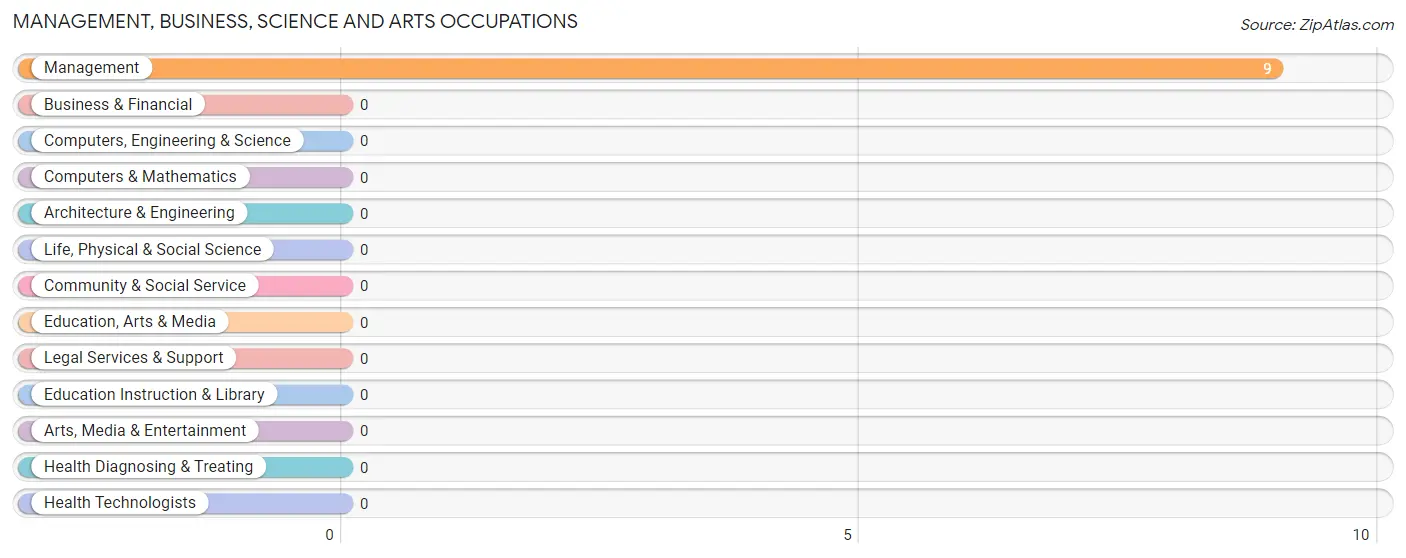
Management, Business, Science and Arts Occupations by Sex
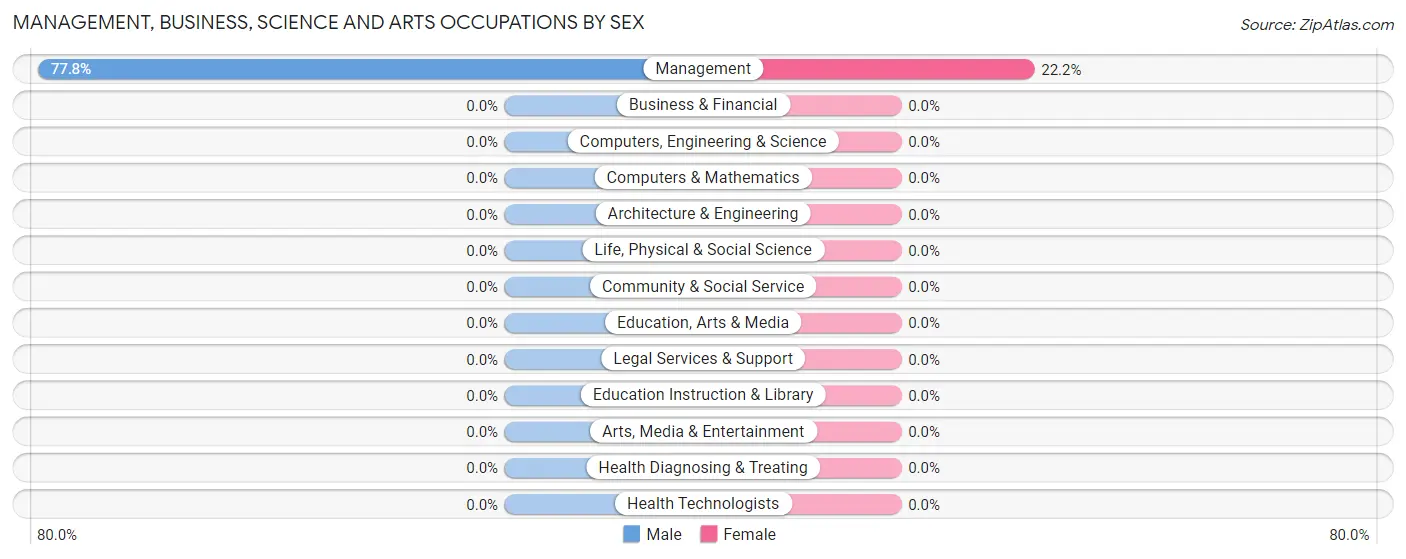
| Occupation | Male | Female |
| Management | 7 (77.8%) | 2 (22.2%) |
| Business & Financial | 0 (0.0%) | 0 (0.0%) |
| Computers, Engineering & Science | 0 (0.0%) | 0 (0.0%) |
| Computers & Mathematics | 0 (0.0%) | 0 (0.0%) |
| Architecture & Engineering | 0 (0.0%) | 0 (0.0%) |
| Life, Physical & Social Science | 0 (0.0%) | 0 (0.0%) |
| Community & Social Service | 0 (0.0%) | 0 (0.0%) |
| Education, Arts & Media | 0 (0.0%) | 0 (0.0%) |
| Legal Services & Support | 0 (0.0%) | 0 (0.0%) |
| Education Instruction & Library | 0 (0.0%) | 0 (0.0%) |
| Arts, Media & Entertainment | 0 (0.0%) | 0 (0.0%) |
| Health Diagnosing & Treating | 0 (0.0%) | 0 (0.0%) |
| Health Technologists | 0 (0.0%) | 0 (0.0%) |
| Total (Category) | 7 (77.8%) | 2 (22.2%) |
| Total (Overall) | 25 (71.4%) | 10 (28.6%) |
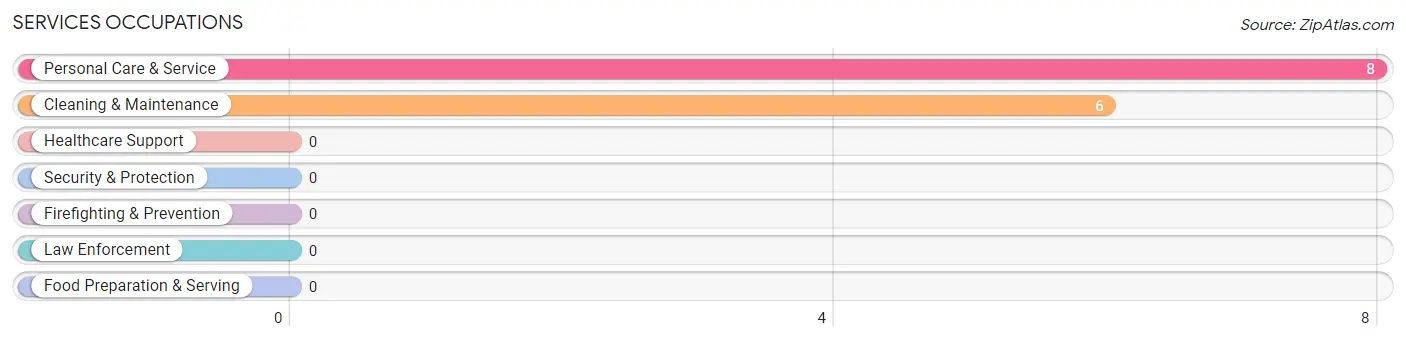
Services Occupations
The most common Services occupations in Aurora are Personal Care & Service (8 | 22.9%), and Cleaning & Maintenance (6 | 17.1%).
Services Occupations by Sex
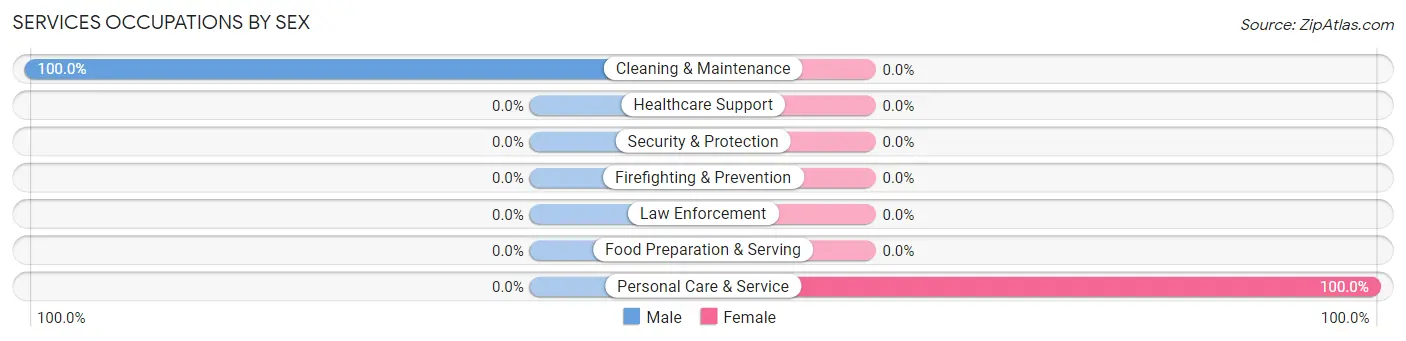
| Occupation | Male | Female |
| Healthcare Support | 0 (0.0%) | 0 (0.0%) |
| Security & Protection | 0 (0.0%) | 0 (0.0%) |
| Firefighting & Prevention | 0 (0.0%) | 0 (0.0%) |
| Law Enforcement | 0 (0.0%) | 0 (0.0%) |
| Food Preparation & Serving | 0 (0.0%) | 0 (0.0%) |
| Cleaning & Maintenance | 6 (100.0%) | 0 (0.0%) |
| Personal Care & Service | 0 (0.0%) | 8 (100.0%) |
| Total (Category) | 6 (42.9%) | 8 (57.1%) |
| Total (Overall) | 25 (71.4%) | 10 (28.6%) |
Sales and Office Occupations
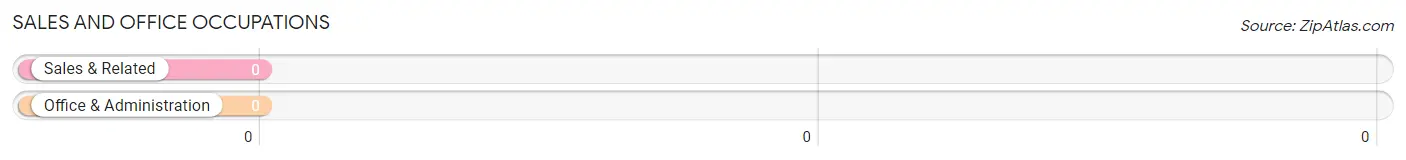
Sales and Office Occupations by Sex
| Occupation | Male | Female |
| Sales & Related | 0 (0.0%) | 0 (0.0%) |
| Office & Administration | 0 (0.0%) | 0 (0.0%) |
| Total (Category) | 0 (0.0%) | 0 (0.0%) |
| Total (Overall) | 25 (71.4%) | 10 (28.6%) |
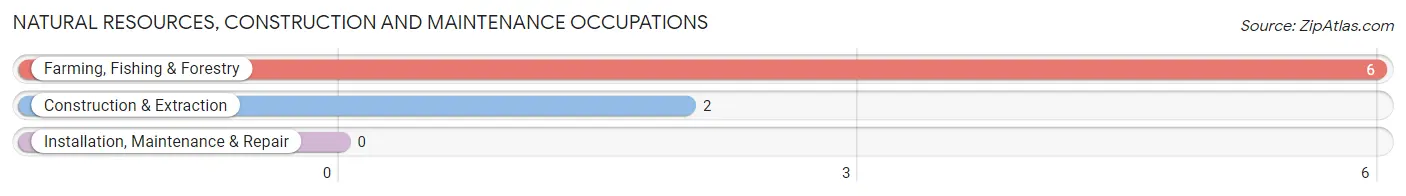
Natural Resources, Construction and Maintenance Occupations
The most common Natural Resources, Construction and Maintenance occupations in Aurora are Farming, Fishing & Forestry (6 | 17.1%), and Construction & Extraction (2 | 5.7%).
Natural Resources, Construction and Maintenance Occupations by Sex
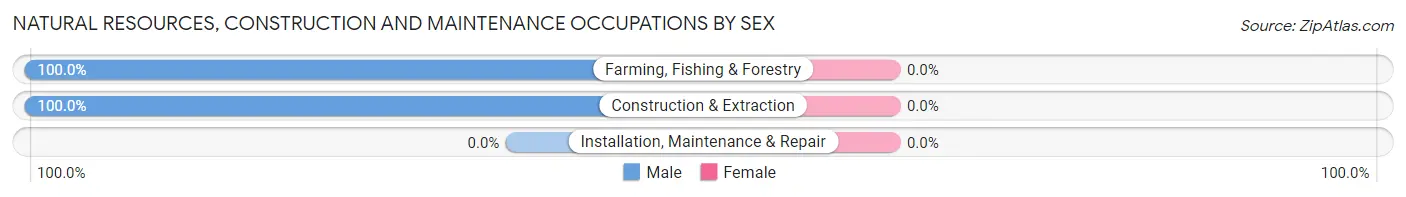
| Occupation | Male | Female |
| Farming, Fishing & Forestry | 6 (100.0%) | 0 (0.0%) |
| Construction & Extraction | 2 (100.0%) | 0 (0.0%) |
| Installation, Maintenance & Repair | 0 (0.0%) | 0 (0.0%) |
| Total (Category) | 8 (100.0%) | 0 (0.0%) |
| Total (Overall) | 25 (71.4%) | 10 (28.6%) |
Production, Transportation and Moving Occupations
The most common Production, Transportation and Moving occupations in Aurora are , and Transportation (4 | 11.4%).
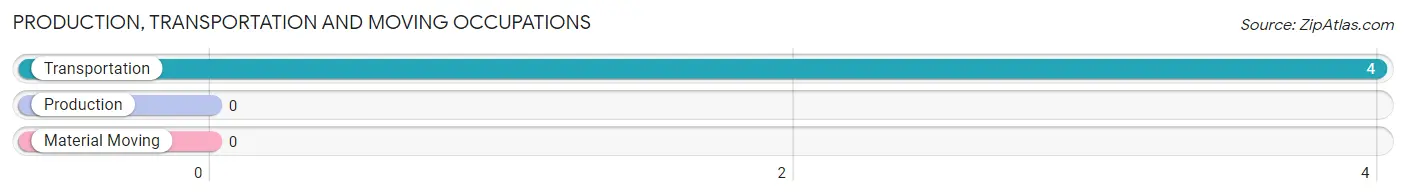
Production, Transportation and Moving Occupations by Sex
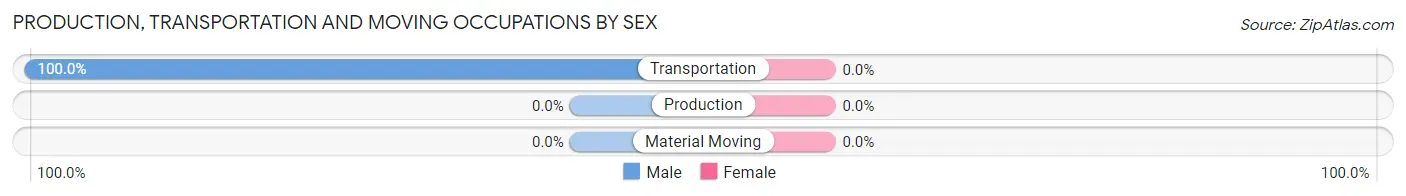
| Occupation | Male | Female |
| Production | 0 (0.0%) | 0 (0.0%) |
| Transportation | 4 (100.0%) | 0 (0.0%) |
| Material Moving | 0 (0.0%) | 0 (0.0%) |
| Total (Category) | 4 (100.0%) | 0 (0.0%) |
| Total (Overall) | 25 (71.4%) | 10 (28.6%) |
Employment Industries by Sex in Aurora
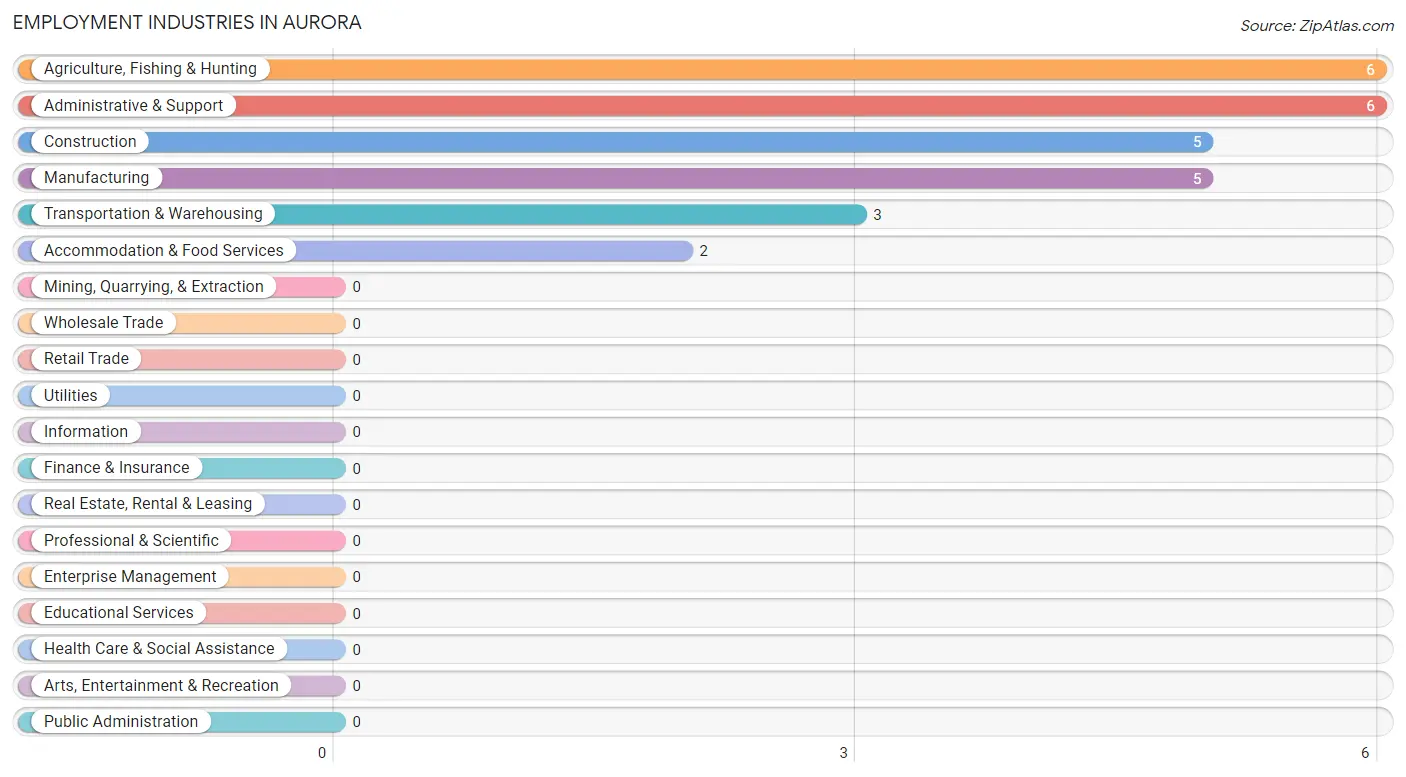
Employment Industries in Aurora
The major employment industries in Aurora include Agriculture, Fishing & Hunting (6 | 17.1%), Administrative & Support (6 | 17.1%), Construction (5 | 14.3%), Manufacturing (5 | 14.3%), and Transportation & Warehousing (3 | 8.6%).
Employment Industries by Sex in Aurora
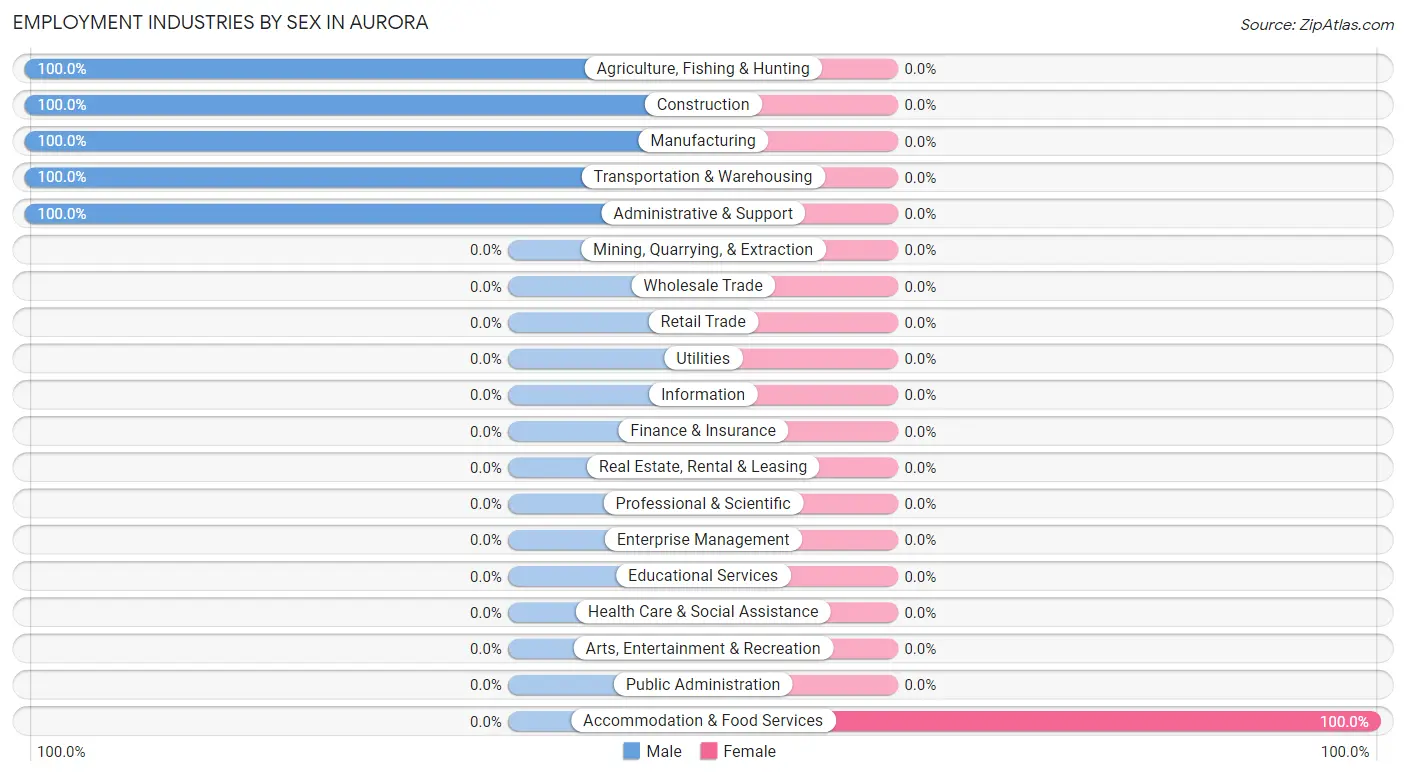
| Industry | Male | Female |
| Agriculture, Fishing & Hunting | 6 (100.0%) | 0 (0.0%) |
| Mining, Quarrying, & Extraction | 0 (0.0%) | 0 (0.0%) |
| Construction | 5 (100.0%) | 0 (0.0%) |
| Manufacturing | 5 (100.0%) | 0 (0.0%) |
| Wholesale Trade | 0 (0.0%) | 0 (0.0%) |
| Retail Trade | 0 (0.0%) | 0 (0.0%) |
| Transportation & Warehousing | 3 (100.0%) | 0 (0.0%) |
| Utilities | 0 (0.0%) | 0 (0.0%) |
| Information | 0 (0.0%) | 0 (0.0%) |
| Finance & Insurance | 0 (0.0%) | 0 (0.0%) |
| Real Estate, Rental & Leasing | 0 (0.0%) | 0 (0.0%) |
| Professional & Scientific | 0 (0.0%) | 0 (0.0%) |
| Enterprise Management | 0 (0.0%) | 0 (0.0%) |
| Administrative & Support | 6 (100.0%) | 0 (0.0%) |
| Educational Services | 0 (0.0%) | 0 (0.0%) |
| Health Care & Social Assistance | 0 (0.0%) | 0 (0.0%) |
| Arts, Entertainment & Recreation | 0 (0.0%) | 0 (0.0%) |
| Accommodation & Food Services | 0 (0.0%) | 2 (100.0%) |
| Public Administration | 0 (0.0%) | 0 (0.0%) |
| Total | 25 (71.4%) | 10 (28.6%) |
Education in Aurora
School Enrollment in Aurora
The most common levels of schooling among the 7 students in Aurora are middle school (5 | 71.4%), and elementary school (2 | 28.6%).
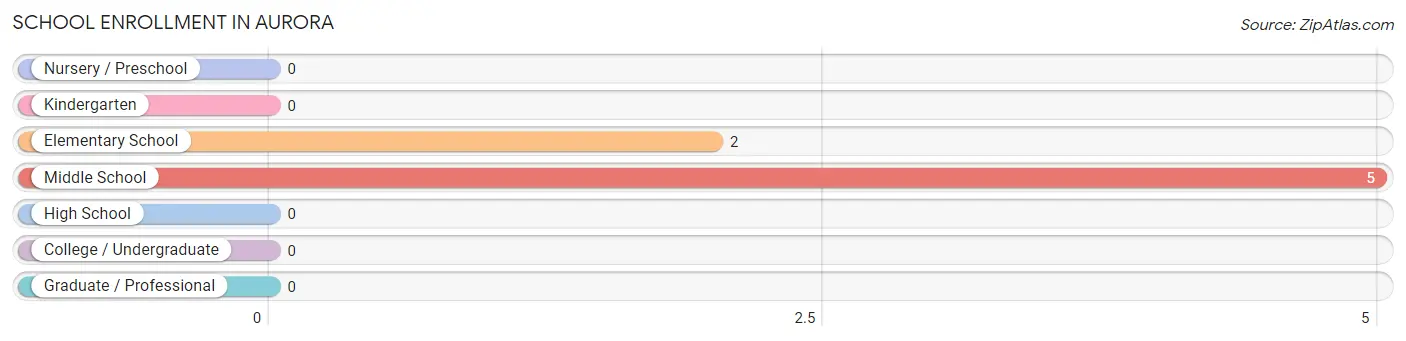
| School Level | # Students | % Students |
| Nursery / Preschool | 0 | 0.0% |
| Kindergarten | 0 | 0.0% |
| Elementary School | 2 | 28.6% |
| Middle School | 5 | 71.4% |
| High School | 0 | 0.0% |
| College / Undergraduate | 0 | 0.0% |
| Graduate / Professional | 0 | 0.0% |
| Total | 7 | 100.0% |
School Enrollment by Age by Funding Source in Aurora
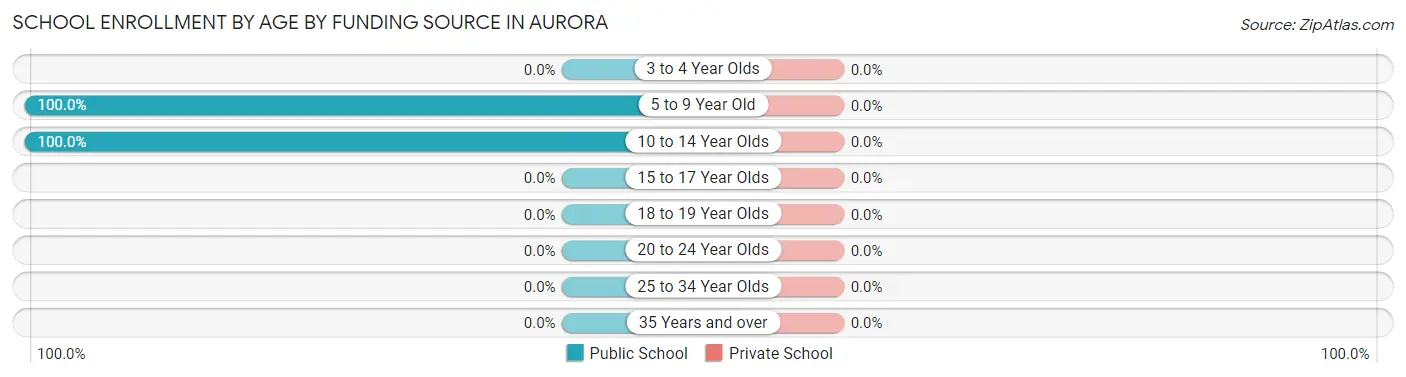
| Age Bracket | Public School | Private School |
| 3 to 4 Year Olds | 0 (0.0%) | 0 (0.0%) |
| 5 to 9 Year Old | 2 (100.0%) | 0 (0.0%) |
| 10 to 14 Year Olds | 5 (100.0%) | 0 (0.0%) |
| 15 to 17 Year Olds | 0 (0.0%) | 0 (0.0%) |
| 18 to 19 Year Olds | 0 (0.0%) | 0 (0.0%) |
| 20 to 24 Year Olds | 0 (0.0%) | 0 (0.0%) |
| 25 to 34 Year Olds | 0 (0.0%) | 0 (0.0%) |
| 35 Years and over | 0 (0.0%) | 0 (0.0%) |
| Total | 7 (100.0%) | 0 (0.0%) |
Educational Attainment by Field of Study in Aurora
Business (2 | 66.7%), and science & technology (1 | 33.3%) are the most common fields of study among 3 individuals in Aurora who have obtained a bachelor's degree or higher.
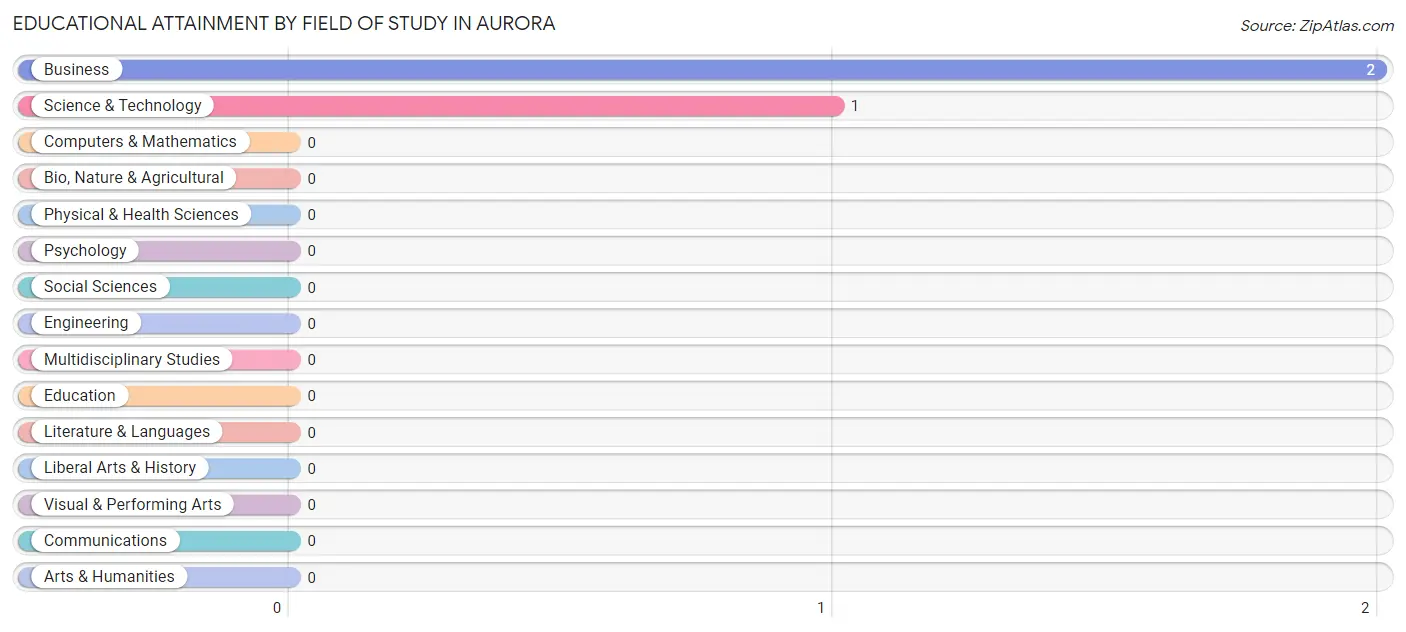
| Field of Study | # Graduates | % Graduates |
| Computers & Mathematics | 0 | 0.0% |
| Bio, Nature & Agricultural | 0 | 0.0% |
| Physical & Health Sciences | 0 | 0.0% |
| Psychology | 0 | 0.0% |
| Social Sciences | 0 | 0.0% |
| Engineering | 0 | 0.0% |
| Multidisciplinary Studies | 0 | 0.0% |
| Science & Technology | 1 | 33.3% |
| Business | 2 | 66.7% |
| Education | 0 | 0.0% |
| Literature & Languages | 0 | 0.0% |
| Liberal Arts & History | 0 | 0.0% |
| Visual & Performing Arts | 0 | 0.0% |
| Communications | 0 | 0.0% |
| Arts & Humanities | 0 | 0.0% |
| Total | 3 | 100.0% |
Transportation & Commute in Aurora
Vehicle Availability by Sex in Aurora
The most prevalent vehicle ownership categories in Aurora are males with 1 vehicle (16, accounting for 64.0%) and females with 1 vehicle (0, making up 160.0%).
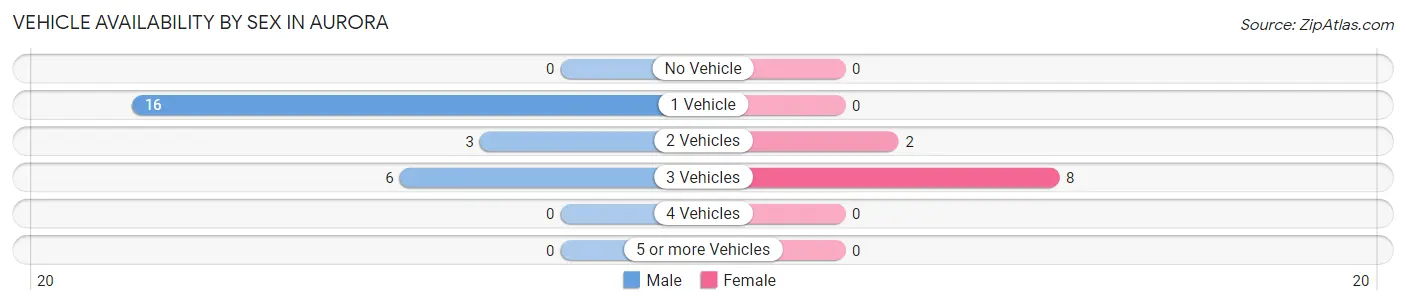
| Vehicles Available | Male | Female |
| No Vehicle | 0 (0.0%) | 0 (0.0%) |
| 1 Vehicle | 16 (64.0%) | 0 (0.0%) |
| 2 Vehicles | 3 (12.0%) | 2 (20.0%) |
| 3 Vehicles | 6 (24.0%) | 8 (80.0%) |
| 4 Vehicles | 0 (0.0%) | 0 (0.0%) |
| 5 or more Vehicles | 0 (0.0%) | 0 (0.0%) |
| Total | 25 (100.0%) | 10 (100.0%) |
Commute Time in Aurora
The most frequently occuring commute durations in Aurora are 30 to 34 minutes (14 commuters, 40.0%), 20 to 24 minutes (13 commuters, 37.1%), and 25 to 29 minutes (3 commuters, 8.6%).
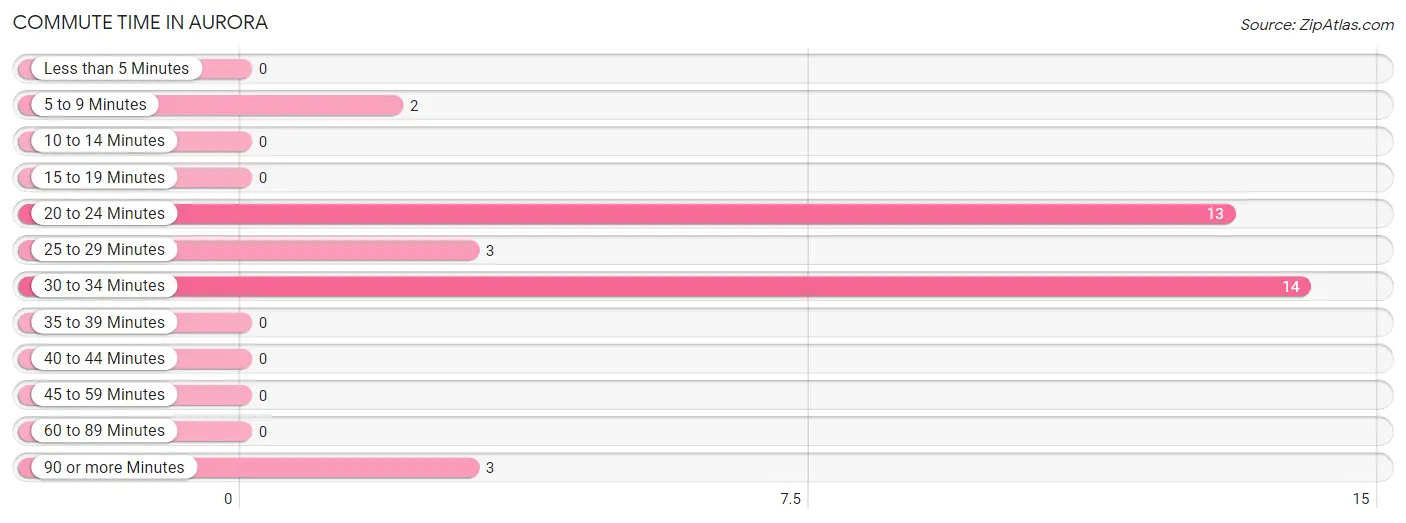
| Commute Time | # Commuters | % Commuters |
| Less than 5 Minutes | 0 | 0.0% |
| 5 to 9 Minutes | 2 | 5.7% |
| 10 to 14 Minutes | 0 | 0.0% |
| 15 to 19 Minutes | 0 | 0.0% |
| 20 to 24 Minutes | 13 | 37.1% |
| 25 to 29 Minutes | 3 | 8.6% |
| 30 to 34 Minutes | 14 | 40.0% |
| 35 to 39 Minutes | 0 | 0.0% |
| 40 to 44 Minutes | 0 | 0.0% |
| 45 to 59 Minutes | 0 | 0.0% |
| 60 to 89 Minutes | 0 | 0.0% |
| 90 or more Minutes | 3 | 8.6% |
Commute Time by Sex in Aurora
The most common commute times in Aurora are 20 to 24 minutes (11 commuters, 44.0%) for males and 30 to 34 minutes (8 commuters, 80.0%) for females.
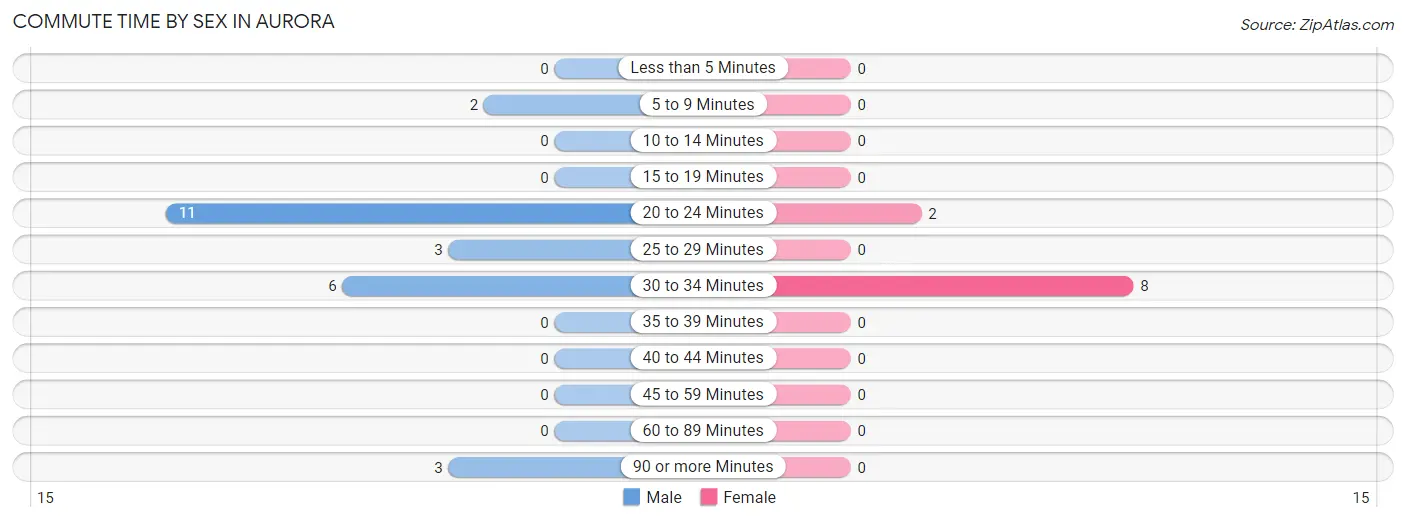
| Commute Time | Male | Female |
| Less than 5 Minutes | 0 (0.0%) | 0 (0.0%) |
| 5 to 9 Minutes | 2 (8.0%) | 0 (0.0%) |
| 10 to 14 Minutes | 0 (0.0%) | 0 (0.0%) |
| 15 to 19 Minutes | 0 (0.0%) | 0 (0.0%) |
| 20 to 24 Minutes | 11 (44.0%) | 2 (20.0%) |
| 25 to 29 Minutes | 3 (12.0%) | 0 (0.0%) |
| 30 to 34 Minutes | 6 (24.0%) | 8 (80.0%) |
| 35 to 39 Minutes | 0 (0.0%) | 0 (0.0%) |
| 40 to 44 Minutes | 0 (0.0%) | 0 (0.0%) |
| 45 to 59 Minutes | 0 (0.0%) | 0 (0.0%) |
| 60 to 89 Minutes | 0 (0.0%) | 0 (0.0%) |
| 90 or more Minutes | 3 (12.0%) | 0 (0.0%) |
Time of Departure to Work by Sex in Aurora
The most frequent times of departure to work in Aurora are 12:00 AM to 4:59 AM (8, 32.0%) for males and 7:30 AM to 7:59 AM (8, 80.0%) for females.
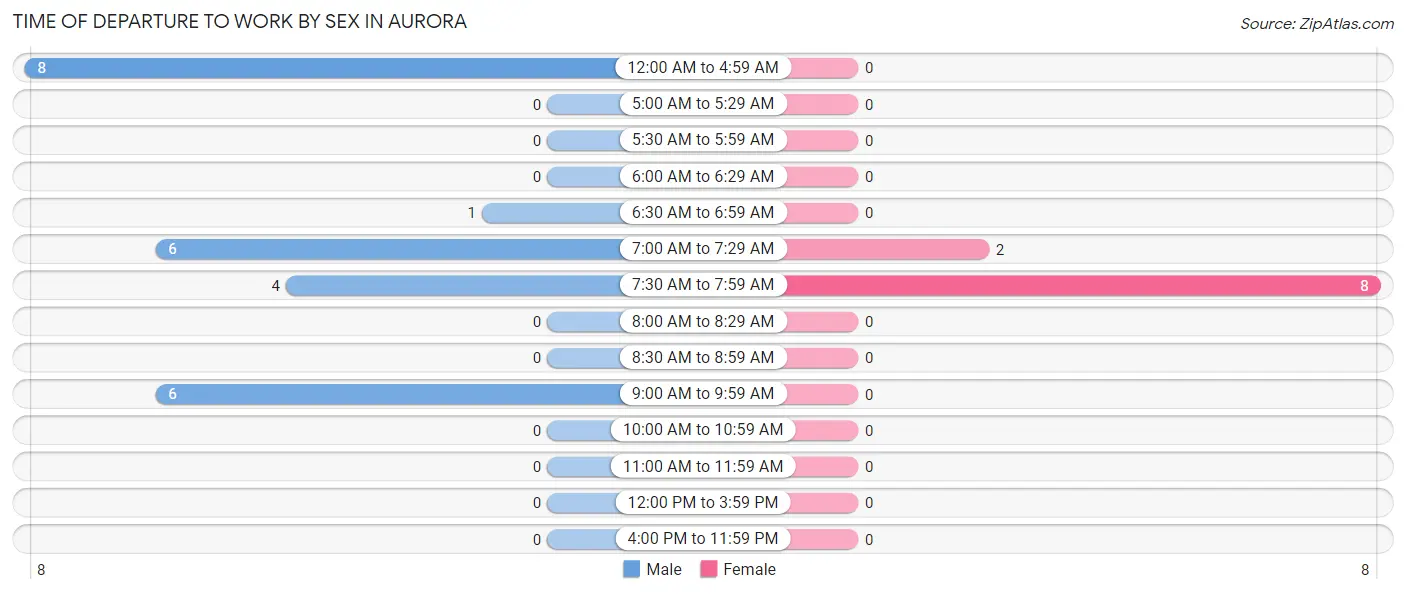
| Time of Departure | Male | Female |
| 12:00 AM to 4:59 AM | 8 (32.0%) | 0 (0.0%) |
| 5:00 AM to 5:29 AM | 0 (0.0%) | 0 (0.0%) |
| 5:30 AM to 5:59 AM | 0 (0.0%) | 0 (0.0%) |
| 6:00 AM to 6:29 AM | 0 (0.0%) | 0 (0.0%) |
| 6:30 AM to 6:59 AM | 1 (4.0%) | 0 (0.0%) |
| 7:00 AM to 7:29 AM | 6 (24.0%) | 2 (20.0%) |
| 7:30 AM to 7:59 AM | 4 (16.0%) | 8 (80.0%) |
| 8:00 AM to 8:29 AM | 0 (0.0%) | 0 (0.0%) |
| 8:30 AM to 8:59 AM | 0 (0.0%) | 0 (0.0%) |
| 9:00 AM to 9:59 AM | 6 (24.0%) | 0 (0.0%) |
| 10:00 AM to 10:59 AM | 0 (0.0%) | 0 (0.0%) |
| 11:00 AM to 11:59 AM | 0 (0.0%) | 0 (0.0%) |
| 12:00 PM to 3:59 PM | 0 (0.0%) | 0 (0.0%) |
| 4:00 PM to 11:59 PM | 0 (0.0%) | 0 (0.0%) |
| Total | 25 (100.0%) | 10 (100.0%) |
Housing Occupancy in Aurora
Occupancy by Ownership in Aurora
Of the total 32 dwellings in Aurora, owner-occupied units account for 26 (81.2%), while renter-occupied units make up 6 (18.8%).
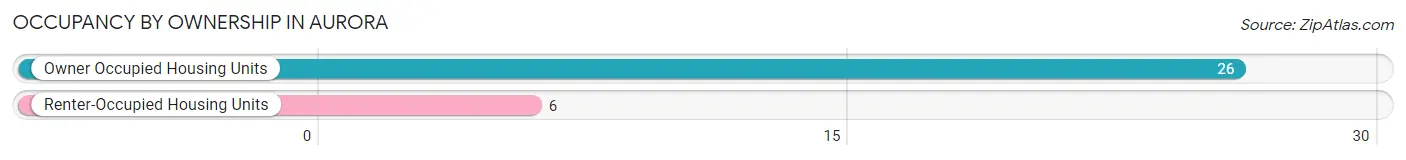
| Occupancy | # Housing Units | % Housing Units |
| Owner Occupied Housing Units | 26 | 81.2% |
| Renter-Occupied Housing Units | 6 | 18.8% |
| Total Occupied Housing Units | 32 | 100.0% |
Occupancy by Household Size in Aurora
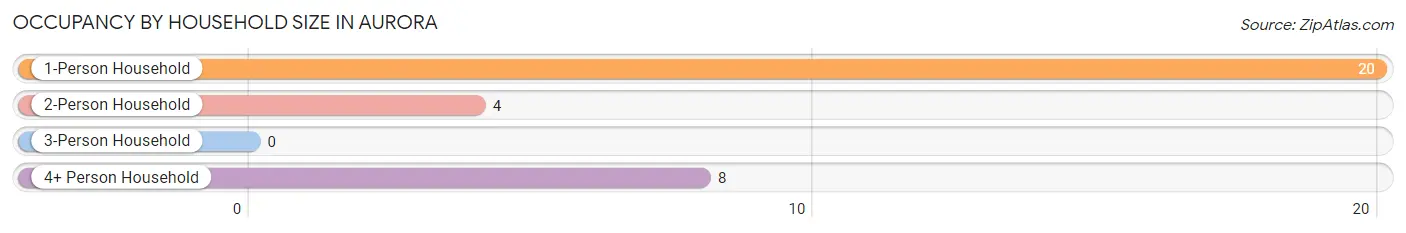
| Household Size | # Housing Units | % Housing Units |
| 1-Person Household | 20 | 62.5% |
| 2-Person Household | 4 | 12.5% |
| 3-Person Household | 0 | 0.0% |
| 4+ Person Household | 8 | 25.0% |
| Total Housing Units | 32 | 100.0% |
Occupancy by Ownership by Household Size in Aurora
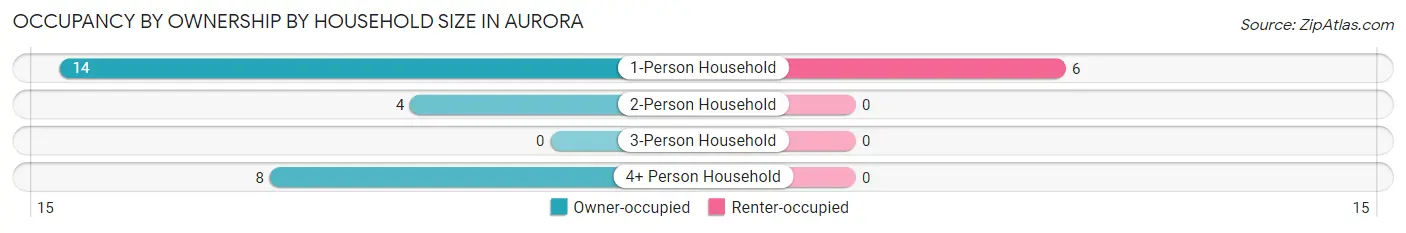
| Household Size | Owner-occupied | Renter-occupied |
| 1-Person Household | 14 (70.0%) | 6 (30.0%) |
| 2-Person Household | 4 (100.0%) | 0 (0.0%) |
| 3-Person Household | 0 (0.0%) | 0 (0.0%) |
| 4+ Person Household | 8 (100.0%) | 0 (0.0%) |
| Total Housing Units | 26 (81.2%) | 6 (18.8%) |
Occupancy by Educational Attainment in Aurora
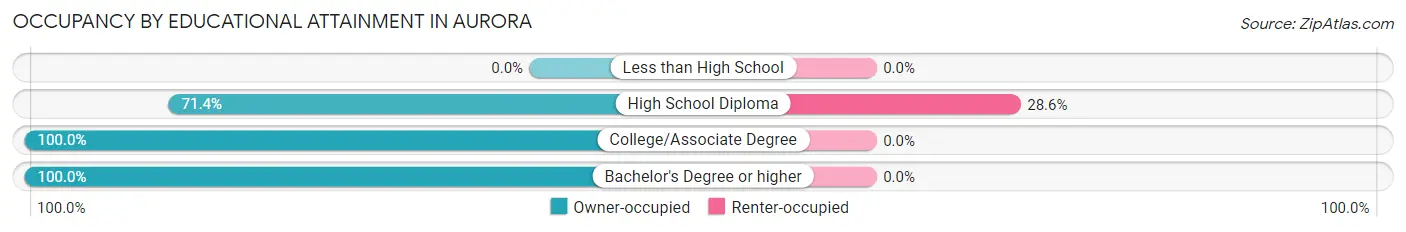
| Household Size | Owner-occupied | Renter-occupied |
| Less than High School | 0 (0.0%) | 0 (0.0%) |
| High School Diploma | 15 (71.4%) | 6 (28.6%) |
| College/Associate Degree | 8 (100.0%) | 0 (0.0%) |
| Bachelor's Degree or higher | 3 (100.0%) | 0 (0.0%) |
Occupancy by Age of Householder in Aurora
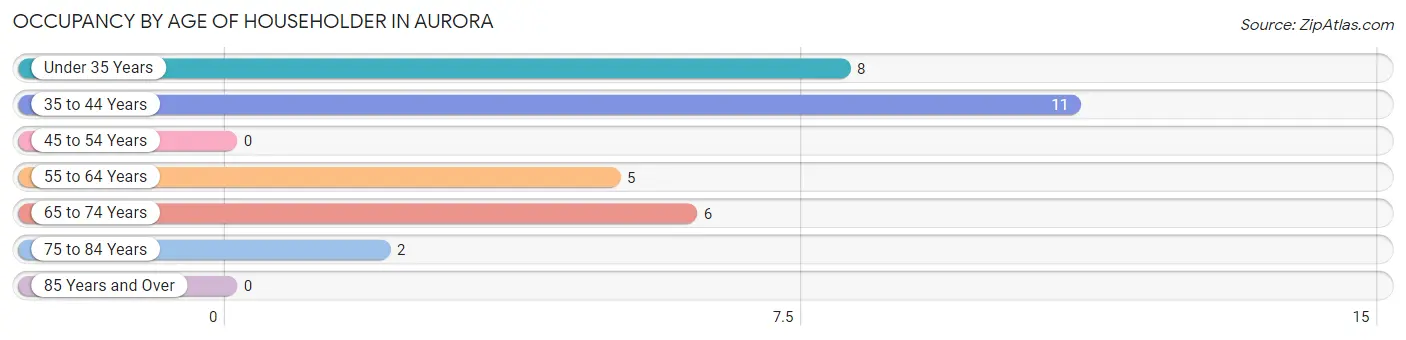
| Age Bracket | # Households | % Households |
| Under 35 Years | 8 | 25.0% |
| 35 to 44 Years | 11 | 34.4% |
| 45 to 54 Years | 0 | 0.0% |
| 55 to 64 Years | 5 | 15.6% |
| 65 to 74 Years | 6 | 18.8% |
| 75 to 84 Years | 2 | 6.2% |
| 85 Years and Over | 0 | 0.0% |
| Total | 32 | 100.0% |
Housing Finances in Aurora
Median Income by Occupancy in Aurora
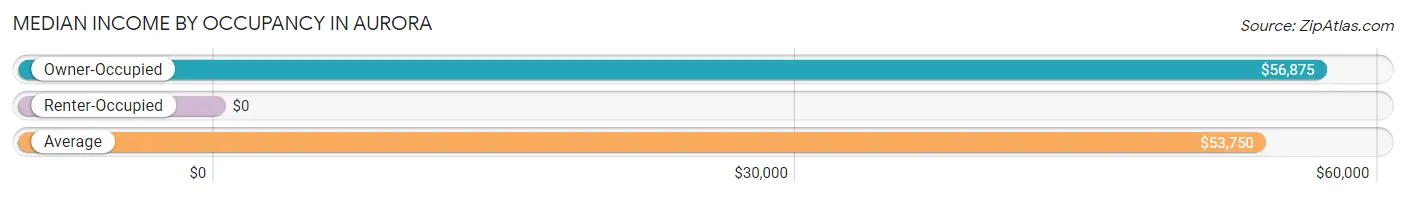
| Occupancy Type | # Households | Median Income |
| Owner-Occupied | 26 (81.2%) | $56,875 |
| Renter-Occupied | 6 (18.8%) | $0 |
| Average | 32 (100.0%) | $53,750 |
Occupancy by Householder Income Bracket in Aurora
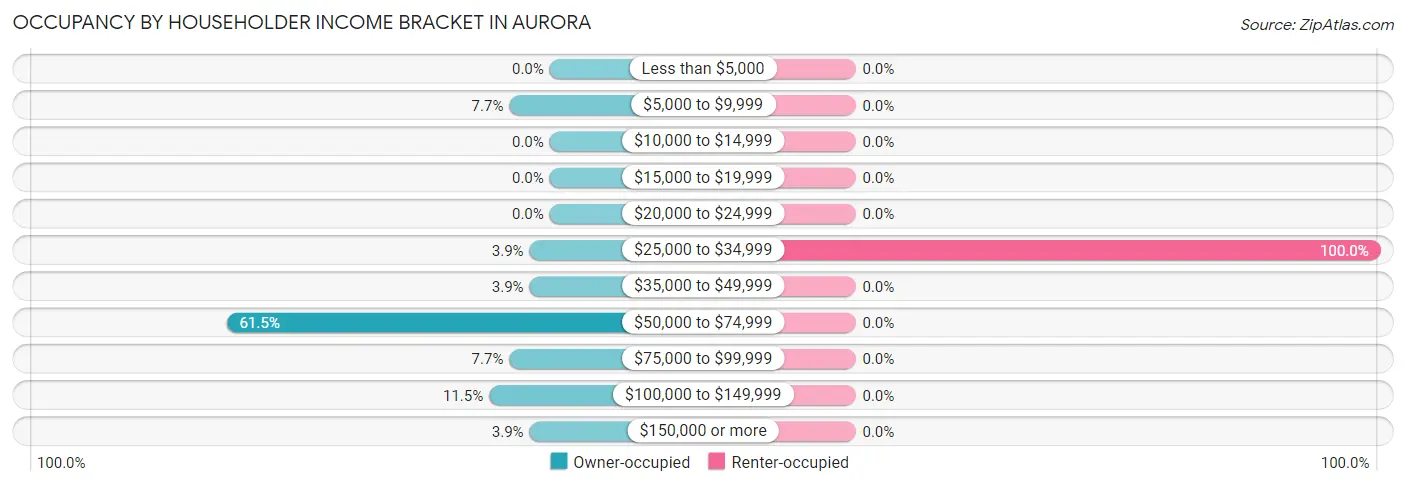
| Income Bracket | Owner-occupied | Renter-occupied |
| Less than $5,000 | 0 (0.0%) | 0 (0.0%) |
| $5,000 to $9,999 | 2 (7.7%) | 0 (0.0%) |
| $10,000 to $14,999 | 0 (0.0%) | 0 (0.0%) |
| $15,000 to $19,999 | 0 (0.0%) | 0 (0.0%) |
| $20,000 to $24,999 | 0 (0.0%) | 0 (0.0%) |
| $25,000 to $34,999 | 1 (3.8%) | 6 (100.0%) |
| $35,000 to $49,999 | 1 (3.8%) | 0 (0.0%) |
| $50,000 to $74,999 | 16 (61.5%) | 0 (0.0%) |
| $75,000 to $99,999 | 2 (7.7%) | 0 (0.0%) |
| $100,000 to $149,999 | 3 (11.5%) | 0 (0.0%) |
| $150,000 or more | 1 (3.8%) | 0 (0.0%) |
| Total | 26 (100.0%) | 6 (100.0%) |
Monthly Housing Cost Tiers in Aurora
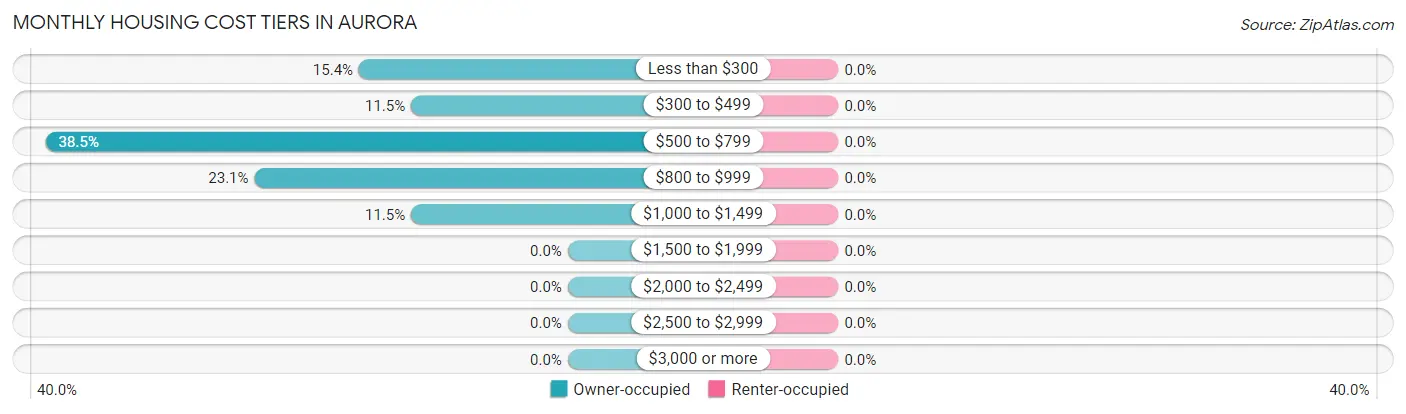
| Monthly Cost | Owner-occupied | Renter-occupied |
| Less than $300 | 4 (15.4%) | 0 (0.0%) |
| $300 to $499 | 3 (11.5%) | 0 (0.0%) |
| $500 to $799 | 10 (38.5%) | 0 (0.0%) |
| $800 to $999 | 6 (23.1%) | 0 (0.0%) |
| $1,000 to $1,499 | 3 (11.5%) | 0 (0.0%) |
| $1,500 to $1,999 | 0 (0.0%) | 0 (0.0%) |
| $2,000 to $2,499 | 0 (0.0%) | 0 (0.0%) |
| $2,500 to $2,999 | 0 (0.0%) | 0 (0.0%) |
| $3,000 or more | 0 (0.0%) | 0 (0.0%) |
| Total | 26 (100.0%) | 6 (100.0%) |
Physical Housing Characteristics in Aurora
Housing Structures in Aurora
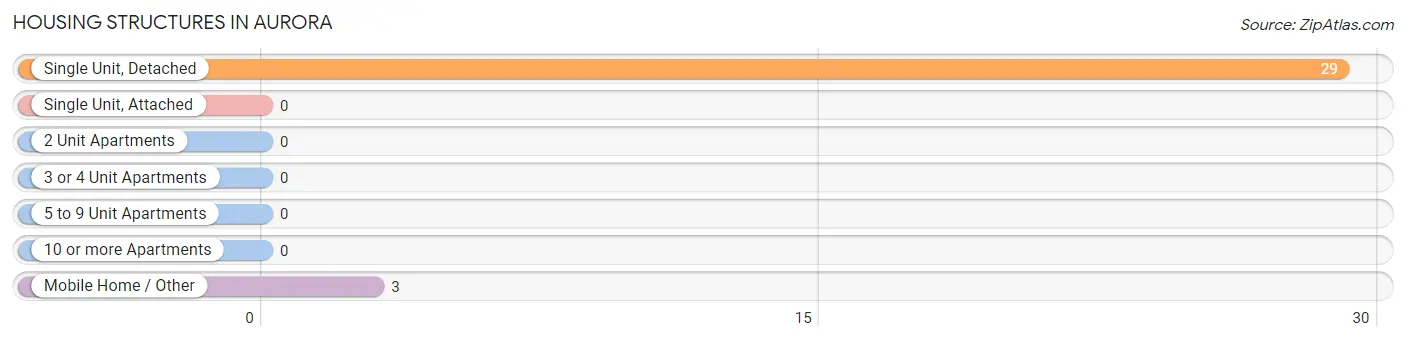
| Structure Type | # Housing Units | % Housing Units |
| Single Unit, Detached | 29 | 90.6% |
| Single Unit, Attached | 0 | 0.0% |
| 2 Unit Apartments | 0 | 0.0% |
| 3 or 4 Unit Apartments | 0 | 0.0% |
| 5 to 9 Unit Apartments | 0 | 0.0% |
| 10 or more Apartments | 0 | 0.0% |
| Mobile Home / Other | 3 | 9.4% |
| Total | 32 | 100.0% |
Housing Structures by Occupancy in Aurora
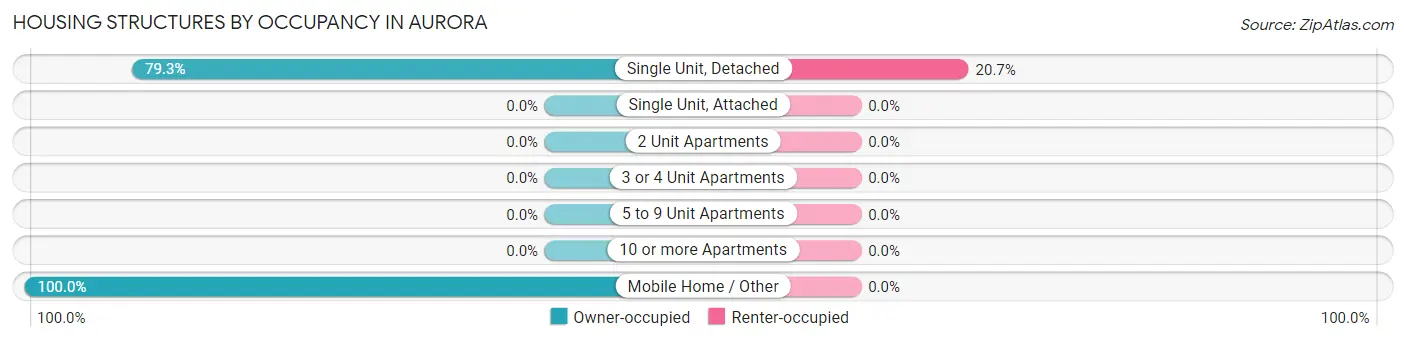
| Structure Type | Owner-occupied | Renter-occupied |
| Single Unit, Detached | 23 (79.3%) | 6 (20.7%) |
| Single Unit, Attached | 0 (0.0%) | 0 (0.0%) |
| 2 Unit Apartments | 0 (0.0%) | 0 (0.0%) |
| 3 or 4 Unit Apartments | 0 (0.0%) | 0 (0.0%) |
| 5 to 9 Unit Apartments | 0 (0.0%) | 0 (0.0%) |
| 10 or more Apartments | 0 (0.0%) | 0 (0.0%) |
| Mobile Home / Other | 3 (100.0%) | 0 (0.0%) |
| Total | 26 (81.2%) | 6 (18.8%) |
Housing Structures by Number of Rooms in Aurora
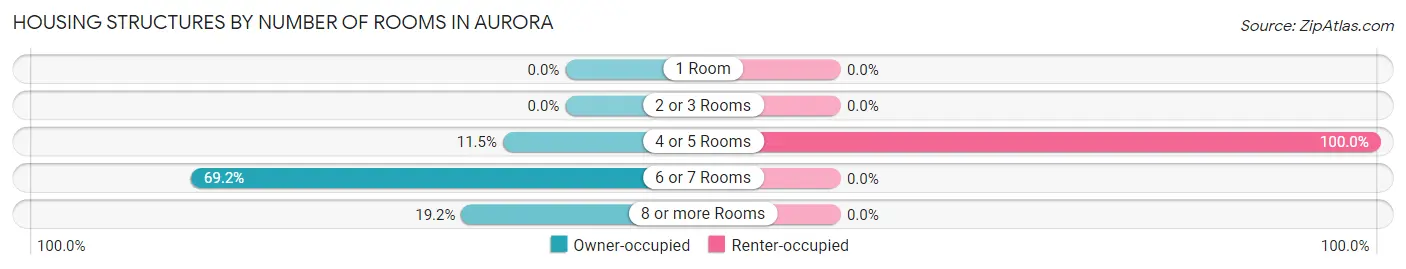
| Number of Rooms | Owner-occupied | Renter-occupied |
| 1 Room | 0 (0.0%) | 0 (0.0%) |
| 2 or 3 Rooms | 0 (0.0%) | 0 (0.0%) |
| 4 or 5 Rooms | 3 (11.5%) | 6 (100.0%) |
| 6 or 7 Rooms | 18 (69.2%) | 0 (0.0%) |
| 8 or more Rooms | 5 (19.2%) | 0 (0.0%) |
| Total | 26 (100.0%) | 6 (100.0%) |
Housing Structure by Heating Type in Aurora
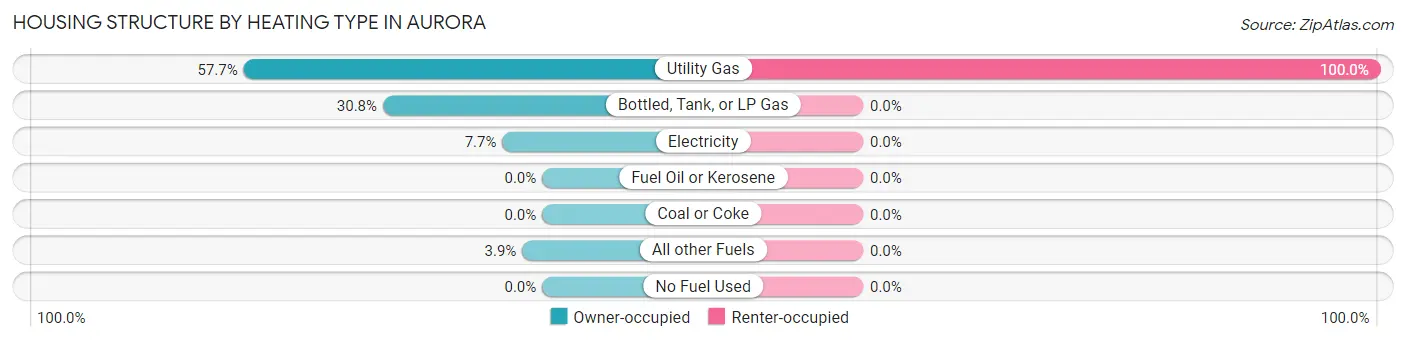
| Heating Type | Owner-occupied | Renter-occupied |
| Utility Gas | 15 (57.7%) | 6 (100.0%) |
| Bottled, Tank, or LP Gas | 8 (30.8%) | 0 (0.0%) |
| Electricity | 2 (7.7%) | 0 (0.0%) |
| Fuel Oil or Kerosene | 0 (0.0%) | 0 (0.0%) |
| Coal or Coke | 0 (0.0%) | 0 (0.0%) |
| All other Fuels | 1 (3.8%) | 0 (0.0%) |
| No Fuel Used | 0 (0.0%) | 0 (0.0%) |
| Total | 26 (100.0%) | 6 (100.0%) |
Household Vehicle Usage in Aurora
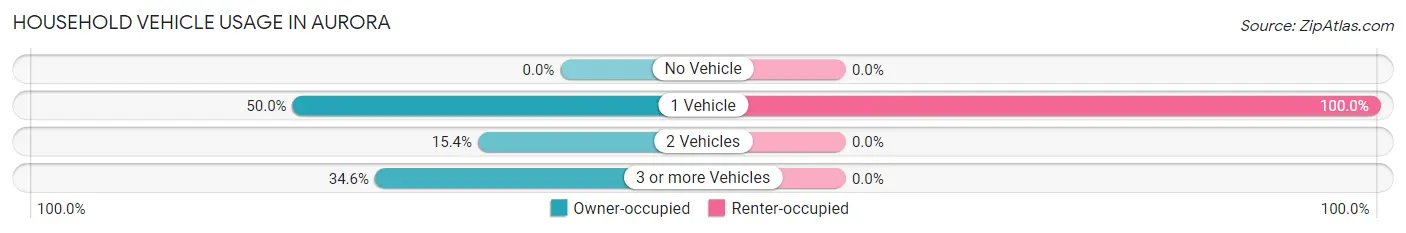
| Vehicles per Household | Owner-occupied | Renter-occupied |
| No Vehicle | 0 (0.0%) | 0 (0.0%) |
| 1 Vehicle | 13 (50.0%) | 6 (100.0%) |
| 2 Vehicles | 4 (15.4%) | 0 (0.0%) |
| 3 or more Vehicles | 9 (34.6%) | 0 (0.0%) |
| Total | 26 (100.0%) | 6 (100.0%) |
Real Estate & Mortgages in Aurora
Real Estate and Mortgage Overview in Aurora
| Characteristic | Without Mortgage | With Mortgage |
| Housing Units | 12 | 14 |
| Median Property Value | $55,000 | $40,000 |
| Median Household Income | $56,250 | $1 |
| Monthly Housing Costs | $400 | $0 |
| Real Estate Taxes | $900 | $0 |
Property Value by Mortgage Status in Aurora
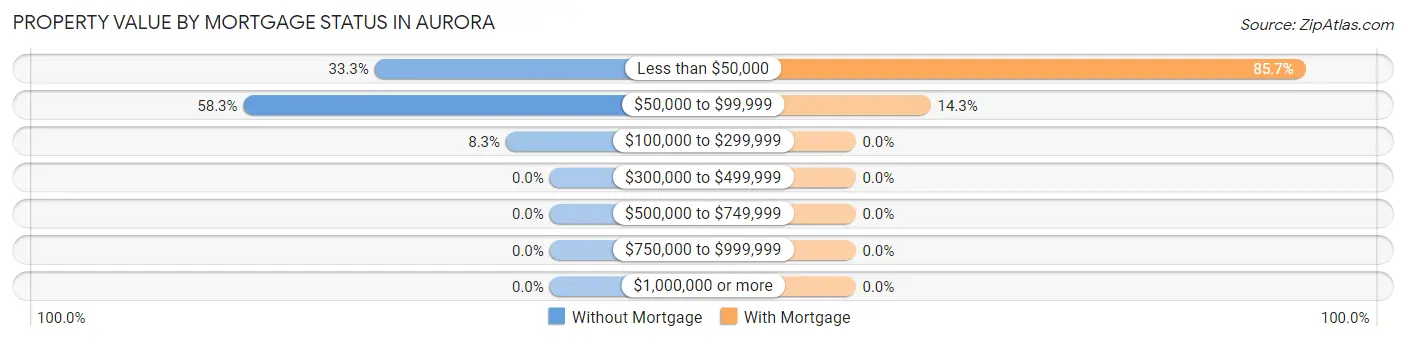
| Property Value | Without Mortgage | With Mortgage |
| Less than $50,000 | 4 (33.3%) | 12 (85.7%) |
| $50,000 to $99,999 | 7 (58.3%) | 2 (14.3%) |
| $100,000 to $299,999 | 1 (8.3%) | 0 (0.0%) |
| $300,000 to $499,999 | 0 (0.0%) | 0 (0.0%) |
| $500,000 to $749,999 | 0 (0.0%) | 0 (0.0%) |
| $750,000 to $999,999 | 0 (0.0%) | 0 (0.0%) |
| $1,000,000 or more | 0 (0.0%) | 0 (0.0%) |
| Total | 12 (100.0%) | 14 (100.0%) |
Household Income by Mortgage Status in Aurora
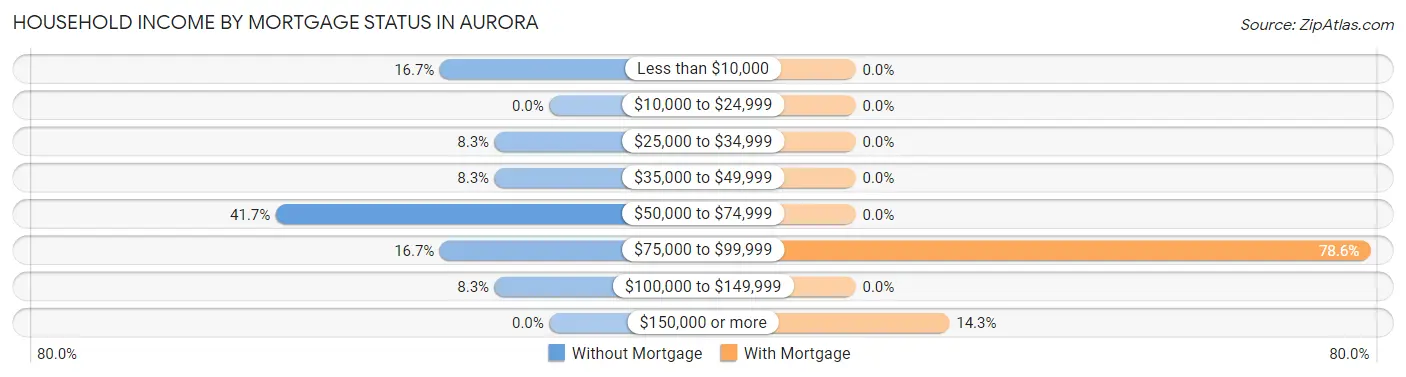
| Household Income | Without Mortgage | With Mortgage |
| Less than $10,000 | 2 (16.7%) | 0 (0.0%) |
| $10,000 to $24,999 | 0 (0.0%) | 0 (0.0%) |
| $25,000 to $34,999 | 1 (8.3%) | 0 (0.0%) |
| $35,000 to $49,999 | 1 (8.3%) | 0 (0.0%) |
| $50,000 to $74,999 | 5 (41.7%) | 0 (0.0%) |
| $75,000 to $99,999 | 2 (16.7%) | 11 (78.6%) |
| $100,000 to $149,999 | 1 (8.3%) | 0 (0.0%) |
| $150,000 or more | 0 (0.0%) | 2 (14.3%) |
| Total | 12 (100.0%) | 14 (100.0%) |
Property Value to Household Income Ratio in Aurora
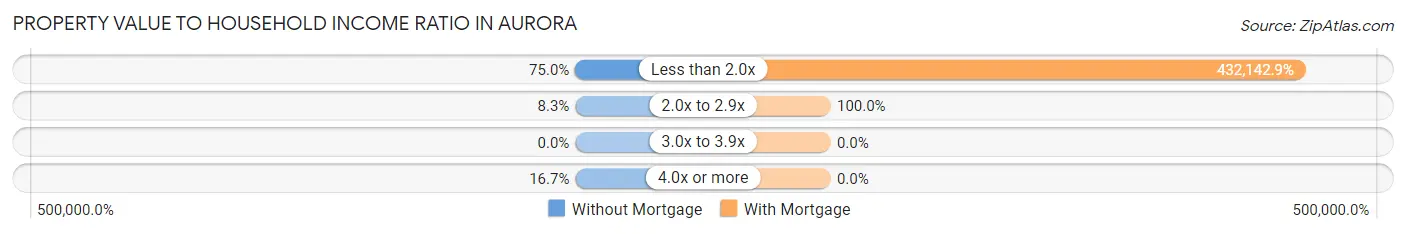
| Value-to-Income Ratio | Without Mortgage | With Mortgage |
| Less than 2.0x | 9 (75.0%) | 60,500 (432,142.9%) |
| 2.0x to 2.9x | 1 (8.3%) | 14 (100.0%) |
| 3.0x to 3.9x | 0 (0.0%) | 0 (0.0%) |
| 4.0x or more | 2 (16.7%) | 0 (0.0%) |
| Total | 12 (100.0%) | 14 (100.0%) |
Real Estate Taxes by Mortgage Status in Aurora
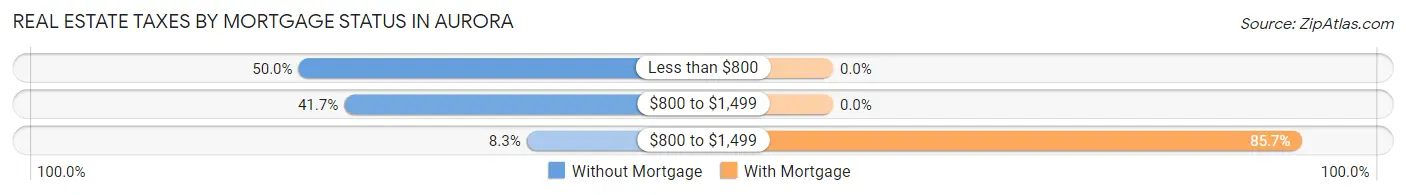
| Property Taxes | Without Mortgage | With Mortgage |
| Less than $800 | 6 (50.0%) | 0 (0.0%) |
| $800 to $1,499 | 5 (41.7%) | 0 (0.0%) |
| $800 to $1,499 | 1 (8.3%) | 12 (85.7%) |
| Total | 12 (100.0%) | 14 (100.0%) |
Health & Disability in Aurora
Health Insurance Coverage by Age in Aurora
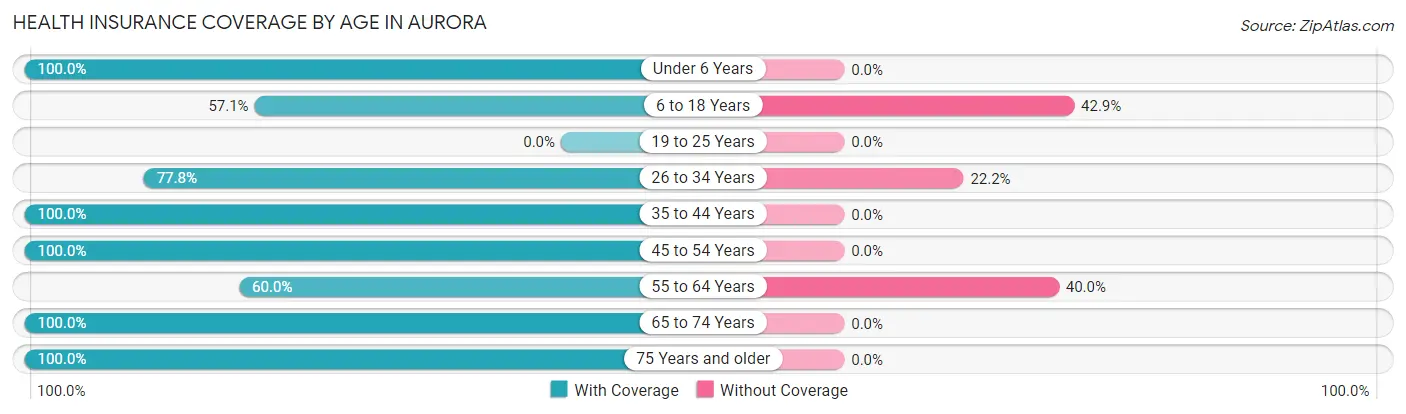
| Age Bracket | With Coverage | Without Coverage |
| Under 6 Years | 12 (100.0%) | 0 (0.0%) |
| 6 to 18 Years | 4 (57.1%) | 3 (42.9%) |
| 19 to 25 Years | 0 (0.0%) | 0 (0.0%) |
| 26 to 34 Years | 14 (77.8%) | 4 (22.2%) |
| 35 to 44 Years | 11 (100.0%) | 0 (0.0%) |
| 45 to 54 Years | 2 (100.0%) | 0 (0.0%) |
| 55 to 64 Years | 3 (60.0%) | 2 (40.0%) |
| 65 to 74 Years | 9 (100.0%) | 0 (0.0%) |
| 75 Years and older | 2 (100.0%) | 0 (0.0%) |
| Total | 57 (86.4%) | 9 (13.6%) |
Health Insurance Coverage by Citizenship Status in Aurora
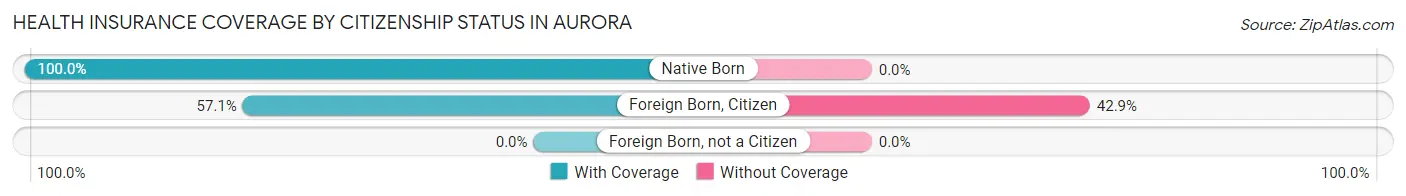
| Citizenship Status | With Coverage | Without Coverage |
| Native Born | 12 (100.0%) | 0 (0.0%) |
| Foreign Born, Citizen | 4 (57.1%) | 3 (42.9%) |
| Foreign Born, not a Citizen | 0 (0.0%) | 0 (0.0%) |
Health Insurance Coverage by Household Income in Aurora
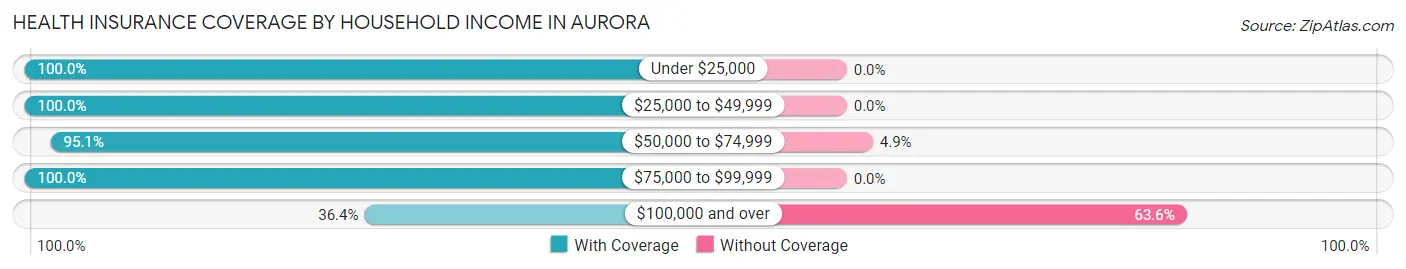
| Household Income | With Coverage | Without Coverage |
| Under $25,000 | 2 (100.0%) | 0 (0.0%) |
| $25,000 to $49,999 | 8 (100.0%) | 0 (0.0%) |
| $50,000 to $74,999 | 39 (95.1%) | 2 (4.9%) |
| $75,000 to $99,999 | 4 (100.0%) | 0 (0.0%) |
| $100,000 and over | 4 (36.4%) | 7 (63.6%) |
Public vs Private Health Insurance Coverage by Age in Aurora
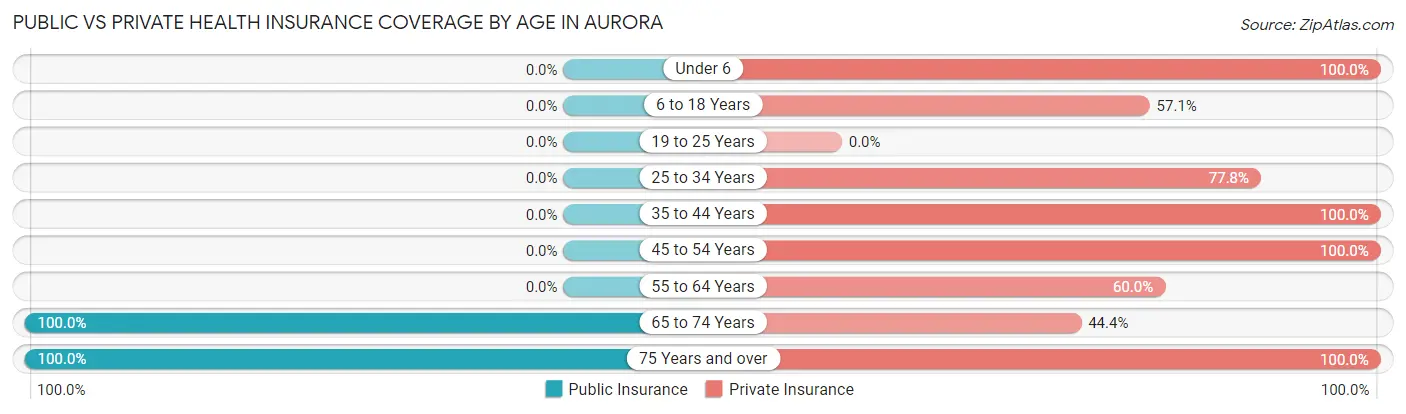
| Age Bracket | Public Insurance | Private Insurance |
| Under 6 | 0 (0.0%) | 12 (100.0%) |
| 6 to 18 Years | 0 (0.0%) | 4 (57.1%) |
| 19 to 25 Years | 0 (0.0%) | 0 (0.0%) |
| 25 to 34 Years | 0 (0.0%) | 14 (77.8%) |
| 35 to 44 Years | 0 (0.0%) | 11 (100.0%) |
| 45 to 54 Years | 0 (0.0%) | 2 (100.0%) |
| 55 to 64 Years | 0 (0.0%) | 3 (60.0%) |
| 65 to 74 Years | 9 (100.0%) | 4 (44.4%) |
| 75 Years and over | 2 (100.0%) | 2 (100.0%) |
| Total | 11 (16.7%) | 52 (78.8%) |
Disability Status by Sex by Age in Aurora
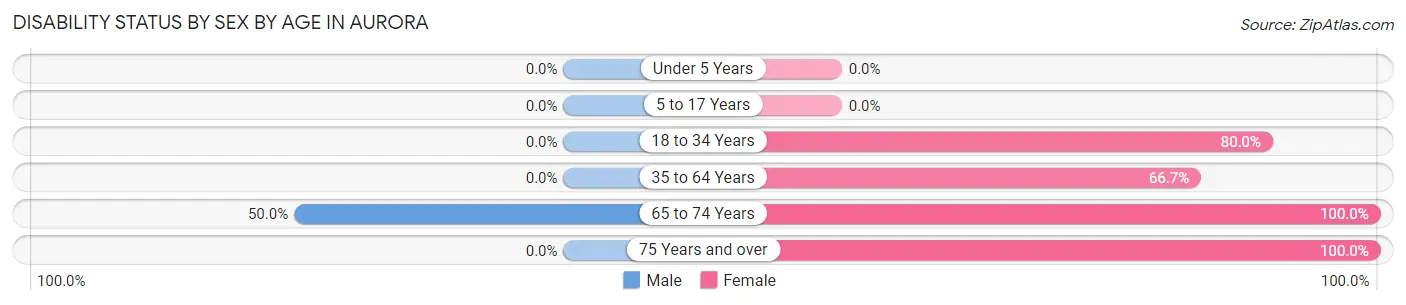
| Age Bracket | Male | Female |
| Under 5 Years | 0 (0.0%) | 0 (0.0%) |
| 5 to 17 Years | 0 (0.0%) | 0 (0.0%) |
| 18 to 34 Years | 0 (0.0%) | 8 (80.0%) |
| 35 to 64 Years | 0 (0.0%) | 2 (66.7%) |
| 65 to 74 Years | 3 (50.0%) | 3 (100.0%) |
| 75 Years and over | 0 (0.0%) | 2 (100.0%) |
Disability Class by Sex by Age in Aurora
Disability Class: Hearing Difficulty
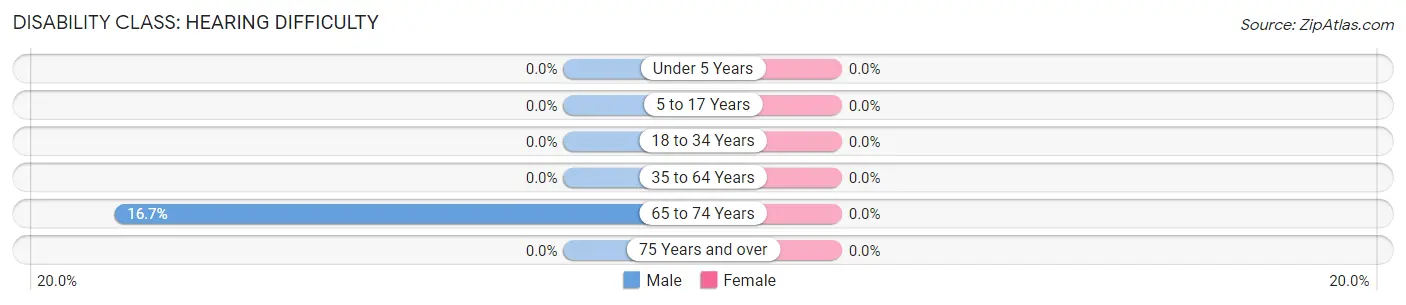
| Age Bracket | Male | Female |
| Under 5 Years | 0 (0.0%) | 0 (0.0%) |
| 5 to 17 Years | 0 (0.0%) | 0 (0.0%) |
| 18 to 34 Years | 0 (0.0%) | 0 (0.0%) |
| 35 to 64 Years | 0 (0.0%) | 0 (0.0%) |
| 65 to 74 Years | 1 (16.7%) | 0 (0.0%) |
| 75 Years and over | 0 (0.0%) | 0 (0.0%) |
Disability Class: Vision Difficulty
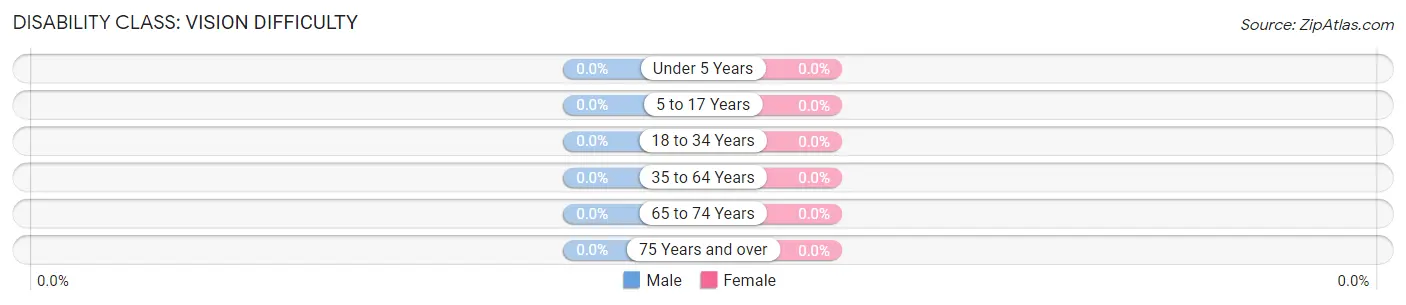
| Age Bracket | Male | Female |
| Under 5 Years | 0 (0.0%) | 0 (0.0%) |
| 5 to 17 Years | 0 (0.0%) | 0 (0.0%) |
| 18 to 34 Years | 0 (0.0%) | 0 (0.0%) |
| 35 to 64 Years | 0 (0.0%) | 0 (0.0%) |
| 65 to 74 Years | 0 (0.0%) | 0 (0.0%) |
| 75 Years and over | 0 (0.0%) | 0 (0.0%) |
Disability Class: Cognitive Difficulty
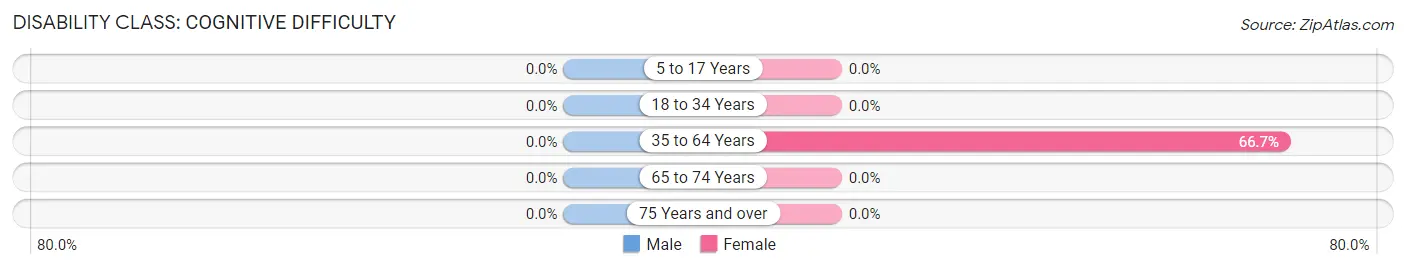
| Age Bracket | Male | Female |
| 5 to 17 Years | 0 (0.0%) | 0 (0.0%) |
| 18 to 34 Years | 0 (0.0%) | 0 (0.0%) |
| 35 to 64 Years | 0 (0.0%) | 2 (66.7%) |
| 65 to 74 Years | 0 (0.0%) | 0 (0.0%) |
| 75 Years and over | 0 (0.0%) | 0 (0.0%) |
Disability Class: Ambulatory Difficulty
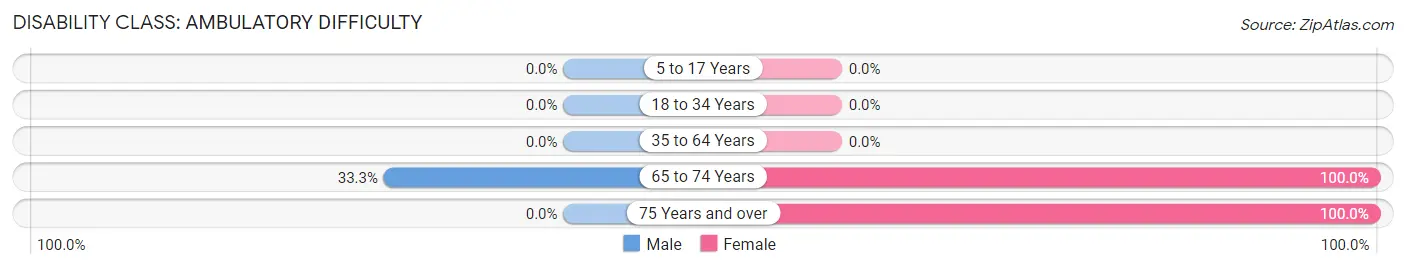
| Age Bracket | Male | Female |
| 5 to 17 Years | 0 (0.0%) | 0 (0.0%) |
| 18 to 34 Years | 0 (0.0%) | 0 (0.0%) |
| 35 to 64 Years | 0 (0.0%) | 0 (0.0%) |
| 65 to 74 Years | 2 (33.3%) | 3 (100.0%) |
| 75 Years and over | 0 (0.0%) | 2 (100.0%) |
Disability Class: Self-Care Difficulty
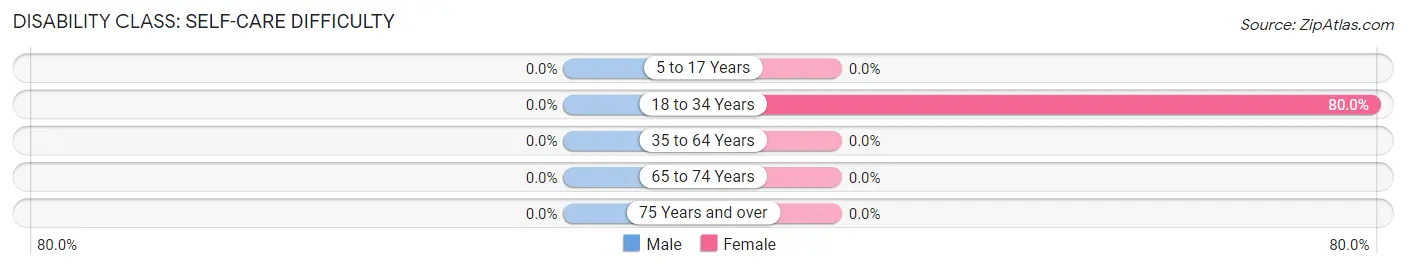
| Age Bracket | Male | Female |
| 5 to 17 Years | 0 (0.0%) | 0 (0.0%) |
| 18 to 34 Years | 0 (0.0%) | 8 (80.0%) |
| 35 to 64 Years | 0 (0.0%) | 0 (0.0%) |
| 65 to 74 Years | 0 (0.0%) | 0 (0.0%) |
| 75 Years and over | 0 (0.0%) | 0 (0.0%) |
Technology Access in Aurora
Computing Device Access in Aurora
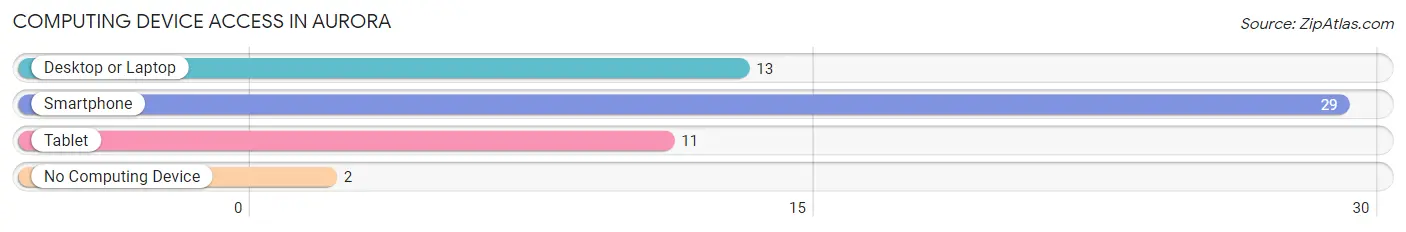
| Device Type | # Households | % Households |
| Desktop or Laptop | 13 | 40.6% |
| Smartphone | 29 | 90.6% |
| Tablet | 11 | 34.4% |
| No Computing Device | 2 | 6.2% |
| Total | 32 | 100.0% |
Internet Access in Aurora
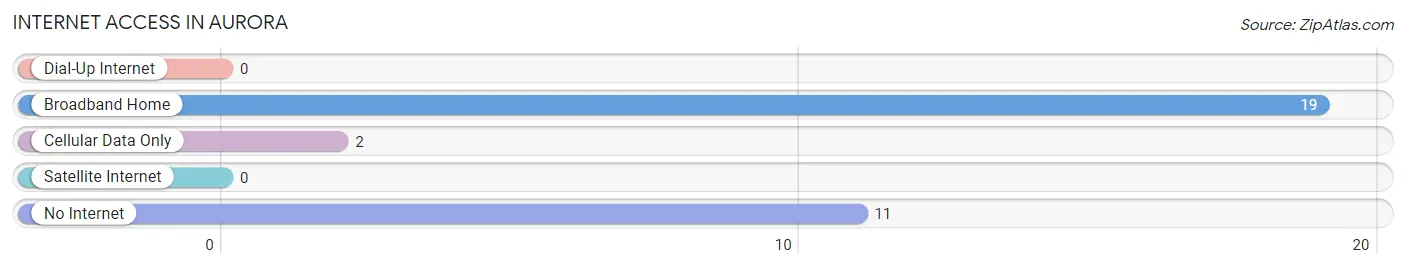
| Internet Type | # Households | % Households |
| Dial-Up Internet | 0 | 0.0% |
| Broadband Home | 19 | 59.4% |
| Cellular Data Only | 2 | 6.2% |
| Satellite Internet | 0 | 0.0% |
| No Internet | 11 | 34.4% |
| Total | 32 | 100.0% |
Aurora Summary
Aurora, Kansas is a small town located in the southeastern corner of the state, in the county of Montgomery. It is situated on the banks of the Neosho River, and is surrounded by rolling hills and farmland. The town has a population of just over 1,000 people, and is known for its small-town charm and friendly atmosphere.
History
Aurora was founded in 1871 by a group of settlers from the nearby town of Osage City. The town was named after the Roman goddess of the dawn, Aurora. The settlers were attracted to the area by the abundance of natural resources, including timber, coal, and limestone. The town quickly grew, and by the early 1900s, it had become a thriving community.
In the early 1900s, Aurora was a major center for coal mining. The town was home to several coal mines, and the coal industry provided many jobs for the local residents. The town also had a thriving lumber industry, and several sawmills were located in the area.
In the 1950s, the coal industry began to decline, and many of the mines closed. This caused a significant economic downturn in the town, and many of the residents moved away in search of work. In the late 1970s, the town began to experience a resurgence, as new businesses began to move into the area.
Geography
Aurora is located in the southeastern corner of Kansas, in the county of Montgomery. It is situated on the banks of the Neosho River, and is surrounded by rolling hills and farmland. The town is located approximately 30 miles south of the state capital, Topeka.
The climate in Aurora is generally mild, with hot summers and cold winters. The average temperature in the summer is around 80 degrees Fahrenheit, and the average temperature in the winter is around 40 degrees Fahrenheit.
Economy
Aurora’s economy is largely based on agriculture and tourism. The town is home to several farms, and the surrounding area is known for its fertile soil and abundant natural resources. The town also has several small businesses, including restaurants, shops, and other services.
Tourism is an important part of the local economy, as the town is home to several attractions, including the historic Montgomery County Courthouse, the Aurora Museum, and the Aurora Historical Society. The town also hosts several annual events, such as the Aurora Days Festival and the Aurora County Fair.
Demographics
As of the 2010 census, the population of Aurora was 1,039. The racial makeup of the town was 95.3% White, 0.7% African American, 0.3% Native American, 0.3% Asian, 0.1% Pacific Islander, and 2.3% from other races. The median household income was $37,917, and the median family income was $45,625.
The town is served by the Montgomery County School District, which includes two elementary schools, one middle school, and one high school. The town also has several churches, including the First United Methodist Church, the First Baptist Church, and the Church of the Nazarene.
Aurora is a small town with a rich history and a friendly atmosphere. The town is home to several businesses and attractions, and the local economy is largely based on agriculture and tourism. The town has a diverse population, and the residents are proud of their small-town charm.
Common Questions
What is Per Capita Income in Aurora?
Per Capita income in Aurora is $29,535.
What is the Median Family Income in Aurora?
Median Family Income in Aurora is $62,500.
What is the Median Household income in Aurora?
Median Household Income in Aurora is $53,750.
What is Inequality or Gini Index in Aurora?
Inequality or Gini Index in Aurora is 0.30.
What is the Total Population of Aurora?
Total Population of Aurora is 66.
What is the Total Male Population of Aurora?
Total Male Population of Aurora is 35.
What is the Total Female Population of Aurora?
Total Female Population of Aurora is 31.
What is the Ratio of Males per 100 Females in Aurora?
There are 112.90 Males per 100 Females in Aurora.
What is the Ratio of Females per 100 Males in Aurora?
There are 88.57 Females per 100 Males in Aurora.
What is the Median Population Age in Aurora?
Median Population Age in Aurora is 30.5 Years.
What is the Average Family Size in Aurora
Average Family Size in Aurora is 3.8 People.
What is the Average Household Size in Aurora
Average Household Size in Aurora is 2.1 People.
How Large is the Labor Force in Aurora?
There are 35 People in the Labor Forcein in Aurora.
What is the Percentage of People in the Labor Force in Aurora?
74.5% of People are in the Labor Force in Aurora.