Ashland, KS Map & Demographics
Ashland Map
Ashland Overview
$32,393
PER CAPITA INCOME
$84,444
AVG FAMILY INCOME
$60,179
AVG HOUSEHOLD INCOME
31.1%
WAGE / INCOME GAP [ % ]
68.9¢/ $1
WAGE / INCOME GAP [ $ ]
0.37
INEQUALITY / GINI INDEX
802
TOTAL POPULATION
391
MALE POPULATION
411
FEMALE POPULATION
95.13
MALES / 100 FEMALES
105.12
FEMALES / 100 MALES
50.1
MEDIAN AGE
3.0
AVG FAMILY SIZE
2.2
AVG HOUSEHOLD SIZE
462
LABOR FORCE [ PEOPLE ]
69.4%
PERCENT IN LABOR FORCE
1.3%
UNEMPLOYMENT RATE
Ashland Zip Codes
Ashland Area Codes
Income in Ashland
Income Overview in Ashland
Per Capita Income in Ashland is $32,393, while median incomes of families and households are $84,444 and $60,179 respectively.
| Characteristic | Number | Measure |
| Per Capita Income | 802 | $32,393 |
| Median Family Income | 188 | $84,444 |
| Mean Family Income | 188 | $90,657 |
| Median Household Income | 343 | $60,179 |
| Mean Household Income | 343 | $70,629 |
| Income Deficit | 188 | $0 |
| Wage / Income Gap (%) | 802 | 31.08% |
| Wage / Income Gap ($) | 802 | 68.92¢ per $1 |
| Gini / Inequality Index | 802 | 0.37 |
Earnings by Sex in Ashland
Average Earnings in Ashland are $32,656, $40,750 for men and $28,083 for women, a difference of 31.1%.
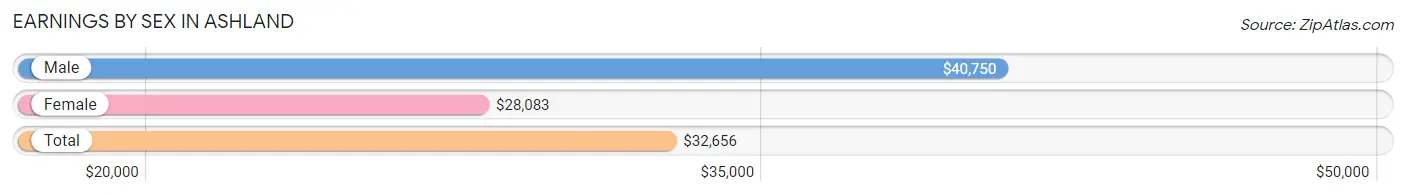
| Sex | Number | Average Earnings |
| Male | 236 (47.3%) | $40,750 |
| Female | 263 (52.7%) | $28,083 |
| Total | 499 (100.0%) | $32,656 |
Earnings by Sex by Income Bracket in Ashland
The most common earnings brackets in Ashland are $25,000 to $29,999 for men (58 | 24.6%) and $12,500 to $14,999 for women (35 | 13.3%).
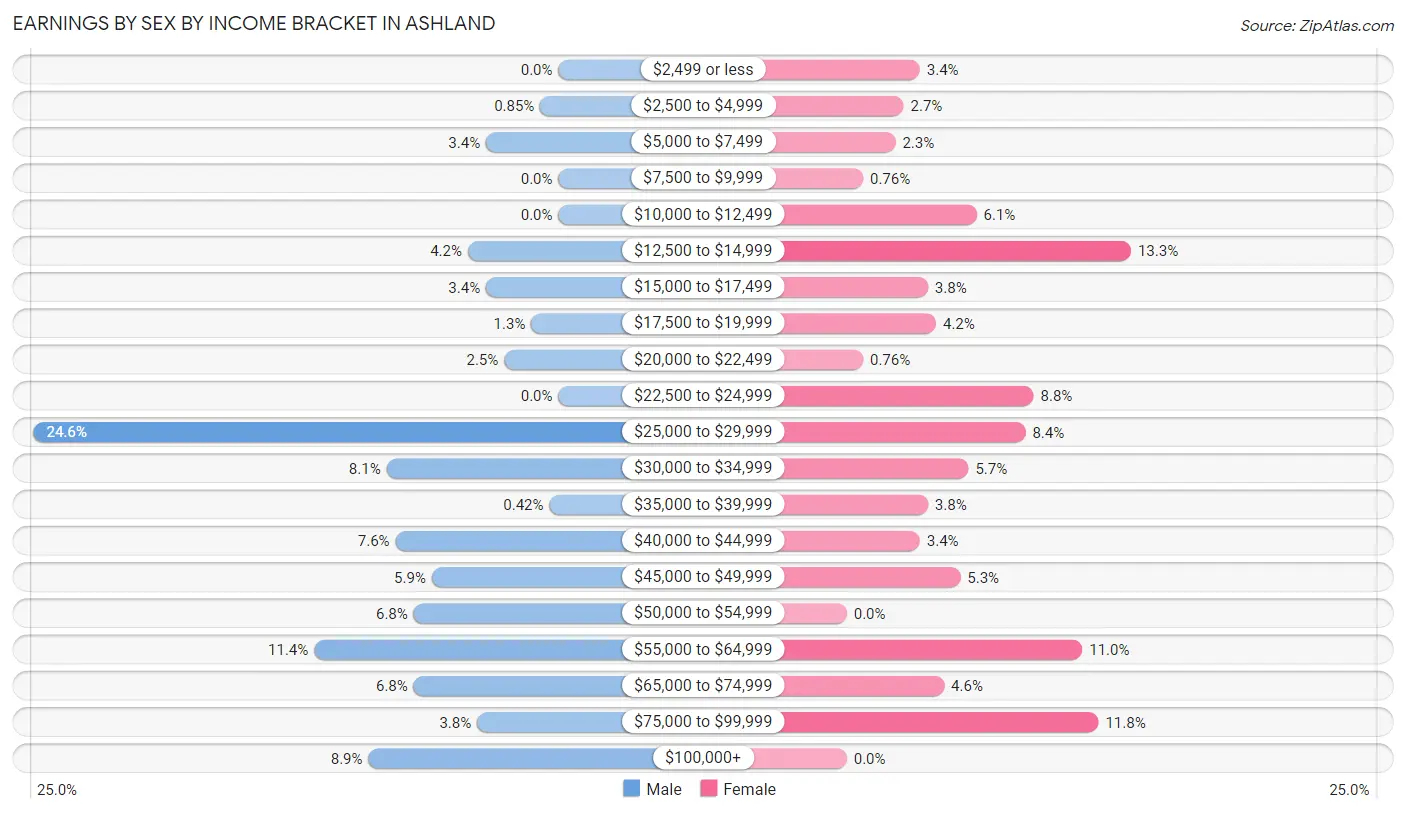
| Income | Male | Female |
| $2,499 or less | 0 (0.0%) | 9 (3.4%) |
| $2,500 to $4,999 | 2 (0.9%) | 7 (2.7%) |
| $5,000 to $7,499 | 8 (3.4%) | 6 (2.3%) |
| $7,500 to $9,999 | 0 (0.0%) | 2 (0.8%) |
| $10,000 to $12,499 | 0 (0.0%) | 16 (6.1%) |
| $12,500 to $14,999 | 10 (4.2%) | 35 (13.3%) |
| $15,000 to $17,499 | 8 (3.4%) | 10 (3.8%) |
| $17,500 to $19,999 | 3 (1.3%) | 11 (4.2%) |
| $20,000 to $22,499 | 6 (2.5%) | 2 (0.8%) |
| $22,500 to $24,999 | 0 (0.0%) | 23 (8.7%) |
| $25,000 to $29,999 | 58 (24.6%) | 22 (8.4%) |
| $30,000 to $34,999 | 19 (8.1%) | 15 (5.7%) |
| $35,000 to $39,999 | 1 (0.4%) | 10 (3.8%) |
| $40,000 to $44,999 | 18 (7.6%) | 9 (3.4%) |
| $45,000 to $49,999 | 14 (5.9%) | 14 (5.3%) |
| $50,000 to $54,999 | 16 (6.8%) | 0 (0.0%) |
| $55,000 to $64,999 | 27 (11.4%) | 29 (11.0%) |
| $65,000 to $74,999 | 16 (6.8%) | 12 (4.6%) |
| $75,000 to $99,999 | 9 (3.8%) | 31 (11.8%) |
| $100,000+ | 21 (8.9%) | 0 (0.0%) |
| Total | 236 (100.0%) | 263 (100.0%) |
Earnings by Sex by Educational Attainment in Ashland
Average earnings in Ashland are $41,750 for men and $33,750 for women, a difference of 19.2%. Men with an educational attainment of high school diploma enjoy the highest average annual earnings of $47,143, while those with bachelor's degree education earn the least with $29,180. Women with an educational attainment of bachelor's degree earn the most with the average annual earnings of $75,833, while those with college or associate's degree education have the smallest earnings of $28,667.
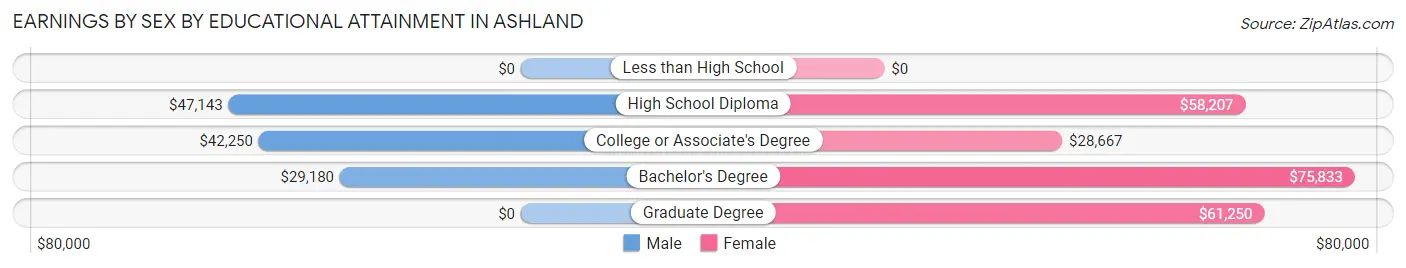
| Educational Attainment | Male Income | Female Income |
| Less than High School | - | - |
| High School Diploma | $47,143 | $58,207 |
| College or Associate's Degree | $42,250 | $28,667 |
| Bachelor's Degree | $29,180 | $75,833 |
| Graduate Degree | - | - |
| Total | $41,750 | $33,750 |
Family Income in Ashland
Family Income Brackets in Ashland
According to the Ashland family income data, there are 65 families falling into the $75,000 to $99,999 income range, which is the most common income bracket and makes up 34.6% of all families.
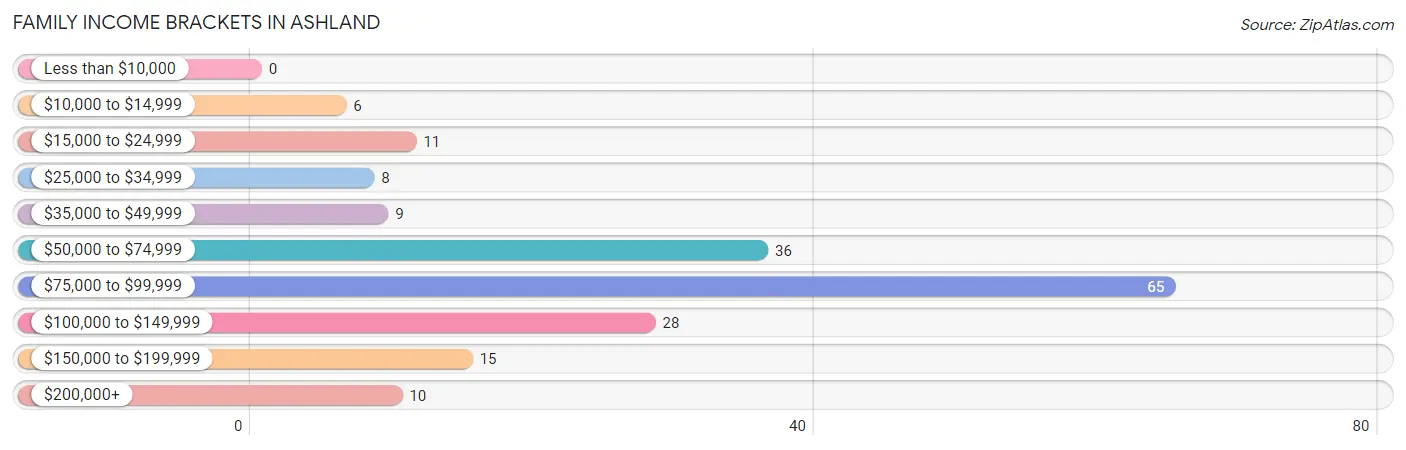
| Income Bracket | # Families | % Families |
| Less than $10,000 | 0 | 0.0% |
| $10,000 to $14,999 | 6 | 3.2% |
| $15,000 to $24,999 | 11 | 5.9% |
| $25,000 to $34,999 | 8 | 4.3% |
| $35,000 to $49,999 | 9 | 4.8% |
| $50,000 to $74,999 | 36 | 19.1% |
| $75,000 to $99,999 | 65 | 34.6% |
| $100,000 to $149,999 | 28 | 14.9% |
| $150,000 to $199,999 | 15 | 8.0% |
| $200,000+ | 10 | 5.3% |
Family Income by Famaliy Size in Ashland
3-person families (27 | 14.4%) account for the highest median family income in Ashland with $106,250 per family, while 2-person families (125 | 66.5%) have the highest median income of $43,886 per family member.
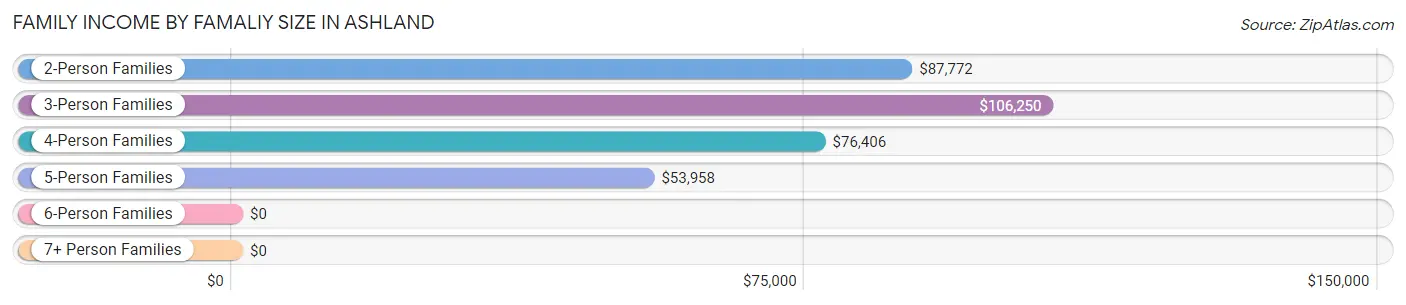
| Income Bracket | # Families | Median Income |
| 2-Person Families | 125 (66.5%) | $87,772 |
| 3-Person Families | 27 (14.4%) | $106,250 |
| 4-Person Families | 21 (11.2%) | $76,406 |
| 5-Person Families | 7 (3.7%) | $53,958 |
| 6-Person Families | 8 (4.3%) | $0 |
| 7+ Person Families | 0 (0.0%) | $0 |
| Total | 188 (100.0%) | $84,444 |
Family Income by Number of Earners in Ashland
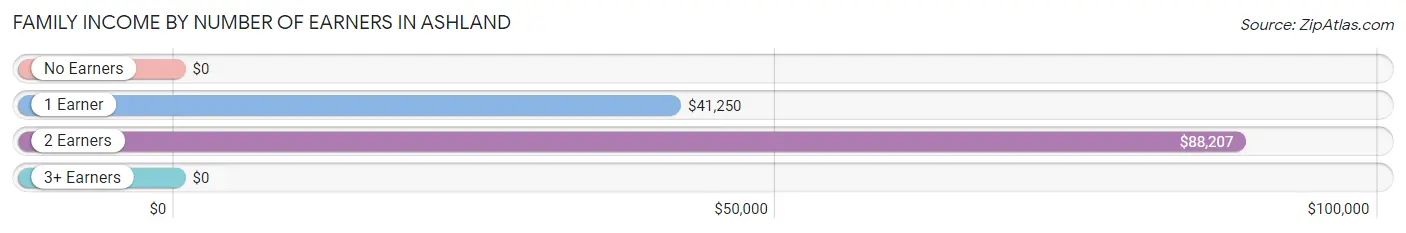
| Number of Earners | # Families | Median Income |
| No Earners | 16 (8.5%) | $0 |
| 1 Earner | 31 (16.5%) | $41,250 |
| 2 Earners | 131 (69.7%) | $88,207 |
| 3+ Earners | 10 (5.3%) | $0 |
| Total | 188 (100.0%) | $84,444 |
Household Income in Ashland
Household Income Brackets in Ashland
With 84 households falling in the category, the $75,000 to $99,999 income range is the most frequent in Ashland, accounting for 24.5% of all households. In contrast, only 4 households (1.2%) fall into the less than $10,000 income bracket, making it the least populous group.
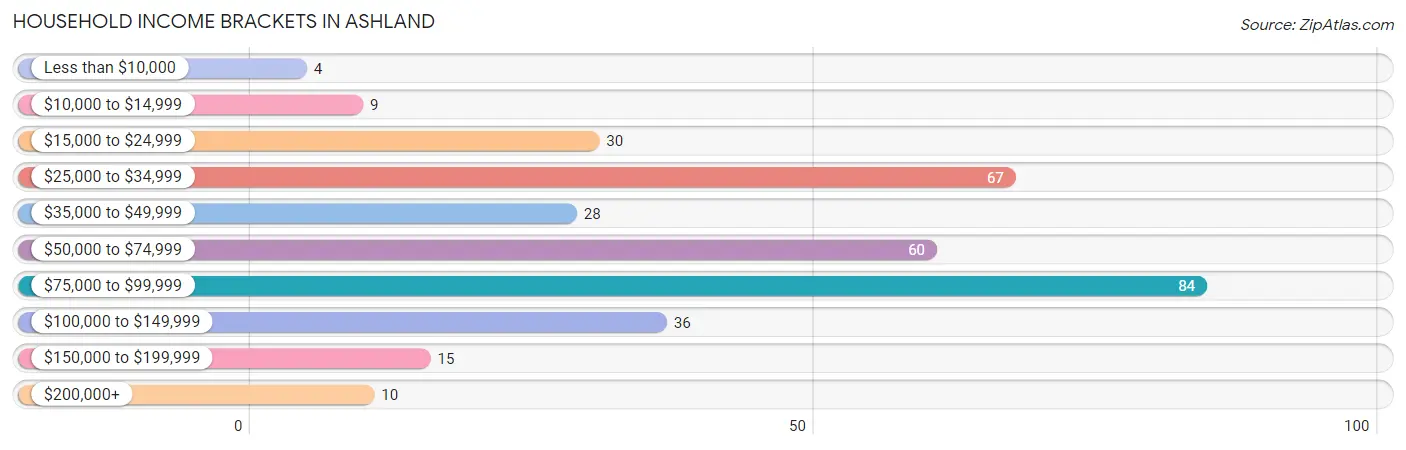
| Income Bracket | # Households | % Households |
| Less than $10,000 | 4 | 1.2% |
| $10,000 to $14,999 | 9 | 2.6% |
| $15,000 to $24,999 | 30 | 8.7% |
| $25,000 to $34,999 | 67 | 19.5% |
| $35,000 to $49,999 | 28 | 8.2% |
| $50,000 to $74,999 | 60 | 17.5% |
| $75,000 to $99,999 | 84 | 24.5% |
| $100,000 to $149,999 | 36 | 10.5% |
| $150,000 to $199,999 | 15 | 4.4% |
| $200,000+ | 10 | 2.9% |
Household Income by Householder Age in Ashland
The median household income in Ashland is $60,179, with the highest median household income of $75,625 found in the 25 to 44 years age bracket for the primary householder. A total of 42 households (12.2%) fall into this category. Meanwhile, the 15 to 24 years age bracket for the primary householder has the lowest median household income of $0, with 26 households (7.6%) in this group.
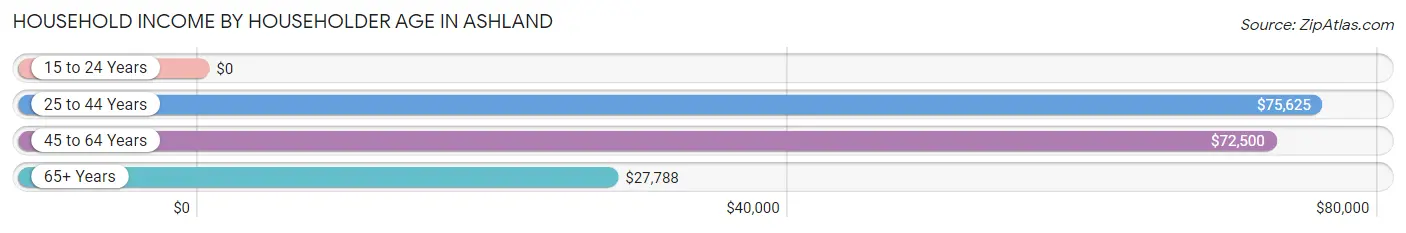
| Income Bracket | # Households | Median Income |
| 15 to 24 Years | 26 (7.6%) | $0 |
| 25 to 44 Years | 42 (12.2%) | $75,625 |
| 45 to 64 Years | 184 (53.6%) | $72,500 |
| 65+ Years | 91 (26.5%) | $27,788 |
| Total | 343 (100.0%) | $60,179 |
Poverty in Ashland
Income Below Poverty by Sex and Age in Ashland
With 13.4% poverty level for males and 6.8% for females among the residents of Ashland, 12 to 14 year old males and under 5 year old females are the most vulnerable to poverty, with 17 males (48.6%) and 7 females (35.0%) in their respective age groups living below the poverty level.
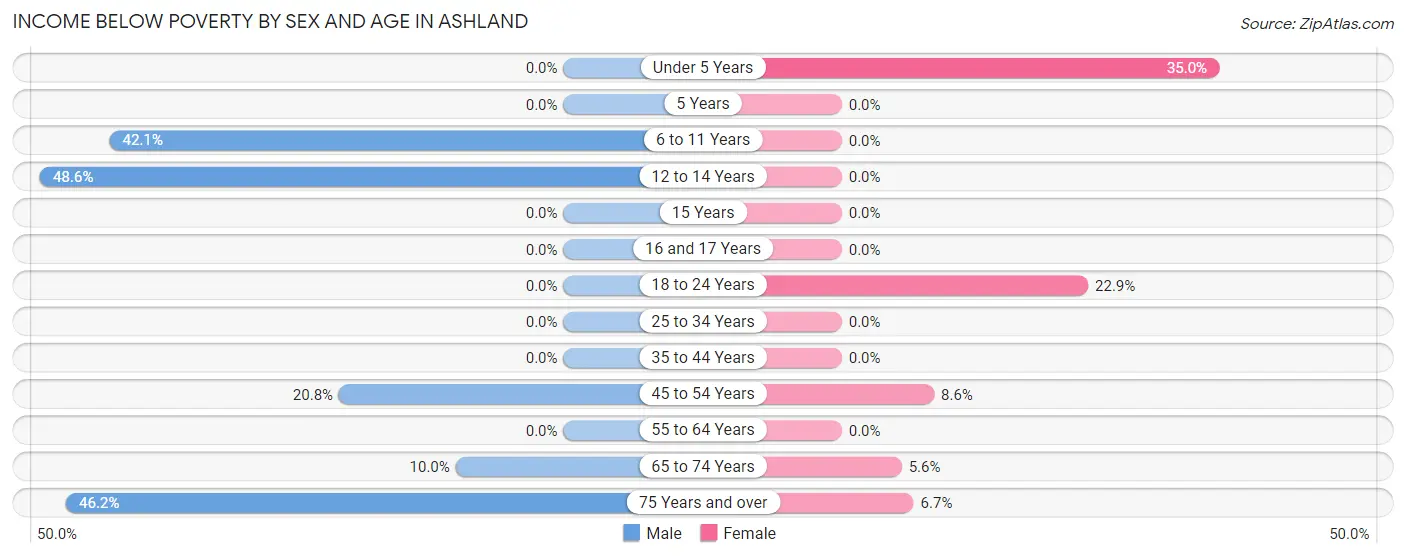
| Age Bracket | Male | Female |
| Under 5 Years | 0 (0.0%) | 7 (35.0%) |
| 5 Years | 0 (0.0%) | 0 (0.0%) |
| 6 to 11 Years | 8 (42.1%) | 0 (0.0%) |
| 12 to 14 Years | 17 (48.6%) | 0 (0.0%) |
| 15 Years | 0 (0.0%) | 0 (0.0%) |
| 16 and 17 Years | 0 (0.0%) | 0 (0.0%) |
| 18 to 24 Years | 0 (0.0%) | 8 (22.9%) |
| 25 to 34 Years | 0 (0.0%) | 0 (0.0%) |
| 35 to 44 Years | 0 (0.0%) | 0 (0.0%) |
| 45 to 54 Years | 15 (20.8%) | 6 (8.6%) |
| 55 to 64 Years | 0 (0.0%) | 0 (0.0%) |
| 65 to 74 Years | 4 (10.0%) | 2 (5.6%) |
| 75 Years and over | 6 (46.2%) | 3 (6.7%) |
| Total | 50 (13.4%) | 26 (6.8%) |
Income Above Poverty by Sex and Age in Ashland
According to the poverty statistics in Ashland, males aged under 5 years and females aged 5 years are the age groups that are most secure financially, with 100.0% of males and 100.0% of females in these age groups living above the poverty line.
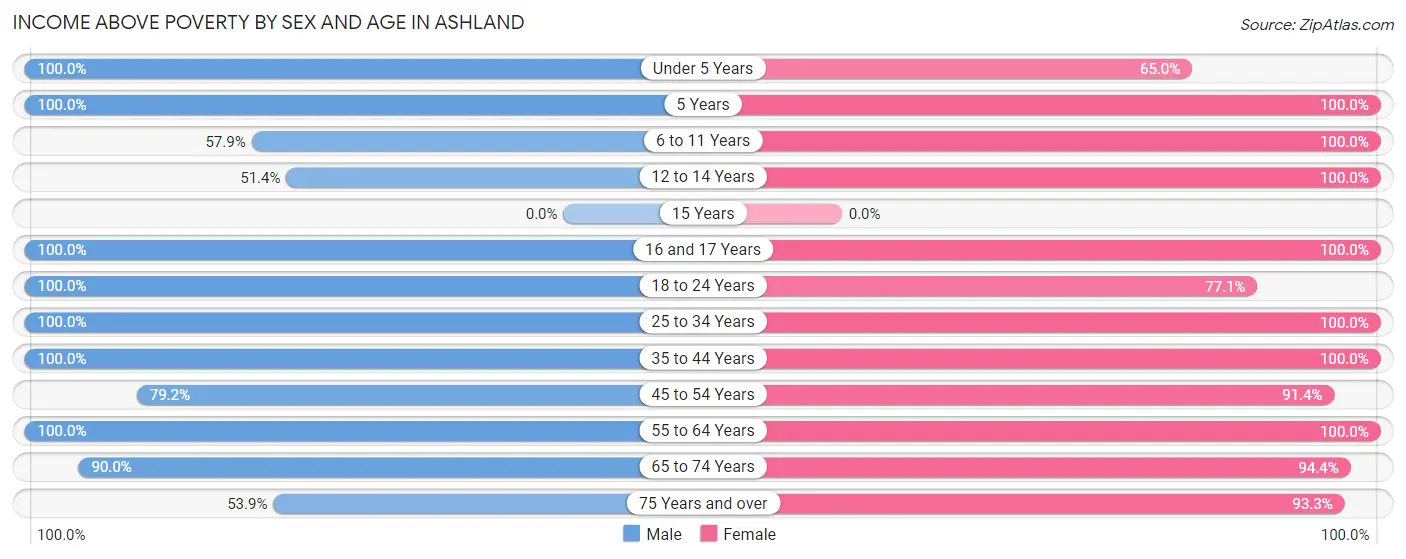
| Age Bracket | Male | Female |
| Under 5 Years | 16 (100.0%) | 13 (65.0%) |
| 5 Years | 3 (100.0%) | 9 (100.0%) |
| 6 to 11 Years | 11 (57.9%) | 10 (100.0%) |
| 12 to 14 Years | 18 (51.4%) | 6 (100.0%) |
| 15 Years | 0 (0.0%) | 0 (0.0%) |
| 16 and 17 Years | 13 (100.0%) | 29 (100.0%) |
| 18 to 24 Years | 11 (100.0%) | 27 (77.1%) |
| 25 to 34 Years | 26 (100.0%) | 17 (100.0%) |
| 35 to 44 Years | 28 (100.0%) | 26 (100.0%) |
| 45 to 54 Years | 57 (79.2%) | 64 (91.4%) |
| 55 to 64 Years | 96 (100.0%) | 80 (100.0%) |
| 65 to 74 Years | 36 (90.0%) | 34 (94.4%) |
| 75 Years and over | 7 (53.8%) | 42 (93.3%) |
| Total | 322 (86.6%) | 357 (93.2%) |
Income Below Poverty Among Married-Couple Families in Ashland
The poverty statistics for married-couple families in Ashland show that 2.7% or 4 of the total 146 families live below the poverty line. Families with no children have the highest poverty rate of 4.0%, comprising of 4 families. On the other hand, families with 1 or 2 children have the lowest poverty rate of 0.0%, which includes 0 families.
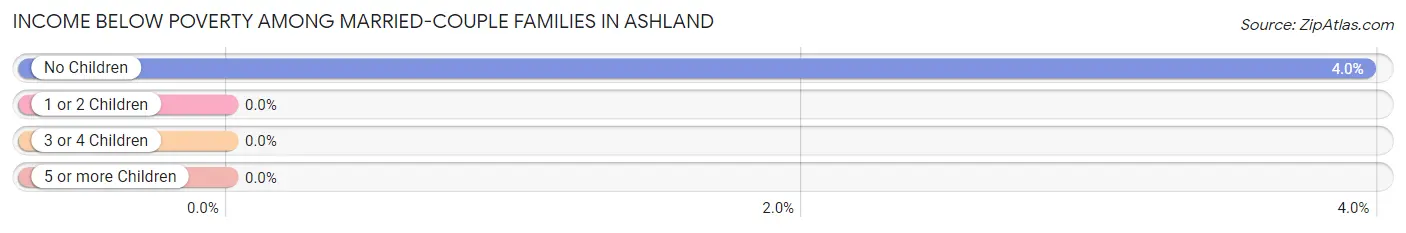
| Children | Above Poverty | Below Poverty |
| No Children | 97 (96.0%) | 4 (4.0%) |
| 1 or 2 Children | 39 (100.0%) | 0 (0.0%) |
| 3 or 4 Children | 6 (100.0%) | 0 (0.0%) |
| 5 or more Children | 0 (0.0%) | 0 (0.0%) |
| Total | 142 (97.3%) | 4 (2.7%) |
Income Below Poverty Among Single-Parent Households in Ashland
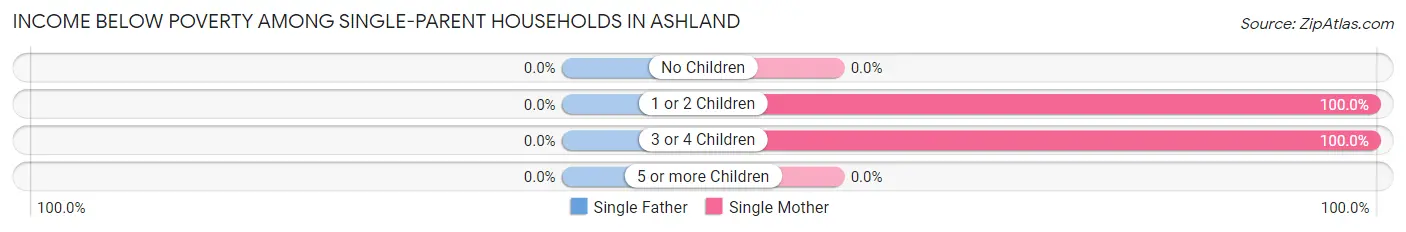
| Children | Single Father | Single Mother |
| No Children | 0 (0.0%) | 0 (0.0%) |
| 1 or 2 Children | 0 (0.0%) | 6 (100.0%) |
| 3 or 4 Children | 0 (0.0%) | 6 (100.0%) |
| 5 or more Children | 0 (0.0%) | 0 (0.0%) |
| Total | 0 (0.0%) | 12 (30.0%) |
Income Below Poverty Among Married-Couple vs Single-Parent Households in Ashland
The poverty data for Ashland shows that 4 of the married-couple family households (2.7%) and 12 of the single-parent households (28.6%) are living below the poverty level. Within the married-couple family households, those with no children have the highest poverty rate, with 4 households (4.0%) falling below the poverty line. Among the single-parent households, those with 3 or 4 children have the highest poverty rate, with 6 household (100.0%) living below poverty.
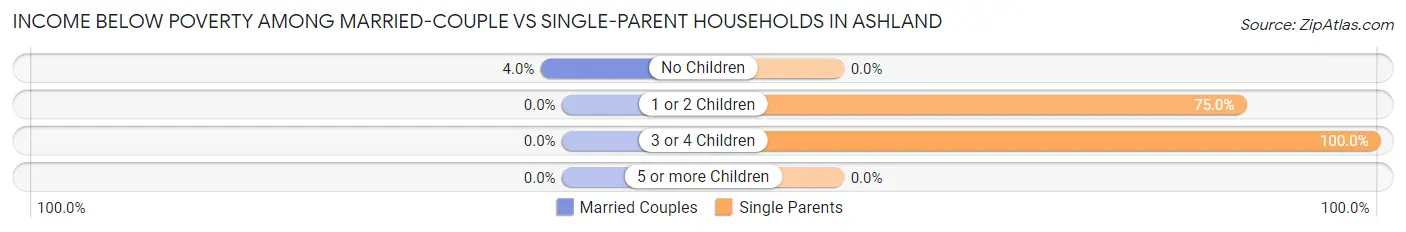
| Children | Married-Couple Families | Single-Parent Households |
| No Children | 4 (4.0%) | 0 (0.0%) |
| 1 or 2 Children | 0 (0.0%) | 6 (75.0%) |
| 3 or 4 Children | 0 (0.0%) | 6 (100.0%) |
| 5 or more Children | 0 (0.0%) | 0 (0.0%) |
| Total | 4 (2.7%) | 12 (28.6%) |
Race in Ashland
The most populous races in Ashland are White / Caucasian (669 | 83.4%), Two or more Races (70 | 8.7%), and Hispanic or Latino (48 | 6.0%).
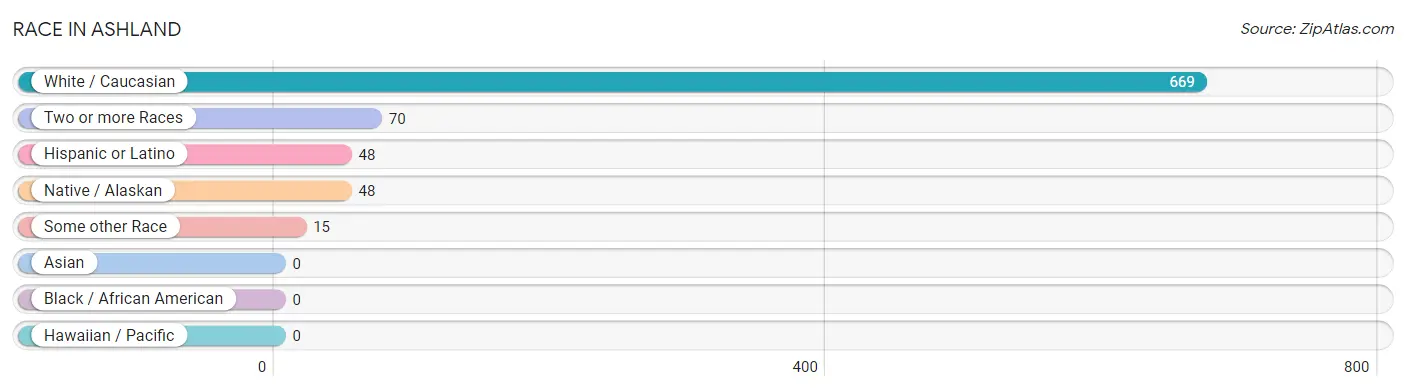
| Race | # Population | % Population |
| Asian | 0 | 0.0% |
| Black / African American | 0 | 0.0% |
| Hawaiian / Pacific | 0 | 0.0% |
| Hispanic or Latino | 48 | 6.0% |
| Native / Alaskan | 48 | 6.0% |
| White / Caucasian | 669 | 83.4% |
| Two or more Races | 70 | 8.7% |
| Some other Race | 15 | 1.9% |
| Total | 802 | 100.0% |
Ancestry in Ashland
The most populous ancestries reported in Ashland are Irish (179 | 22.3%), German (154 | 19.2%), English (91 | 11.4%), European (58 | 7.2%), and Scandinavian (55 | 6.9%), together accounting for 67.0% of all Ashland residents.
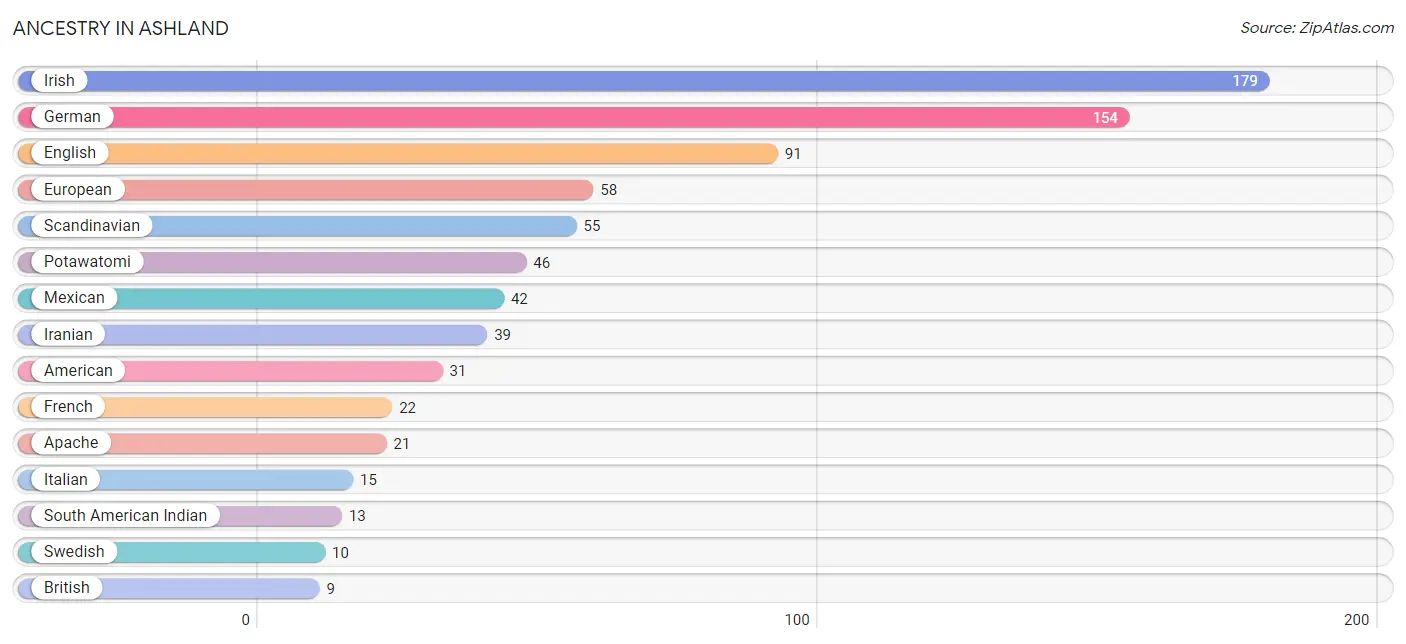
| Ancestry | # Population | % Population |
| American | 31 | 3.9% |
| Apache | 21 | 2.6% |
| British | 9 | 1.1% |
| Cherokee | 1 | 0.1% |
| Czech | 4 | 0.5% |
| Czechoslovakian | 4 | 0.5% |
| Dutch | 5 | 0.6% |
| English | 91 | 11.4% |
| European | 58 | 7.2% |
| French | 22 | 2.7% |
| German | 154 | 19.2% |
| Iranian | 39 | 4.9% |
| Irish | 179 | 22.3% |
| Italian | 15 | 1.9% |
| Mexican | 42 | 5.2% |
| Norwegian | 1 | 0.1% |
| Polish | 2 | 0.3% |
| Potawatomi | 46 | 5.7% |
| Scandinavian | 55 | 6.9% |
| Scottish | 8 | 1.0% |
| Seminole | 2 | 0.3% |
| South American Indian | 13 | 1.6% |
| Swedish | 10 | 1.3% |
| Welsh | 3 | 0.4% | View All 24 Rows |
Immigrants in Ashland
The most numerous immigrant groups reported in Ashland came from Central America (7 | 0.9%), Latin America (7 | 0.9%), and Mexico (7 | 0.9%), together accounting for 2.6% of all Ashland residents.
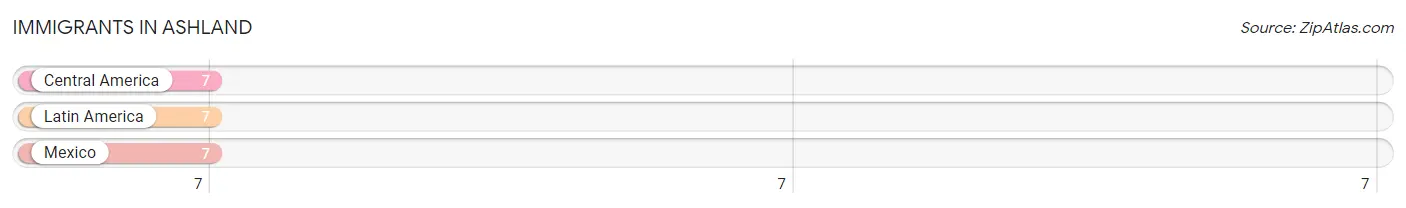
| Immigration Origin | # Population | % Population |
| Central America | 7 | 0.9% |
| Latin America | 7 | 0.9% |
| Mexico | 7 | 0.9% | View All 3 Rows |
Sex and Age in Ashland
Sex and Age in Ashland
The most populous age groups in Ashland are 55 to 59 Years (57 | 14.6%) for men and 50 to 54 Years (48 | 11.7%) for women.
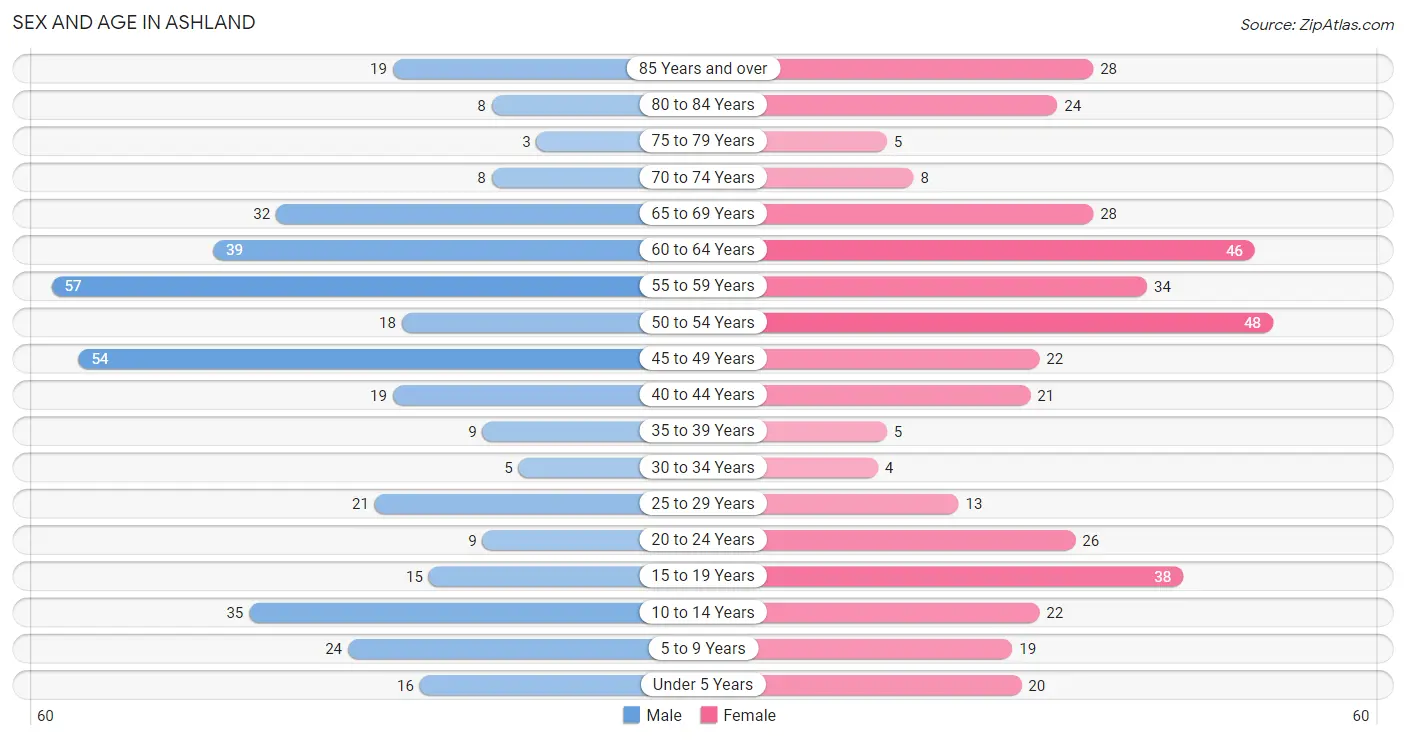
| Age Bracket | Male | Female |
| Under 5 Years | 16 (4.1%) | 20 (4.9%) |
| 5 to 9 Years | 24 (6.1%) | 19 (4.6%) |
| 10 to 14 Years | 35 (8.9%) | 22 (5.3%) |
| 15 to 19 Years | 15 (3.8%) | 38 (9.2%) |
| 20 to 24 Years | 9 (2.3%) | 26 (6.3%) |
| 25 to 29 Years | 21 (5.4%) | 13 (3.2%) |
| 30 to 34 Years | 5 (1.3%) | 4 (1.0%) |
| 35 to 39 Years | 9 (2.3%) | 5 (1.2%) |
| 40 to 44 Years | 19 (4.9%) | 21 (5.1%) |
| 45 to 49 Years | 54 (13.8%) | 22 (5.3%) |
| 50 to 54 Years | 18 (4.6%) | 48 (11.7%) |
| 55 to 59 Years | 57 (14.6%) | 34 (8.3%) |
| 60 to 64 Years | 39 (10.0%) | 46 (11.2%) |
| 65 to 69 Years | 32 (8.2%) | 28 (6.8%) |
| 70 to 74 Years | 8 (2.1%) | 8 (1.9%) |
| 75 to 79 Years | 3 (0.8%) | 5 (1.2%) |
| 80 to 84 Years | 8 (2.1%) | 24 (5.8%) |
| 85 Years and over | 19 (4.9%) | 28 (6.8%) |
| Total | 391 (100.0%) | 411 (100.0%) |
Families and Households in Ashland
Median Family Size in Ashland
The median family size in Ashland is 3.05 persons per family, with married-couple families (146 | 77.7%) accounting for the largest median family size of 3.14 persons per family. On the other hand, single male/father families (2 | 1.1%) represent the smallest median family size with 2.00 persons per family.
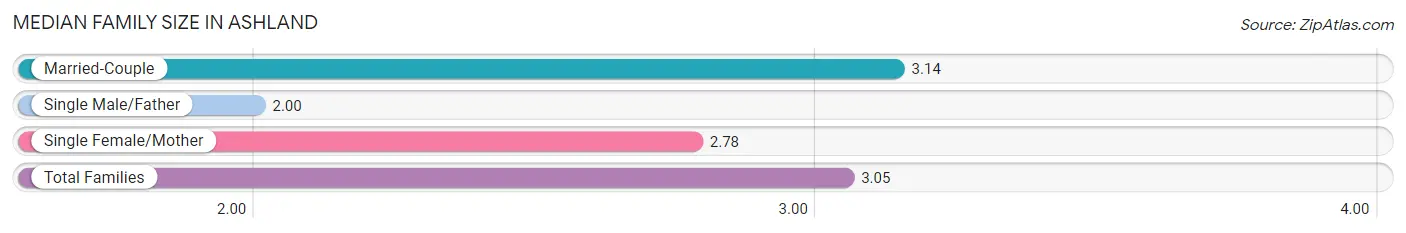
| Family Type | # Families | Family Size |
| Married-Couple | 146 (77.7%) | 3.14 |
| Single Male/Father | 2 (1.1%) | 2.00 |
| Single Female/Mother | 40 (21.3%) | 2.78 |
| Total Families | 188 (100.0%) | 3.05 |
Median Household Size in Ashland
The median household size in Ashland is 2.25 persons per household, with single male/father households (2 | 0.6%) accounting for the largest median household size of 4 persons per household. non-family households (155 | 45.2%) represent the smallest median household size with 1.24 persons per household.
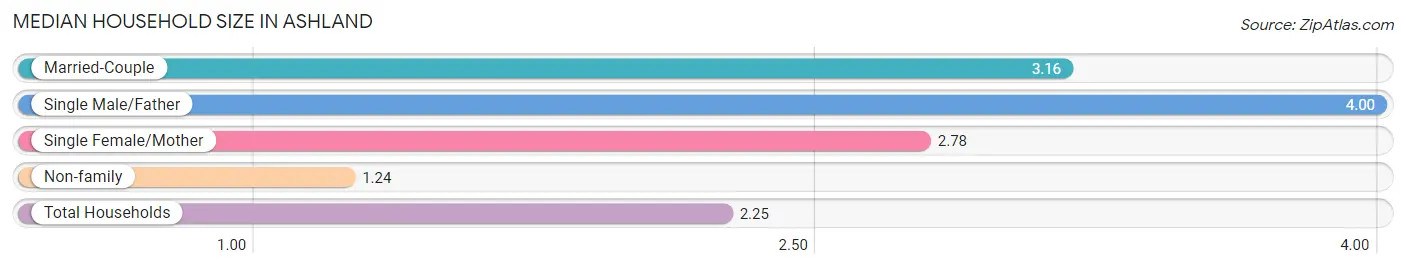
| Household Type | # Households | Household Size |
| Married-Couple | 146 (42.6%) | 3.16 |
| Single Male/Father | 2 (0.6%) | 4.00 |
| Single Female/Mother | 40 (11.7%) | 2.78 |
| Non-family | 155 (45.2%) | 1.24 |
| Total Households | 343 (100.0%) | 2.25 |
Household Size by Marriage Status in Ashland
Out of a total of 343 households in Ashland, 188 (54.8%) are family households, while 155 (45.2%) are nonfamily households. The most numerous type of family households are 2-person households, comprising 120, and the most common type of nonfamily households are 1-person households, comprising 137.
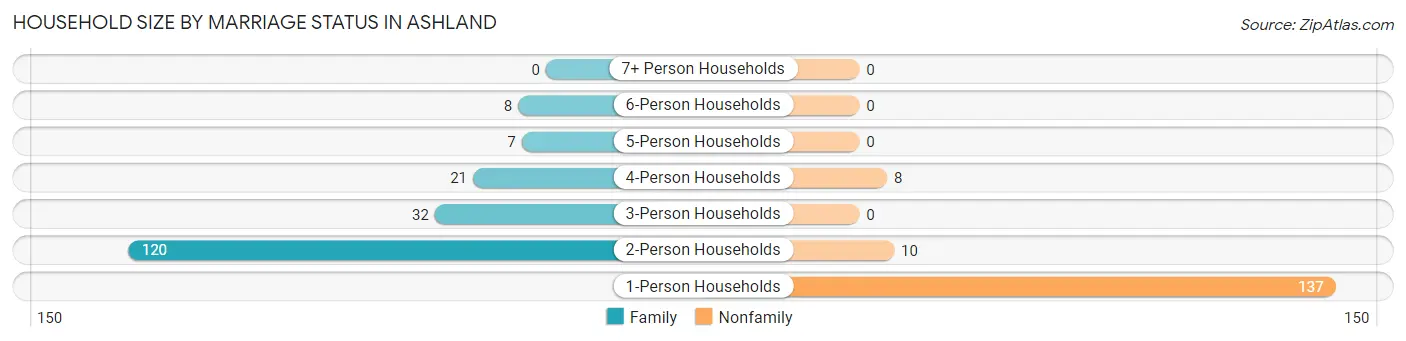
| Household Size | Family Households | Nonfamily Households |
| 1-Person Households | - | 137 (39.9%) |
| 2-Person Households | 120 (35.0%) | 10 (2.9%) |
| 3-Person Households | 32 (9.3%) | 0 (0.0%) |
| 4-Person Households | 21 (6.1%) | 8 (2.3%) |
| 5-Person Households | 7 (2.0%) | 0 (0.0%) |
| 6-Person Households | 8 (2.3%) | 0 (0.0%) |
| 7+ Person Households | 0 (0.0%) | 0 (0.0%) |
| Total | 188 (54.8%) | 155 (45.2%) |
Female Fertility in Ashland
Fertility by Age in Ashland
| Age Bracket | Women with Births | Births / 1,000 Women |
| 15 to 19 years | 0 (0.0%) | 0.0 |
| 20 to 34 years | 0 (0.0%) | 0.0 |
| 35 to 50 years | 0 (0.0%) | 0.0 |
| Total | 0 (0.0%) | 0.0 |
Fertility by Age by Marriage Status in Ashland
| Age Bracket | Married | Unmarried |
| 15 to 19 years | 0 (0.0%) | 0 (0.0%) |
| 20 to 34 years | 0 (0.0%) | 0 (0.0%) |
| 35 to 50 years | 0 (0.0%) | 0 (0.0%) |
| Total | 0 (0.0%) | 0 (0.0%) |
Fertility by Education in Ashland
| Educational Attainment | Women with Births | Births / 1,000 Women |
| Less than High School | 0 (0.0%) | 0.0 |
| High School Diploma | 0 (0.0%) | 0.0 |
| College or Associate's Degree | 0 (0.0%) | 0.0 |
| Bachelor's Degree | 0 (0.0%) | 0.0 |
| Graduate Degree | 0 (0.0%) | 0.0 |
| Total | 0 (0.0%) | 0.0 |
Fertility by Education by Marriage Status in Ashland
| Educational Attainment | Married | Unmarried |
| Less than High School | 0 (0.0%) | 0 (0.0%) |
| High School Diploma | 0 (0.0%) | 0 (0.0%) |
| College or Associate's Degree | 0 (0.0%) | 0 (0.0%) |
| Bachelor's Degree | 0 (0.0%) | 0 (0.0%) |
| Graduate Degree | 0 (0.0%) | 0 (0.0%) |
| Total | 0 (0.0%) | 0 (0.0%) |
Employment Characteristics in Ashland
Employment by Class of Employer in Ashland
Among the 425 employed individuals in Ashland, private company employees (200 | 47.1%), self-employed (not incorporated) (74 | 17.4%), and local government employees (55 | 12.9%) make up the most common classes of employment.
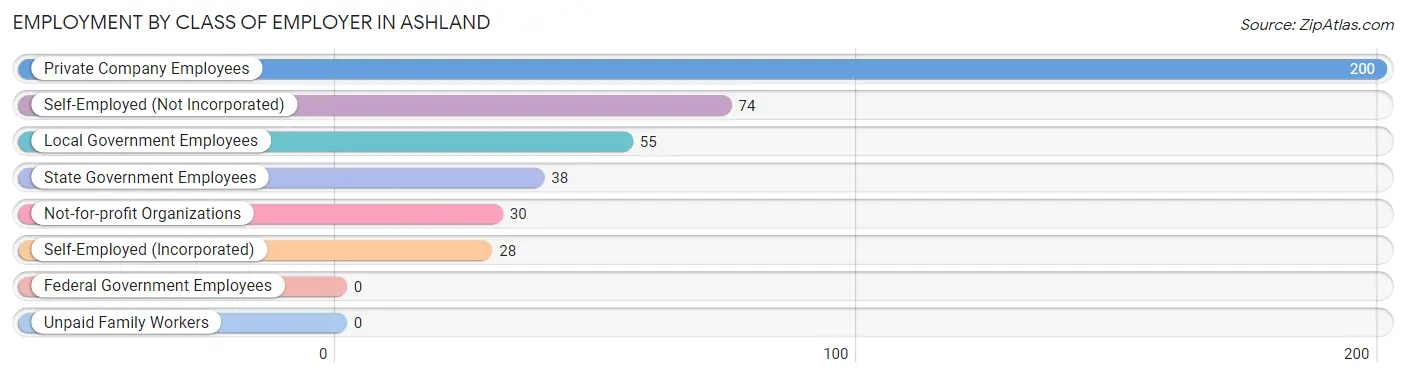
| Employer Class | # Employees | % Employees |
| Private Company Employees | 200 | 47.1% |
| Self-Employed (Incorporated) | 28 | 6.6% |
| Self-Employed (Not Incorporated) | 74 | 17.4% |
| Not-for-profit Organizations | 30 | 7.1% |
| Local Government Employees | 55 | 12.9% |
| State Government Employees | 38 | 8.9% |
| Federal Government Employees | 0 | 0.0% |
| Unpaid Family Workers | 0 | 0.0% |
| Total | 425 | 100.0% |
Employment Status by Age in Ashland
According to the labor force statistics for Ashland, out of the total population over 16 years of age (666), 69.4% or 462 individuals are in the labor force, with 1.3% or 6 of them unemployed. The age group with the highest labor force participation rate is 30 to 34 years, with 100.0% or 9 individuals in the labor force. Within the labor force, the 20 to 24 years age range has the highest percentage of unemployed individuals, with 18.8% or 6 of them being unemployed.
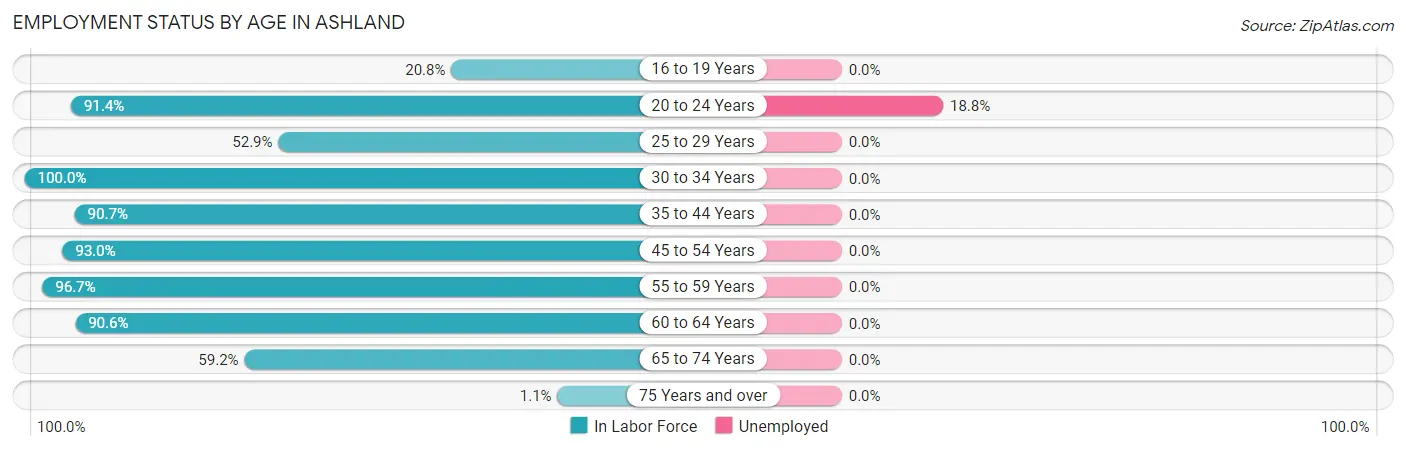
| Age Bracket | In Labor Force | Unemployed |
| 16 to 19 Years | 11 (20.8%) | 0 (0.0%) |
| 20 to 24 Years | 32 (91.4%) | 6 (18.8%) |
| 25 to 29 Years | 18 (52.9%) | 0 (0.0%) |
| 30 to 34 Years | 9 (100.0%) | 0 (0.0%) |
| 35 to 44 Years | 49 (90.7%) | 0 (0.0%) |
| 45 to 54 Years | 132 (93.0%) | 0 (0.0%) |
| 55 to 59 Years | 88 (96.7%) | 0 (0.0%) |
| 60 to 64 Years | 77 (90.6%) | 0 (0.0%) |
| 65 to 74 Years | 45 (59.2%) | 0 (0.0%) |
| 75 Years and over | 1 (1.1%) | 0 (0.0%) |
| Total | 462 (69.4%) | 6 (1.3%) |
Employment Status by Educational Attainment in Ashland
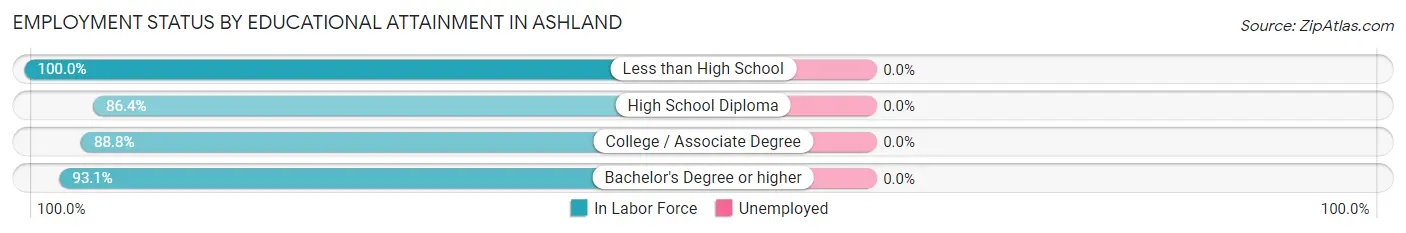
| Educational Attainment | In Labor Force | Unemployed |
| Less than High School | 17 (100.0%) | 0 (0.0%) |
| High School Diploma | 70 (86.4%) | 0 (0.0%) |
| College / Associate Degree | 191 (88.8%) | 0 (0.0%) |
| Bachelor's Degree or higher | 95 (93.1%) | 0 (0.0%) |
| Total | 373 (89.9%) | 0 (0.0%) |
Employment Occupations by Sex in Ashland
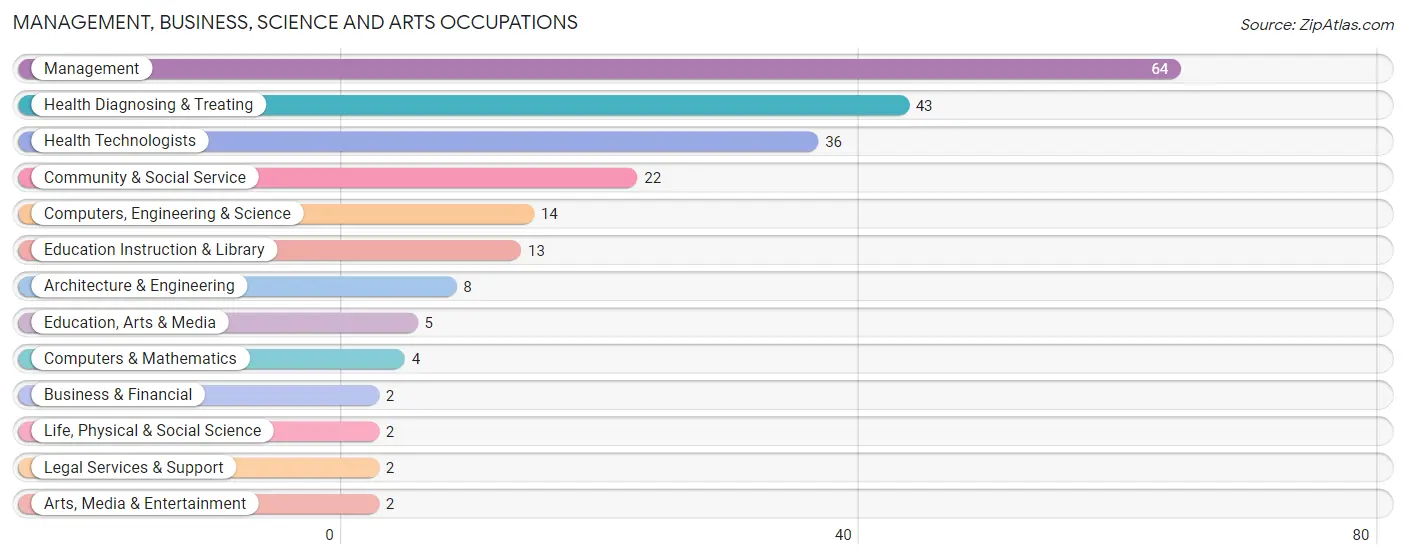
Management, Business, Science and Arts Occupations
The most common Management, Business, Science and Arts occupations in Ashland are Management (64 | 14.0%), Health Diagnosing & Treating (43 | 9.4%), Health Technologists (36 | 7.9%), Community & Social Service (22 | 4.8%), and Computers, Engineering & Science (14 | 3.1%).
Management, Business, Science and Arts Occupations by Sex
Within the Management, Business, Science and Arts occupations in Ashland, the most male-oriented occupations are Architecture & Engineering (100.0%), Life, Physical & Social Science (100.0%), and Computers, Engineering & Science (85.7%), while the most female-oriented occupations are Business & Financial (100.0%), Legal Services & Support (100.0%), and Education Instruction & Library (100.0%).
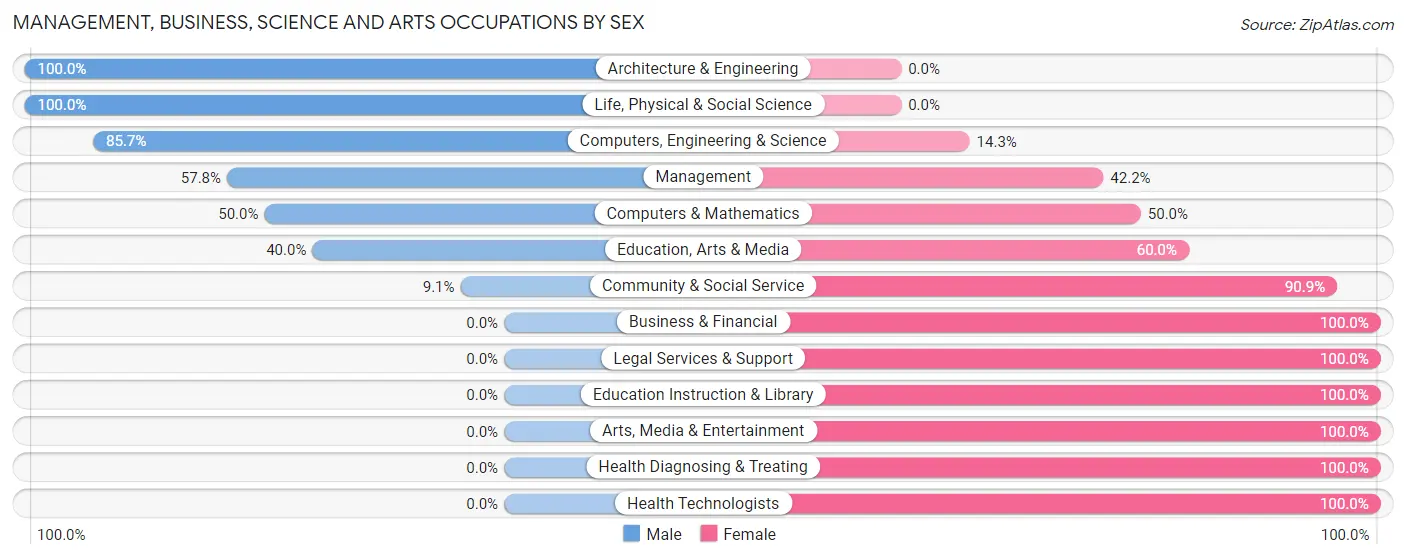
| Occupation | Male | Female |
| Management | 37 (57.8%) | 27 (42.2%) |
| Business & Financial | 0 (0.0%) | 2 (100.0%) |
| Computers, Engineering & Science | 12 (85.7%) | 2 (14.3%) |
| Computers & Mathematics | 2 (50.0%) | 2 (50.0%) |
| Architecture & Engineering | 8 (100.0%) | 0 (0.0%) |
| Life, Physical & Social Science | 2 (100.0%) | 0 (0.0%) |
| Community & Social Service | 2 (9.1%) | 20 (90.9%) |
| Education, Arts & Media | 2 (40.0%) | 3 (60.0%) |
| Legal Services & Support | 0 (0.0%) | 2 (100.0%) |
| Education Instruction & Library | 0 (0.0%) | 13 (100.0%) |
| Arts, Media & Entertainment | 0 (0.0%) | 2 (100.0%) |
| Health Diagnosing & Treating | 0 (0.0%) | 43 (100.0%) |
| Health Technologists | 0 (0.0%) | 36 (100.0%) |
| Total (Category) | 51 (35.2%) | 94 (64.8%) |
| Total (Overall) | 233 (51.1%) | 223 (48.9%) |
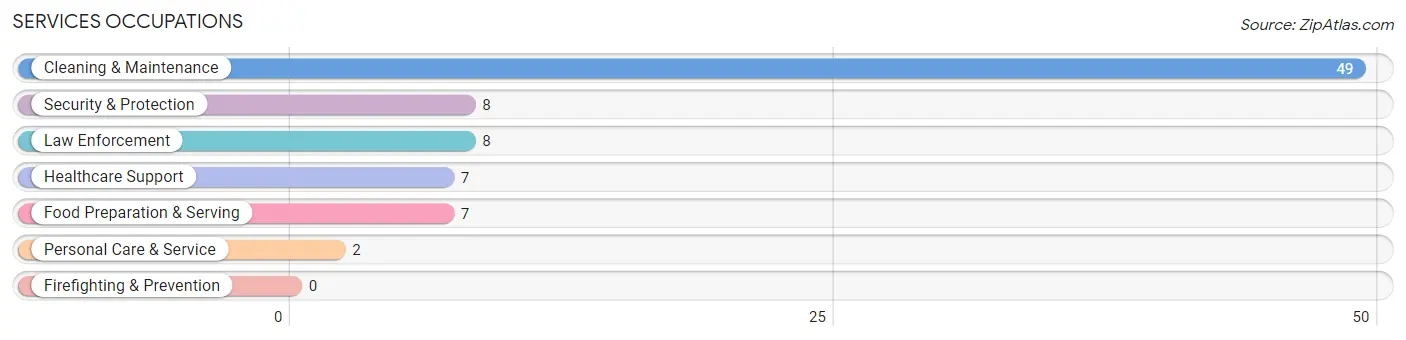
Services Occupations
The most common Services occupations in Ashland are Cleaning & Maintenance (49 | 10.7%), Security & Protection (8 | 1.8%), Law Enforcement (8 | 1.8%), Healthcare Support (7 | 1.5%), and Food Preparation & Serving (7 | 1.5%).
Services Occupations by Sex
Within the Services occupations in Ashland, the most male-oriented occupations are Cleaning & Maintenance (73.5%), Security & Protection (25.0%), and Law Enforcement (25.0%), while the most female-oriented occupations are Healthcare Support (100.0%), Food Preparation & Serving (100.0%), and Personal Care & Service (100.0%).
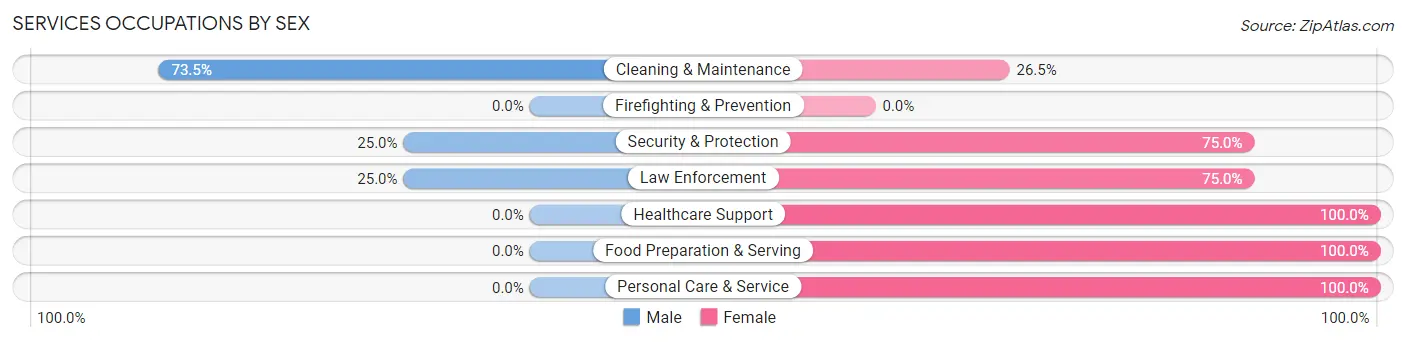
| Occupation | Male | Female |
| Healthcare Support | 0 (0.0%) | 7 (100.0%) |
| Security & Protection | 2 (25.0%) | 6 (75.0%) |
| Firefighting & Prevention | 0 (0.0%) | 0 (0.0%) |
| Law Enforcement | 2 (25.0%) | 6 (75.0%) |
| Food Preparation & Serving | 0 (0.0%) | 7 (100.0%) |
| Cleaning & Maintenance | 36 (73.5%) | 13 (26.5%) |
| Personal Care & Service | 0 (0.0%) | 2 (100.0%) |
| Total (Category) | 38 (52.0%) | 35 (47.9%) |
| Total (Overall) | 233 (51.1%) | 223 (48.9%) |
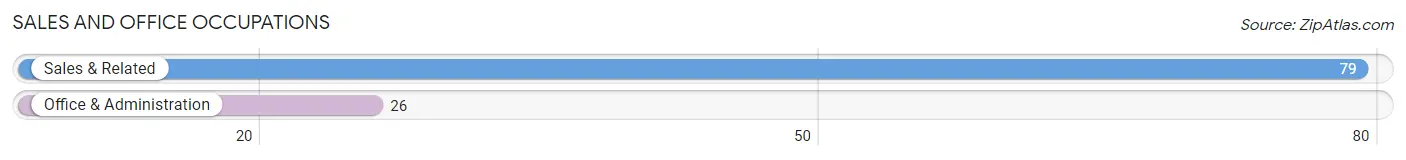
Sales and Office Occupations
The most common Sales and Office occupations in Ashland are Sales & Related (79 | 17.3%), and Office & Administration (26 | 5.7%).
Sales and Office Occupations by Sex
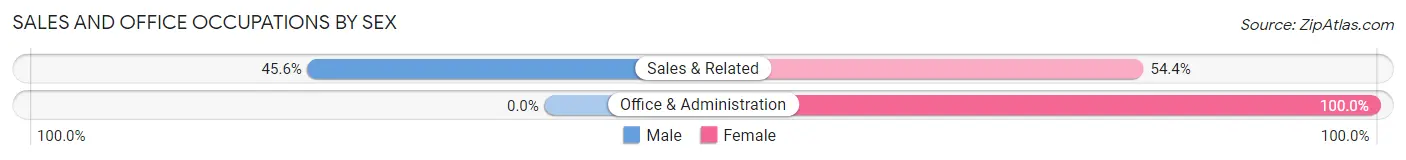
| Occupation | Male | Female |
| Sales & Related | 36 (45.6%) | 43 (54.4%) |
| Office & Administration | 0 (0.0%) | 26 (100.0%) |
| Total (Category) | 36 (34.3%) | 69 (65.7%) |
| Total (Overall) | 233 (51.1%) | 223 (48.9%) |
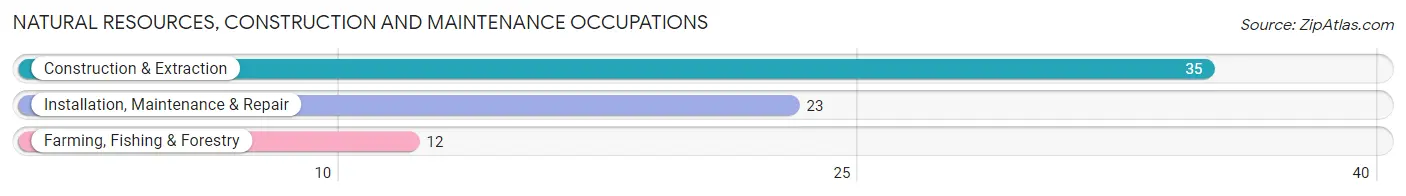
Natural Resources, Construction and Maintenance Occupations
The most common Natural Resources, Construction and Maintenance occupations in Ashland are Construction & Extraction (35 | 7.7%), Installation, Maintenance & Repair (23 | 5.0%), and Farming, Fishing & Forestry (12 | 2.6%).
Natural Resources, Construction and Maintenance Occupations by Sex
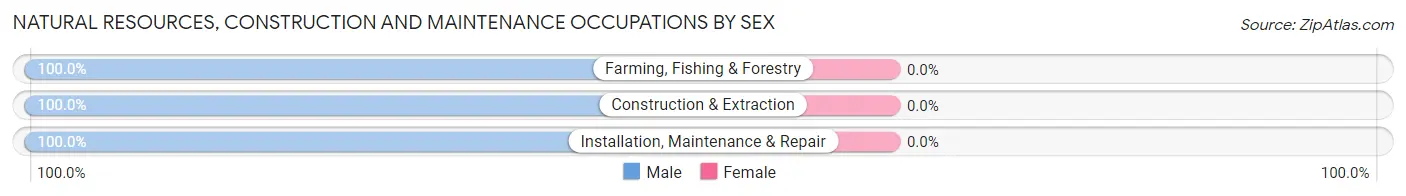
| Occupation | Male | Female |
| Farming, Fishing & Forestry | 12 (100.0%) | 0 (0.0%) |
| Construction & Extraction | 35 (100.0%) | 0 (0.0%) |
| Installation, Maintenance & Repair | 23 (100.0%) | 0 (0.0%) |
| Total (Category) | 70 (100.0%) | 0 (0.0%) |
| Total (Overall) | 233 (51.1%) | 223 (48.9%) |
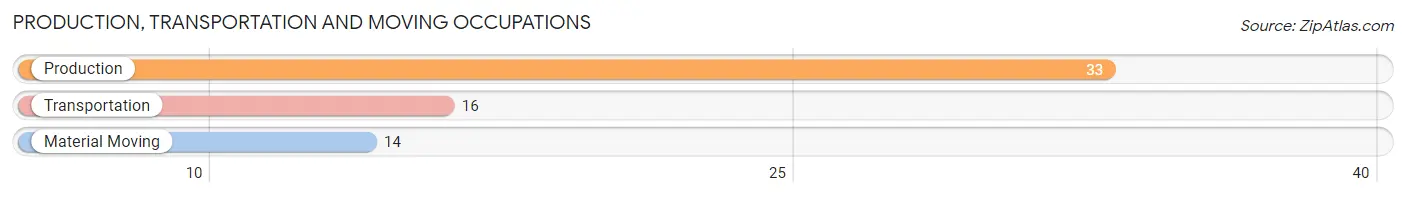
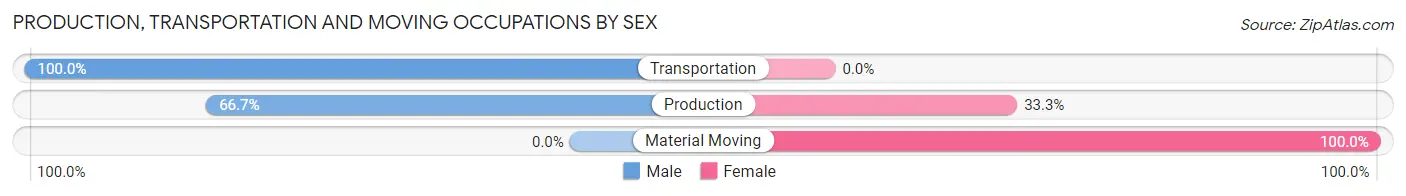
Production, Transportation and Moving Occupations
The most common Production, Transportation and Moving occupations in Ashland are Production (33 | 7.2%), Transportation (16 | 3.5%), and Material Moving (14 | 3.1%).
Production, Transportation and Moving Occupations by Sex
| Occupation | Male | Female |
| Production | 22 (66.7%) | 11 (33.3%) |
| Transportation | 16 (100.0%) | 0 (0.0%) |
| Material Moving | 0 (0.0%) | 14 (100.0%) |
| Total (Category) | 38 (60.3%) | 25 (39.7%) |
| Total (Overall) | 233 (51.1%) | 223 (48.9%) |
Employment Industries by Sex in Ashland
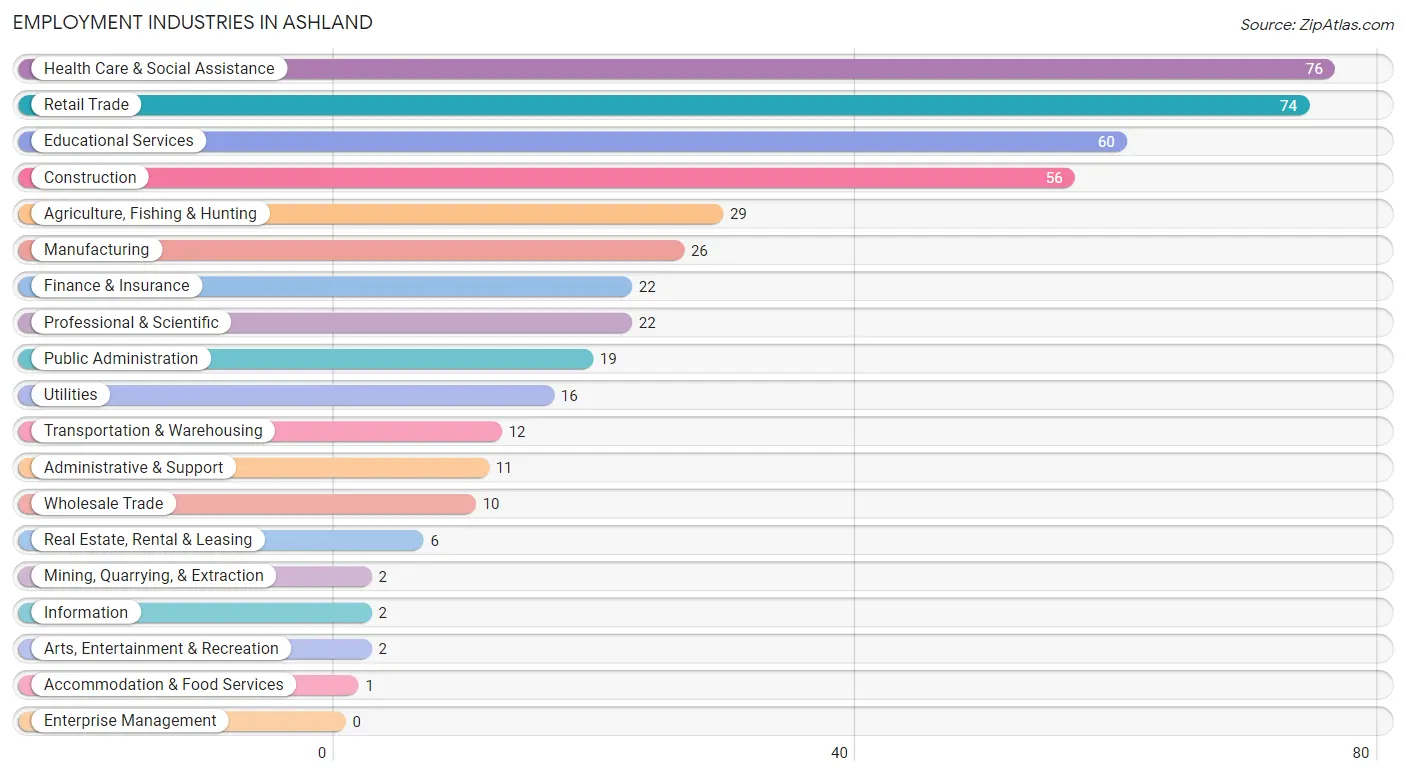
Employment Industries in Ashland
The major employment industries in Ashland include Health Care & Social Assistance (76 | 16.7%), Retail Trade (74 | 16.2%), Educational Services (60 | 13.2%), Construction (56 | 12.3%), and Agriculture, Fishing & Hunting (29 | 6.4%).
Employment Industries by Sex in Ashland
The Ashland industries that see more men than women are Agriculture, Fishing & Hunting (100.0%), Construction (100.0%), and Wholesale Trade (100.0%), whereas the industries that tend to have a higher number of women are Mining, Quarrying, & Extraction (100.0%), Information (100.0%), and Real Estate, Rental & Leasing (100.0%).
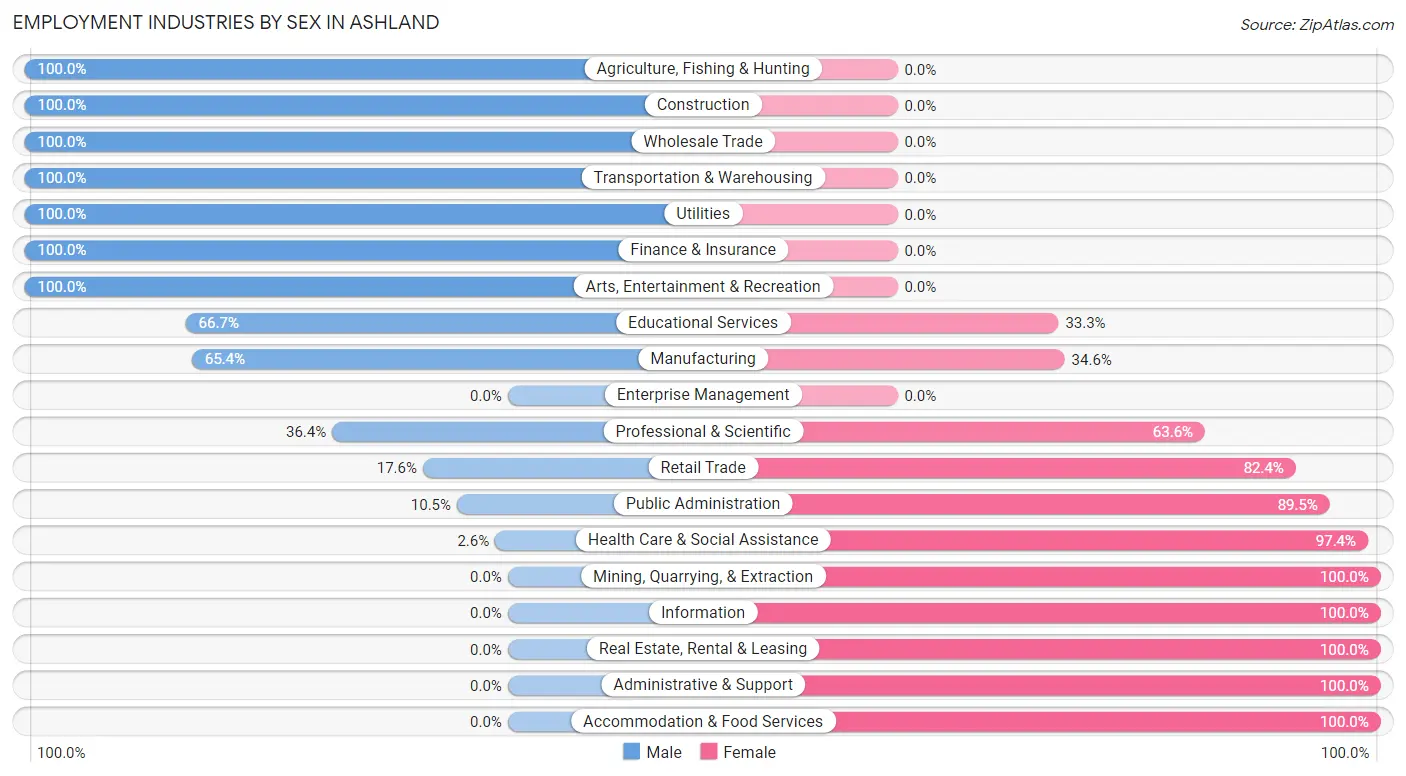
| Industry | Male | Female |
| Agriculture, Fishing & Hunting | 29 (100.0%) | 0 (0.0%) |
| Mining, Quarrying, & Extraction | 0 (0.0%) | 2 (100.0%) |
| Construction | 56 (100.0%) | 0 (0.0%) |
| Manufacturing | 17 (65.4%) | 9 (34.6%) |
| Wholesale Trade | 10 (100.0%) | 0 (0.0%) |
| Retail Trade | 13 (17.6%) | 61 (82.4%) |
| Transportation & Warehousing | 12 (100.0%) | 0 (0.0%) |
| Utilities | 16 (100.0%) | 0 (0.0%) |
| Information | 0 (0.0%) | 2 (100.0%) |
| Finance & Insurance | 22 (100.0%) | 0 (0.0%) |
| Real Estate, Rental & Leasing | 0 (0.0%) | 6 (100.0%) |
| Professional & Scientific | 8 (36.4%) | 14 (63.6%) |
| Enterprise Management | 0 (0.0%) | 0 (0.0%) |
| Administrative & Support | 0 (0.0%) | 11 (100.0%) |
| Educational Services | 40 (66.7%) | 20 (33.3%) |
| Health Care & Social Assistance | 2 (2.6%) | 74 (97.4%) |
| Arts, Entertainment & Recreation | 2 (100.0%) | 0 (0.0%) |
| Accommodation & Food Services | 0 (0.0%) | 1 (100.0%) |
| Public Administration | 2 (10.5%) | 17 (89.5%) |
| Total | 233 (51.1%) | 223 (48.9%) |
Education in Ashland
School Enrollment in Ashland
The most common levels of schooling among the 168 students in Ashland are high school (56 | 33.3%), middle school (48 | 28.6%), and elementary school (29 | 17.3%).
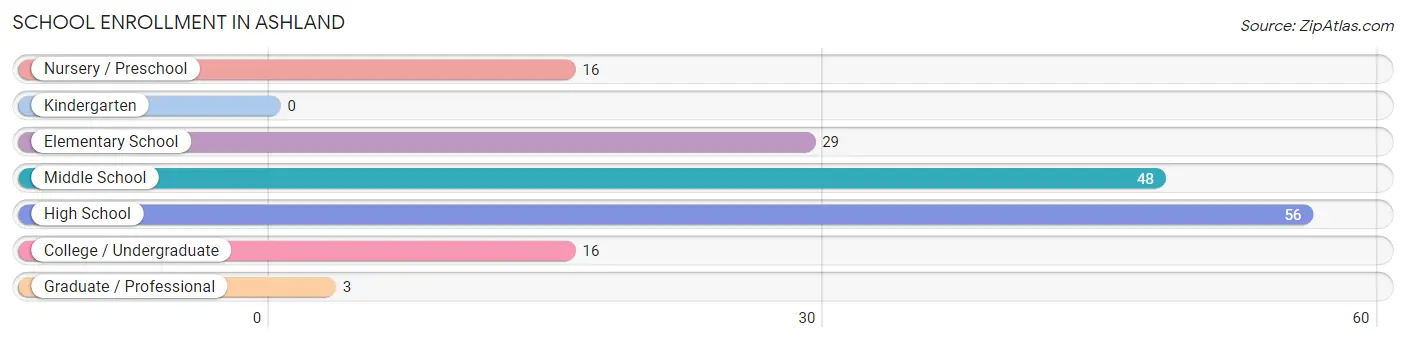
| School Level | # Students | % Students |
| Nursery / Preschool | 16 | 9.5% |
| Kindergarten | 0 | 0.0% |
| Elementary School | 29 | 17.3% |
| Middle School | 48 | 28.6% |
| High School | 56 | 33.3% |
| College / Undergraduate | 16 | 9.5% |
| Graduate / Professional | 3 | 1.8% |
| Total | 168 | 100.0% |
School Enrollment by Age by Funding Source in Ashland
Out of a total of 168 students who are enrolled in schools in Ashland, 3 (1.8%) attend a private institution, while the remaining 165 (98.2%) are enrolled in public schools. The age group of 3 to 4 year olds has the highest likelihood of being enrolled in private schools, with 2 (50.0% in the age bracket) enrolled. Conversely, the age group of 5 to 9 year old has the lowest likelihood of being enrolled in a private school, with 41 (100.0% in the age bracket) attending a public institution.
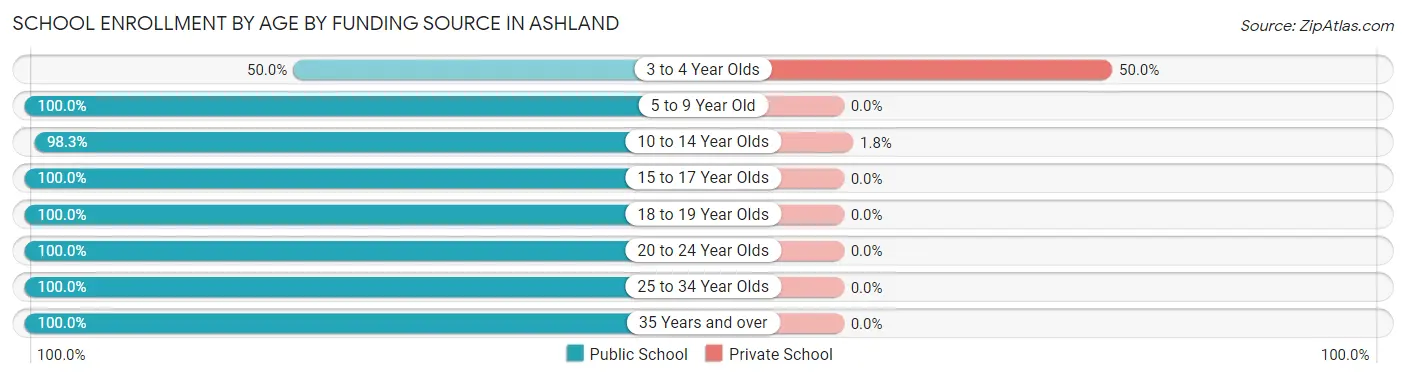
| Age Bracket | Public School | Private School |
| 3 to 4 Year Olds | 2 (50.0%) | 2 (50.0%) |
| 5 to 9 Year Old | 41 (100.0%) | 0 (0.0%) |
| 10 to 14 Year Olds | 56 (98.3%) | 1 (1.8%) |
| 15 to 17 Year Olds | 42 (100.0%) | 0 (0.0%) |
| 18 to 19 Year Olds | 5 (100.0%) | 0 (0.0%) |
| 20 to 24 Year Olds | 5 (100.0%) | 0 (0.0%) |
| 25 to 34 Year Olds | 7 (100.0%) | 0 (0.0%) |
| 35 Years and over | 7 (100.0%) | 0 (0.0%) |
| Total | 165 (98.2%) | 3 (1.8%) |
Educational Attainment by Field of Study in Ashland
Computers & mathematics (36 | 27.7%), bio, nature & agricultural (25 | 19.2%), science & technology (24 | 18.5%), education (21 | 16.2%), and business (7 | 5.4%) are the most common fields of study among 130 individuals in Ashland who have obtained a bachelor's degree or higher.
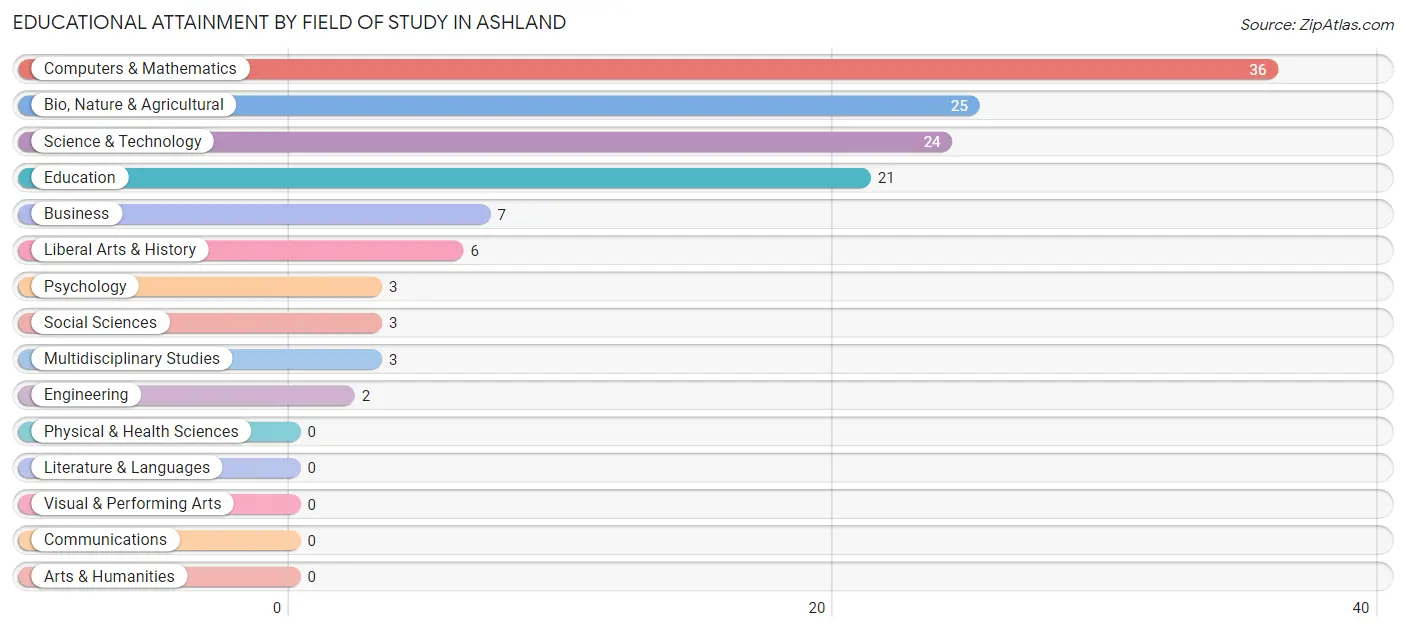
| Field of Study | # Graduates | % Graduates |
| Computers & Mathematics | 36 | 27.7% |
| Bio, Nature & Agricultural | 25 | 19.2% |
| Physical & Health Sciences | 0 | 0.0% |
| Psychology | 3 | 2.3% |
| Social Sciences | 3 | 2.3% |
| Engineering | 2 | 1.5% |
| Multidisciplinary Studies | 3 | 2.3% |
| Science & Technology | 24 | 18.5% |
| Business | 7 | 5.4% |
| Education | 21 | 16.2% |
| Literature & Languages | 0 | 0.0% |
| Liberal Arts & History | 6 | 4.6% |
| Visual & Performing Arts | 0 | 0.0% |
| Communications | 0 | 0.0% |
| Arts & Humanities | 0 | 0.0% |
| Total | 130 | 100.0% |
Transportation & Commute in Ashland
Vehicle Availability by Sex in Ashland
The most prevalent vehicle ownership categories in Ashland are males with 2 vehicles (69, accounting for 32.6%) and females with 2 vehicles (59, making up 32.4%).
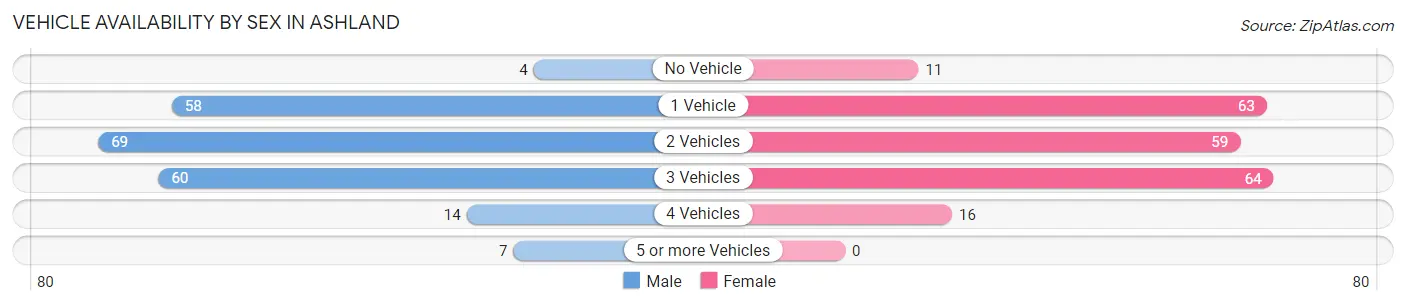
| Vehicles Available | Male | Female |
| No Vehicle | 4 (1.9%) | 11 (5.2%) |
| 1 Vehicle | 58 (27.4%) | 63 (29.6%) |
| 2 Vehicles | 69 (32.6%) | 59 (27.7%) |
| 3 Vehicles | 60 (28.3%) | 64 (30.0%) |
| 4 Vehicles | 14 (6.6%) | 16 (7.5%) |
| 5 or more Vehicles | 7 (3.3%) | 0 (0.0%) |
| Total | 212 (100.0%) | 213 (100.0%) |
Commute Time in Ashland
The most frequently occuring commute durations in Ashland are less than 5 minutes (166 commuters, 39.8%), 5 to 9 minutes (105 commuters, 25.2%), and 10 to 14 minutes (61 commuters, 14.6%).
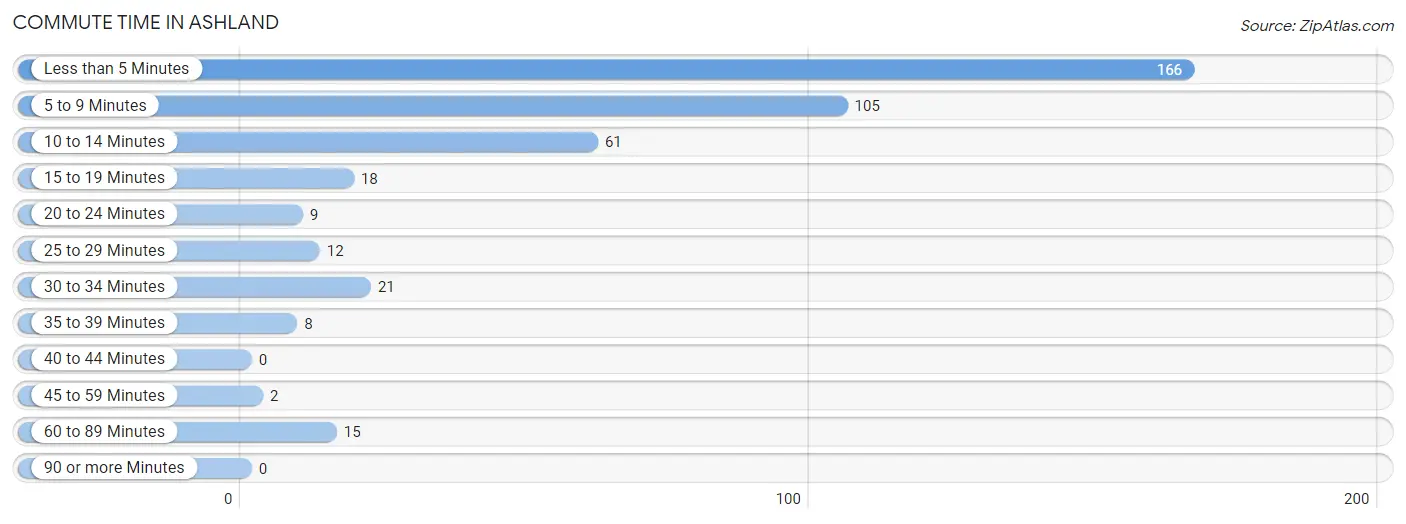
| Commute Time | # Commuters | % Commuters |
| Less than 5 Minutes | 166 | 39.8% |
| 5 to 9 Minutes | 105 | 25.2% |
| 10 to 14 Minutes | 61 | 14.6% |
| 15 to 19 Minutes | 18 | 4.3% |
| 20 to 24 Minutes | 9 | 2.2% |
| 25 to 29 Minutes | 12 | 2.9% |
| 30 to 34 Minutes | 21 | 5.0% |
| 35 to 39 Minutes | 8 | 1.9% |
| 40 to 44 Minutes | 0 | 0.0% |
| 45 to 59 Minutes | 2 | 0.5% |
| 60 to 89 Minutes | 15 | 3.6% |
| 90 or more Minutes | 0 | 0.0% |
Commute Time by Sex in Ashland
The most common commute times in Ashland are 5 to 9 minutes (71 commuters, 34.3%) for males and less than 5 minutes (111 commuters, 52.9%) for females.
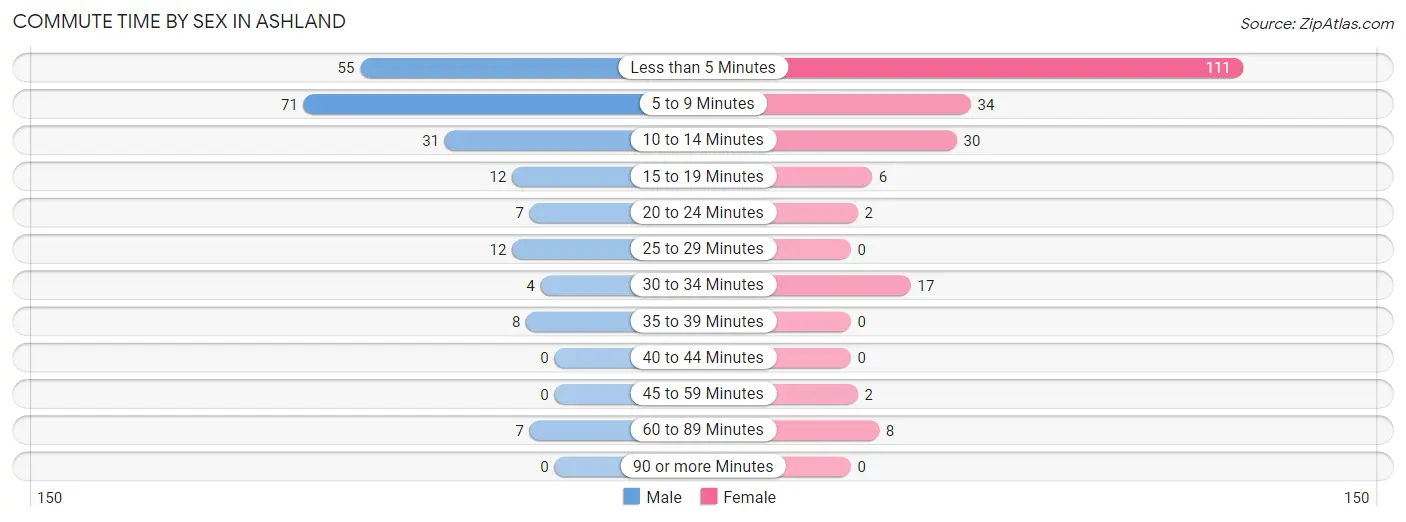
| Commute Time | Male | Female |
| Less than 5 Minutes | 55 (26.6%) | 111 (52.9%) |
| 5 to 9 Minutes | 71 (34.3%) | 34 (16.2%) |
| 10 to 14 Minutes | 31 (15.0%) | 30 (14.3%) |
| 15 to 19 Minutes | 12 (5.8%) | 6 (2.9%) |
| 20 to 24 Minutes | 7 (3.4%) | 2 (0.9%) |
| 25 to 29 Minutes | 12 (5.8%) | 0 (0.0%) |
| 30 to 34 Minutes | 4 (1.9%) | 17 (8.1%) |
| 35 to 39 Minutes | 8 (3.9%) | 0 (0.0%) |
| 40 to 44 Minutes | 0 (0.0%) | 0 (0.0%) |
| 45 to 59 Minutes | 0 (0.0%) | 2 (0.9%) |
| 60 to 89 Minutes | 7 (3.4%) | 8 (3.8%) |
| 90 or more Minutes | 0 (0.0%) | 0 (0.0%) |
Time of Departure to Work by Sex in Ashland
The most frequent times of departure to work in Ashland are 6:30 AM to 6:59 AM (49, 23.7%) for males and 8:00 AM to 8:29 AM (43, 20.5%) for females.
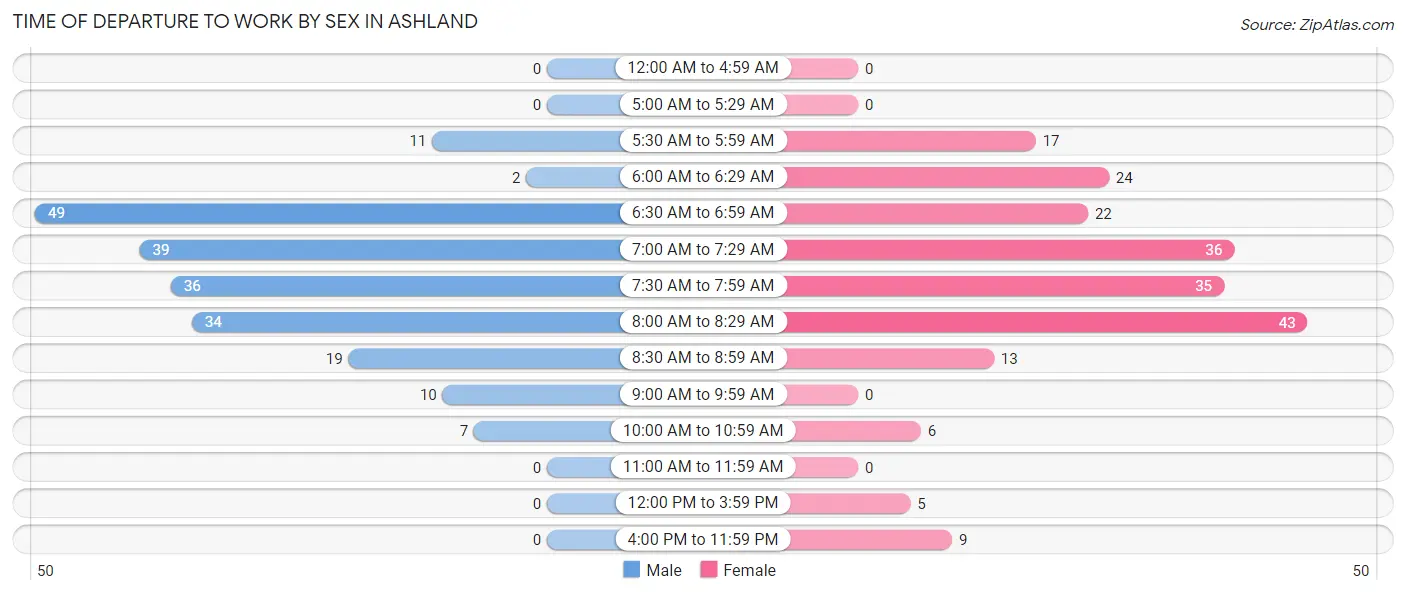
| Time of Departure | Male | Female |
| 12:00 AM to 4:59 AM | 0 (0.0%) | 0 (0.0%) |
| 5:00 AM to 5:29 AM | 0 (0.0%) | 0 (0.0%) |
| 5:30 AM to 5:59 AM | 11 (5.3%) | 17 (8.1%) |
| 6:00 AM to 6:29 AM | 2 (1.0%) | 24 (11.4%) |
| 6:30 AM to 6:59 AM | 49 (23.7%) | 22 (10.5%) |
| 7:00 AM to 7:29 AM | 39 (18.8%) | 36 (17.1%) |
| 7:30 AM to 7:59 AM | 36 (17.4%) | 35 (16.7%) |
| 8:00 AM to 8:29 AM | 34 (16.4%) | 43 (20.5%) |
| 8:30 AM to 8:59 AM | 19 (9.2%) | 13 (6.2%) |
| 9:00 AM to 9:59 AM | 10 (4.8%) | 0 (0.0%) |
| 10:00 AM to 10:59 AM | 7 (3.4%) | 6 (2.9%) |
| 11:00 AM to 11:59 AM | 0 (0.0%) | 0 (0.0%) |
| 12:00 PM to 3:59 PM | 0 (0.0%) | 5 (2.4%) |
| 4:00 PM to 11:59 PM | 0 (0.0%) | 9 (4.3%) |
| Total | 207 (100.0%) | 210 (100.0%) |
Housing Occupancy in Ashland
Occupancy by Ownership in Ashland
Of the total 343 dwellings in Ashland, owner-occupied units account for 265 (77.3%), while renter-occupied units make up 78 (22.7%).
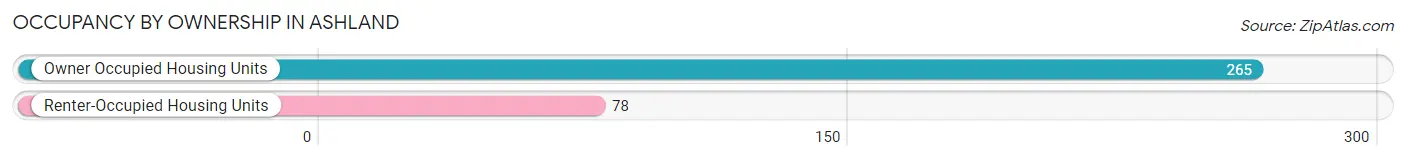
| Occupancy | # Housing Units | % Housing Units |
| Owner Occupied Housing Units | 265 | 77.3% |
| Renter-Occupied Housing Units | 78 | 22.7% |
| Total Occupied Housing Units | 343 | 100.0% |
Occupancy by Household Size in Ashland
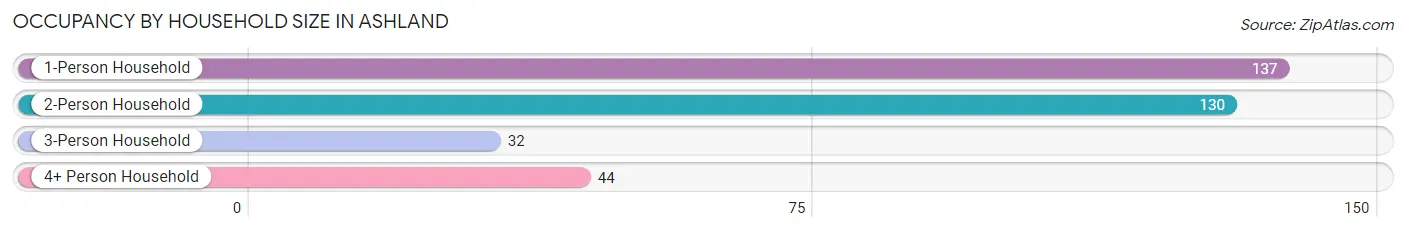
| Household Size | # Housing Units | % Housing Units |
| 1-Person Household | 137 | 39.9% |
| 2-Person Household | 130 | 37.9% |
| 3-Person Household | 32 | 9.3% |
| 4+ Person Household | 44 | 12.8% |
| Total Housing Units | 343 | 100.0% |
Occupancy by Ownership by Household Size in Ashland
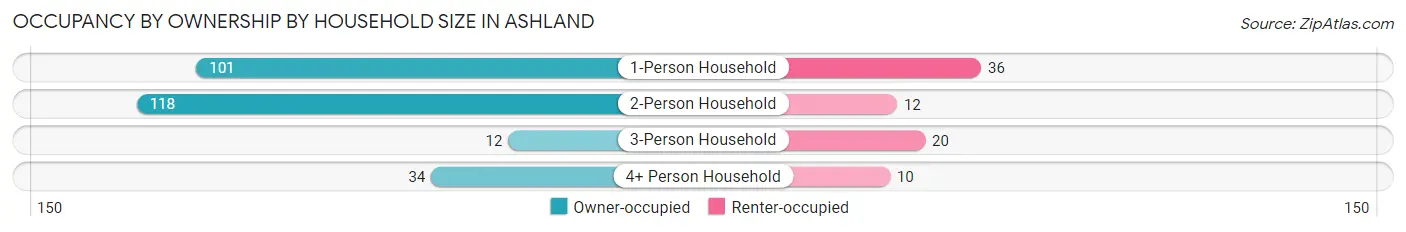
| Household Size | Owner-occupied | Renter-occupied |
| 1-Person Household | 101 (73.7%) | 36 (26.3%) |
| 2-Person Household | 118 (90.8%) | 12 (9.2%) |
| 3-Person Household | 12 (37.5%) | 20 (62.5%) |
| 4+ Person Household | 34 (77.3%) | 10 (22.7%) |
| Total Housing Units | 265 (77.3%) | 78 (22.7%) |
Occupancy by Educational Attainment in Ashland
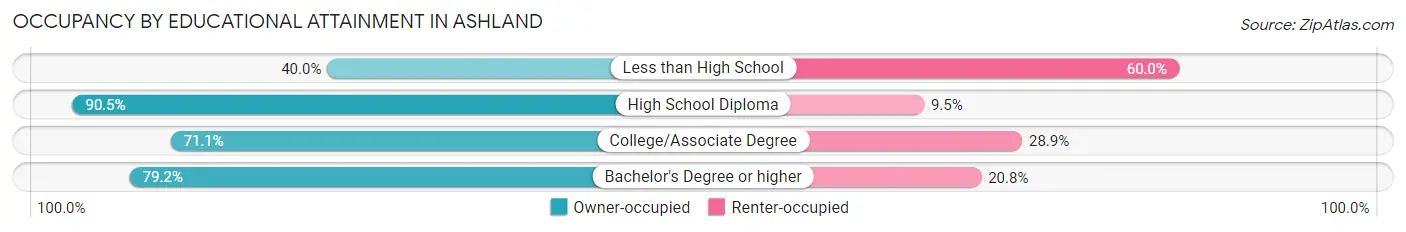
| Household Size | Owner-occupied | Renter-occupied |
| Less than High School | 4 (40.0%) | 6 (60.0%) |
| High School Diploma | 86 (90.5%) | 9 (9.5%) |
| College/Associate Degree | 118 (71.1%) | 48 (28.9%) |
| Bachelor's Degree or higher | 57 (79.2%) | 15 (20.8%) |
Occupancy by Age of Householder in Ashland
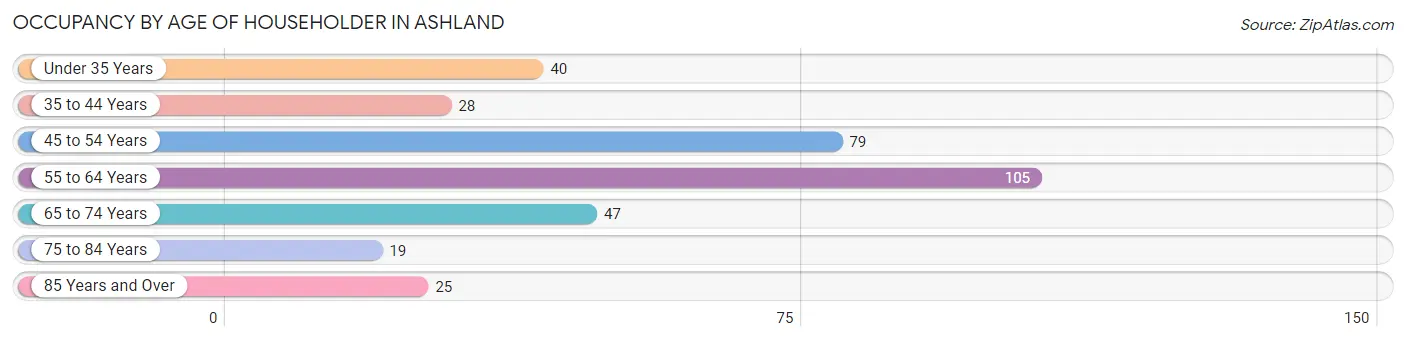
| Age Bracket | # Households | % Households |
| Under 35 Years | 40 | 11.7% |
| 35 to 44 Years | 28 | 8.2% |
| 45 to 54 Years | 79 | 23.0% |
| 55 to 64 Years | 105 | 30.6% |
| 65 to 74 Years | 47 | 13.7% |
| 75 to 84 Years | 19 | 5.5% |
| 85 Years and Over | 25 | 7.3% |
| Total | 343 | 100.0% |
Housing Finances in Ashland
Median Income by Occupancy in Ashland
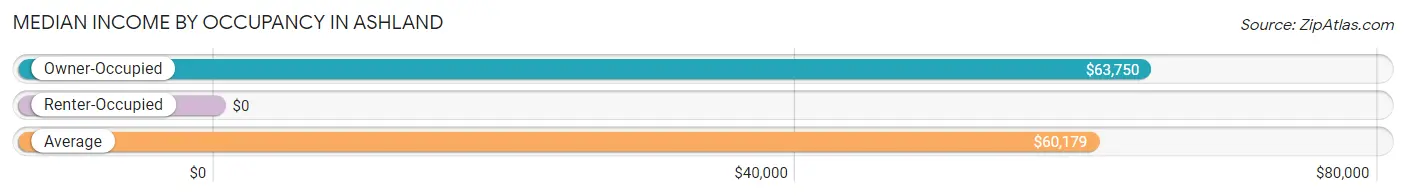
| Occupancy Type | # Households | Median Income |
| Owner-Occupied | 265 (77.3%) | $63,750 |
| Renter-Occupied | 78 (22.7%) | $0 |
| Average | 343 (100.0%) | $60,179 |
Occupancy by Householder Income Bracket in Ashland
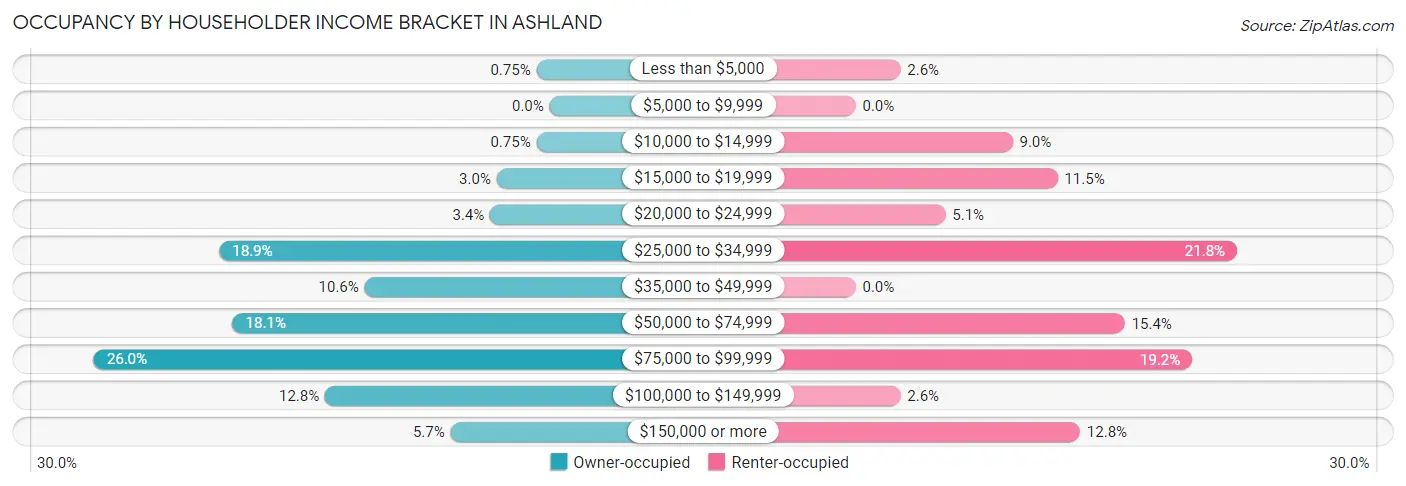
| Income Bracket | Owner-occupied | Renter-occupied |
| Less than $5,000 | 2 (0.7%) | 2 (2.6%) |
| $5,000 to $9,999 | 0 (0.0%) | 0 (0.0%) |
| $10,000 to $14,999 | 2 (0.7%) | 7 (9.0%) |
| $15,000 to $19,999 | 8 (3.0%) | 9 (11.5%) |
| $20,000 to $24,999 | 9 (3.4%) | 4 (5.1%) |
| $25,000 to $34,999 | 50 (18.9%) | 17 (21.8%) |
| $35,000 to $49,999 | 28 (10.6%) | 0 (0.0%) |
| $50,000 to $74,999 | 48 (18.1%) | 12 (15.4%) |
| $75,000 to $99,999 | 69 (26.0%) | 15 (19.2%) |
| $100,000 to $149,999 | 34 (12.8%) | 2 (2.6%) |
| $150,000 or more | 15 (5.7%) | 10 (12.8%) |
| Total | 265 (100.0%) | 78 (100.0%) |
Monthly Housing Cost Tiers in Ashland
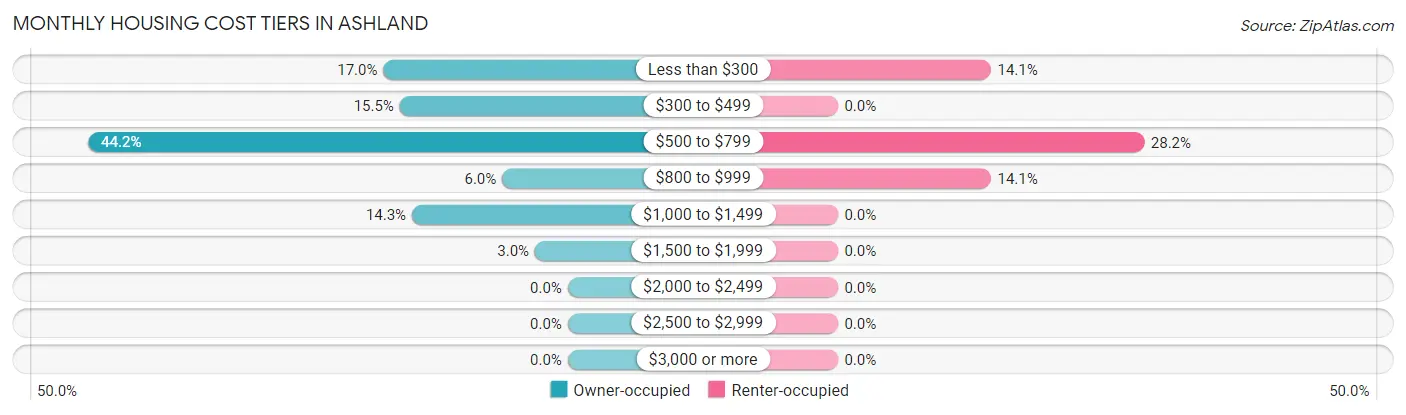
| Monthly Cost | Owner-occupied | Renter-occupied |
| Less than $300 | 45 (17.0%) | 11 (14.1%) |
| $300 to $499 | 41 (15.5%) | 0 (0.0%) |
| $500 to $799 | 117 (44.2%) | 22 (28.2%) |
| $800 to $999 | 16 (6.0%) | 11 (14.1%) |
| $1,000 to $1,499 | 38 (14.3%) | 0 (0.0%) |
| $1,500 to $1,999 | 8 (3.0%) | 0 (0.0%) |
| $2,000 to $2,499 | 0 (0.0%) | 0 (0.0%) |
| $2,500 to $2,999 | 0 (0.0%) | 0 (0.0%) |
| $3,000 or more | 0 (0.0%) | 0 (0.0%) |
| Total | 265 (100.0%) | 78 (100.0%) |
Physical Housing Characteristics in Ashland
Housing Structures in Ashland
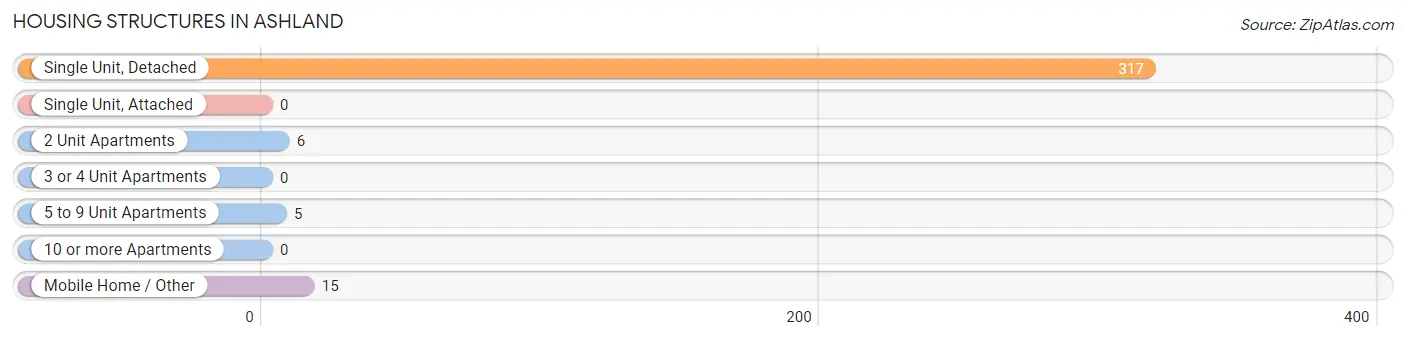
| Structure Type | # Housing Units | % Housing Units |
| Single Unit, Detached | 317 | 92.4% |
| Single Unit, Attached | 0 | 0.0% |
| 2 Unit Apartments | 6 | 1.8% |
| 3 or 4 Unit Apartments | 0 | 0.0% |
| 5 to 9 Unit Apartments | 5 | 1.5% |
| 10 or more Apartments | 0 | 0.0% |
| Mobile Home / Other | 15 | 4.4% |
| Total | 343 | 100.0% |
Housing Structures by Occupancy in Ashland
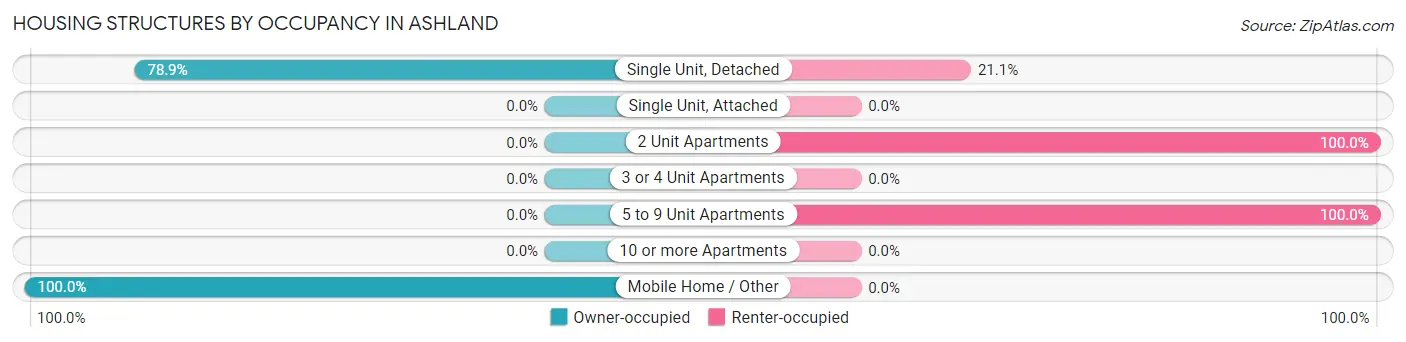
| Structure Type | Owner-occupied | Renter-occupied |
| Single Unit, Detached | 250 (78.9%) | 67 (21.1%) |
| Single Unit, Attached | 0 (0.0%) | 0 (0.0%) |
| 2 Unit Apartments | 0 (0.0%) | 6 (100.0%) |
| 3 or 4 Unit Apartments | 0 (0.0%) | 0 (0.0%) |
| 5 to 9 Unit Apartments | 0 (0.0%) | 5 (100.0%) |
| 10 or more Apartments | 0 (0.0%) | 0 (0.0%) |
| Mobile Home / Other | 15 (100.0%) | 0 (0.0%) |
| Total | 265 (77.3%) | 78 (22.7%) |
Housing Structures by Number of Rooms in Ashland
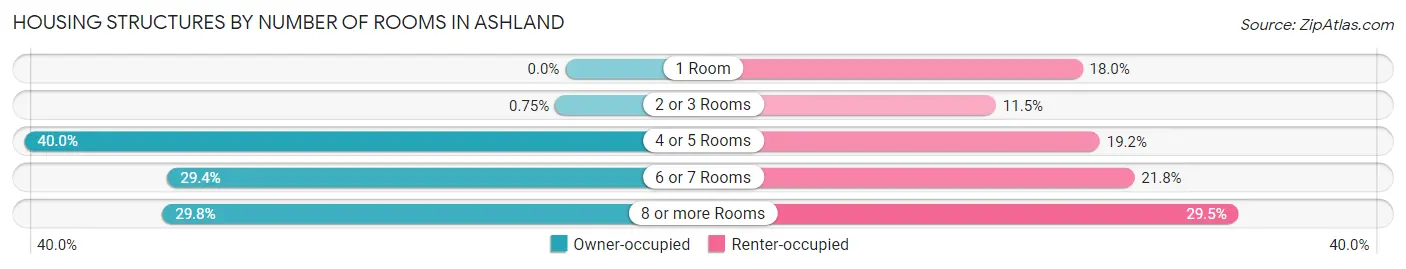
| Number of Rooms | Owner-occupied | Renter-occupied |
| 1 Room | 0 (0.0%) | 14 (17.9%) |
| 2 or 3 Rooms | 2 (0.7%) | 9 (11.5%) |
| 4 or 5 Rooms | 106 (40.0%) | 15 (19.2%) |
| 6 or 7 Rooms | 78 (29.4%) | 17 (21.8%) |
| 8 or more Rooms | 79 (29.8%) | 23 (29.5%) |
| Total | 265 (100.0%) | 78 (100.0%) |
Housing Structure by Heating Type in Ashland
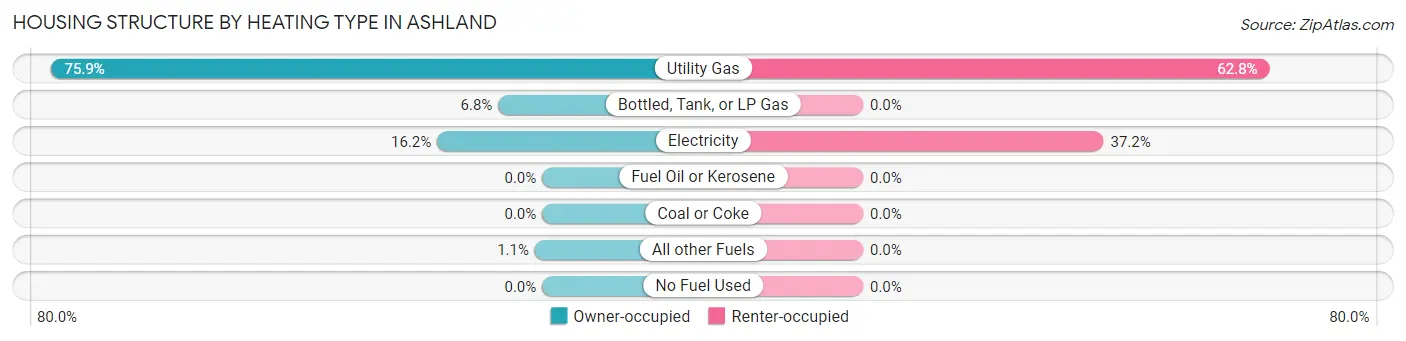
| Heating Type | Owner-occupied | Renter-occupied |
| Utility Gas | 201 (75.8%) | 49 (62.8%) |
| Bottled, Tank, or LP Gas | 18 (6.8%) | 0 (0.0%) |
| Electricity | 43 (16.2%) | 29 (37.2%) |
| Fuel Oil or Kerosene | 0 (0.0%) | 0 (0.0%) |
| Coal or Coke | 0 (0.0%) | 0 (0.0%) |
| All other Fuels | 3 (1.1%) | 0 (0.0%) |
| No Fuel Used | 0 (0.0%) | 0 (0.0%) |
| Total | 265 (100.0%) | 78 (100.0%) |
Household Vehicle Usage in Ashland
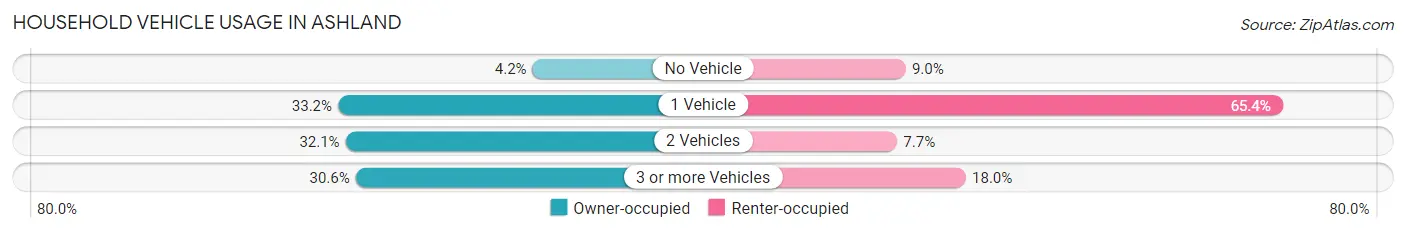
| Vehicles per Household | Owner-occupied | Renter-occupied |
| No Vehicle | 11 (4.2%) | 7 (9.0%) |
| 1 Vehicle | 88 (33.2%) | 51 (65.4%) |
| 2 Vehicles | 85 (32.1%) | 6 (7.7%) |
| 3 or more Vehicles | 81 (30.6%) | 14 (17.9%) |
| Total | 265 (100.0%) | 78 (100.0%) |
Real Estate & Mortgages in Ashland
Real Estate and Mortgage Overview in Ashland
| Characteristic | Without Mortgage | With Mortgage |
| Housing Units | 167 | 98 |
| Median Property Value | $66,800 | $67,600 |
| Median Household Income | $54,375 | $8 |
| Monthly Housing Costs | $492 | $0 |
| Real Estate Taxes | $1,309 | $0 |
Property Value by Mortgage Status in Ashland
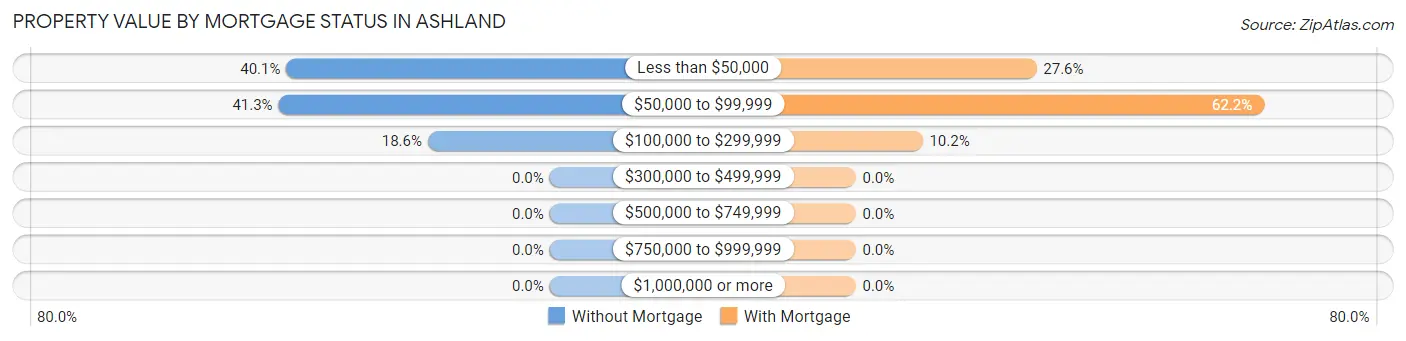
| Property Value | Without Mortgage | With Mortgage |
| Less than $50,000 | 67 (40.1%) | 27 (27.6%) |
| $50,000 to $99,999 | 69 (41.3%) | 61 (62.2%) |
| $100,000 to $299,999 | 31 (18.6%) | 10 (10.2%) |
| $300,000 to $499,999 | 0 (0.0%) | 0 (0.0%) |
| $500,000 to $749,999 | 0 (0.0%) | 0 (0.0%) |
| $750,000 to $999,999 | 0 (0.0%) | 0 (0.0%) |
| $1,000,000 or more | 0 (0.0%) | 0 (0.0%) |
| Total | 167 (100.0%) | 98 (100.0%) |
Household Income by Mortgage Status in Ashland
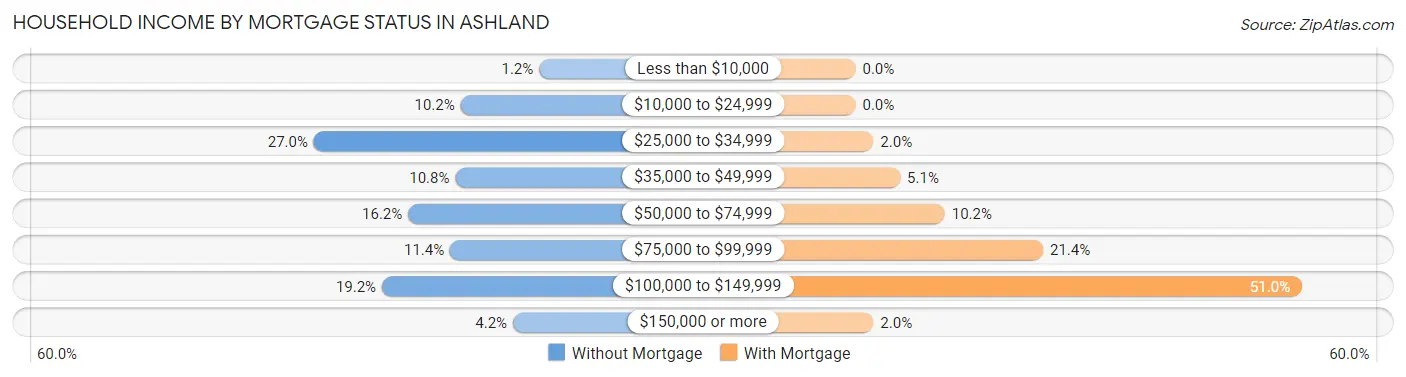
| Household Income | Without Mortgage | With Mortgage |
| Less than $10,000 | 2 (1.2%) | 0 (0.0%) |
| $10,000 to $24,999 | 17 (10.2%) | 0 (0.0%) |
| $25,000 to $34,999 | 45 (27.0%) | 2 (2.0%) |
| $35,000 to $49,999 | 18 (10.8%) | 5 (5.1%) |
| $50,000 to $74,999 | 27 (16.2%) | 10 (10.2%) |
| $75,000 to $99,999 | 19 (11.4%) | 21 (21.4%) |
| $100,000 to $149,999 | 32 (19.2%) | 50 (51.0%) |
| $150,000 or more | 7 (4.2%) | 2 (2.0%) |
| Total | 167 (100.0%) | 98 (100.0%) |
Property Value to Household Income Ratio in Ashland
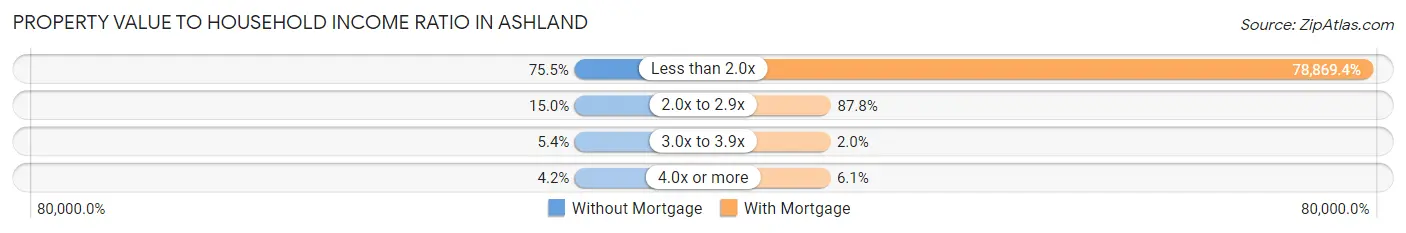
| Value-to-Income Ratio | Without Mortgage | With Mortgage |
| Less than 2.0x | 126 (75.4%) | 77,292 (78,869.4%) |
| 2.0x to 2.9x | 25 (15.0%) | 86 (87.8%) |
| 3.0x to 3.9x | 9 (5.4%) | 2 (2.0%) |
| 4.0x or more | 7 (4.2%) | 6 (6.1%) |
| Total | 167 (100.0%) | 98 (100.0%) |
Real Estate Taxes by Mortgage Status in Ashland
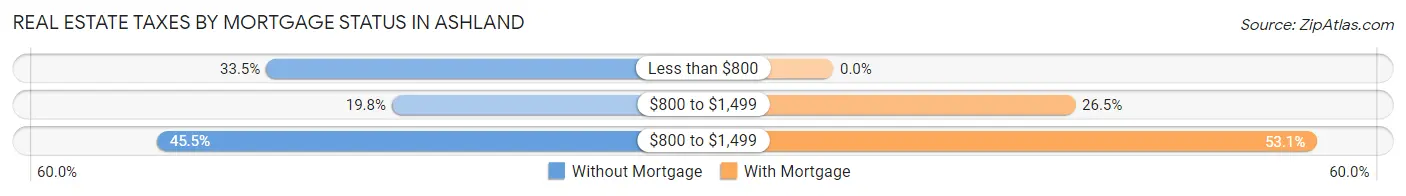
| Property Taxes | Without Mortgage | With Mortgage |
| Less than $800 | 56 (33.5%) | 0 (0.0%) |
| $800 to $1,499 | 33 (19.8%) | 26 (26.5%) |
| $800 to $1,499 | 76 (45.5%) | 52 (53.1%) |
| Total | 167 (100.0%) | 98 (100.0%) |
Health & Disability in Ashland
Health Insurance Coverage by Age in Ashland
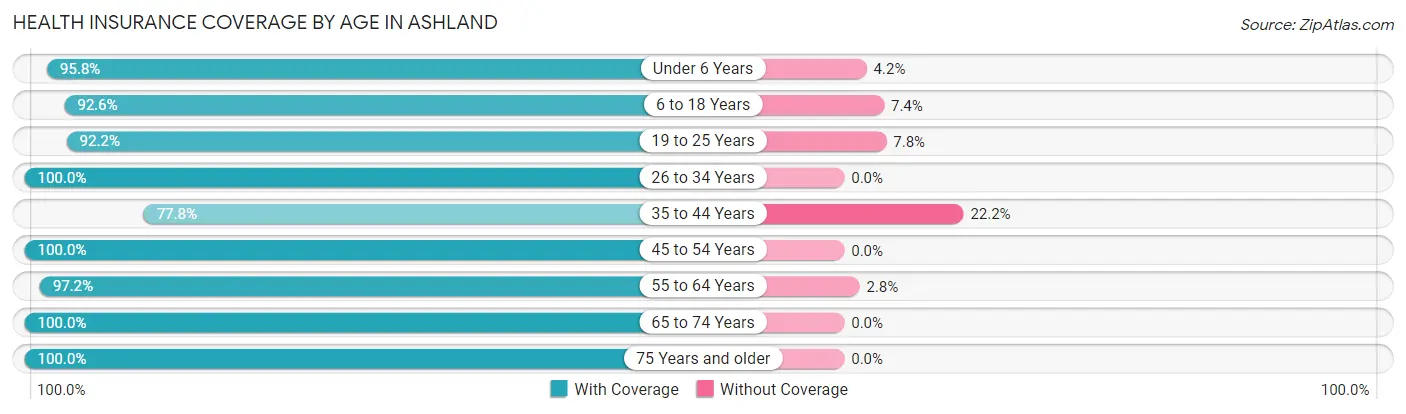
| Age Bracket | With Coverage | Without Coverage |
| Under 6 Years | 46 (95.8%) | 2 (4.2%) |
| 6 to 18 Years | 125 (92.6%) | 10 (7.4%) |
| 19 to 25 Years | 47 (92.2%) | 4 (7.8%) |
| 26 to 34 Years | 33 (100.0%) | 0 (0.0%) |
| 35 to 44 Years | 42 (77.8%) | 12 (22.2%) |
| 45 to 54 Years | 142 (100.0%) | 0 (0.0%) |
| 55 to 64 Years | 171 (97.2%) | 5 (2.8%) |
| 65 to 74 Years | 76 (100.0%) | 0 (0.0%) |
| 75 Years and older | 58 (100.0%) | 0 (0.0%) |
| Total | 740 (95.7%) | 33 (4.3%) |
Health Insurance Coverage by Citizenship Status in Ashland
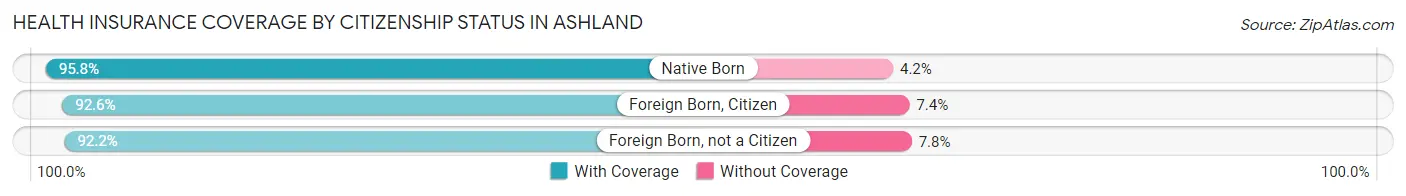
| Citizenship Status | With Coverage | Without Coverage |
| Native Born | 46 (95.8%) | 2 (4.2%) |
| Foreign Born, Citizen | 125 (92.6%) | 10 (7.4%) |
| Foreign Born, not a Citizen | 47 (92.2%) | 4 (7.8%) |
Health Insurance Coverage by Household Income in Ashland
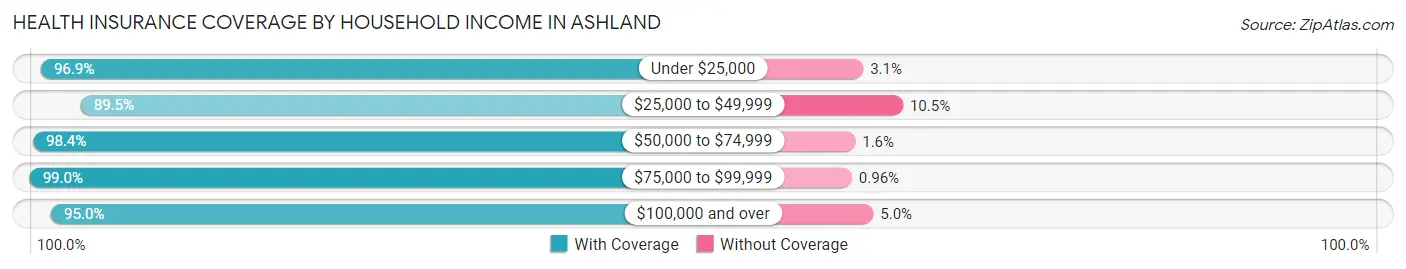
| Household Income | With Coverage | Without Coverage |
| Under $25,000 | 63 (96.9%) | 2 (3.1%) |
| $25,000 to $49,999 | 136 (89.5%) | 16 (10.5%) |
| $50,000 to $74,999 | 124 (98.4%) | 2 (1.6%) |
| $75,000 to $99,999 | 207 (99.0%) | 2 (1.0%) |
| $100,000 and over | 210 (95.0%) | 11 (5.0%) |
Public vs Private Health Insurance Coverage by Age in Ashland
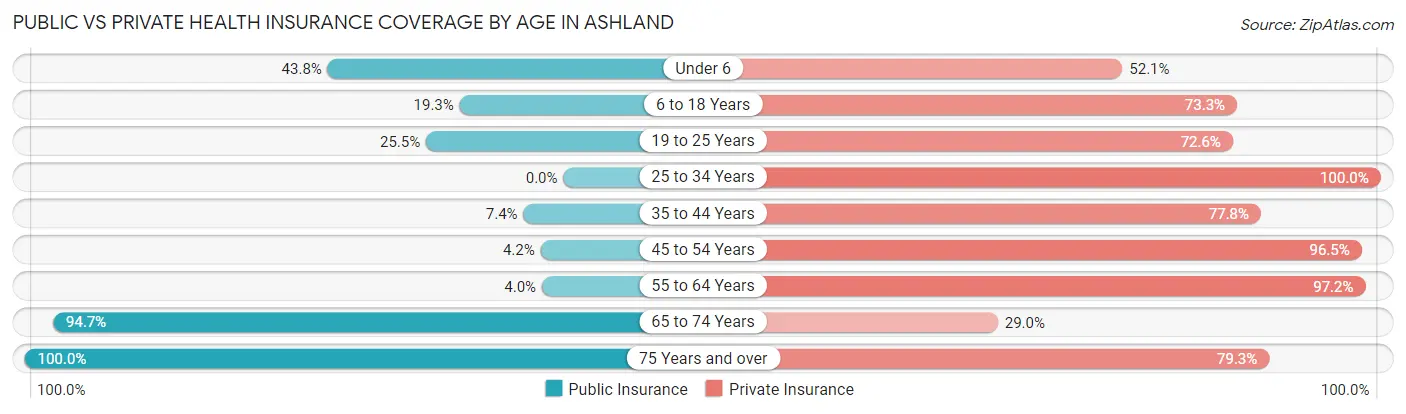
| Age Bracket | Public Insurance | Private Insurance |
| Under 6 | 21 (43.8%) | 25 (52.1%) |
| 6 to 18 Years | 26 (19.3%) | 99 (73.3%) |
| 19 to 25 Years | 13 (25.5%) | 37 (72.6%) |
| 25 to 34 Years | 0 (0.0%) | 33 (100.0%) |
| 35 to 44 Years | 4 (7.4%) | 42 (77.8%) |
| 45 to 54 Years | 6 (4.2%) | 137 (96.5%) |
| 55 to 64 Years | 7 (4.0%) | 171 (97.2%) |
| 65 to 74 Years | 72 (94.7%) | 22 (28.9%) |
| 75 Years and over | 58 (100.0%) | 46 (79.3%) |
| Total | 207 (26.8%) | 612 (79.2%) |
Disability Status by Sex by Age in Ashland
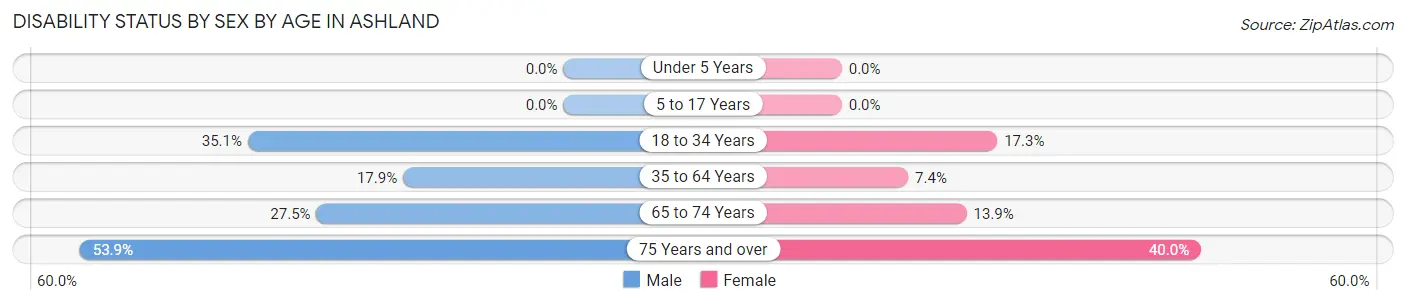
| Age Bracket | Male | Female |
| Under 5 Years | 0 (0.0%) | 0 (0.0%) |
| 5 to 17 Years | 0 (0.0%) | 0 (0.0%) |
| 18 to 34 Years | 13 (35.1%) | 9 (17.3%) |
| 35 to 64 Years | 35 (17.9%) | 13 (7.4%) |
| 65 to 74 Years | 11 (27.5%) | 5 (13.9%) |
| 75 Years and over | 7 (53.8%) | 18 (40.0%) |
Disability Class by Sex by Age in Ashland
Disability Class: Hearing Difficulty
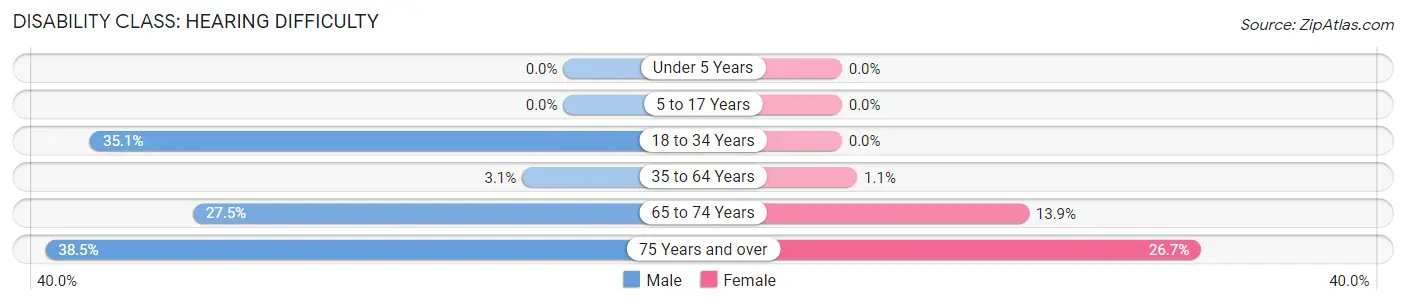
| Age Bracket | Male | Female |
| Under 5 Years | 0 (0.0%) | 0 (0.0%) |
| 5 to 17 Years | 0 (0.0%) | 0 (0.0%) |
| 18 to 34 Years | 13 (35.1%) | 0 (0.0%) |
| 35 to 64 Years | 6 (3.1%) | 2 (1.1%) |
| 65 to 74 Years | 11 (27.5%) | 5 (13.9%) |
| 75 Years and over | 5 (38.5%) | 12 (26.7%) |
Disability Class: Vision Difficulty
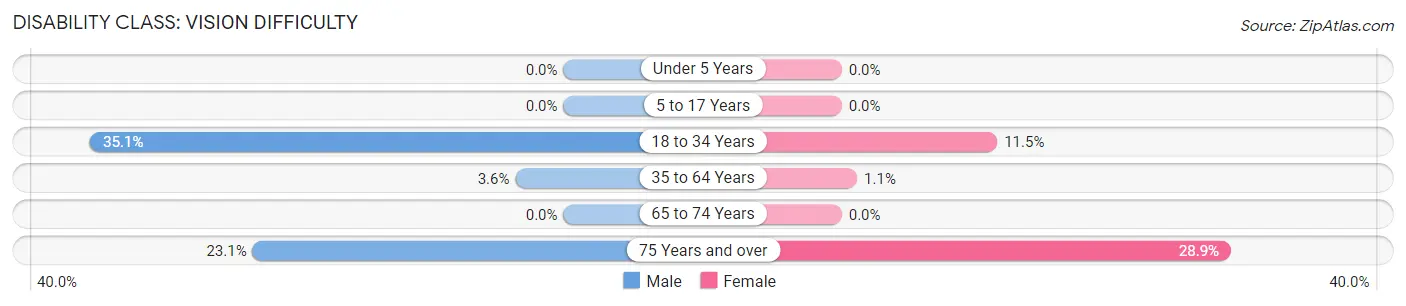
| Age Bracket | Male | Female |
| Under 5 Years | 0 (0.0%) | 0 (0.0%) |
| 5 to 17 Years | 0 (0.0%) | 0 (0.0%) |
| 18 to 34 Years | 13 (35.1%) | 6 (11.5%) |
| 35 to 64 Years | 7 (3.6%) | 2 (1.1%) |
| 65 to 74 Years | 0 (0.0%) | 0 (0.0%) |
| 75 Years and over | 3 (23.1%) | 13 (28.9%) |
Disability Class: Cognitive Difficulty
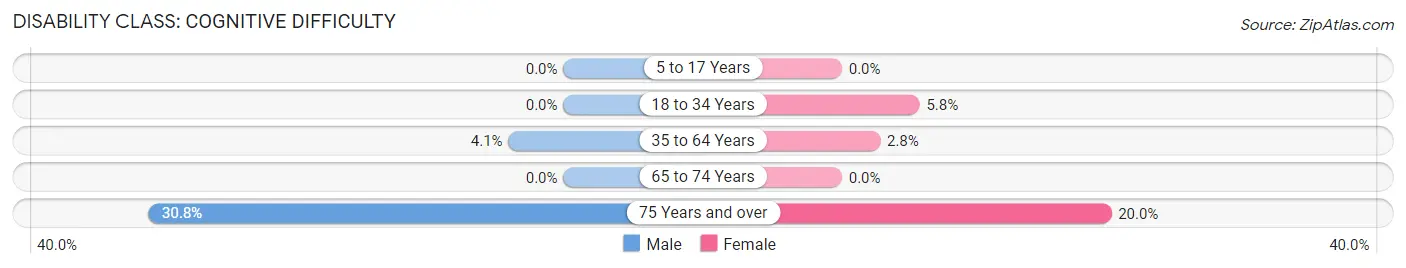
| Age Bracket | Male | Female |
| 5 to 17 Years | 0 (0.0%) | 0 (0.0%) |
| 18 to 34 Years | 0 (0.0%) | 3 (5.8%) |
| 35 to 64 Years | 8 (4.1%) | 5 (2.8%) |
| 65 to 74 Years | 0 (0.0%) | 0 (0.0%) |
| 75 Years and over | 4 (30.8%) | 9 (20.0%) |
Disability Class: Ambulatory Difficulty
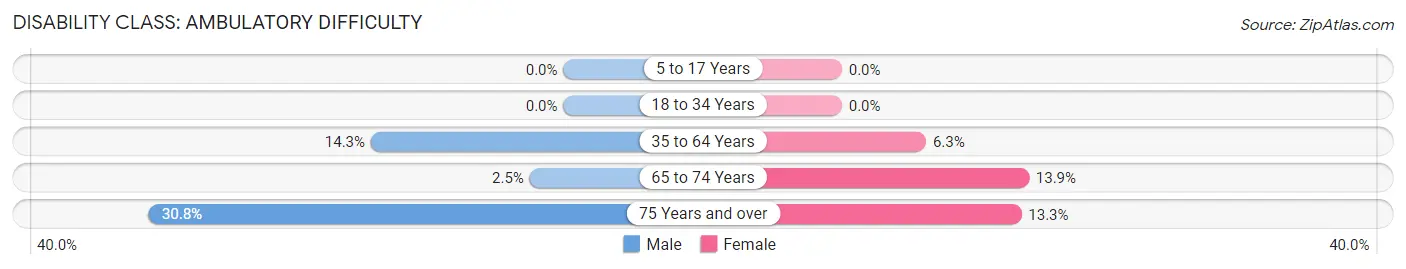
| Age Bracket | Male | Female |
| 5 to 17 Years | 0 (0.0%) | 0 (0.0%) |
| 18 to 34 Years | 0 (0.0%) | 0 (0.0%) |
| 35 to 64 Years | 28 (14.3%) | 11 (6.2%) |
| 65 to 74 Years | 1 (2.5%) | 5 (13.9%) |
| 75 Years and over | 4 (30.8%) | 6 (13.3%) |
Disability Class: Self-Care Difficulty
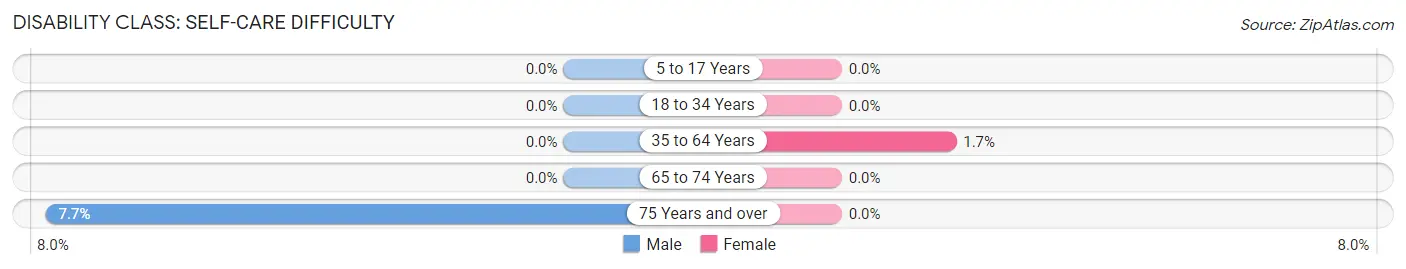
| Age Bracket | Male | Female |
| 5 to 17 Years | 0 (0.0%) | 0 (0.0%) |
| 18 to 34 Years | 0 (0.0%) | 0 (0.0%) |
| 35 to 64 Years | 0 (0.0%) | 3 (1.7%) |
| 65 to 74 Years | 0 (0.0%) | 0 (0.0%) |
| 75 Years and over | 1 (7.7%) | 0 (0.0%) |
Technology Access in Ashland
Computing Device Access in Ashland
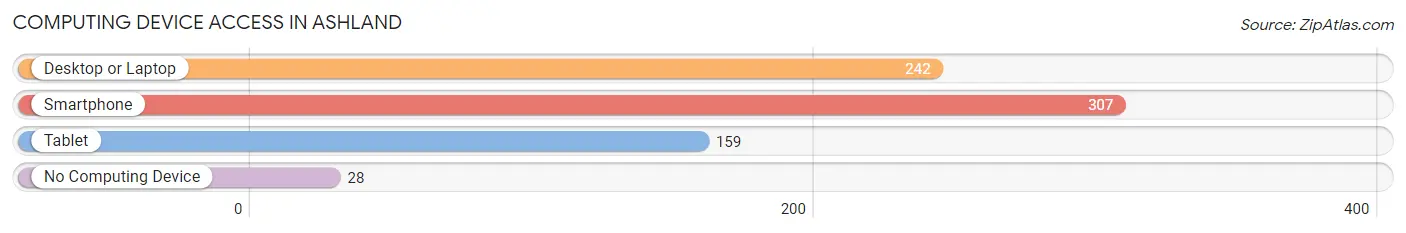
| Device Type | # Households | % Households |
| Desktop or Laptop | 242 | 70.6% |
| Smartphone | 307 | 89.5% |
| Tablet | 159 | 46.4% |
| No Computing Device | 28 | 8.2% |
| Total | 343 | 100.0% |
Internet Access in Ashland
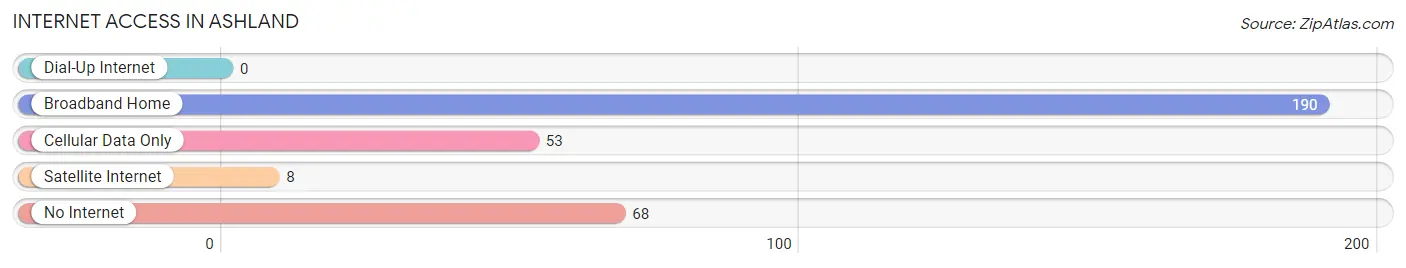
| Internet Type | # Households | % Households |
| Dial-Up Internet | 0 | 0.0% |
| Broadband Home | 190 | 55.4% |
| Cellular Data Only | 53 | 15.4% |
| Satellite Internet | 8 | 2.3% |
| No Internet | 68 | 19.8% |
| Total | 343 | 100.0% |
Ashland Summary
Ashland, Kansas is a small town located in Clark County, Kansas. It is situated in the southwestern corner of the state, approximately 25 miles from the Oklahoma border. The town was founded in 1887 and has a population of approximately 500 people.
History
The town of Ashland was founded in 1887 by a group of settlers from the nearby town of Englewood. The settlers were looking for a place to settle and start a new life. The town was named after the nearby Ashland Creek, which was named after the ash trees that grew along its banks. The town was originally a farming community, but soon developed into a small trading center.
In the early 1900s, the town began to grow and prosper. The railroad came to town in 1906, bringing with it new businesses and opportunities. The town also became a popular stop for travelers on the Santa Fe Trail.
In the 1920s, the town experienced a period of growth and prosperity. The population increased from 500 to 1,000 people. The town also saw the construction of a new school, a bank, and a post office.
In the 1950s, the town experienced a decline in population as many of the younger residents moved away to larger cities. The town also experienced a decline in businesses as the railroad stopped running through town.
Geography
Ashland is located in the southwestern corner of Kansas, approximately 25 miles from the Oklahoma border. The town is situated in the High Plains region of the state, which is characterized by flat terrain and dry climate. The town is located on the banks of Ashland Creek, which is a tributary of the Arkansas River.
The town is surrounded by agricultural land, which is used for growing wheat, corn, and other crops. The town is also located near several small lakes, which provide recreational opportunities for the residents.
Economy
The economy of Ashland is largely based on agriculture. The town is surrounded by agricultural land, which is used for growing wheat, corn, and other crops. The town also has several small businesses, including a grocery store, a hardware store, and a restaurant.
The town also has a small manufacturing sector, which produces a variety of products, including furniture, clothing, and electronics. The town also has a small tourism industry, which is centered around the nearby lakes and recreational activities.
Demographics
As of the 2010 census, the population of Ashland was 498 people. The town has a median age of 39.7 years, with a gender ratio of 50.2% male and 49.8% female. The town is predominantly white, with a small Hispanic population. The town also has a small Native American population.
The town has a median household income of $37,500, and a poverty rate of 16.3%. The town also has a high rate of unemployment, with a rate of 8.3%.
Conclusion
Ashland, Kansas is a small town located in Clark County, Kansas. It was founded in 1887 and has a population of approximately 500 people. The town is situated in the High Plains region of the state, which is characterized by flat terrain and dry climate. The economy of Ashland is largely based on agriculture, with a small manufacturing sector and a small tourism industry. The town has a median age of 39.7 years, with a gender ratio of 50.2% male and 49.8% female. The town has a median household income of $37,500, and a poverty rate of 16.3%.
Common Questions
What is Per Capita Income in Ashland?
Per Capita income in Ashland is $32,393.
What is the Median Family Income in Ashland?
Median Family Income in Ashland is $84,444.
What is the Median Household income in Ashland?
Median Household Income in Ashland is $60,179.
What is Income or Wage Gap in Ashland?
Income or Wage Gap in Ashland is 31.1%.
Women in Ashland earn 68.9 cents for every dollar earned by a man.
What is Inequality or Gini Index in Ashland?
Inequality or Gini Index in Ashland is 0.37.
What is the Total Population of Ashland?
Total Population of Ashland is 802.
What is the Total Male Population of Ashland?
Total Male Population of Ashland is 391.
What is the Total Female Population of Ashland?
Total Female Population of Ashland is 411.
What is the Ratio of Males per 100 Females in Ashland?
There are 95.13 Males per 100 Females in Ashland.
What is the Ratio of Females per 100 Males in Ashland?
There are 105.12 Females per 100 Males in Ashland.
What is the Median Population Age in Ashland?
Median Population Age in Ashland is 50.1 Years.
What is the Average Family Size in Ashland
Average Family Size in Ashland is 3.0 People.
What is the Average Household Size in Ashland
Average Household Size in Ashland is 2.2 People.
How Large is the Labor Force in Ashland?
There are 462 People in the Labor Forcein in Ashland.
What is the Percentage of People in the Labor Force in Ashland?
69.4% of People are in the Labor Force in Ashland.
What is the Unemployment Rate in Ashland?
Unemployment Rate in Ashland is 1.3%.