Anthony, KS Map & Demographics
Anthony Map
Anthony Overview
$23,675
PER CAPITA INCOME
$58,640
AVG FAMILY INCOME
$51,117
AVG HOUSEHOLD INCOME
39.7%
WAGE / INCOME GAP [ % ]
60.3¢/ $1
WAGE / INCOME GAP [ $ ]
$13,868
FAMILY INCOME DEFICIT
0.41
INEQUALITY / GINI INDEX
2,290
TOTAL POPULATION
983
MALE POPULATION
1,307
FEMALE POPULATION
75.21
MALES / 100 FEMALES
132.96
FEMALES / 100 MALES
38.4
MEDIAN AGE
3.6
AVG FAMILY SIZE
2.7
AVG HOUSEHOLD SIZE
953
LABOR FORCE [ PEOPLE ]
56.4%
PERCENT IN LABOR FORCE
9.3%
UNEMPLOYMENT RATE
Anthony Zip Codes
Anthony Area Codes
Income in Anthony
Income Overview in Anthony
Per Capita Income in Anthony is $23,675, while median incomes of families and households are $58,640 and $51,117 respectively.
| Characteristic | Number | Measure |
| Per Capita Income | 2,290 | $23,675 |
| Median Family Income | 495 | $58,640 |
| Mean Family Income | 495 | $68,486 |
| Median Household Income | 801 | $51,117 |
| Mean Household Income | 801 | $62,198 |
| Income Deficit | 495 | $13,868 |
| Wage / Income Gap (%) | 2,290 | 39.68% |
| Wage / Income Gap ($) | 2,290 | 60.32¢ per $1 |
| Gini / Inequality Index | 2,290 | 0.41 |
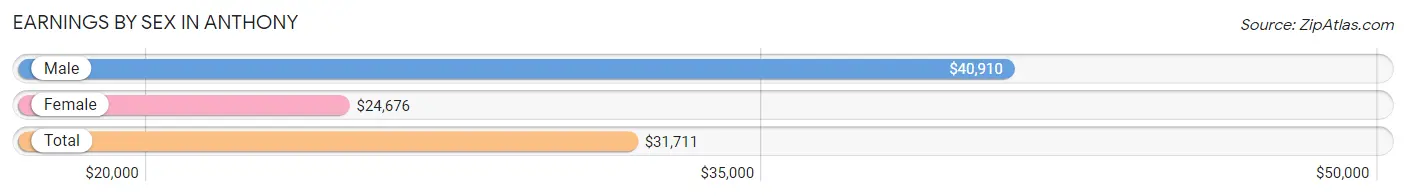
Earnings by Sex in Anthony
Average Earnings in Anthony are $31,711, $40,910 for men and $24,676 for women, a difference of 39.7%.
| Sex | Number | Average Earnings |
| Male | 473 (49.8%) | $40,910 |
| Female | 477 (50.2%) | $24,676 |
| Total | 950 (100.0%) | $31,711 |
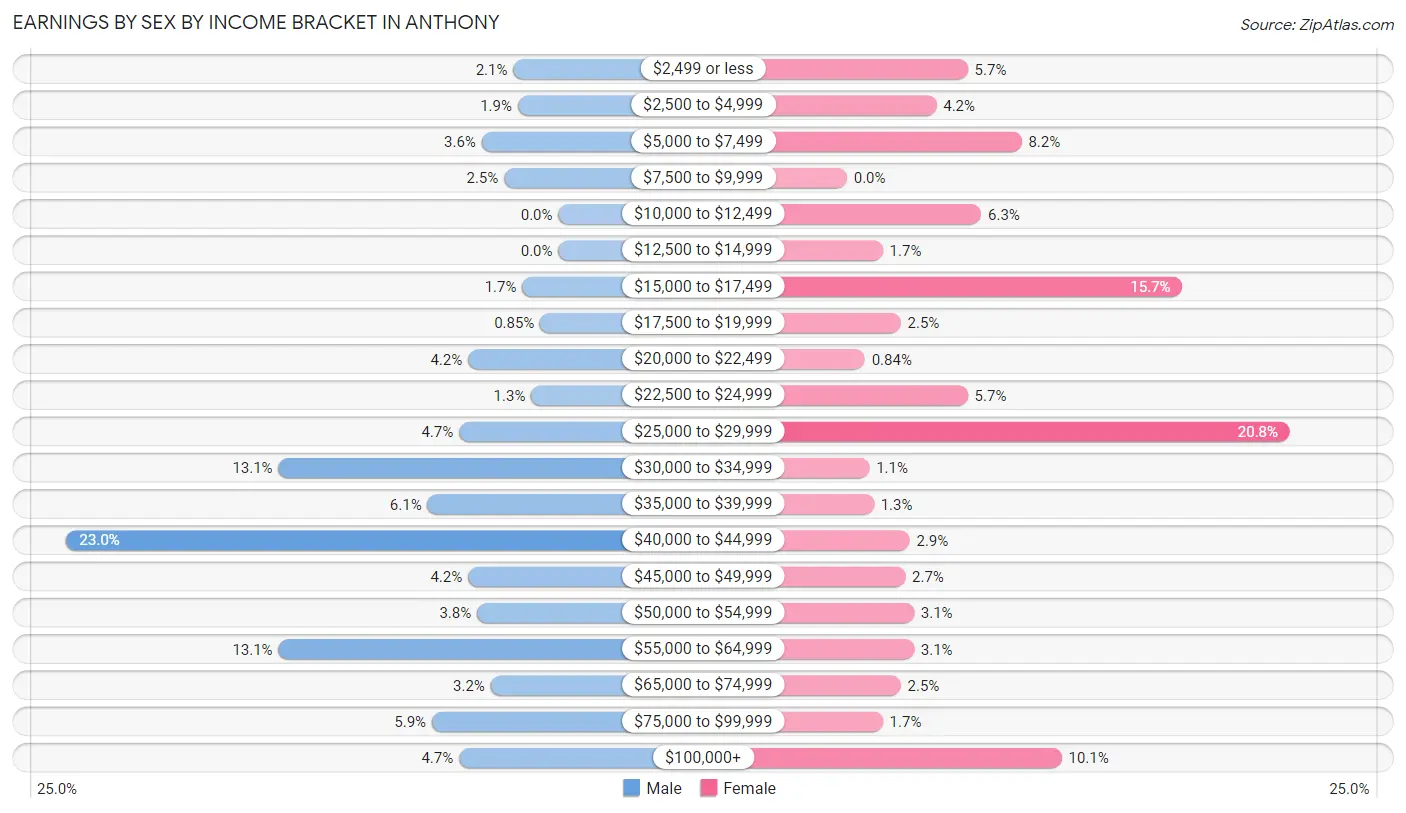
Earnings by Sex by Income Bracket in Anthony
The most common earnings brackets in Anthony are $40,000 to $44,999 for men (109 | 23.0%) and $25,000 to $29,999 for women (99 | 20.7%).
| Income | Male | Female |
| $2,499 or less | 10 (2.1%) | 27 (5.7%) |
| $2,500 to $4,999 | 9 (1.9%) | 20 (4.2%) |
| $5,000 to $7,499 | 17 (3.6%) | 39 (8.2%) |
| $7,500 to $9,999 | 12 (2.5%) | 0 (0.0%) |
| $10,000 to $12,499 | 0 (0.0%) | 30 (6.3%) |
| $12,500 to $14,999 | 0 (0.0%) | 8 (1.7%) |
| $15,000 to $17,499 | 8 (1.7%) | 75 (15.7%) |
| $17,500 to $19,999 | 4 (0.9%) | 12 (2.5%) |
| $20,000 to $22,499 | 20 (4.2%) | 4 (0.8%) |
| $22,500 to $24,999 | 6 (1.3%) | 27 (5.7%) |
| $25,000 to $29,999 | 22 (4.6%) | 99 (20.7%) |
| $30,000 to $34,999 | 62 (13.1%) | 5 (1.1%) |
| $35,000 to $39,999 | 29 (6.1%) | 6 (1.3%) |
| $40,000 to $44,999 | 109 (23.0%) | 14 (2.9%) |
| $45,000 to $49,999 | 20 (4.2%) | 13 (2.7%) |
| $50,000 to $54,999 | 18 (3.8%) | 15 (3.1%) |
| $55,000 to $64,999 | 62 (13.1%) | 15 (3.1%) |
| $65,000 to $74,999 | 15 (3.2%) | 12 (2.5%) |
| $75,000 to $99,999 | 28 (5.9%) | 8 (1.7%) |
| $100,000+ | 22 (4.6%) | 48 (10.1%) |
| Total | 473 (100.0%) | 477 (100.0%) |
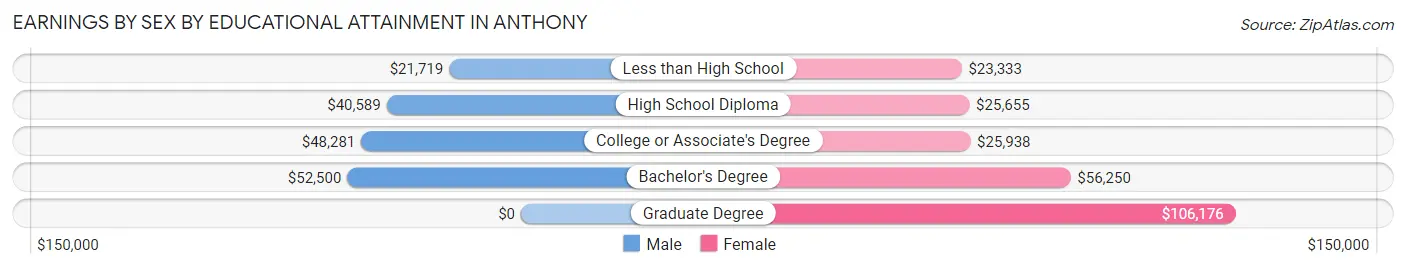
Earnings by Sex by Educational Attainment in Anthony
Average earnings in Anthony are $41,517 for men and $26,742 for women, a difference of 35.6%. Men with an educational attainment of bachelor's degree enjoy the highest average annual earnings of $52,500, while those with less than high school education earn the least with $21,719. Women with an educational attainment of graduate degree earn the most with the average annual earnings of $106,176, while those with less than high school education have the smallest earnings of $23,333.
| Educational Attainment | Male Income | Female Income |
| Less than High School | $21,719 | $23,333 |
| High School Diploma | $40,589 | $25,655 |
| College or Associate's Degree | $48,281 | $25,938 |
| Bachelor's Degree | $52,500 | $56,250 |
| Graduate Degree | - | - |
| Total | $41,517 | $26,742 |
Family Income in Anthony
Family Income Brackets in Anthony
According to the Anthony family income data, there are 142 families falling into the $50,000 to $74,999 income range, which is the most common income bracket and makes up 28.7% of all families. Conversely, the $10,000 to $14,999 income bracket is the least frequent group with only 2 families (0.4%) belonging to this category.
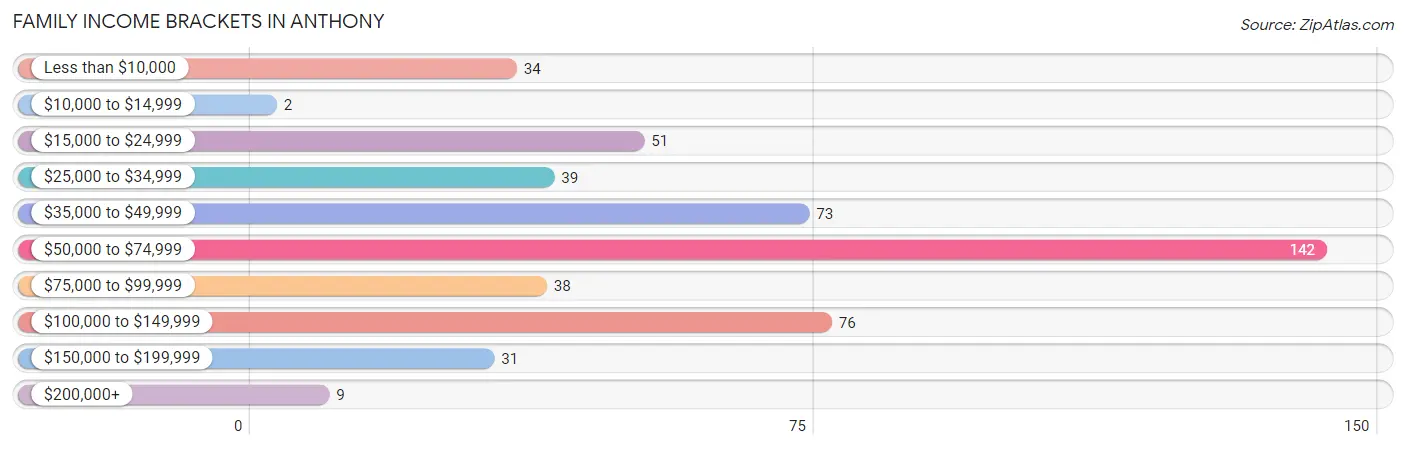
| Income Bracket | # Families | % Families |
| Less than $10,000 | 34 | 6.9% |
| $10,000 to $14,999 | 2 | 0.4% |
| $15,000 to $24,999 | 51 | 10.3% |
| $25,000 to $34,999 | 39 | 7.9% |
| $35,000 to $49,999 | 73 | 14.7% |
| $50,000 to $74,999 | 142 | 28.7% |
| $75,000 to $99,999 | 38 | 7.7% |
| $100,000 to $149,999 | 76 | 15.4% |
| $150,000 to $199,999 | 31 | 6.3% |
| $200,000+ | 9 | 1.8% |
Family Income by Famaliy Size in Anthony
5-person families (37 | 7.5%) account for the highest median family income in Anthony with $134,250 per family, while 4-person families (89 | 18.0%) have the highest median income of $26,940 per family member.
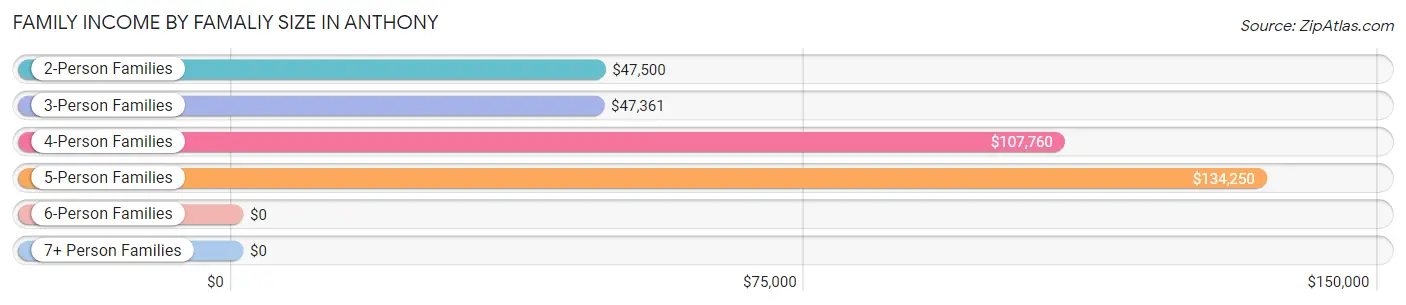
| Income Bracket | # Families | Median Income |
| 2-Person Families | 226 (45.7%) | $47,500 |
| 3-Person Families | 107 (21.6%) | $47,361 |
| 4-Person Families | 89 (18.0%) | $107,760 |
| 5-Person Families | 37 (7.5%) | $134,250 |
| 6-Person Families | 17 (3.4%) | $0 |
| 7+ Person Families | 19 (3.8%) | $0 |
| Total | 495 (100.0%) | $58,640 |
Family Income by Number of Earners in Anthony
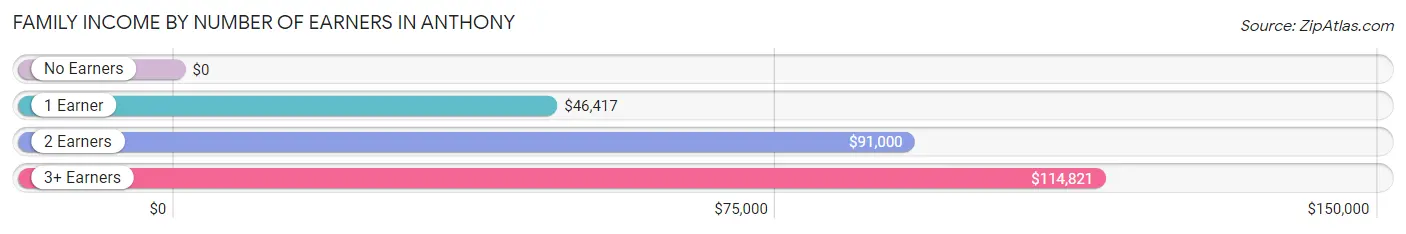
| Number of Earners | # Families | Median Income |
| No Earners | 69 (13.9%) | $0 |
| 1 Earner | 227 (45.9%) | $46,417 |
| 2 Earners | 186 (37.6%) | $91,000 |
| 3+ Earners | 13 (2.6%) | $114,821 |
| Total | 495 (100.0%) | $58,640 |
Household Income in Anthony
Household Income Brackets in Anthony
With 239 households falling in the category, the $50,000 to $74,999 income range is the most frequent in Anthony, accounting for 29.8% of all households. In contrast, only 23 households (2.9%) fall into the $200,000+ income bracket, making it the least populous group.
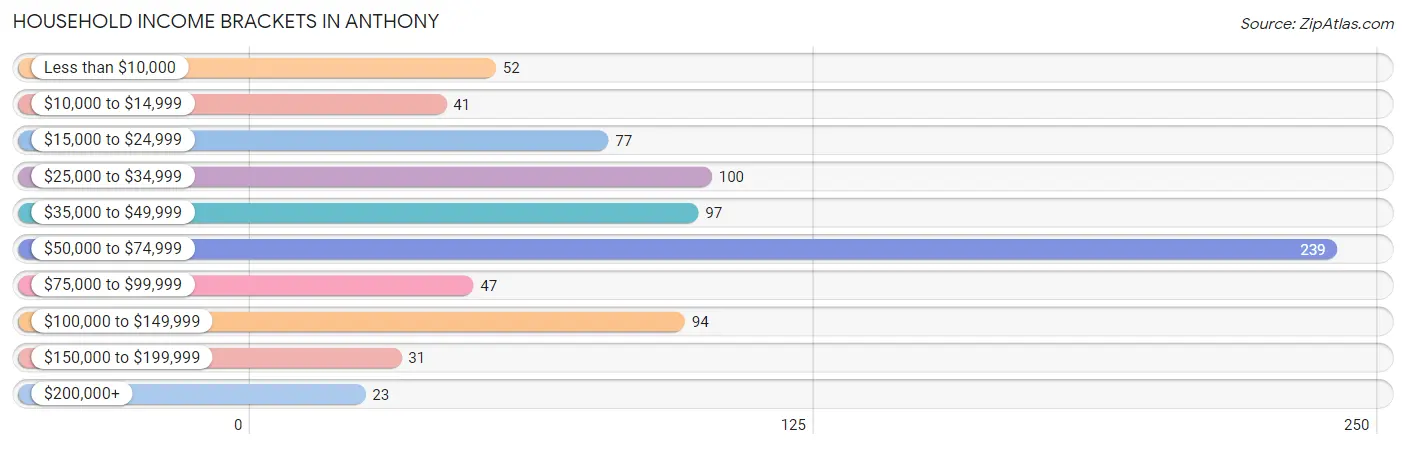
| Income Bracket | # Households | % Households |
| Less than $10,000 | 52 | 6.5% |
| $10,000 to $14,999 | 41 | 5.1% |
| $15,000 to $24,999 | 77 | 9.6% |
| $25,000 to $34,999 | 100 | 12.5% |
| $35,000 to $49,999 | 97 | 12.1% |
| $50,000 to $74,999 | 239 | 29.8% |
| $75,000 to $99,999 | 47 | 5.9% |
| $100,000 to $149,999 | 94 | 11.7% |
| $150,000 to $199,999 | 31 | 3.9% |
| $200,000+ | 23 | 2.9% |
Household Income by Householder Age in Anthony
The median household income in Anthony is $51,117, with the highest median household income of $69,167 found in the 25 to 44 years age bracket for the primary householder. A total of 222 households (27.7%) fall into this category. Meanwhile, the 15 to 24 years age bracket for the primary householder has the lowest median household income of $0, with 72 households (9.0%) in this group.
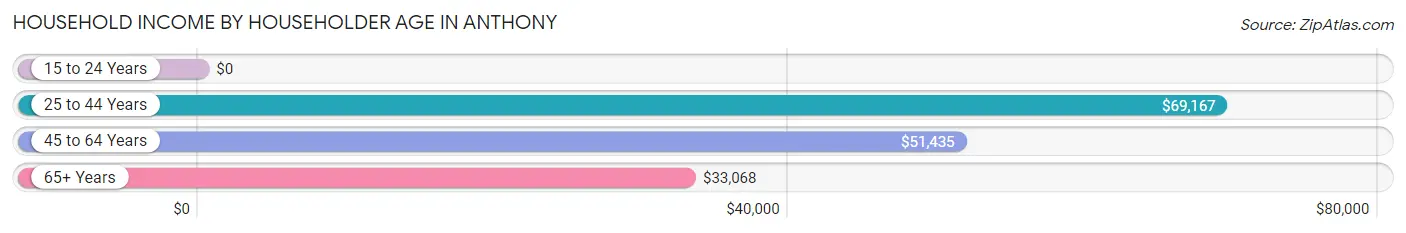
| Income Bracket | # Households | Median Income |
| 15 to 24 Years | 72 (9.0%) | $0 |
| 25 to 44 Years | 222 (27.7%) | $69,167 |
| 45 to 64 Years | 258 (32.2%) | $51,435 |
| 65+ Years | 249 (31.1%) | $33,068 |
| Total | 801 (100.0%) | $51,117 |
Poverty in Anthony
Income Below Poverty by Sex and Age in Anthony
With 10.1% poverty level for males and 15.2% for females among the residents of Anthony, 25 to 34 year old males and 55 to 64 year old females are the most vulnerable to poverty, with 12 males (33.3%) and 49 females (31.0%) in their respective age groups living below the poverty level.
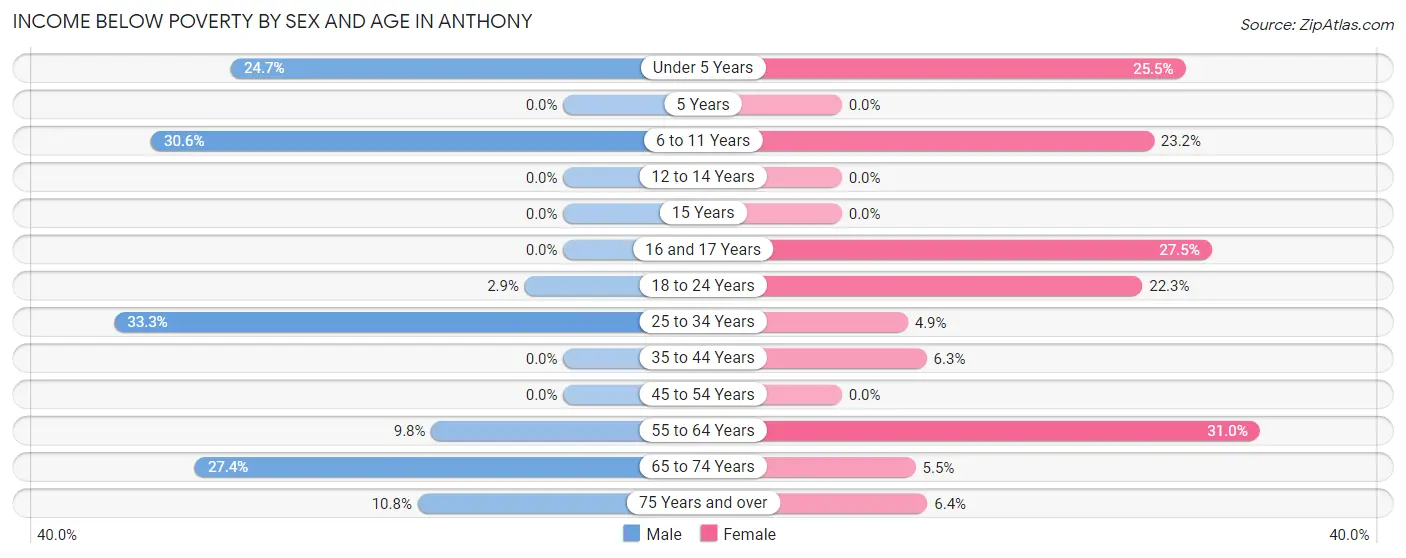
| Age Bracket | Male | Female |
| Under 5 Years | 18 (24.7%) | 38 (25.5%) |
| 5 Years | 0 (0.0%) | 0 (0.0%) |
| 6 to 11 Years | 15 (30.6%) | 38 (23.2%) |
| 12 to 14 Years | 0 (0.0%) | 0 (0.0%) |
| 15 Years | 0 (0.0%) | 0 (0.0%) |
| 16 and 17 Years | 0 (0.0%) | 14 (27.5%) |
| 18 to 24 Years | 3 (2.9%) | 27 (22.3%) |
| 25 to 34 Years | 12 (33.3%) | 5 (4.9%) |
| 35 to 44 Years | 0 (0.0%) | 8 (6.3%) |
| 45 to 54 Years | 0 (0.0%) | 0 (0.0%) |
| 55 to 64 Years | 10 (9.8%) | 49 (31.0%) |
| 65 to 74 Years | 32 (27.4%) | 8 (5.5%) |
| 75 Years and over | 4 (10.8%) | 4 (6.4%) |
| Total | 94 (10.1%) | 191 (15.2%) |
Income Above Poverty by Sex and Age in Anthony
According to the poverty statistics in Anthony, males aged 12 to 14 years and females aged 5 years are the age groups that are most secure financially, with 100.0% of males and 100.0% of females in these age groups living above the poverty line.
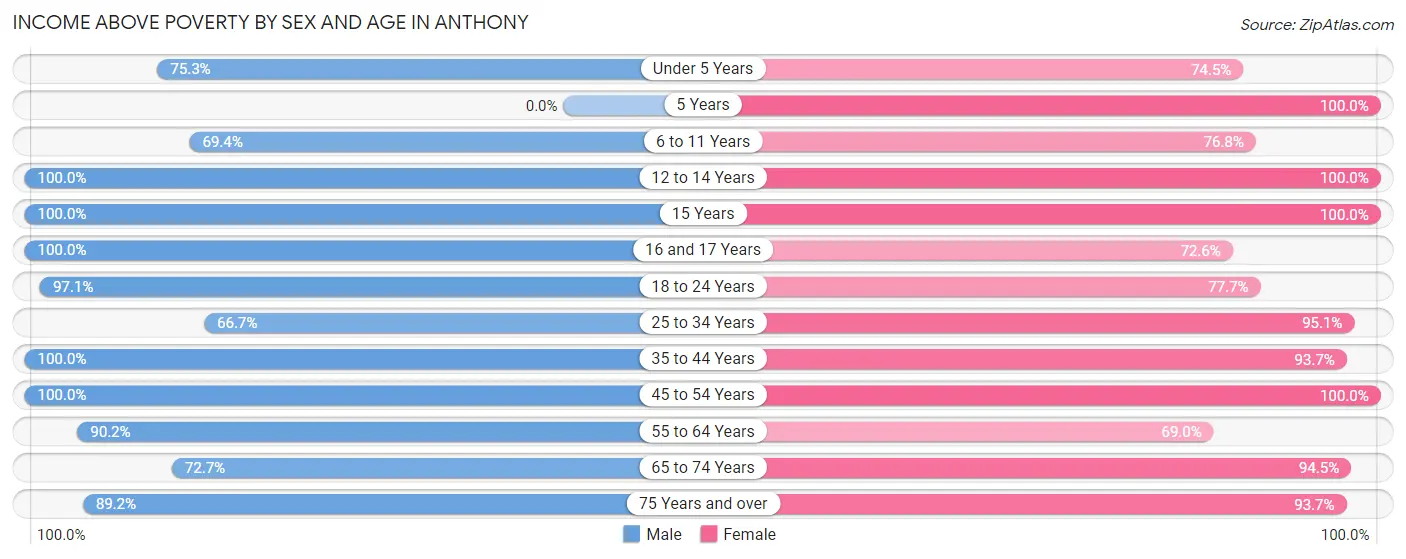
| Age Bracket | Male | Female |
| Under 5 Years | 55 (75.3%) | 111 (74.5%) |
| 5 Years | 0 (0.0%) | 11 (100.0%) |
| 6 to 11 Years | 34 (69.4%) | 126 (76.8%) |
| 12 to 14 Years | 67 (100.0%) | 39 (100.0%) |
| 15 Years | 15 (100.0%) | 34 (100.0%) |
| 16 and 17 Years | 39 (100.0%) | 37 (72.6%) |
| 18 to 24 Years | 102 (97.1%) | 94 (77.7%) |
| 25 to 34 Years | 24 (66.7%) | 97 (95.1%) |
| 35 to 44 Years | 138 (100.0%) | 119 (93.7%) |
| 45 to 54 Years | 152 (100.0%) | 89 (100.0%) |
| 55 to 64 Years | 92 (90.2%) | 109 (69.0%) |
| 65 to 74 Years | 85 (72.7%) | 138 (94.5%) |
| 75 Years and over | 33 (89.2%) | 59 (93.6%) |
| Total | 836 (89.9%) | 1,063 (84.8%) |
Income Below Poverty Among Married-Couple Families in Anthony
The poverty statistics for married-couple families in Anthony show that 3.1% or 10 of the total 318 families live below the poverty line. Families with 3 or 4 children have the highest poverty rate of 5.7%, comprising of 3 families. On the other hand, families with no children have the lowest poverty rate of 0.0%, which includes 0 families.
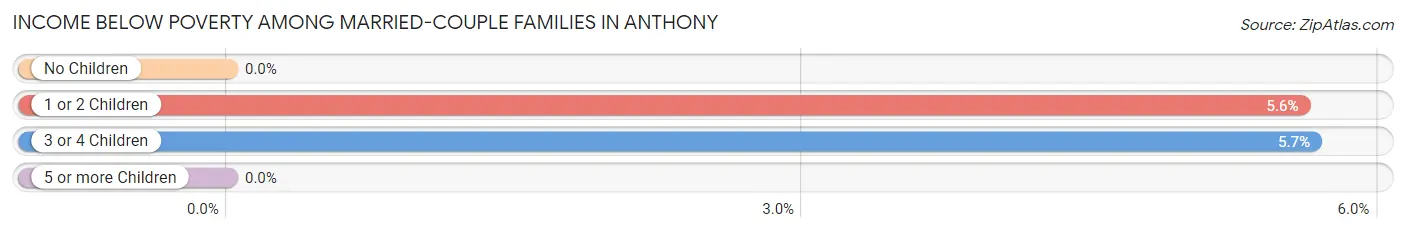
| Children | Above Poverty | Below Poverty |
| No Children | 140 (100.0%) | 0 (0.0%) |
| 1 or 2 Children | 118 (94.4%) | 7 (5.6%) |
| 3 or 4 Children | 50 (94.3%) | 3 (5.7%) |
| 5 or more Children | 0 (0.0%) | 0 (0.0%) |
| Total | 308 (96.9%) | 10 (3.1%) |
Income Below Poverty Among Single-Parent Households in Anthony
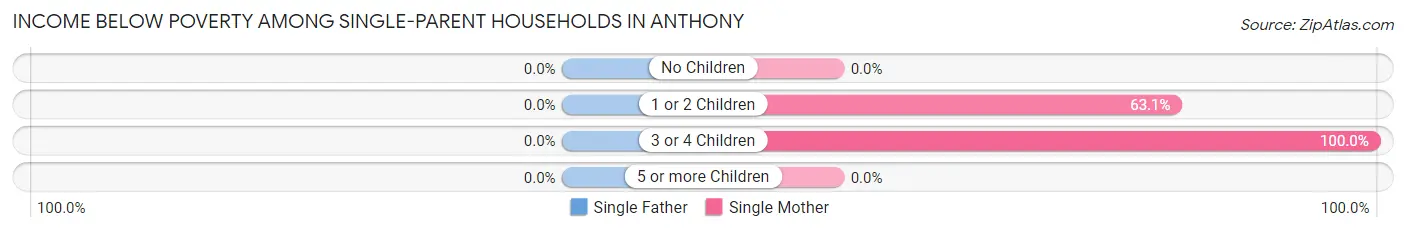
| Children | Single Father | Single Mother |
| No Children | 0 (0.0%) | 0 (0.0%) |
| 1 or 2 Children | 0 (0.0%) | 41 (63.1%) |
| 3 or 4 Children | 0 (0.0%) | 8 (100.0%) |
| 5 or more Children | 0 (0.0%) | 0 (0.0%) |
| Total | 0 (0.0%) | 49 (42.2%) |
Income Below Poverty Among Married-Couple vs Single-Parent Households in Anthony
The poverty data for Anthony shows that 10 of the married-couple family households (3.1%) and 49 of the single-parent households (27.7%) are living below the poverty level. Within the married-couple family households, those with 3 or 4 children have the highest poverty rate, with 3 households (5.7%) falling below the poverty line. Among the single-parent households, those with 3 or 4 children have the highest poverty rate, with 8 household (100.0%) living below poverty.
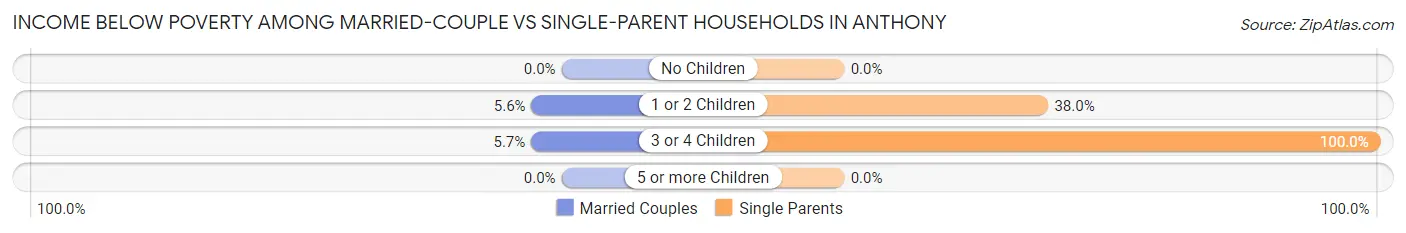
| Children | Married-Couple Families | Single-Parent Households |
| No Children | 0 (0.0%) | 0 (0.0%) |
| 1 or 2 Children | 7 (5.6%) | 41 (38.0%) |
| 3 or 4 Children | 3 (5.7%) | 8 (100.0%) |
| 5 or more Children | 0 (0.0%) | 0 (0.0%) |
| Total | 10 (3.1%) | 49 (27.7%) |
Race in Anthony
The most populous races in Anthony are White / Caucasian (2,128 | 92.9%), Hispanic or Latino (117 | 5.1%), and Two or more Races (69 | 3.0%).
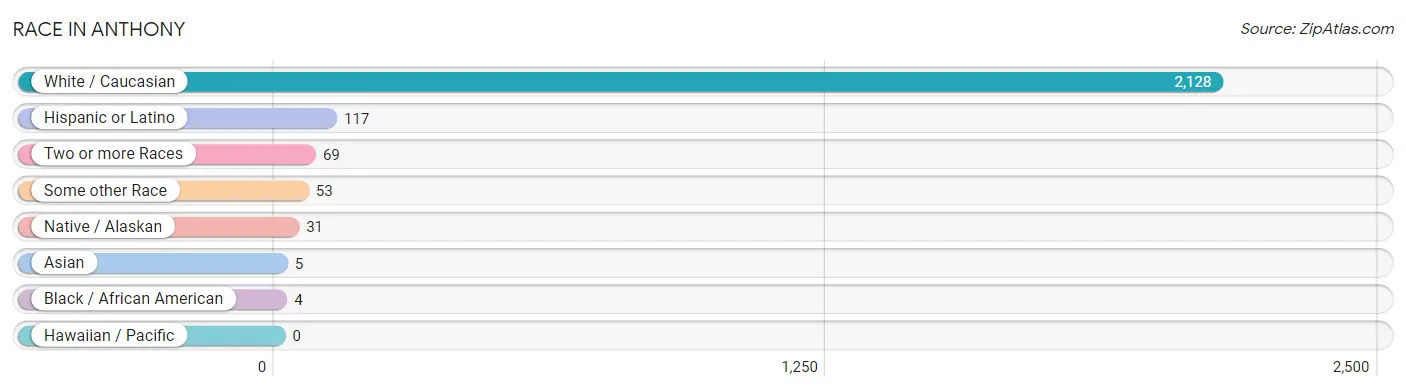
| Race | # Population | % Population |
| Asian | 5 | 0.2% |
| Black / African American | 4 | 0.2% |
| Hawaiian / Pacific | 0 | 0.0% |
| Hispanic or Latino | 117 | 5.1% |
| Native / Alaskan | 31 | 1.3% |
| White / Caucasian | 2,128 | 92.9% |
| Two or more Races | 69 | 3.0% |
| Some other Race | 53 | 2.3% |
| Total | 2,290 | 100.0% |
Ancestry in Anthony
The most populous ancestries reported in Anthony are German (547 | 23.9%), Irish (246 | 10.7%), English (218 | 9.5%), American (133 | 5.8%), and Mexican (112 | 4.9%), together accounting for 54.8% of all Anthony residents.
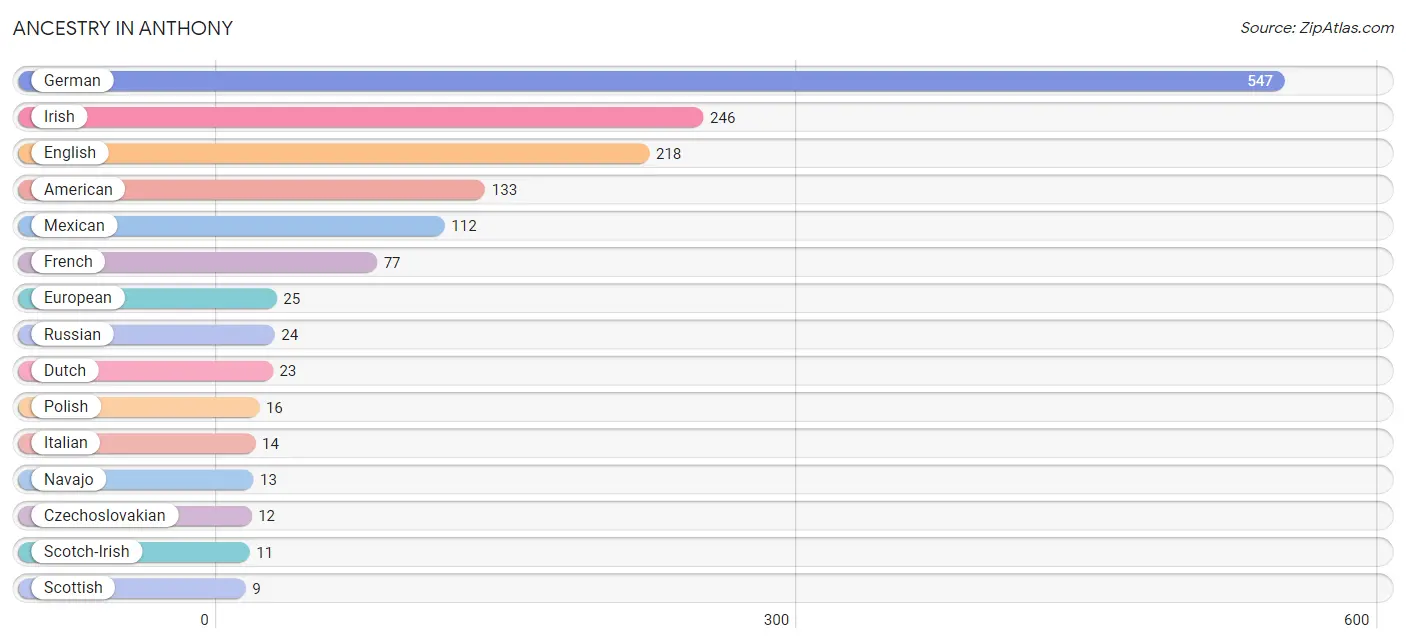
| Ancestry | # Population | % Population |
| American | 133 | 5.8% |
| Apache | 5 | 0.2% |
| British | 2 | 0.1% |
| Cherokee | 5 | 0.2% |
| Chickasaw | 3 | 0.1% |
| Creek | 5 | 0.2% |
| Czech | 5 | 0.2% |
| Czechoslovakian | 12 | 0.5% |
| Dutch | 23 | 1.0% |
| English | 218 | 9.5% |
| European | 25 | 1.1% |
| French | 77 | 3.4% |
| German | 547 | 23.9% |
| Irish | 246 | 10.7% |
| Italian | 14 | 0.6% |
| Kiowa | 1 | 0.0% |
| Korean | 5 | 0.2% |
| Lumbee | 8 | 0.4% |
| Mexican | 112 | 4.9% |
| Mexican American Indian | 6 | 0.3% |
| Navajo | 13 | 0.6% |
| Norwegian | 5 | 0.2% |
| Pennsylvania German | 4 | 0.2% |
| Polish | 16 | 0.7% |
| Potawatomi | 3 | 0.1% |
| Russian | 24 | 1.1% |
| Scotch-Irish | 11 | 0.5% |
| Scottish | 9 | 0.4% |
| Seminole | 5 | 0.2% |
| Swedish | 4 | 0.2% |
| Swiss | 4 | 0.2% |
| Welsh | 8 | 0.4% | View All 32 Rows |
Immigrants in Anthony
The most numerous immigrant groups reported in Anthony came from Europe (21 | 0.9%), Northern Europe (21 | 0.9%), Asia (5 | 0.2%), Philippines (5 | 0.2%), and South Eastern Asia (5 | 0.2%), together accounting for 2.5% of all Anthony residents.
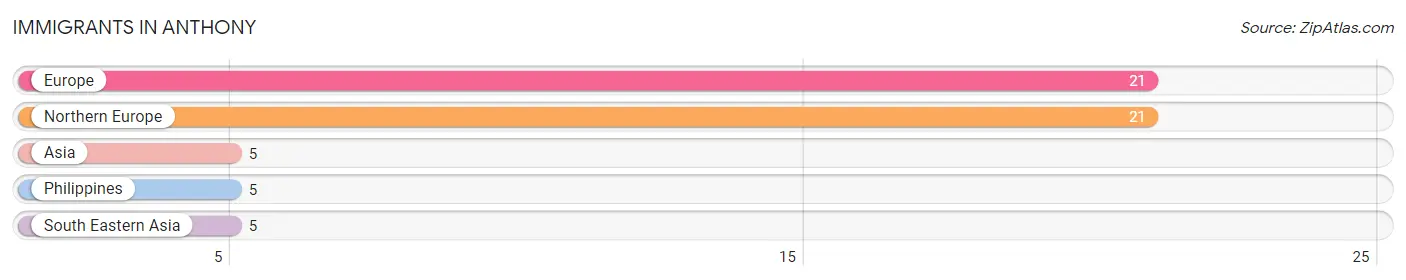
| Immigration Origin | # Population | % Population |
| Asia | 5 | 0.2% |
| Europe | 21 | 0.9% |
| Northern Europe | 21 | 0.9% |
| Philippines | 5 | 0.2% |
| South Eastern Asia | 5 | 0.2% | View All 5 Rows |
Sex and Age in Anthony
Sex and Age in Anthony
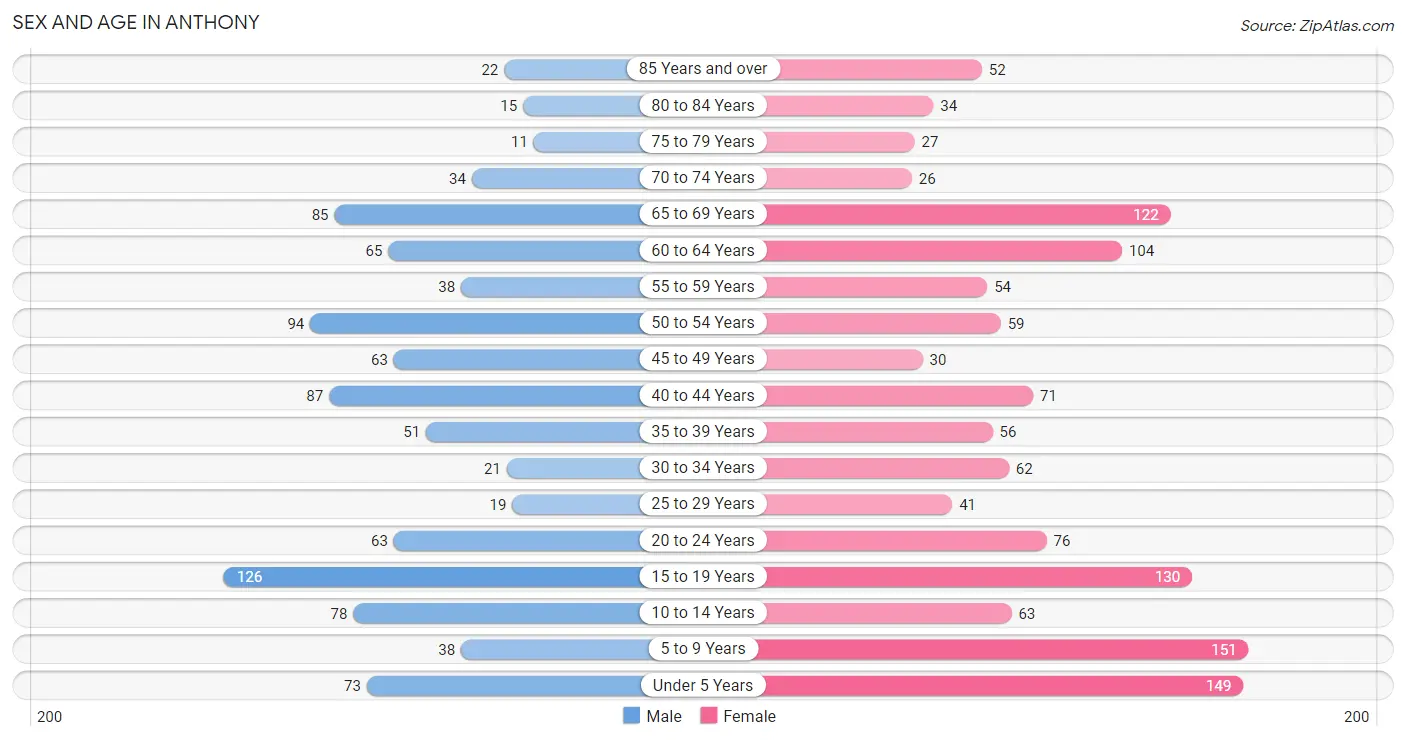
The most populous age groups in Anthony are 15 to 19 Years (126 | 12.8%) for men and 5 to 9 Years (151 | 11.6%) for women.
| Age Bracket | Male | Female |
| Under 5 Years | 73 (7.4%) | 149 (11.4%) |
| 5 to 9 Years | 38 (3.9%) | 151 (11.6%) |
| 10 to 14 Years | 78 (7.9%) | 63 (4.8%) |
| 15 to 19 Years | 126 (12.8%) | 130 (10.0%) |
| 20 to 24 Years | 63 (6.4%) | 76 (5.8%) |
| 25 to 29 Years | 19 (1.9%) | 41 (3.1%) |
| 30 to 34 Years | 21 (2.1%) | 62 (4.7%) |
| 35 to 39 Years | 51 (5.2%) | 56 (4.3%) |
| 40 to 44 Years | 87 (8.8%) | 71 (5.4%) |
| 45 to 49 Years | 63 (6.4%) | 30 (2.3%) |
| 50 to 54 Years | 94 (9.6%) | 59 (4.5%) |
| 55 to 59 Years | 38 (3.9%) | 54 (4.1%) |
| 60 to 64 Years | 65 (6.6%) | 104 (8.0%) |
| 65 to 69 Years | 85 (8.6%) | 122 (9.3%) |
| 70 to 74 Years | 34 (3.5%) | 26 (2.0%) |
| 75 to 79 Years | 11 (1.1%) | 27 (2.1%) |
| 80 to 84 Years | 15 (1.5%) | 34 (2.6%) |
| 85 Years and over | 22 (2.2%) | 52 (4.0%) |
| Total | 983 (100.0%) | 1,307 (100.0%) |
Families and Households in Anthony
Median Family Size in Anthony
The median family size in Anthony is 3.61 persons per family, with married-couple families (318 | 64.2%) accounting for the largest median family size of 3.89 persons per family. On the other hand, single female/mother families (116 | 23.4%) represent the smallest median family size with 2.87 persons per family.
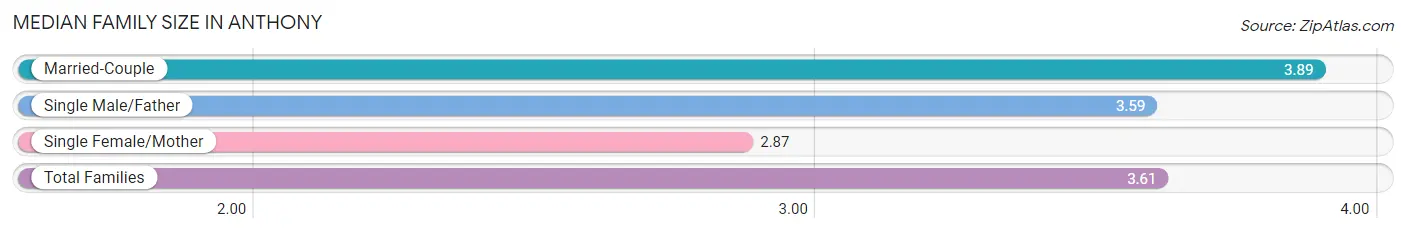
| Family Type | # Families | Family Size |
| Married-Couple | 318 (64.2%) | 3.89 |
| Single Male/Father | 61 (12.3%) | 3.59 |
| Single Female/Mother | 116 (23.4%) | 2.87 |
| Total Families | 495 (100.0%) | 3.61 |
Median Household Size in Anthony
The median household size in Anthony is 2.73 persons per household, with single male/father households (61 | 7.6%) accounting for the largest median household size of 4.23 persons per household. non-family households (306 | 38.2%) represent the smallest median household size with 1.16 persons per household.
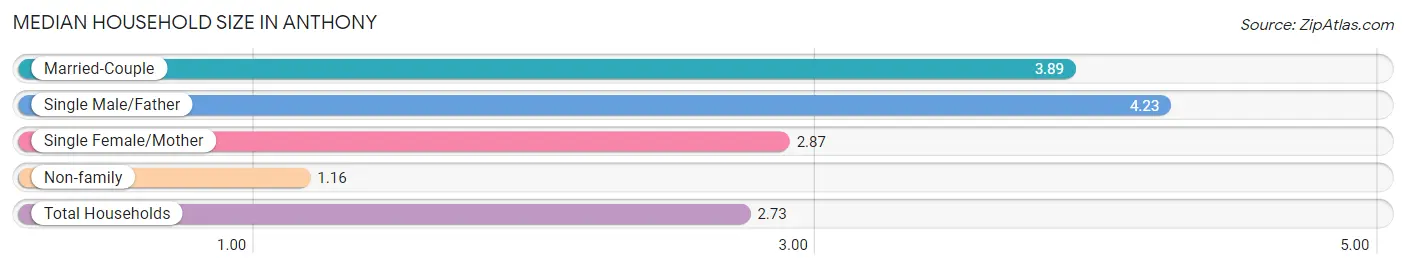
| Household Type | # Households | Household Size |
| Married-Couple | 318 (39.7%) | 3.89 |
| Single Male/Father | 61 (7.6%) | 4.23 |
| Single Female/Mother | 116 (14.5%) | 2.87 |
| Non-family | 306 (38.2%) | 1.16 |
| Total Households | 801 (100.0%) | 2.73 |
Household Size by Marriage Status in Anthony
Out of a total of 801 households in Anthony, 495 (61.8%) are family households, while 306 (38.2%) are nonfamily households. The most numerous type of family households are 2-person households, comprising 226, and the most common type of nonfamily households are 1-person households, comprising 262.
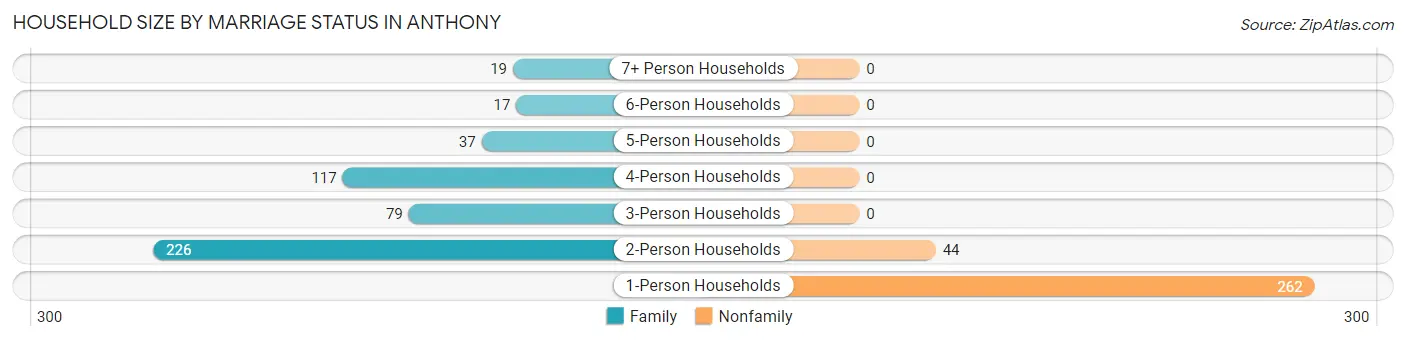
| Household Size | Family Households | Nonfamily Households |
| 1-Person Households | - | 262 (32.7%) |
| 2-Person Households | 226 (28.2%) | 44 (5.5%) |
| 3-Person Households | 79 (9.9%) | 0 (0.0%) |
| 4-Person Households | 117 (14.6%) | 0 (0.0%) |
| 5-Person Households | 37 (4.6%) | 0 (0.0%) |
| 6-Person Households | 17 (2.1%) | 0 (0.0%) |
| 7+ Person Households | 19 (2.4%) | 0 (0.0%) |
| Total | 495 (61.8%) | 306 (38.2%) |
Female Fertility in Anthony
Fertility by Age in Anthony
Average fertility rate in Anthony is 146.0 births per 1,000 women. Women in the age bracket of 20 to 34 years have the highest fertility rate with 212.0 births per 1,000 women. Women in the age bracket of 20 to 34 years acount for 52.8% of all women with births.
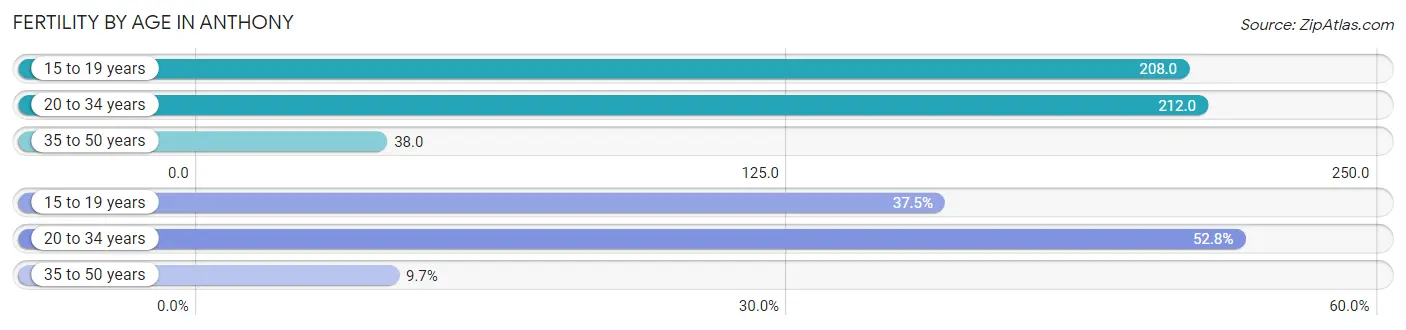
| Age Bracket | Women with Births | Births / 1,000 Women |
| 15 to 19 years | 27 (37.5%) | 208.0 |
| 20 to 34 years | 38 (52.8%) | 212.0 |
| 35 to 50 years | 7 (9.7%) | 38.0 |
| Total | 72 (100.0%) | 146.0 |
Fertility by Age by Marriage Status in Anthony
37.5% of women with births (72) in Anthony are married. The highest percentage of unmarried women with births falls into 15 to 19 years age bracket with 100.0% of them unmarried at the time of birth, while the lowest percentage of unmarried women with births belong to 35 to 50 years age bracket with 0.0% of them unmarried.
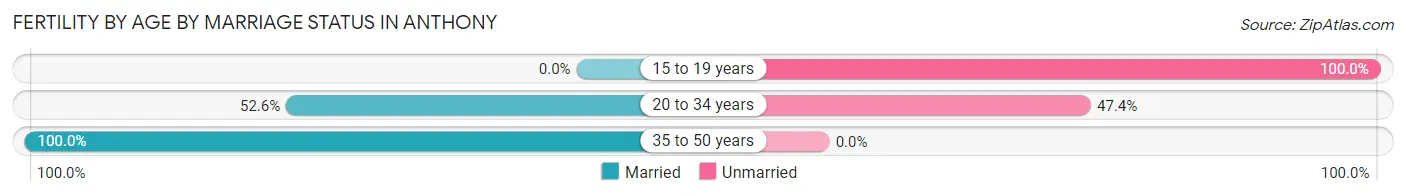
| Age Bracket | Married | Unmarried |
| 15 to 19 years | 0 (0.0%) | 27 (100.0%) |
| 20 to 34 years | 20 (52.6%) | 18 (47.4%) |
| 35 to 50 years | 7 (100.0%) | 0 (0.0%) |
| Total | 27 (37.5%) | 45 (62.5%) |
Fertility by Education in Anthony
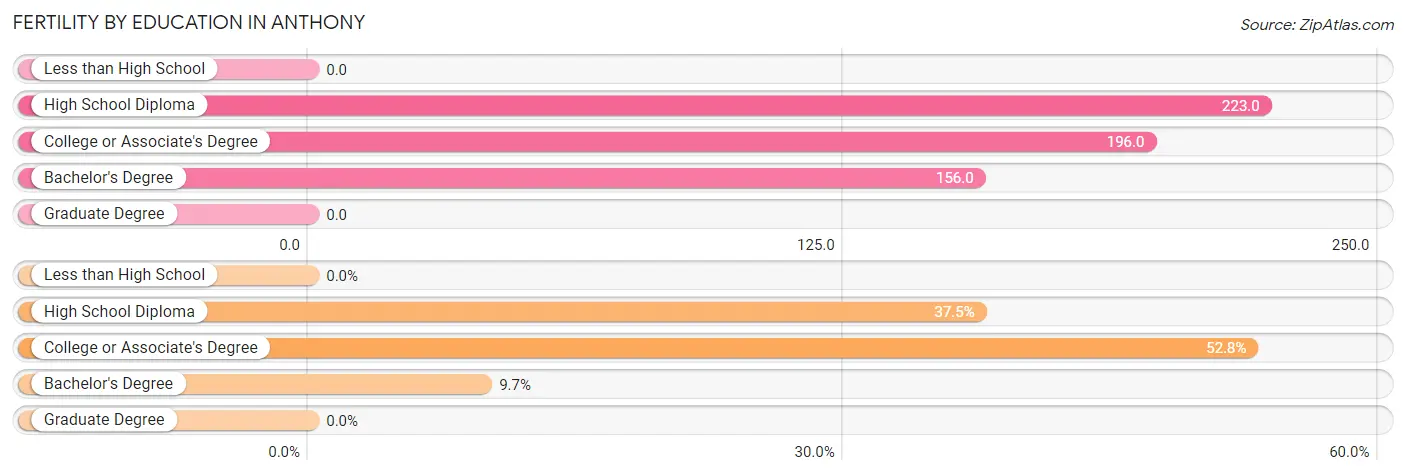
| Educational Attainment | Women with Births | Births / 1,000 Women |
| Less than High School | 0 (0.0%) | 0.0 |
| High School Diploma | 27 (37.5%) | 223.0 |
| College or Associate's Degree | 38 (52.8%) | 196.0 |
| Bachelor's Degree | 7 (9.7%) | 156.0 |
| Graduate Degree | 0 (0.0%) | 0.0 |
| Total | 72 (100.0%) | 146.0 |
Fertility by Education by Marriage Status in Anthony
62.5% of women with births in Anthony are unmarried. Women with the educational attainment of bachelor's degree are most likely to be married with 100.0% of them married at childbirth, while women with the educational attainment of high school diploma are least likely to be married with 100.0% of them unmarried at childbirth.
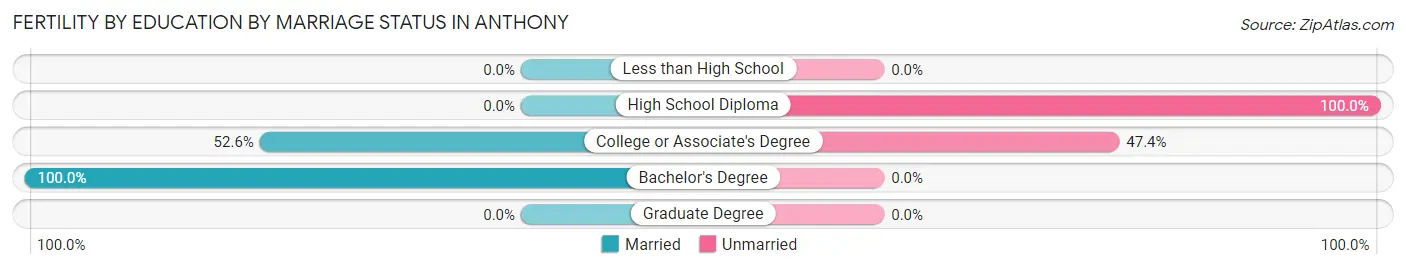
| Educational Attainment | Married | Unmarried |
| Less than High School | 0 (0.0%) | 0 (0.0%) |
| High School Diploma | 0 (0.0%) | 27 (100.0%) |
| College or Associate's Degree | 20 (52.6%) | 18 (47.4%) |
| Bachelor's Degree | 7 (100.0%) | 0 (0.0%) |
| Graduate Degree | 0 (0.0%) | 0 (0.0%) |
| Total | 27 (37.5%) | 45 (62.5%) |
Employment Characteristics in Anthony
Employment by Class of Employer in Anthony
Among the 863 employed individuals in Anthony, private company employees (375 | 43.4%), not-for-profit organizations (200 | 23.2%), and local government employees (126 | 14.6%) make up the most common classes of employment.
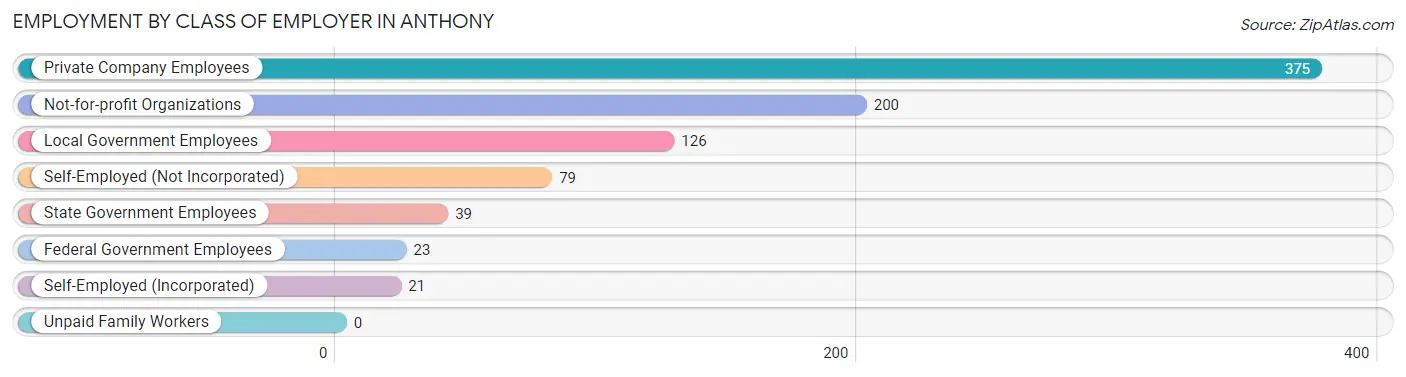
| Employer Class | # Employees | % Employees |
| Private Company Employees | 375 | 43.4% |
| Self-Employed (Incorporated) | 21 | 2.4% |
| Self-Employed (Not Incorporated) | 79 | 9.1% |
| Not-for-profit Organizations | 200 | 23.2% |
| Local Government Employees | 126 | 14.6% |
| State Government Employees | 39 | 4.5% |
| Federal Government Employees | 23 | 2.7% |
| Unpaid Family Workers | 0 | 0.0% |
| Total | 863 | 100.0% |
Employment Status by Age in Anthony
According to the labor force statistics for Anthony, out of the total population over 16 years of age (1,689), 56.4% or 953 individuals are in the labor force, with 9.3% or 89 of them unemployed. The age group with the highest labor force participation rate is 25 to 29 years, with 98.3% or 59 individuals in the labor force. Within the labor force, the 16 to 19 years age range has the highest percentage of unemployed individuals, with 51.6% or 66 of them being unemployed.
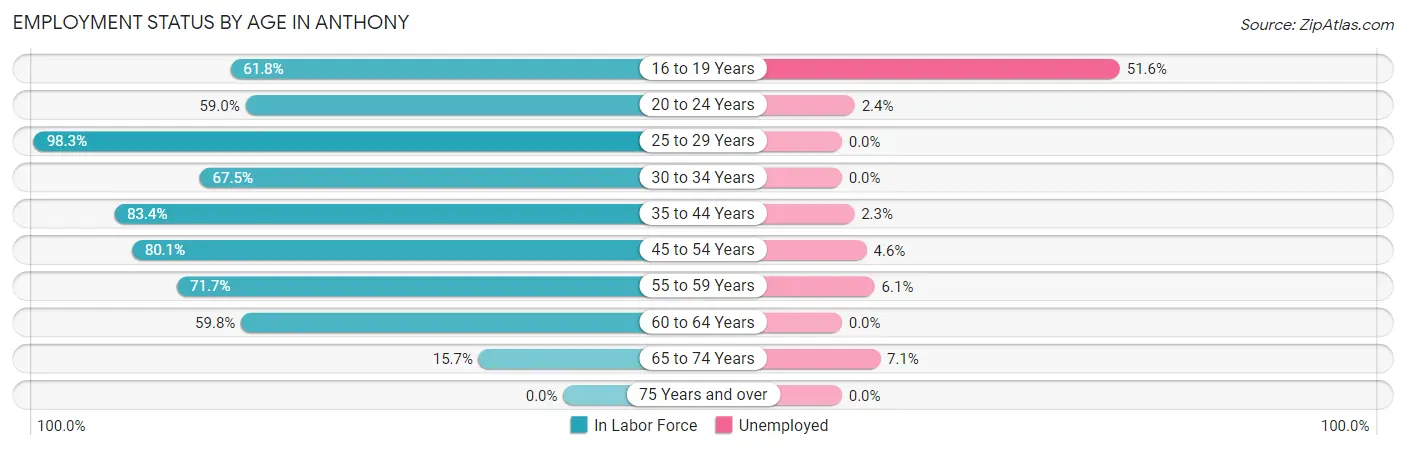
| Age Bracket | In Labor Force | Unemployed |
| 16 to 19 Years | 128 (61.8%) | 66 (51.6%) |
| 20 to 24 Years | 82 (59.0%) | 2 (2.4%) |
| 25 to 29 Years | 59 (98.3%) | 0 (0.0%) |
| 30 to 34 Years | 56 (67.5%) | 0 (0.0%) |
| 35 to 44 Years | 221 (83.4%) | 5 (2.3%) |
| 45 to 54 Years | 197 (80.1%) | 9 (4.6%) |
| 55 to 59 Years | 66 (71.7%) | 4 (6.1%) |
| 60 to 64 Years | 101 (59.8%) | 0 (0.0%) |
| 65 to 74 Years | 42 (15.7%) | 3 (7.1%) |
| 75 Years and over | 0 (0.0%) | 0 (0.0%) |
| Total | 953 (56.4%) | 89 (9.3%) |
Employment Status by Educational Attainment in Anthony
According to labor force statistics for Anthony, 76.5% of individuals (700) out of the total population between 25 and 64 years of age (915) are in the labor force, with 2.6% or 18 of them being unemployed. The group with the highest labor force participation rate are those with the educational attainment of bachelor's degree or higher, with 98.2% or 109 individuals in the labor force. Within the labor force, individuals with less than high school education have the highest percentage of unemployment, with 36.1% or 13 of them being unemployed.
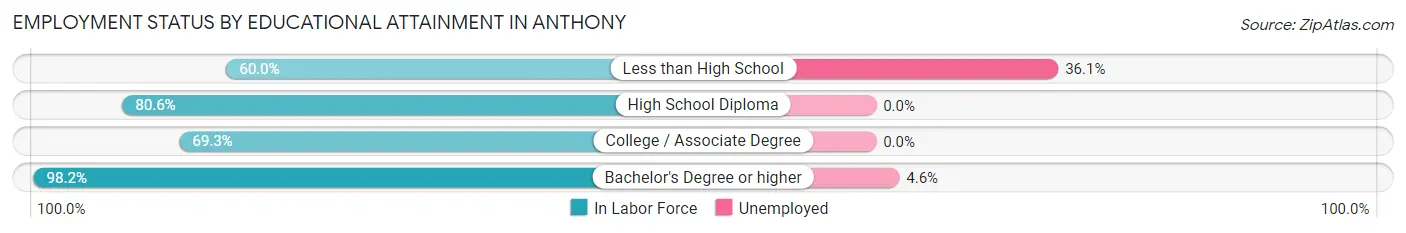
| Educational Attainment | In Labor Force | Unemployed |
| Less than High School | 36 (60.0%) | 22 (36.1%) |
| High School Diploma | 282 (80.6%) | 0 (0.0%) |
| College / Associate Degree | 273 (69.3%) | 0 (0.0%) |
| Bachelor's Degree or higher | 109 (98.2%) | 5 (4.6%) |
| Total | 700 (76.5%) | 24 (2.6%) |
Employment Occupations by Sex in Anthony
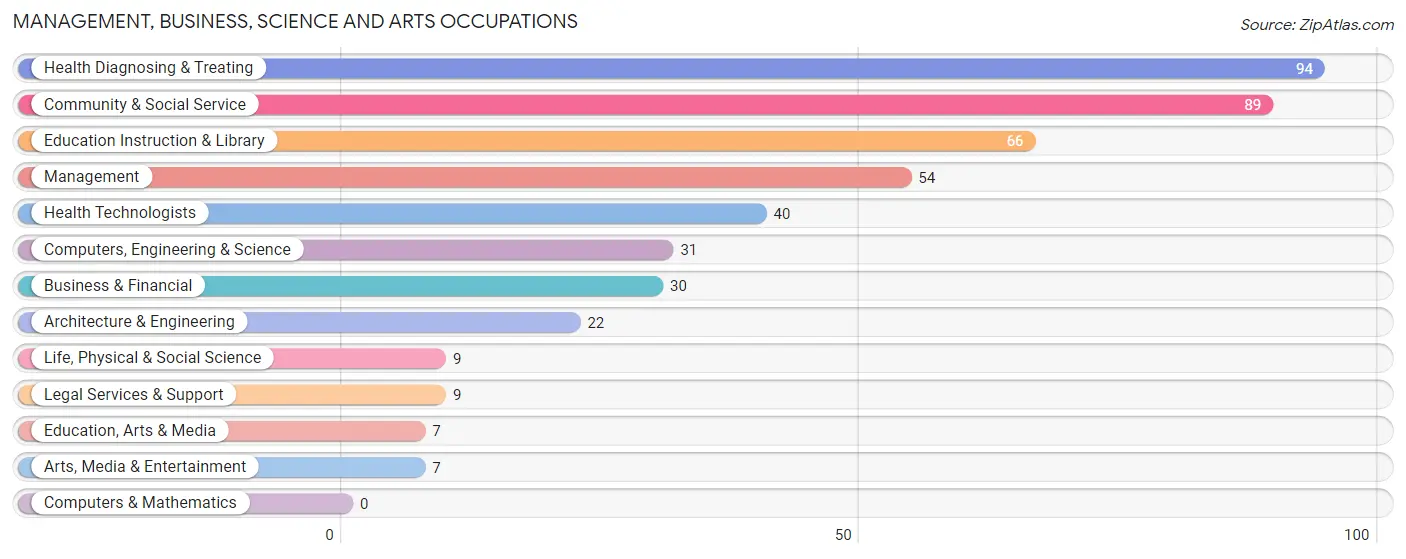
Management, Business, Science and Arts Occupations
The most common Management, Business, Science and Arts occupations in Anthony are Health Diagnosing & Treating (94 | 10.9%), Community & Social Service (89 | 10.3%), Education Instruction & Library (66 | 7.6%), Management (54 | 6.3%), and Health Technologists (40 | 4.6%).
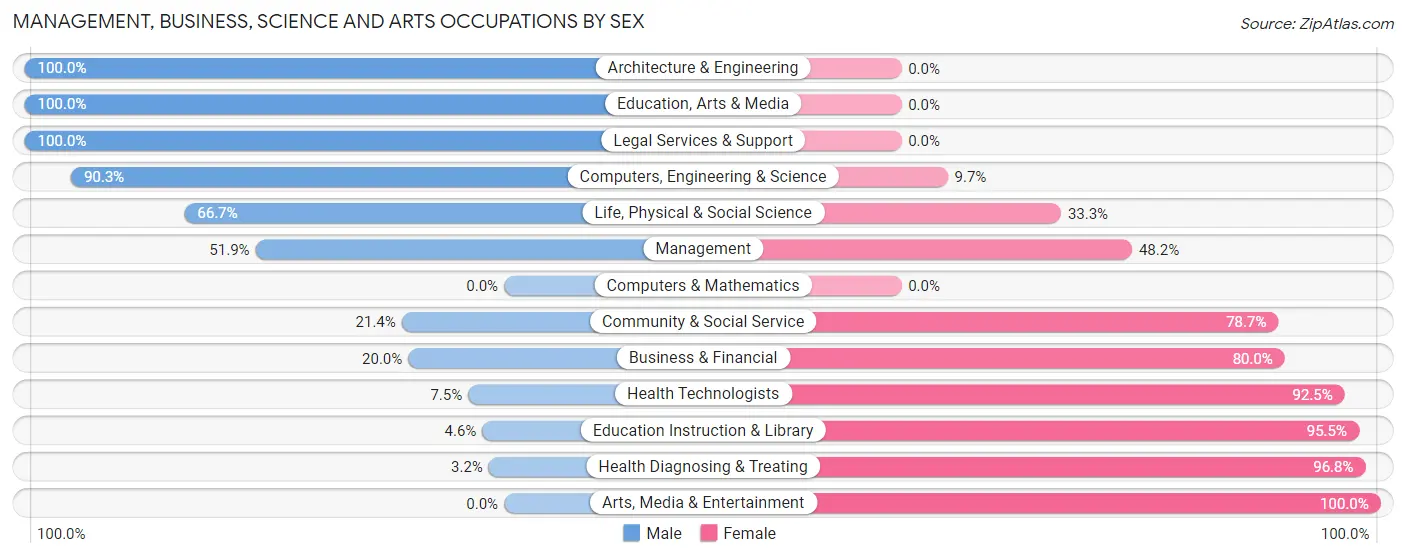
Management, Business, Science and Arts Occupations by Sex
Within the Management, Business, Science and Arts occupations in Anthony, the most male-oriented occupations are Architecture & Engineering (100.0%), Education, Arts & Media (100.0%), and Legal Services & Support (100.0%), while the most female-oriented occupations are Arts, Media & Entertainment (100.0%), Health Diagnosing & Treating (96.8%), and Education Instruction & Library (95.5%).
| Occupation | Male | Female |
| Management | 28 (51.8%) | 26 (48.1%) |
| Business & Financial | 6 (20.0%) | 24 (80.0%) |
| Computers, Engineering & Science | 28 (90.3%) | 3 (9.7%) |
| Computers & Mathematics | 0 (0.0%) | 0 (0.0%) |
| Architecture & Engineering | 22 (100.0%) | 0 (0.0%) |
| Life, Physical & Social Science | 6 (66.7%) | 3 (33.3%) |
| Community & Social Service | 19 (21.3%) | 70 (78.6%) |
| Education, Arts & Media | 7 (100.0%) | 0 (0.0%) |
| Legal Services & Support | 9 (100.0%) | 0 (0.0%) |
| Education Instruction & Library | 3 (4.5%) | 63 (95.5%) |
| Arts, Media & Entertainment | 0 (0.0%) | 7 (100.0%) |
| Health Diagnosing & Treating | 3 (3.2%) | 91 (96.8%) |
| Health Technologists | 3 (7.5%) | 37 (92.5%) |
| Total (Category) | 84 (28.2%) | 214 (71.8%) |
| Total (Overall) | 428 (49.6%) | 435 (50.4%) |
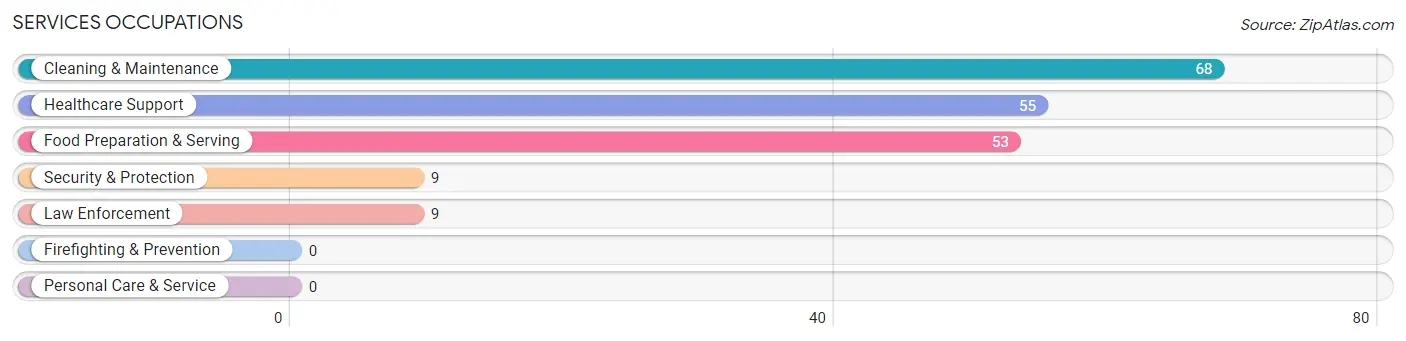
Services Occupations
The most common Services occupations in Anthony are Cleaning & Maintenance (68 | 7.9%), Healthcare Support (55 | 6.4%), Food Preparation & Serving (53 | 6.1%), Security & Protection (9 | 1.0%), and Law Enforcement (9 | 1.0%).
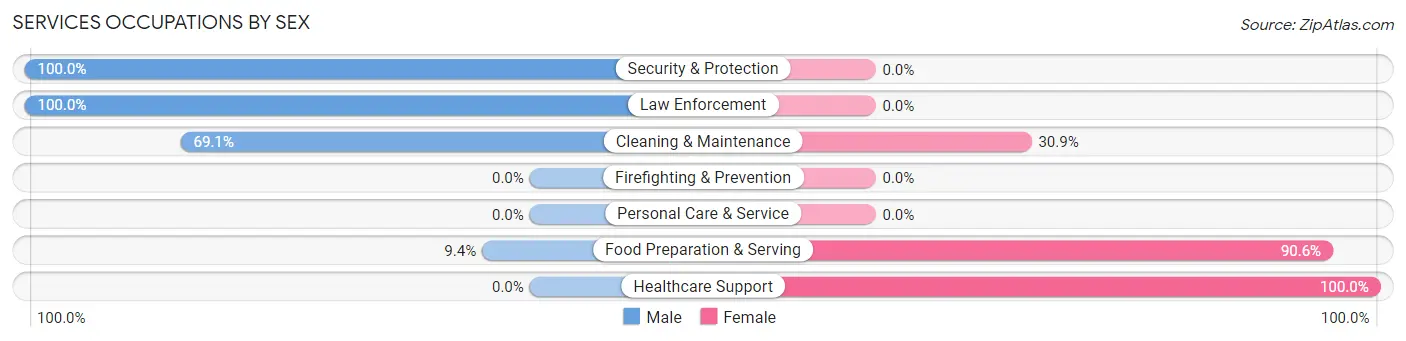
Services Occupations by Sex
Within the Services occupations in Anthony, the most male-oriented occupations are Security & Protection (100.0%), Law Enforcement (100.0%), and Cleaning & Maintenance (69.1%), while the most female-oriented occupations are Healthcare Support (100.0%), Food Preparation & Serving (90.6%), and Cleaning & Maintenance (30.9%).
| Occupation | Male | Female |
| Healthcare Support | 0 (0.0%) | 55 (100.0%) |
| Security & Protection | 9 (100.0%) | 0 (0.0%) |
| Firefighting & Prevention | 0 (0.0%) | 0 (0.0%) |
| Law Enforcement | 9 (100.0%) | 0 (0.0%) |
| Food Preparation & Serving | 5 (9.4%) | 48 (90.6%) |
| Cleaning & Maintenance | 47 (69.1%) | 21 (30.9%) |
| Personal Care & Service | 0 (0.0%) | 0 (0.0%) |
| Total (Category) | 61 (33.0%) | 124 (67.0%) |
| Total (Overall) | 428 (49.6%) | 435 (50.4%) |
Sales and Office Occupations
The most common Sales and Office occupations in Anthony are Office & Administration (62 | 7.2%), and Sales & Related (57 | 6.6%).
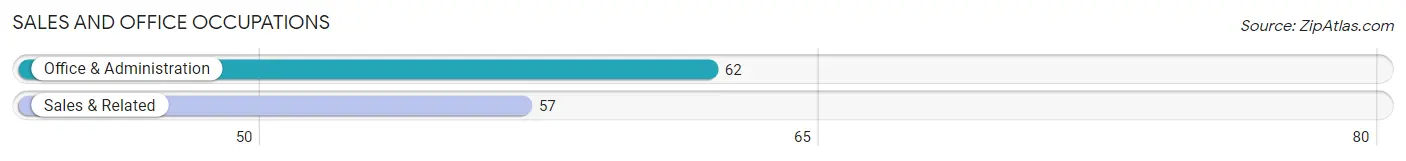
Sales and Office Occupations by Sex
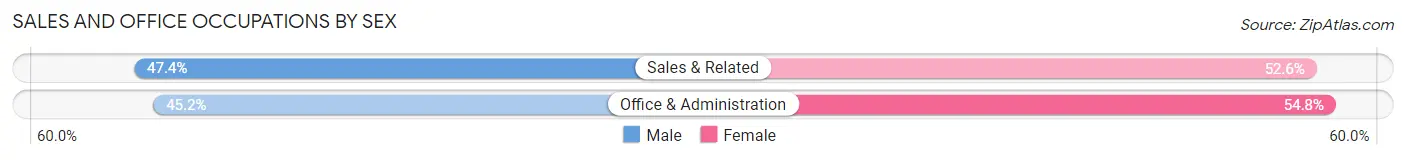
| Occupation | Male | Female |
| Sales & Related | 27 (47.4%) | 30 (52.6%) |
| Office & Administration | 28 (45.2%) | 34 (54.8%) |
| Total (Category) | 55 (46.2%) | 64 (53.8%) |
| Total (Overall) | 428 (49.6%) | 435 (50.4%) |
Natural Resources, Construction and Maintenance Occupations
The most common Natural Resources, Construction and Maintenance occupations in Anthony are Installation, Maintenance & Repair (106 | 12.3%), Construction & Extraction (26 | 3.0%), and Farming, Fishing & Forestry (9 | 1.0%).
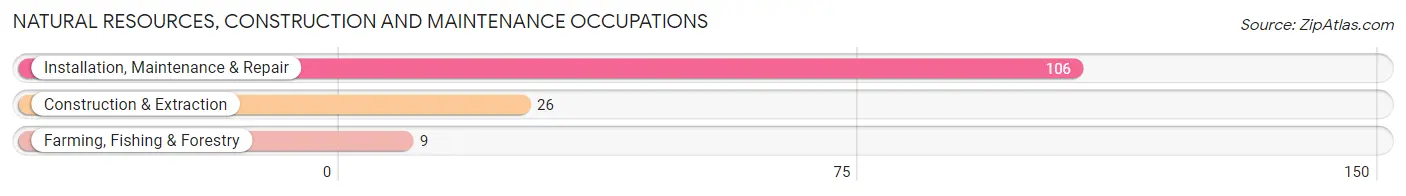
Natural Resources, Construction and Maintenance Occupations by Sex
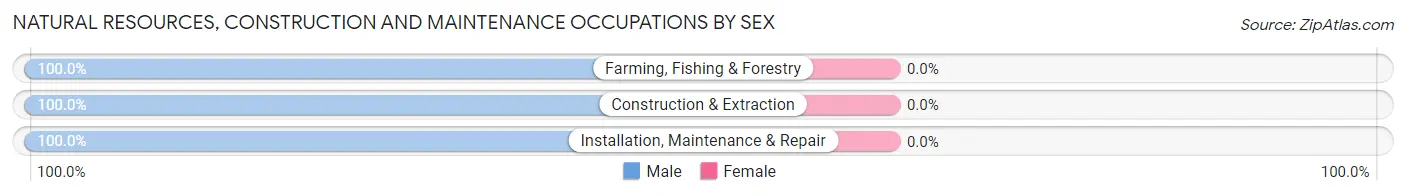
| Occupation | Male | Female |
| Farming, Fishing & Forestry | 9 (100.0%) | 0 (0.0%) |
| Construction & Extraction | 26 (100.0%) | 0 (0.0%) |
| Installation, Maintenance & Repair | 106 (100.0%) | 0 (0.0%) |
| Total (Category) | 141 (100.0%) | 0 (0.0%) |
| Total (Overall) | 428 (49.6%) | 435 (50.4%) |
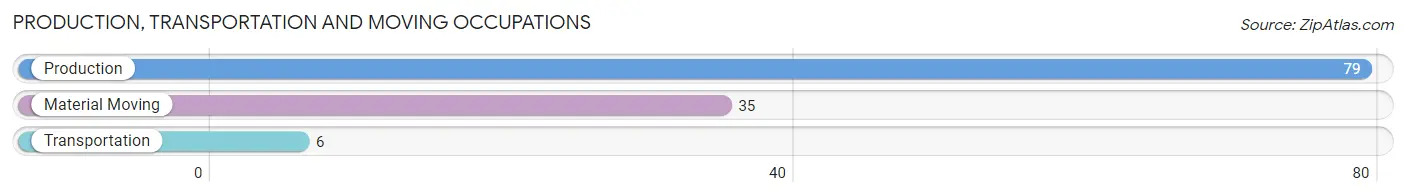
Production, Transportation and Moving Occupations
The most common Production, Transportation and Moving occupations in Anthony are Production (79 | 9.1%), Material Moving (35 | 4.1%), and Transportation (6 | 0.7%).
Production, Transportation and Moving Occupations by Sex
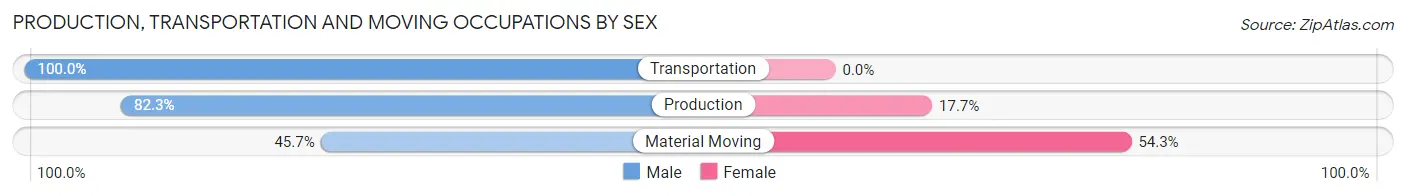
| Occupation | Male | Female |
| Production | 65 (82.3%) | 14 (17.7%) |
| Transportation | 6 (100.0%) | 0 (0.0%) |
| Material Moving | 16 (45.7%) | 19 (54.3%) |
| Total (Category) | 87 (72.5%) | 33 (27.5%) |
| Total (Overall) | 428 (49.6%) | 435 (50.4%) |
Employment Industries by Sex in Anthony
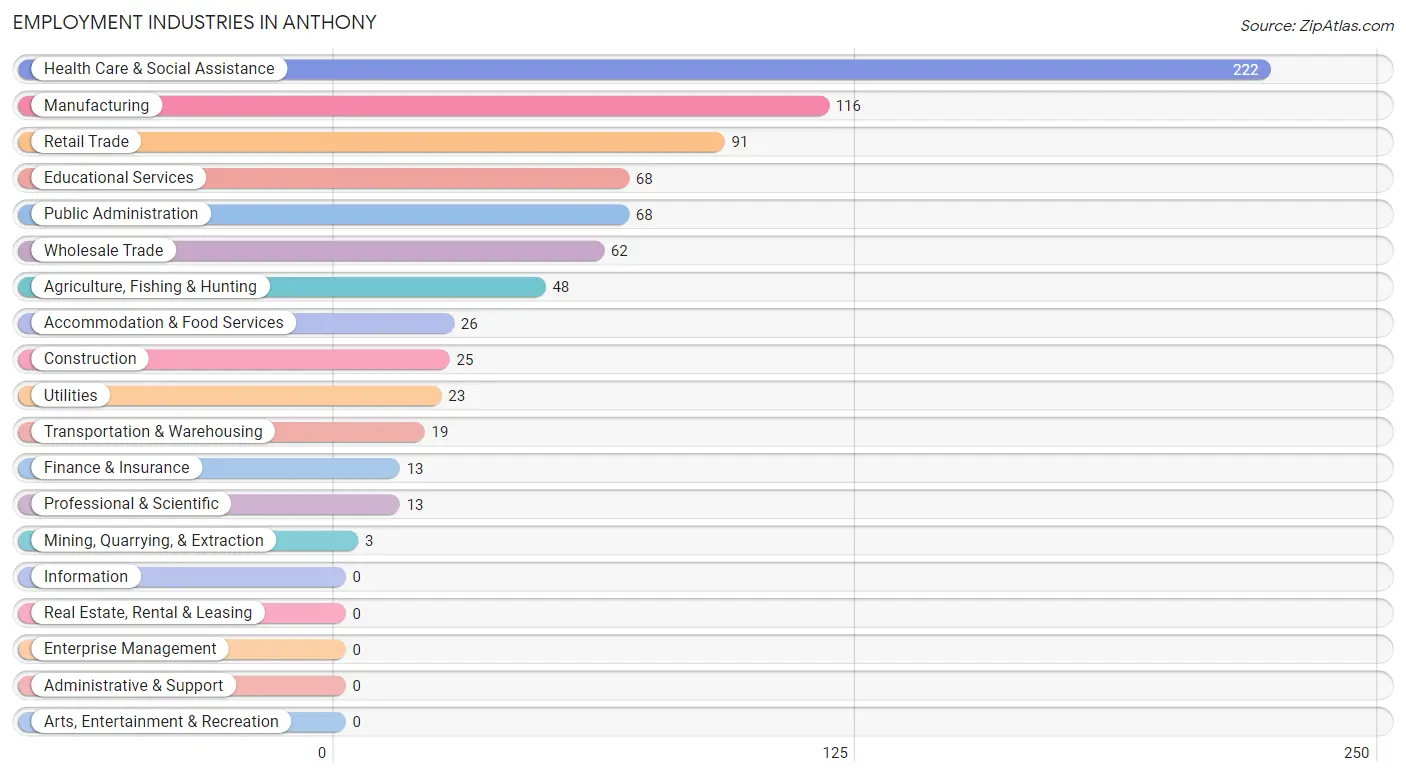
Employment Industries in Anthony
The major employment industries in Anthony include Health Care & Social Assistance (222 | 25.7%), Manufacturing (116 | 13.4%), Retail Trade (91 | 10.5%), Educational Services (68 | 7.9%), and Public Administration (68 | 7.9%).
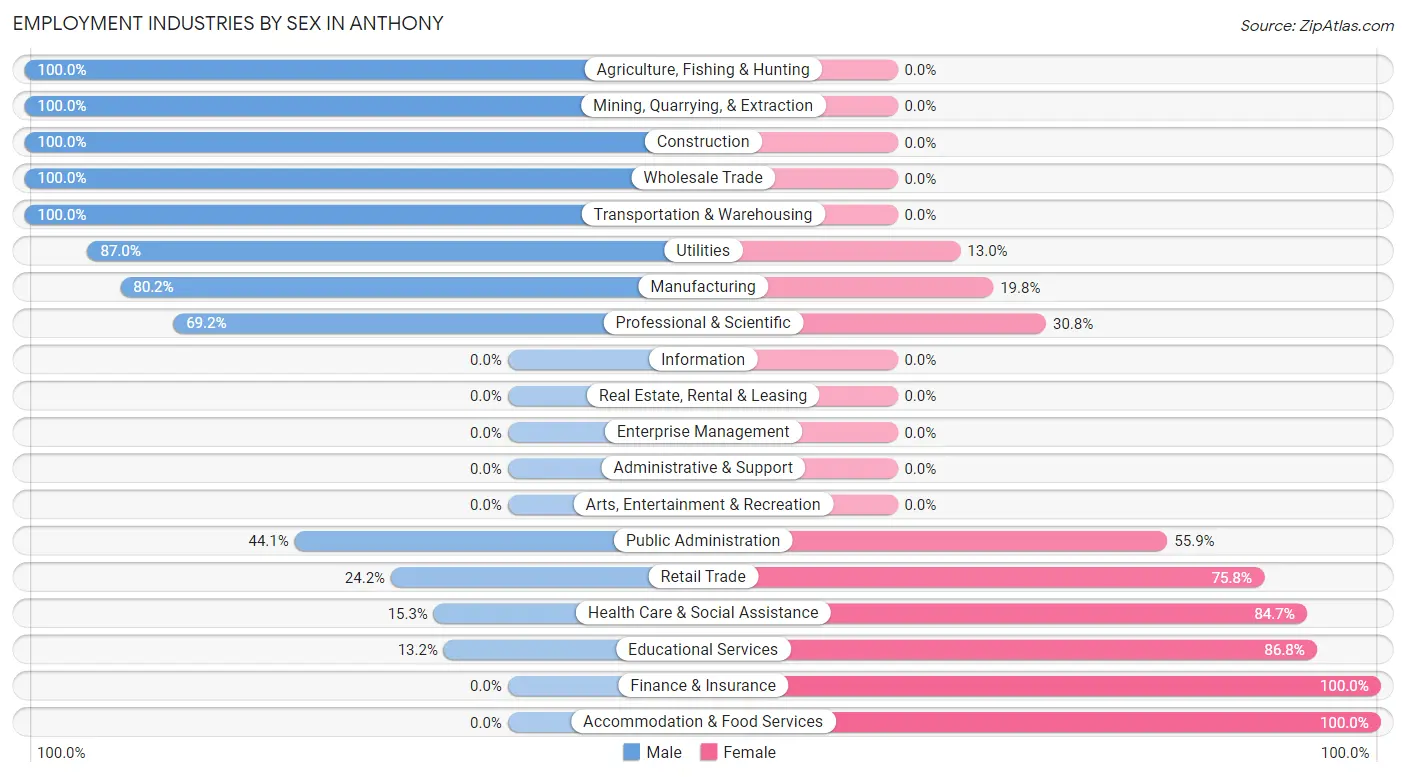
Employment Industries by Sex in Anthony
The Anthony industries that see more men than women are Agriculture, Fishing & Hunting (100.0%), Mining, Quarrying, & Extraction (100.0%), and Construction (100.0%), whereas the industries that tend to have a higher number of women are Finance & Insurance (100.0%), Accommodation & Food Services (100.0%), and Educational Services (86.8%).
| Industry | Male | Female |
| Agriculture, Fishing & Hunting | 48 (100.0%) | 0 (0.0%) |
| Mining, Quarrying, & Extraction | 3 (100.0%) | 0 (0.0%) |
| Construction | 25 (100.0%) | 0 (0.0%) |
| Manufacturing | 93 (80.2%) | 23 (19.8%) |
| Wholesale Trade | 62 (100.0%) | 0 (0.0%) |
| Retail Trade | 22 (24.2%) | 69 (75.8%) |
| Transportation & Warehousing | 19 (100.0%) | 0 (0.0%) |
| Utilities | 20 (87.0%) | 3 (13.0%) |
| Information | 0 (0.0%) | 0 (0.0%) |
| Finance & Insurance | 0 (0.0%) | 13 (100.0%) |
| Real Estate, Rental & Leasing | 0 (0.0%) | 0 (0.0%) |
| Professional & Scientific | 9 (69.2%) | 4 (30.8%) |
| Enterprise Management | 0 (0.0%) | 0 (0.0%) |
| Administrative & Support | 0 (0.0%) | 0 (0.0%) |
| Educational Services | 9 (13.2%) | 59 (86.8%) |
| Health Care & Social Assistance | 34 (15.3%) | 188 (84.7%) |
| Arts, Entertainment & Recreation | 0 (0.0%) | 0 (0.0%) |
| Accommodation & Food Services | 0 (0.0%) | 26 (100.0%) |
| Public Administration | 30 (44.1%) | 38 (55.9%) |
| Total | 428 (49.6%) | 435 (50.4%) |
Education in Anthony
School Enrollment in Anthony
The most common levels of schooling among the 653 students in Anthony are high school (232 | 35.5%), elementary school (148 | 22.7%), and middle school (94 | 14.4%).
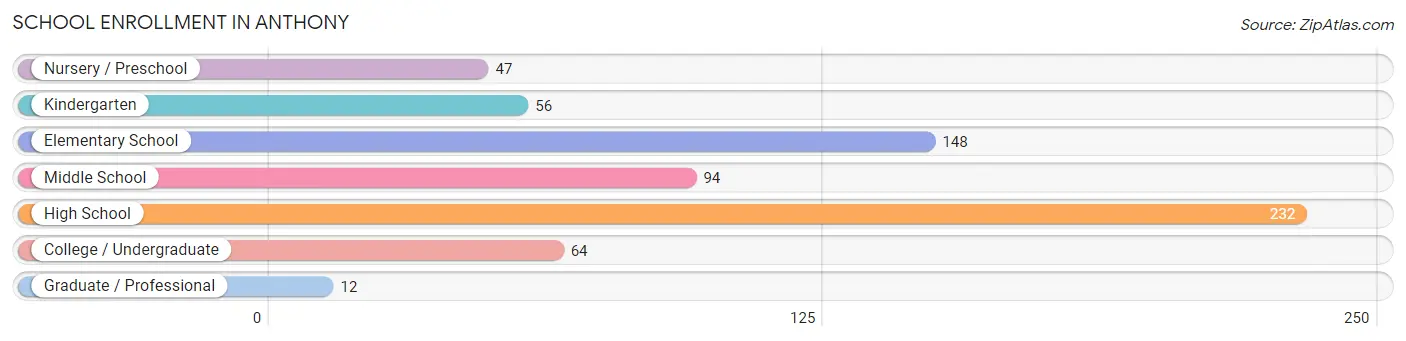
| School Level | # Students | % Students |
| Nursery / Preschool | 47 | 7.2% |
| Kindergarten | 56 | 8.6% |
| Elementary School | 148 | 22.7% |
| Middle School | 94 | 14.4% |
| High School | 232 | 35.5% |
| College / Undergraduate | 64 | 9.8% |
| Graduate / Professional | 12 | 1.8% |
| Total | 653 | 100.0% |
School Enrollment by Age by Funding Source in Anthony
Out of a total of 653 students who are enrolled in schools in Anthony, 72 (11.0%) attend a private institution, while the remaining 581 (89.0%) are enrolled in public schools. The age group of 3 to 4 year olds has the highest likelihood of being enrolled in private schools, with 34 (72.3% in the age bracket) enrolled. Conversely, the age group of 5 to 9 year old has the lowest likelihood of being enrolled in a private school, with 189 (100.0% in the age bracket) attending a public institution.
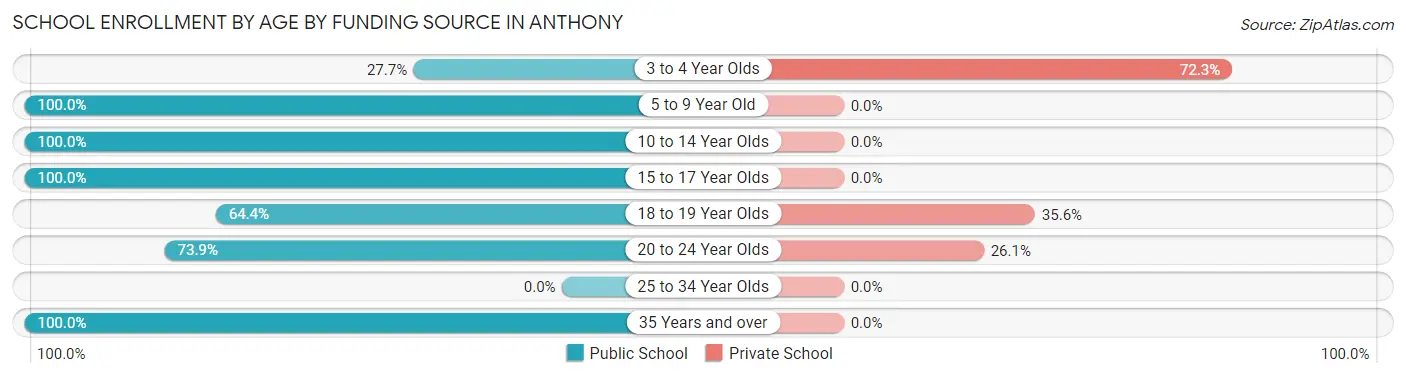
| Age Bracket | Public School | Private School |
| 3 to 4 Year Olds | 13 (27.7%) | 34 (72.3%) |
| 5 to 9 Year Old | 189 (100.0%) | 0 (0.0%) |
| 10 to 14 Year Olds | 141 (100.0%) | 0 (0.0%) |
| 15 to 17 Year Olds | 139 (100.0%) | 0 (0.0%) |
| 18 to 19 Year Olds | 47 (64.4%) | 26 (35.6%) |
| 20 to 24 Year Olds | 34 (73.9%) | 12 (26.1%) |
| 25 to 34 Year Olds | 0 (0.0%) | 0 (0.0%) |
| 35 Years and over | 18 (100.0%) | 0 (0.0%) |
| Total | 581 (89.0%) | 72 (11.0%) |
Educational Attainment by Field of Study in Anthony
Education (63 | 26.0%), science & technology (45 | 18.6%), business (40 | 16.5%), psychology (22 | 9.1%), and communications (18 | 7.4%) are the most common fields of study among 242 individuals in Anthony who have obtained a bachelor's degree or higher.
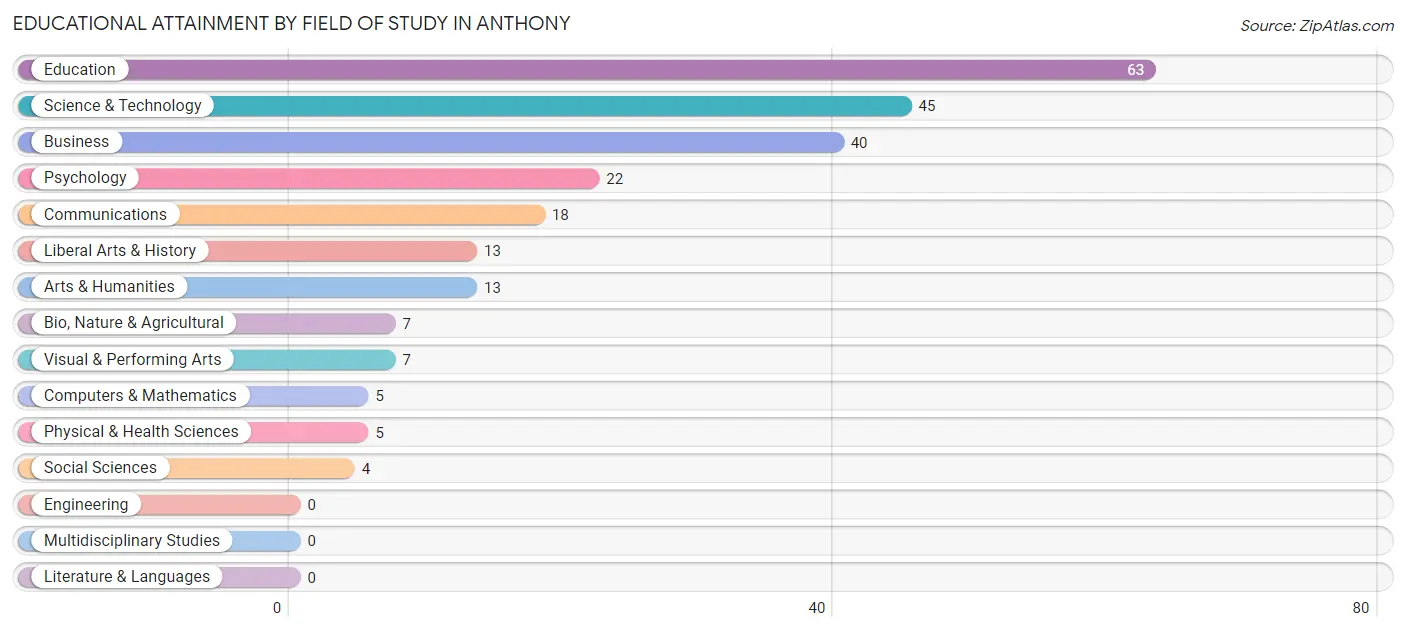
| Field of Study | # Graduates | % Graduates |
| Computers & Mathematics | 5 | 2.1% |
| Bio, Nature & Agricultural | 7 | 2.9% |
| Physical & Health Sciences | 5 | 2.1% |
| Psychology | 22 | 9.1% |
| Social Sciences | 4 | 1.7% |
| Engineering | 0 | 0.0% |
| Multidisciplinary Studies | 0 | 0.0% |
| Science & Technology | 45 | 18.6% |
| Business | 40 | 16.5% |
| Education | 63 | 26.0% |
| Literature & Languages | 0 | 0.0% |
| Liberal Arts & History | 13 | 5.4% |
| Visual & Performing Arts | 7 | 2.9% |
| Communications | 18 | 7.4% |
| Arts & Humanities | 13 | 5.4% |
| Total | 242 | 100.0% |
Transportation & Commute in Anthony
Vehicle Availability by Sex in Anthony
The most prevalent vehicle ownership categories in Anthony are males with 2 vehicles (232, accounting for 54.2%) and females with 2 vehicles (187, making up 53.3%).
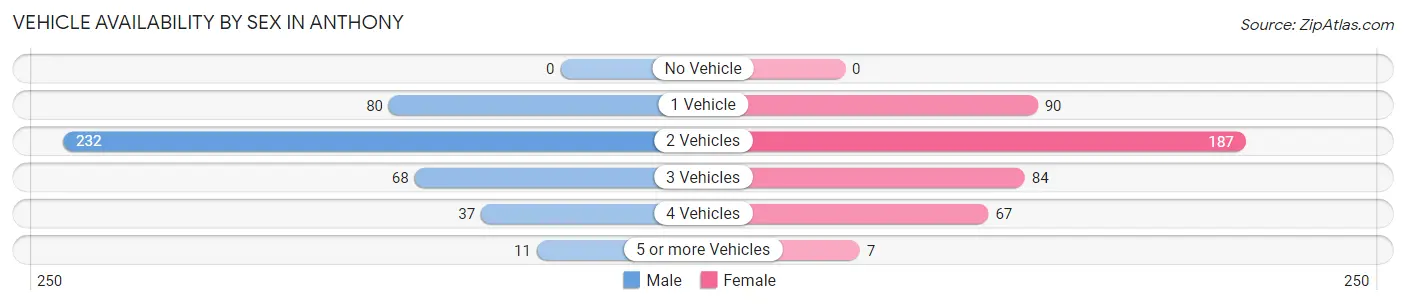
| Vehicles Available | Male | Female |
| No Vehicle | 0 (0.0%) | 0 (0.0%) |
| 1 Vehicle | 80 (18.7%) | 90 (20.7%) |
| 2 Vehicles | 232 (54.2%) | 187 (43.0%) |
| 3 Vehicles | 68 (15.9%) | 84 (19.3%) |
| 4 Vehicles | 37 (8.6%) | 67 (15.4%) |
| 5 or more Vehicles | 11 (2.6%) | 7 (1.6%) |
| Total | 428 (100.0%) | 435 (100.0%) |
Commute Time in Anthony
The most frequently occuring commute durations in Anthony are 5 to 9 minutes (271 commuters, 32.3%), less than 5 minutes (189 commuters, 22.5%), and 15 to 19 minutes (142 commuters, 16.9%).
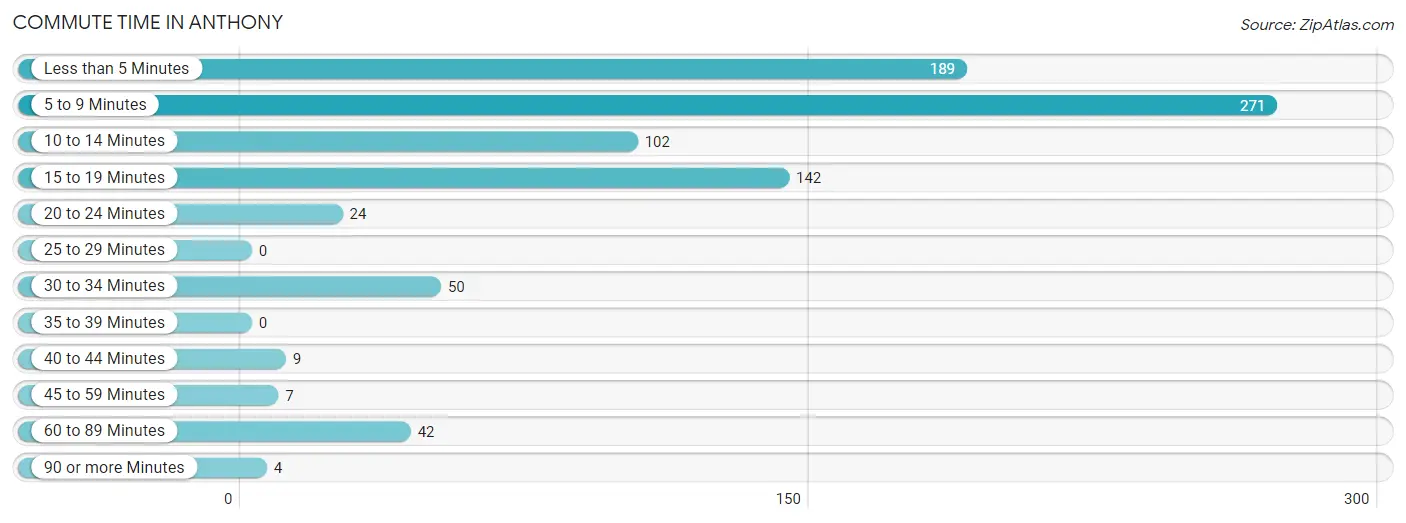
| Commute Time | # Commuters | % Commuters |
| Less than 5 Minutes | 189 | 22.5% |
| 5 to 9 Minutes | 271 | 32.3% |
| 10 to 14 Minutes | 102 | 12.1% |
| 15 to 19 Minutes | 142 | 16.9% |
| 20 to 24 Minutes | 24 | 2.9% |
| 25 to 29 Minutes | 0 | 0.0% |
| 30 to 34 Minutes | 50 | 5.9% |
| 35 to 39 Minutes | 0 | 0.0% |
| 40 to 44 Minutes | 9 | 1.1% |
| 45 to 59 Minutes | 7 | 0.8% |
| 60 to 89 Minutes | 42 | 5.0% |
| 90 or more Minutes | 4 | 0.5% |
Commute Time by Sex in Anthony
The most common commute times in Anthony are 5 to 9 minutes (154 commuters, 36.0%) for males and 5 to 9 minutes (117 commuters, 28.4%) for females.
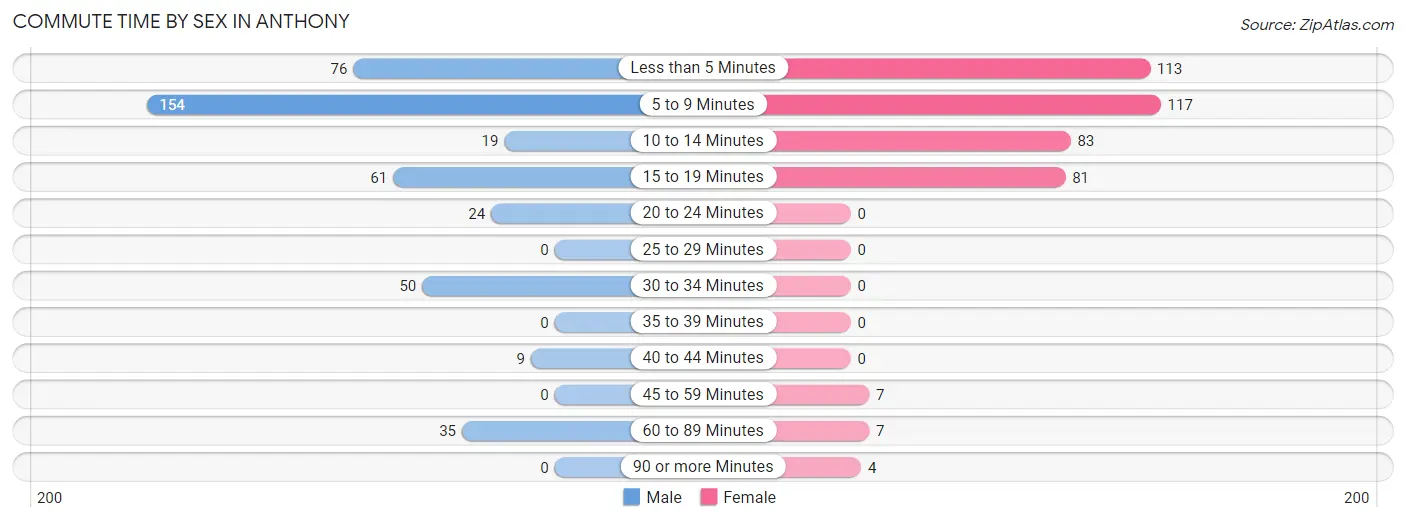
| Commute Time | Male | Female |
| Less than 5 Minutes | 76 (17.8%) | 113 (27.4%) |
| 5 to 9 Minutes | 154 (36.0%) | 117 (28.4%) |
| 10 to 14 Minutes | 19 (4.4%) | 83 (20.2%) |
| 15 to 19 Minutes | 61 (14.2%) | 81 (19.7%) |
| 20 to 24 Minutes | 24 (5.6%) | 0 (0.0%) |
| 25 to 29 Minutes | 0 (0.0%) | 0 (0.0%) |
| 30 to 34 Minutes | 50 (11.7%) | 0 (0.0%) |
| 35 to 39 Minutes | 0 (0.0%) | 0 (0.0%) |
| 40 to 44 Minutes | 9 (2.1%) | 0 (0.0%) |
| 45 to 59 Minutes | 0 (0.0%) | 7 (1.7%) |
| 60 to 89 Minutes | 35 (8.2%) | 7 (1.7%) |
| 90 or more Minutes | 0 (0.0%) | 4 (1.0%) |
Time of Departure to Work by Sex in Anthony
The most frequent times of departure to work in Anthony are 7:00 AM to 7:29 AM (129, 30.1%) for males and 7:30 AM to 7:59 AM (199, 48.3%) for females.
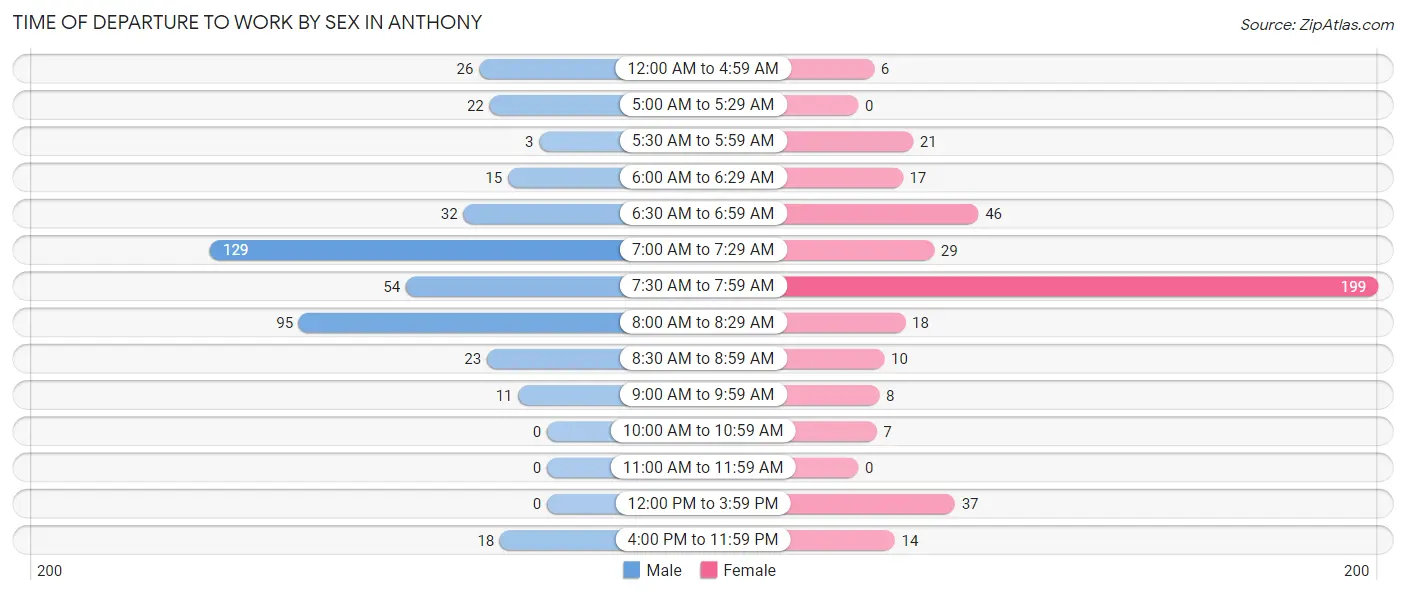
| Time of Departure | Male | Female |
| 12:00 AM to 4:59 AM | 26 (6.1%) | 6 (1.5%) |
| 5:00 AM to 5:29 AM | 22 (5.1%) | 0 (0.0%) |
| 5:30 AM to 5:59 AM | 3 (0.7%) | 21 (5.1%) |
| 6:00 AM to 6:29 AM | 15 (3.5%) | 17 (4.1%) |
| 6:30 AM to 6:59 AM | 32 (7.5%) | 46 (11.2%) |
| 7:00 AM to 7:29 AM | 129 (30.1%) | 29 (7.0%) |
| 7:30 AM to 7:59 AM | 54 (12.6%) | 199 (48.3%) |
| 8:00 AM to 8:29 AM | 95 (22.2%) | 18 (4.4%) |
| 8:30 AM to 8:59 AM | 23 (5.4%) | 10 (2.4%) |
| 9:00 AM to 9:59 AM | 11 (2.6%) | 8 (1.9%) |
| 10:00 AM to 10:59 AM | 0 (0.0%) | 7 (1.7%) |
| 11:00 AM to 11:59 AM | 0 (0.0%) | 0 (0.0%) |
| 12:00 PM to 3:59 PM | 0 (0.0%) | 37 (9.0%) |
| 4:00 PM to 11:59 PM | 18 (4.2%) | 14 (3.4%) |
| Total | 428 (100.0%) | 412 (100.0%) |
Housing Occupancy in Anthony
Occupancy by Ownership in Anthony
Of the total 801 dwellings in Anthony, owner-occupied units account for 610 (76.1%), while renter-occupied units make up 191 (23.8%).
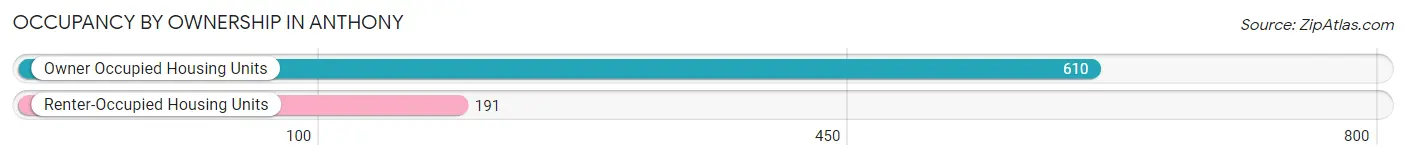
| Occupancy | # Housing Units | % Housing Units |
| Owner Occupied Housing Units | 610 | 76.1% |
| Renter-Occupied Housing Units | 191 | 23.8% |
| Total Occupied Housing Units | 801 | 100.0% |
Occupancy by Household Size in Anthony
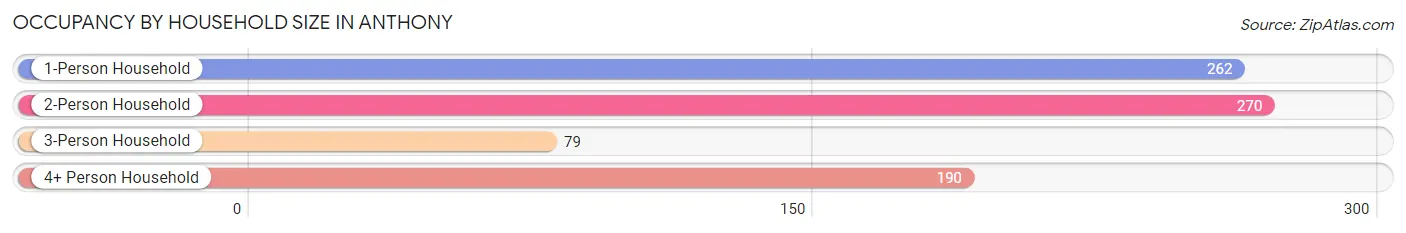
| Household Size | # Housing Units | % Housing Units |
| 1-Person Household | 262 | 32.7% |
| 2-Person Household | 270 | 33.7% |
| 3-Person Household | 79 | 9.9% |
| 4+ Person Household | 190 | 23.7% |
| Total Housing Units | 801 | 100.0% |
Occupancy by Ownership by Household Size in Anthony
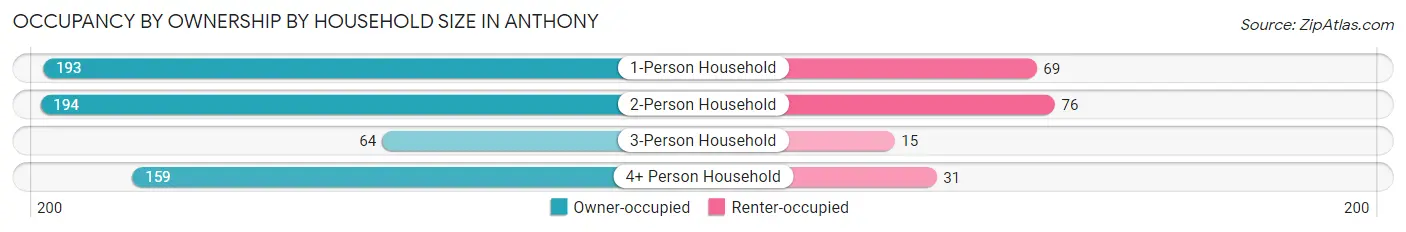
| Household Size | Owner-occupied | Renter-occupied |
| 1-Person Household | 193 (73.7%) | 69 (26.3%) |
| 2-Person Household | 194 (71.9%) | 76 (28.1%) |
| 3-Person Household | 64 (81.0%) | 15 (19.0%) |
| 4+ Person Household | 159 (83.7%) | 31 (16.3%) |
| Total Housing Units | 610 (76.1%) | 191 (23.8%) |
Occupancy by Educational Attainment in Anthony
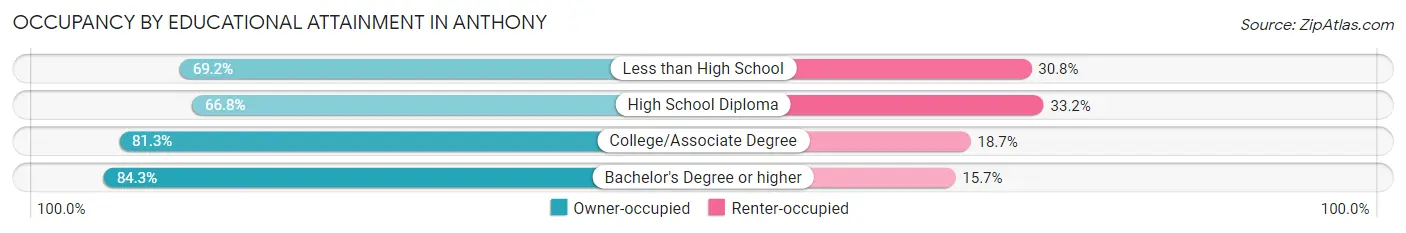
| Household Size | Owner-occupied | Renter-occupied |
| Less than High School | 63 (69.2%) | 28 (30.8%) |
| High School Diploma | 163 (66.8%) | 81 (33.2%) |
| College/Associate Degree | 239 (81.3%) | 55 (18.7%) |
| Bachelor's Degree or higher | 145 (84.3%) | 27 (15.7%) |
Occupancy by Age of Householder in Anthony
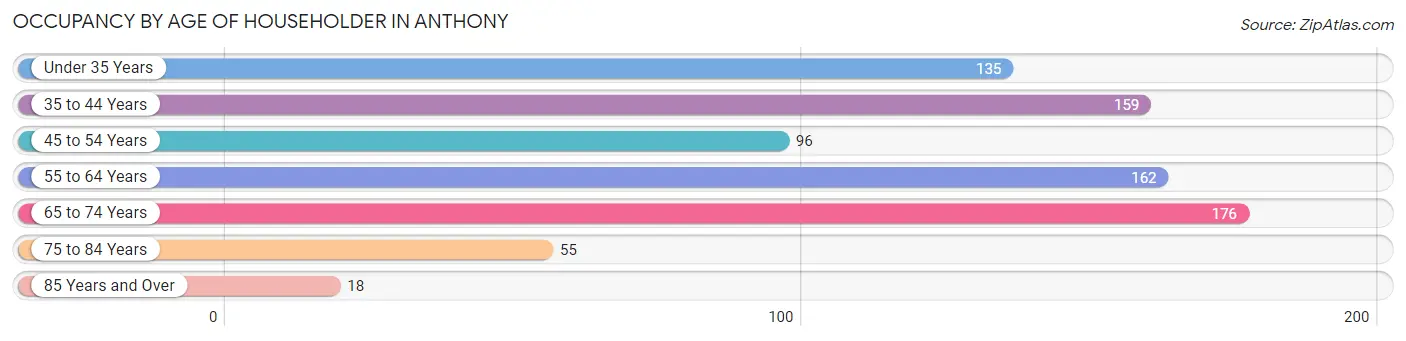
| Age Bracket | # Households | % Households |
| Under 35 Years | 135 | 16.9% |
| 35 to 44 Years | 159 | 19.9% |
| 45 to 54 Years | 96 | 12.0% |
| 55 to 64 Years | 162 | 20.2% |
| 65 to 74 Years | 176 | 22.0% |
| 75 to 84 Years | 55 | 6.9% |
| 85 Years and Over | 18 | 2.2% |
| Total | 801 | 100.0% |
Housing Finances in Anthony
Median Income by Occupancy in Anthony
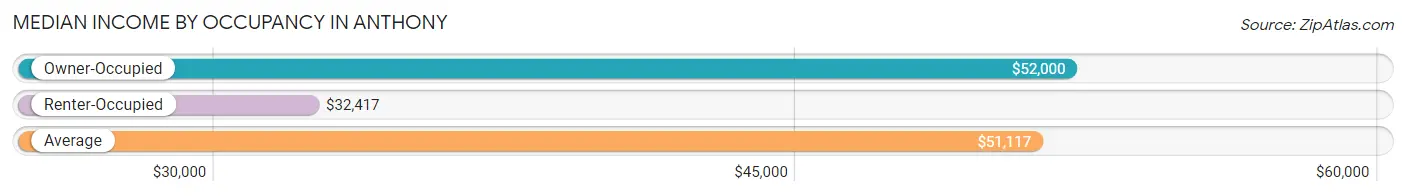
| Occupancy Type | # Households | Median Income |
| Owner-Occupied | 610 (76.1%) | $52,000 |
| Renter-Occupied | 191 (23.8%) | $32,417 |
| Average | 801 (100.0%) | $51,117 |
Occupancy by Householder Income Bracket in Anthony
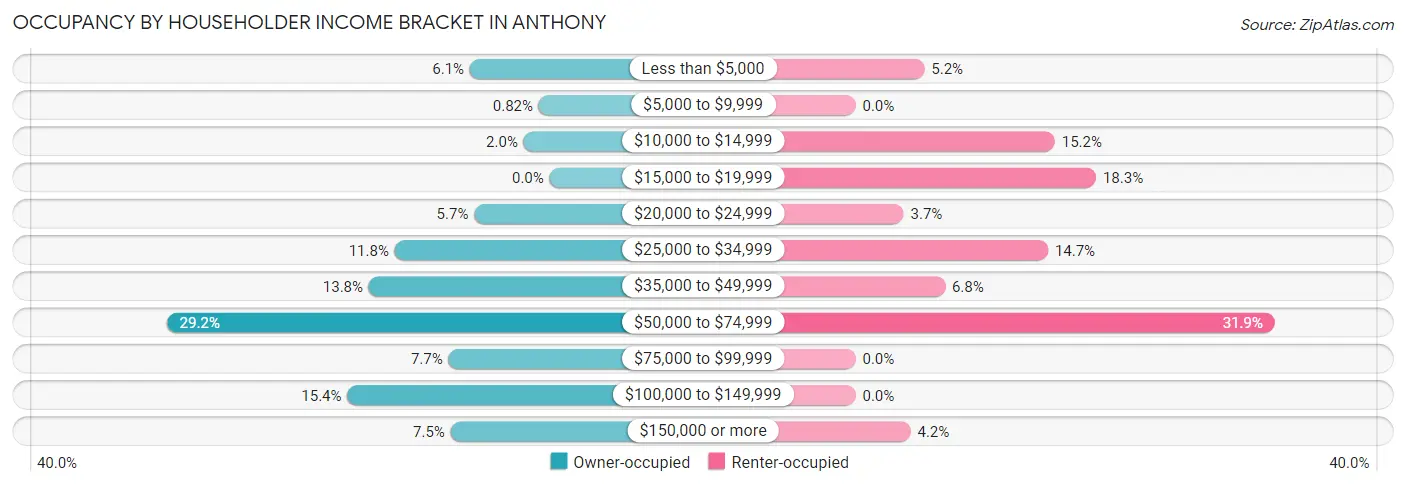
| Income Bracket | Owner-occupied | Renter-occupied |
| Less than $5,000 | 37 (6.1%) | 10 (5.2%) |
| $5,000 to $9,999 | 5 (0.8%) | 0 (0.0%) |
| $10,000 to $14,999 | 12 (2.0%) | 29 (15.2%) |
| $15,000 to $19,999 | 0 (0.0%) | 35 (18.3%) |
| $20,000 to $24,999 | 35 (5.7%) | 7 (3.7%) |
| $25,000 to $34,999 | 72 (11.8%) | 28 (14.7%) |
| $35,000 to $49,999 | 84 (13.8%) | 13 (6.8%) |
| $50,000 to $74,999 | 178 (29.2%) | 61 (31.9%) |
| $75,000 to $99,999 | 47 (7.7%) | 0 (0.0%) |
| $100,000 to $149,999 | 94 (15.4%) | 0 (0.0%) |
| $150,000 or more | 46 (7.5%) | 8 (4.2%) |
| Total | 610 (100.0%) | 191 (100.0%) |
Monthly Housing Cost Tiers in Anthony
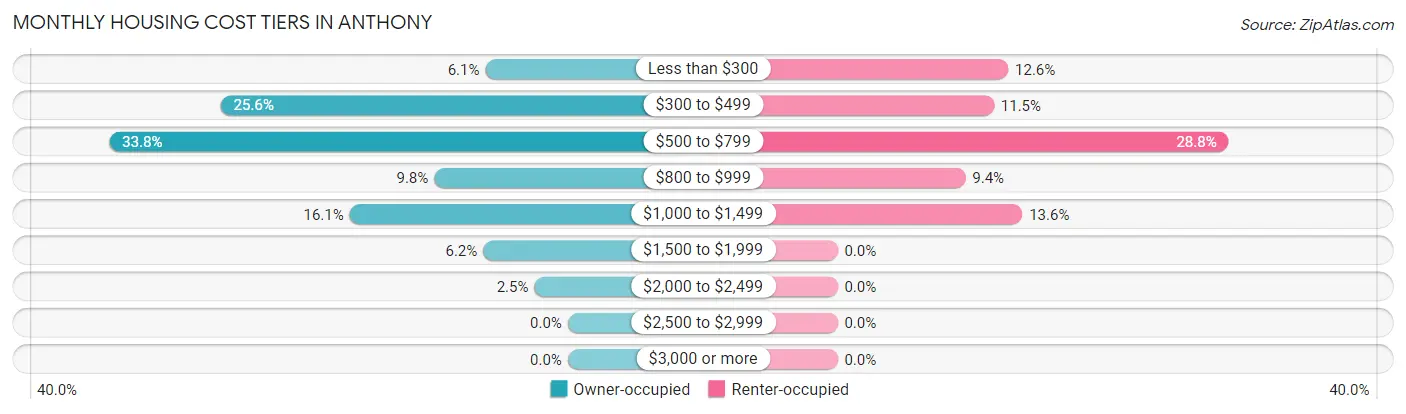
| Monthly Cost | Owner-occupied | Renter-occupied |
| Less than $300 | 37 (6.1%) | 24 (12.6%) |
| $300 to $499 | 156 (25.6%) | 22 (11.5%) |
| $500 to $799 | 206 (33.8%) | 55 (28.8%) |
| $800 to $999 | 60 (9.8%) | 18 (9.4%) |
| $1,000 to $1,499 | 98 (16.1%) | 26 (13.6%) |
| $1,500 to $1,999 | 38 (6.2%) | 0 (0.0%) |
| $2,000 to $2,499 | 15 (2.5%) | 0 (0.0%) |
| $2,500 to $2,999 | 0 (0.0%) | 0 (0.0%) |
| $3,000 or more | 0 (0.0%) | 0 (0.0%) |
| Total | 610 (100.0%) | 191 (100.0%) |
Physical Housing Characteristics in Anthony
Housing Structures in Anthony
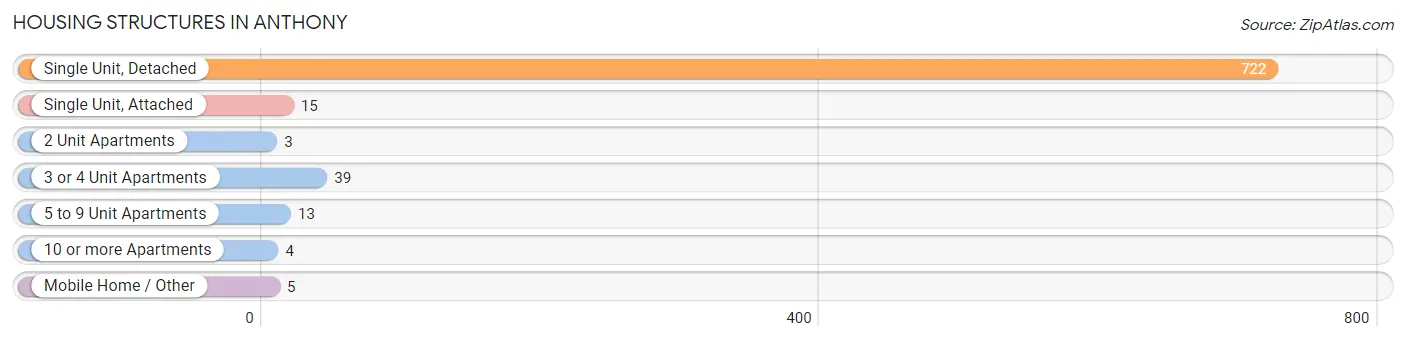
| Structure Type | # Housing Units | % Housing Units |
| Single Unit, Detached | 722 | 90.1% |
| Single Unit, Attached | 15 | 1.9% |
| 2 Unit Apartments | 3 | 0.4% |
| 3 or 4 Unit Apartments | 39 | 4.9% |
| 5 to 9 Unit Apartments | 13 | 1.6% |
| 10 or more Apartments | 4 | 0.5% |
| Mobile Home / Other | 5 | 0.6% |
| Total | 801 | 100.0% |
Housing Structures by Occupancy in Anthony
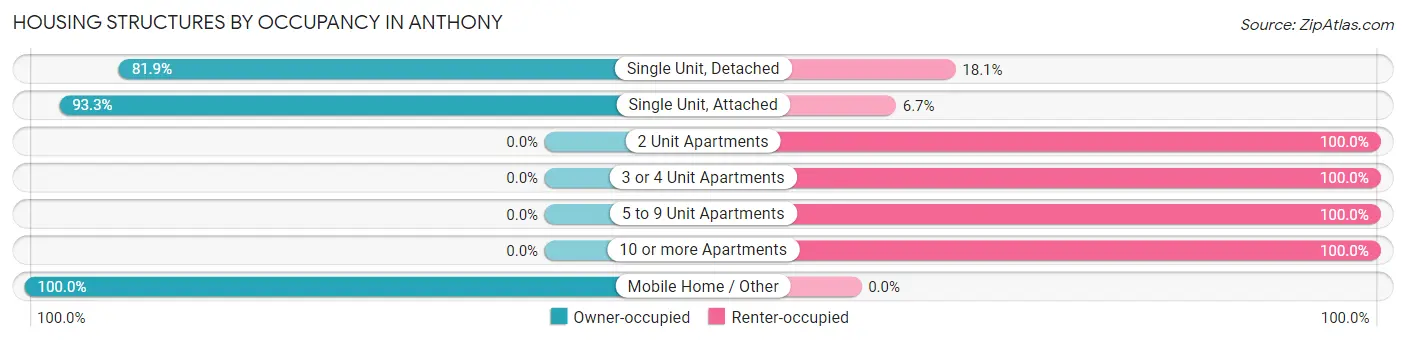
| Structure Type | Owner-occupied | Renter-occupied |
| Single Unit, Detached | 591 (81.9%) | 131 (18.1%) |
| Single Unit, Attached | 14 (93.3%) | 1 (6.7%) |
| 2 Unit Apartments | 0 (0.0%) | 3 (100.0%) |
| 3 or 4 Unit Apartments | 0 (0.0%) | 39 (100.0%) |
| 5 to 9 Unit Apartments | 0 (0.0%) | 13 (100.0%) |
| 10 or more Apartments | 0 (0.0%) | 4 (100.0%) |
| Mobile Home / Other | 5 (100.0%) | 0 (0.0%) |
| Total | 610 (76.1%) | 191 (23.8%) |
Housing Structures by Number of Rooms in Anthony
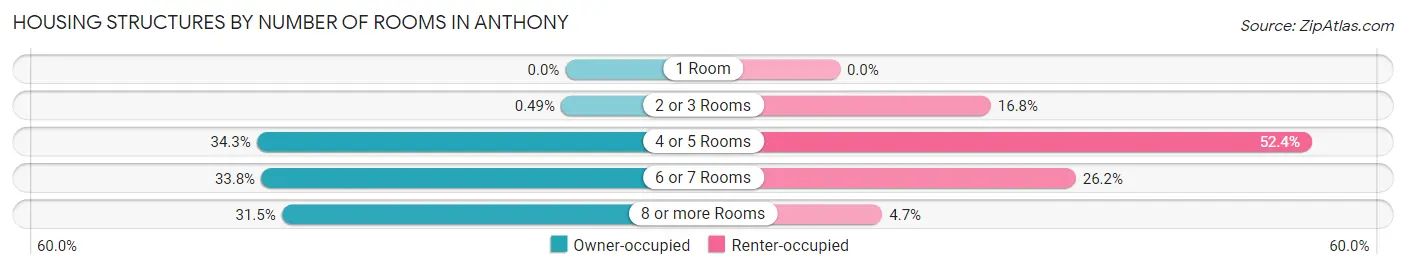
| Number of Rooms | Owner-occupied | Renter-occupied |
| 1 Room | 0 (0.0%) | 0 (0.0%) |
| 2 or 3 Rooms | 3 (0.5%) | 32 (16.8%) |
| 4 or 5 Rooms | 209 (34.3%) | 100 (52.4%) |
| 6 or 7 Rooms | 206 (33.8%) | 50 (26.2%) |
| 8 or more Rooms | 192 (31.5%) | 9 (4.7%) |
| Total | 610 (100.0%) | 191 (100.0%) |
Housing Structure by Heating Type in Anthony
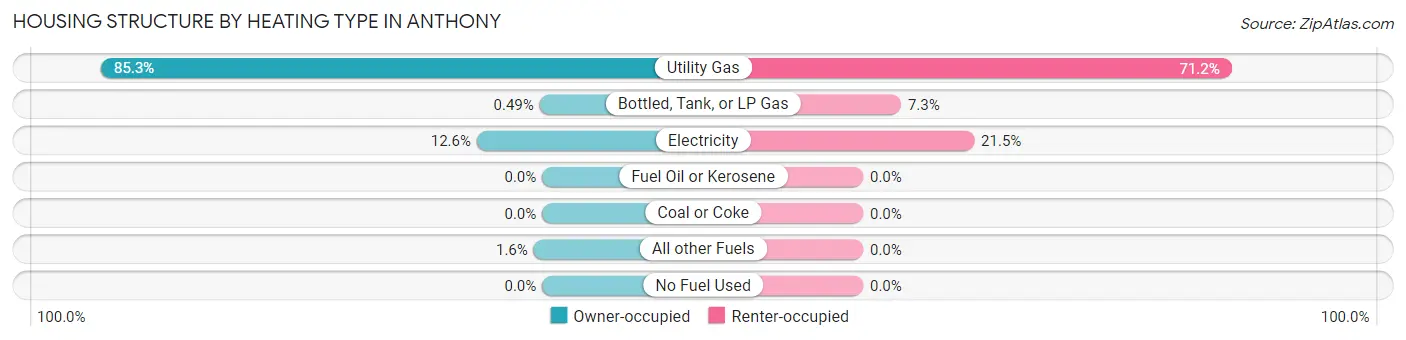
| Heating Type | Owner-occupied | Renter-occupied |
| Utility Gas | 520 (85.3%) | 136 (71.2%) |
| Bottled, Tank, or LP Gas | 3 (0.5%) | 14 (7.3%) |
| Electricity | 77 (12.6%) | 41 (21.5%) |
| Fuel Oil or Kerosene | 0 (0.0%) | 0 (0.0%) |
| Coal or Coke | 0 (0.0%) | 0 (0.0%) |
| All other Fuels | 10 (1.6%) | 0 (0.0%) |
| No Fuel Used | 0 (0.0%) | 0 (0.0%) |
| Total | 610 (100.0%) | 191 (100.0%) |
Household Vehicle Usage in Anthony
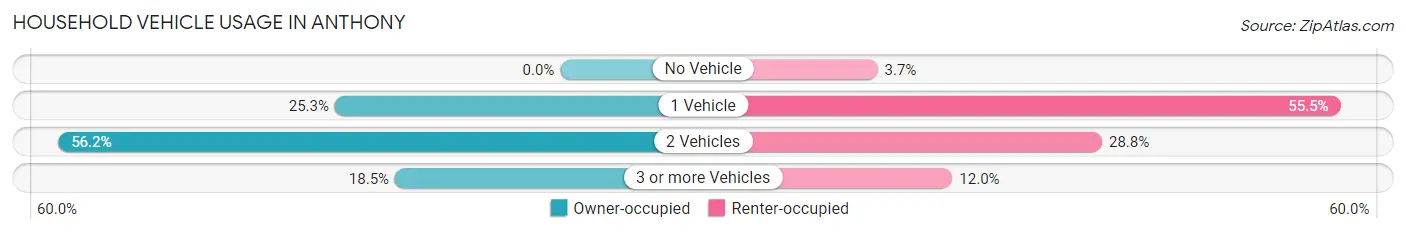
| Vehicles per Household | Owner-occupied | Renter-occupied |
| No Vehicle | 0 (0.0%) | 7 (3.7%) |
| 1 Vehicle | 154 (25.3%) | 106 (55.5%) |
| 2 Vehicles | 343 (56.2%) | 55 (28.8%) |
| 3 or more Vehicles | 113 (18.5%) | 23 (12.0%) |
| Total | 610 (100.0%) | 191 (100.0%) |
Real Estate & Mortgages in Anthony
Real Estate and Mortgage Overview in Anthony
| Characteristic | Without Mortgage | With Mortgage |
| Housing Units | 410 | 200 |
| Median Property Value | $53,900 | $98,300 |
| Median Household Income | $50,792 | $35 |
| Monthly Housing Costs | $510 | $0 |
| Real Estate Taxes | $1,269 | $3 |
Property Value by Mortgage Status in Anthony
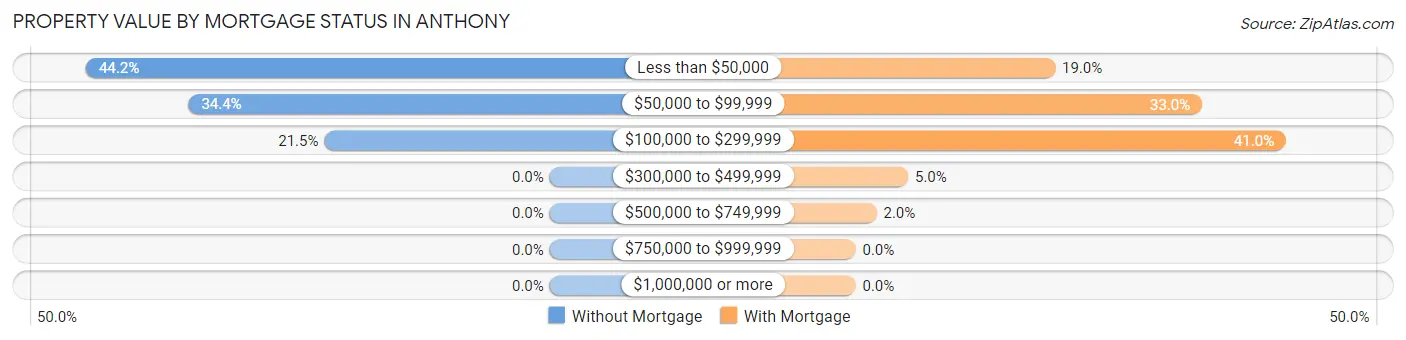
| Property Value | Without Mortgage | With Mortgage |
| Less than $50,000 | 181 (44.2%) | 38 (19.0%) |
| $50,000 to $99,999 | 141 (34.4%) | 66 (33.0%) |
| $100,000 to $299,999 | 88 (21.5%) | 82 (41.0%) |
| $300,000 to $499,999 | 0 (0.0%) | 10 (5.0%) |
| $500,000 to $749,999 | 0 (0.0%) | 4 (2.0%) |
| $750,000 to $999,999 | 0 (0.0%) | 0 (0.0%) |
| $1,000,000 or more | 0 (0.0%) | 0 (0.0%) |
| Total | 410 (100.0%) | 200 (100.0%) |
Household Income by Mortgage Status in Anthony
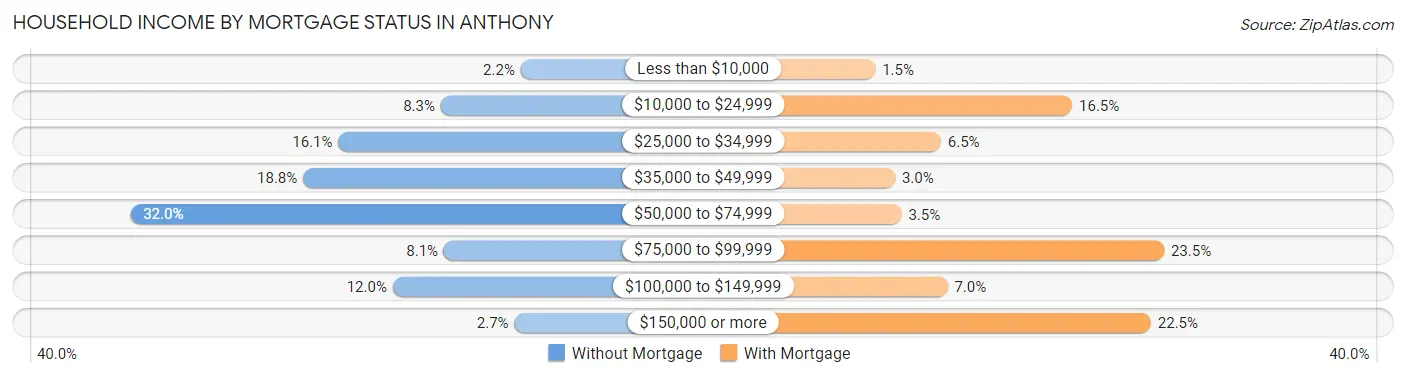
| Household Income | Without Mortgage | With Mortgage |
| Less than $10,000 | 9 (2.2%) | 3 (1.5%) |
| $10,000 to $24,999 | 34 (8.3%) | 33 (16.5%) |
| $25,000 to $34,999 | 66 (16.1%) | 13 (6.5%) |
| $35,000 to $49,999 | 77 (18.8%) | 6 (3.0%) |
| $50,000 to $74,999 | 131 (32.0%) | 7 (3.5%) |
| $75,000 to $99,999 | 33 (8.1%) | 47 (23.5%) |
| $100,000 to $149,999 | 49 (11.9%) | 14 (7.0%) |
| $150,000 or more | 11 (2.7%) | 45 (22.5%) |
| Total | 410 (100.0%) | 200 (100.0%) |
Property Value to Household Income Ratio in Anthony
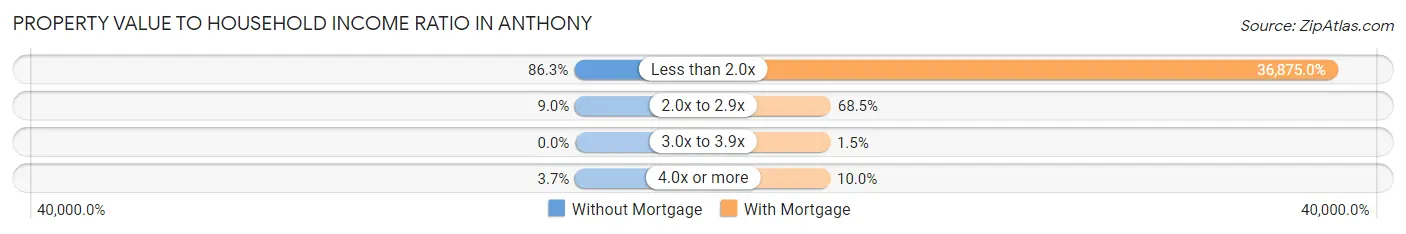
| Value-to-Income Ratio | Without Mortgage | With Mortgage |
| Less than 2.0x | 354 (86.3%) | 73,750 (36,875.0%) |
| 2.0x to 2.9x | 37 (9.0%) | 137 (68.5%) |
| 3.0x to 3.9x | 0 (0.0%) | 3 (1.5%) |
| 4.0x or more | 15 (3.7%) | 20 (10.0%) |
| Total | 410 (100.0%) | 200 (100.0%) |
Real Estate Taxes by Mortgage Status in Anthony
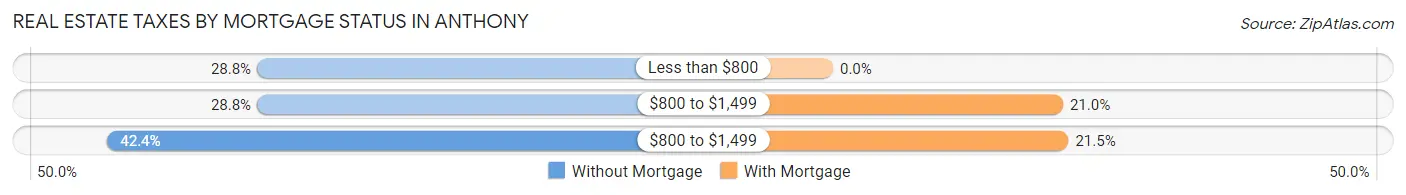
| Property Taxes | Without Mortgage | With Mortgage |
| Less than $800 | 118 (28.8%) | 0 (0.0%) |
| $800 to $1,499 | 118 (28.8%) | 42 (21.0%) |
| $800 to $1,499 | 174 (42.4%) | 43 (21.5%) |
| Total | 410 (100.0%) | 200 (100.0%) |
Health & Disability in Anthony
Health Insurance Coverage by Age in Anthony
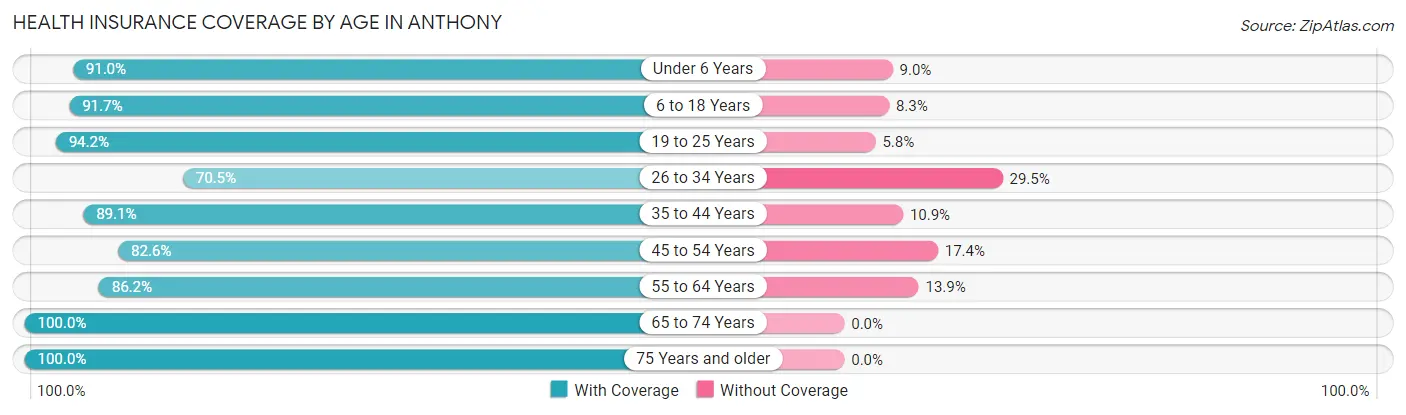
| Age Bracket | With Coverage | Without Coverage |
| Under 6 Years | 212 (91.0%) | 21 (9.0%) |
| 6 to 18 Years | 484 (91.7%) | 44 (8.3%) |
| 19 to 25 Years | 162 (94.2%) | 10 (5.8%) |
| 26 to 34 Years | 86 (70.5%) | 36 (29.5%) |
| 35 to 44 Years | 236 (89.1%) | 29 (10.9%) |
| 45 to 54 Years | 199 (82.6%) | 42 (17.4%) |
| 55 to 64 Years | 224 (86.2%) | 36 (13.9%) |
| 65 to 74 Years | 263 (100.0%) | 0 (0.0%) |
| 75 Years and older | 100 (100.0%) | 0 (0.0%) |
| Total | 1,966 (90.0%) | 218 (10.0%) |
Health Insurance Coverage by Citizenship Status in Anthony
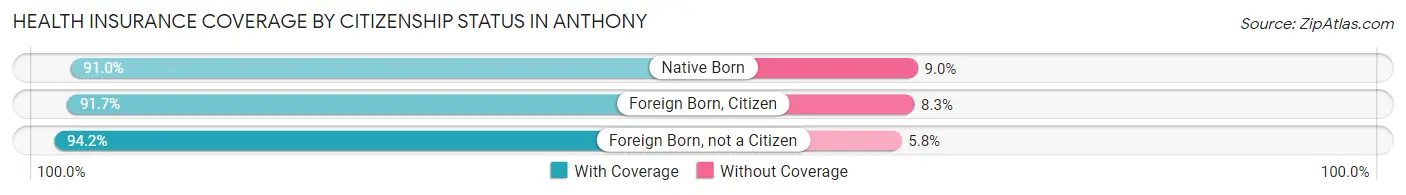
| Citizenship Status | With Coverage | Without Coverage |
| Native Born | 212 (91.0%) | 21 (9.0%) |
| Foreign Born, Citizen | 484 (91.7%) | 44 (8.3%) |
| Foreign Born, not a Citizen | 162 (94.2%) | 10 (5.8%) |
Health Insurance Coverage by Household Income in Anthony
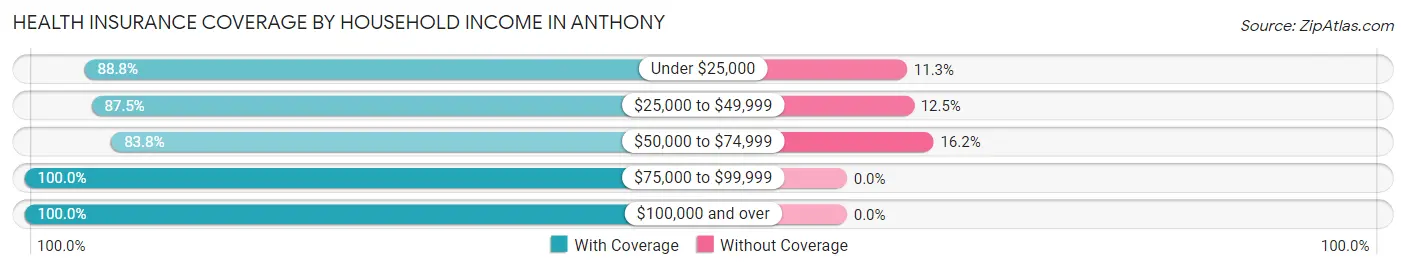
| Household Income | With Coverage | Without Coverage |
| Under $25,000 | 292 (88.7%) | 37 (11.3%) |
| $25,000 to $49,999 | 328 (87.5%) | 47 (12.5%) |
| $50,000 to $74,999 | 691 (83.8%) | 134 (16.2%) |
| $75,000 to $99,999 | 146 (100.0%) | 0 (0.0%) |
| $100,000 and over | 509 (100.0%) | 0 (0.0%) |
Public vs Private Health Insurance Coverage by Age in Anthony
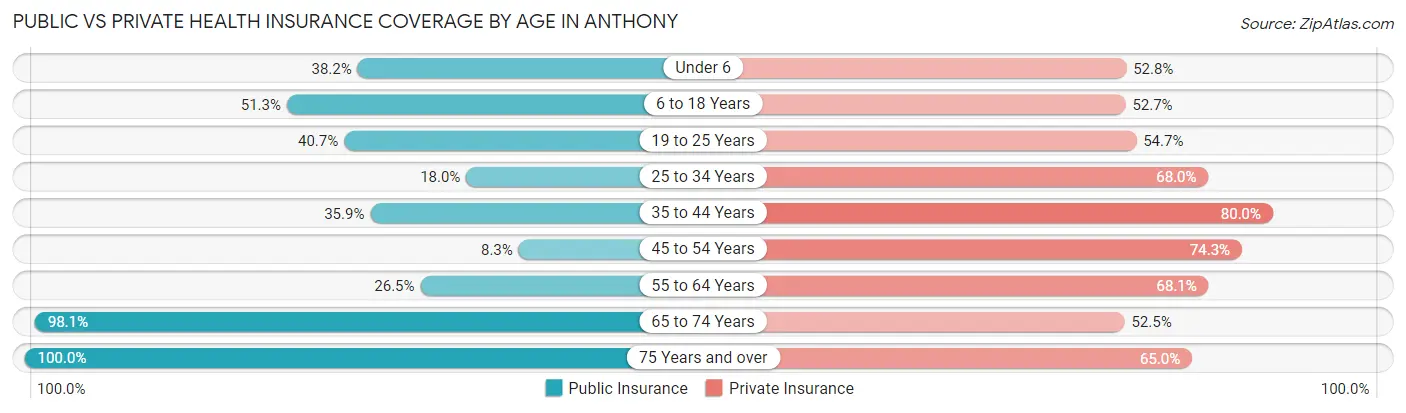
| Age Bracket | Public Insurance | Private Insurance |
| Under 6 | 89 (38.2%) | 123 (52.8%) |
| 6 to 18 Years | 271 (51.3%) | 278 (52.6%) |
| 19 to 25 Years | 70 (40.7%) | 94 (54.6%) |
| 25 to 34 Years | 22 (18.0%) | 83 (68.0%) |
| 35 to 44 Years | 95 (35.8%) | 212 (80.0%) |
| 45 to 54 Years | 20 (8.3%) | 179 (74.3%) |
| 55 to 64 Years | 69 (26.5%) | 177 (68.1%) |
| 65 to 74 Years | 258 (98.1%) | 138 (52.5%) |
| 75 Years and over | 100 (100.0%) | 65 (65.0%) |
| Total | 994 (45.5%) | 1,349 (61.8%) |
Disability Status by Sex by Age in Anthony
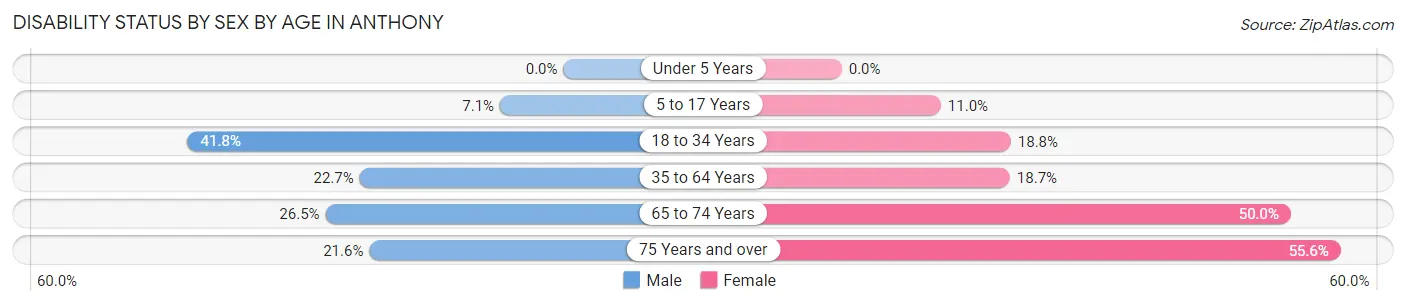
| Age Bracket | Male | Female |
| Under 5 Years | 0 (0.0%) | 0 (0.0%) |
| 5 to 17 Years | 12 (7.1%) | 33 (11.0%) |
| 18 to 34 Years | 59 (41.8%) | 42 (18.8%) |
| 35 to 64 Years | 89 (22.7%) | 70 (18.7%) |
| 65 to 74 Years | 31 (26.5%) | 73 (50.0%) |
| 75 Years and over | 8 (21.6%) | 35 (55.6%) |
Disability Class by Sex by Age in Anthony
Disability Class: Hearing Difficulty
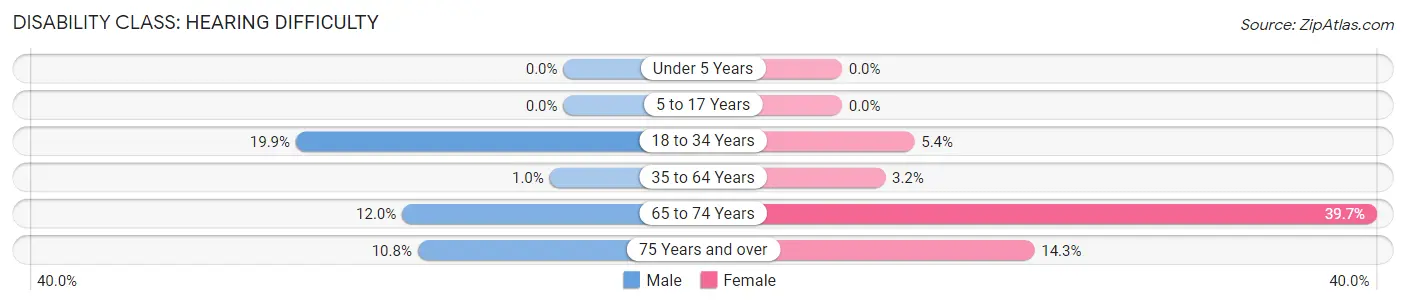
| Age Bracket | Male | Female |
| Under 5 Years | 0 (0.0%) | 0 (0.0%) |
| 5 to 17 Years | 0 (0.0%) | 0 (0.0%) |
| 18 to 34 Years | 28 (19.9%) | 12 (5.4%) |
| 35 to 64 Years | 4 (1.0%) | 12 (3.2%) |
| 65 to 74 Years | 14 (12.0%) | 58 (39.7%) |
| 75 Years and over | 4 (10.8%) | 9 (14.3%) |
Disability Class: Vision Difficulty
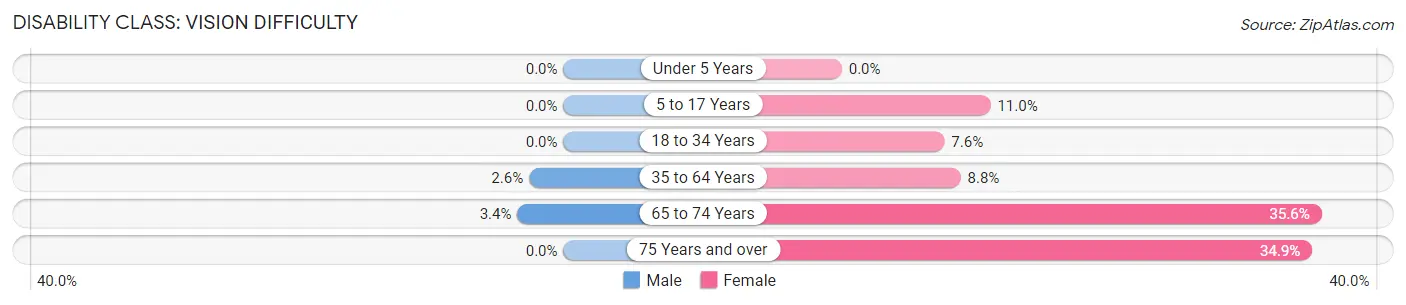
| Age Bracket | Male | Female |
| Under 5 Years | 0 (0.0%) | 0 (0.0%) |
| 5 to 17 Years | 0 (0.0%) | 33 (11.0%) |
| 18 to 34 Years | 0 (0.0%) | 17 (7.6%) |
| 35 to 64 Years | 10 (2.5%) | 33 (8.8%) |
| 65 to 74 Years | 4 (3.4%) | 52 (35.6%) |
| 75 Years and over | 0 (0.0%) | 22 (34.9%) |
Disability Class: Cognitive Difficulty
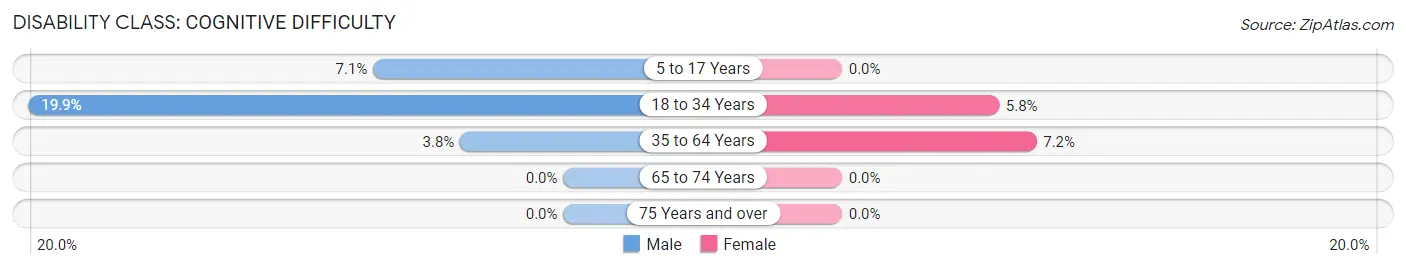
| Age Bracket | Male | Female |
| 5 to 17 Years | 12 (7.1%) | 0 (0.0%) |
| 18 to 34 Years | 28 (19.9%) | 13 (5.8%) |
| 35 to 64 Years | 15 (3.8%) | 27 (7.2%) |
| 65 to 74 Years | 0 (0.0%) | 0 (0.0%) |
| 75 Years and over | 0 (0.0%) | 0 (0.0%) |
Disability Class: Ambulatory Difficulty
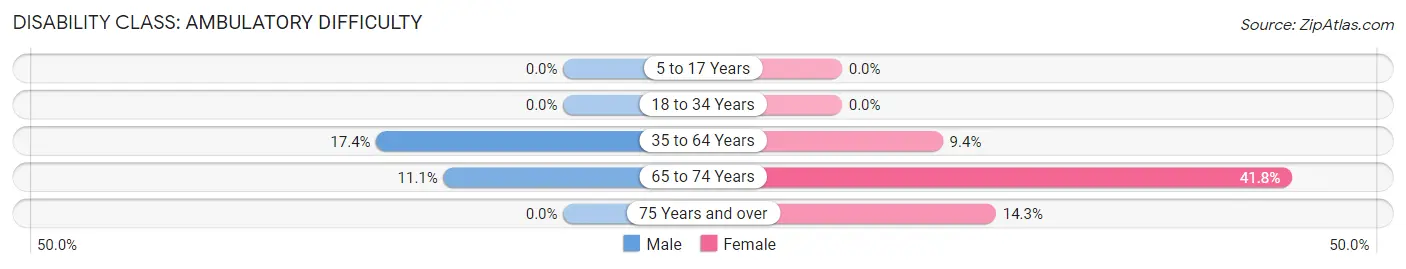
| Age Bracket | Male | Female |
| 5 to 17 Years | 0 (0.0%) | 0 (0.0%) |
| 18 to 34 Years | 0 (0.0%) | 0 (0.0%) |
| 35 to 64 Years | 68 (17.3%) | 35 (9.4%) |
| 65 to 74 Years | 13 (11.1%) | 61 (41.8%) |
| 75 Years and over | 0 (0.0%) | 9 (14.3%) |
Disability Class: Self-Care Difficulty
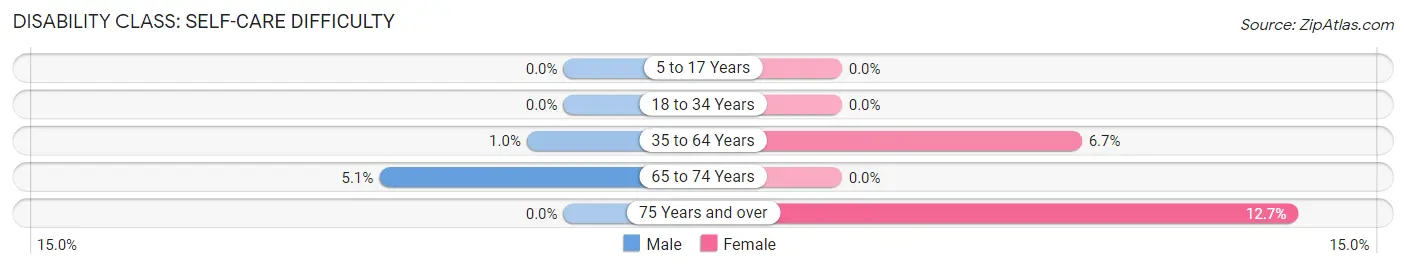
| Age Bracket | Male | Female |
| 5 to 17 Years | 0 (0.0%) | 0 (0.0%) |
| 18 to 34 Years | 0 (0.0%) | 0 (0.0%) |
| 35 to 64 Years | 4 (1.0%) | 25 (6.7%) |
| 65 to 74 Years | 6 (5.1%) | 0 (0.0%) |
| 75 Years and over | 0 (0.0%) | 8 (12.7%) |
Technology Access in Anthony
Computing Device Access in Anthony
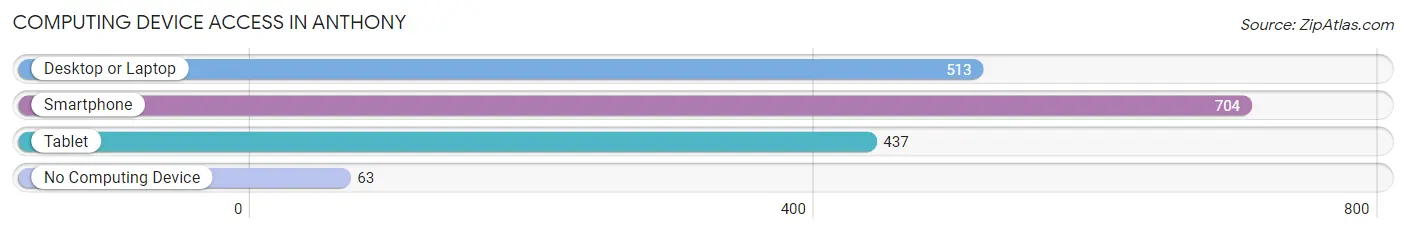
| Device Type | # Households | % Households |
| Desktop or Laptop | 513 | 64.0% |
| Smartphone | 704 | 87.9% |
| Tablet | 437 | 54.6% |
| No Computing Device | 63 | 7.9% |
| Total | 801 | 100.0% |
Internet Access in Anthony
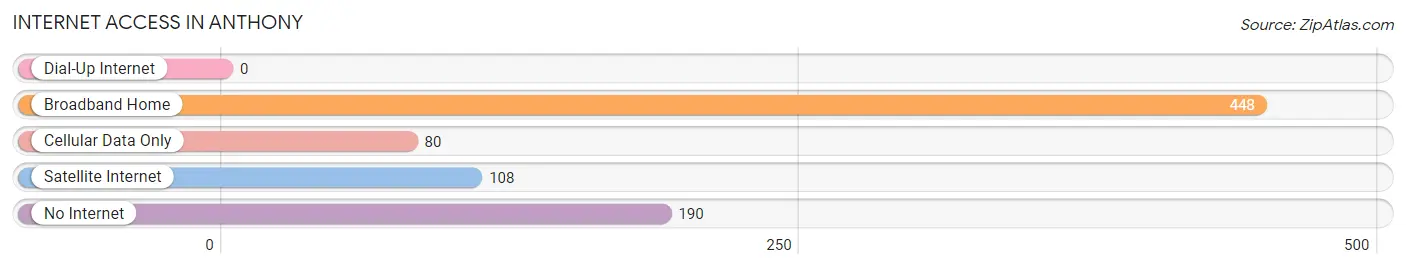
| Internet Type | # Households | % Households |
| Dial-Up Internet | 0 | 0.0% |
| Broadband Home | 448 | 55.9% |
| Cellular Data Only | 80 | 10.0% |
| Satellite Internet | 108 | 13.5% |
| No Internet | 190 | 23.7% |
| Total | 801 | 100.0% |
Anthony Summary
Anthony, Kansas is a small city located in the southwestern corner of the state, near the Oklahoma border. It is the county seat of Harper County and has a population of around 2,500 people. The city was founded in 1879 and was named after Anthony Township, which was named after a local settler, John Anthony.
Geography
Anthony is located in the southwestern corner of Kansas, near the Oklahoma border. It is situated in the High Plains region of the Great Plains, and is part of the Great Bend Prairie. The city is located at an elevation of 1,845 feet (562 m) above sea level. The city is located on the Arkansas River, which is a tributary of the Mississippi River. The city is located in the Central Time Zone.
The climate in Anthony is semi-arid, with hot summers and cold winters. The average annual temperature is around 55°F (13°C). The average annual precipitation is around 20 inches (508 mm).
Economy
The economy of Anthony is largely based on agriculture. The city is home to several large farms, which produce wheat, corn, and other crops. The city is also home to several manufacturing companies, which produce a variety of products, including furniture, clothing, and food products.
The city is also home to several retail stores, restaurants, and other businesses. The city is home to a branch of the Harper County Bank, which provides banking services to the local community.
Demographics
As of the 2010 census, the population of Anthony was 2,521. The racial makeup of the city was 94.3% White, 0.7% African American, 0.3% Native American, 0.2% Asian, 0.1% Pacific Islander, 2.2% from other races, and 2.4% from two or more races. Hispanic or Latino of any race were 4.7% of the population.
The median income for a household in the city was $37,917, and the median income for a family was $45,000. The per capita income for the city was $18,945. About 11.2% of families and 14.2% of the population were below the poverty line, including 19.2% of those under age 18 and 8.2% of those age 65 or over.
Education
Anthony is served by the Anthony-Harper Unified School District, which includes Anthony Elementary School, Anthony Middle School, and Anthony High School. The city is also home to several private schools, including St. Mary's Catholic School and Anthony Christian Academy.
Conclusion
Anthony, Kansas is a small city located in the southwestern corner of the state, near the Oklahoma border. It is the county seat of Harper County and has a population of around 2,500 people. The city was founded in 1879 and was named after Anthony Township, which was named after a local settler, John Anthony. The economy of Anthony is largely based on agriculture, and the city is home to several large farms, manufacturing companies, and other businesses. The population of Anthony is mostly White, with a small percentage of African American, Native American, Asian, and Pacific Islander residents. The city is served by the Anthony-Harper Unified School District, and is home to several private schools.
Common Questions
What is Per Capita Income in Anthony?
Per Capita income in Anthony is $23,675.
What is the Median Family Income in Anthony?
Median Family Income in Anthony is $58,640.
What is the Median Household income in Anthony?
Median Household Income in Anthony is $51,117.
What is Income or Wage Gap in Anthony?
Income or Wage Gap in Anthony is 39.7%.
Women in Anthony earn 60.3 cents for every dollar earned by a man.
What is Family Income Deficit in Anthony?
Family Income Deficit in Anthony is $13,868.
Families that are below poverty line in Anthony earn $13,868 less on average than the poverty threshold level.
What is Inequality or Gini Index in Anthony?
Inequality or Gini Index in Anthony is 0.41.
What is the Total Population of Anthony?
Total Population of Anthony is 2,290.
What is the Total Male Population of Anthony?
Total Male Population of Anthony is 983.
What is the Total Female Population of Anthony?
Total Female Population of Anthony is 1,307.
What is the Ratio of Males per 100 Females in Anthony?
There are 75.21 Males per 100 Females in Anthony.
What is the Ratio of Females per 100 Males in Anthony?
There are 132.96 Females per 100 Males in Anthony.
What is the Median Population Age in Anthony?
Median Population Age in Anthony is 38.4 Years.
What is the Average Family Size in Anthony
Average Family Size in Anthony is 3.6 People.
What is the Average Household Size in Anthony
Average Household Size in Anthony is 2.7 People.
How Large is the Labor Force in Anthony?
There are 953 People in the Labor Forcein in Anthony.
What is the Percentage of People in the Labor Force in Anthony?
56.4% of People are in the Labor Force in Anthony.
What is the Unemployment Rate in Anthony?
Unemployment Rate in Anthony is 9.3%.