Zip Codes with the Highest Percentage of Population Employed in Agriculture, Fishing & Hunting in Hammond, IN
RELATED REPORTS & OPTIONS
Agriculture, Fishing & Hunting
Hammond
Compare Zip Codes
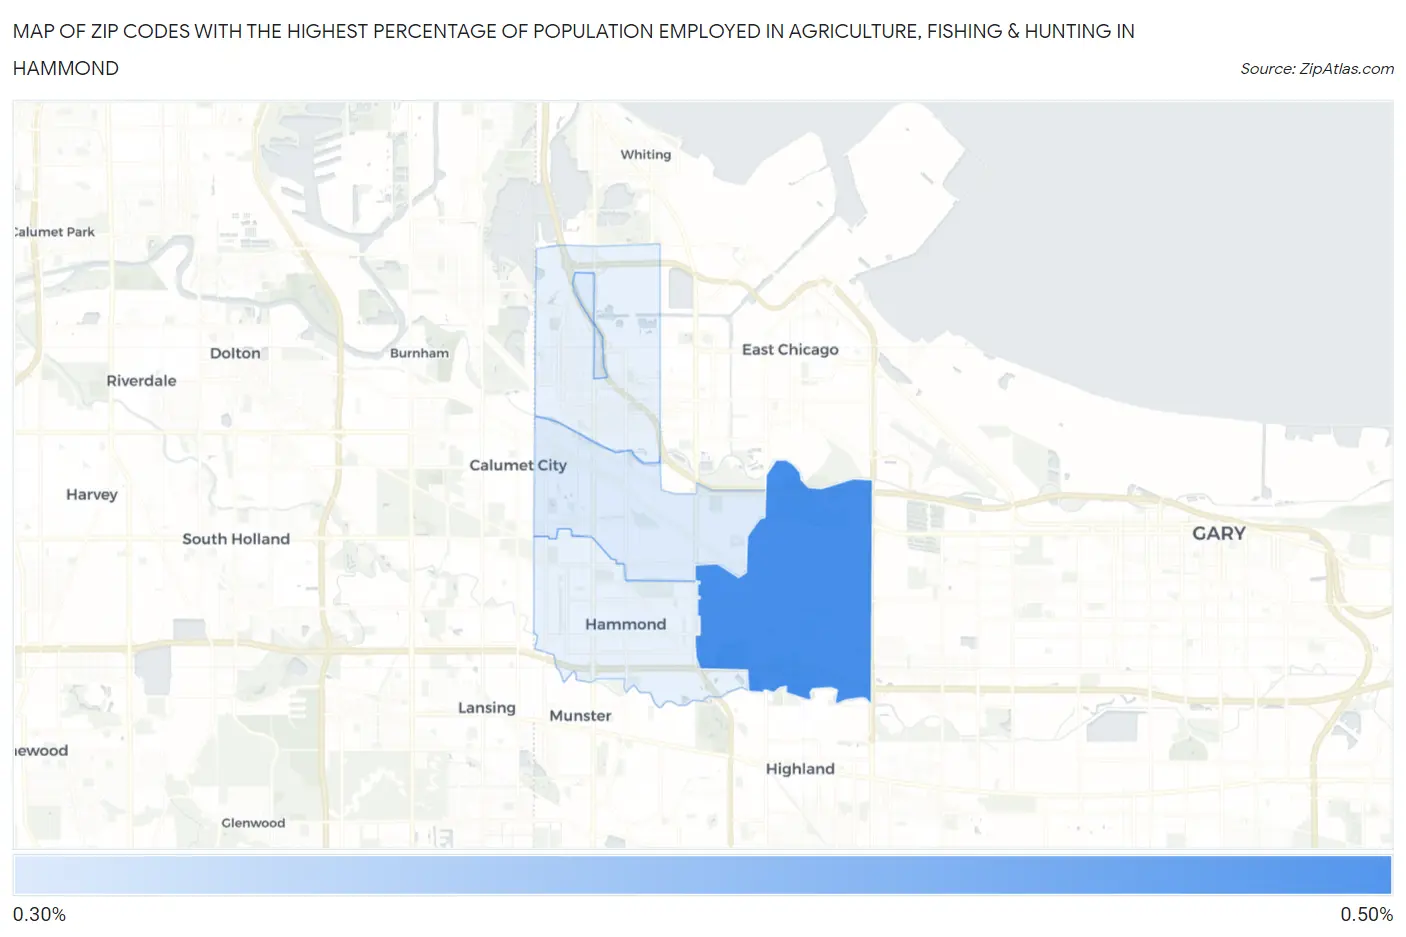
Map of Zip Codes with the Highest Percentage of Population Employed in Agriculture, Fishing & Hunting in Hammond
0.0%
0.50%
Zip Codes with the Highest Percentage of Population Employed in Agriculture, Fishing & Hunting in Hammond, IN
| Zip Code | % Employed | vs State | vs National | |
| 1. | 46323 | 0.45% | 1.1%(-0.610)#482 | 1.2%(-0.752)#19,724 |
| 2. | 46320 | 0.37% | 1.1%(-0.690)#503 | 1.2%(-0.832)#20,468 |
1
Common Questions
What are the Top 3 Zip Codes with the Highest Percentage of Population Employed in Agriculture, Fishing & Hunting in Hammond, IN?
Top 3 Zip Codes with the Highest Percentage of Population Employed in Agriculture, Fishing & Hunting in Hammond, IN are:
What zip code has the Highest Percentage of Population Employed in Agriculture, Fishing & Hunting in Hammond, IN?
46323 has the Highest Percentage of Population Employed in Agriculture, Fishing & Hunting in Hammond, IN with 0.45%.
What is the Percentage of Population Employed in Agriculture, Fishing & Hunting in Hammond, IN?
Percentage of Population Employed in Agriculture, Fishing & Hunting in Hammond is 0.20%.
What is the Percentage of Population Employed in Agriculture, Fishing & Hunting in Indiana?
Percentage of Population Employed in Agriculture, Fishing & Hunting in Indiana is 1.1%.
What is the Percentage of Population Employed in Agriculture, Fishing & Hunting in the United States?
Percentage of Population Employed in Agriculture, Fishing & Hunting in the United States is 1.2%.