Zip Codes with the Highest Percentage of Households Heated by Electricity in Glenview, IL
RELATED REPORTS & OPTIONS
Electrical Heating
Glenview
Compare Zip Codes
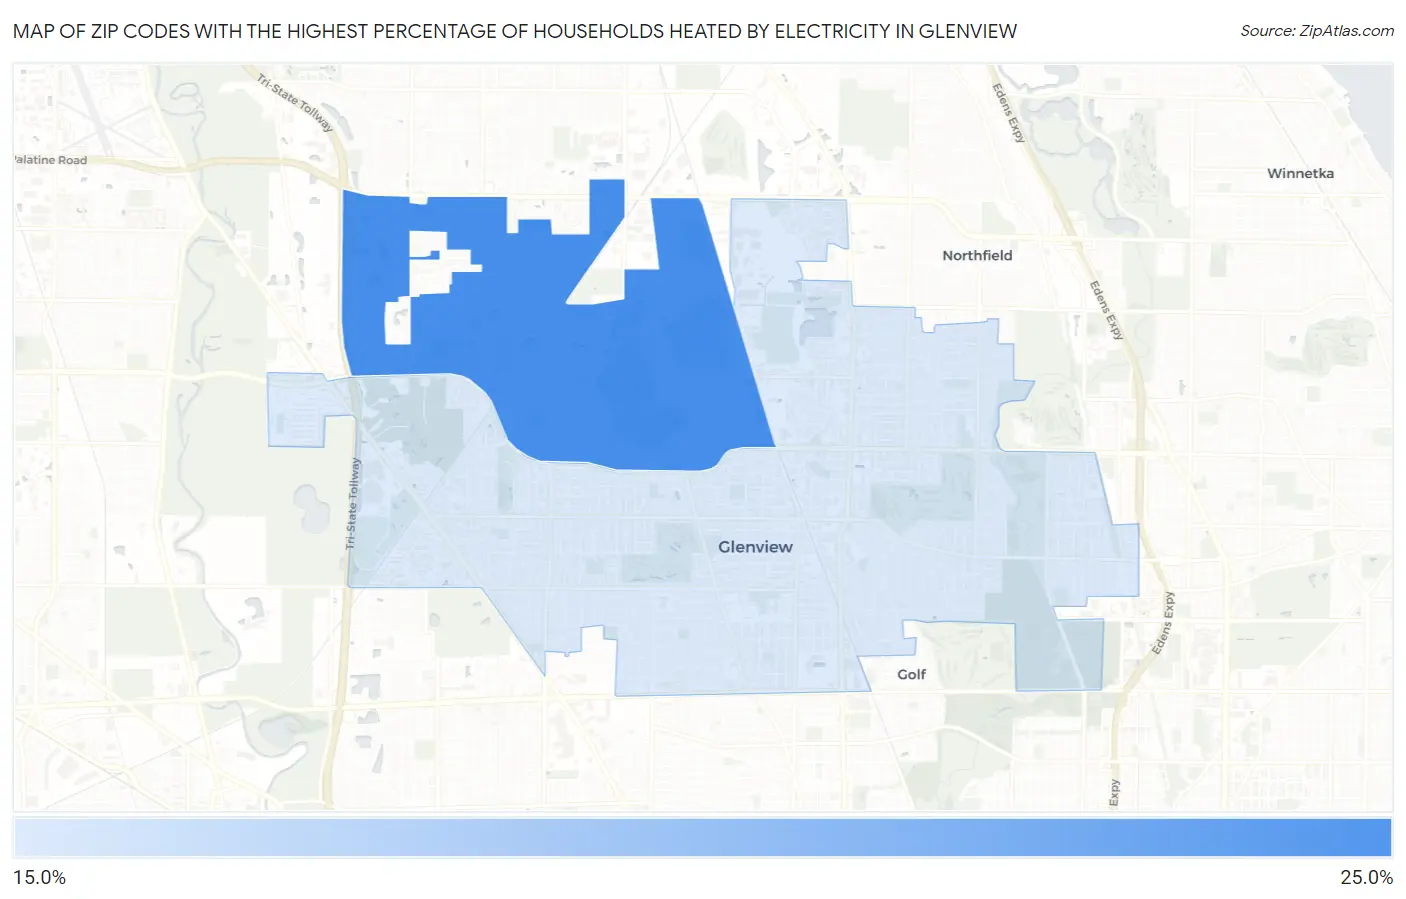
Map of Zip Codes with the Highest Percentage of Households Heated by Electricity in Glenview
20.0%
21.4%
Zip Codes with the Highest Percentage of Households Heated by Electricity in Glenview, IL
| Zip Code | Electrical Heating | vs State | vs National | |
| 1. | 60026 | 21.4% | 17.9%(+3.50)#486 | 40.2%(-18.8)#19,778 |
| 2. | 60025 | 20.0% | 17.9%(+2.10)#550 | 40.2%(-20.2)#20,455 |
1
Common Questions
What are the Top Zip Codes with the Highest Percentage of Households Heated by Electricity in Glenview, IL?
Top Zip Codes with the Highest Percentage of Households Heated by Electricity in Glenview, IL are:
What zip code has the Highest Percentage of Households Heated by Electricity in Glenview, IL?
60026 has the Highest Percentage of Households Heated by Electricity in Glenview, IL with 21.4%.
What is the Percentage of Households Heated by Electricity in Glenview, IL?
Percentage of Households Heated by Electricity in Glenview is 19.5%.
What is the Percentage of Households Heated by Electricity in Illinois?
Percentage of Households Heated by Electricity in Illinois is 17.9%.
What is the Percentage of Households Heated by Electricity in the United States?
Percentage of Households Heated by Electricity in the United States is 40.2%.