Zip Codes with the Highest Percentage of Population Employed in Agriculture, Fishing & Hunting in Des Plaines, IL
RELATED REPORTS & OPTIONS
Agriculture, Fishing & Hunting
Des Plaines
Compare Zip Codes
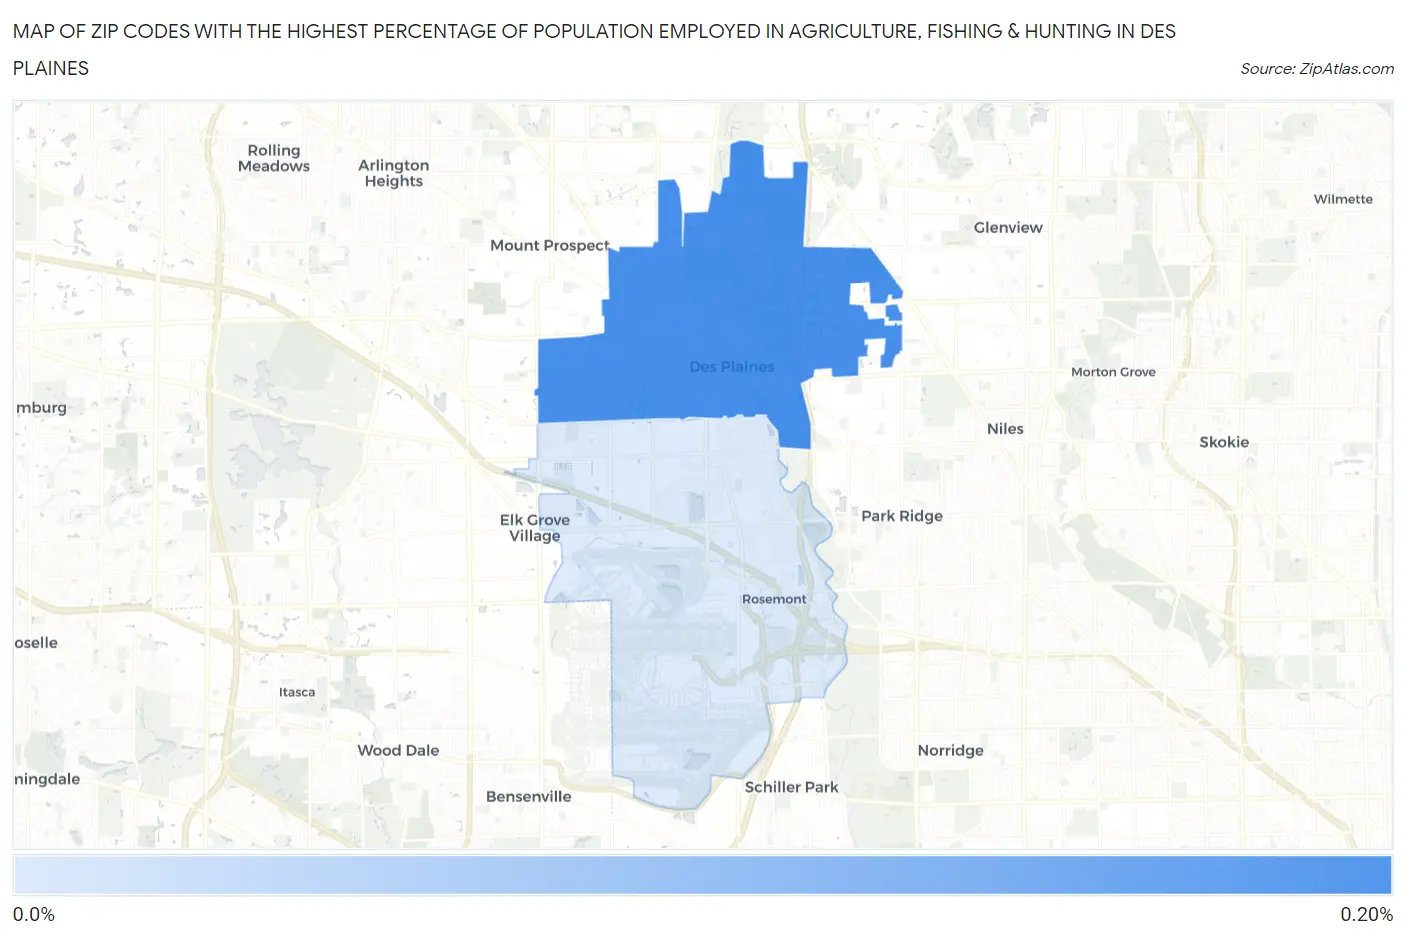
Map of Zip Codes with the Highest Percentage of Population Employed in Agriculture, Fishing & Hunting in Des Plaines
0.0%
0.20%
Zip Codes with the Highest Percentage of Population Employed in Agriculture, Fishing & Hunting in Des Plaines, IL
| Zip Code | % Employed | vs State | vs National | |
| 1. | 60016 | 0.17% | 0.88%(-0.710)#1,045 | 1.2%(-1.03)#22,769 |
| 2. | 60018 | 0.083% | 0.88%(-0.794)#1,097 | 1.2%(-1.12)#23,913 |
1
Common Questions
What are the Top Zip Codes with the Highest Percentage of Population Employed in Agriculture, Fishing & Hunting in Des Plaines, IL?
Top Zip Codes with the Highest Percentage of Population Employed in Agriculture, Fishing & Hunting in Des Plaines, IL are:
What zip code has the Highest Percentage of Population Employed in Agriculture, Fishing & Hunting in Des Plaines, IL?
60016 has the Highest Percentage of Population Employed in Agriculture, Fishing & Hunting in Des Plaines, IL with 0.17%.
What is the Percentage of Population Employed in Agriculture, Fishing & Hunting in Des Plaines, IL?
Percentage of Population Employed in Agriculture, Fishing & Hunting in Des Plaines is 0.18%.
What is the Percentage of Population Employed in Agriculture, Fishing & Hunting in Illinois?
Percentage of Population Employed in Agriculture, Fishing & Hunting in Illinois is 0.88%.
What is the Percentage of Population Employed in Agriculture, Fishing & Hunting in the United States?
Percentage of Population Employed in Agriculture, Fishing & Hunting in the United States is 1.2%.