Zip Codes with the Highest Percentage of Population Employed in Transportation in Belleville, IL
RELATED REPORTS & OPTIONS
Transportation
Belleville
Compare Zip Codes
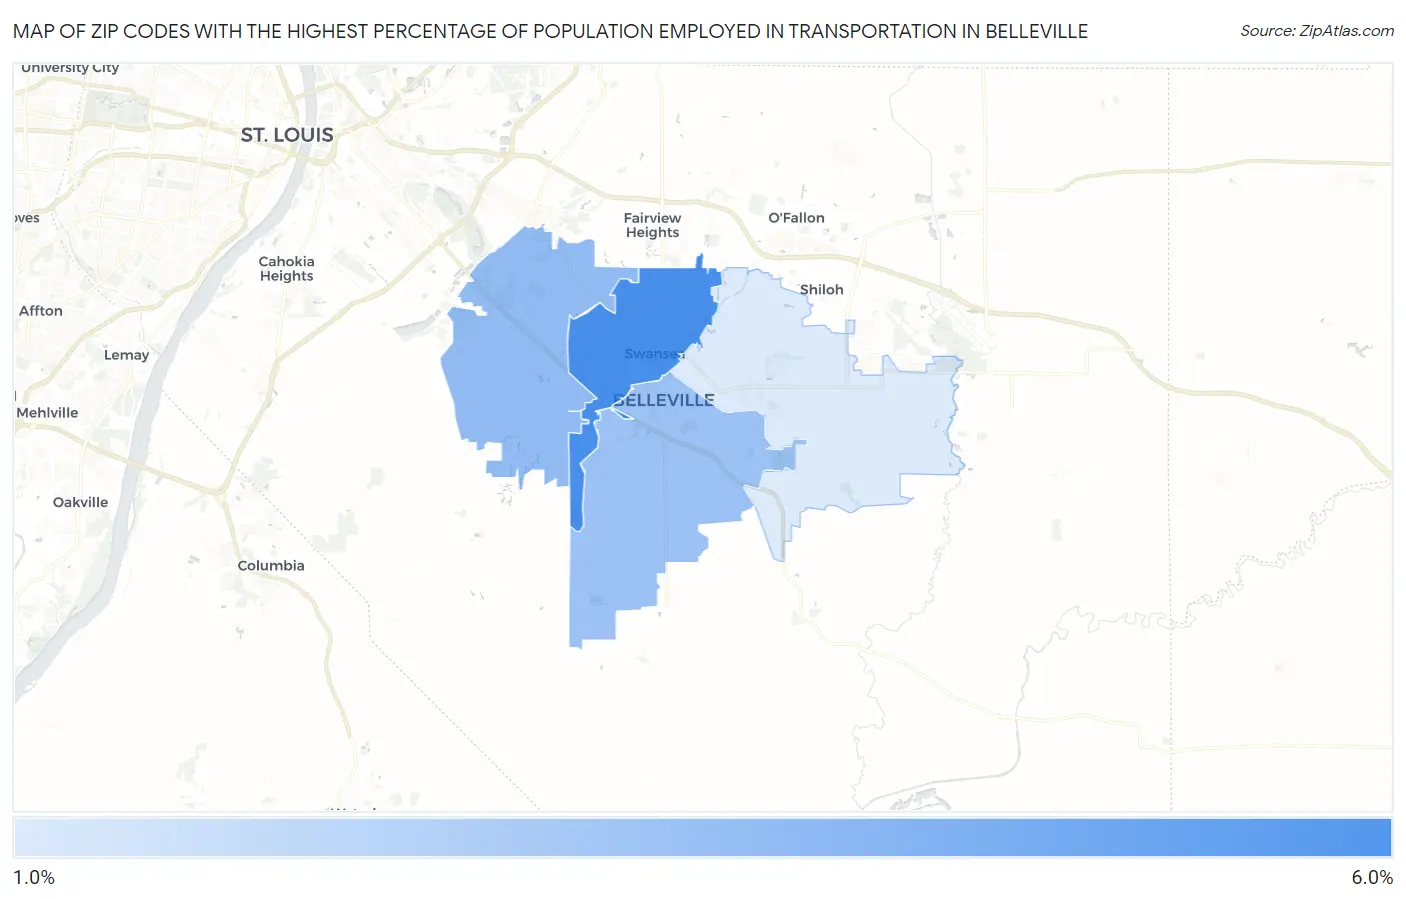
Map of Zip Codes with the Highest Percentage of Population Employed in Transportation in Belleville
0.0%
6.0%
Zip Codes with the Highest Percentage of Population Employed in Transportation in Belleville, IL
| Zip Code | % Employed | vs State | vs National | |
| 1. | 62226 | 5.1% | 4.2%(+0.823)#584 | 3.8%(+1.24)#10,128 |
| 2. | 62223 | 3.5% | 4.2%(-0.700)#890 | 3.8%(-0.284)#16,671 |
| 3. | 62220 | 3.3% | 4.2%(-0.935)#924 | 3.8%(-0.520)#17,834 |
| 4. | 62221 | 1.9% | 4.2%(-2.29)#1,141 | 3.8%(-1.88)#23,876 |
1
Common Questions
What are the Top 3 Zip Codes with the Highest Percentage of Population Employed in Transportation in Belleville, IL?
Top 3 Zip Codes with the Highest Percentage of Population Employed in Transportation in Belleville, IL are:
What zip code has the Highest Percentage of Population Employed in Transportation in Belleville, IL?
62226 has the Highest Percentage of Population Employed in Transportation in Belleville, IL with 5.1%.
What is the Percentage of Population Employed in Transportation in Belleville, IL?
Percentage of Population Employed in Transportation in Belleville is 4.7%.
What is the Percentage of Population Employed in Transportation in Illinois?
Percentage of Population Employed in Transportation in Illinois is 4.2%.
What is the Percentage of Population Employed in Transportation in the United States?
Percentage of Population Employed in Transportation in the United States is 3.8%.