Zip Codes with the Highest Percentage of Population Walking to Work in Belleville, IL
RELATED REPORTS & OPTIONS
Walk to Work
Belleville
Compare Zip Codes
Map of Zip Codes with the Highest Percentage of Population Walking to Work in Belleville
37.1%
63.3%
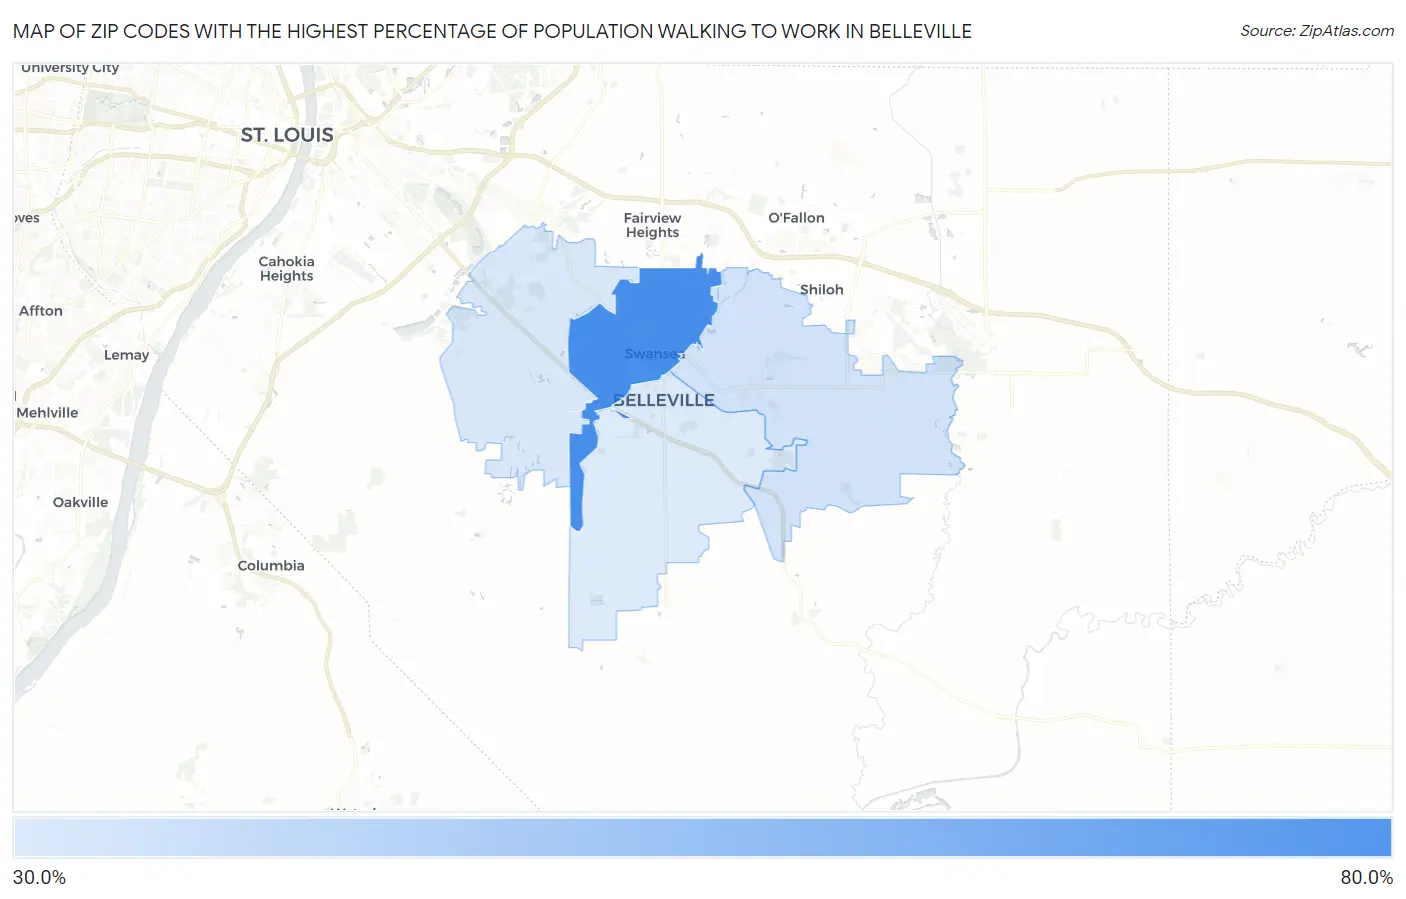
Zip Codes with the Highest Percentage of Population Walking to Work in Belleville, IL
| Zip Code | % Walk to Work | vs State | vs National | |
| 1. | 62226 | 63.3% | 32.8%(+30.5)#36 | 33.4%(+29.9)#758 |
| 2. | 62221 | 38.8% | 32.8%(+6.00)#379 | 33.4%(+5.40)#8,865 |
| 3. | 62223 | 38.0% | 32.8%(+5.20)#389 | 33.4%(+4.60)#9,228 |
| 4. | 62220 | 37.1% | 32.8%(+4.30)#404 | 33.4%(+3.70)#9,642 |
1
Common Questions
What are the Top 3 Zip Codes with the Highest Percentage of Population Walking to Work in Belleville, IL?
Top 3 Zip Codes with the Highest Percentage of Population Walking to Work in Belleville, IL are:
What zip code has the Highest Percentage of Population Walking to Work in Belleville, IL?
62226 has the Highest Percentage of Population Walking to Work in Belleville, IL with 63.3%.
What is the Percentage of Population Walking to Work in Belleville, IL?
Percentage of Population Walking to Work in Belleville is 37.1%.
What is the Percentage of Population Walking to Work in Illinois?
Percentage of Population Walking to Work in Illinois is 32.8%.
What is the Percentage of Population Walking to Work in the United States?
Percentage of Population Walking to Work in the United States is 33.4%.