Zip Codes with the Highest Percentage of Population Employed in Manufacturing in Belleville, IL
RELATED REPORTS & OPTIONS
Manufacturing
Belleville
Compare Zip Codes
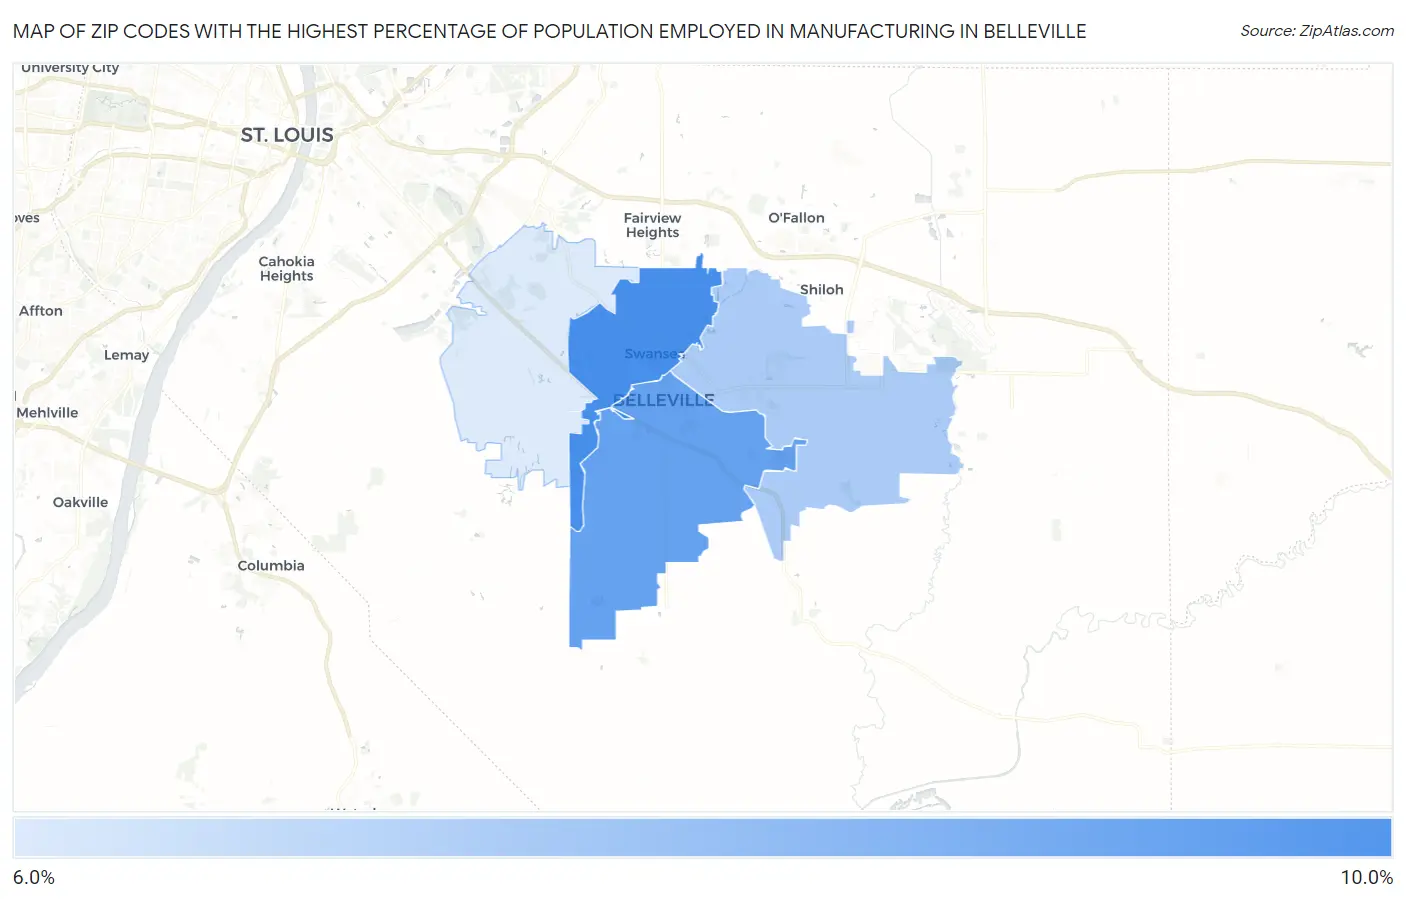
Map of Zip Codes with the Highest Percentage of Population Employed in Manufacturing in Belleville
0.0%
10.0%
Zip Codes with the Highest Percentage of Population Employed in Manufacturing in Belleville, IL
| Zip Code | % Employed | vs State | vs National | |
| 1. | 62226 | 9.5% | 11.6%(-2.15)#947 | 10.0%(-0.495)#16,640 |
| 2. | 62220 | 8.8% | 11.6%(-2.84)#989 | 10.0%(-1.19)#17,763 |
| 3. | 62221 | 7.2% | 11.6%(-4.47)#1,116 | 10.0%(-2.81)#20,639 |
| 4. | 62223 | 6.0% | 11.6%(-5.63)#1,183 | 10.0%(-3.98)#22,725 |
1
Common Questions
What are the Top 3 Zip Codes with the Highest Percentage of Population Employed in Manufacturing in Belleville, IL?
Top 3 Zip Codes with the Highest Percentage of Population Employed in Manufacturing in Belleville, IL are:
What zip code has the Highest Percentage of Population Employed in Manufacturing in Belleville, IL?
62226 has the Highest Percentage of Population Employed in Manufacturing in Belleville, IL with 9.5%.
What is the Percentage of Population Employed in Manufacturing in Belleville, IL?
Percentage of Population Employed in Manufacturing in Belleville is 9.7%.
What is the Percentage of Population Employed in Manufacturing in Illinois?
Percentage of Population Employed in Manufacturing in Illinois is 11.6%.
What is the Percentage of Population Employed in Manufacturing in the United States?
Percentage of Population Employed in Manufacturing in the United States is 10.0%.