Zip Codes with the Highest Percentage of Population Working from Home in Warner Robins, GA
RELATED REPORTS & OPTIONS
Work from Home
Warner Robins
Compare Zip Codes
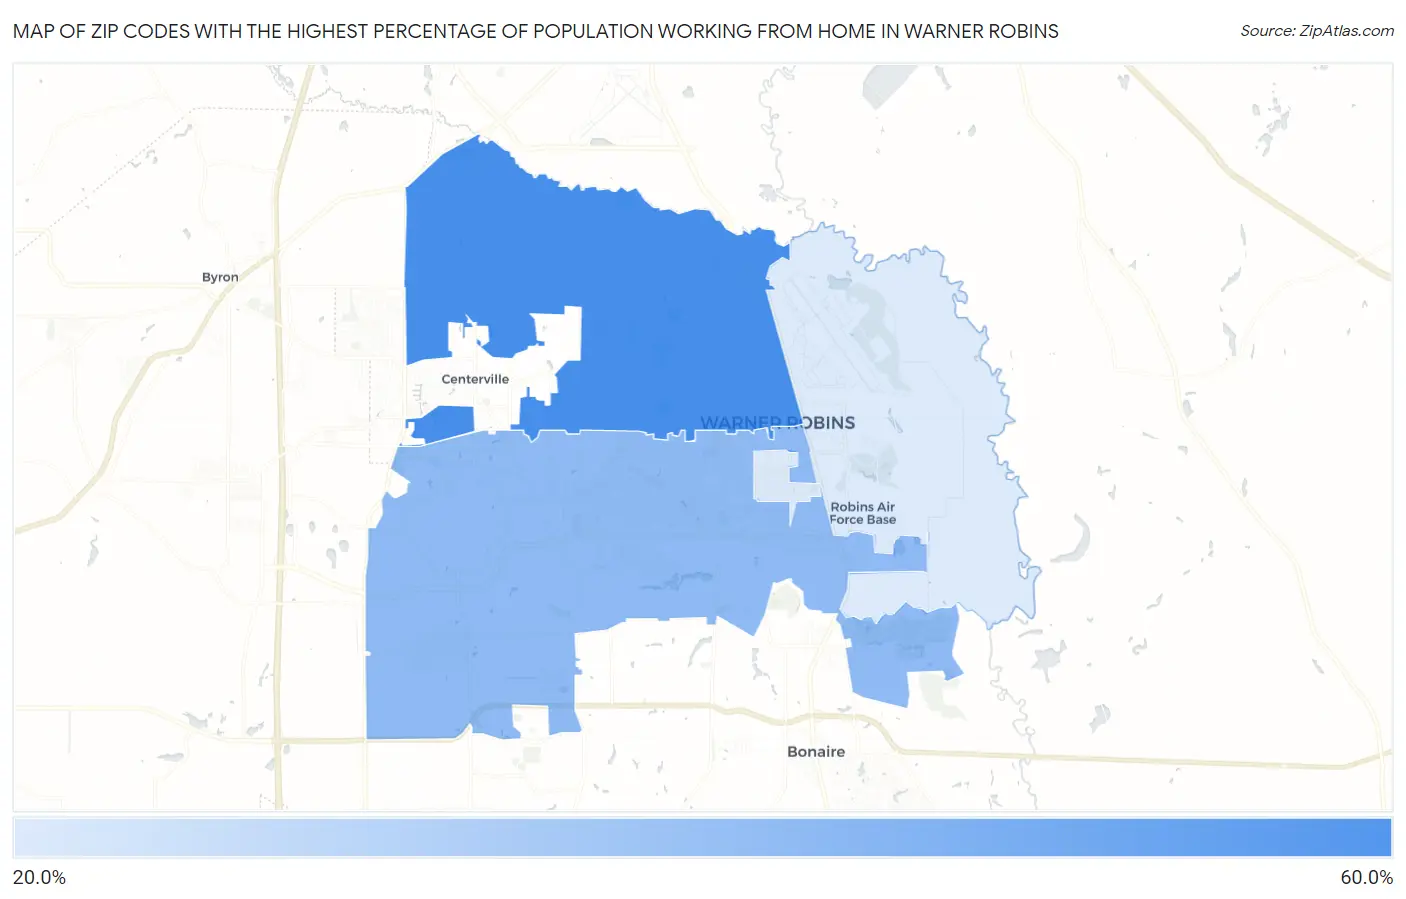
Map of Zip Codes with the Highest Percentage of Population Working from Home in Warner Robins
29.5%
51.5%
Zip Codes with the Highest Percentage of Population Working from Home in Warner Robins, GA
| Zip Code | % Work from Home | vs State | vs National | |
| 1. | 31093 | 51.5% | 44.4%(+7.10)#119 | 44.0%(+7.50)#7,071 |
| 2. | 31088 | 40.7% | 44.4%(-3.70)#409 | 44.0%(-3.30)#18,989 |
| 3. | 31098 | 29.5% | 44.4%(-14.9)#532 | 44.0%(-14.5)#23,978 |
1
Common Questions
What are the Top Zip Codes with the Highest Percentage of Population Working from Home in Warner Robins, GA?
Top Zip Codes with the Highest Percentage of Population Working from Home in Warner Robins, GA are:
What zip code has the Highest Percentage of Population Working from Home in Warner Robins, GA?
31093 has the Highest Percentage of Population Working from Home in Warner Robins, GA with 51.5%.
What is the Percentage of Population Working from Home in Warner Robins, GA?
Percentage of Population Working from Home in Warner Robins is 40.4%.
What is the Percentage of Population Working from Home in Georgia?
Percentage of Population Working from Home in Georgia is 44.4%.
What is the Percentage of Population Working from Home in the United States?
Percentage of Population Working from Home in the United States is 44.0%.