Zip Codes with the Highest Percentage of Population Employed in Agriculture, Fishing & Hunting in Norwalk, CT
RELATED REPORTS & OPTIONS
Agriculture, Fishing & Hunting
Norwalk
Compare Zip Codes
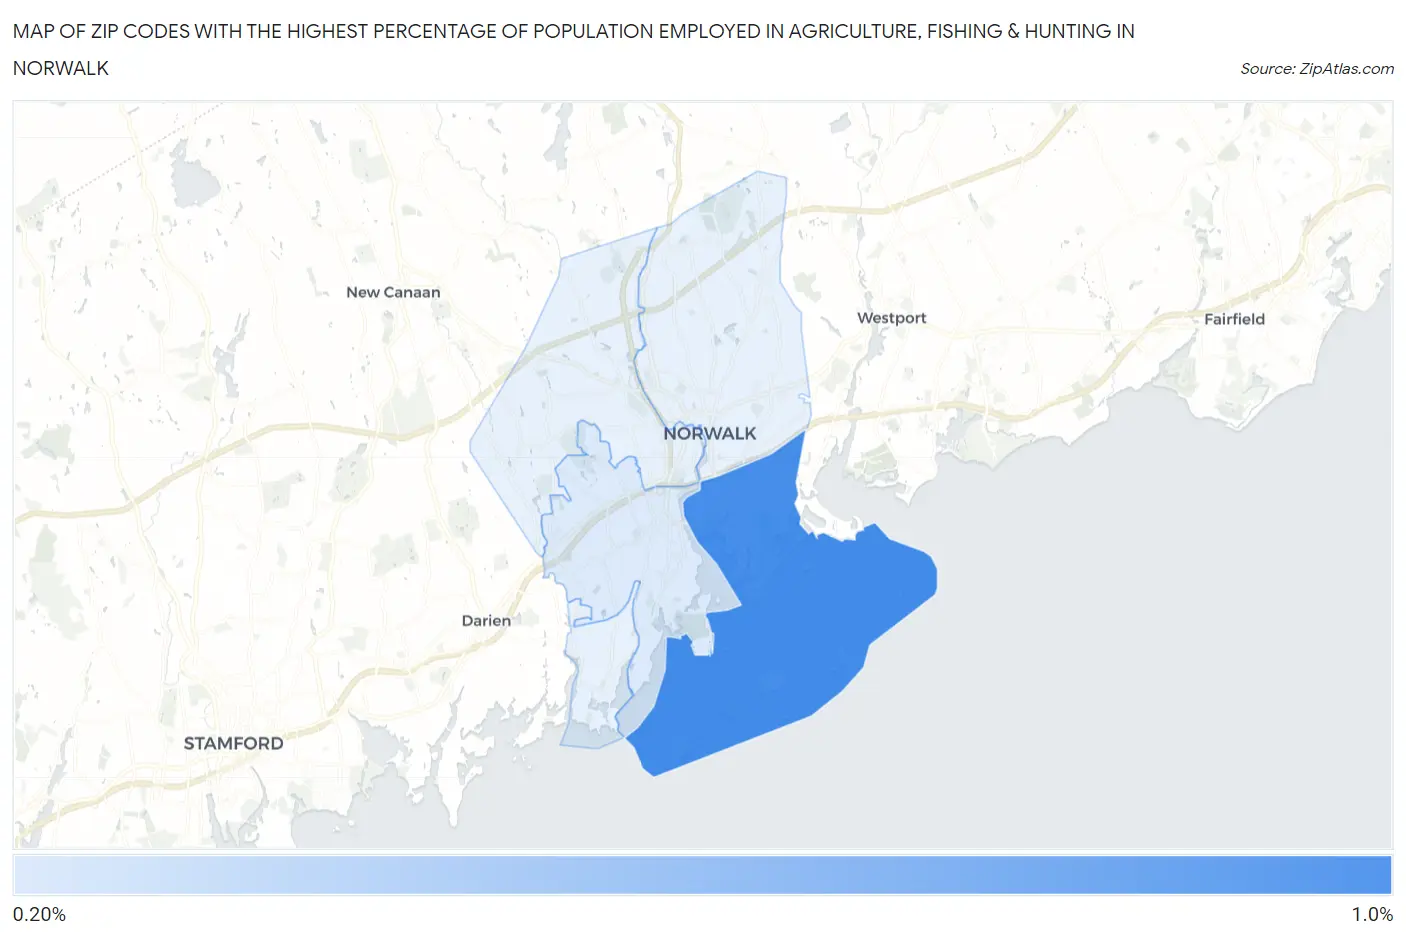
Map of Zip Codes with the Highest Percentage of Population Employed in Agriculture, Fishing & Hunting in Norwalk
0.0%
1.0%
Zip Codes with the Highest Percentage of Population Employed in Agriculture, Fishing & Hunting in Norwalk, CT
| Zip Code | % Employed | vs State | vs National | |
| 1. | 06855 | 0.82% | 0.36%(+0.467)#59 | 1.2%(-0.375)#17,112 |
| 2. | 06854 | 0.28% | 0.36%(-0.075)#110 | 1.2%(-0.917)#21,386 |
1
Common Questions
What are the Top 3 Zip Codes with the Highest Percentage of Population Employed in Agriculture, Fishing & Hunting in Norwalk, CT?
Top 3 Zip Codes with the Highest Percentage of Population Employed in Agriculture, Fishing & Hunting in Norwalk, CT are:
What zip code has the Highest Percentage of Population Employed in Agriculture, Fishing & Hunting in Norwalk, CT?
06855 has the Highest Percentage of Population Employed in Agriculture, Fishing & Hunting in Norwalk, CT with 0.82%.
What is the Percentage of Population Employed in Agriculture, Fishing & Hunting in Norwalk, CT?
Percentage of Population Employed in Agriculture, Fishing & Hunting in Norwalk is 0.17%.
What is the Percentage of Population Employed in Agriculture, Fishing & Hunting in Connecticut?
Percentage of Population Employed in Agriculture, Fishing & Hunting in Connecticut is 0.36%.
What is the Percentage of Population Employed in Agriculture, Fishing & Hunting in the United States?
Percentage of Population Employed in Agriculture, Fishing & Hunting in the United States is 1.2%.