Zip Codes with the Highest Percentage of Population Employed in Agriculture, Fishing & Hunting in Milford, CT
RELATED REPORTS & OPTIONS
Agriculture, Fishing & Hunting
Milford
Compare Zip Codes
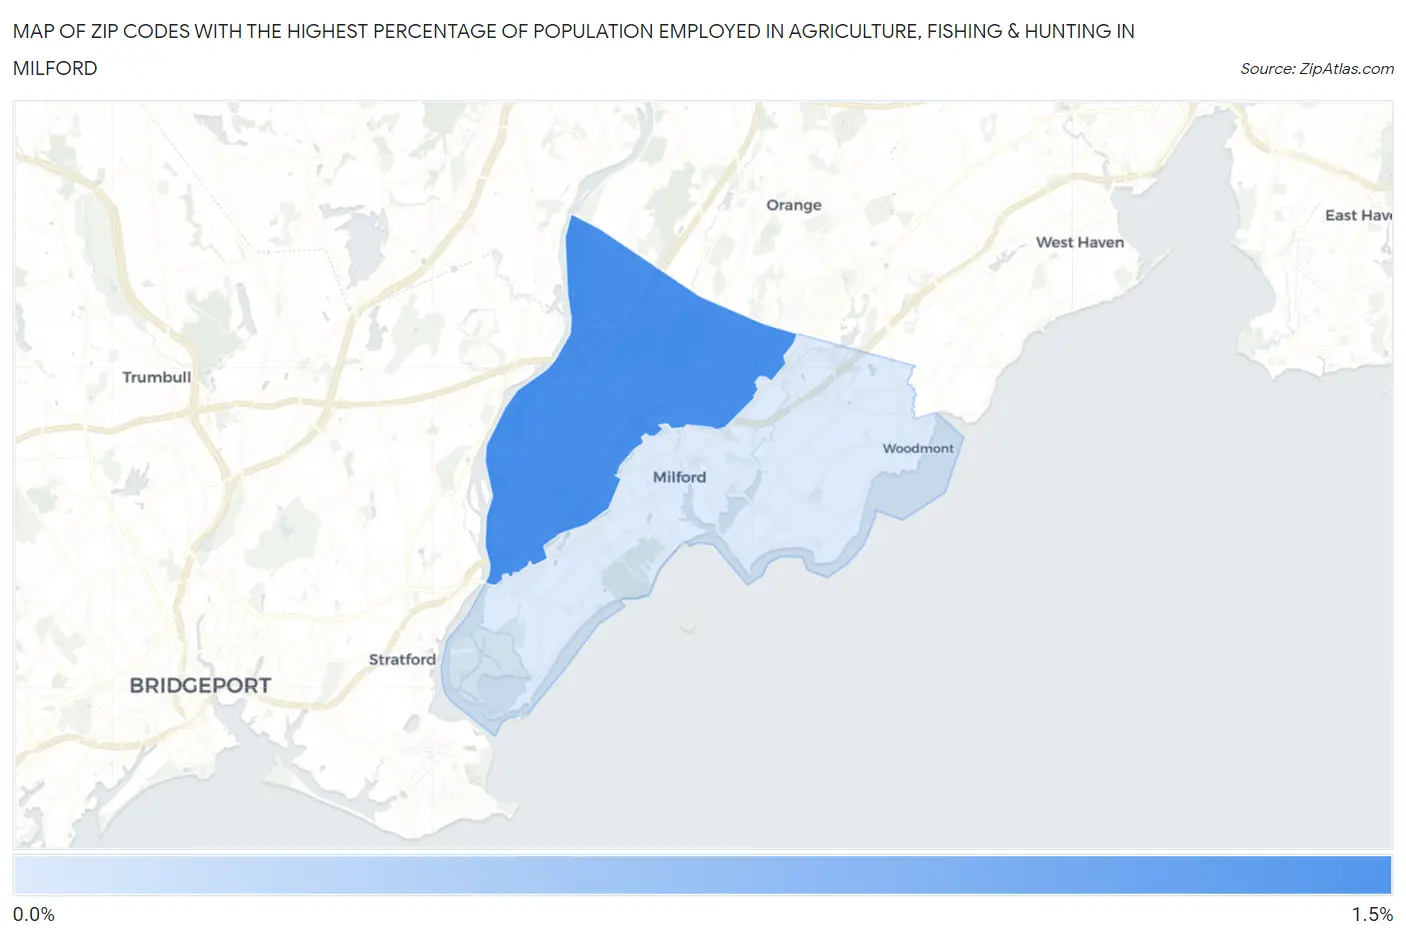
Map of Zip Codes with the Highest Percentage of Population Employed in Agriculture, Fishing & Hunting in Milford
0.43%
1.1%
Zip Codes with the Highest Percentage of Population Employed in Agriculture, Fishing & Hunting in Milford, CT
| Zip Code | % Employed | vs State | vs National | |
| 1. | 06461 | 1.1% | 0.36%(+0.700)#47 | 1.2%(-0.143)#15,984 |
| 2. | 06460 | 0.43% | 0.36%(+0.078)#90 | 1.2%(-0.765)#19,846 |
1
Common Questions
What are the Top Zip Codes with the Highest Percentage of Population Employed in Agriculture, Fishing & Hunting in Milford, CT?
Top Zip Codes with the Highest Percentage of Population Employed in Agriculture, Fishing & Hunting in Milford, CT are:
What zip code has the Highest Percentage of Population Employed in Agriculture, Fishing & Hunting in Milford, CT?
06461 has the Highest Percentage of Population Employed in Agriculture, Fishing & Hunting in Milford, CT with 1.1%.
What is the Percentage of Population Employed in Agriculture, Fishing & Hunting in Connecticut?
Percentage of Population Employed in Agriculture, Fishing & Hunting in Connecticut is 0.36%.
What is the Percentage of Population Employed in Agriculture, Fishing & Hunting in the United States?
Percentage of Population Employed in Agriculture, Fishing & Hunting in the United States is 1.2%.