Zip Codes with the Highest Percentage of Population Employed in Agriculture, Fishing & Hunting in Longmont, CO
RELATED REPORTS & OPTIONS
Agriculture, Fishing & Hunting
Longmont
Compare Zip Codes
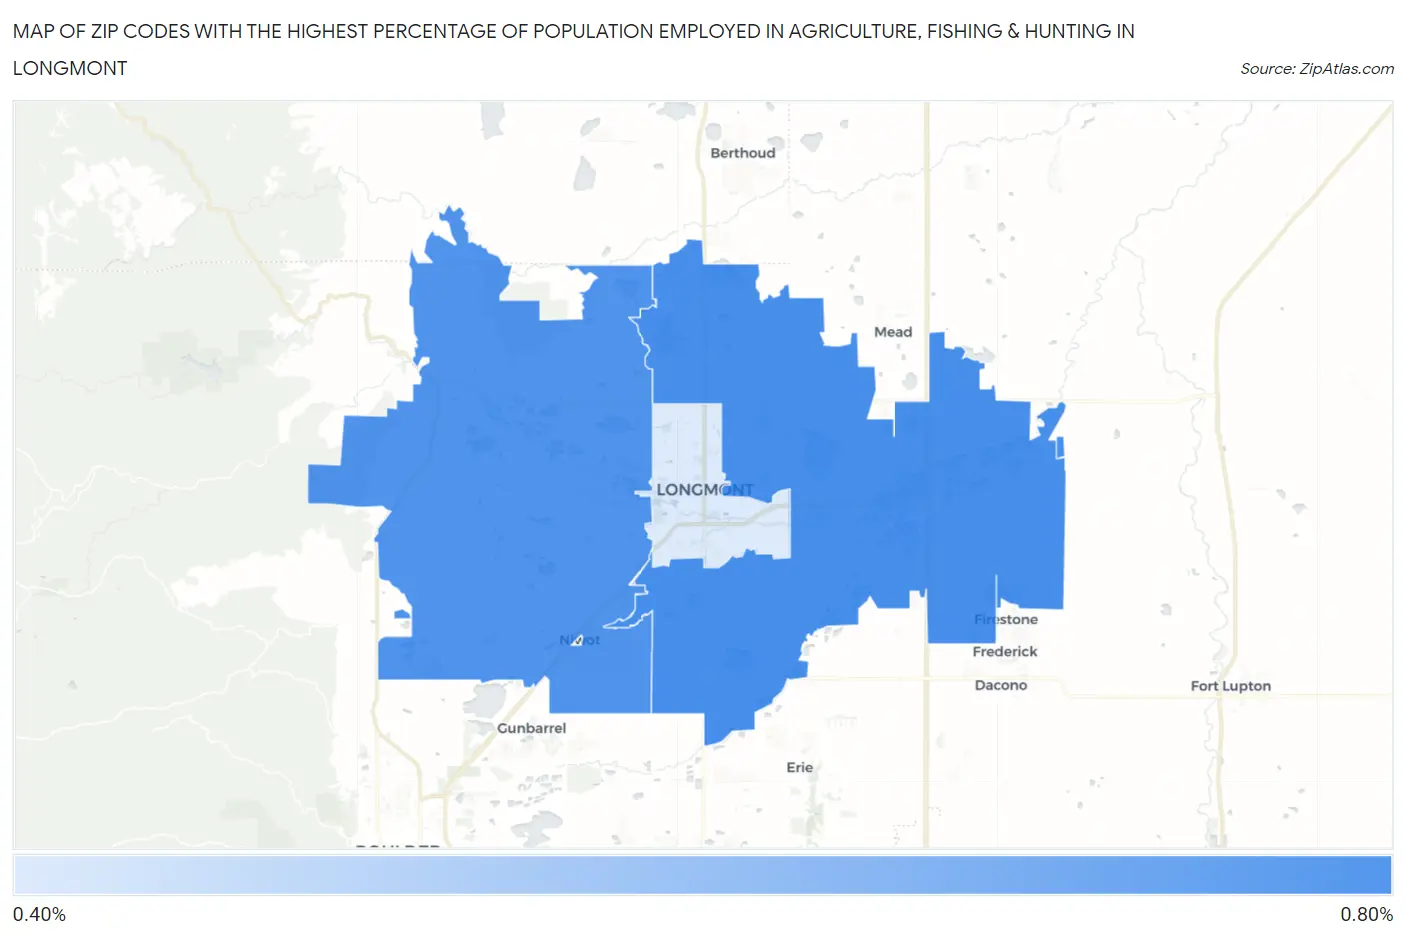
Map of Zip Codes with the Highest Percentage of Population Employed in Agriculture, Fishing & Hunting in Longmont
0.0%
0.80%
Zip Codes with the Highest Percentage of Population Employed in Agriculture, Fishing & Hunting in Longmont, CO
| Zip Code | % Employed | vs State | vs National | |
| 1. | 80504 | 0.78% | 1.1%(-0.364)#299 | 1.2%(-0.416)#17,348 |
| 2. | 80503 | 0.77% | 1.1%(-0.376)#303 | 1.2%(-0.428)#17,410 |
| 3. | 80501 | 0.49% | 1.1%(-0.658)#334 | 1.2%(-0.710)#19,375 |
1
Common Questions
What are the Top Zip Codes with the Highest Percentage of Population Employed in Agriculture, Fishing & Hunting in Longmont, CO?
Top Zip Codes with the Highest Percentage of Population Employed in Agriculture, Fishing & Hunting in Longmont, CO are:
What zip code has the Highest Percentage of Population Employed in Agriculture, Fishing & Hunting in Longmont, CO?
80504 has the Highest Percentage of Population Employed in Agriculture, Fishing & Hunting in Longmont, CO with 0.78%.
What is the Percentage of Population Employed in Agriculture, Fishing & Hunting in Longmont, CO?
Percentage of Population Employed in Agriculture, Fishing & Hunting in Longmont is 0.37%.
What is the Percentage of Population Employed in Agriculture, Fishing & Hunting in Colorado?
Percentage of Population Employed in Agriculture, Fishing & Hunting in Colorado is 1.1%.
What is the Percentage of Population Employed in Agriculture, Fishing & Hunting in the United States?
Percentage of Population Employed in Agriculture, Fishing & Hunting in the United States is 1.2%.