Zip Codes with the Highest Percentage of Population Employed in Professional & Scientific Services in San Clemente, CA
RELATED REPORTS & OPTIONS
Professional & Scientific Services
San Clemente
Compare Zip Codes
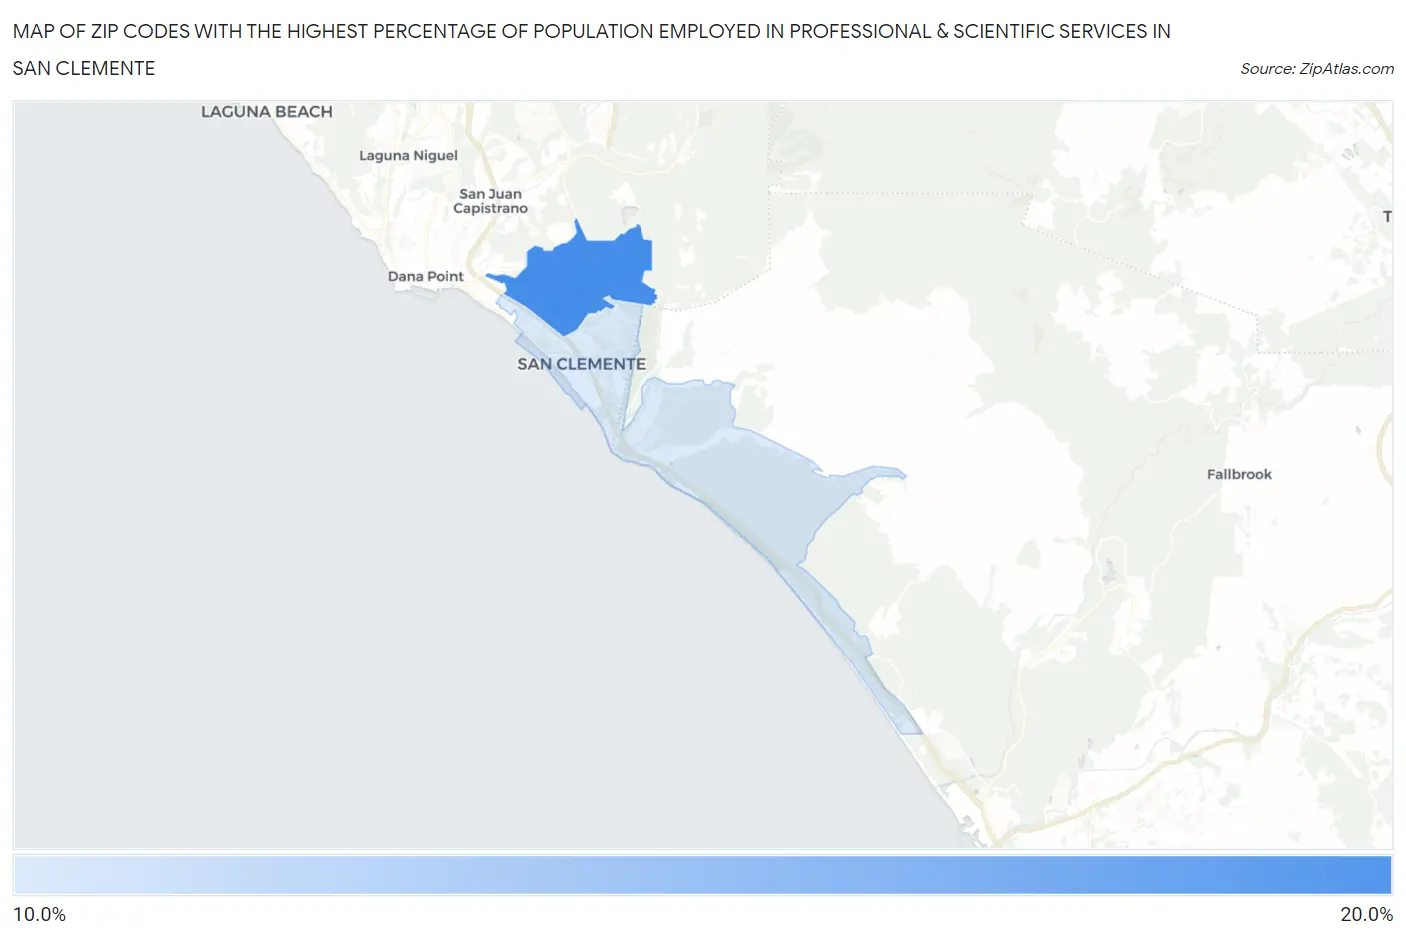
Map of Zip Codes with the Highest Percentage of Population Employed in Professional & Scientific Services in San Clemente
11.3%
16.4%
Zip Codes with the Highest Percentage of Population Employed in Professional & Scientific Services in San Clemente, CA
| Zip Code | % Employed | vs State | vs National | |
| 1. | 92673 | 16.4% | 9.4%(+6.93)#254 | 7.8%(+8.52)#1,526 |
| 2. | 92672 | 11.3% | 9.4%(+1.89)#447 | 7.8%(+3.48)#3,626 |
1
Common Questions
What are the Top Zip Codes with the Highest Percentage of Population Employed in Professional & Scientific Services in San Clemente, CA?
Top Zip Codes with the Highest Percentage of Population Employed in Professional & Scientific Services in San Clemente, CA are:
What zip code has the Highest Percentage of Population Employed in Professional & Scientific Services in San Clemente, CA?
92673 has the Highest Percentage of Population Employed in Professional & Scientific Services in San Clemente, CA with 16.4%.
What is the Percentage of Population Employed in Professional & Scientific Services in San Clemente, CA?
Percentage of Population Employed in Professional & Scientific Services in San Clemente is 13.9%.
What is the Percentage of Population Employed in Professional & Scientific Services in California?
Percentage of Population Employed in Professional & Scientific Services in California is 9.4%.
What is the Percentage of Population Employed in Professional & Scientific Services in the United States?
Percentage of Population Employed in Professional & Scientific Services in the United States is 7.8%.