Zip Codes with the Highest Percentage of Population Employed in Farming, Fishing & Forestry in Madera, CA
RELATED REPORTS & OPTIONS
Farming, Fishing & Forestry
Madera
Compare Zip Codes
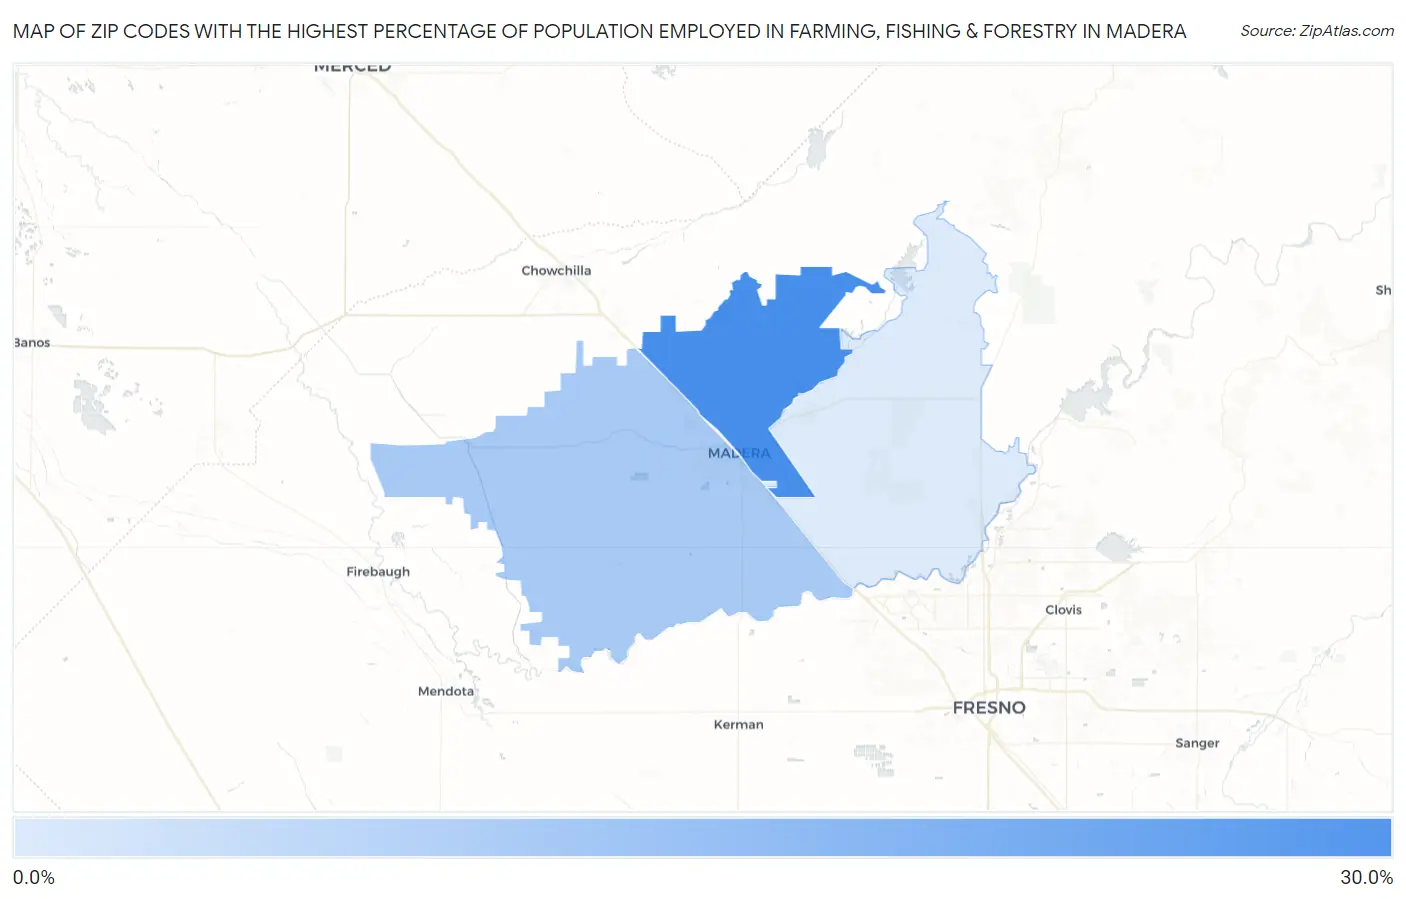
Map of Zip Codes with the Highest Percentage of Population Employed in Farming, Fishing & Forestry in Madera
0.0%
30.0%
Zip Codes with the Highest Percentage of Population Employed in Farming, Fishing & Forestry in Madera, CA
| Zip Code | % Employed | vs State | vs National | |
| 1. | 93638 | 25.1% | 1.4%(+23.7)#58 | 0.61%(+24.5)#282 |
| 2. | 93637 | 8.9% | 1.4%(+7.53)#168 | 0.61%(+8.33)#1,416 |
| 3. | 93636 | 0.96% | 1.4%(-0.449)#510 | 0.61%(+0.356)#9,924 |
1
Common Questions
What are the Top Zip Codes with the Highest Percentage of Population Employed in Farming, Fishing & Forestry in Madera, CA?
Top Zip Codes with the Highest Percentage of Population Employed in Farming, Fishing & Forestry in Madera, CA are:
What zip code has the Highest Percentage of Population Employed in Farming, Fishing & Forestry in Madera, CA?
93638 has the Highest Percentage of Population Employed in Farming, Fishing & Forestry in Madera, CA with 25.1%.
What is the Percentage of Population Employed in Farming, Fishing & Forestry in Madera, CA?
Percentage of Population Employed in Farming, Fishing & Forestry in Madera is 20.4%.
What is the Percentage of Population Employed in Farming, Fishing & Forestry in California?
Percentage of Population Employed in Farming, Fishing & Forestry in California is 1.4%.
What is the Percentage of Population Employed in Farming, Fishing & Forestry in the United States?
Percentage of Population Employed in Farming, Fishing & Forestry in the United States is 0.61%.