Zip Codes with the Highest Percentage of Population Employed in Legal Services & Support in Mesa, AZ
RELATED REPORTS & OPTIONS
Legal Services & Support
Mesa
Compare Zip Codes
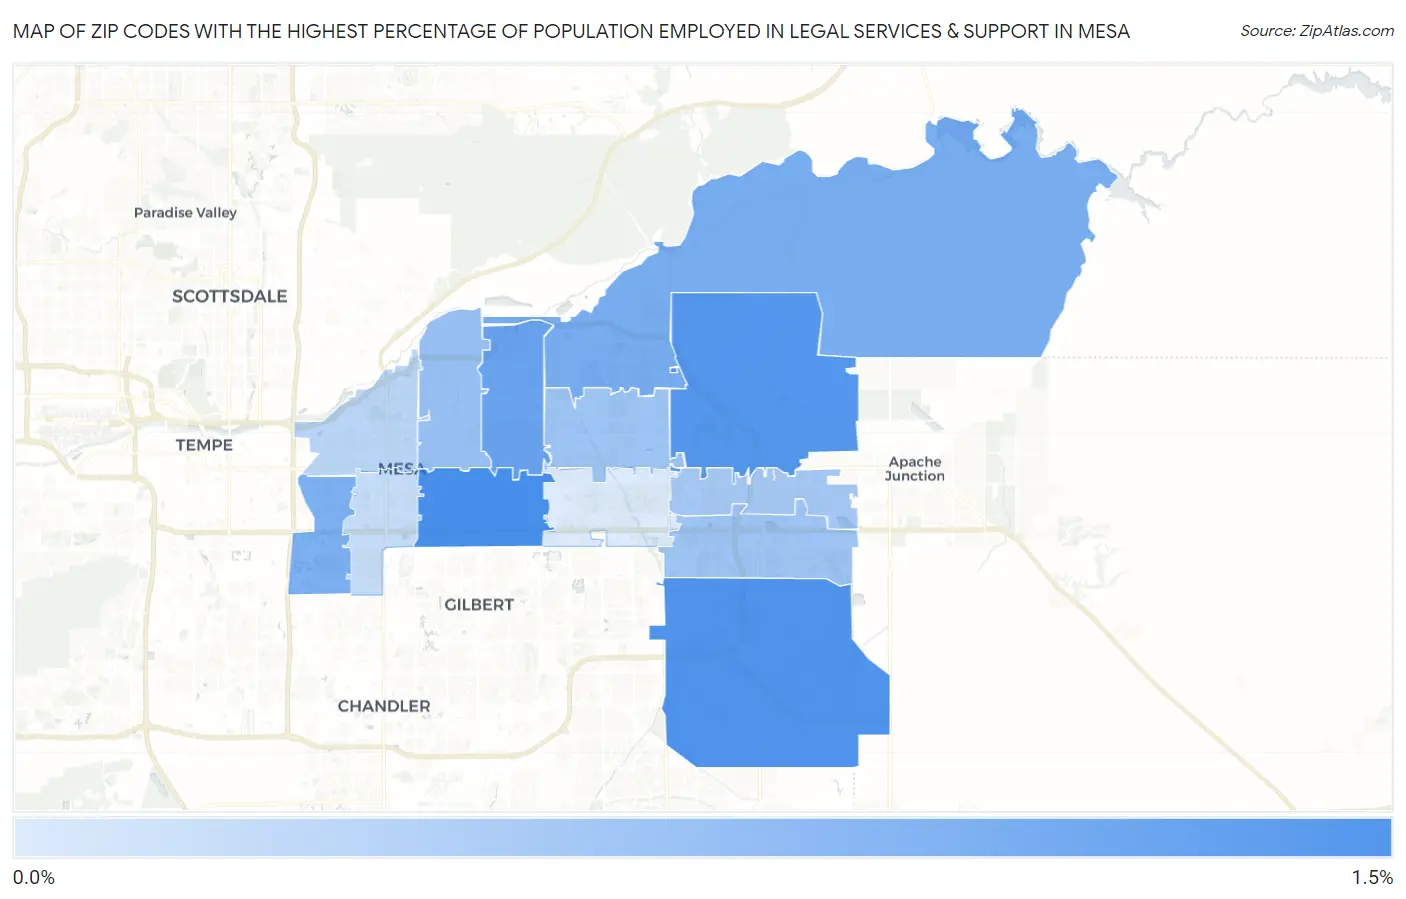
Map of Zip Codes with the Highest Percentage of Population Employed in Legal Services & Support in Mesa
0.11%
1.2%
Zip Codes with the Highest Percentage of Population Employed in Legal Services & Support in Mesa, AZ
| Zip Code | % Employed | vs State | vs National | |
| 1. | 85204 | 1.2% | 0.99%(+0.216)#84 | 1.2%(+0.018)#6,487 |
| 2. | 85212 | 1.1% | 0.99%(+0.154)#89 | 1.2%(-0.044)#6,884 |
| 3. | 85207 | 1.1% | 0.99%(+0.118)#92 | 1.2%(-0.080)#7,145 |
| 4. | 85213 | 0.97% | 0.99%(-0.019)#110 | 1.2%(-0.216)#8,058 |
| 5. | 85215 | 0.84% | 0.99%(-0.144)#127 | 1.2%(-0.342)#9,091 |
| 6. | 85202 | 0.82% | 0.99%(-0.169)#135 | 1.2%(-0.367)#9,299 |
| 7. | 85203 | 0.62% | 0.99%(-0.364)#163 | 1.2%(-0.562)#11,223 |
| 8. | 85209 | 0.57% | 0.99%(-0.417)#170 | 1.2%(-0.614)#11,832 |
| 9. | 85205 | 0.56% | 0.99%(-0.423)#171 | 1.2%(-0.621)#11,906 |
| 10. | 85208 | 0.52% | 0.99%(-0.469)#176 | 1.2%(-0.667)#12,407 |
| 11. | 85201 | 0.36% | 0.99%(-0.626)#205 | 1.2%(-0.824)#14,330 |
| 12. | 85210 | 0.28% | 0.99%(-0.711)#215 | 1.2%(-0.909)#15,321 |
| 13. | 85206 | 0.11% | 0.99%(-0.872)#231 | 1.2%(-1.07)#17,013 |
1
Common Questions
What are the Top 10 Zip Codes with the Highest Percentage of Population Employed in Legal Services & Support in Mesa, AZ?
Top 10 Zip Codes with the Highest Percentage of Population Employed in Legal Services & Support in Mesa, AZ are:
What zip code has the Highest Percentage of Population Employed in Legal Services & Support in Mesa, AZ?
85204 has the Highest Percentage of Population Employed in Legal Services & Support in Mesa, AZ with 1.2%.
What is the Percentage of Population Employed in Legal Services & Support in Mesa, AZ?
Percentage of Population Employed in Legal Services & Support in Mesa is 0.75%.
What is the Percentage of Population Employed in Legal Services & Support in Arizona?
Percentage of Population Employed in Legal Services & Support in Arizona is 0.99%.
What is the Percentage of Population Employed in Legal Services & Support in the United States?
Percentage of Population Employed in Legal Services & Support in the United States is 1.2%.