Zip Codes with the Highest Percentage of Population Employed in Legal Services & Support in Green Valley, AZ
RELATED REPORTS & OPTIONS
Legal Services & Support
Green Valley
Compare Zip Codes
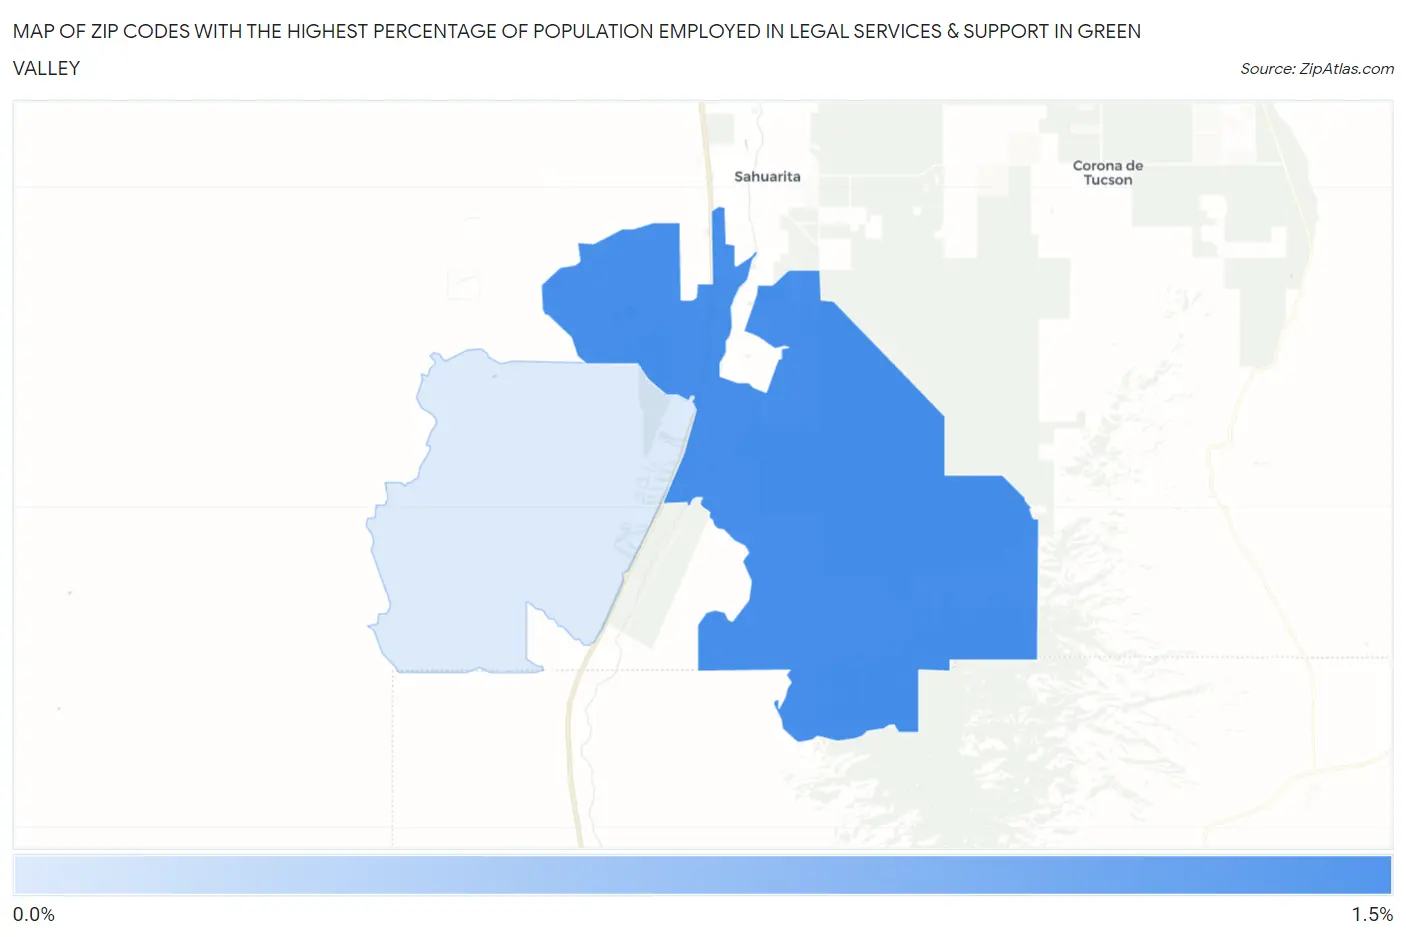
Map of Zip Codes with the Highest Percentage of Population Employed in Legal Services & Support in Green Valley
0.46%
1.2%
Zip Codes with the Highest Percentage of Population Employed in Legal Services & Support in Green Valley, AZ
| Zip Code | % Employed | vs State | vs National | |
| 1. | 85614 | 1.2% | 0.99%(+0.200)#85 | 1.2%(+0.002)#6,601 |
| 2. | 85622 | 0.46% | 0.99%(-0.526)#187 | 1.2%(-0.724)#13,133 |
1
Common Questions
What are the Top Zip Codes with the Highest Percentage of Population Employed in Legal Services & Support in Green Valley, AZ?
Top Zip Codes with the Highest Percentage of Population Employed in Legal Services & Support in Green Valley, AZ are:
What zip code has the Highest Percentage of Population Employed in Legal Services & Support in Green Valley, AZ?
85614 has the Highest Percentage of Population Employed in Legal Services & Support in Green Valley, AZ with 1.2%.
What is the Percentage of Population Employed in Legal Services & Support in Green Valley, AZ?
Percentage of Population Employed in Legal Services & Support in Green Valley is 1.0%.
What is the Percentage of Population Employed in Legal Services & Support in Arizona?
Percentage of Population Employed in Legal Services & Support in Arizona is 0.99%.
What is the Percentage of Population Employed in Legal Services & Support in the United States?
Percentage of Population Employed in Legal Services & Support in the United States is 1.2%.