Zip Codes with the Highest Percentage of Population Employed in Agriculture, Fishing & Hunting in Peoria, AZ
RELATED REPORTS & OPTIONS
Agriculture, Fishing & Hunting
Peoria
Compare Zip Codes
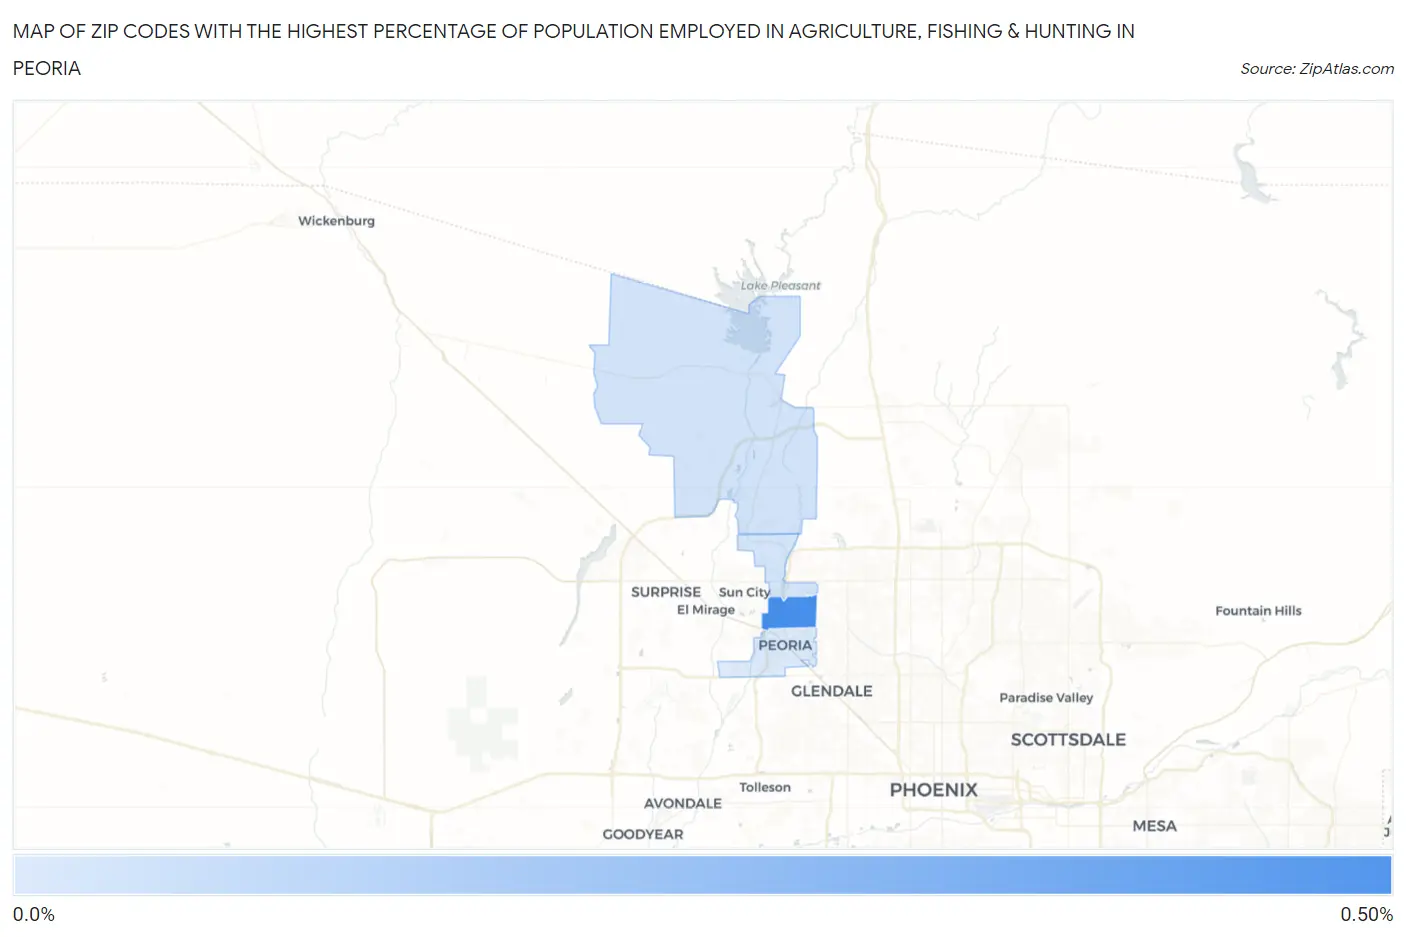
Map of Zip Codes with the Highest Percentage of Population Employed in Agriculture, Fishing & Hunting in Peoria
0.0%
0.50%
Zip Codes with the Highest Percentage of Population Employed in Agriculture, Fishing & Hunting in Peoria, AZ
| Zip Code | % Employed | vs State | vs National | |
| 1. | 85381 | 0.42% | 0.80%(-0.379)#181 | 1.2%(-0.775)#19,947 |
| 2. | 85383 | 0.093% | 0.80%(-0.710)#266 | 1.2%(-1.11)#23,774 |
| 3. | 85382 | 0.087% | 0.80%(-0.716)#268 | 1.2%(-1.11)#23,866 |
| 4. | 85345 | 0.065% | 0.80%(-0.738)#272 | 1.2%(-1.13)#24,171 |
1
Common Questions
What are the Top 3 Zip Codes with the Highest Percentage of Population Employed in Agriculture, Fishing & Hunting in Peoria, AZ?
Top 3 Zip Codes with the Highest Percentage of Population Employed in Agriculture, Fishing & Hunting in Peoria, AZ are:
What zip code has the Highest Percentage of Population Employed in Agriculture, Fishing & Hunting in Peoria, AZ?
85381 has the Highest Percentage of Population Employed in Agriculture, Fishing & Hunting in Peoria, AZ with 0.42%.
What is the Percentage of Population Employed in Agriculture, Fishing & Hunting in Peoria, AZ?
Percentage of Population Employed in Agriculture, Fishing & Hunting in Peoria is 0.13%.
What is the Percentage of Population Employed in Agriculture, Fishing & Hunting in Arizona?
Percentage of Population Employed in Agriculture, Fishing & Hunting in Arizona is 0.80%.
What is the Percentage of Population Employed in Agriculture, Fishing & Hunting in the United States?
Percentage of Population Employed in Agriculture, Fishing & Hunting in the United States is 1.2%.