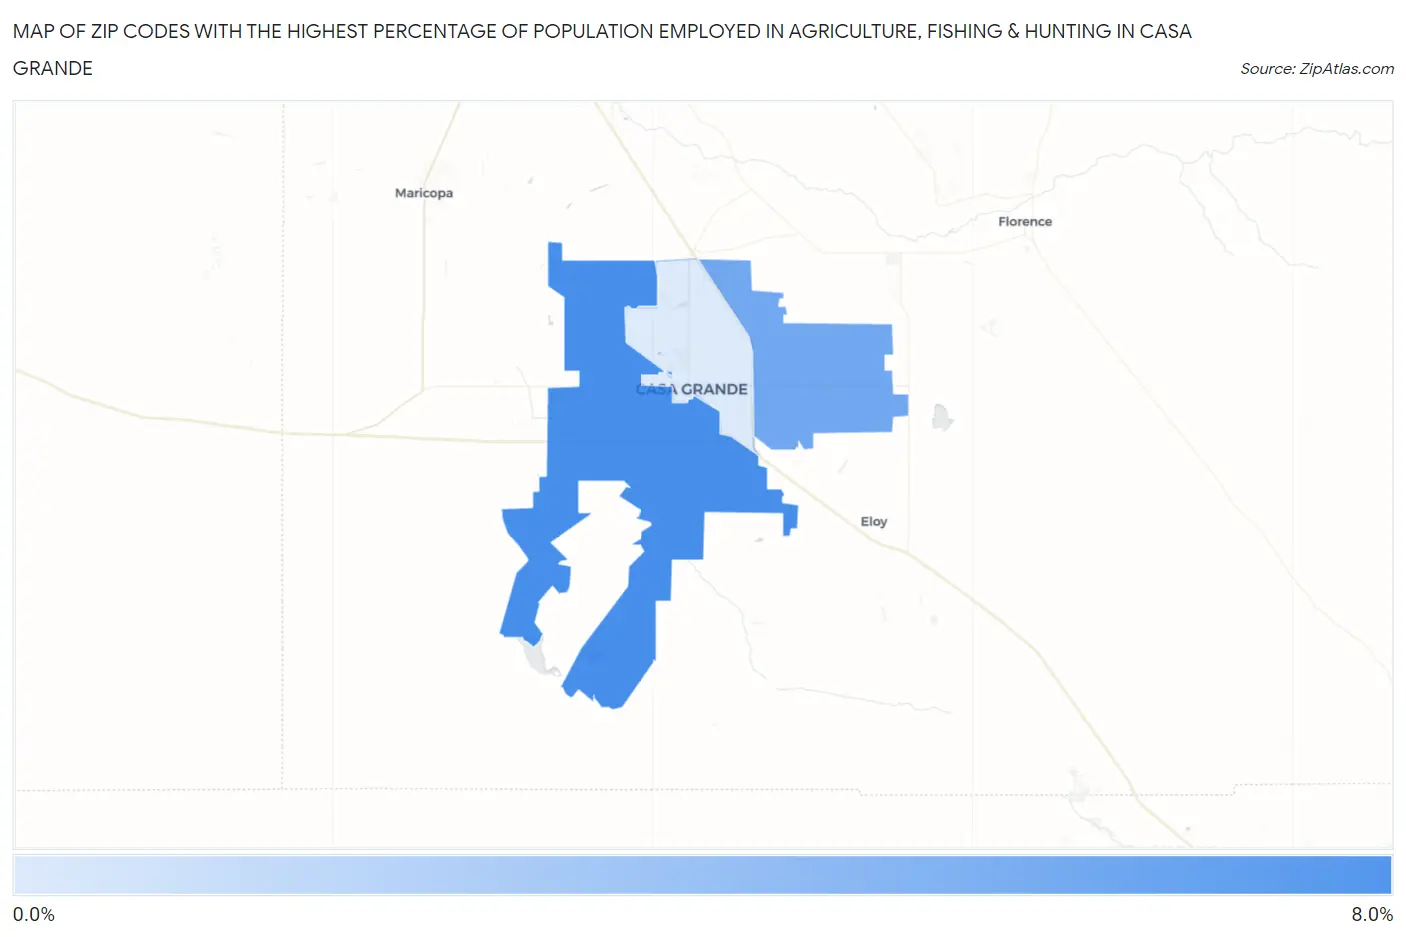
Zip Codes with the Highest Percentage of Population Employed in Agriculture, Fishing & Hunting in Casa Grande, AZ
RELATED REPORTS & OPTIONS
Agriculture, Fishing & Hunting
Casa Grande
Compare Zip Codes
Map of Zip Codes with the Highest Percentage of Population Employed in Agriculture, Fishing & Hunting in Casa Grande
0.0%
8.0%
Zip Codes with the Highest Percentage of Population Employed in Agriculture, Fishing & Hunting in Casa Grande, AZ
| Zip Code | % Employed | vs State | vs National | |
| 1. | 85193 | 8.0% | 0.80%(+7.19)#35 | 1.2%(+6.80)#5,411 |
| 2. | 85194 | 6.1% | 0.80%(+5.33)#44 | 1.2%(+4.93)#6,784 |
| 3. | 85122 | 1.6% | 0.80%(+0.779)#93 | 1.2%(+0.382)#14,028 |
1
Common Questions
What are the Top Zip Codes with the Highest Percentage of Population Employed in Agriculture, Fishing & Hunting in Casa Grande, AZ?
Top Zip Codes with the Highest Percentage of Population Employed in Agriculture, Fishing & Hunting in Casa Grande, AZ are:
What zip code has the Highest Percentage of Population Employed in Agriculture, Fishing & Hunting in Casa Grande, AZ?
85193 has the Highest Percentage of Population Employed in Agriculture, Fishing & Hunting in Casa Grande, AZ with 8.0%.
What is the Percentage of Population Employed in Agriculture, Fishing & Hunting in Casa Grande, AZ?
Percentage of Population Employed in Agriculture, Fishing & Hunting in Casa Grande is 1.7%.
What is the Percentage of Population Employed in Agriculture, Fishing & Hunting in Arizona?
Percentage of Population Employed in Agriculture, Fishing & Hunting in Arizona is 0.80%.
What is the Percentage of Population Employed in Agriculture, Fishing & Hunting in the United States?
Percentage of Population Employed in Agriculture, Fishing & Hunting in the United States is 1.2%.