Decatur, AL Map & Demographics
Decatur Map
Decatur Overview
$33,136
PER CAPITA INCOME
$69,560
AVG FAMILY INCOME
$55,164
AVG HOUSEHOLD INCOME
30.8%
WAGE / INCOME GAP [ % ]
69.2¢/ $1
WAGE / INCOME GAP [ $ ]
$9,065
FAMILY INCOME DEFICIT
0.47
INEQUALITY / GINI INDEX
57,525
TOTAL POPULATION
29,042
MALE POPULATION
28,483
FEMALE POPULATION
101.96
MALES / 100 FEMALES
98.08
FEMALES / 100 MALES
40.4
MEDIAN AGE
3.1
AVG FAMILY SIZE
2.4
AVG HOUSEHOLD SIZE
26,990
LABOR FORCE [ PEOPLE ]
58.8%
PERCENT IN LABOR FORCE
5.1%
UNEMPLOYMENT RATE
Decatur Area Codes
Income in Decatur
Income Overview in Decatur
Per Capita Income in Decatur is $33,136, while median incomes of families and households are $69,560 and $55,164 respectively.
| Characteristic | Number | Measure |
| Per Capita Income | 57,525 | $33,136 |
| Median Family Income | 14,132 | $69,560 |
| Mean Family Income | 14,132 | $94,753 |
| Median Household Income | 23,674 | $55,164 |
| Mean Household Income | 23,674 | $78,031 |
| Income Deficit | 14,132 | $9,065 |
| Wage / Income Gap (%) | 57,525 | 30.84% |
| Wage / Income Gap ($) | 57,525 | 69.16¢ per $1 |
| Gini / Inequality Index | 57,525 | 0.47 |
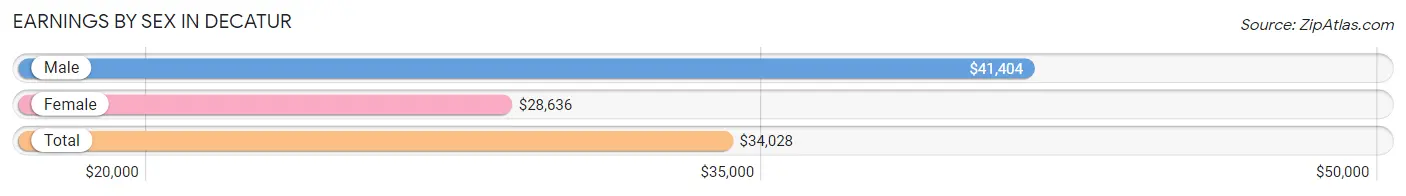
Earnings by Sex in Decatur
Average Earnings in Decatur are $34,028, $41,404 for men and $28,636 for women, a difference of 30.8%.
| Sex | Number | Average Earnings |
| Male | 15,869 (57.2%) | $41,404 |
| Female | 11,884 (42.8%) | $28,636 |
| Total | 27,753 (100.0%) | $34,028 |
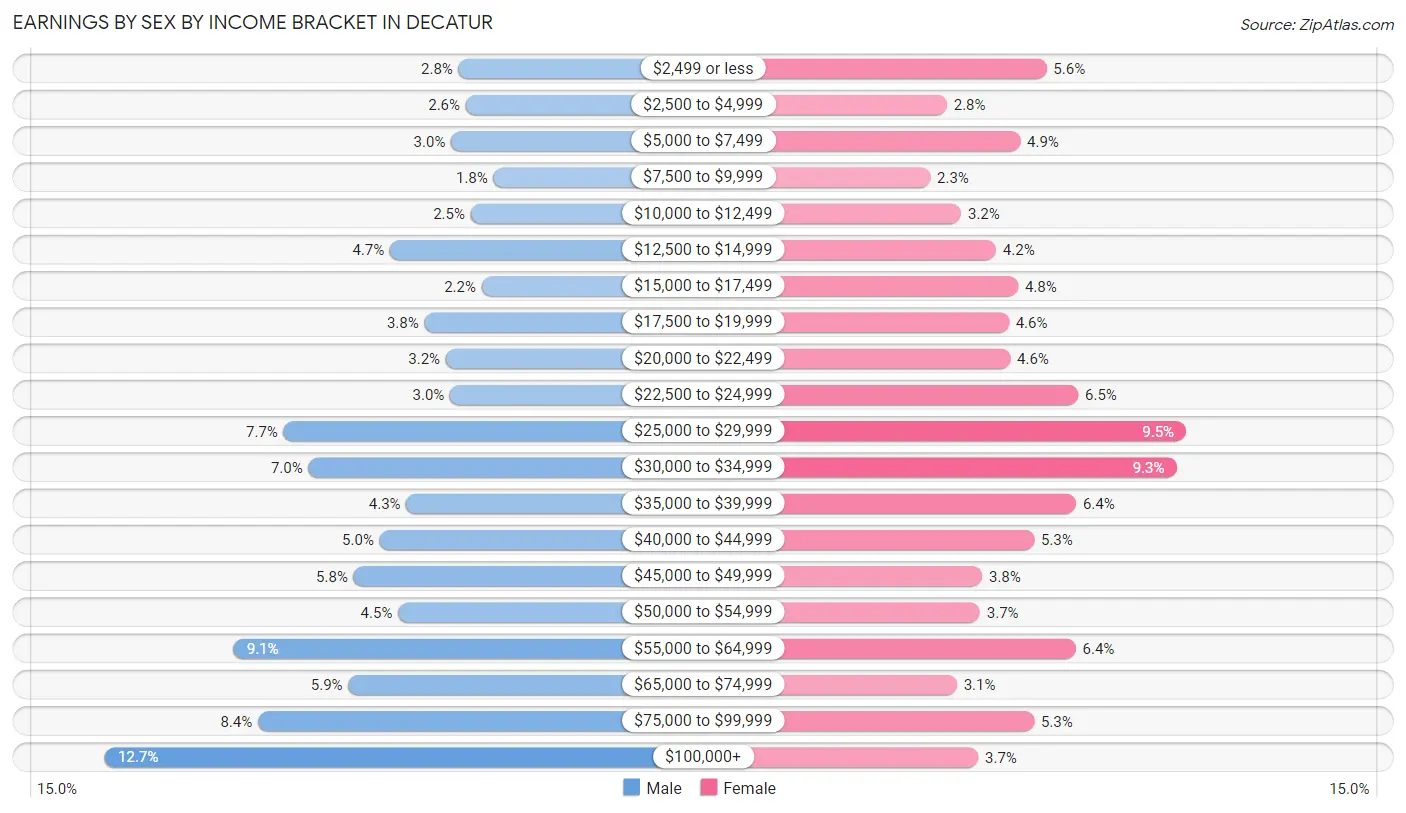
Earnings by Sex by Income Bracket in Decatur
The most common earnings brackets in Decatur are $100,000+ for men (2,021 | 12.7%) and $25,000 to $29,999 for women (1,133 | 9.5%).
| Income | Male | Female |
| $2,499 or less | 444 (2.8%) | 667 (5.6%) |
| $2,500 to $4,999 | 412 (2.6%) | 334 (2.8%) |
| $5,000 to $7,499 | 478 (3.0%) | 579 (4.9%) |
| $7,500 to $9,999 | 289 (1.8%) | 278 (2.3%) |
| $10,000 to $12,499 | 391 (2.5%) | 382 (3.2%) |
| $12,500 to $14,999 | 751 (4.7%) | 498 (4.2%) |
| $15,000 to $17,499 | 341 (2.1%) | 572 (4.8%) |
| $17,500 to $19,999 | 596 (3.8%) | 541 (4.5%) |
| $20,000 to $22,499 | 501 (3.2%) | 546 (4.6%) |
| $22,500 to $24,999 | 483 (3.0%) | 772 (6.5%) |
| $25,000 to $29,999 | 1,225 (7.7%) | 1,133 (9.5%) |
| $30,000 to $34,999 | 1,114 (7.0%) | 1,101 (9.3%) |
| $35,000 to $39,999 | 677 (4.3%) | 765 (6.4%) |
| $40,000 to $44,999 | 796 (5.0%) | 625 (5.3%) |
| $45,000 to $49,999 | 913 (5.8%) | 452 (3.8%) |
| $50,000 to $54,999 | 714 (4.5%) | 444 (3.7%) |
| $55,000 to $64,999 | 1,448 (9.1%) | 764 (6.4%) |
| $65,000 to $74,999 | 936 (5.9%) | 367 (3.1%) |
| $75,000 to $99,999 | 1,339 (8.4%) | 625 (5.3%) |
| $100,000+ | 2,021 (12.7%) | 439 (3.7%) |
| Total | 15,869 (100.0%) | 11,884 (100.0%) |
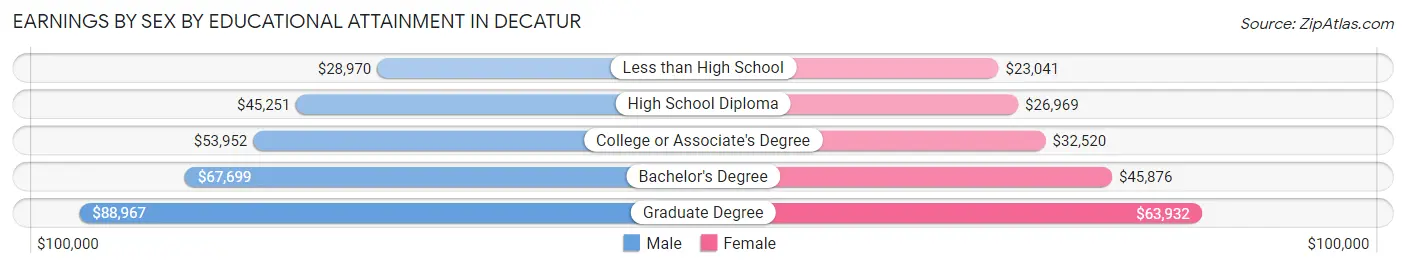
Earnings by Sex by Educational Attainment in Decatur
Average earnings in Decatur are $46,601 for men and $32,896 for women, a difference of 29.4%. Men with an educational attainment of graduate degree enjoy the highest average annual earnings of $88,967, while those with less than high school education earn the least with $28,970. Women with an educational attainment of graduate degree earn the most with the average annual earnings of $63,932, while those with less than high school education have the smallest earnings of $23,041.
| Educational Attainment | Male Income | Female Income |
| Less than High School | $28,970 | $23,041 |
| High School Diploma | $45,251 | $26,969 |
| College or Associate's Degree | $53,952 | $32,520 |
| Bachelor's Degree | $67,699 | $45,876 |
| Graduate Degree | $88,967 | $63,932 |
| Total | $46,601 | $32,896 |
Family Income in Decatur
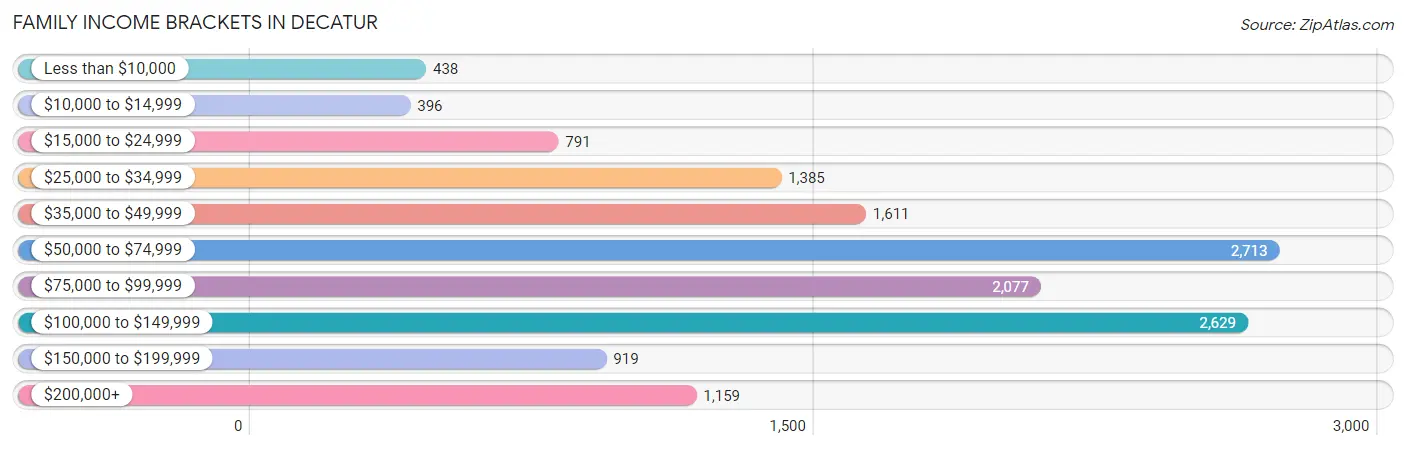
Family Income Brackets in Decatur
According to the Decatur family income data, there are 2,713 families falling into the $50,000 to $74,999 income range, which is the most common income bracket and makes up 19.2% of all families. Conversely, the $10,000 to $14,999 income bracket is the least frequent group with only 396 families (2.8%) belonging to this category.
| Income Bracket | # Families | % Families |
| Less than $10,000 | 438 | 3.1% |
| $10,000 to $14,999 | 396 | 2.8% |
| $15,000 to $24,999 | 791 | 5.6% |
| $25,000 to $34,999 | 1,385 | 9.8% |
| $35,000 to $49,999 | 1,611 | 11.4% |
| $50,000 to $74,999 | 2,713 | 19.2% |
| $75,000 to $99,999 | 2,077 | 14.7% |
| $100,000 to $149,999 | 2,629 | 18.6% |
| $150,000 to $199,999 | 919 | 6.5% |
| $200,000+ | 1,159 | 8.2% |
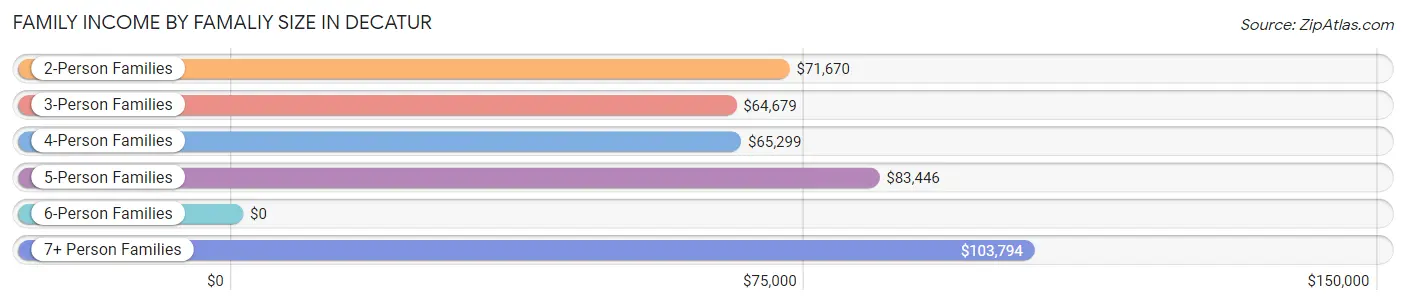
Family Income by Famaliy Size in Decatur
7+ person families (413 | 2.9%) account for the highest median family income in Decatur with $103,794 per family, while 2-person families (7,375 | 52.2%) have the highest median income of $35,835 per family member.
| Income Bracket | # Families | Median Income |
| 2-Person Families | 7,375 (52.2%) | $71,670 |
| 3-Person Families | 3,118 (22.1%) | $64,679 |
| 4-Person Families | 2,176 (15.4%) | $65,299 |
| 5-Person Families | 758 (5.4%) | $83,446 |
| 6-Person Families | 292 (2.1%) | $0 |
| 7+ Person Families | 413 (2.9%) | $103,794 |
| Total | 14,132 (100.0%) | $69,560 |
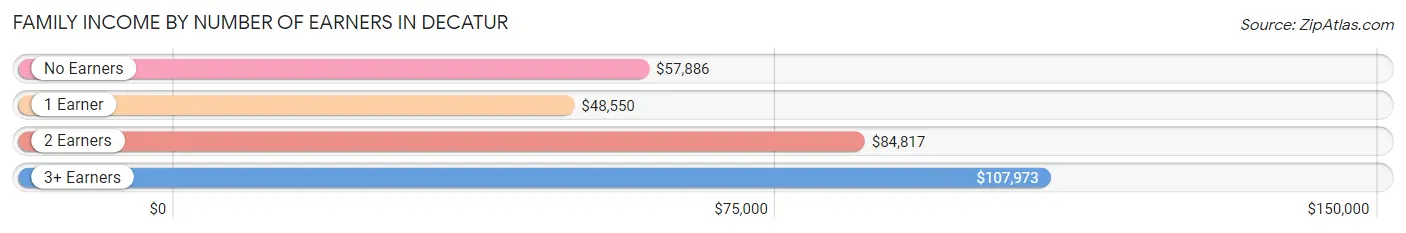
Family Income by Number of Earners in Decatur
The median family income in Decatur is $69,560, with families comprising 3+ earners (1,265) having the highest median family income of $107,973, while families with 1 earner (4,788) have the lowest median family income of $48,550, accounting for 8.9% and 33.9% of families, respectively.
| Number of Earners | # Families | Median Income |
| No Earners | 2,895 (20.5%) | $57,886 |
| 1 Earner | 4,788 (33.9%) | $48,550 |
| 2 Earners | 5,184 (36.7%) | $84,817 |
| 3+ Earners | 1,265 (8.9%) | $107,973 |
| Total | 14,132 (100.0%) | $69,560 |
Household Income in Decatur
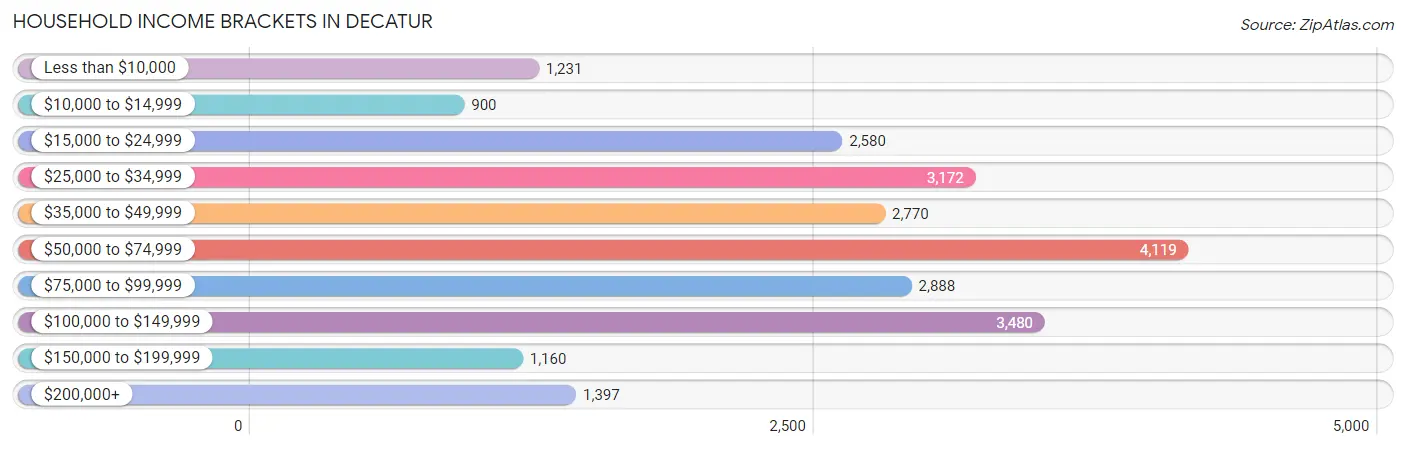
Household Income Brackets in Decatur
With 4,119 households falling in the category, the $50,000 to $74,999 income range is the most frequent in Decatur, accounting for 17.4% of all households. In contrast, only 900 households (3.8%) fall into the $10,000 to $14,999 income bracket, making it the least populous group.
| Income Bracket | # Households | % Households |
| Less than $10,000 | 1,231 | 5.2% |
| $10,000 to $14,999 | 900 | 3.8% |
| $15,000 to $24,999 | 2,580 | 10.9% |
| $25,000 to $34,999 | 3,172 | 13.4% |
| $35,000 to $49,999 | 2,770 | 11.7% |
| $50,000 to $74,999 | 4,119 | 17.4% |
| $75,000 to $99,999 | 2,888 | 12.2% |
| $100,000 to $149,999 | 3,480 | 14.7% |
| $150,000 to $199,999 | 1,160 | 4.9% |
| $200,000+ | 1,397 | 5.9% |
Household Income by Householder Age in Decatur
The median household income in Decatur is $55,164, with the highest median household income of $74,344 found in the 45 to 64 years age bracket for the primary householder. A total of 8,248 households (34.8%) fall into this category. Meanwhile, the 65+ years age bracket for the primary householder has the lowest median household income of $43,750, with 7,644 households (32.3%) in this group.
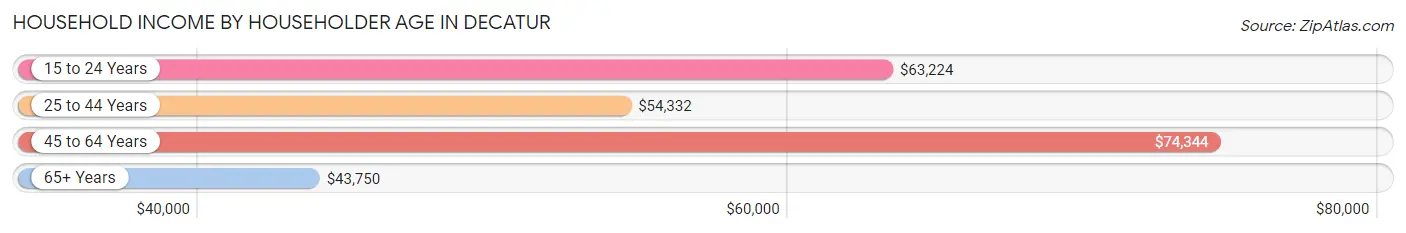
| Income Bracket | # Households | Median Income |
| 15 to 24 Years | 800 (3.4%) | $63,224 |
| 25 to 44 Years | 6,982 (29.5%) | $54,332 |
| 45 to 64 Years | 8,248 (34.8%) | $74,344 |
| 65+ Years | 7,644 (32.3%) | $43,750 |
| Total | 23,674 (100.0%) | $55,164 |
Poverty in Decatur
Income Below Poverty by Sex and Age in Decatur
With 13.2% poverty level for males and 14.6% for females among the residents of Decatur, under 5 year old males and under 5 year old females are the most vulnerable to poverty, with 625 males (33.5%) and 563 females (34.4%) in their respective age groups living below the poverty level.
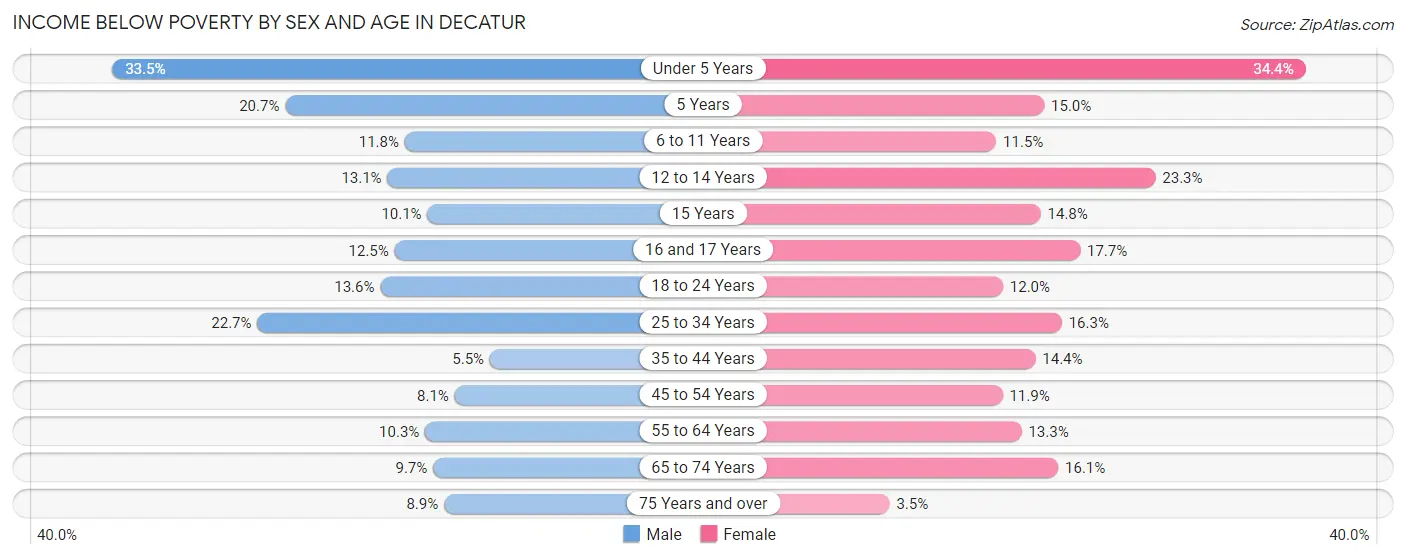
| Age Bracket | Male | Female |
| Under 5 Years | 625 (33.5%) | 563 (34.4%) |
| 5 Years | 76 (20.6%) | 35 (15.0%) |
| 6 to 11 Years | 244 (11.8%) | 246 (11.5%) |
| 12 to 14 Years | 144 (13.1%) | 267 (23.3%) |
| 15 Years | 46 (10.1%) | 53 (14.8%) |
| 16 and 17 Years | 116 (12.5%) | 144 (17.7%) |
| 18 to 24 Years | 320 (13.6%) | 256 (12.0%) |
| 25 to 34 Years | 865 (22.7%) | 522 (16.3%) |
| 35 to 44 Years | 186 (5.4%) | 479 (14.4%) |
| 45 to 54 Years | 278 (8.1%) | 373 (11.9%) |
| 55 to 64 Years | 362 (10.3%) | 511 (13.3%) |
| 65 to 74 Years | 284 (9.7%) | 551 (16.1%) |
| 75 Years and over | 155 (8.9%) | 94 (3.5%) |
| Total | 3,701 (13.2%) | 4,094 (14.6%) |
Income Above Poverty by Sex and Age in Decatur
According to the poverty statistics in Decatur, males aged 35 to 44 years and females aged 75 years and over are the age groups that are most secure financially, with 94.6% of males and 96.5% of females in these age groups living above the poverty line.
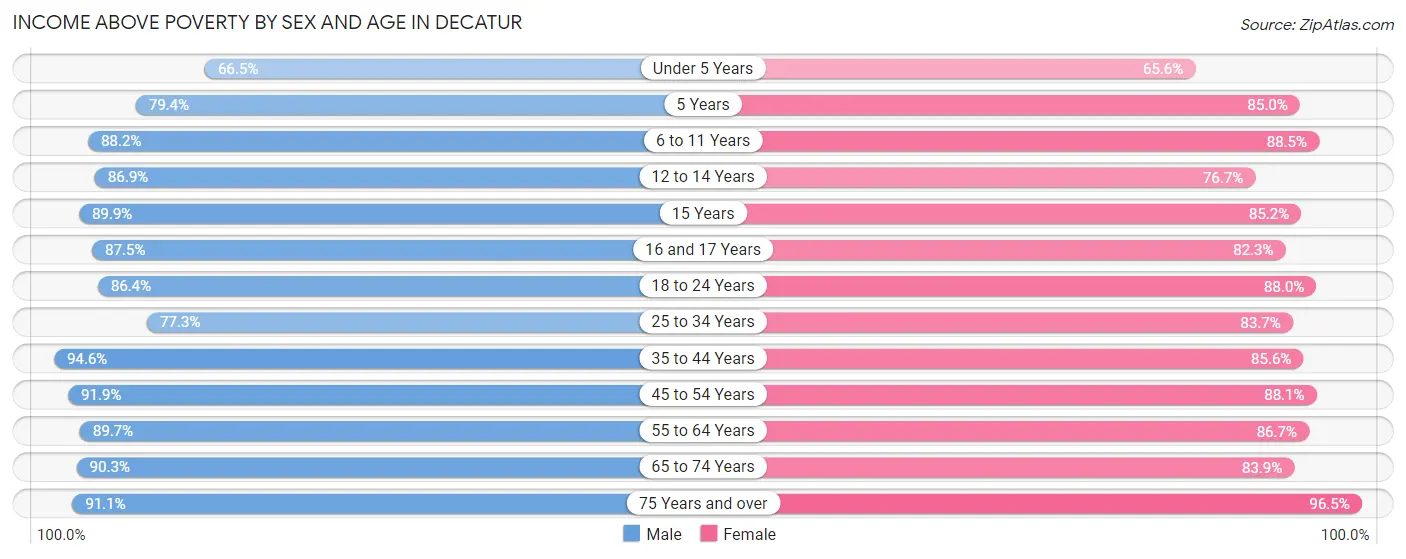
| Age Bracket | Male | Female |
| Under 5 Years | 1,241 (66.5%) | 1,072 (65.6%) |
| 5 Years | 292 (79.3%) | 198 (85.0%) |
| 6 to 11 Years | 1,829 (88.2%) | 1,900 (88.5%) |
| 12 to 14 Years | 959 (86.9%) | 880 (76.7%) |
| 15 Years | 410 (89.9%) | 306 (85.2%) |
| 16 and 17 Years | 810 (87.5%) | 670 (82.3%) |
| 18 to 24 Years | 2,035 (86.4%) | 1,884 (88.0%) |
| 25 to 34 Years | 2,943 (77.3%) | 2,675 (83.7%) |
| 35 to 44 Years | 3,227 (94.6%) | 2,854 (85.6%) |
| 45 to 54 Years | 3,165 (91.9%) | 2,754 (88.1%) |
| 55 to 64 Years | 3,167 (89.7%) | 3,319 (86.7%) |
| 65 to 74 Years | 2,652 (90.3%) | 2,880 (83.9%) |
| 75 Years and over | 1,595 (91.1%) | 2,564 (96.5%) |
| Total | 24,325 (86.8%) | 23,956 (85.4%) |
Income Below Poverty Among Married-Couple Families in Decatur
The poverty statistics for married-couple families in Decatur show that 6.2% or 615 of the total 9,925 families live below the poverty line. Families with 3 or 4 children have the highest poverty rate of 15.9%, comprising of 103 families. On the other hand, families with 5 or more children have the lowest poverty rate of 0.0%, which includes 0 families.
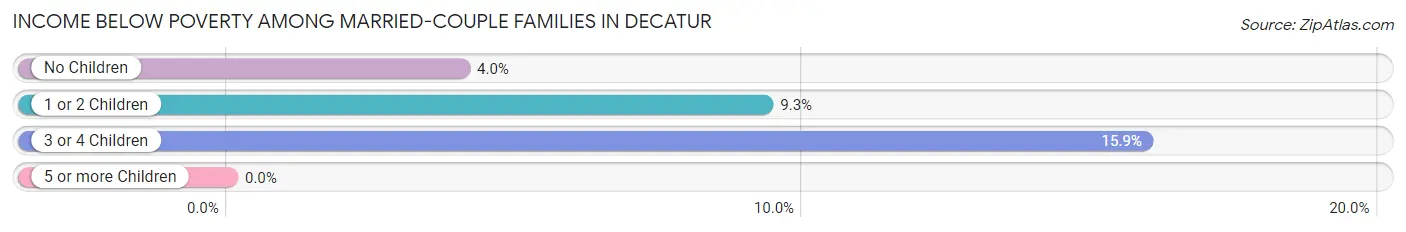
| Children | Above Poverty | Below Poverty |
| No Children | 6,054 (96.0%) | 255 (4.0%) |
| 1 or 2 Children | 2,501 (90.7%) | 257 (9.3%) |
| 3 or 4 Children | 543 (84.1%) | 103 (15.9%) |
| 5 or more Children | 212 (100.0%) | 0 (0.0%) |
| Total | 9,310 (93.8%) | 615 (6.2%) |
Income Below Poverty Among Single-Parent Households in Decatur
According to the poverty data in Decatur, 8.3% or 90 single-father households and 24.9% or 776 single-mother households are living below the poverty line. Among single-father households, those with 5 or more children have the highest poverty rate, with 2 households (100.0%) experiencing poverty. Likewise, among single-mother households, those with 5 or more children have the highest poverty rate, with 29 households (100.0%) falling below the poverty line.
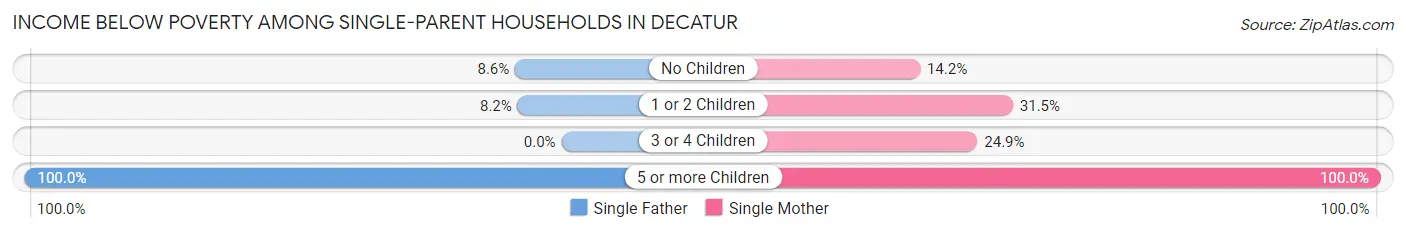
| Children | Single Father | Single Mother |
| No Children | 43 (8.6%) | 172 (14.2%) |
| 1 or 2 Children | 45 (8.2%) | 512 (31.5%) |
| 3 or 4 Children | 0 (0.0%) | 63 (24.9%) |
| 5 or more Children | 2 (100.0%) | 29 (100.0%) |
| Total | 90 (8.3%) | 776 (24.9%) |
Income Below Poverty Among Married-Couple vs Single-Parent Households in Decatur
The poverty data for Decatur shows that 615 of the married-couple family households (6.2%) and 866 of the single-parent households (20.6%) are living below the poverty level. Within the married-couple family households, those with 3 or 4 children have the highest poverty rate, with 103 households (15.9%) falling below the poverty line. Among the single-parent households, those with 5 or more children have the highest poverty rate, with 31 household (100.0%) living below poverty.
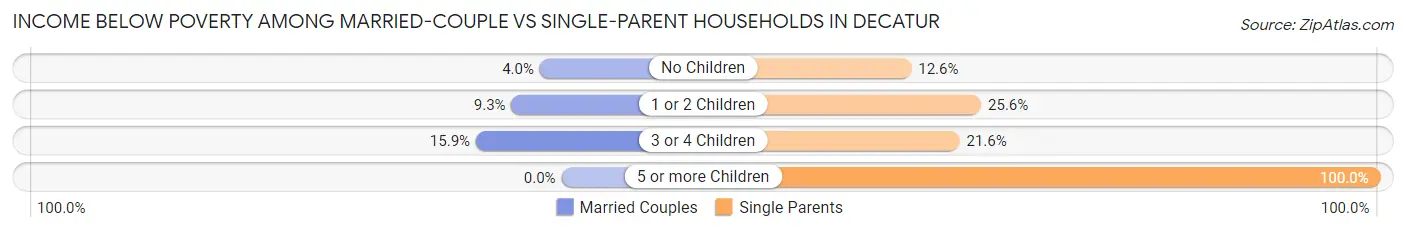
| Children | Married-Couple Families | Single-Parent Households |
| No Children | 255 (4.0%) | 215 (12.6%) |
| 1 or 2 Children | 257 (9.3%) | 557 (25.6%) |
| 3 or 4 Children | 103 (15.9%) | 63 (21.6%) |
| 5 or more Children | 0 (0.0%) | 31 (100.0%) |
| Total | 615 (6.2%) | 866 (20.6%) |
Race in Decatur
The most populous races in Decatur are White / Caucasian (36,028 | 62.6%), Black / African American (13,810 | 24.0%), and Hispanic or Latino (8,348 | 14.5%).
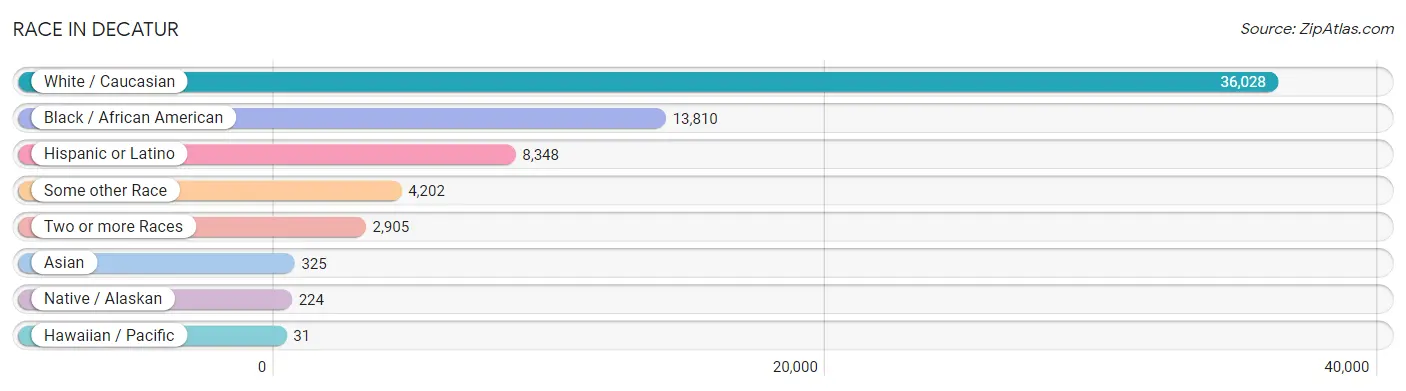
| Race | # Population | % Population |
| Asian | 325 | 0.6% |
| Black / African American | 13,810 | 24.0% |
| Hawaiian / Pacific | 31 | 0.1% |
| Hispanic or Latino | 8,348 | 14.5% |
| Native / Alaskan | 224 | 0.4% |
| White / Caucasian | 36,028 | 62.6% |
| Two or more Races | 2,905 | 5.1% |
| Some other Race | 4,202 | 7.3% |
| Total | 57,525 | 100.0% |
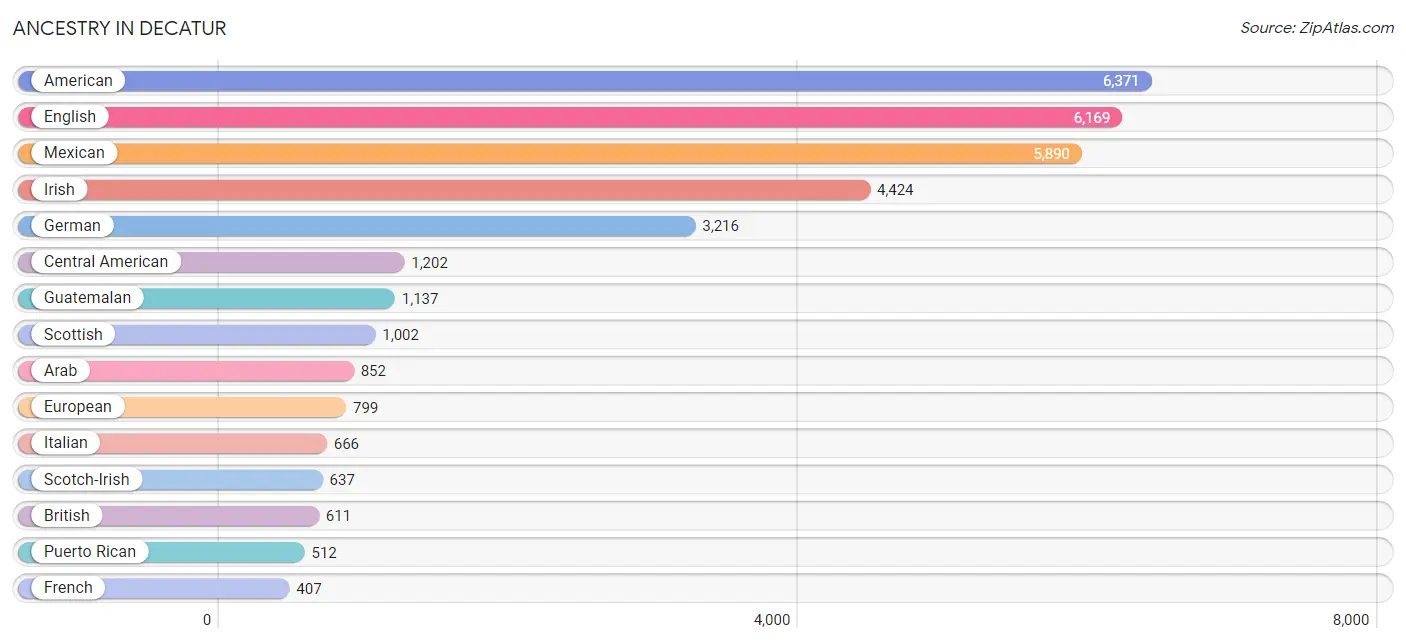
Ancestry in Decatur
The most populous ancestries reported in Decatur are American (6,371 | 11.1%), English (6,169 | 10.7%), Mexican (5,890 | 10.2%), Irish (4,424 | 7.7%), and German (3,216 | 5.6%), together accounting for 45.3% of all Decatur residents.
| Ancestry | # Population | % Population |
| African | 205 | 0.4% |
| Albanian | 22 | 0.0% |
| American | 6,371 | 11.1% |
| Apache | 131 | 0.2% |
| Arab | 852 | 1.5% |
| Armenian | 15 | 0.0% |
| Bhutanese | 13 | 0.0% |
| Blackfeet | 12 | 0.0% |
| Brazilian | 23 | 0.0% |
| British | 611 | 1.1% |
| Burmese | 16 | 0.0% |
| Canadian | 14 | 0.0% |
| Celtic | 11 | 0.0% |
| Central American | 1,202 | 2.1% |
| Cherokee | 301 | 0.5% |
| Chilean | 6 | 0.0% |
| Colombian | 34 | 0.1% |
| Creek | 17 | 0.0% |
| Cuban | 257 | 0.4% |
| Danish | 59 | 0.1% |
| Dominican | 22 | 0.0% |
| Dutch | 228 | 0.4% |
| Eastern European | 134 | 0.2% |
| Ecuadorian | 23 | 0.0% |
| English | 6,169 | 10.7% |
| European | 799 | 1.4% |
| French | 407 | 0.7% |
| French Canadian | 31 | 0.1% |
| German | 3,216 | 5.6% |
| Greek | 58 | 0.1% |
| Guamanian / Chamorro | 16 | 0.0% |
| Guatemalan | 1,137 | 2.0% |
| Honduran | 35 | 0.1% |
| Houma | 5 | 0.0% |
| Hungarian | 8 | 0.0% |
| Indian (Asian) | 53 | 0.1% |
| Iranian | 22 | 0.0% |
| Irish | 4,424 | 7.7% |
| Iroquois | 12 | 0.0% |
| Italian | 666 | 1.2% |
| Jamaican | 31 | 0.1% |
| Korean | 63 | 0.1% |
| Lebanese | 60 | 0.1% |
| Lithuanian | 19 | 0.0% |
| Mexican | 5,890 | 10.2% |
| Native Hawaiian | 67 | 0.1% |
| Northern European | 90 | 0.2% |
| Norwegian | 183 | 0.3% |
| Pakistani | 16 | 0.0% |
| Pennsylvania German | 9 | 0.0% |
| Polish | 285 | 0.5% |
| Portuguese | 159 | 0.3% |
| Puerto Rican | 512 | 0.9% |
| Romanian | 30 | 0.1% |
| Russian | 17 | 0.0% |
| Salvadoran | 5 | 0.0% |
| Scandinavian | 71 | 0.1% |
| Scotch-Irish | 637 | 1.1% |
| Scottish | 1,002 | 1.7% |
| Serbian | 9 | 0.0% |
| Slovak | 16 | 0.0% |
| South American | 80 | 0.1% |
| Spaniard | 178 | 0.3% |
| Spanish | 91 | 0.2% |
| Sri Lankan | 130 | 0.2% |
| Subsaharan African | 235 | 0.4% |
| Swedish | 119 | 0.2% |
| Swiss | 154 | 0.3% |
| Syrian | 5 | 0.0% |
| Thai | 197 | 0.3% |
| U.S. Virgin Islander | 15 | 0.0% |
| Ugandan | 30 | 0.1% |
| Ukrainian | 91 | 0.2% |
| Ute | 16 | 0.0% |
| Venezuelan | 17 | 0.0% |
| Welsh | 395 | 0.7% | View All 76 Rows |
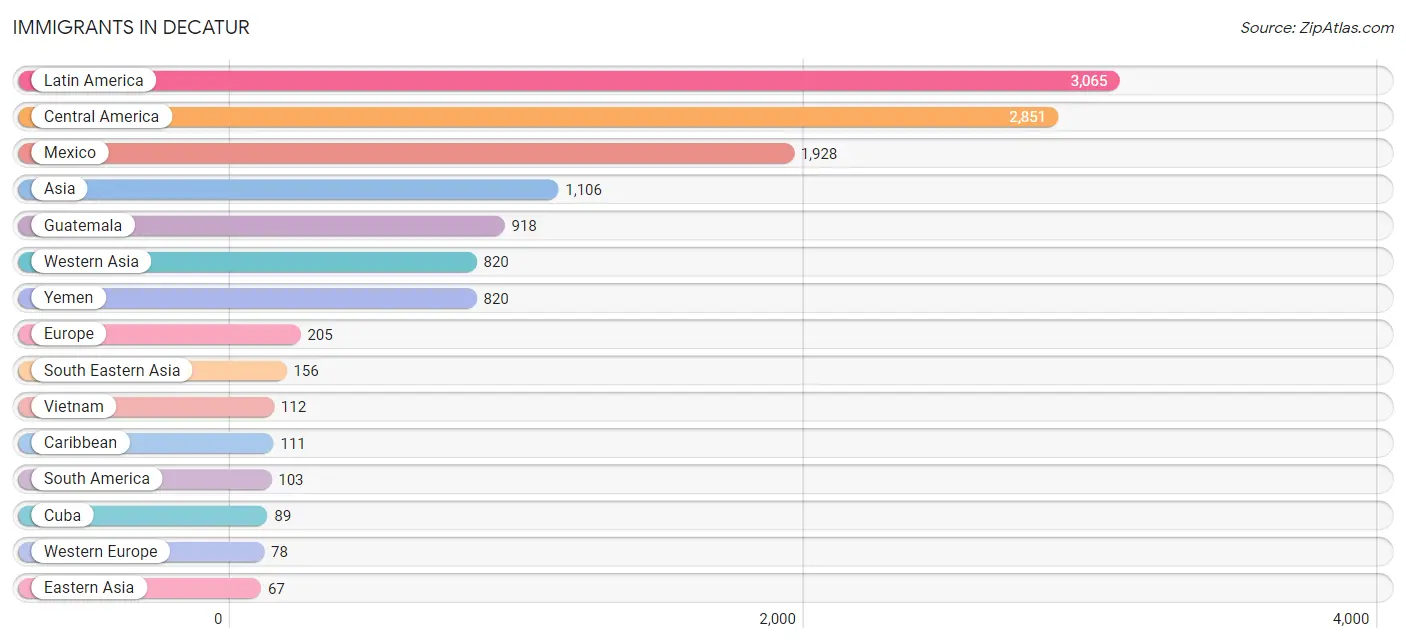
Immigrants in Decatur
The most numerous immigrant groups reported in Decatur came from Latin America (3,065 | 5.3%), Central America (2,851 | 5.0%), Mexico (1,928 | 3.4%), Asia (1,106 | 1.9%), and Guatemala (918 | 1.6%), together accounting for 17.2% of all Decatur residents.
| Immigration Origin | # Population | % Population |
| Africa | 61 | 0.1% |
| Asia | 1,106 | 1.9% |
| Belgium | 18 | 0.0% |
| Canada | 4 | 0.0% |
| Caribbean | 111 | 0.2% |
| Central America | 2,851 | 5.0% |
| Chile | 6 | 0.0% |
| China | 51 | 0.1% |
| Colombia | 17 | 0.0% |
| Cuba | 89 | 0.2% |
| Dominican Republic | 22 | 0.0% |
| Eastern Africa | 30 | 0.1% |
| Eastern Asia | 67 | 0.1% |
| Eastern Europe | 36 | 0.1% |
| Ecuador | 50 | 0.1% |
| El Salvador | 5 | 0.0% |
| England | 44 | 0.1% |
| Europe | 205 | 0.4% |
| France | 20 | 0.0% |
| Germany | 40 | 0.1% |
| Guatemala | 918 | 1.6% |
| India | 41 | 0.1% |
| Iran | 22 | 0.0% |
| Korea | 16 | 0.0% |
| Latin America | 3,065 | 5.3% |
| Mexico | 1,928 | 3.4% |
| Micronesia | 38 | 0.1% |
| Nigeria | 31 | 0.1% |
| Northern Europe | 44 | 0.1% |
| Oceania | 38 | 0.1% |
| Philippines | 44 | 0.1% |
| Romania | 24 | 0.0% |
| South America | 103 | 0.2% |
| South Central Asia | 63 | 0.1% |
| South Eastern Asia | 156 | 0.3% |
| Southern Europe | 47 | 0.1% |
| Spain | 47 | 0.1% |
| Taiwan | 6 | 0.0% |
| Uganda | 30 | 0.1% |
| Ukraine | 12 | 0.0% |
| Venezuela | 30 | 0.1% |
| Vietnam | 112 | 0.2% |
| Western Africa | 31 | 0.1% |
| Western Asia | 820 | 1.4% |
| Western Europe | 78 | 0.1% |
| Yemen | 820 | 1.4% | View All 46 Rows |
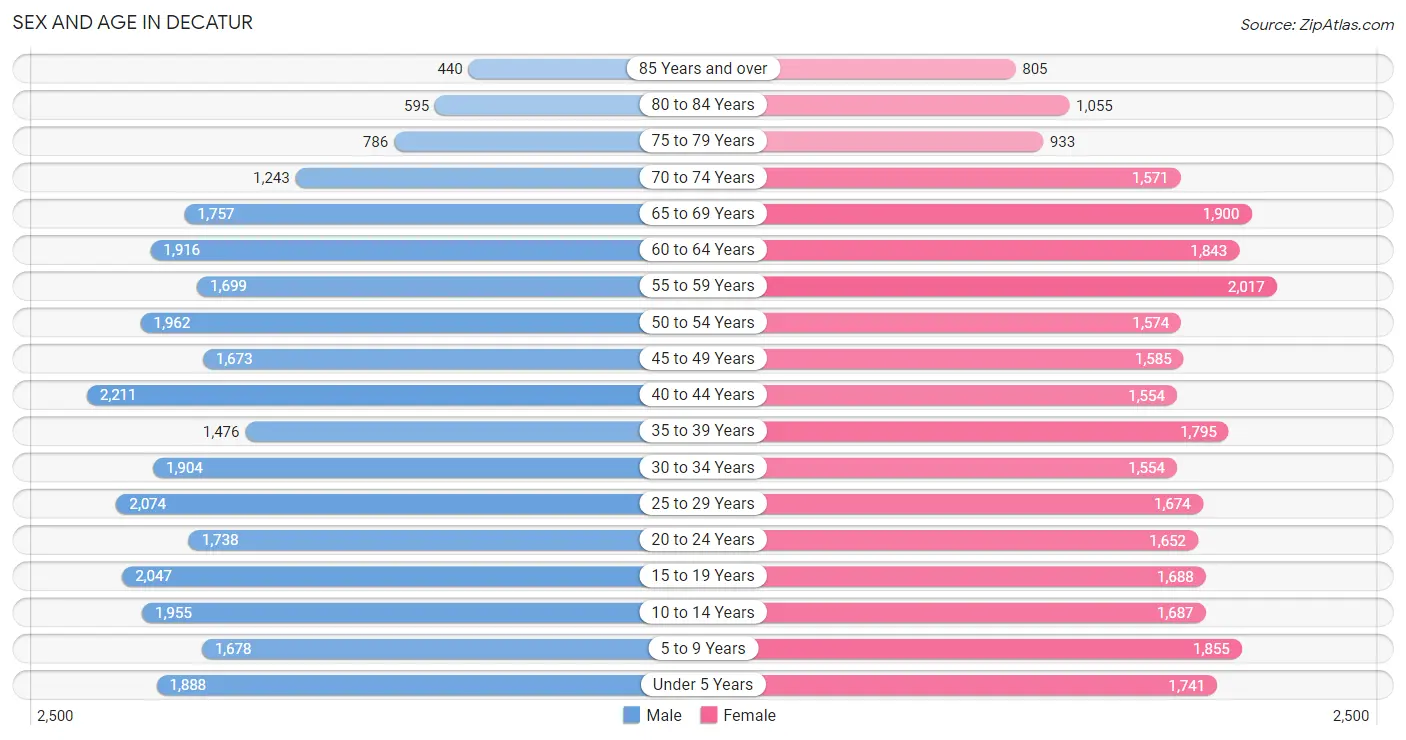
Sex and Age in Decatur
Sex and Age in Decatur
The most populous age groups in Decatur are 40 to 44 Years (2,211 | 7.6%) for men and 55 to 59 Years (2,017 | 7.1%) for women.
| Age Bracket | Male | Female |
| Under 5 Years | 1,888 (6.5%) | 1,741 (6.1%) |
| 5 to 9 Years | 1,678 (5.8%) | 1,855 (6.5%) |
| 10 to 14 Years | 1,955 (6.7%) | 1,687 (5.9%) |
| 15 to 19 Years | 2,047 (7.0%) | 1,688 (5.9%) |
| 20 to 24 Years | 1,738 (6.0%) | 1,652 (5.8%) |
| 25 to 29 Years | 2,074 (7.1%) | 1,674 (5.9%) |
| 30 to 34 Years | 1,904 (6.6%) | 1,554 (5.5%) |
| 35 to 39 Years | 1,476 (5.1%) | 1,795 (6.3%) |
| 40 to 44 Years | 2,211 (7.6%) | 1,554 (5.5%) |
| 45 to 49 Years | 1,673 (5.8%) | 1,585 (5.6%) |
| 50 to 54 Years | 1,962 (6.8%) | 1,574 (5.5%) |
| 55 to 59 Years | 1,699 (5.9%) | 2,017 (7.1%) |
| 60 to 64 Years | 1,916 (6.6%) | 1,843 (6.5%) |
| 65 to 69 Years | 1,757 (6.0%) | 1,900 (6.7%) |
| 70 to 74 Years | 1,243 (4.3%) | 1,571 (5.5%) |
| 75 to 79 Years | 786 (2.7%) | 933 (3.3%) |
| 80 to 84 Years | 595 (2.1%) | 1,055 (3.7%) |
| 85 Years and over | 440 (1.5%) | 805 (2.8%) |
| Total | 29,042 (100.0%) | 28,483 (100.0%) |
Families and Households in Decatur
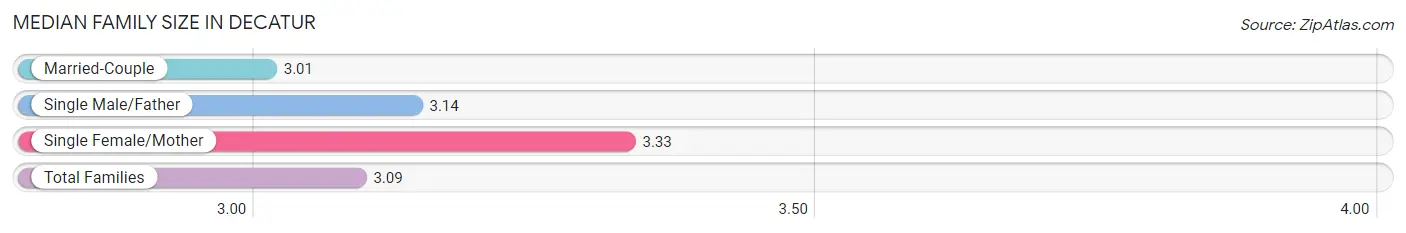
Median Family Size in Decatur
The median family size in Decatur is 3.09 persons per family, with single female/mother families (3,117 | 22.1%) accounting for the largest median family size of 3.33 persons per family. On the other hand, married-couple families (9,925 | 70.2%) represent the smallest median family size with 3.01 persons per family.
| Family Type | # Families | Family Size |
| Married-Couple | 9,925 (70.2%) | 3.01 |
| Single Male/Father | 1,090 (7.7%) | 3.14 |
| Single Female/Mother | 3,117 (22.1%) | 3.33 |
| Total Families | 14,132 (100.0%) | 3.09 |
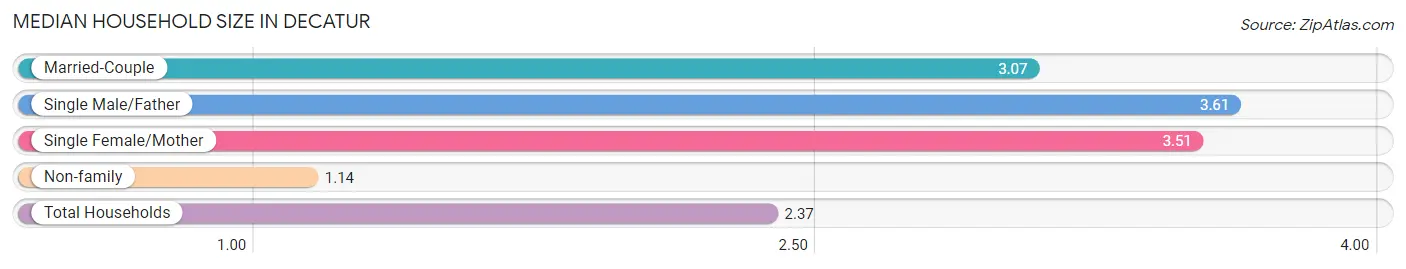
Median Household Size in Decatur
The median household size in Decatur is 2.37 persons per household, with single male/father households (1,090 | 4.6%) accounting for the largest median household size of 3.61 persons per household. non-family households (9,542 | 40.3%) represent the smallest median household size with 1.14 persons per household.
| Household Type | # Households | Household Size |
| Married-Couple | 9,925 (41.9%) | 3.07 |
| Single Male/Father | 1,090 (4.6%) | 3.61 |
| Single Female/Mother | 3,117 (13.2%) | 3.51 |
| Non-family | 9,542 (40.3%) | 1.14 |
| Total Households | 23,674 (100.0%) | 2.37 |
Household Size by Marriage Status in Decatur
Out of a total of 23,674 households in Decatur, 14,132 (59.7%) are family households, while 9,542 (40.3%) are nonfamily households. The most numerous type of family households are 2-person households, comprising 6,775, and the most common type of nonfamily households are 1-person households, comprising 8,496.
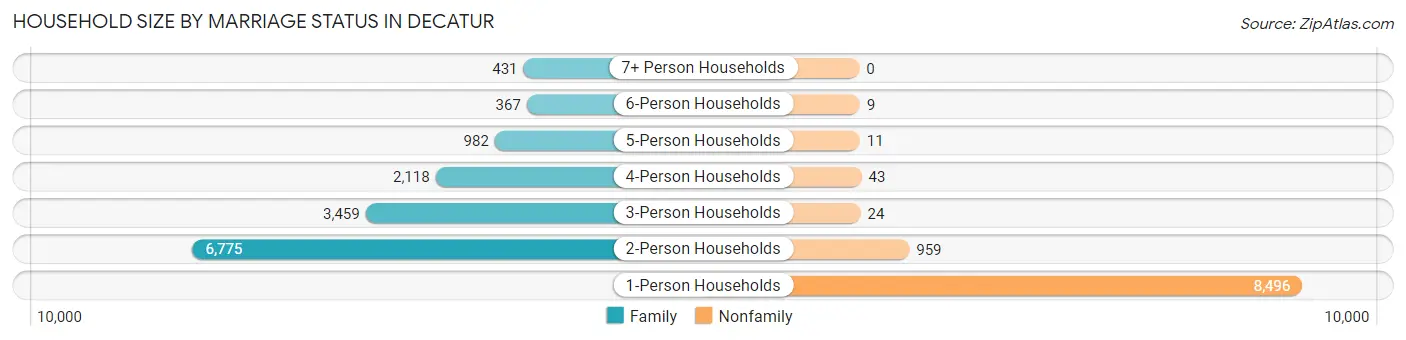
| Household Size | Family Households | Nonfamily Households |
| 1-Person Households | - | 8,496 (35.9%) |
| 2-Person Households | 6,775 (28.6%) | 959 (4.1%) |
| 3-Person Households | 3,459 (14.6%) | 24 (0.1%) |
| 4-Person Households | 2,118 (8.9%) | 43 (0.2%) |
| 5-Person Households | 982 (4.2%) | 11 (0.1%) |
| 6-Person Households | 367 (1.5%) | 9 (0.0%) |
| 7+ Person Households | 431 (1.8%) | 0 (0.0%) |
| Total | 14,132 (59.7%) | 9,542 (40.3%) |
Female Fertility in Decatur
Fertility by Age in Decatur
Average fertility rate in Decatur is 61.0 births per 1,000 women. Women in the age bracket of 20 to 34 years have the highest fertility rate with 139.0 births per 1,000 women. Women in the age bracket of 20 to 34 years acount for 94.7% of all women with births.
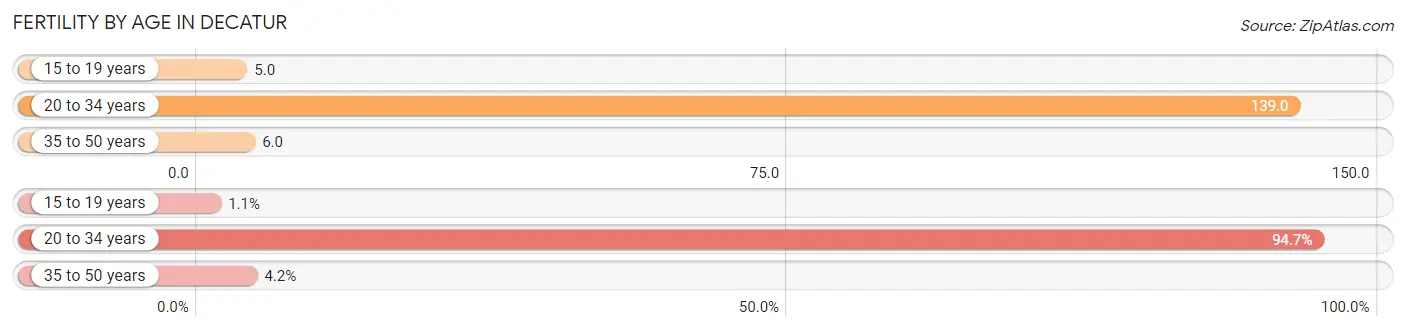
| Age Bracket | Women with Births | Births / 1,000 Women |
| 15 to 19 years | 8 (1.1%) | 5.0 |
| 20 to 34 years | 678 (94.7%) | 139.0 |
| 35 to 50 years | 30 (4.2%) | 6.0 |
| Total | 716 (100.0%) | 61.0 |
Fertility by Age by Marriage Status in Decatur
58.4% of women with births (716) in Decatur are married. The highest percentage of unmarried women with births falls into 20 to 34 years age bracket with 42.2% of them unmarried at the time of birth, while the lowest percentage of unmarried women with births belong to 15 to 19 years age bracket with 0.0% of them unmarried.
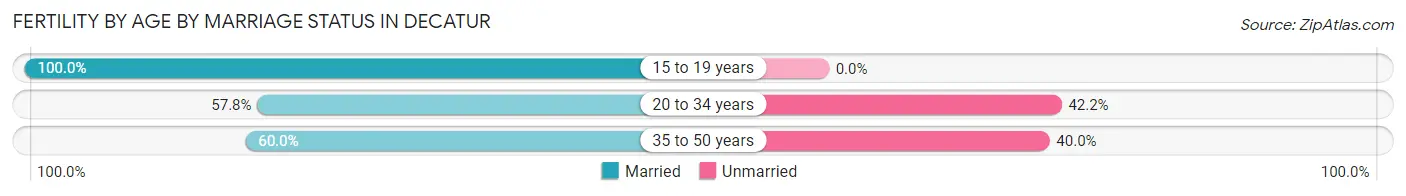
| Age Bracket | Married | Unmarried |
| 15 to 19 years | 8 (100.0%) | 0 (0.0%) |
| 20 to 34 years | 392 (57.8%) | 286 (42.2%) |
| 35 to 50 years | 18 (60.0%) | 12 (40.0%) |
| Total | 418 (58.4%) | 298 (41.6%) |
Fertility by Education in Decatur
Average fertility rate in Decatur is 61.0 births per 1,000 women. Women with the education attainment of high school diploma have the highest fertility rate of 113.0 births per 1,000 women, while women with the education attainment of graduate degree have the lowest fertility at 10.0 births per 1,000 women. Women with the education attainment of high school diploma represent 46.1% of all women with births.
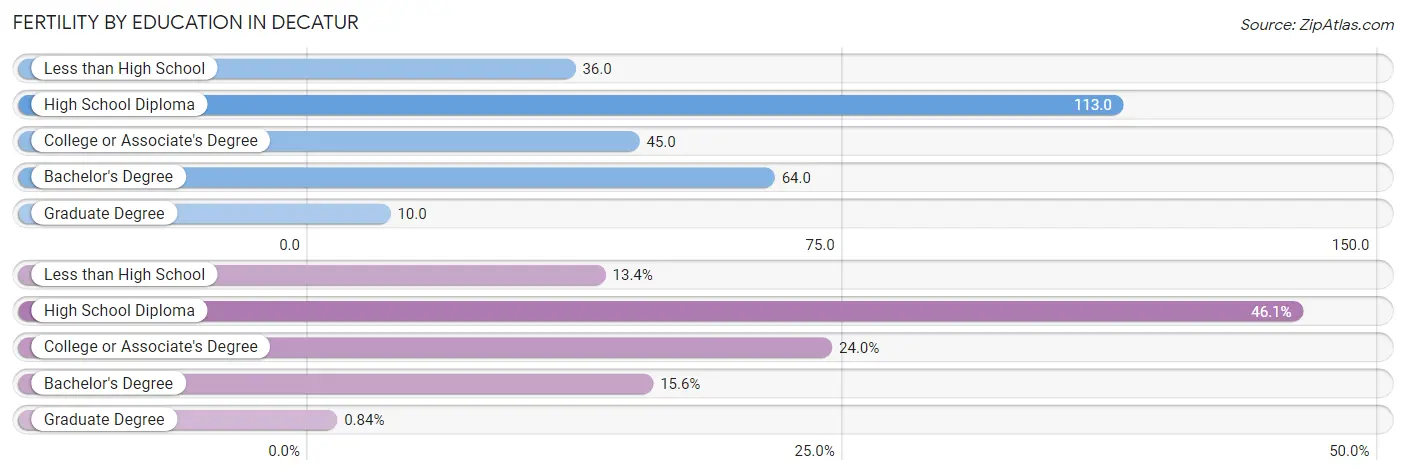
| Educational Attainment | Women with Births | Births / 1,000 Women |
| Less than High School | 96 (13.4%) | 36.0 |
| High School Diploma | 330 (46.1%) | 113.0 |
| College or Associate's Degree | 172 (24.0%) | 45.0 |
| Bachelor's Degree | 112 (15.6%) | 64.0 |
| Graduate Degree | 6 (0.8%) | 10.0 |
| Total | 716 (100.0%) | 61.0 |
Fertility by Education by Marriage Status in Decatur
41.6% of women with births in Decatur are unmarried. Women with the educational attainment of bachelor's degree are most likely to be married with 100.0% of them married at childbirth, while women with the educational attainment of high school diploma are least likely to be married with 67.6% of them unmarried at childbirth.
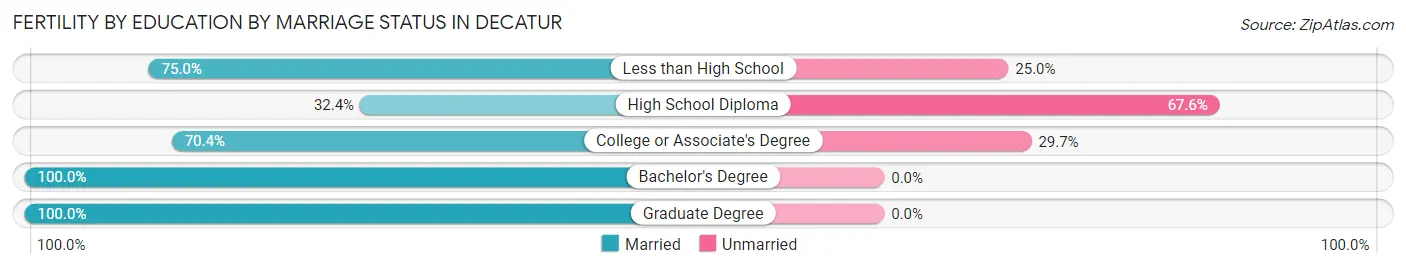
| Educational Attainment | Married | Unmarried |
| Less than High School | 72 (75.0%) | 24 (25.0%) |
| High School Diploma | 107 (32.4%) | 223 (67.6%) |
| College or Associate's Degree | 121 (70.4%) | 51 (29.6%) |
| Bachelor's Degree | 112 (100.0%) | 0 (0.0%) |
| Graduate Degree | 6 (100.0%) | 0 (0.0%) |
| Total | 418 (58.4%) | 298 (41.6%) |
Employment Characteristics in Decatur
Employment by Class of Employer in Decatur
Among the 25,144 employed individuals in Decatur, private company employees (18,668 | 74.2%), not-for-profit organizations (1,667 | 6.6%), and local government employees (1,250 | 5.0%) make up the most common classes of employment.
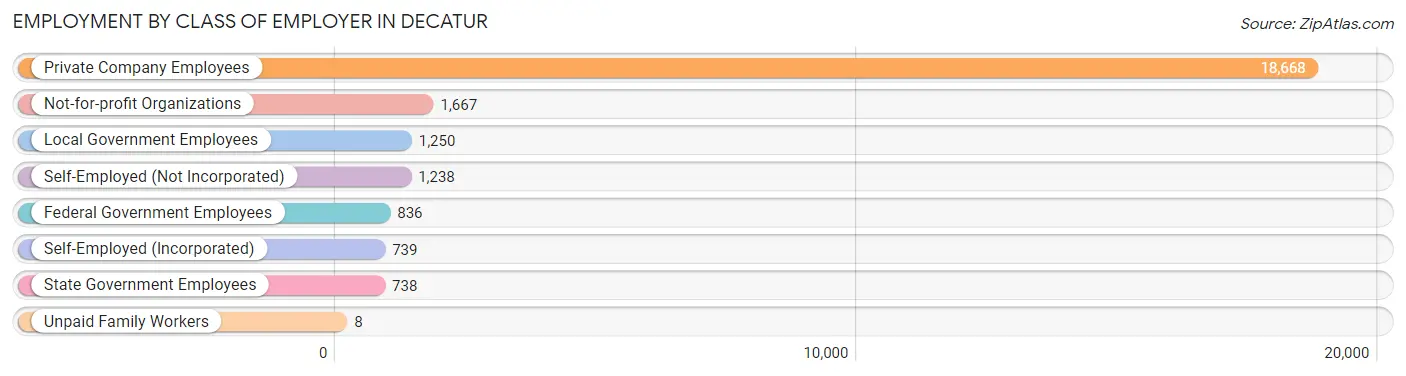
| Employer Class | # Employees | % Employees |
| Private Company Employees | 18,668 | 74.2% |
| Self-Employed (Incorporated) | 739 | 2.9% |
| Self-Employed (Not Incorporated) | 1,238 | 4.9% |
| Not-for-profit Organizations | 1,667 | 6.6% |
| Local Government Employees | 1,250 | 5.0% |
| State Government Employees | 738 | 2.9% |
| Federal Government Employees | 836 | 3.3% |
| Unpaid Family Workers | 8 | 0.0% |
| Total | 25,144 | 100.0% |
Employment Status by Age in Decatur
According to the labor force statistics for Decatur, out of the total population over 16 years of age (45,902), 58.8% or 26,990 individuals are in the labor force, with 5.1% or 1,376 of them unemployed. The age group with the highest labor force participation rate is 35 to 44 years, with 81.8% or 5,755 individuals in the labor force. Within the labor force, the 16 to 19 years age range has the highest percentage of unemployed individuals, with 13.7% or 202 of them being unemployed.
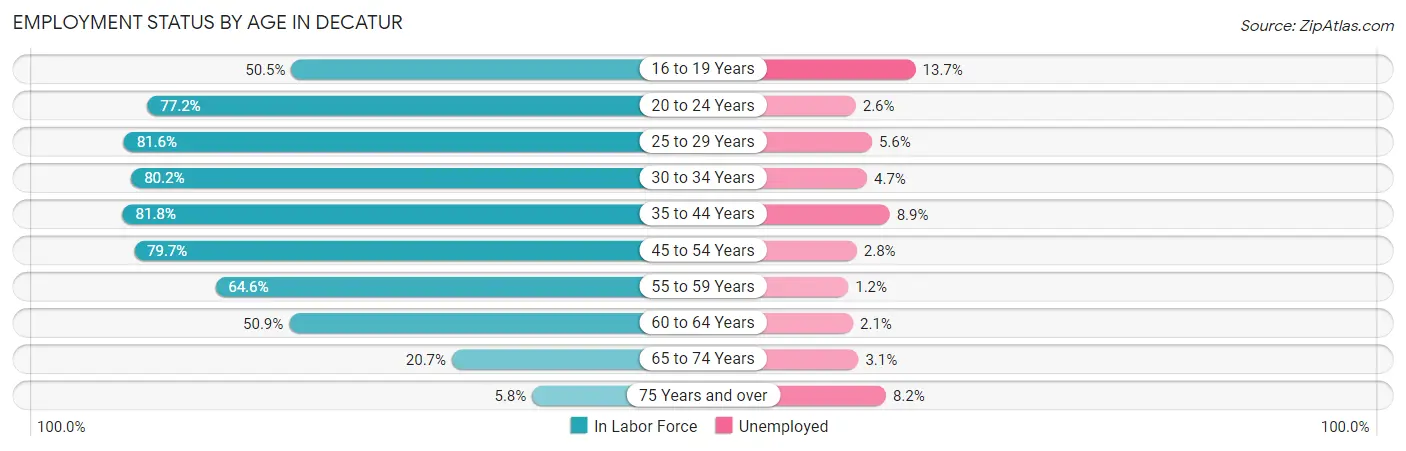
| Age Bracket | In Labor Force | Unemployed |
| 16 to 19 Years | 1,473 (50.5%) | 202 (13.7%) |
| 20 to 24 Years | 2,617 (77.2%) | 68 (2.6%) |
| 25 to 29 Years | 3,058 (81.6%) | 171 (5.6%) |
| 30 to 34 Years | 2,773 (80.2%) | 130 (4.7%) |
| 35 to 44 Years | 5,755 (81.8%) | 512 (8.9%) |
| 45 to 54 Years | 5,415 (79.7%) | 152 (2.8%) |
| 55 to 59 Years | 2,401 (64.6%) | 29 (1.2%) |
| 60 to 64 Years | 1,913 (50.9%) | 40 (2.1%) |
| 65 to 74 Years | 1,339 (20.7%) | 42 (3.1%) |
| 75 Years and over | 268 (5.8%) | 22 (8.2%) |
| Total | 26,990 (58.8%) | 1,376 (5.1%) |
Employment Status by Educational Attainment in Decatur
According to labor force statistics for Decatur, 74.8% of individuals (21,326) out of the total population between 25 and 64 years of age (28,511) are in the labor force, with 4.9% or 1,045 of them being unemployed. The group with the highest labor force participation rate are those with the educational attainment of bachelor's degree or higher, with 82.8% or 5,486 individuals in the labor force. Within the labor force, individuals with less than high school education have the highest percentage of unemployment, with 8.4% or 278 of them being unemployed.
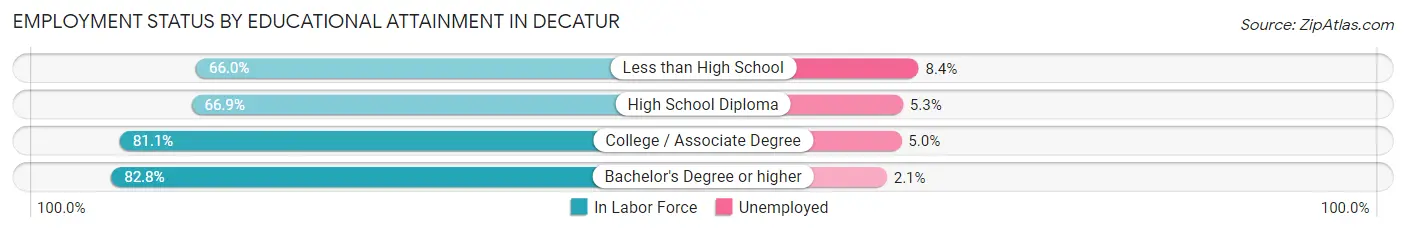
| Educational Attainment | In Labor Force | Unemployed |
| Less than High School | 3,307 (66.0%) | 421 (8.4%) |
| High School Diploma | 5,513 (66.9%) | 437 (5.3%) |
| College / Associate Degree | 7,003 (81.1%) | 432 (5.0%) |
| Bachelor's Degree or higher | 5,486 (82.8%) | 139 (2.1%) |
| Total | 21,326 (74.8%) | 1,397 (4.9%) |
Employment Occupations by Sex in Decatur
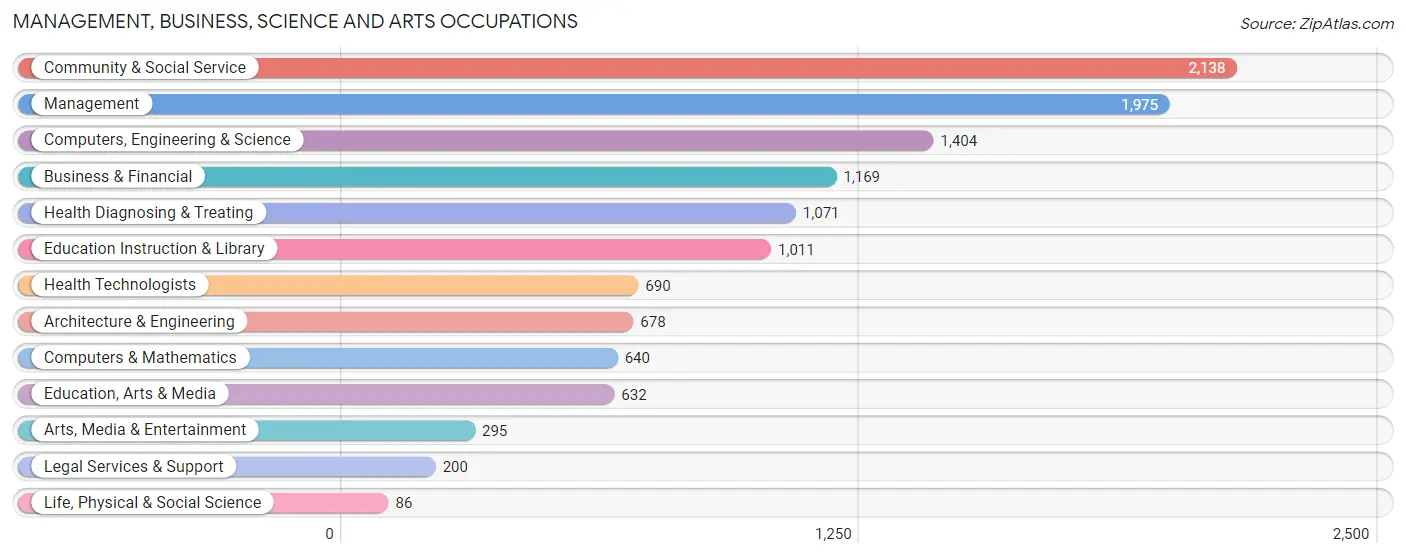
Management, Business, Science and Arts Occupations
The most common Management, Business, Science and Arts occupations in Decatur are Community & Social Service (2,138 | 8.4%), Management (1,975 | 7.7%), Computers, Engineering & Science (1,404 | 5.5%), Business & Financial (1,169 | 4.6%), and Health Diagnosing & Treating (1,071 | 4.2%).
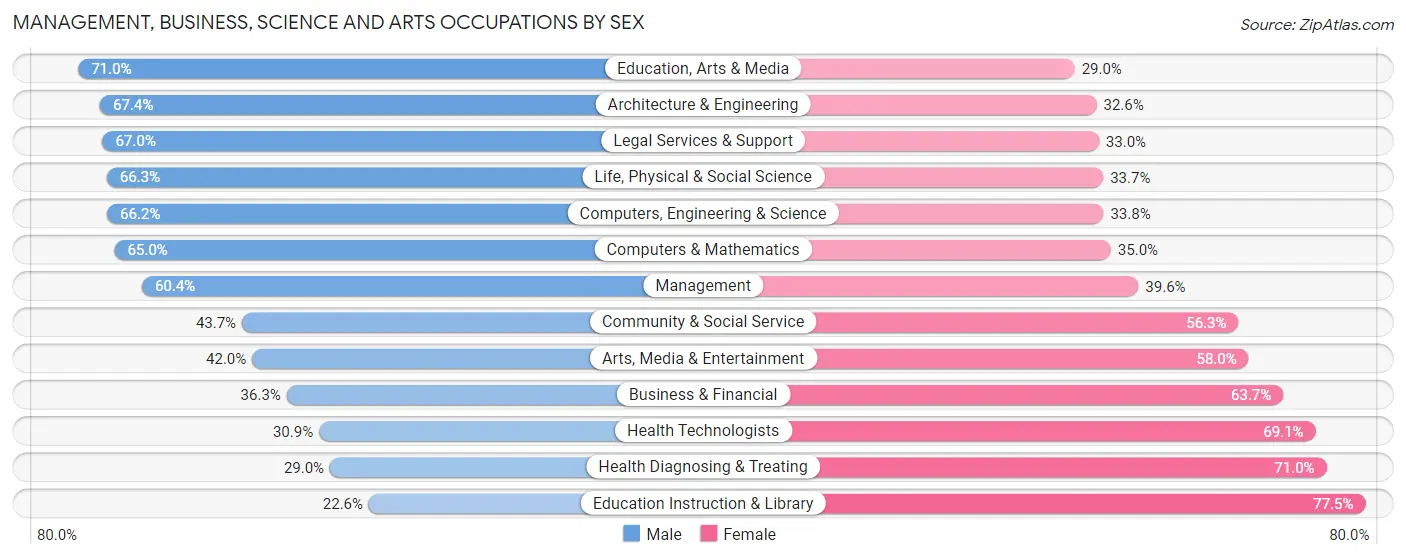
Management, Business, Science and Arts Occupations by Sex
Within the Management, Business, Science and Arts occupations in Decatur, the most male-oriented occupations are Education, Arts & Media (71.0%), Architecture & Engineering (67.4%), and Legal Services & Support (67.0%), while the most female-oriented occupations are Education Instruction & Library (77.4%), Health Diagnosing & Treating (71.0%), and Health Technologists (69.1%).
| Occupation | Male | Female |
| Management | 1,193 (60.4%) | 782 (39.6%) |
| Business & Financial | 424 (36.3%) | 745 (63.7%) |
| Computers, Engineering & Science | 930 (66.2%) | 474 (33.8%) |
| Computers & Mathematics | 416 (65.0%) | 224 (35.0%) |
| Architecture & Engineering | 457 (67.4%) | 221 (32.6%) |
| Life, Physical & Social Science | 57 (66.3%) | 29 (33.7%) |
| Community & Social Service | 935 (43.7%) | 1,203 (56.3%) |
| Education, Arts & Media | 449 (71.0%) | 183 (29.0%) |
| Legal Services & Support | 134 (67.0%) | 66 (33.0%) |
| Education Instruction & Library | 228 (22.6%) | 783 (77.4%) |
| Arts, Media & Entertainment | 124 (42.0%) | 171 (58.0%) |
| Health Diagnosing & Treating | 311 (29.0%) | 760 (71.0%) |
| Health Technologists | 213 (30.9%) | 477 (69.1%) |
| Total (Category) | 3,793 (48.9%) | 3,964 (51.1%) |
| Total (Overall) | 14,634 (57.1%) | 10,976 (42.9%) |
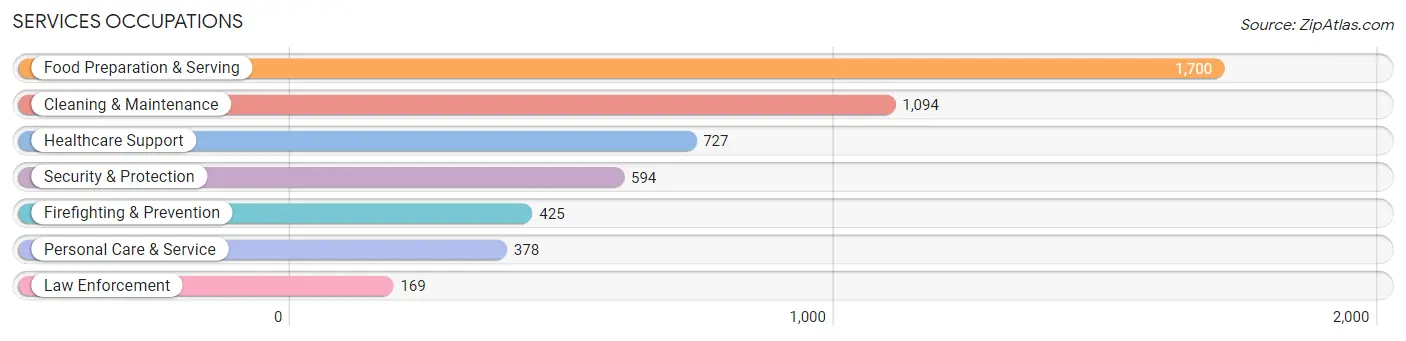
Services Occupations
The most common Services occupations in Decatur are Food Preparation & Serving (1,700 | 6.6%), Cleaning & Maintenance (1,094 | 4.3%), Healthcare Support (727 | 2.8%), Security & Protection (594 | 2.3%), and Firefighting & Prevention (425 | 1.7%).
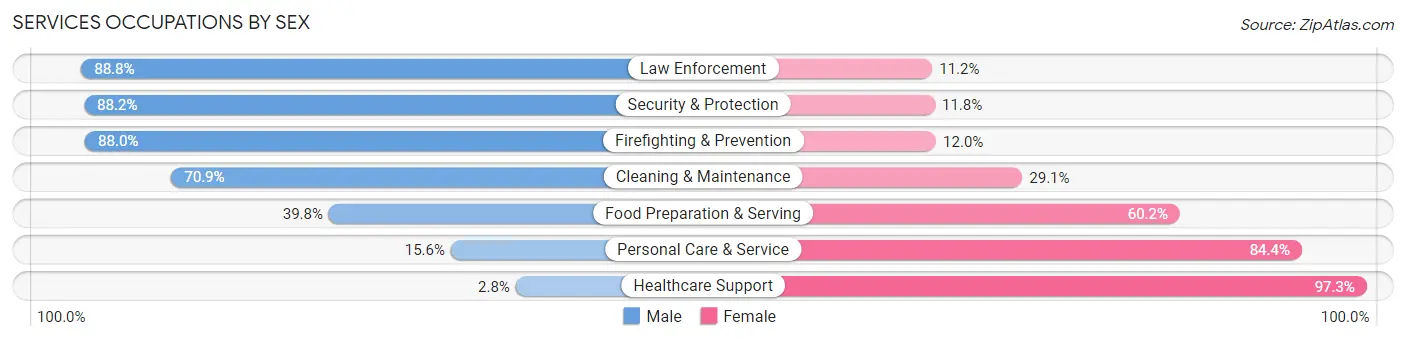
Services Occupations by Sex
Within the Services occupations in Decatur, the most male-oriented occupations are Law Enforcement (88.8%), Security & Protection (88.2%), and Firefighting & Prevention (88.0%), while the most female-oriented occupations are Healthcare Support (97.3%), Personal Care & Service (84.4%), and Food Preparation & Serving (60.2%).
| Occupation | Male | Female |
| Healthcare Support | 20 (2.8%) | 707 (97.3%) |
| Security & Protection | 524 (88.2%) | 70 (11.8%) |
| Firefighting & Prevention | 374 (88.0%) | 51 (12.0%) |
| Law Enforcement | 150 (88.8%) | 19 (11.2%) |
| Food Preparation & Serving | 676 (39.8%) | 1,024 (60.2%) |
| Cleaning & Maintenance | 776 (70.9%) | 318 (29.1%) |
| Personal Care & Service | 59 (15.6%) | 319 (84.4%) |
| Total (Category) | 2,055 (45.7%) | 2,438 (54.3%) |
| Total (Overall) | 14,634 (57.1%) | 10,976 (42.9%) |
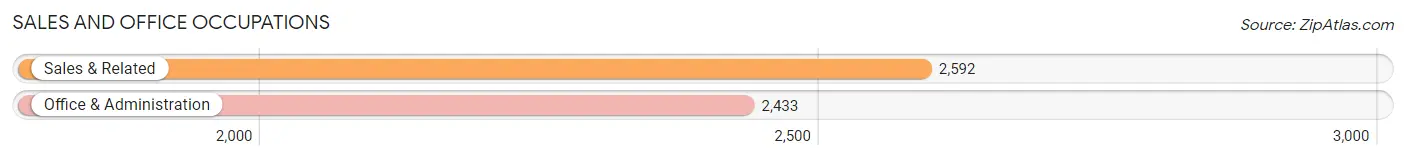
Sales and Office Occupations
The most common Sales and Office occupations in Decatur are Sales & Related (2,592 | 10.1%), and Office & Administration (2,433 | 9.5%).
Sales and Office Occupations by Sex
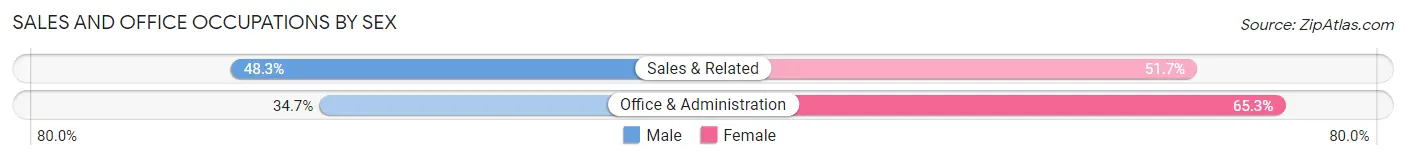
| Occupation | Male | Female |
| Sales & Related | 1,251 (48.3%) | 1,341 (51.7%) |
| Office & Administration | 844 (34.7%) | 1,589 (65.3%) |
| Total (Category) | 2,095 (41.7%) | 2,930 (58.3%) |
| Total (Overall) | 14,634 (57.1%) | 10,976 (42.9%) |
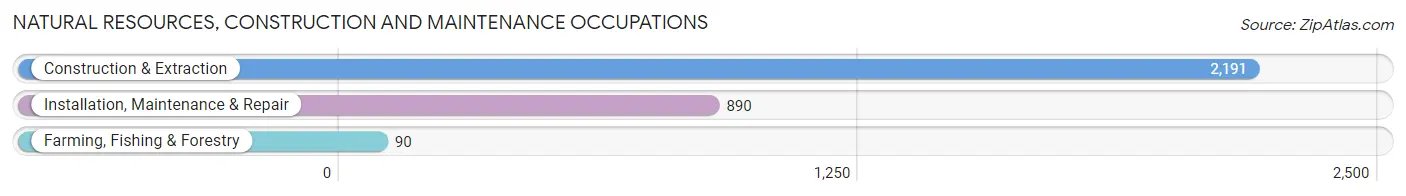
Natural Resources, Construction and Maintenance Occupations
The most common Natural Resources, Construction and Maintenance occupations in Decatur are Construction & Extraction (2,191 | 8.6%), Installation, Maintenance & Repair (890 | 3.5%), and Farming, Fishing & Forestry (90 | 0.4%).
Natural Resources, Construction and Maintenance Occupations by Sex
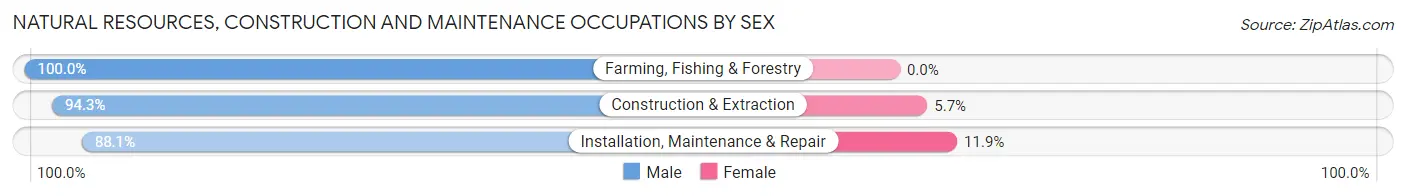
| Occupation | Male | Female |
| Farming, Fishing & Forestry | 90 (100.0%) | 0 (0.0%) |
| Construction & Extraction | 2,066 (94.3%) | 125 (5.7%) |
| Installation, Maintenance & Repair | 784 (88.1%) | 106 (11.9%) |
| Total (Category) | 2,940 (92.7%) | 231 (7.3%) |
| Total (Overall) | 14,634 (57.1%) | 10,976 (42.9%) |
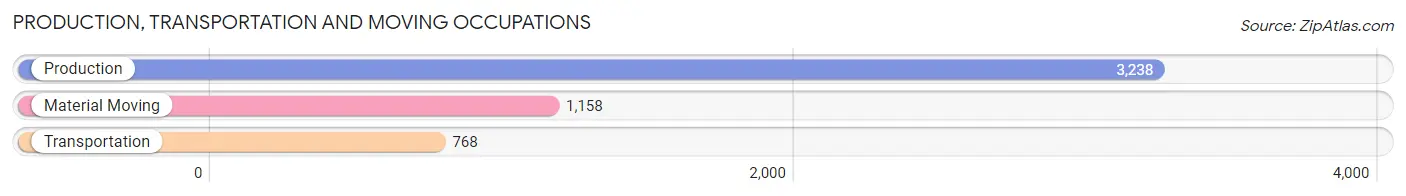
Production, Transportation and Moving Occupations
The most common Production, Transportation and Moving occupations in Decatur are Production (3,238 | 12.6%), Material Moving (1,158 | 4.5%), and Transportation (768 | 3.0%).
Production, Transportation and Moving Occupations by Sex
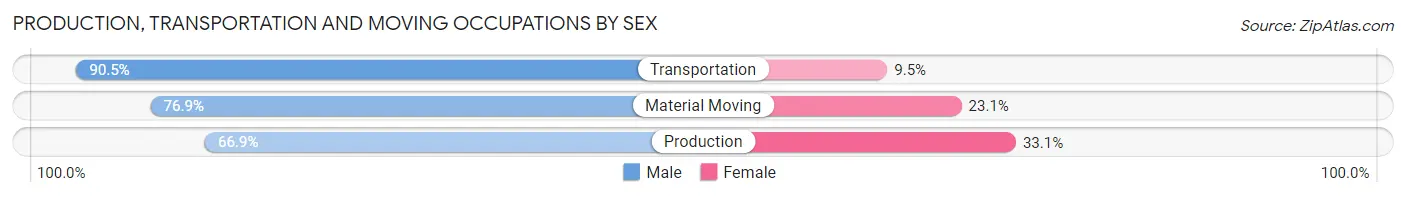
| Occupation | Male | Female |
| Production | 2,166 (66.9%) | 1,072 (33.1%) |
| Transportation | 695 (90.5%) | 73 (9.5%) |
| Material Moving | 890 (76.9%) | 268 (23.1%) |
| Total (Category) | 3,751 (72.6%) | 1,413 (27.4%) |
| Total (Overall) | 14,634 (57.1%) | 10,976 (42.9%) |
Employment Industries by Sex in Decatur
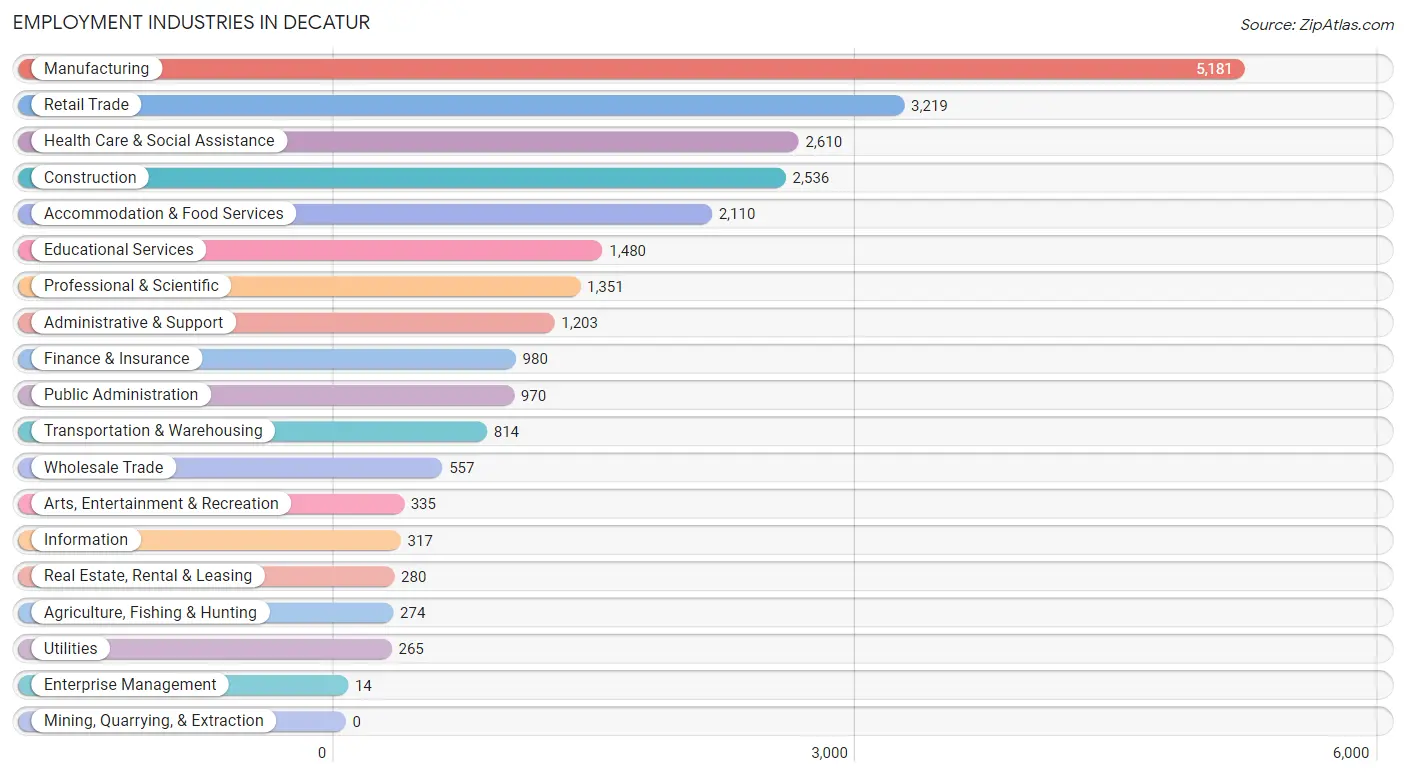
Employment Industries in Decatur
The major employment industries in Decatur include Manufacturing (5,181 | 20.2%), Retail Trade (3,219 | 12.6%), Health Care & Social Assistance (2,610 | 10.2%), Construction (2,536 | 9.9%), and Accommodation & Food Services (2,110 | 8.2%).
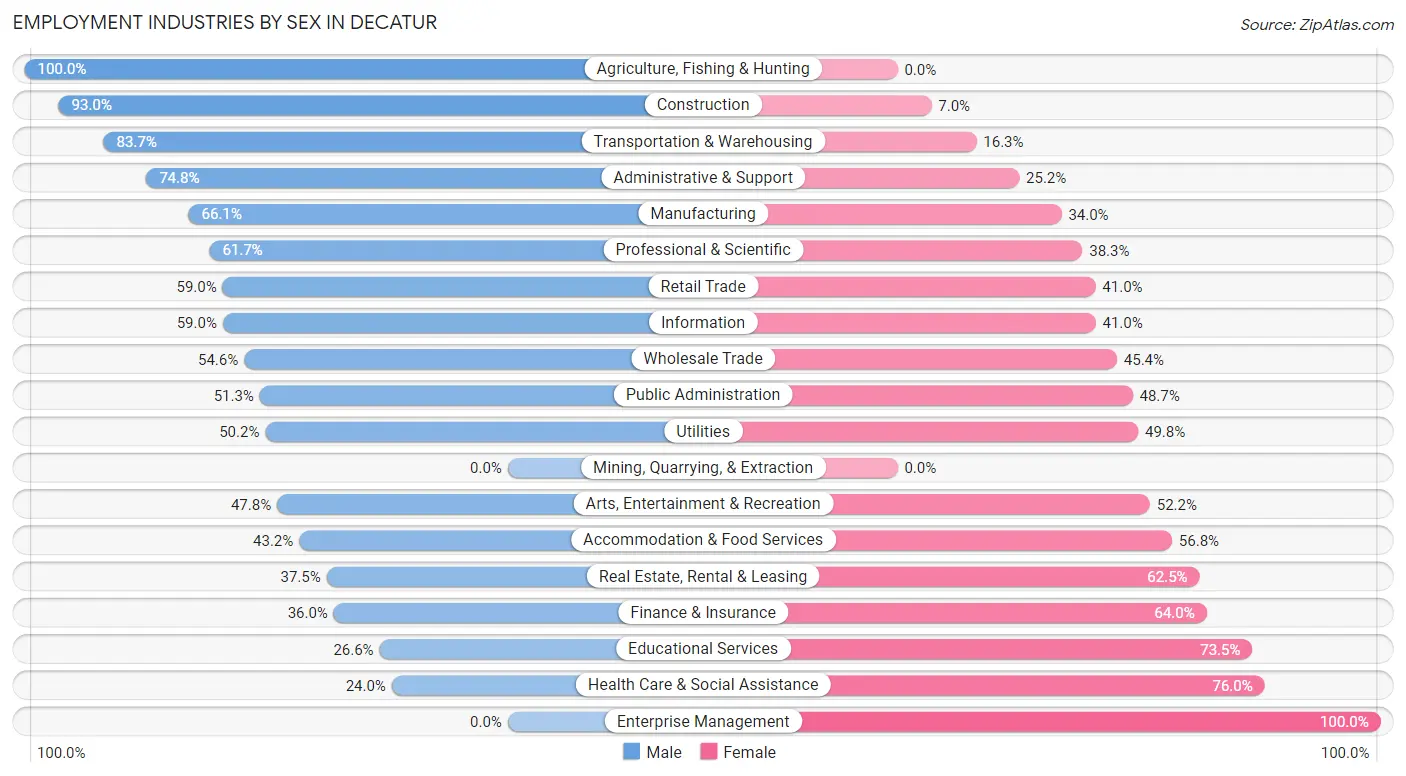
Employment Industries by Sex in Decatur
The Decatur industries that see more men than women are Agriculture, Fishing & Hunting (100.0%), Construction (93.0%), and Transportation & Warehousing (83.7%), whereas the industries that tend to have a higher number of women are Enterprise Management (100.0%), Health Care & Social Assistance (76.0%), and Educational Services (73.5%).
| Industry | Male | Female |
| Agriculture, Fishing & Hunting | 274 (100.0%) | 0 (0.0%) |
| Mining, Quarrying, & Extraction | 0 (0.0%) | 0 (0.0%) |
| Construction | 2,358 (93.0%) | 178 (7.0%) |
| Manufacturing | 3,422 (66.0%) | 1,759 (34.0%) |
| Wholesale Trade | 304 (54.6%) | 253 (45.4%) |
| Retail Trade | 1,900 (59.0%) | 1,319 (41.0%) |
| Transportation & Warehousing | 681 (83.7%) | 133 (16.3%) |
| Utilities | 133 (50.2%) | 132 (49.8%) |
| Information | 187 (59.0%) | 130 (41.0%) |
| Finance & Insurance | 353 (36.0%) | 627 (64.0%) |
| Real Estate, Rental & Leasing | 105 (37.5%) | 175 (62.5%) |
| Professional & Scientific | 834 (61.7%) | 517 (38.3%) |
| Enterprise Management | 0 (0.0%) | 14 (100.0%) |
| Administrative & Support | 900 (74.8%) | 303 (25.2%) |
| Educational Services | 393 (26.6%) | 1,087 (73.5%) |
| Health Care & Social Assistance | 627 (24.0%) | 1,983 (76.0%) |
| Arts, Entertainment & Recreation | 160 (47.8%) | 175 (52.2%) |
| Accommodation & Food Services | 911 (43.2%) | 1,199 (56.8%) |
| Public Administration | 498 (51.3%) | 472 (48.7%) |
| Total | 14,634 (57.1%) | 10,976 (42.9%) |
Education in Decatur
School Enrollment in Decatur
The most common levels of schooling among the 13,343 students in Decatur are high school (3,175 | 23.8%), elementary school (3,082 | 23.1%), and middle school (2,867 | 21.5%).
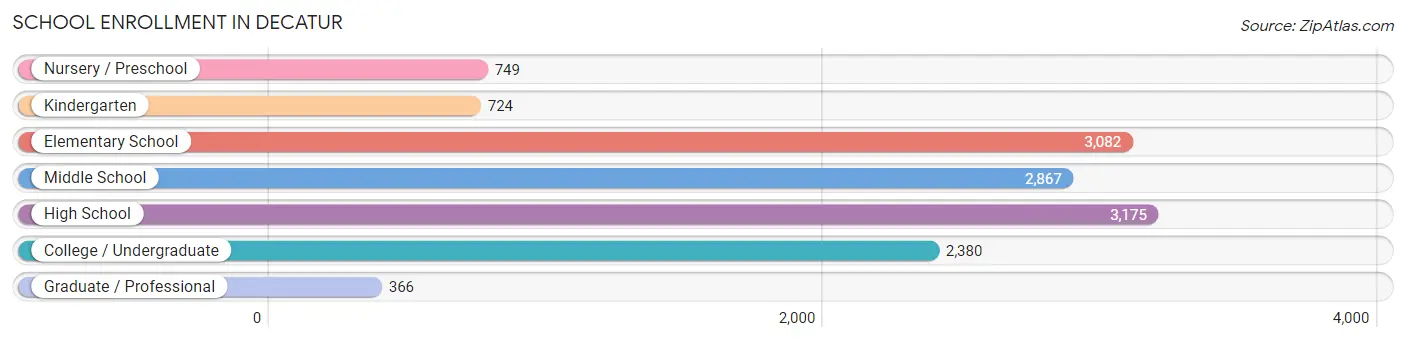
| School Level | # Students | % Students |
| Nursery / Preschool | 749 | 5.6% |
| Kindergarten | 724 | 5.4% |
| Elementary School | 3,082 | 23.1% |
| Middle School | 2,867 | 21.5% |
| High School | 3,175 | 23.8% |
| College / Undergraduate | 2,380 | 17.8% |
| Graduate / Professional | 366 | 2.7% |
| Total | 13,343 | 100.0% |
School Enrollment by Age by Funding Source in Decatur
Out of a total of 13,343 students who are enrolled in schools in Decatur, 1,241 (9.3%) attend a private institution, while the remaining 12,102 (90.7%) are enrolled in public schools. The age group of 3 to 4 year olds has the highest likelihood of being enrolled in private schools, with 275 (46.1% in the age bracket) enrolled. Conversely, the age group of 18 to 19 year olds has the lowest likelihood of being enrolled in a private school, with 808 (95.7% in the age bracket) attending a public institution.
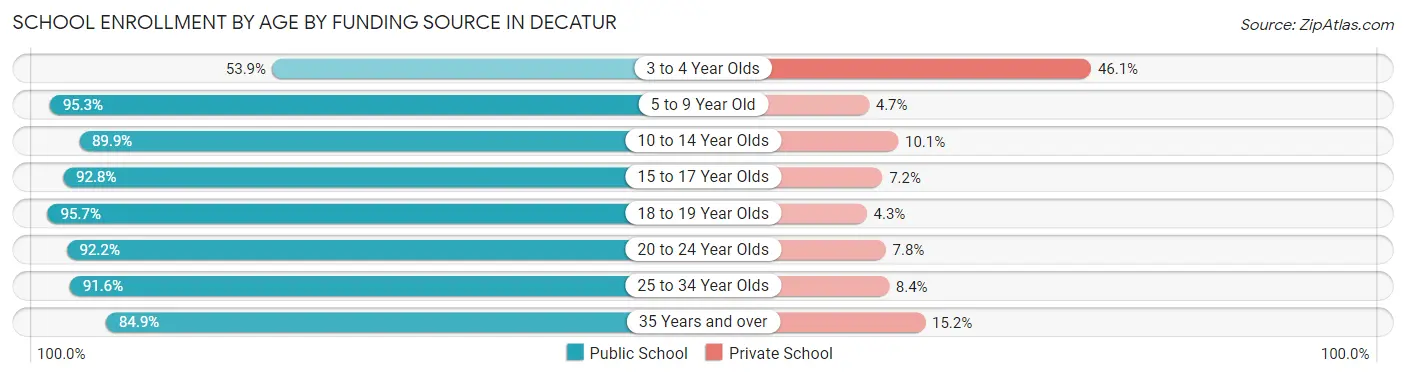
| Age Bracket | Public School | Private School |
| 3 to 4 Year Olds | 322 (53.9%) | 275 (46.1%) |
| 5 to 9 Year Old | 3,339 (95.3%) | 164 (4.7%) |
| 10 to 14 Year Olds | 3,202 (89.9%) | 361 (10.1%) |
| 15 to 17 Year Olds | 2,327 (92.8%) | 180 (7.2%) |
| 18 to 19 Year Olds | 808 (95.7%) | 36 (4.3%) |
| 20 to 24 Year Olds | 815 (92.2%) | 69 (7.8%) |
| 25 to 34 Year Olds | 870 (91.6%) | 80 (8.4%) |
| 35 Years and over | 420 (84.9%) | 75 (15.1%) |
| Total | 12,102 (90.7%) | 1,241 (9.3%) |
Educational Attainment by Field of Study in Decatur
Business (2,536 | 25.4%), education (1,505 | 15.0%), science & technology (1,015 | 10.2%), engineering (952 | 9.5%), and liberal arts & history (694 | 6.9%) are the most common fields of study among 9,998 individuals in Decatur who have obtained a bachelor's degree or higher.
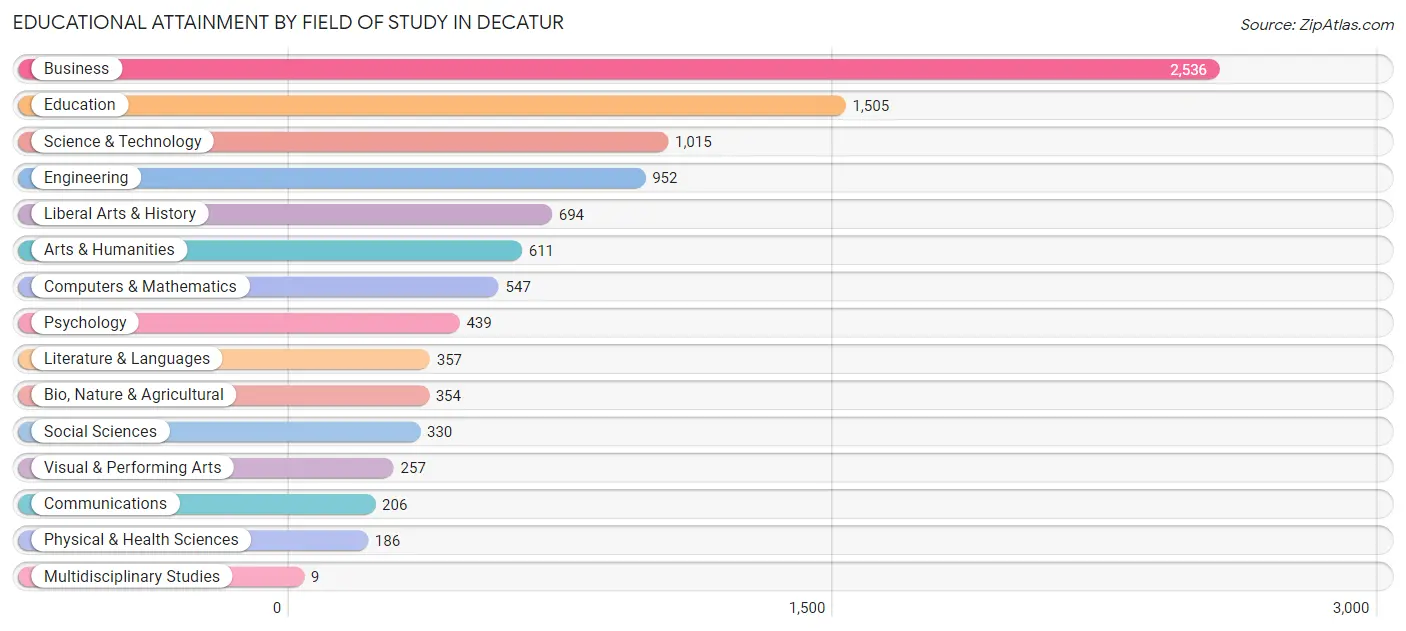
| Field of Study | # Graduates | % Graduates |
| Computers & Mathematics | 547 | 5.5% |
| Bio, Nature & Agricultural | 354 | 3.5% |
| Physical & Health Sciences | 186 | 1.9% |
| Psychology | 439 | 4.4% |
| Social Sciences | 330 | 3.3% |
| Engineering | 952 | 9.5% |
| Multidisciplinary Studies | 9 | 0.1% |
| Science & Technology | 1,015 | 10.2% |
| Business | 2,536 | 25.4% |
| Education | 1,505 | 15.0% |
| Literature & Languages | 357 | 3.6% |
| Liberal Arts & History | 694 | 6.9% |
| Visual & Performing Arts | 257 | 2.6% |
| Communications | 206 | 2.1% |
| Arts & Humanities | 611 | 6.1% |
| Total | 9,998 | 100.0% |
Transportation & Commute in Decatur
Vehicle Availability by Sex in Decatur
The most prevalent vehicle ownership categories in Decatur are males with 2 vehicles (5,564, accounting for 39.0%) and females with 2 vehicles (4,277, making up 51.3%).
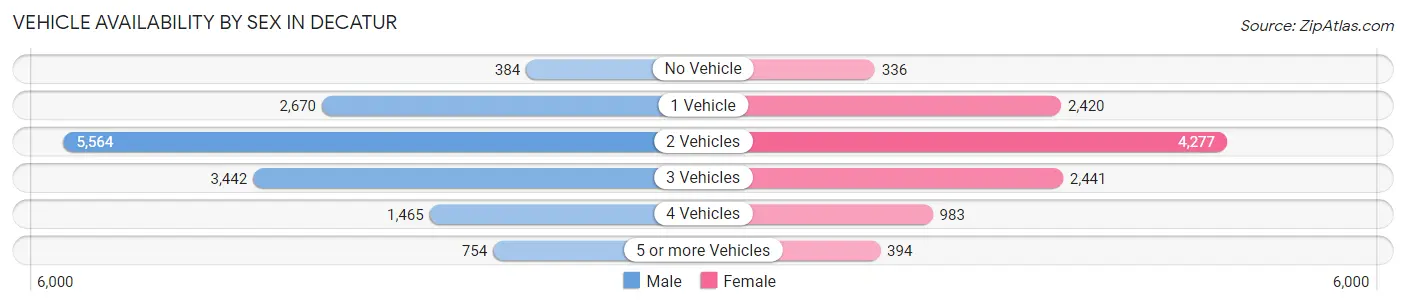
| Vehicles Available | Male | Female |
| No Vehicle | 384 (2.7%) | 336 (3.1%) |
| 1 Vehicle | 2,670 (18.7%) | 2,420 (22.3%) |
| 2 Vehicles | 5,564 (39.0%) | 4,277 (39.4%) |
| 3 Vehicles | 3,442 (24.1%) | 2,441 (22.5%) |
| 4 Vehicles | 1,465 (10.3%) | 983 (9.1%) |
| 5 or more Vehicles | 754 (5.3%) | 394 (3.6%) |
| Total | 14,279 (100.0%) | 10,851 (100.0%) |
Commute Time in Decatur
The most frequently occuring commute durations in Decatur are 10 to 14 minutes (5,330 commuters, 22.0%), 5 to 9 minutes (4,449 commuters, 18.4%), and 15 to 19 minutes (4,054 commuters, 16.8%).
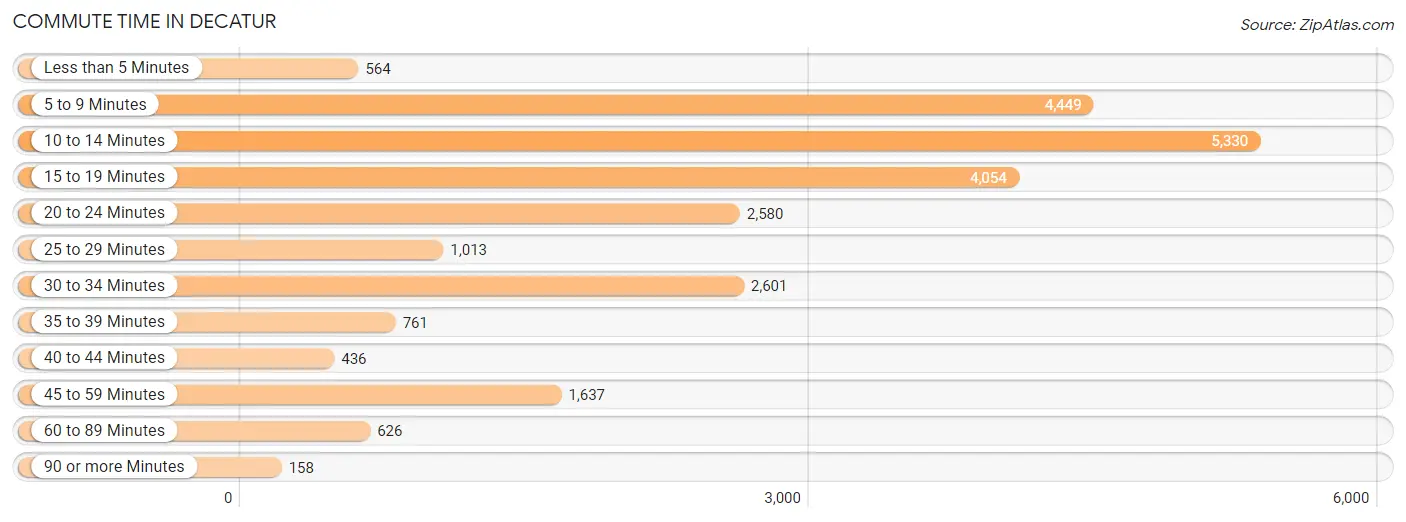
| Commute Time | # Commuters | % Commuters |
| Less than 5 Minutes | 564 | 2.3% |
| 5 to 9 Minutes | 4,449 | 18.4% |
| 10 to 14 Minutes | 5,330 | 22.0% |
| 15 to 19 Minutes | 4,054 | 16.8% |
| 20 to 24 Minutes | 2,580 | 10.7% |
| 25 to 29 Minutes | 1,013 | 4.2% |
| 30 to 34 Minutes | 2,601 | 10.7% |
| 35 to 39 Minutes | 761 | 3.1% |
| 40 to 44 Minutes | 436 | 1.8% |
| 45 to 59 Minutes | 1,637 | 6.8% |
| 60 to 89 Minutes | 626 | 2.6% |
| 90 or more Minutes | 158 | 0.6% |
Commute Time by Sex in Decatur
The most common commute times in Decatur are 10 to 14 minutes (2,664 commuters, 19.3%) for males and 10 to 14 minutes (2,666 commuters, 25.6%) for females.
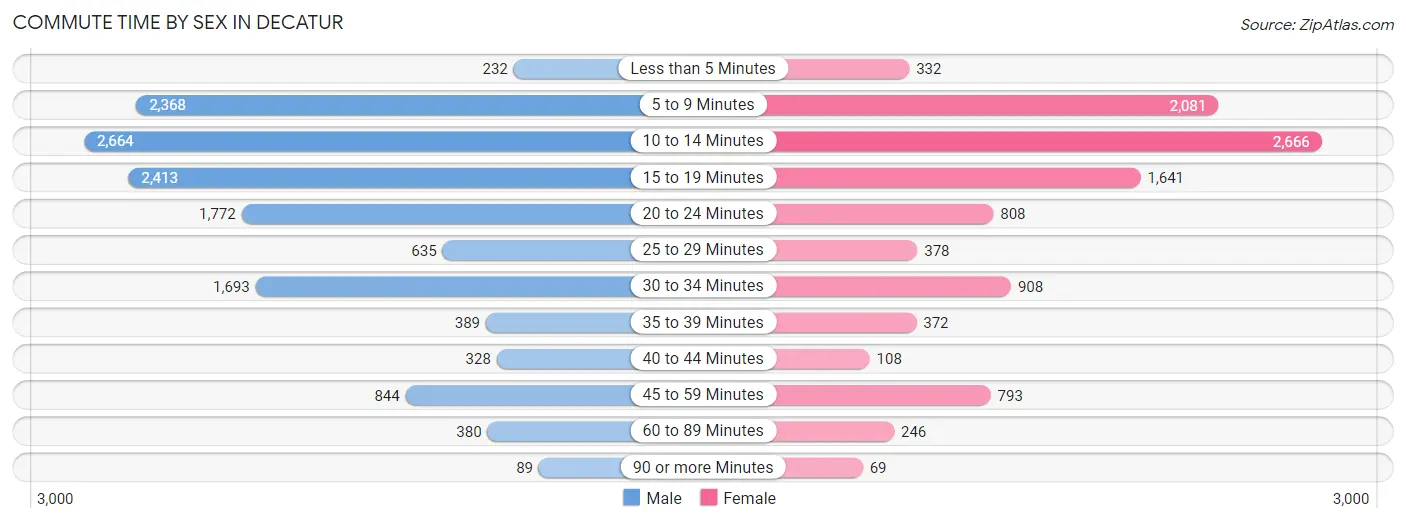
| Commute Time | Male | Female |
| Less than 5 Minutes | 232 (1.7%) | 332 (3.2%) |
| 5 to 9 Minutes | 2,368 (17.2%) | 2,081 (20.0%) |
| 10 to 14 Minutes | 2,664 (19.3%) | 2,666 (25.6%) |
| 15 to 19 Minutes | 2,413 (17.5%) | 1,641 (15.8%) |
| 20 to 24 Minutes | 1,772 (12.8%) | 808 (7.8%) |
| 25 to 29 Minutes | 635 (4.6%) | 378 (3.6%) |
| 30 to 34 Minutes | 1,693 (12.3%) | 908 (8.7%) |
| 35 to 39 Minutes | 389 (2.8%) | 372 (3.6%) |
| 40 to 44 Minutes | 328 (2.4%) | 108 (1.0%) |
| 45 to 59 Minutes | 844 (6.1%) | 793 (7.6%) |
| 60 to 89 Minutes | 380 (2.8%) | 246 (2.4%) |
| 90 or more Minutes | 89 (0.6%) | 69 (0.7%) |
Time of Departure to Work by Sex in Decatur
The most frequent times of departure to work in Decatur are 6:00 AM to 6:29 AM (1,807, 13.1%) for males and 7:00 AM to 7:29 AM (1,871, 18.0%) for females.
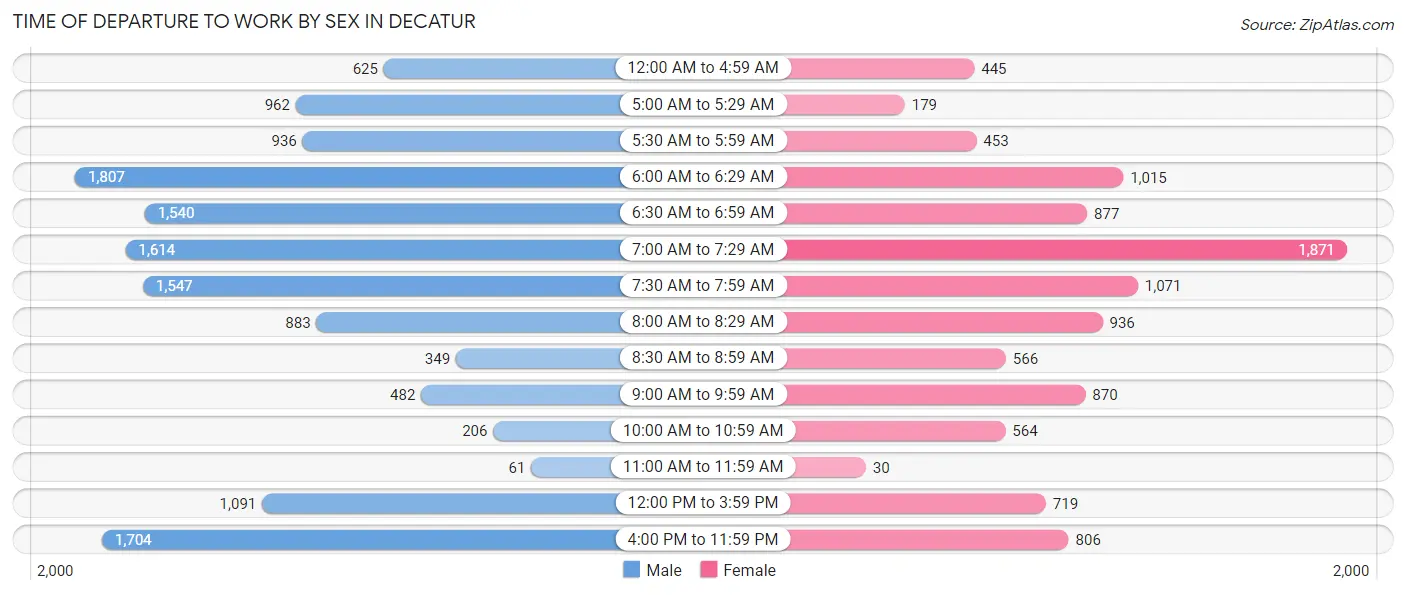
| Time of Departure | Male | Female |
| 12:00 AM to 4:59 AM | 625 (4.5%) | 445 (4.3%) |
| 5:00 AM to 5:29 AM | 962 (7.0%) | 179 (1.7%) |
| 5:30 AM to 5:59 AM | 936 (6.8%) | 453 (4.3%) |
| 6:00 AM to 6:29 AM | 1,807 (13.1%) | 1,015 (9.8%) |
| 6:30 AM to 6:59 AM | 1,540 (11.2%) | 877 (8.4%) |
| 7:00 AM to 7:29 AM | 1,614 (11.7%) | 1,871 (18.0%) |
| 7:30 AM to 7:59 AM | 1,547 (11.2%) | 1,071 (10.3%) |
| 8:00 AM to 8:29 AM | 883 (6.4%) | 936 (9.0%) |
| 8:30 AM to 8:59 AM | 349 (2.5%) | 566 (5.4%) |
| 9:00 AM to 9:59 AM | 482 (3.5%) | 870 (8.4%) |
| 10:00 AM to 10:59 AM | 206 (1.5%) | 564 (5.4%) |
| 11:00 AM to 11:59 AM | 61 (0.4%) | 30 (0.3%) |
| 12:00 PM to 3:59 PM | 1,091 (7.9%) | 719 (6.9%) |
| 4:00 PM to 11:59 PM | 1,704 (12.3%) | 806 (7.7%) |
| Total | 13,807 (100.0%) | 10,402 (100.0%) |
Housing Occupancy in Decatur
Occupancy by Ownership in Decatur
Of the total 23,674 dwellings in Decatur, owner-occupied units account for 15,112 (63.8%), while renter-occupied units make up 8,562 (36.2%).
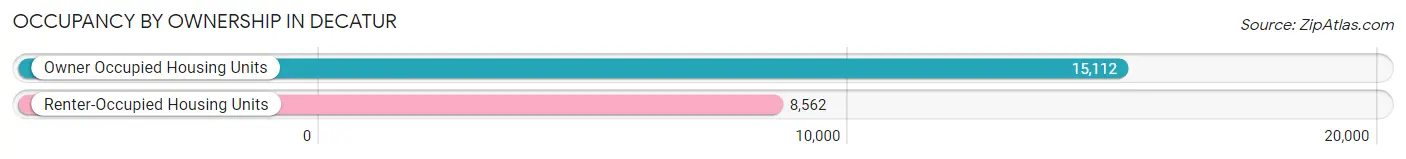
| Occupancy | # Housing Units | % Housing Units |
| Owner Occupied Housing Units | 15,112 | 63.8% |
| Renter-Occupied Housing Units | 8,562 | 36.2% |
| Total Occupied Housing Units | 23,674 | 100.0% |
Occupancy by Household Size in Decatur
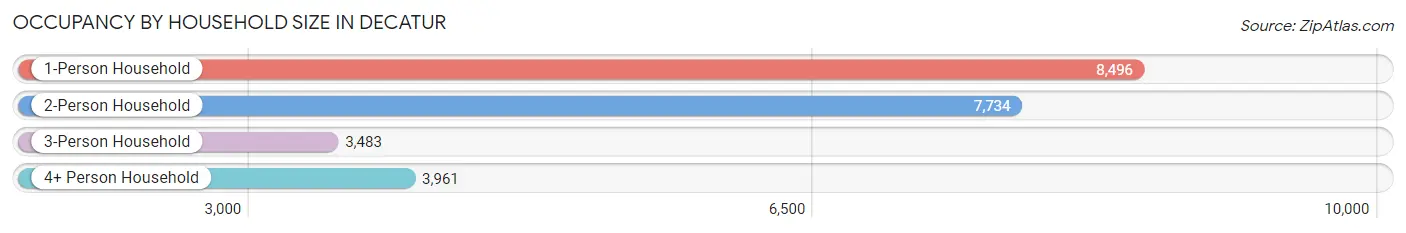
| Household Size | # Housing Units | % Housing Units |
| 1-Person Household | 8,496 | 35.9% |
| 2-Person Household | 7,734 | 32.7% |
| 3-Person Household | 3,483 | 14.7% |
| 4+ Person Household | 3,961 | 16.7% |
| Total Housing Units | 23,674 | 100.0% |
Occupancy by Ownership by Household Size in Decatur
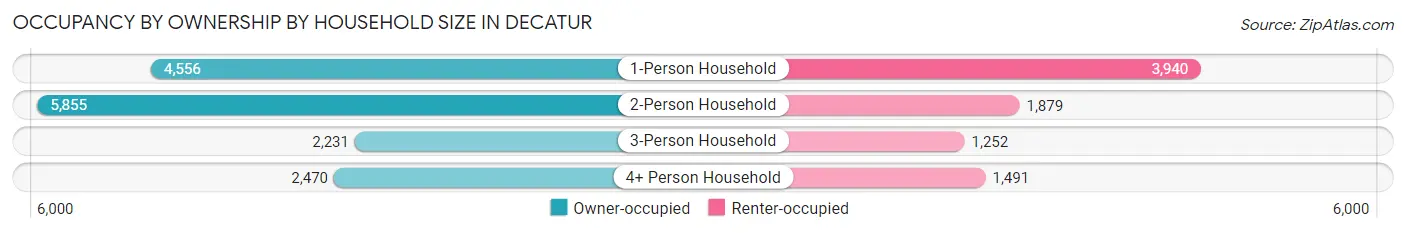
| Household Size | Owner-occupied | Renter-occupied |
| 1-Person Household | 4,556 (53.6%) | 3,940 (46.4%) |
| 2-Person Household | 5,855 (75.7%) | 1,879 (24.3%) |
| 3-Person Household | 2,231 (64.0%) | 1,252 (35.9%) |
| 4+ Person Household | 2,470 (62.4%) | 1,491 (37.6%) |
| Total Housing Units | 15,112 (63.8%) | 8,562 (36.2%) |
Occupancy by Educational Attainment in Decatur
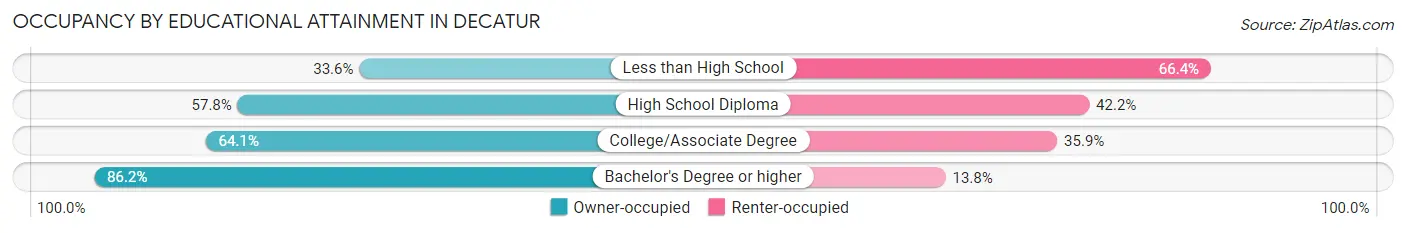
| Household Size | Owner-occupied | Renter-occupied |
| Less than High School | 1,137 (33.6%) | 2,243 (66.4%) |
| High School Diploma | 3,548 (57.8%) | 2,594 (42.2%) |
| College/Associate Degree | 5,154 (64.1%) | 2,884 (35.9%) |
| Bachelor's Degree or higher | 5,273 (86.2%) | 841 (13.8%) |
Occupancy by Age of Householder in Decatur
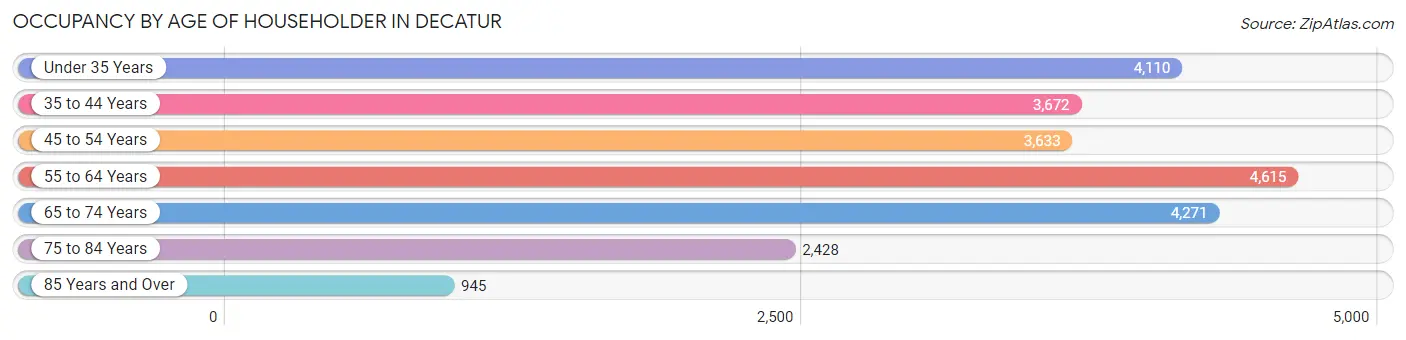
| Age Bracket | # Households | % Households |
| Under 35 Years | 4,110 | 17.4% |
| 35 to 44 Years | 3,672 | 15.5% |
| 45 to 54 Years | 3,633 | 15.3% |
| 55 to 64 Years | 4,615 | 19.5% |
| 65 to 74 Years | 4,271 | 18.0% |
| 75 to 84 Years | 2,428 | 10.3% |
| 85 Years and Over | 945 | 4.0% |
| Total | 23,674 | 100.0% |
Housing Finances in Decatur
Median Income by Occupancy in Decatur
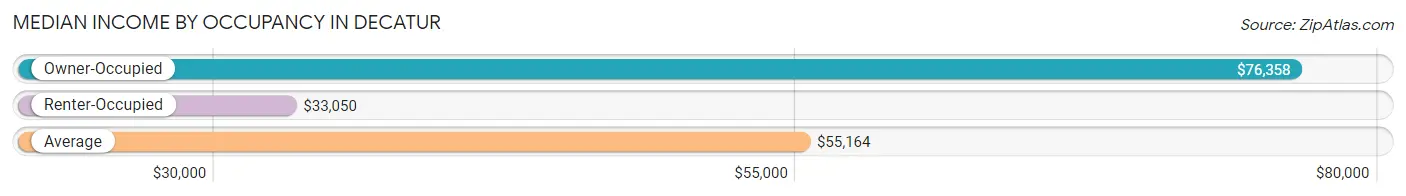
| Occupancy Type | # Households | Median Income |
| Owner-Occupied | 15,112 (63.8%) | $76,358 |
| Renter-Occupied | 8,562 (36.2%) | $33,050 |
| Average | 23,674 (100.0%) | $55,164 |
Occupancy by Householder Income Bracket in Decatur
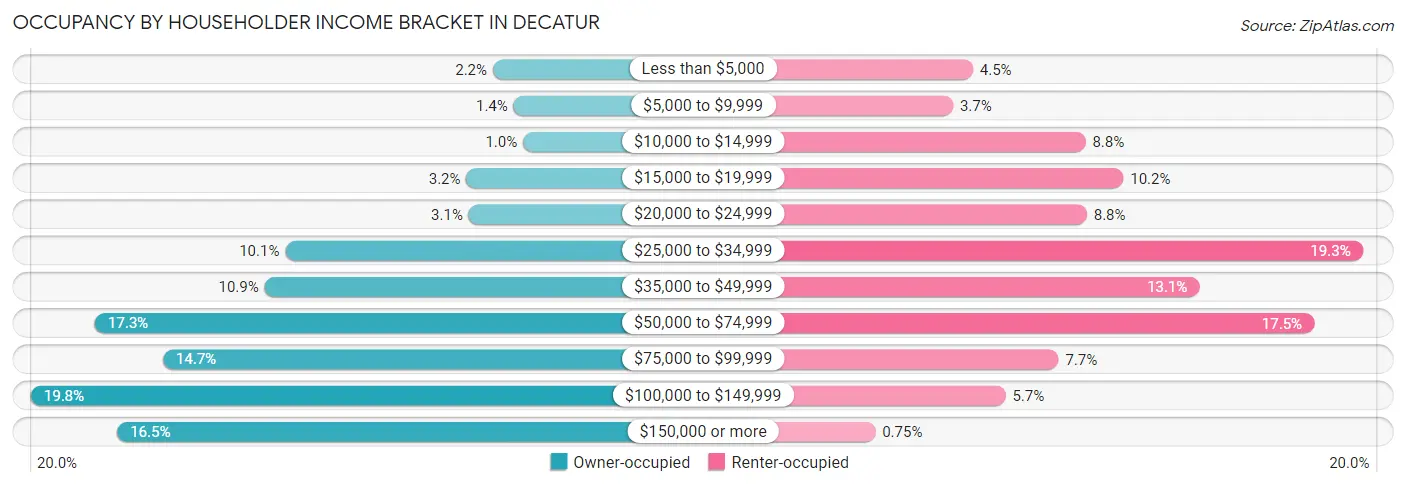
| Income Bracket | Owner-occupied | Renter-occupied |
| Less than $5,000 | 326 (2.2%) | 383 (4.5%) |
| $5,000 to $9,999 | 207 (1.4%) | 318 (3.7%) |
| $10,000 to $14,999 | 153 (1.0%) | 750 (8.8%) |
| $15,000 to $19,999 | 479 (3.2%) | 873 (10.2%) |
| $20,000 to $24,999 | 465 (3.1%) | 754 (8.8%) |
| $25,000 to $34,999 | 1,522 (10.1%) | 1,653 (19.3%) |
| $35,000 to $49,999 | 1,641 (10.9%) | 1,121 (13.1%) |
| $50,000 to $74,999 | 2,618 (17.3%) | 1,495 (17.5%) |
| $75,000 to $99,999 | 2,226 (14.7%) | 662 (7.7%) |
| $100,000 to $149,999 | 2,986 (19.8%) | 489 (5.7%) |
| $150,000 or more | 2,489 (16.5%) | 64 (0.7%) |
| Total | 15,112 (100.0%) | 8,562 (100.0%) |
Monthly Housing Cost Tiers in Decatur
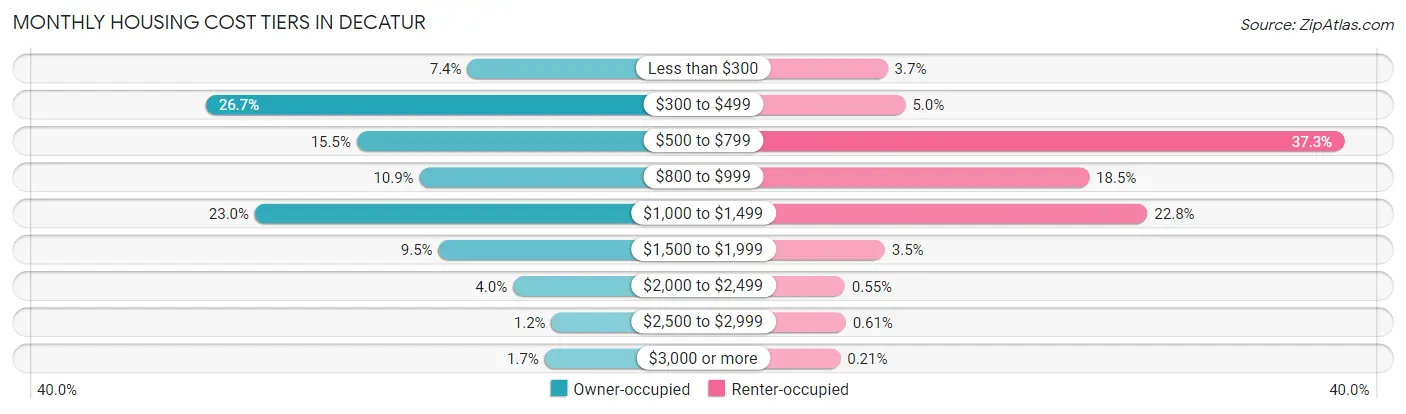
| Monthly Cost | Owner-occupied | Renter-occupied |
| Less than $300 | 1,117 (7.4%) | 317 (3.7%) |
| $300 to $499 | 4,028 (26.7%) | 429 (5.0%) |
| $500 to $799 | 2,348 (15.5%) | 3,194 (37.3%) |
| $800 to $999 | 1,650 (10.9%) | 1,587 (18.5%) |
| $1,000 to $1,499 | 3,482 (23.0%) | 1,955 (22.8%) |
| $1,500 to $1,999 | 1,439 (9.5%) | 299 (3.5%) |
| $2,000 to $2,499 | 609 (4.0%) | 47 (0.5%) |
| $2,500 to $2,999 | 182 (1.2%) | 52 (0.6%) |
| $3,000 or more | 257 (1.7%) | 18 (0.2%) |
| Total | 15,112 (100.0%) | 8,562 (100.0%) |
Physical Housing Characteristics in Decatur
Housing Structures in Decatur
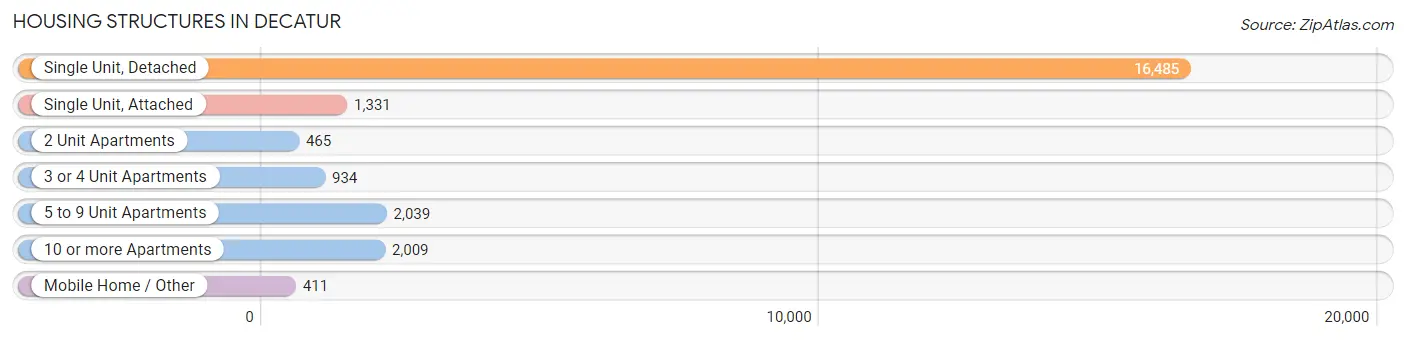
| Structure Type | # Housing Units | % Housing Units |
| Single Unit, Detached | 16,485 | 69.6% |
| Single Unit, Attached | 1,331 | 5.6% |
| 2 Unit Apartments | 465 | 2.0% |
| 3 or 4 Unit Apartments | 934 | 4.0% |
| 5 to 9 Unit Apartments | 2,039 | 8.6% |
| 10 or more Apartments | 2,009 | 8.5% |
| Mobile Home / Other | 411 | 1.7% |
| Total | 23,674 | 100.0% |
Housing Structures by Occupancy in Decatur
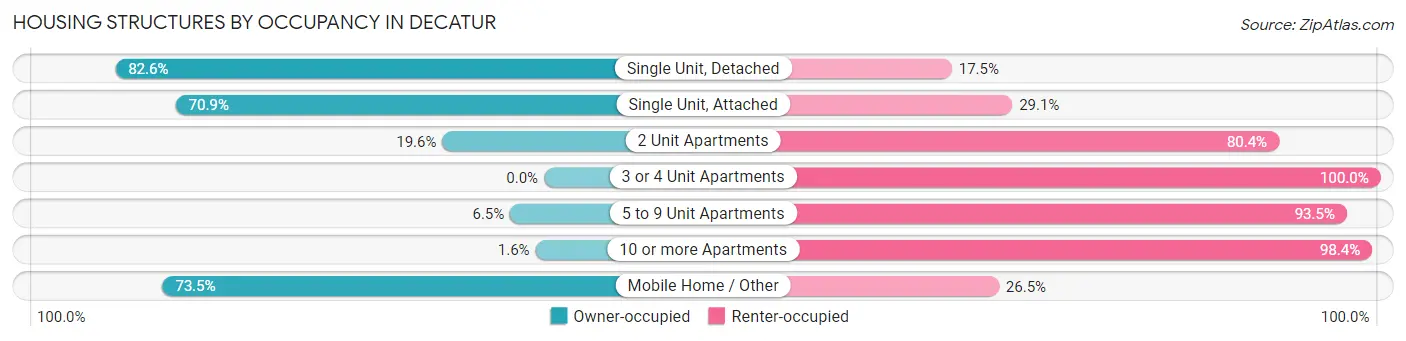
| Structure Type | Owner-occupied | Renter-occupied |
| Single Unit, Detached | 13,609 (82.6%) | 2,876 (17.4%) |
| Single Unit, Attached | 944 (70.9%) | 387 (29.1%) |
| 2 Unit Apartments | 91 (19.6%) | 374 (80.4%) |
| 3 or 4 Unit Apartments | 0 (0.0%) | 934 (100.0%) |
| 5 to 9 Unit Apartments | 133 (6.5%) | 1,906 (93.5%) |
| 10 or more Apartments | 33 (1.6%) | 1,976 (98.4%) |
| Mobile Home / Other | 302 (73.5%) | 109 (26.5%) |
| Total | 15,112 (63.8%) | 8,562 (36.2%) |
Housing Structures by Number of Rooms in Decatur
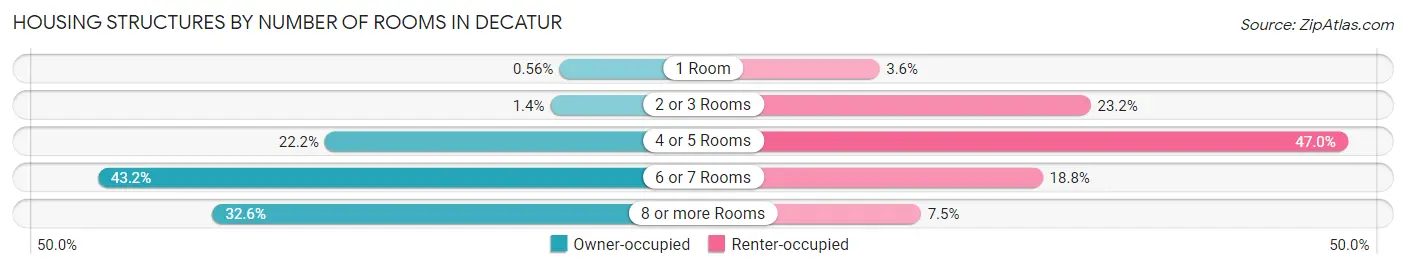
| Number of Rooms | Owner-occupied | Renter-occupied |
| 1 Room | 84 (0.6%) | 312 (3.6%) |
| 2 or 3 Rooms | 209 (1.4%) | 1,985 (23.2%) |
| 4 or 5 Rooms | 3,359 (22.2%) | 4,020 (46.9%) |
| 6 or 7 Rooms | 6,531 (43.2%) | 1,605 (18.8%) |
| 8 or more Rooms | 4,929 (32.6%) | 640 (7.5%) |
| Total | 15,112 (100.0%) | 8,562 (100.0%) |
Housing Structure by Heating Type in Decatur
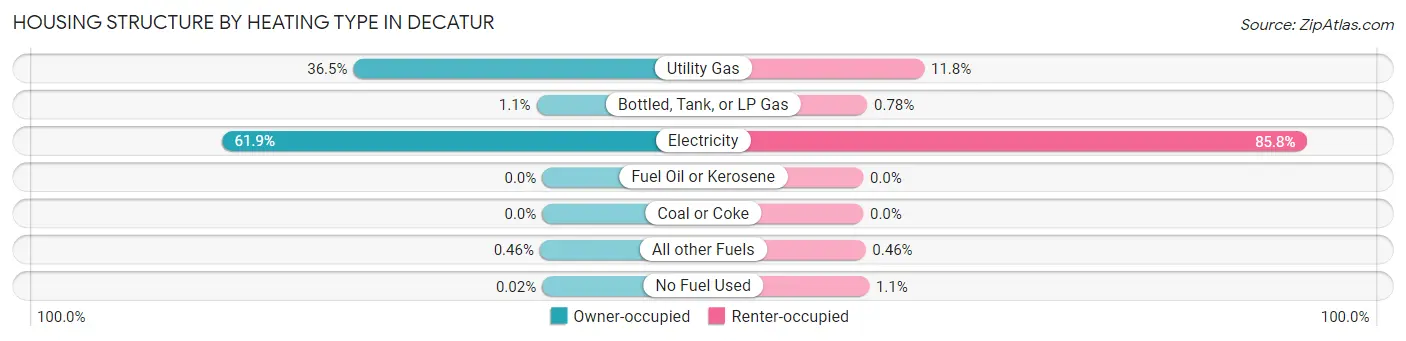
| Heating Type | Owner-occupied | Renter-occupied |
| Utility Gas | 5,515 (36.5%) | 1,009 (11.8%) |
| Bottled, Tank, or LP Gas | 164 (1.1%) | 67 (0.8%) |
| Electricity | 9,360 (61.9%) | 7,349 (85.8%) |
| Fuel Oil or Kerosene | 0 (0.0%) | 0 (0.0%) |
| Coal or Coke | 0 (0.0%) | 0 (0.0%) |
| All other Fuels | 70 (0.5%) | 39 (0.5%) |
| No Fuel Used | 3 (0.0%) | 98 (1.1%) |
| Total | 15,112 (100.0%) | 8,562 (100.0%) |
Household Vehicle Usage in Decatur
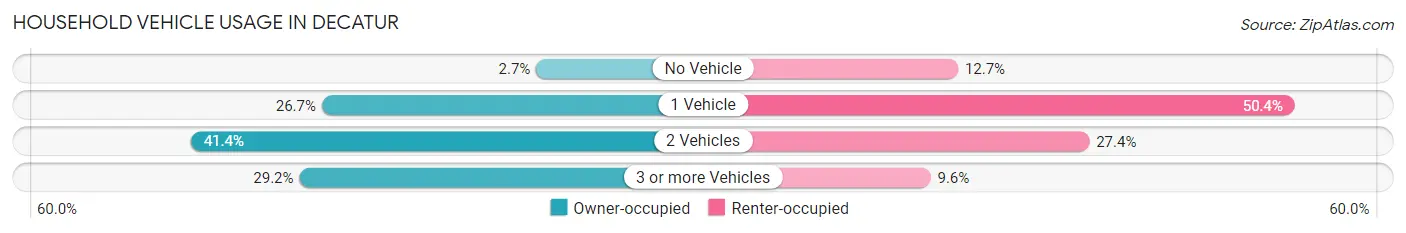
| Vehicles per Household | Owner-occupied | Renter-occupied |
| No Vehicle | 406 (2.7%) | 1,084 (12.7%) |
| 1 Vehicle | 4,036 (26.7%) | 4,314 (50.4%) |
| 2 Vehicles | 6,255 (41.4%) | 2,343 (27.4%) |
| 3 or more Vehicles | 4,415 (29.2%) | 821 (9.6%) |
| Total | 15,112 (100.0%) | 8,562 (100.0%) |
Real Estate & Mortgages in Decatur
Real Estate and Mortgage Overview in Decatur
| Characteristic | Without Mortgage | With Mortgage |
| Housing Units | 6,726 | 8,386 |
| Median Property Value | $171,000 | $169,500 |
| Median Household Income | $53,750 | $1,423 |
| Monthly Housing Costs | $410 | $238 |
| Real Estate Taxes | $618 | $812 |
Property Value by Mortgage Status in Decatur
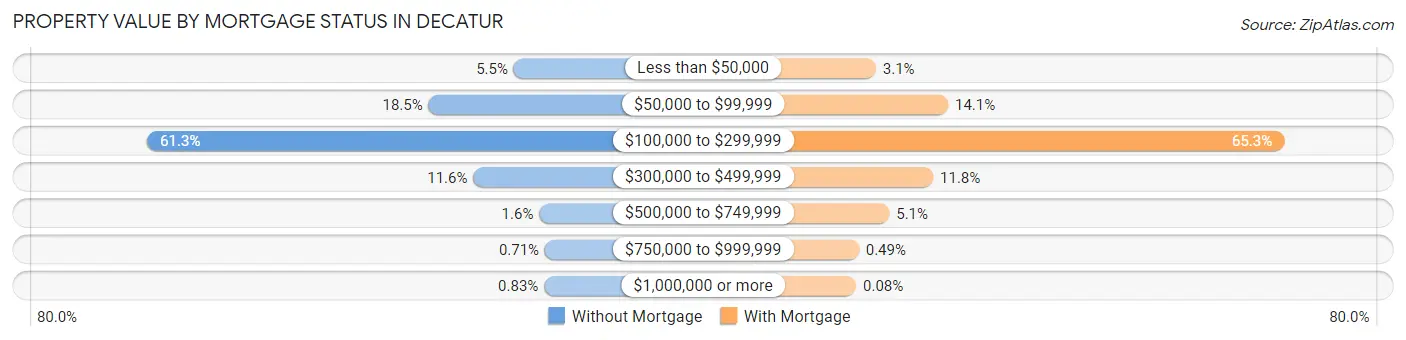
| Property Value | Without Mortgage | With Mortgage |
| Less than $50,000 | 367 (5.5%) | 259 (3.1%) |
| $50,000 to $99,999 | 1,241 (18.4%) | 1,182 (14.1%) |
| $100,000 to $299,999 | 4,126 (61.3%) | 5,475 (65.3%) |
| $300,000 to $499,999 | 782 (11.6%) | 991 (11.8%) |
| $500,000 to $749,999 | 106 (1.6%) | 431 (5.1%) |
| $750,000 to $999,999 | 48 (0.7%) | 41 (0.5%) |
| $1,000,000 or more | 56 (0.8%) | 7 (0.1%) |
| Total | 6,726 (100.0%) | 8,386 (100.0%) |
Household Income by Mortgage Status in Decatur
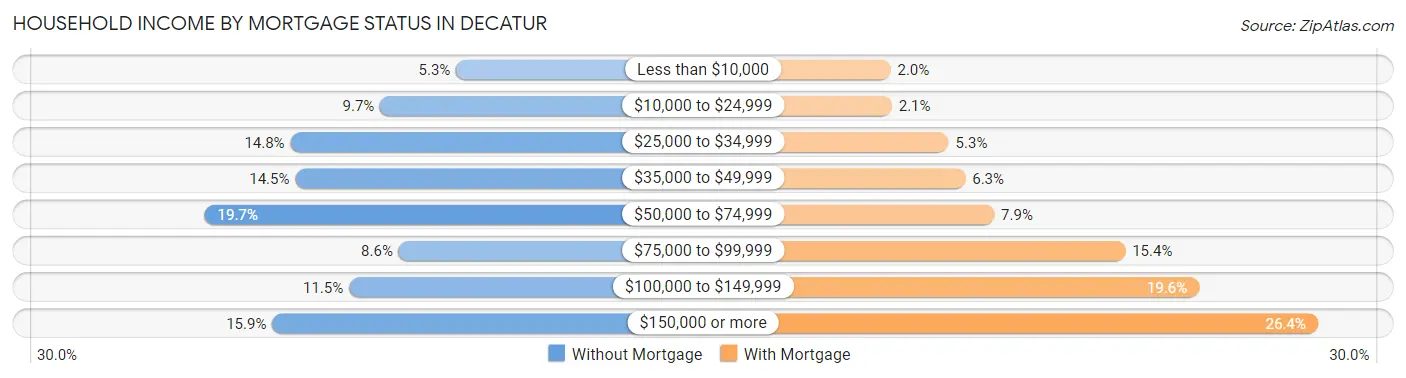
| Household Income | Without Mortgage | With Mortgage |
| Less than $10,000 | 359 (5.3%) | 168 (2.0%) |
| $10,000 to $24,999 | 651 (9.7%) | 174 (2.1%) |
| $25,000 to $34,999 | 996 (14.8%) | 446 (5.3%) |
| $35,000 to $49,999 | 977 (14.5%) | 526 (6.3%) |
| $50,000 to $74,999 | 1,326 (19.7%) | 664 (7.9%) |
| $75,000 to $99,999 | 580 (8.6%) | 1,292 (15.4%) |
| $100,000 to $149,999 | 771 (11.5%) | 1,646 (19.6%) |
| $150,000 or more | 1,066 (15.9%) | 2,215 (26.4%) |
| Total | 6,726 (100.0%) | 8,386 (100.0%) |
Property Value to Household Income Ratio in Decatur
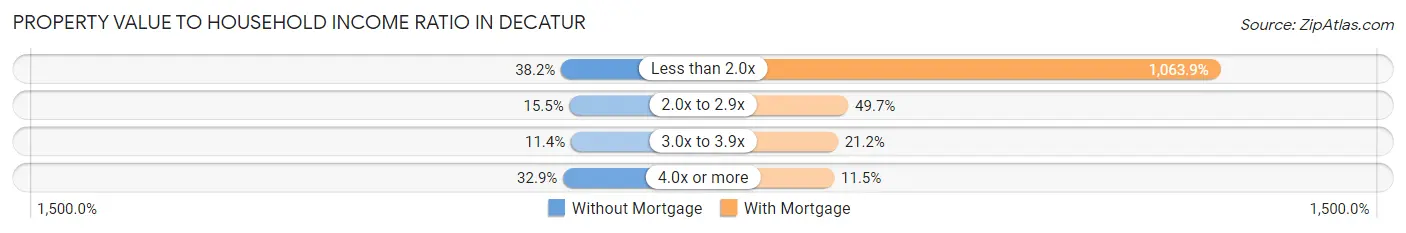
| Value-to-Income Ratio | Without Mortgage | With Mortgage |
| Less than 2.0x | 2,572 (38.2%) | 89,221 (1,063.9%) |
| 2.0x to 2.9x | 1,042 (15.5%) | 4,169 (49.7%) |
| 3.0x to 3.9x | 769 (11.4%) | 1,775 (21.2%) |
| 4.0x or more | 2,214 (32.9%) | 962 (11.5%) |
| Total | 6,726 (100.0%) | 8,386 (100.0%) |
Real Estate Taxes by Mortgage Status in Decatur
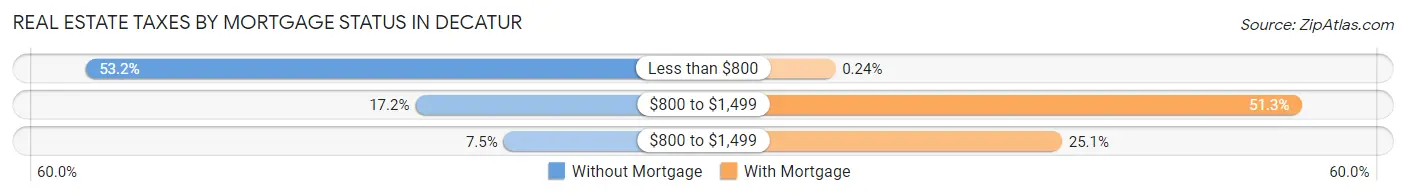
| Property Taxes | Without Mortgage | With Mortgage |
| Less than $800 | 3,581 (53.2%) | 20 (0.2%) |
| $800 to $1,499 | 1,156 (17.2%) | 4,303 (51.3%) |
| $800 to $1,499 | 505 (7.5%) | 2,102 (25.1%) |
| Total | 6,726 (100.0%) | 8,386 (100.0%) |
Health & Disability in Decatur
Health Insurance Coverage by Age in Decatur
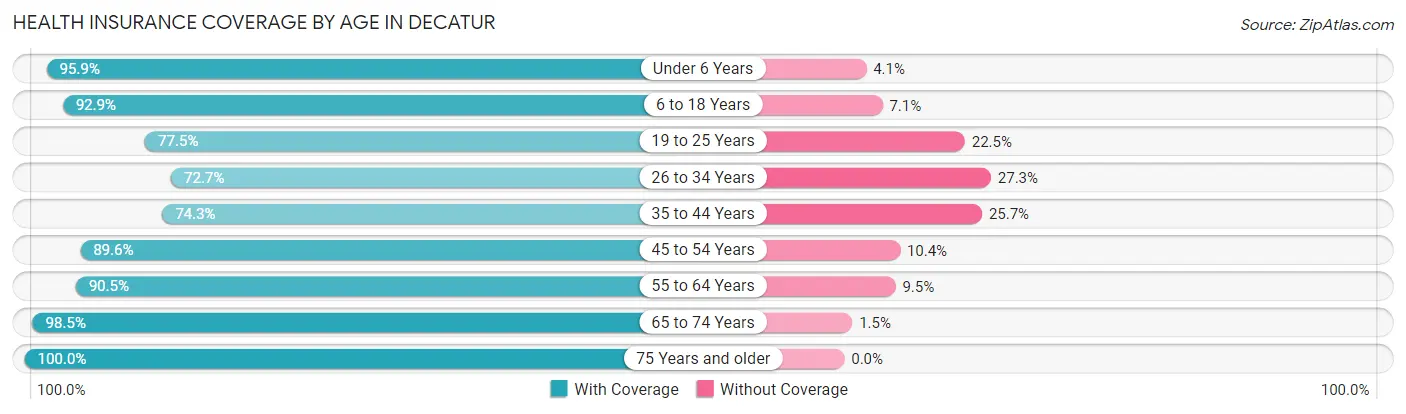
| Age Bracket | With Coverage | Without Coverage |
| Under 6 Years | 4,059 (95.9%) | 173 (4.1%) |
| 6 to 18 Years | 9,087 (92.9%) | 696 (7.1%) |
| 19 to 25 Years | 3,437 (77.5%) | 996 (22.5%) |
| 26 to 34 Years | 4,639 (72.7%) | 1,745 (27.3%) |
| 35 to 44 Years | 5,014 (74.3%) | 1,732 (25.7%) |
| 45 to 54 Years | 5,879 (89.6%) | 681 (10.4%) |
| 55 to 64 Years | 6,657 (90.5%) | 702 (9.5%) |
| 65 to 74 Years | 6,273 (98.5%) | 94 (1.5%) |
| 75 Years and older | 4,408 (100.0%) | 0 (0.0%) |
| Total | 49,453 (87.9%) | 6,819 (12.1%) |
Health Insurance Coverage by Citizenship Status in Decatur
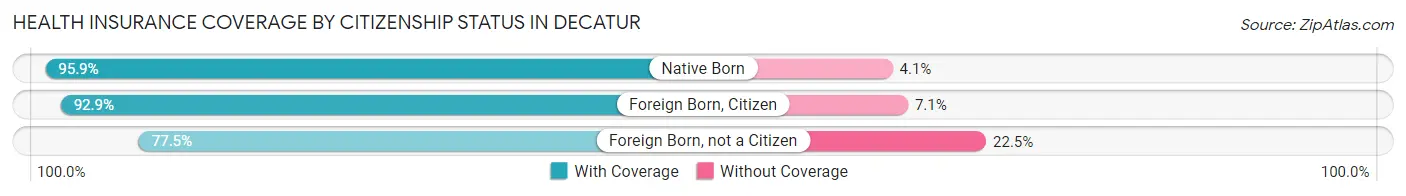
| Citizenship Status | With Coverage | Without Coverage |
| Native Born | 4,059 (95.9%) | 173 (4.1%) |
| Foreign Born, Citizen | 9,087 (92.9%) | 696 (7.1%) |
| Foreign Born, not a Citizen | 3,437 (77.5%) | 996 (22.5%) |
Health Insurance Coverage by Household Income in Decatur
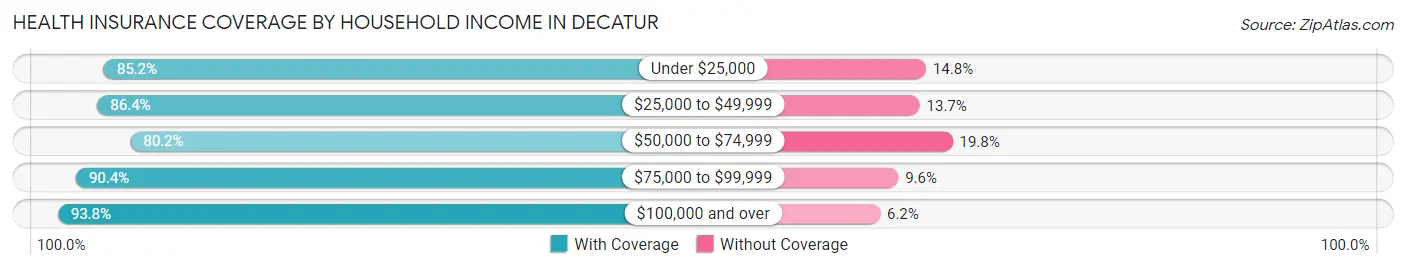
| Household Income | With Coverage | Without Coverage |
| Under $25,000 | 6,832 (85.2%) | 1,191 (14.8%) |
| $25,000 to $49,999 | 10,380 (86.4%) | 1,641 (13.7%) |
| $50,000 to $74,999 | 8,485 (80.2%) | 2,096 (19.8%) |
| $75,000 to $99,999 | 7,361 (90.4%) | 784 (9.6%) |
| $100,000 and over | 16,326 (93.8%) | 1,084 (6.2%) |
Public vs Private Health Insurance Coverage by Age in Decatur
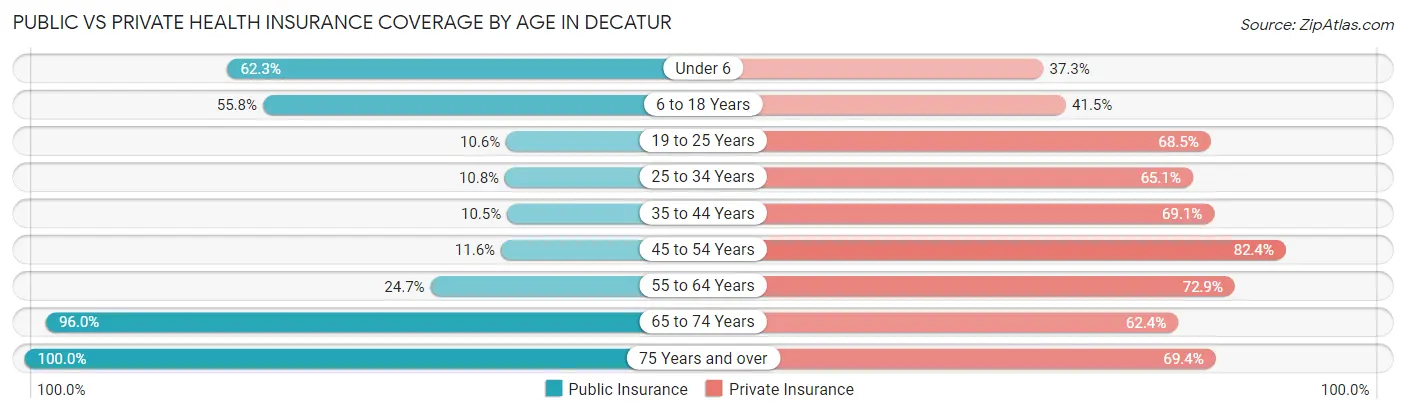
| Age Bracket | Public Insurance | Private Insurance |
| Under 6 | 2,638 (62.3%) | 1,577 (37.3%) |
| 6 to 18 Years | 5,458 (55.8%) | 4,055 (41.4%) |
| 19 to 25 Years | 471 (10.6%) | 3,035 (68.5%) |
| 25 to 34 Years | 692 (10.8%) | 4,158 (65.1%) |
| 35 to 44 Years | 705 (10.4%) | 4,662 (69.1%) |
| 45 to 54 Years | 760 (11.6%) | 5,406 (82.4%) |
| 55 to 64 Years | 1,816 (24.7%) | 5,368 (72.9%) |
| 65 to 74 Years | 6,114 (96.0%) | 3,974 (62.4%) |
| 75 Years and over | 4,408 (100.0%) | 3,058 (69.4%) |
| Total | 23,062 (41.0%) | 35,293 (62.7%) |
Disability Status by Sex by Age in Decatur
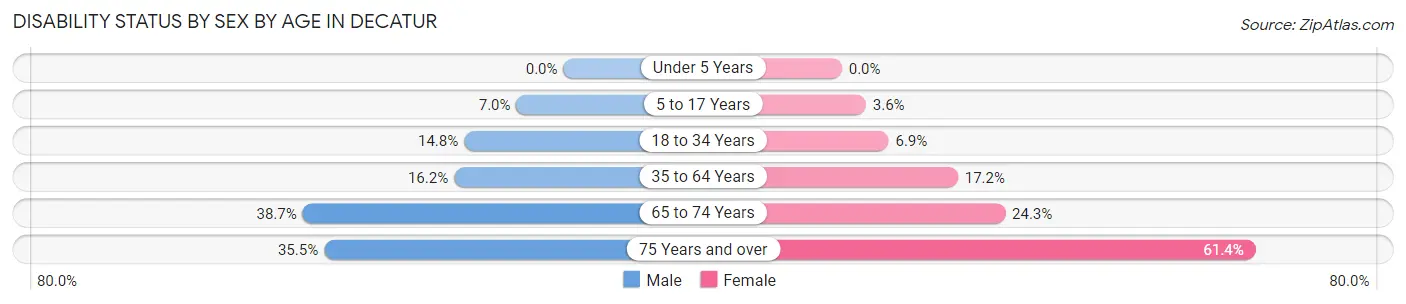
| Age Bracket | Male | Female |
| Under 5 Years | 0 (0.0%) | 0 (0.0%) |
| 5 to 17 Years | 350 (7.0%) | 168 (3.6%) |
| 18 to 34 Years | 907 (14.7%) | 370 (6.9%) |
| 35 to 64 Years | 1,687 (16.2%) | 1,771 (17.2%) |
| 65 to 74 Years | 1,137 (38.7%) | 832 (24.2%) |
| 75 Years and over | 622 (35.5%) | 1,633 (61.4%) |
Disability Class by Sex by Age in Decatur
Disability Class: Hearing Difficulty
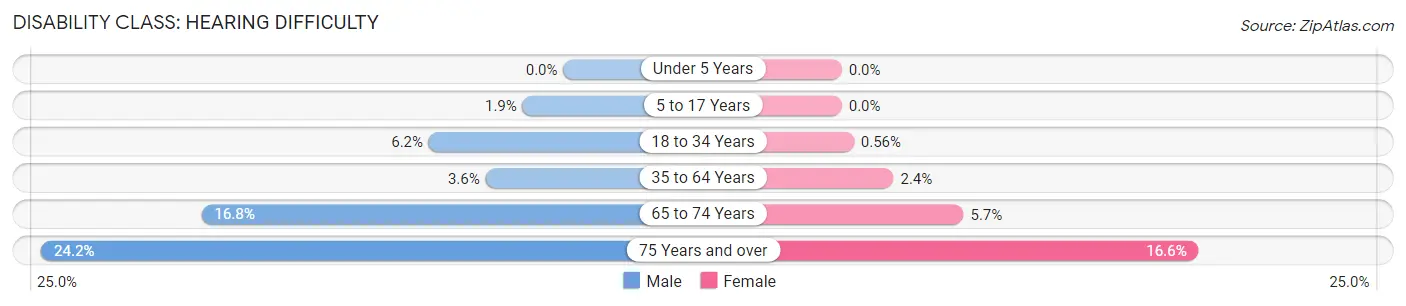
| Age Bracket | Male | Female |
| Under 5 Years | 0 (0.0%) | 0 (0.0%) |
| 5 to 17 Years | 95 (1.9%) | 0 (0.0%) |
| 18 to 34 Years | 384 (6.2%) | 30 (0.6%) |
| 35 to 64 Years | 375 (3.6%) | 247 (2.4%) |
| 65 to 74 Years | 493 (16.8%) | 194 (5.7%) |
| 75 Years and over | 424 (24.2%) | 440 (16.6%) |
Disability Class: Vision Difficulty
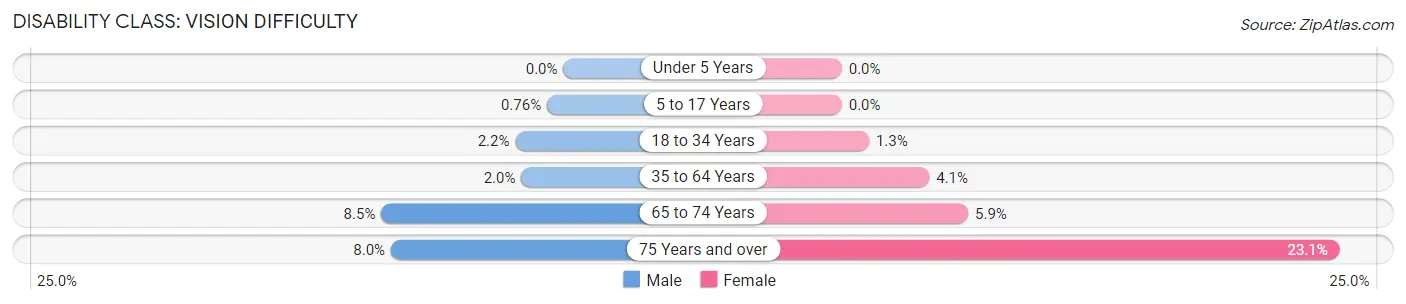
| Age Bracket | Male | Female |
| Under 5 Years | 0 (0.0%) | 0 (0.0%) |
| 5 to 17 Years | 38 (0.8%) | 0 (0.0%) |
| 18 to 34 Years | 137 (2.2%) | 67 (1.3%) |
| 35 to 64 Years | 203 (1.9%) | 417 (4.1%) |
| 65 to 74 Years | 248 (8.5%) | 201 (5.9%) |
| 75 Years and over | 140 (8.0%) | 614 (23.1%) |
Disability Class: Cognitive Difficulty
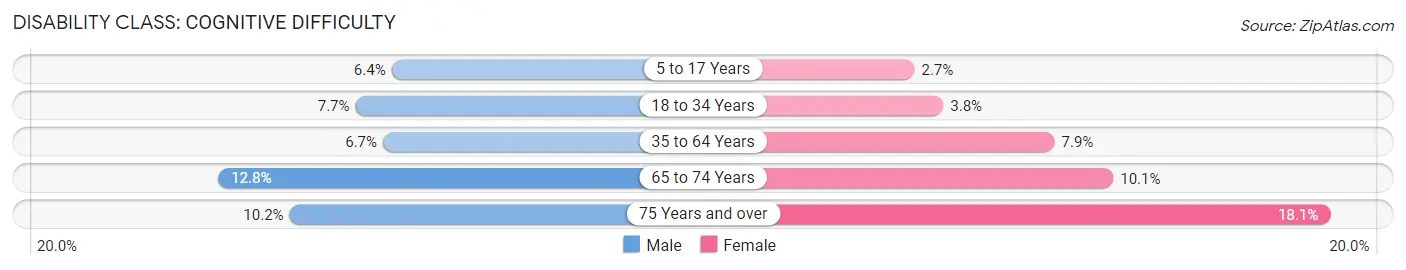
| Age Bracket | Male | Female |
| 5 to 17 Years | 320 (6.4%) | 127 (2.7%) |
| 18 to 34 Years | 475 (7.7%) | 201 (3.8%) |
| 35 to 64 Years | 696 (6.7%) | 812 (7.9%) |
| 65 to 74 Years | 376 (12.8%) | 346 (10.1%) |
| 75 Years and over | 178 (10.2%) | 482 (18.1%) |
Disability Class: Ambulatory Difficulty
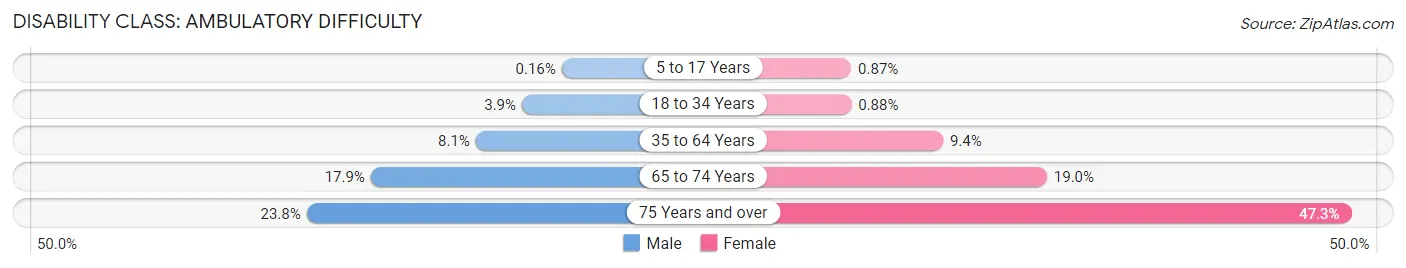
| Age Bracket | Male | Female |
| 5 to 17 Years | 8 (0.2%) | 41 (0.9%) |
| 18 to 34 Years | 237 (3.8%) | 47 (0.9%) |
| 35 to 64 Years | 845 (8.1%) | 965 (9.4%) |
| 65 to 74 Years | 525 (17.9%) | 653 (19.0%) |
| 75 Years and over | 417 (23.8%) | 1,257 (47.3%) |
Disability Class: Self-Care Difficulty
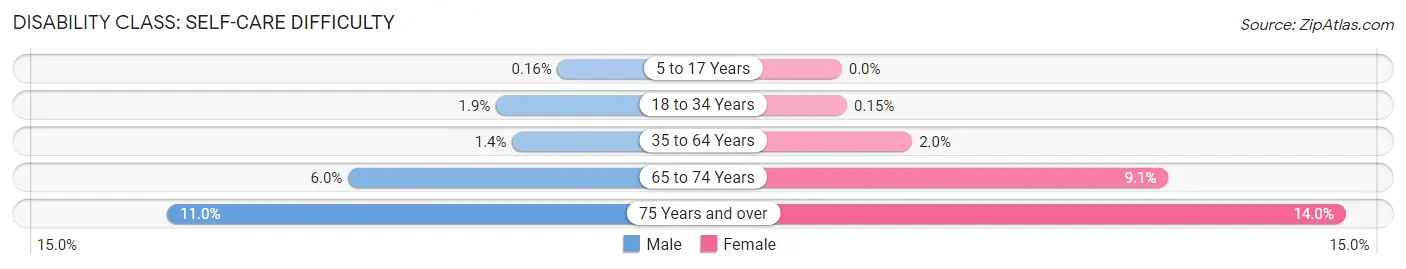
| Age Bracket | Male | Female |
| 5 to 17 Years | 8 (0.2%) | 0 (0.0%) |
| 18 to 34 Years | 115 (1.9%) | 8 (0.2%) |
| 35 to 64 Years | 147 (1.4%) | 202 (2.0%) |
| 65 to 74 Years | 176 (6.0%) | 312 (9.1%) |
| 75 Years and over | 193 (11.0%) | 373 (14.0%) |
Technology Access in Decatur
Computing Device Access in Decatur
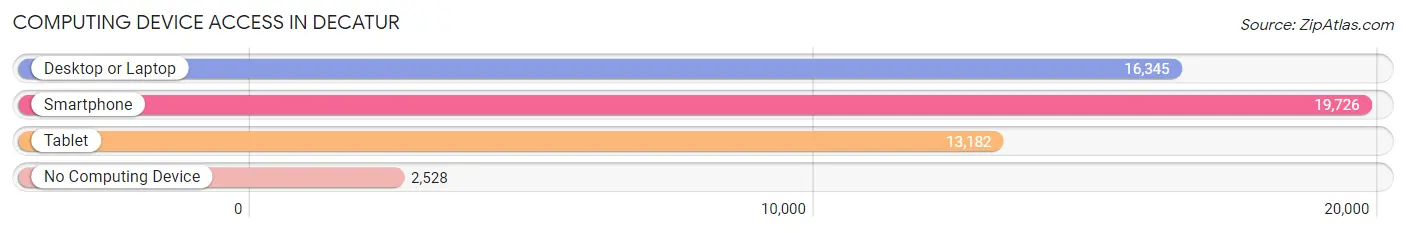
| Device Type | # Households | % Households |
| Desktop or Laptop | 16,345 | 69.0% |
| Smartphone | 19,726 | 83.3% |
| Tablet | 13,182 | 55.7% |
| No Computing Device | 2,528 | 10.7% |
| Total | 23,674 | 100.0% |
Internet Access in Decatur
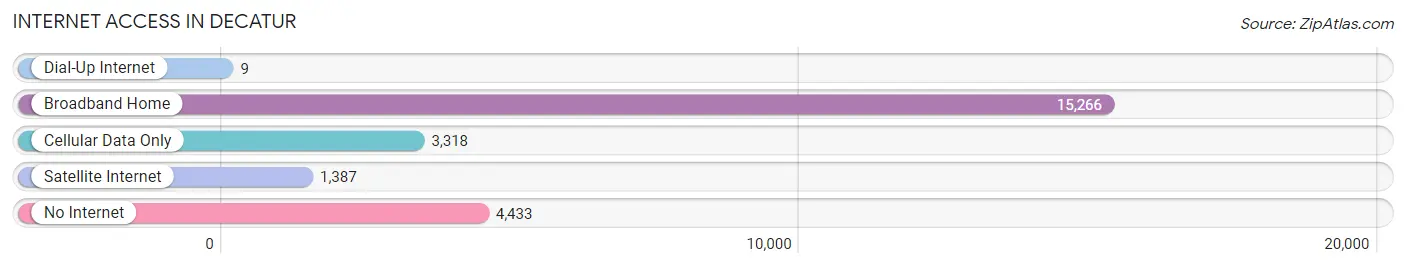
| Internet Type | # Households | % Households |
| Dial-Up Internet | 9 | 0.0% |
| Broadband Home | 15,266 | 64.5% |
| Cellular Data Only | 3,318 | 14.0% |
| Satellite Internet | 1,387 | 5.9% |
| No Internet | 4,433 | 18.7% |
| Total | 23,674 | 100.0% |
Decatur Summary
Decatur, Alabama is a city located in Morgan County in the northern part of the state. It is the largest city in the county and the second largest in the state. The city is situated along the Tennessee River and is part of the Huntsville-Decatur Combined Statistical Area. As of the 2010 census, the population of Decatur was 55,683.
History
Decatur was founded in 1820 and named after Stephen Decatur, a naval hero of the War of 1812. The city was incorporated in 1821 and was the first county seat of Morgan County. During the Civil War, Decatur was the site of several battles, including the Battle of Decatur. After the war, the city experienced a period of growth and development, becoming an important industrial center. In the late 19th century, Decatur was home to several cotton mills and other industries.
Geography
Decatur is located in northern Alabama, in Morgan County. It is situated along the Tennessee River, about 20 miles south of Huntsville. The city has a total area of 33.3 square miles, of which 32.9 square miles is land and 0.4 square miles is water.
Climate
Decatur has a humid subtropical climate, with hot, humid summers and mild winters. The average annual temperature is 64°F, with an average high of 87°F in July and an average low of 41°F in January. The average annual precipitation is 48.3 inches.
Economy
Decatur’s economy is largely based on manufacturing and industry. The city is home to several large companies, including 3M, General Electric, and Daikin Industries. The city is also home to several universities and colleges, including the University of Alabama in Huntsville, Calhoun Community College, and Athens State University.
Demographics
As of the 2010 census, the population of Decatur was 55,683. The racial makeup of the city was 73.3% White, 19.3% African American, 0.4% Native American, 1.7% Asian, 0.1% Pacific Islander, 2.7% from other races, and 2.5% from two or more races. Hispanic or Latino of any race were 5.3% of the population.
The median income for a household in Decatur was $41,945, and the median income for a family was $50,945. The per capita income for the city was $21,845. About 15.3% of the population was below the poverty line.
Common Questions
What is Per Capita Income in Decatur?
Per Capita income in Decatur is $33,136.
What is the Median Family Income in Decatur?
Median Family Income in Decatur is $69,560.
What is the Median Household income in Decatur?
Median Household Income in Decatur is $55,164.
What is Income or Wage Gap in Decatur?
Income or Wage Gap in Decatur is 30.8%.
Women in Decatur earn 69.2 cents for every dollar earned by a man.
What is Family Income Deficit in Decatur?
Family Income Deficit in Decatur is $9,065.
Families that are below poverty line in Decatur earn $9,065 less on average than the poverty threshold level.
What is Inequality or Gini Index in Decatur?
Inequality or Gini Index in Decatur is 0.47.
What is the Total Population of Decatur?
Total Population of Decatur is 57,525.
What is the Total Male Population of Decatur?
Total Male Population of Decatur is 29,042.
What is the Total Female Population of Decatur?
Total Female Population of Decatur is 28,483.
What is the Ratio of Males per 100 Females in Decatur?
There are 101.96 Males per 100 Females in Decatur.
What is the Ratio of Females per 100 Males in Decatur?
There are 98.08 Females per 100 Males in Decatur.
What is the Median Population Age in Decatur?
Median Population Age in Decatur is 40.4 Years.
What is the Average Family Size in Decatur
Average Family Size in Decatur is 3.1 People.
What is the Average Household Size in Decatur
Average Household Size in Decatur is 2.4 People.
How Large is the Labor Force in Decatur?
There are 26,990 People in the Labor Forcein in Decatur.
What is the Percentage of People in the Labor Force in Decatur?
58.8% of People are in the Labor Force in Decatur.
What is the Unemployment Rate in Decatur?
Unemployment Rate in Decatur is 5.1%.