Zip Codes with the Highest Percentage of Renter-Occupied Units in Anniston, AL
RELATED REPORTS & OPTIONS
Highest Renter-Occupied
Anniston
Compare Zip Codes
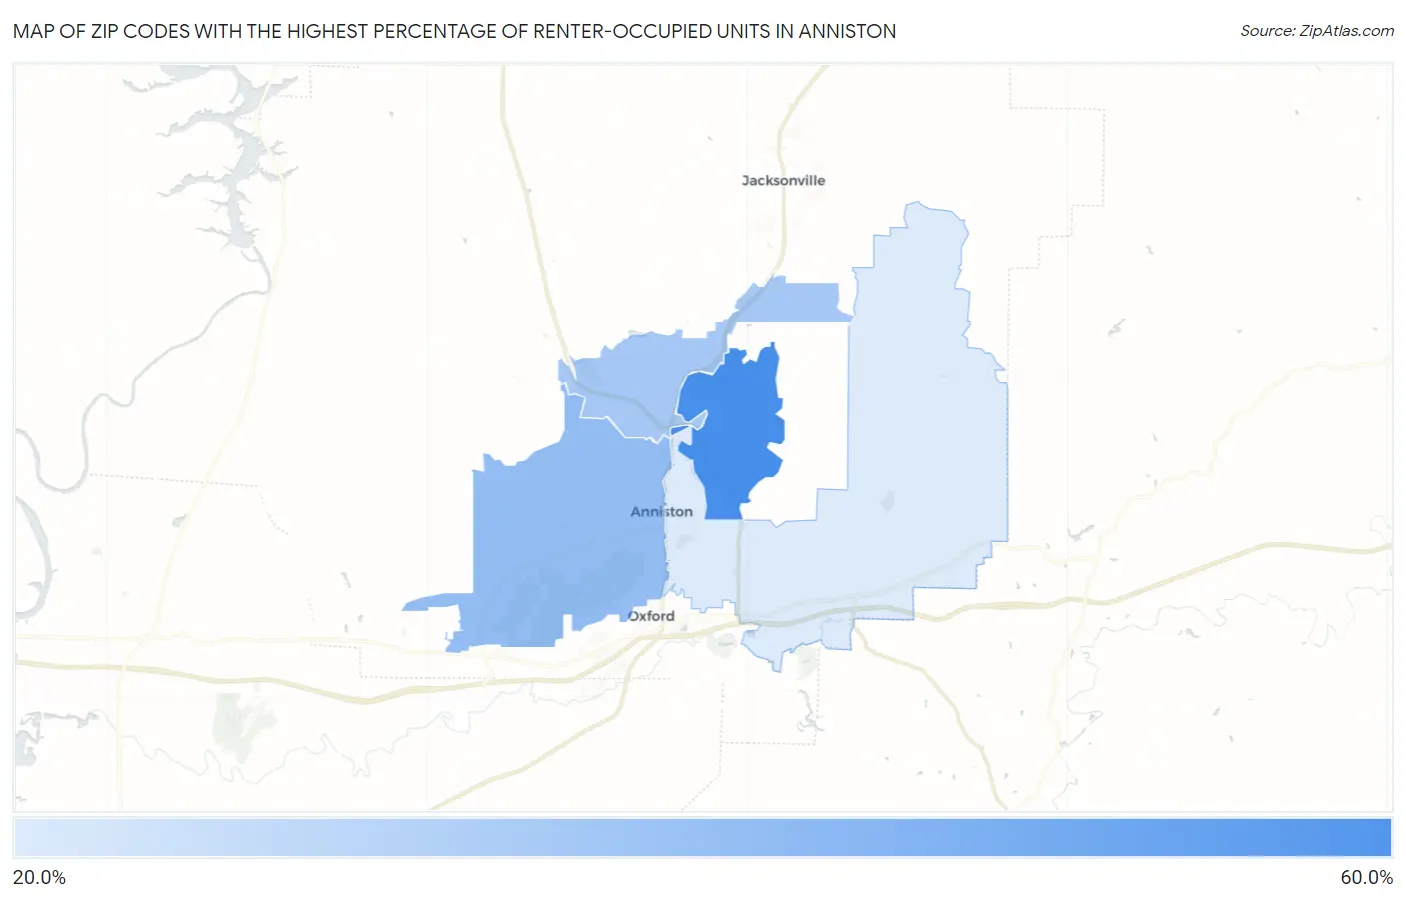
Map of Zip Codes with the Highest Percentage of Renter-Occupied Units in Anniston
0.0%
60.0%
Zip Codes with the Highest Percentage of Renter-Occupied Units in Anniston, AL
| Zip Code | % Renter-Occupied | vs State | vs National | |
| 1. | 36205 | 54.4% | 30.3%(+24.1)#35 | 35.2%(+19.2)#2,421 |
| 2. | 36201 | 38.3% | 30.3%(+8.05)#100 | 35.2%(+3.14)#5,977 |
| 3. | 36206 | 34.3% | 30.3%(+4.03)#131 | 35.2%(-0.874)#7,707 |
| 4. | 36207 | 23.9% | 30.3%(-6.34)#256 | 35.2%(-11.2)#14,555 |
1
Common Questions
What are the Top 3 Zip Codes with the Highest Percentage of Renter-Occupied Units in Anniston, AL?
Top 3 Zip Codes with the Highest Percentage of Renter-Occupied Units in Anniston, AL are:
What zip code has the Highest Percentage of Renter-Occupied Units in Anniston, AL?
36205 has the Highest Percentage of Renter-Occupied Units in Anniston, AL with 54.4%.
What is the Percentage of Renter-Occupied Units in Anniston, AL?
Percentage of Renter-Occupied Units in Anniston is 38.7%.
What is the Percentage of Renter-Occupied Units in Alabama?
Percentage of Renter-Occupied Units in Alabama is 30.3%.
What is the Percentage of Renter-Occupied Units in the United States?
Percentage of Renter-Occupied Units in the United States is 35.2%.